戴尔Inspiron 15 3000 3511笔记本电脑评论。让更便宜的东西变得更好
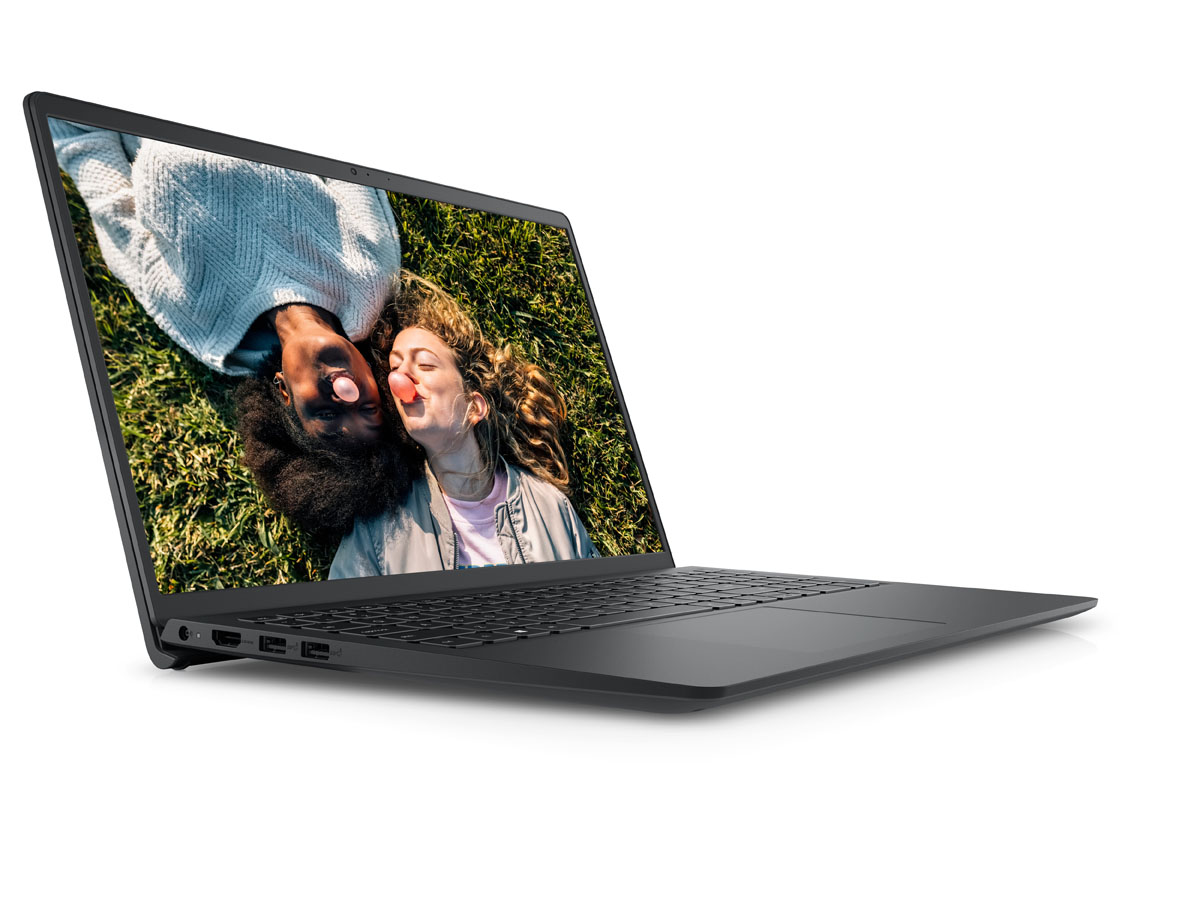
Inspiron 15 3511直接继承了去年的 灵感15 3501.它引入了全新的机箱设计,更薄更轻,增加了便携性。还有一些其他的惊喜,帮助Inspiron 15 3511在其预算价格范围内战胜了许多其他机型。
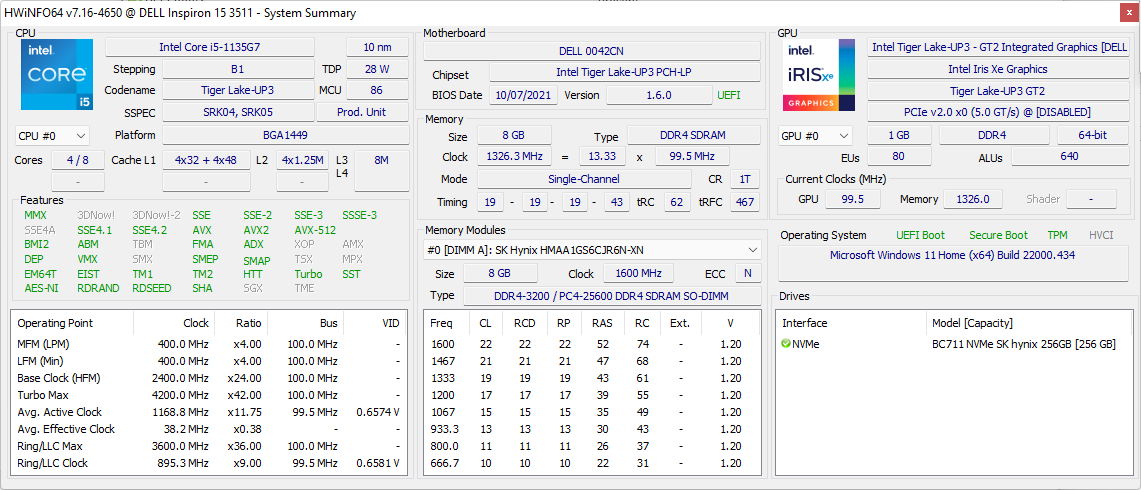
SKU的范围从Core i3-1115G4到Core i7-1165G7,配备UHD Graphics 或Iris Xe,4GB到12GB内存,以及128GB到512GB PCIe NVMe存储。一个1080p的IPS显示屏是标准配置,可以选择触摸。我们的具体审查单位是一个中档配置,配备酷睿i5处理器,8GB单通道内存,256GB固态硬盘,以及1080p触摸屏,零售价约为550美元。
这一领域的竞争对手包括其他廉价的15.6英寸多媒体/办公笔记本电脑,如HPPavilion 15,Lenovo IdeaPad 3 15,Asus VivoBook S15, 或Acer Aspire 系列 。
更多戴尔评论。
Potential Competitors in Comparison
Rating | Date | Model | Weight | Height | Size | Resolution | Price |
|---|---|---|---|---|---|---|---|
| 79.9 % v7 (old) | 01 / 2022 | Dell Inspiron 15 3000 3511 i5-1135G7, Iris Xe G7 80EUs | 1.7 kg | 18.99 mm | 15.60" | 1920x1080 | |
| 84.2 % v7 (old) | 10 / 2021 | Dell XPS 15 9510 i5 11400H FHD i5-11400H, UHD Graphics Xe 16EUs | 1.8 kg | 18 mm | 15.60" | 1920x1200 | |
| 82.1 % v7 (old) | Asus VivoBook S15 D533UA R7 5700U, Vega 8 | 1.8 kg | 16.1 mm | 15.60" | 1920x1080 | ||
| 80.5 % v7 (old) | 10 / 2021 | Dell Inspiron 15 3501 i7-1165G7, Iris Xe G7 96EUs | 2 kg | 19.9 mm | 15.60" | 1920x1080 | |
| 80.4 % v7 (old) | 12 / 2021 | Lenovo IdeaPad 3 15ALC6 R3 5300U, Vega 6 | 1.7 kg | 19.9 mm | 15.60" | 1920x1080 | |
| 81.2 % v7 (old) | 07 / 2021 | HP Pavilion 15-eg i7-1165G7, GeForce MX450 | 1.7 kg | 17.9 mm | 15.60" | 1920x1080 |
案例
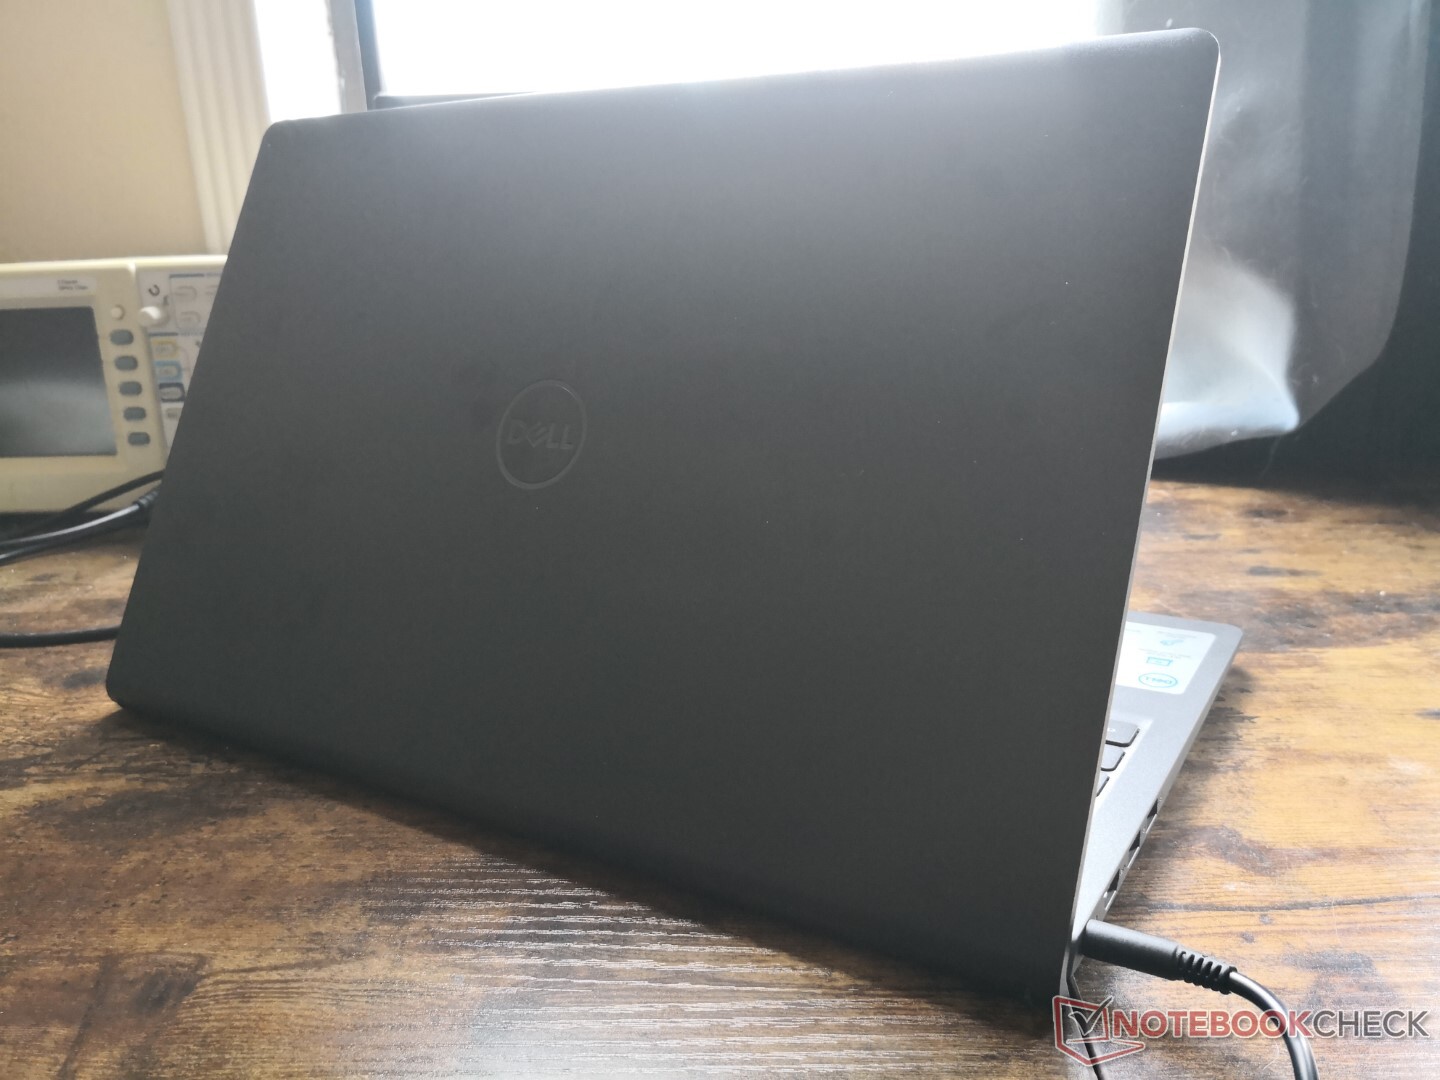
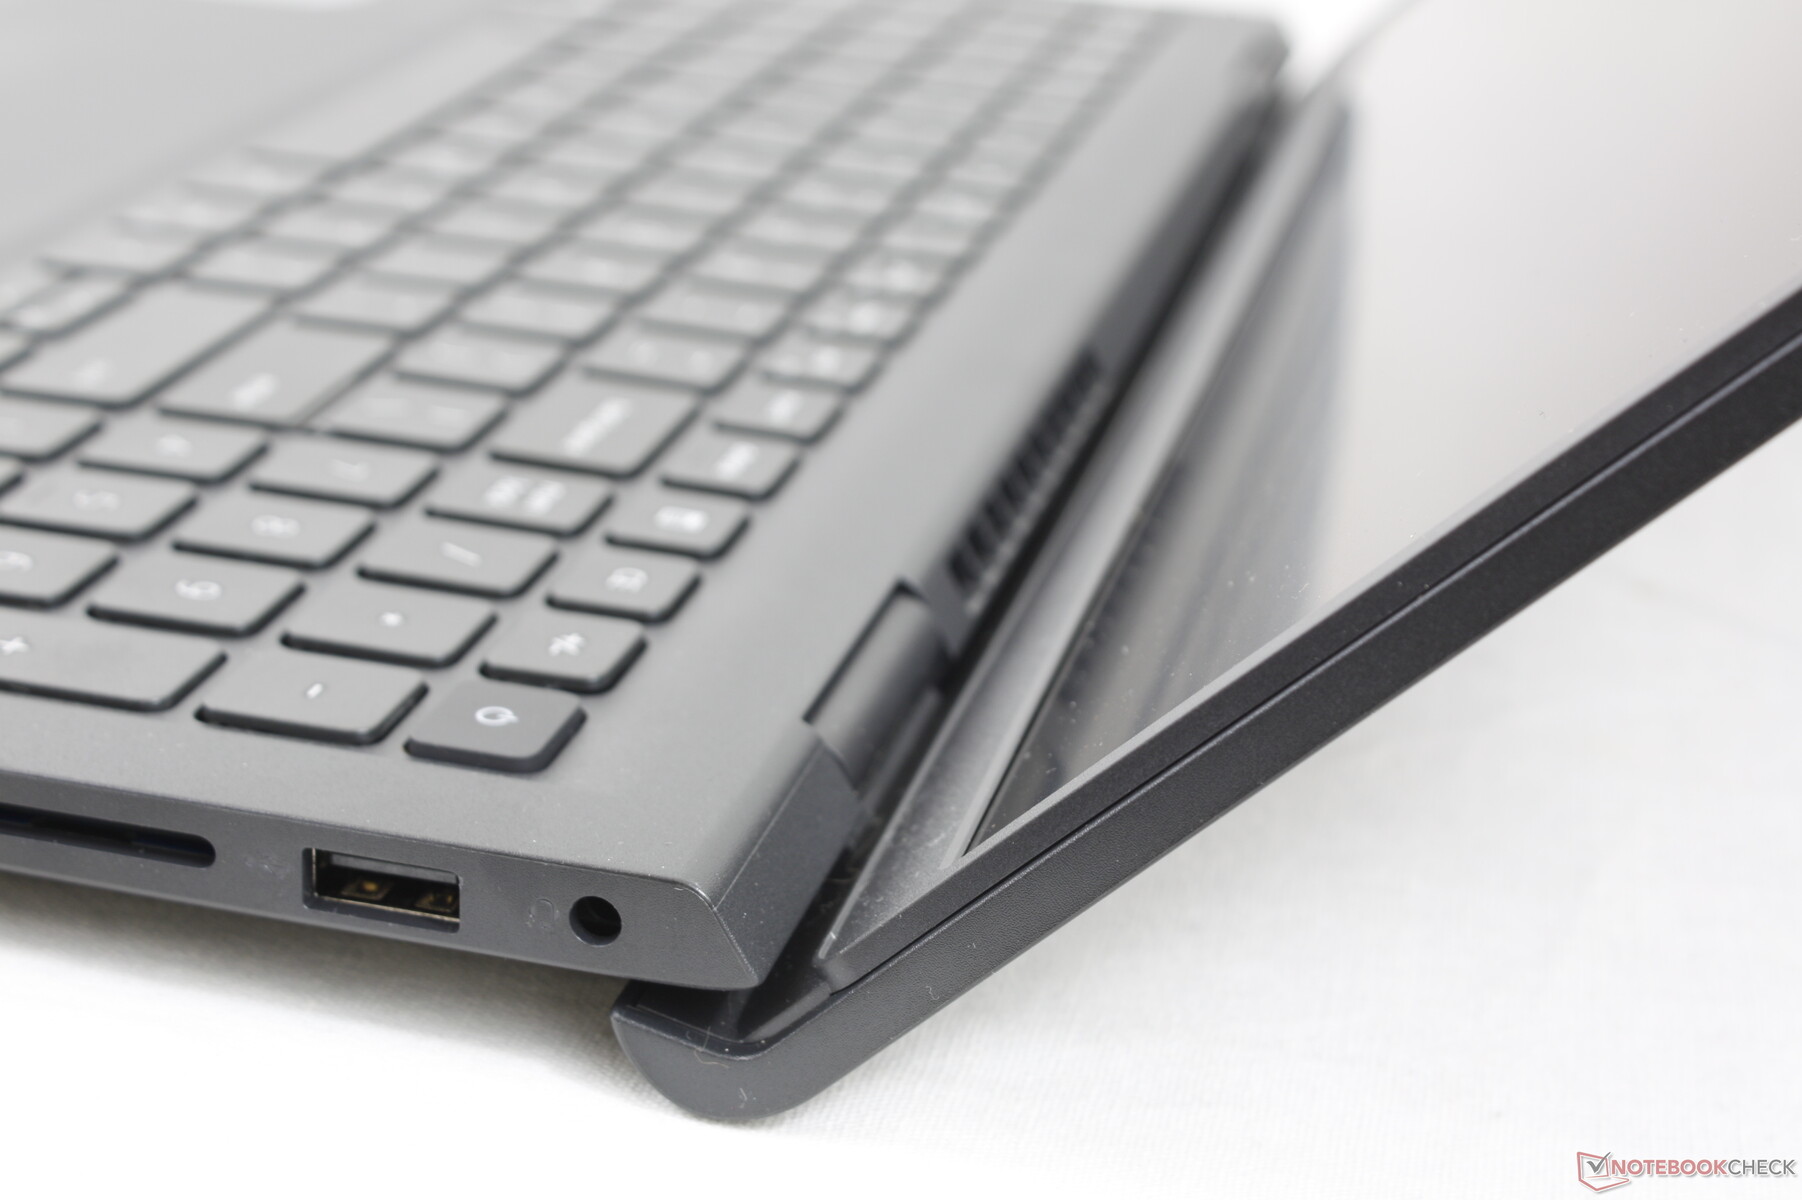
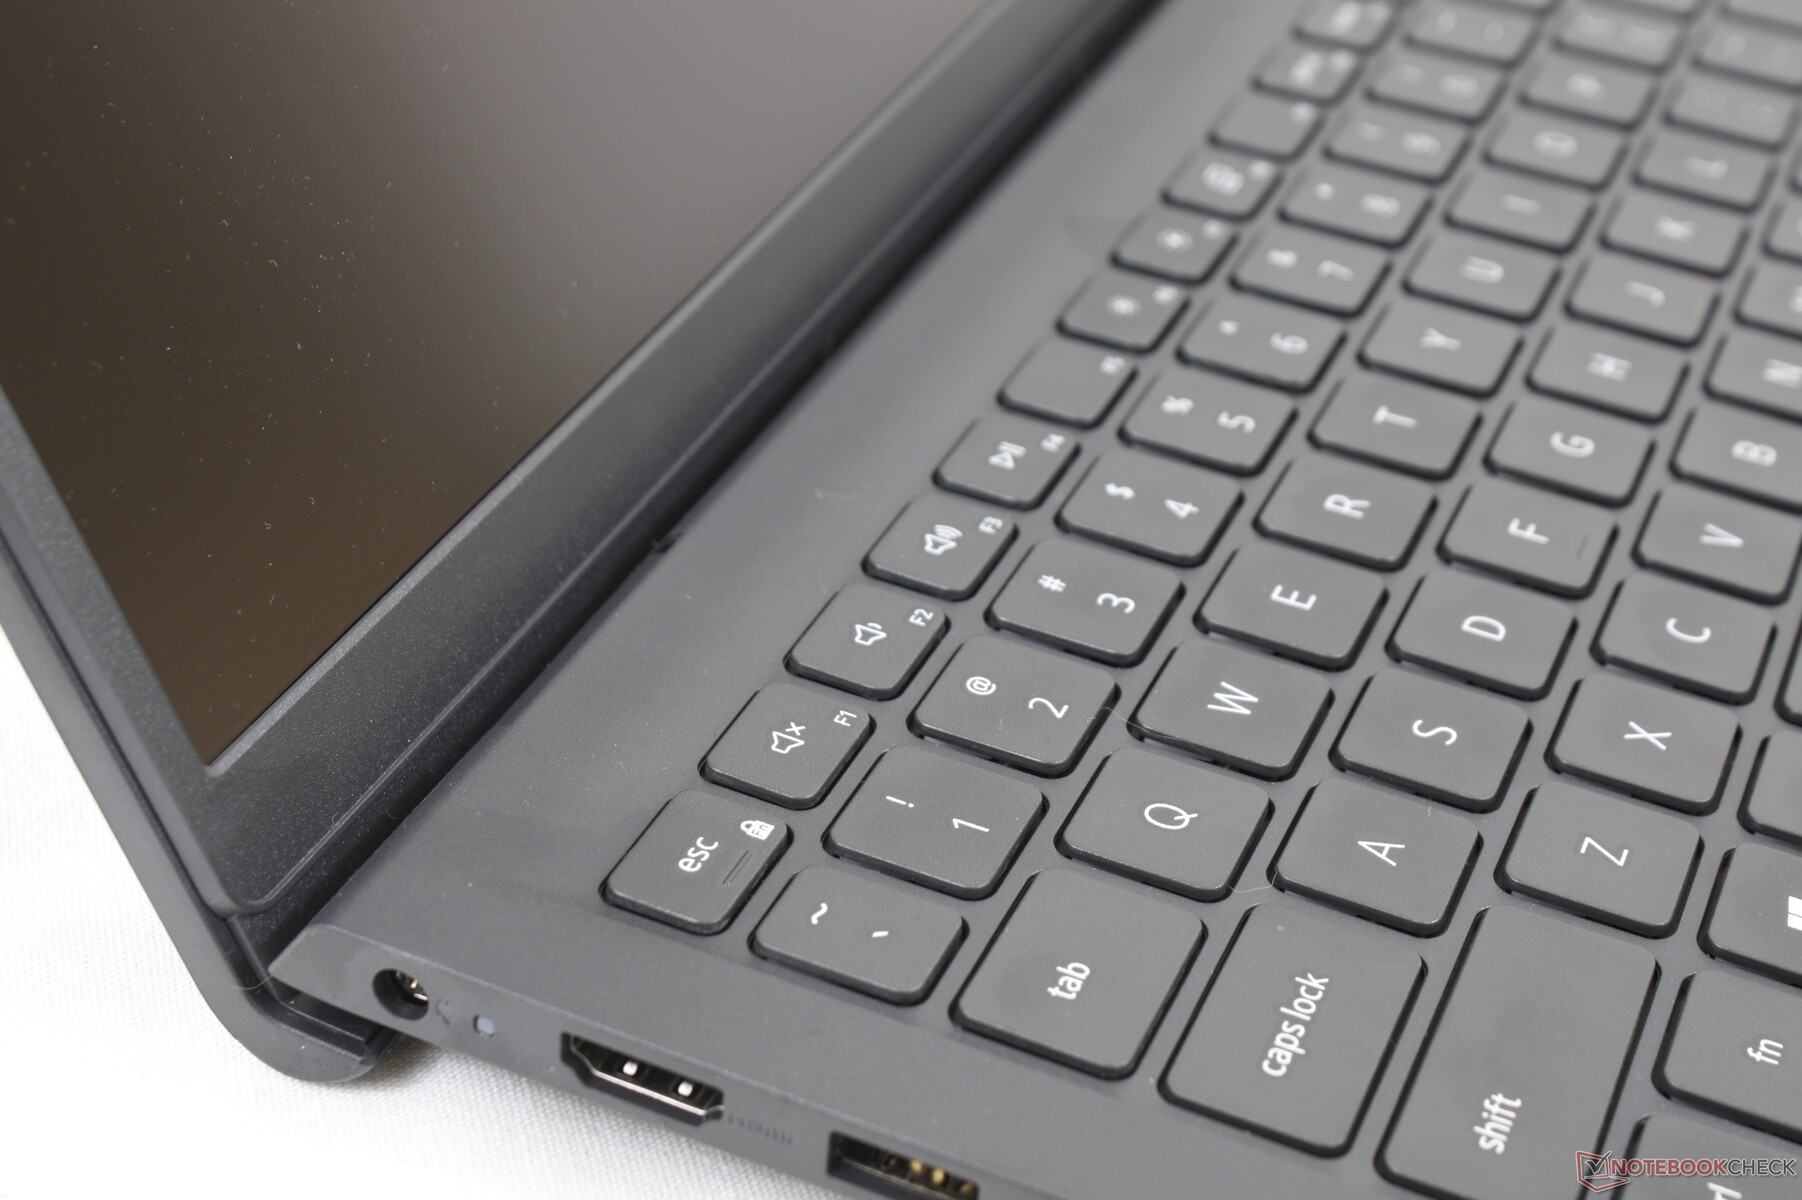
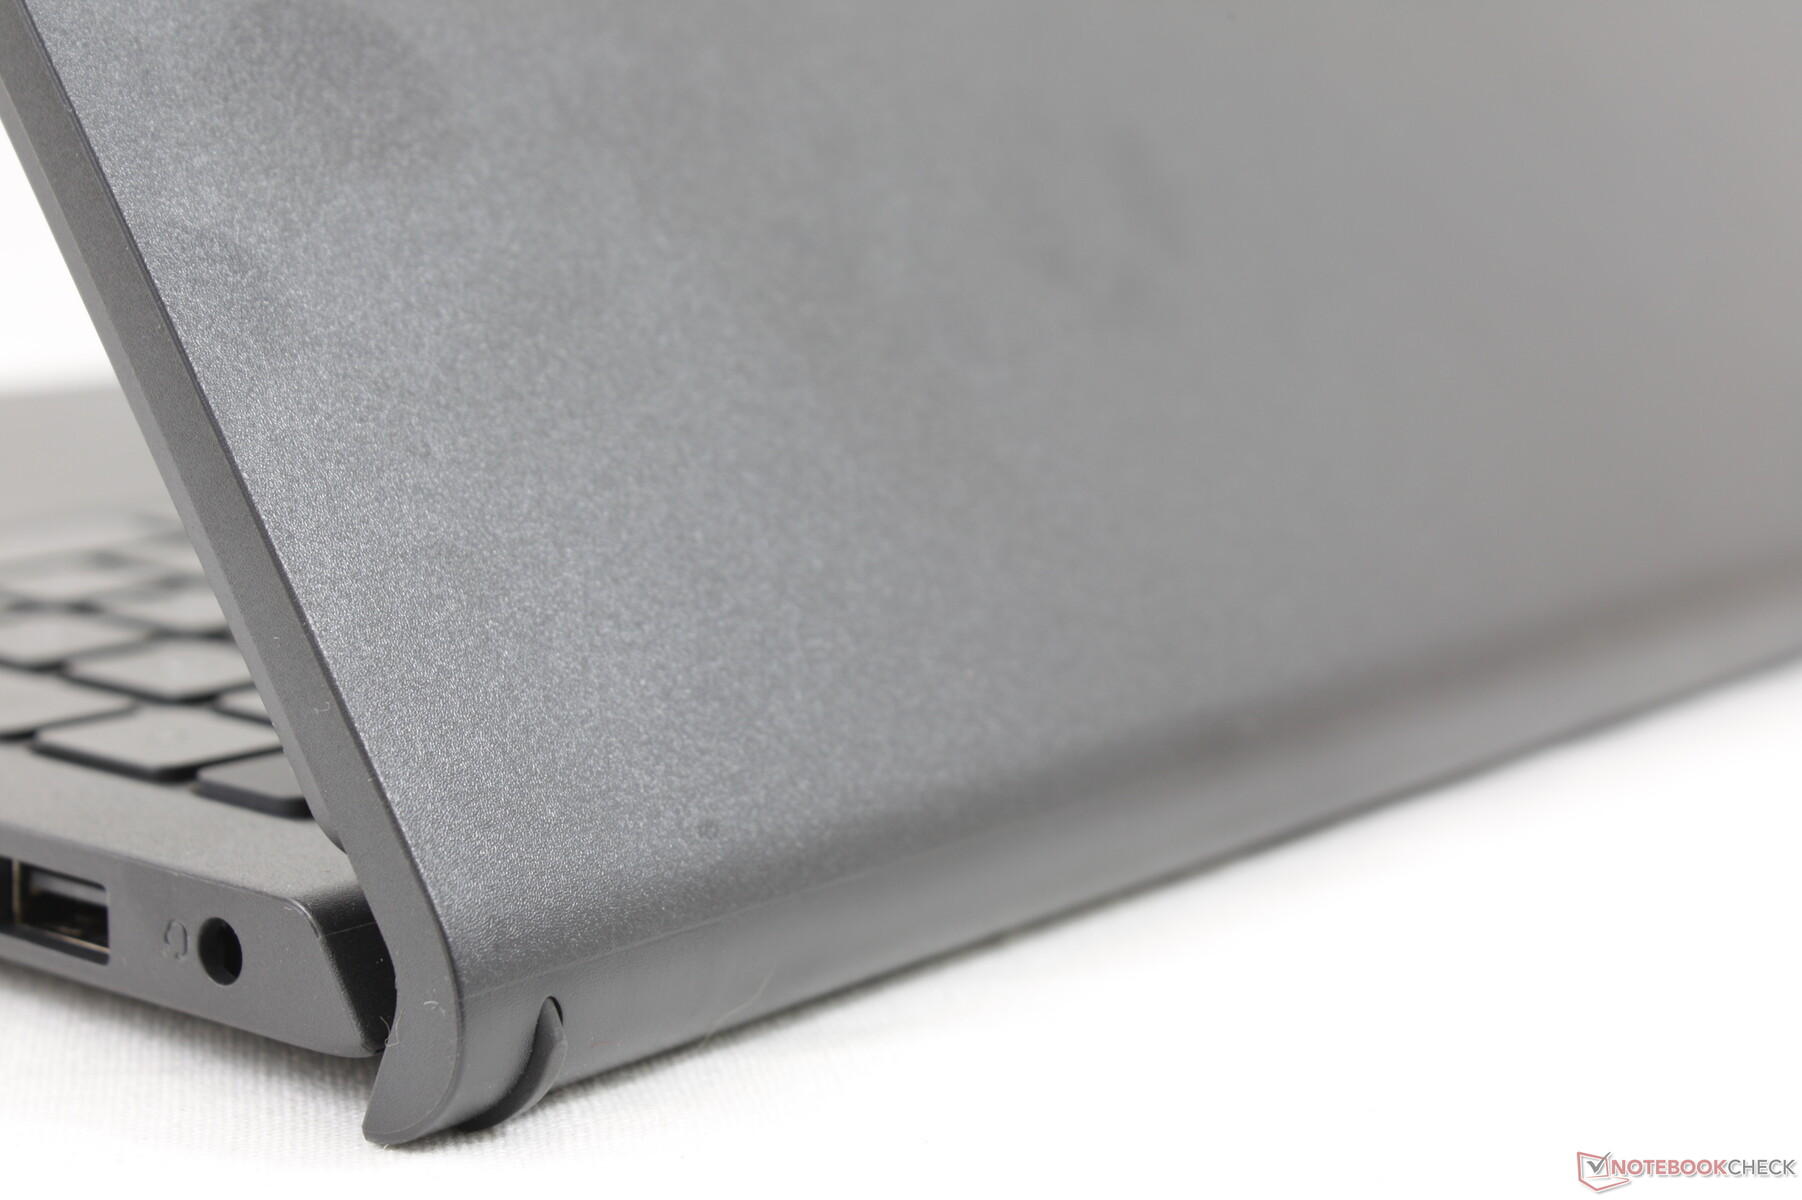
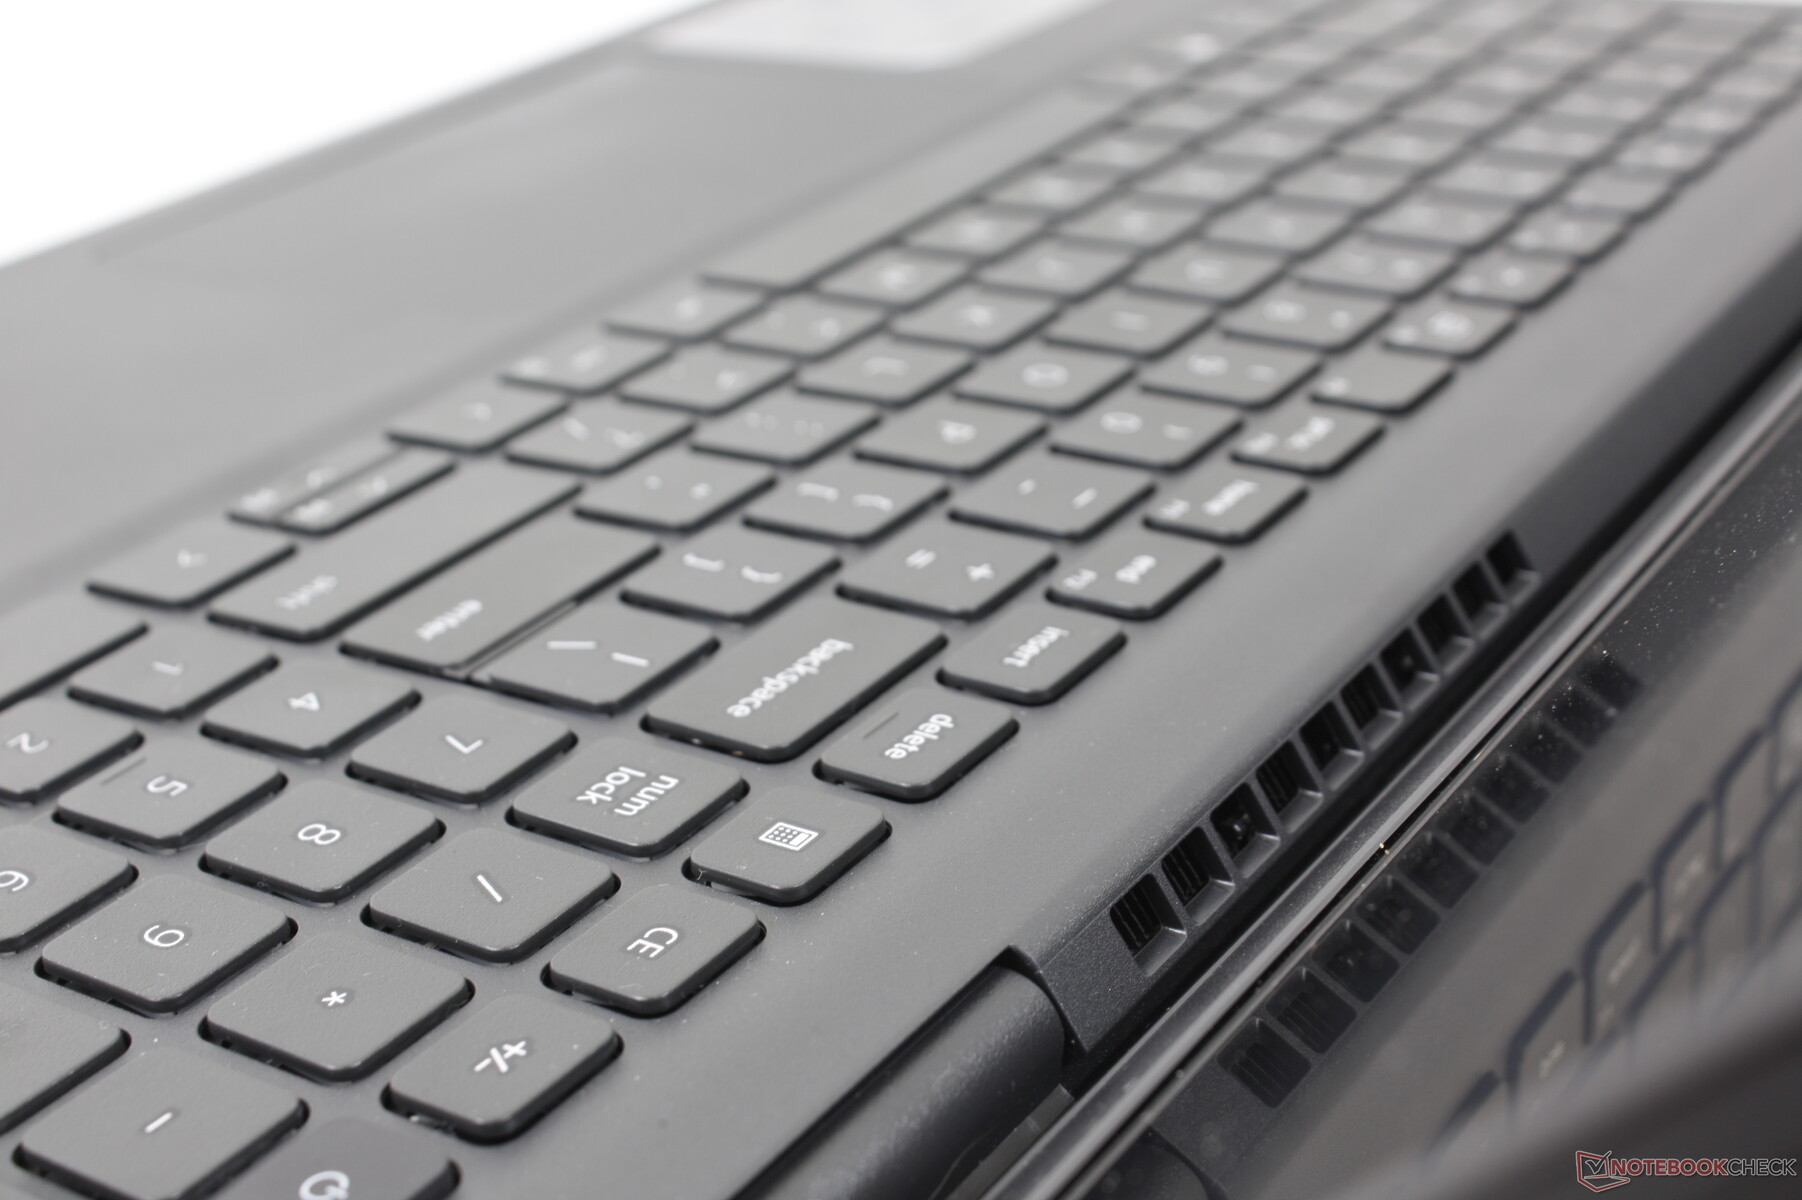
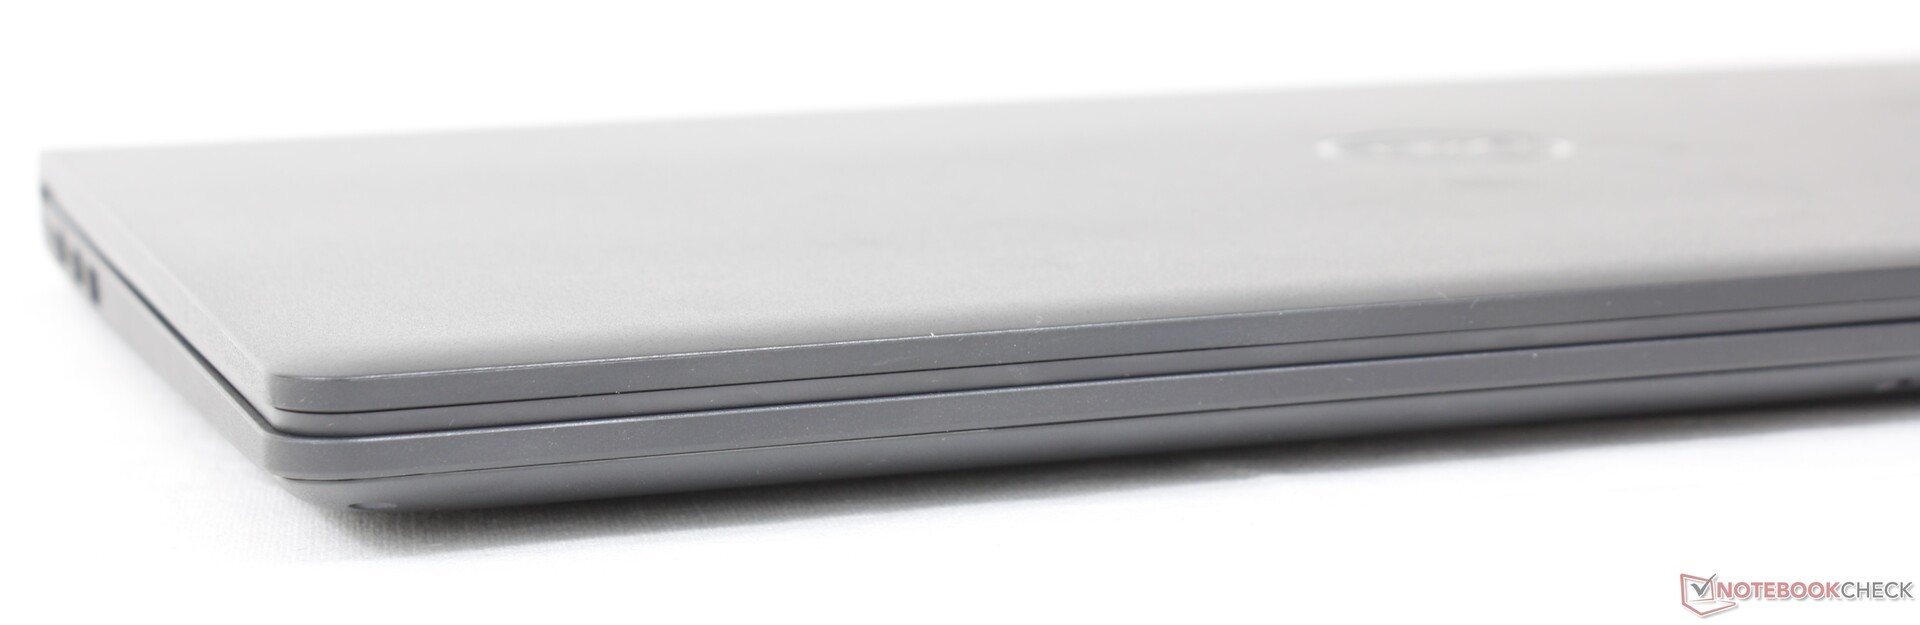
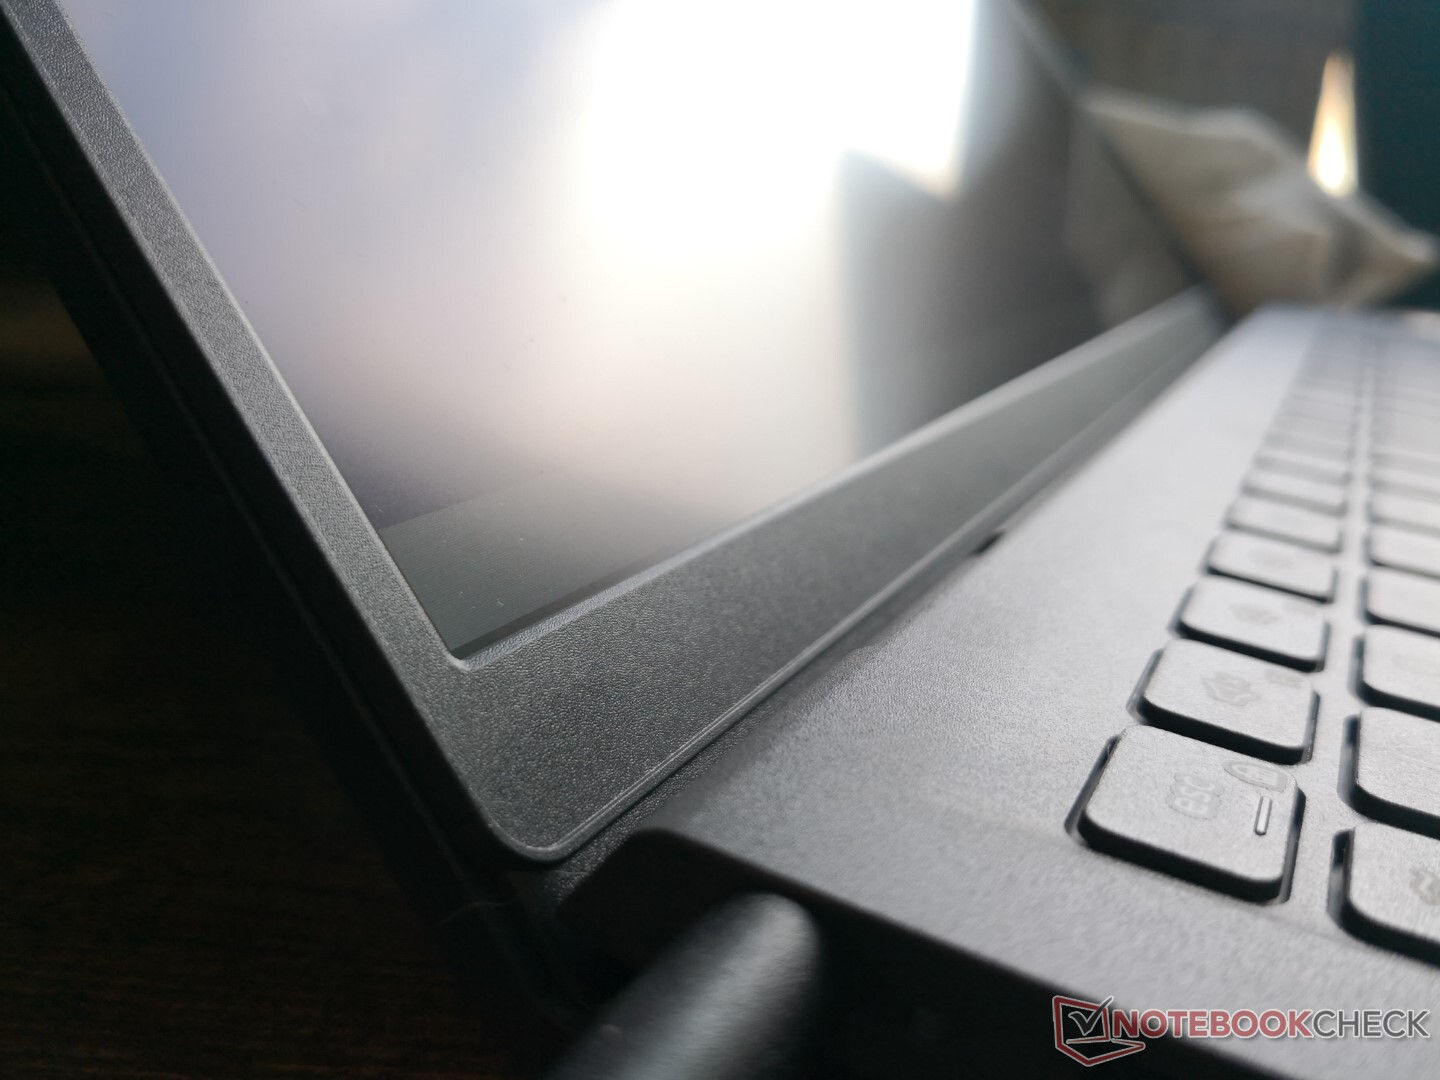
改良后的Inspiron 15 3511设计大大缩小了3501的底部 "下巴 "边框,使屏幕与机身的比例更高。该系统现在还采用了与VivoBook上类似的铰链。 MSI Prestige或惠普Pavilion ,以轻微的角度提升底座,以改善人体工程学和空气流通。然而,机箱的大部分仍然是塑料的,因此,尽管进行了全面的重新设计,系统并没有感觉到比旧的Inspiron 15 3501更坚硬或更高质量。键盘中心、外盖和底座边缘在足够大的压力下很容易扭曲和变形。
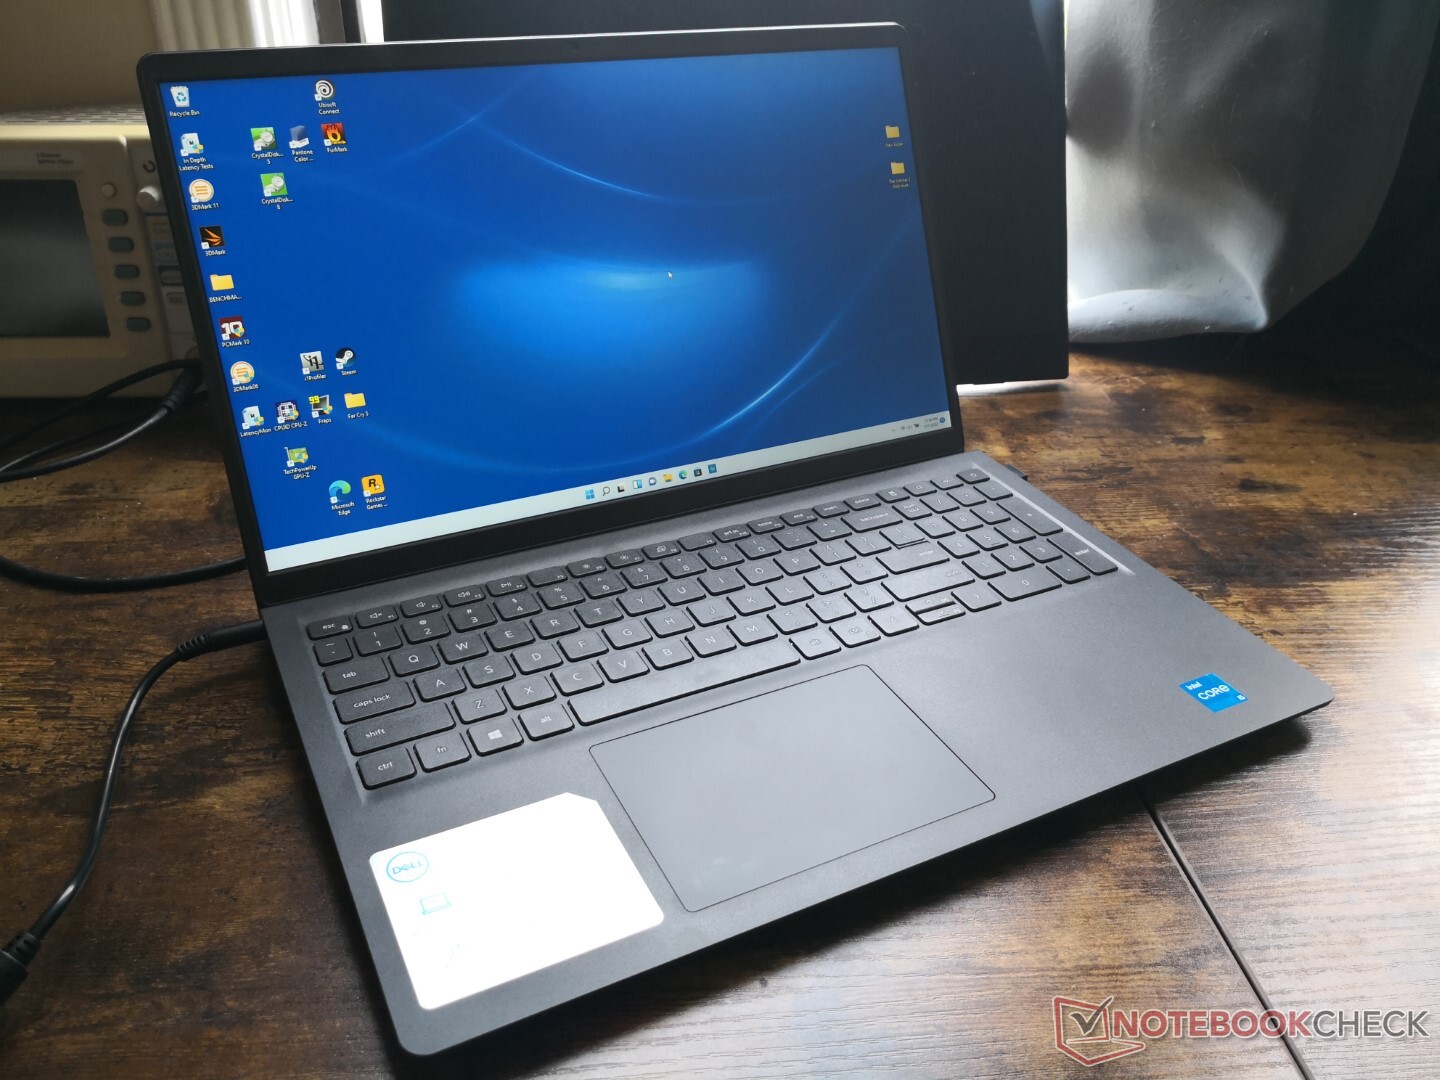
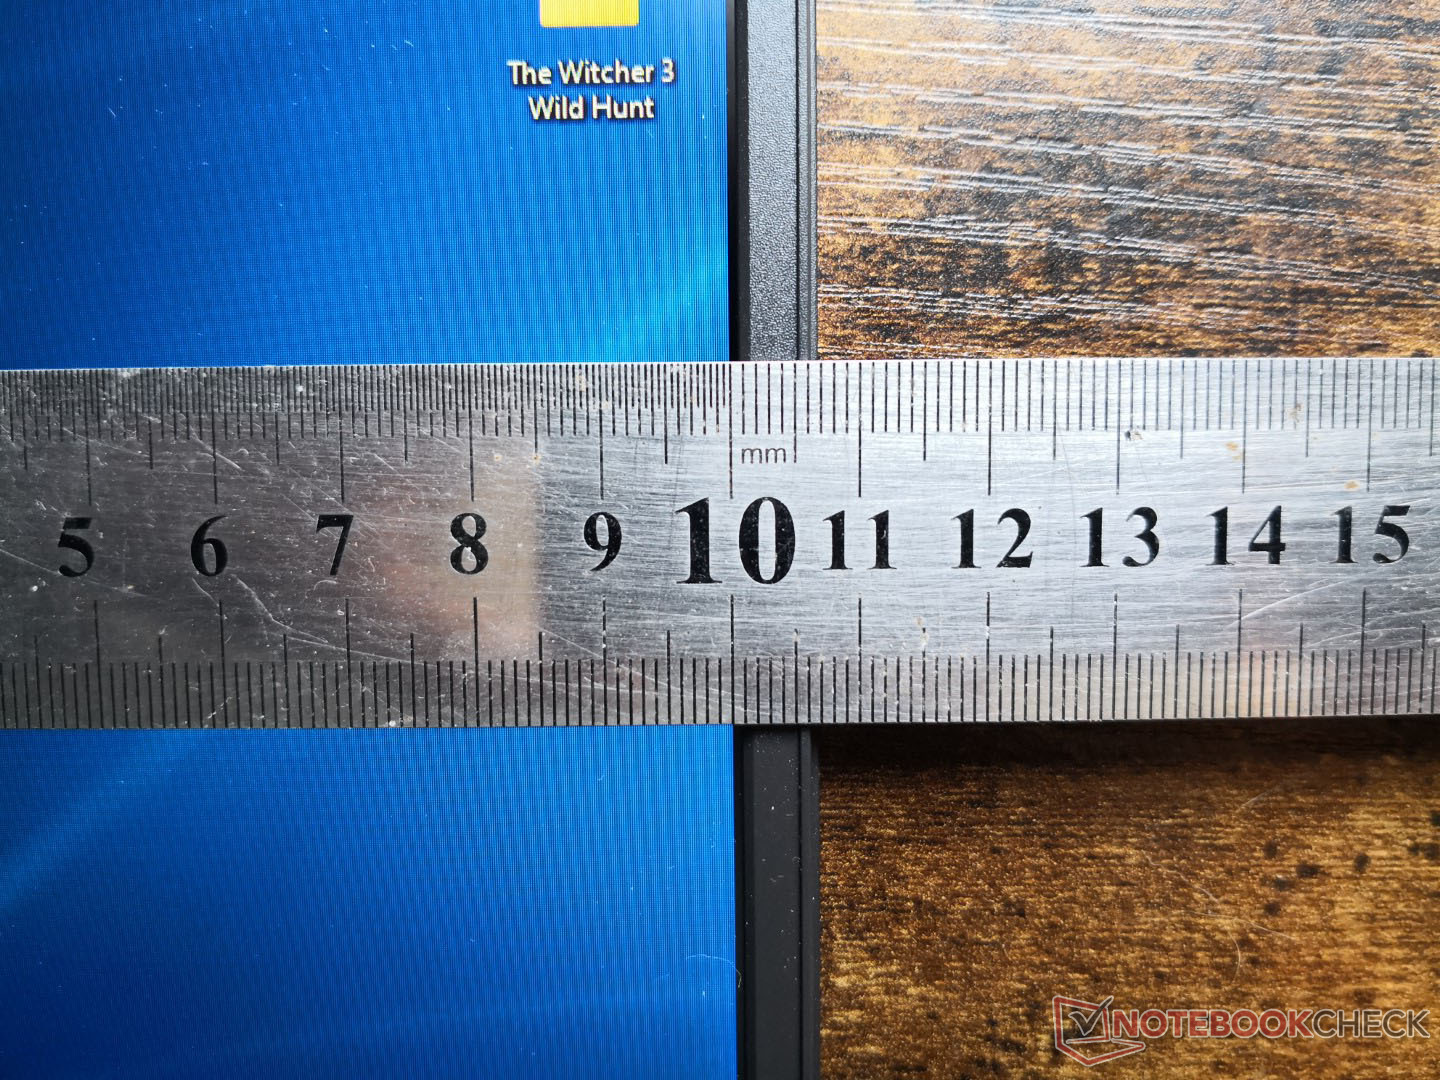
新机型比上一代产品小了约11%,轻了15%。然而,3501的设计实际上相当大,这意味着3511的设计在尺寸和重量方面与Pavilion 、VivoBook或IdeaPad 3更相似。
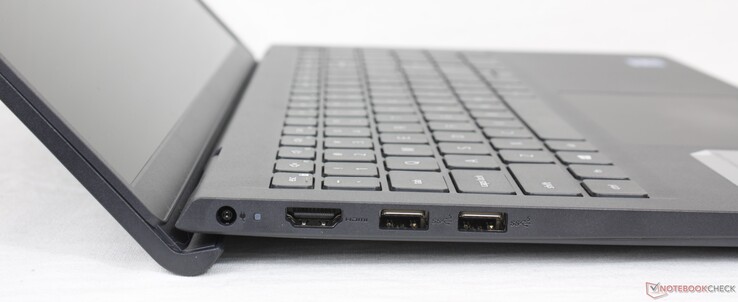
连接性
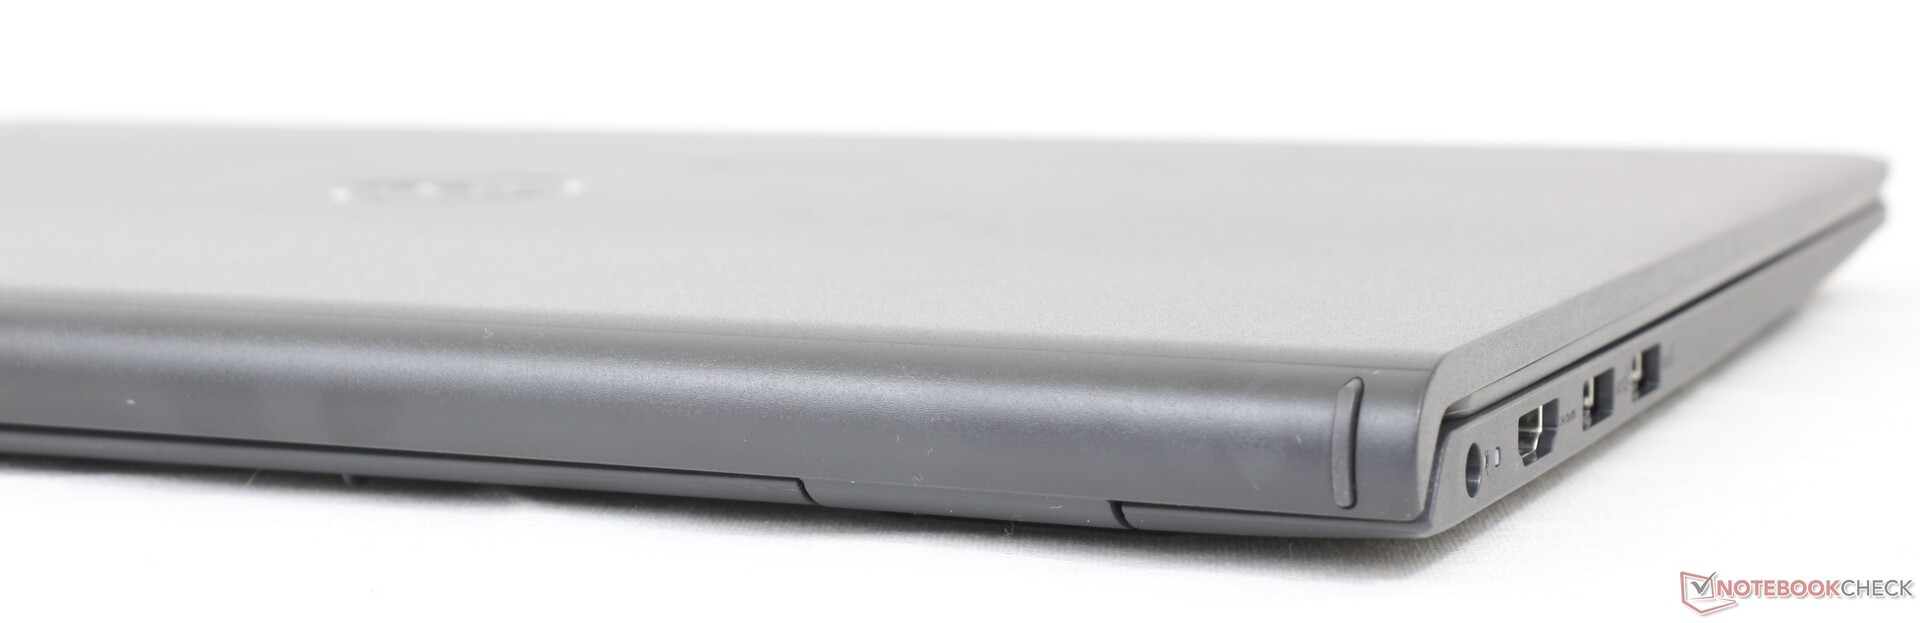
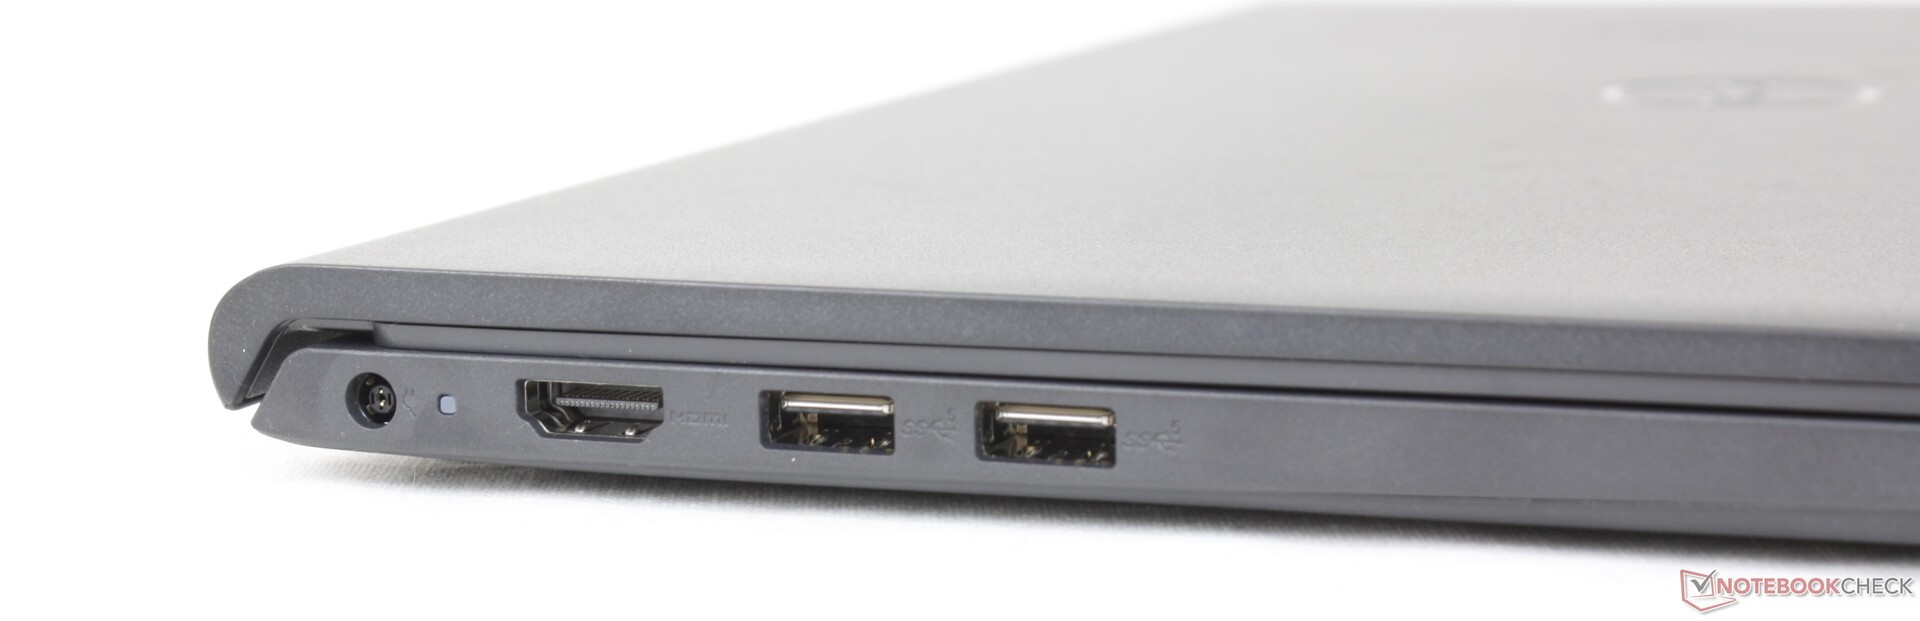
与老款Inspiron 15 3501相比,新款Inspiron 15 3511的端口较少。例如,电缆锁插槽和RJ-45端口现在已经完全消失。戴尔甚至不屑于包括一个USB-C选项。
有趣的是,根据戴尔自己的产品页面,这里的HDMI端口只能支持到1080p60,没有2K或4K选项。
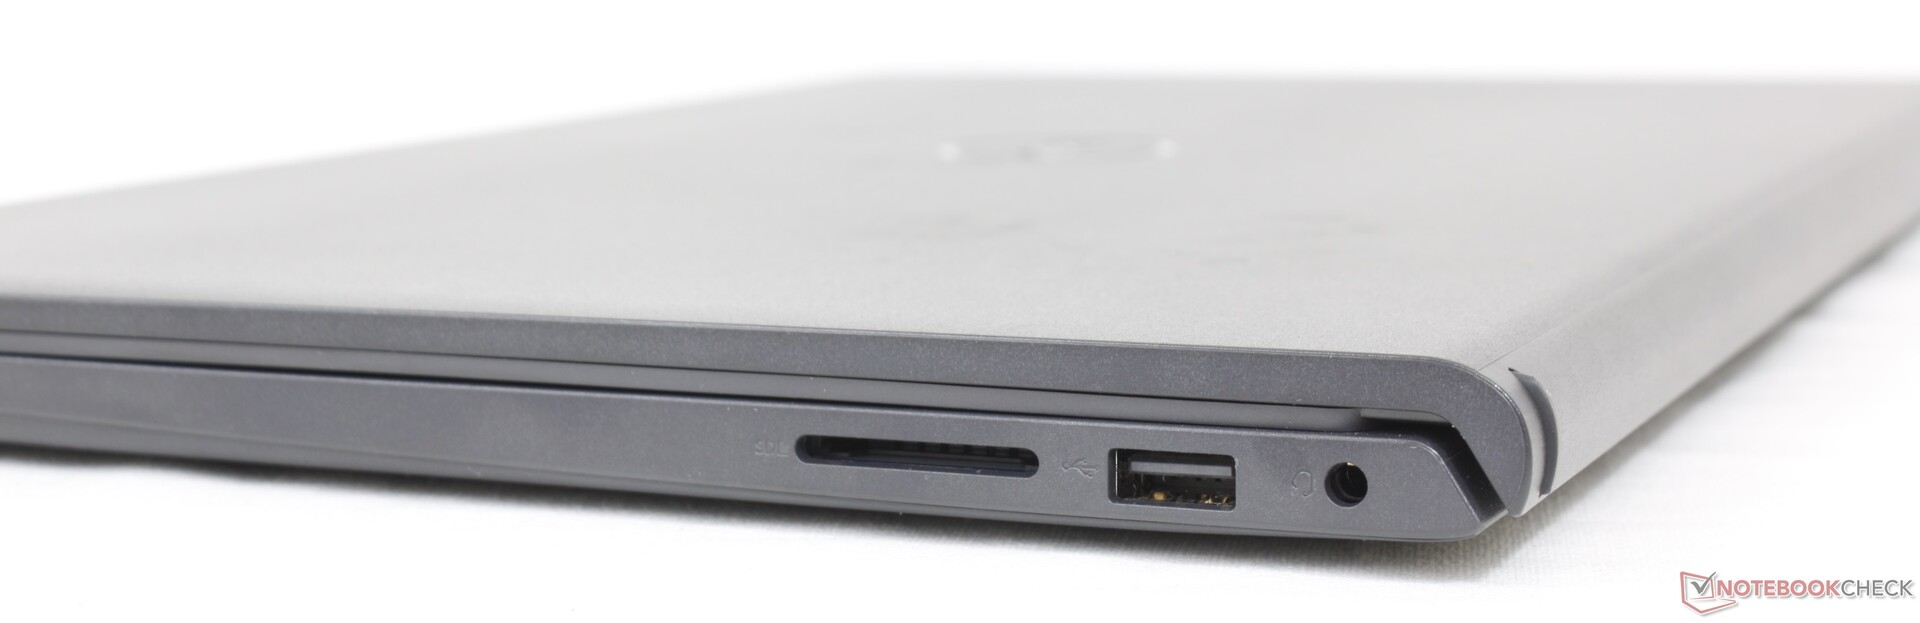
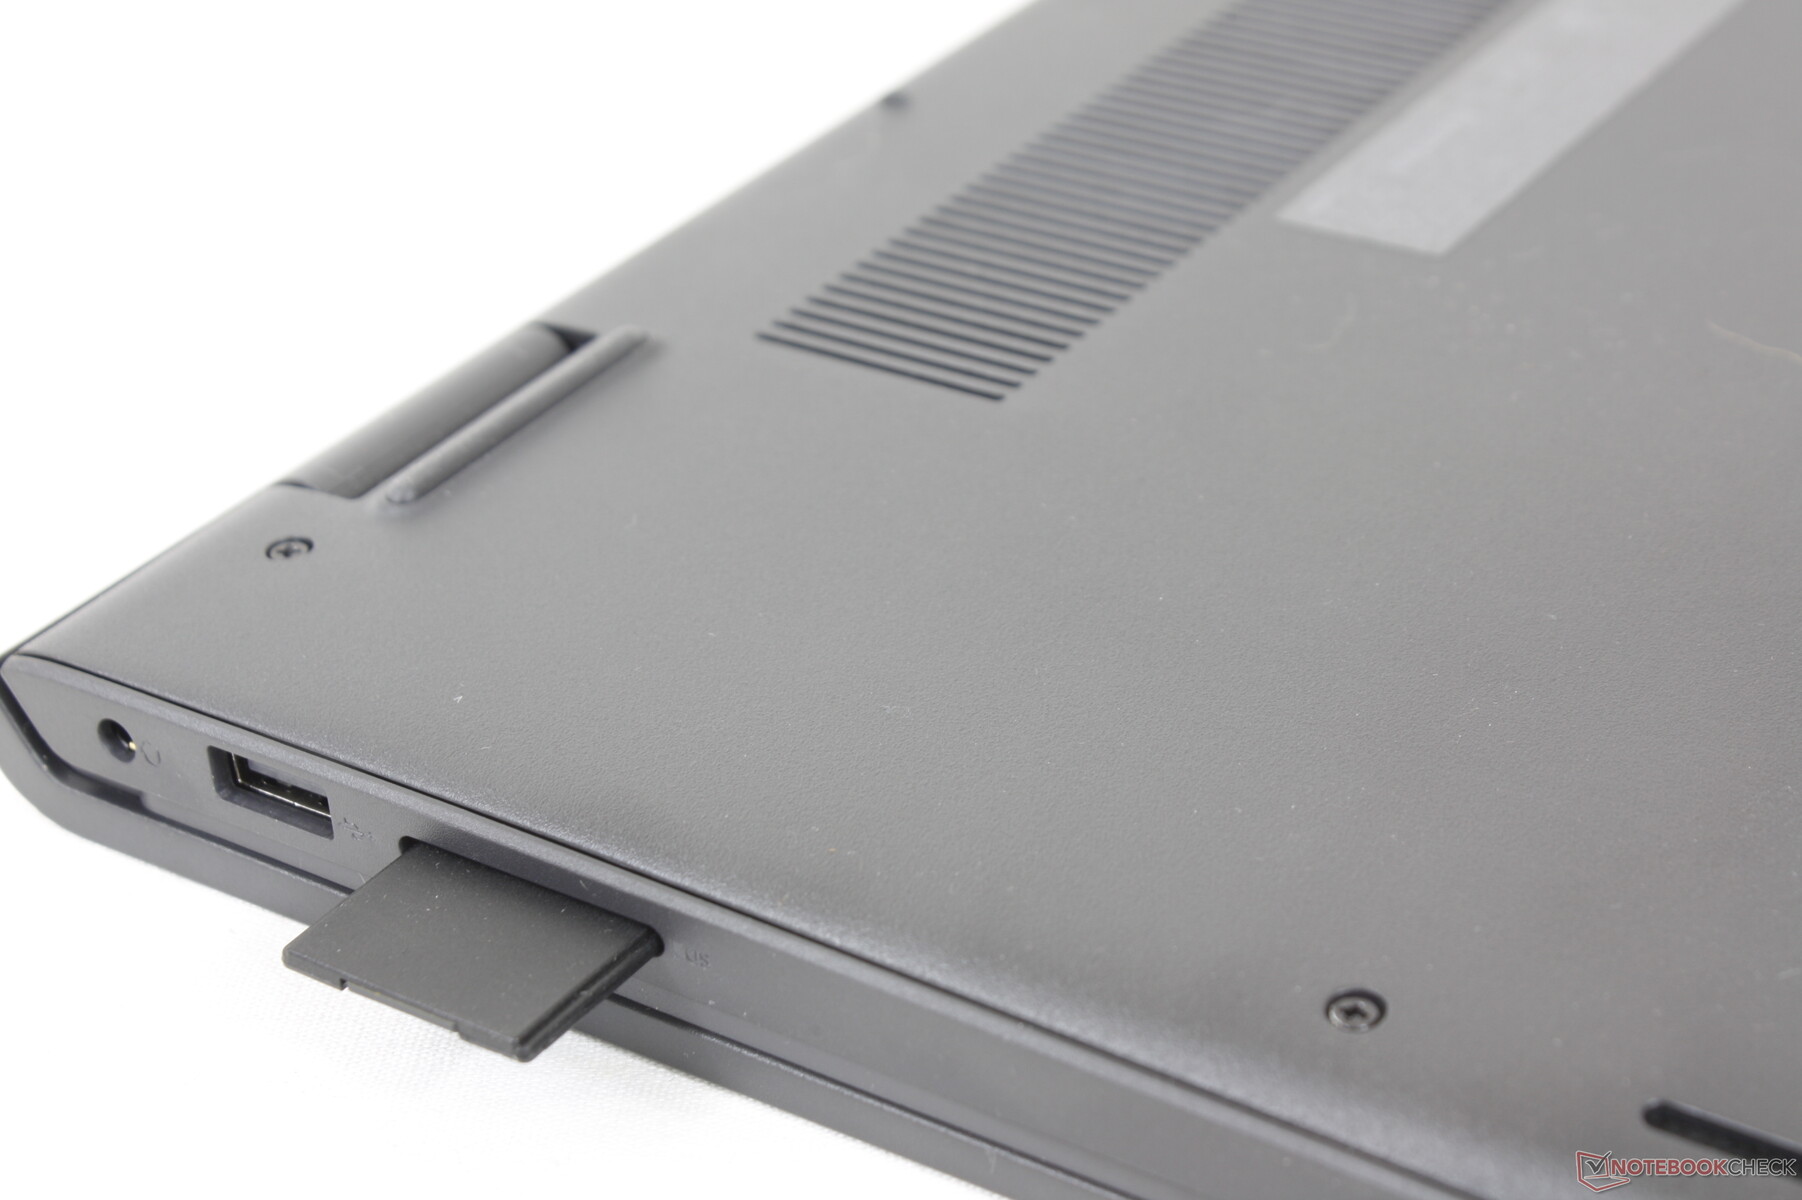
SD卡阅读器
集成的SD卡读卡器很慢。从我们的UHS-II测试卡向桌面传输1GB的图片需要50多秒,而在惠普Pavilion 15-eg上只需要14秒。
| SD Card Reader | |
| average JPG Copy Test (av. of 3 runs) | |
| Dell XPS 15 9510 i5 11400H FHD (AV Pro V60) | |
| HP Pavilion 15-eg (AV PRO microSD 128 GB V60) | |
| Asus VivoBook S15 D533UA (AV PRO microSD 128 GB V60) | |
| Lenovo IdeaPad 3 15ALC6 (AV PRO microSD 128 GB V60) | |
| Dell Inspiron 15 3501 (AV Pro SD 128 GB V60) | |
| Dell Inspiron 15 3000 3511 (AV Pro V60) | |
| maximum AS SSD Seq Read Test (1GB) | |
| Dell XPS 15 9510 i5 11400H FHD (AV Pro V60) | |
| HP Pavilion 15-eg (AV PRO microSD 128 GB V60) | |
| Lenovo IdeaPad 3 15ALC6 (AV PRO microSD 128 GB V60) | |
| Asus VivoBook S15 D533UA (AV PRO microSD 128 GB V60) | |
| Dell Inspiron 15 3501 (AV Pro SD microSD 128 GB V60) | |
| Dell Inspiron 15 3000 3511 (AV Pro V60) | |
沟通
包括一个1x1的Wi-Fi 5模块,而不是通常的2x2 Wi-Fi 6模块,可能是为了节省成本。虽然现实世界的传输率很平庸,但至少对于流媒体而言,它们足够稳定和可靠。
| Networking | |
| iperf3 transmit AX12 | |
| Dell XPS 15 9510 i5 11400H FHD | |
| HP Pavilion 15-eg | |
| Asus VivoBook S15 D533UA | |
| Lenovo IdeaPad 3 15ALC6 | |
| Dell Inspiron 15 3000 3511 | |
| Dell Inspiron 15 3501 | |
| iperf3 receive AX12 | |
| Dell XPS 15 9510 i5 11400H FHD | |
| HP Pavilion 15-eg | |
| Asus VivoBook S15 D533UA | |
| Lenovo IdeaPad 3 15ALC6 | |
| Dell Inspiron 15 3501 | |
| Dell Inspiron 15 3000 3511 | |
网络摄像头
与去年的Inspiron 3501相比,摄像头质量似乎没有改进。也没有网络摄像头快门或Windows Hello支持。


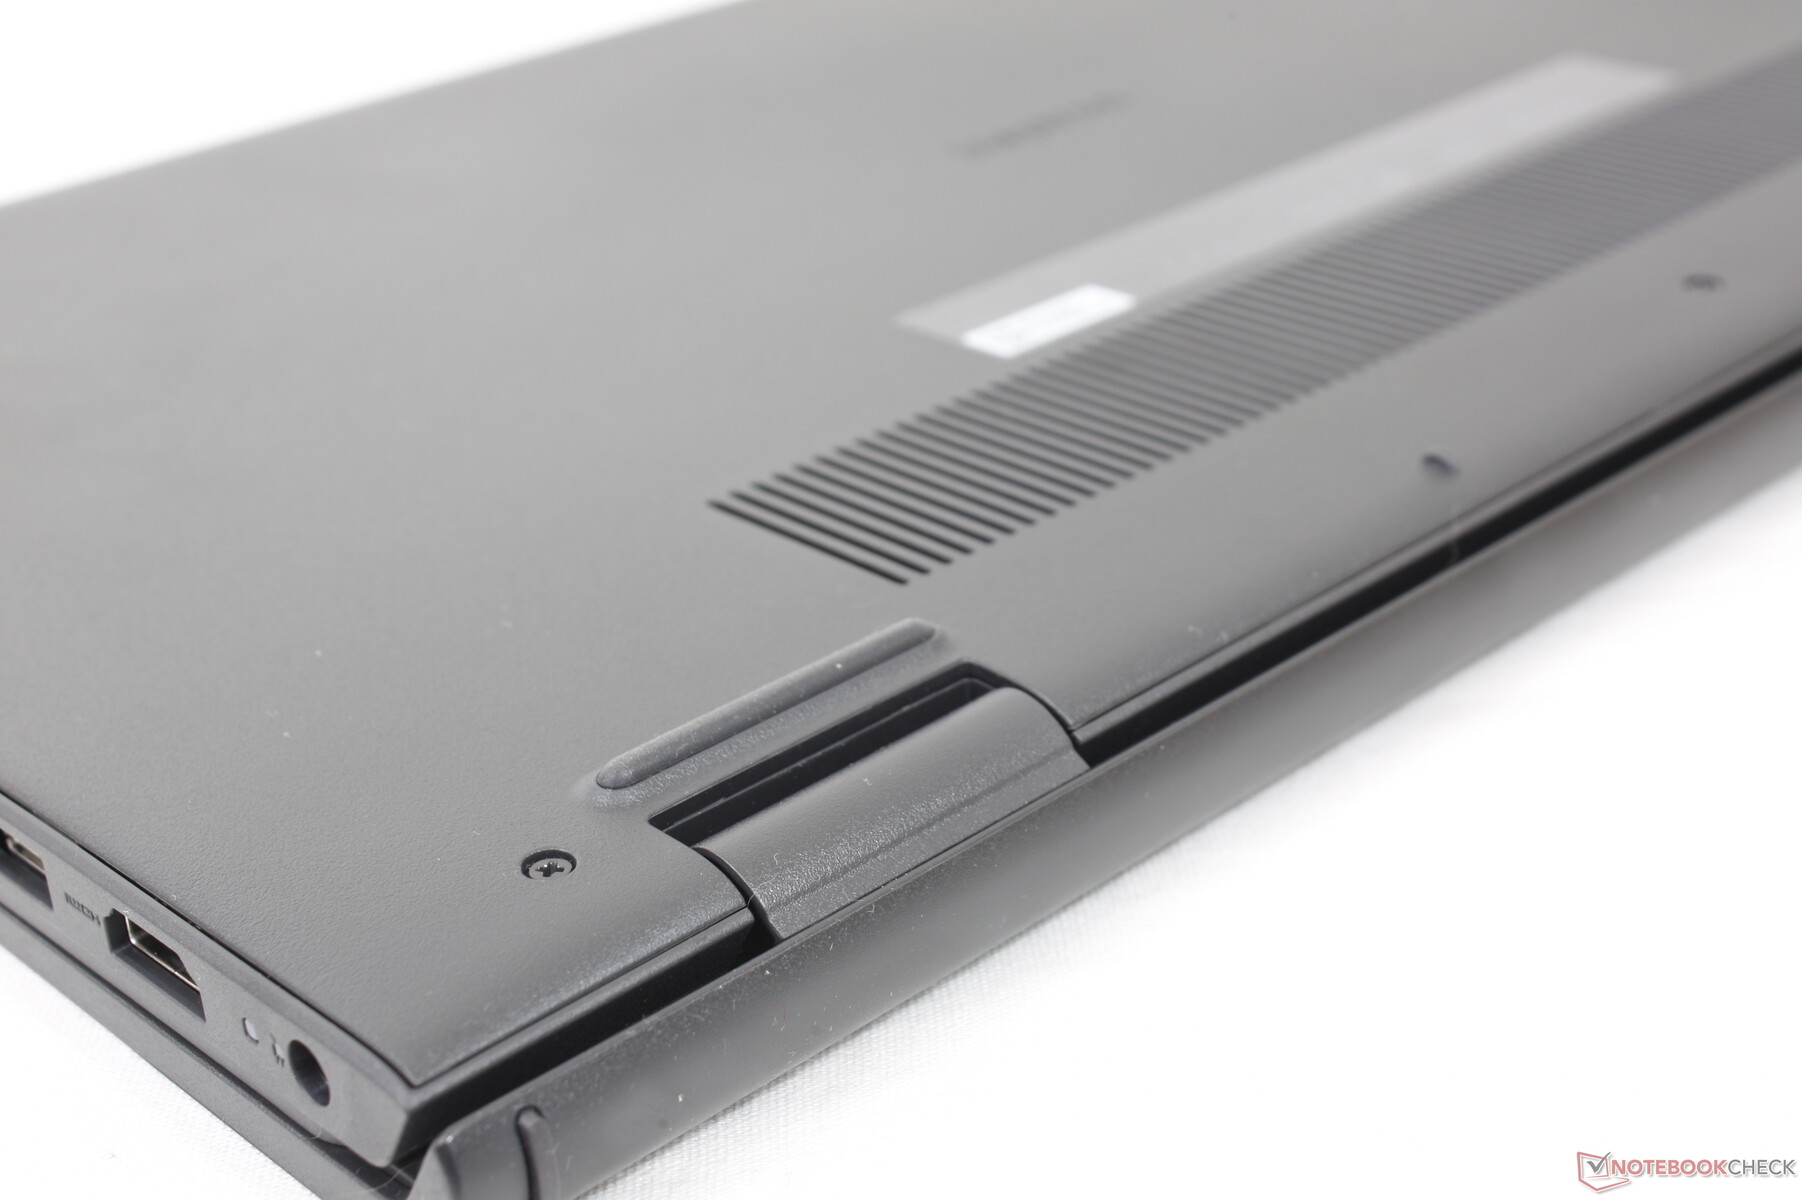
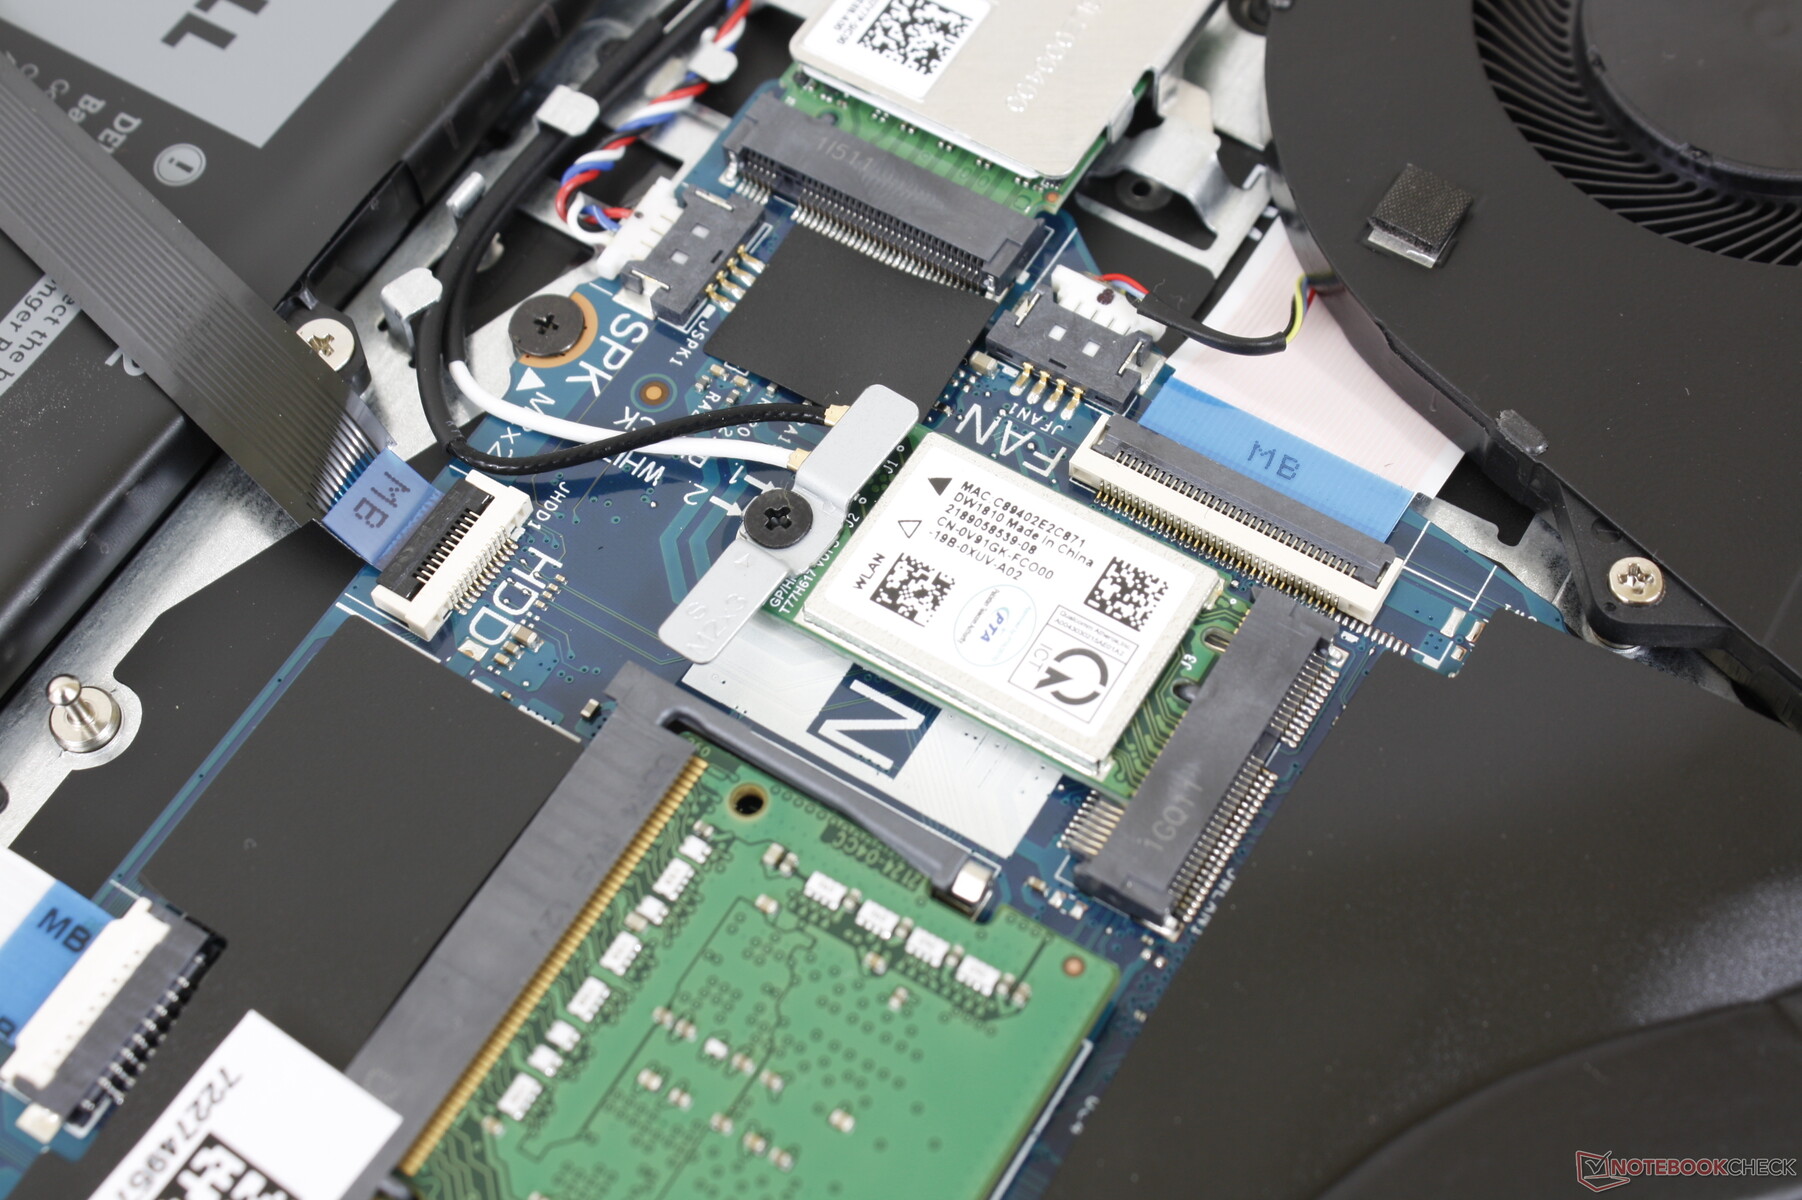
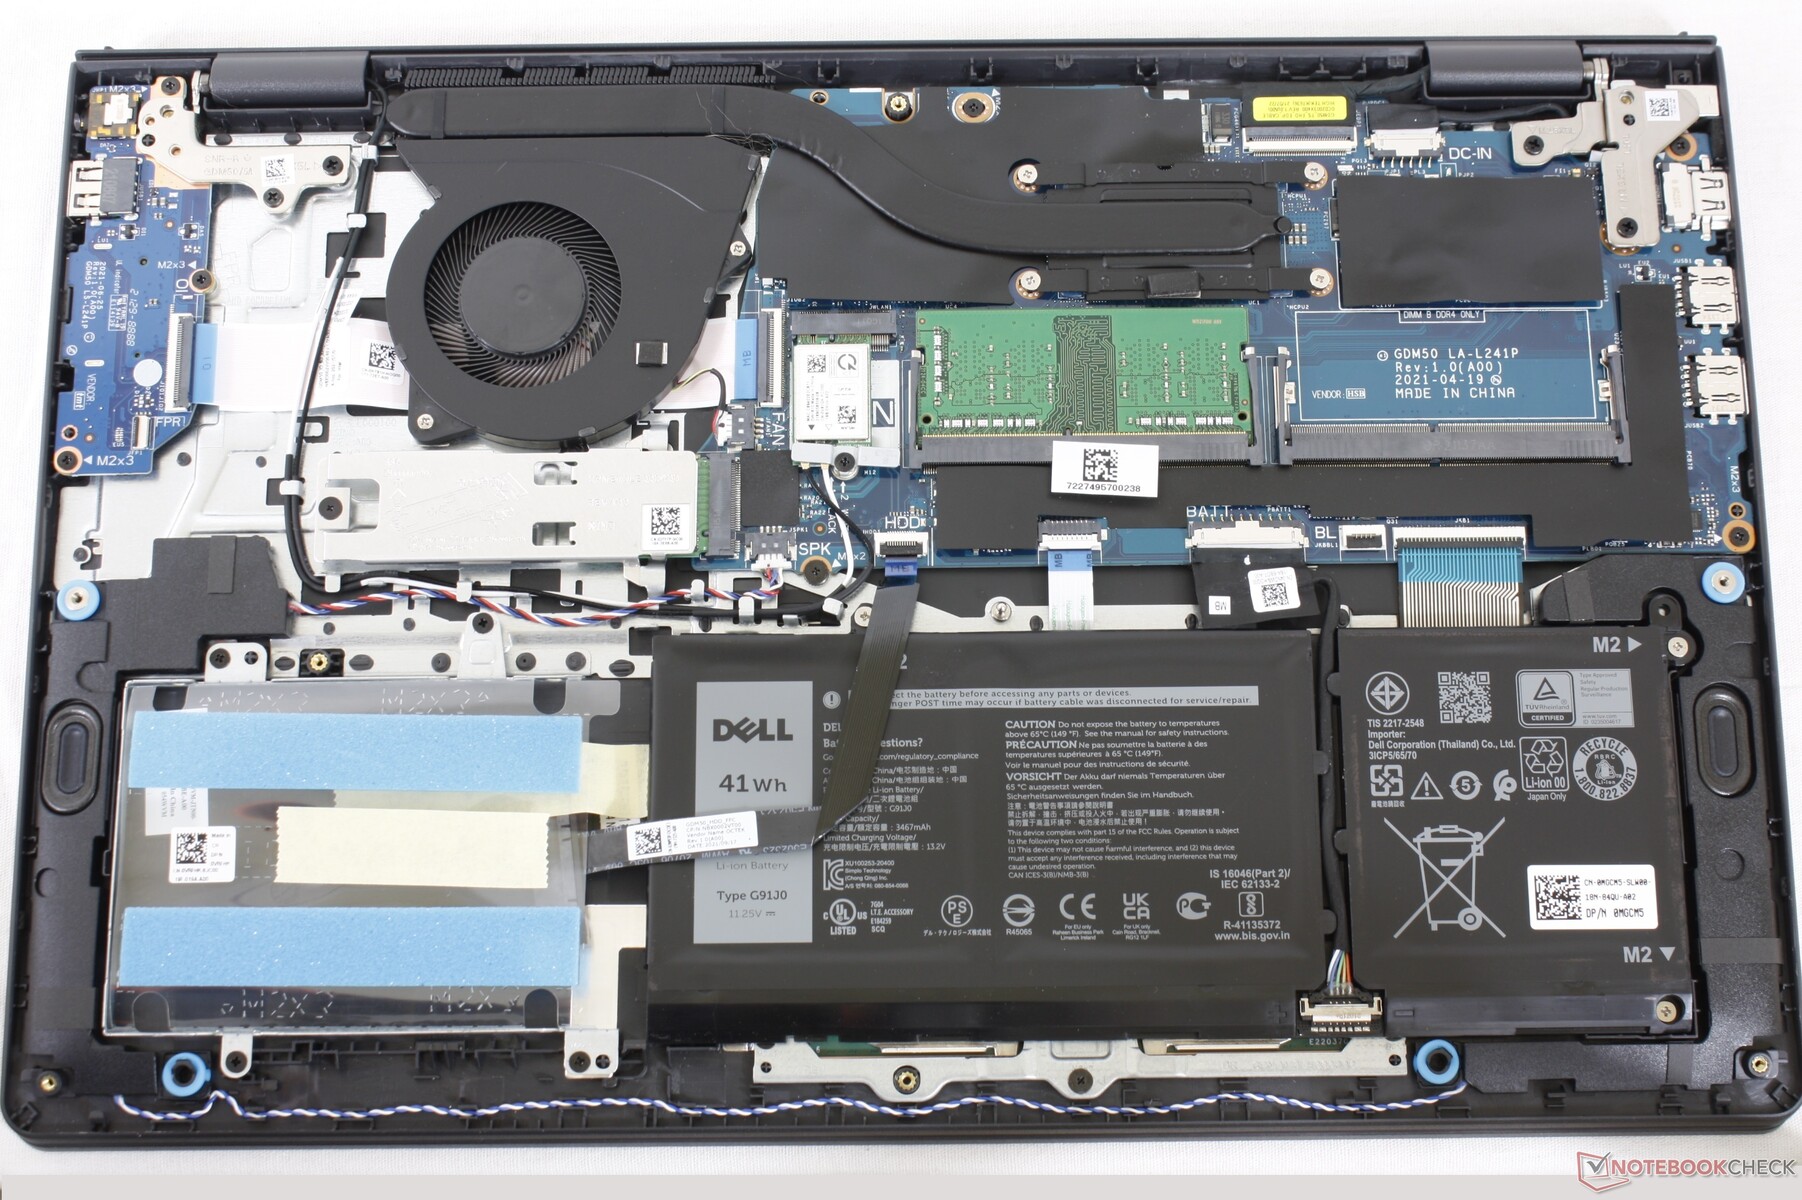
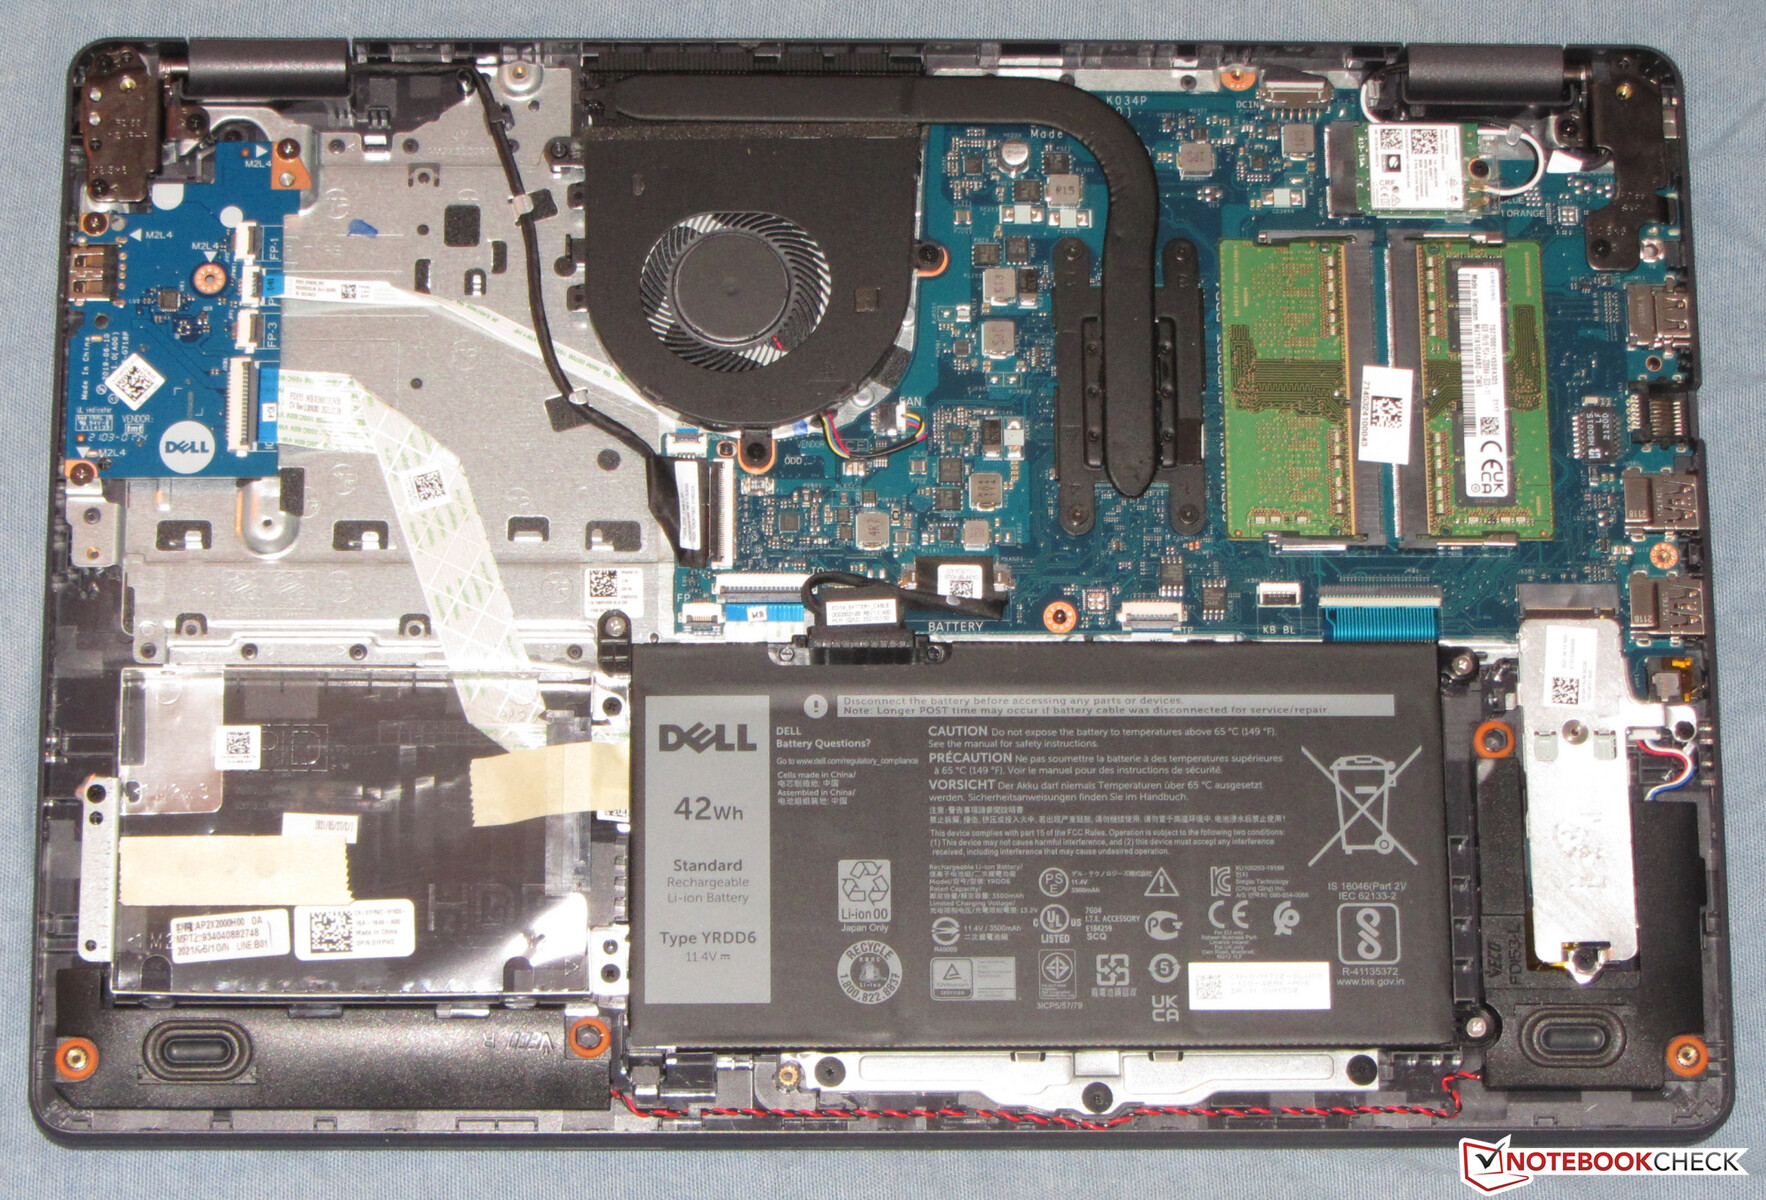
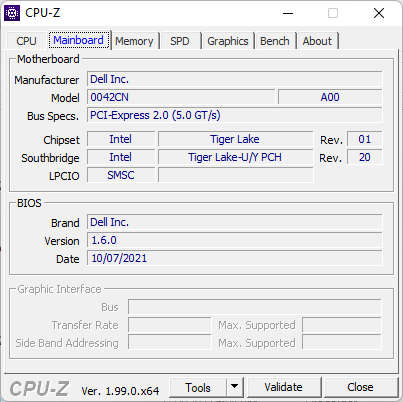
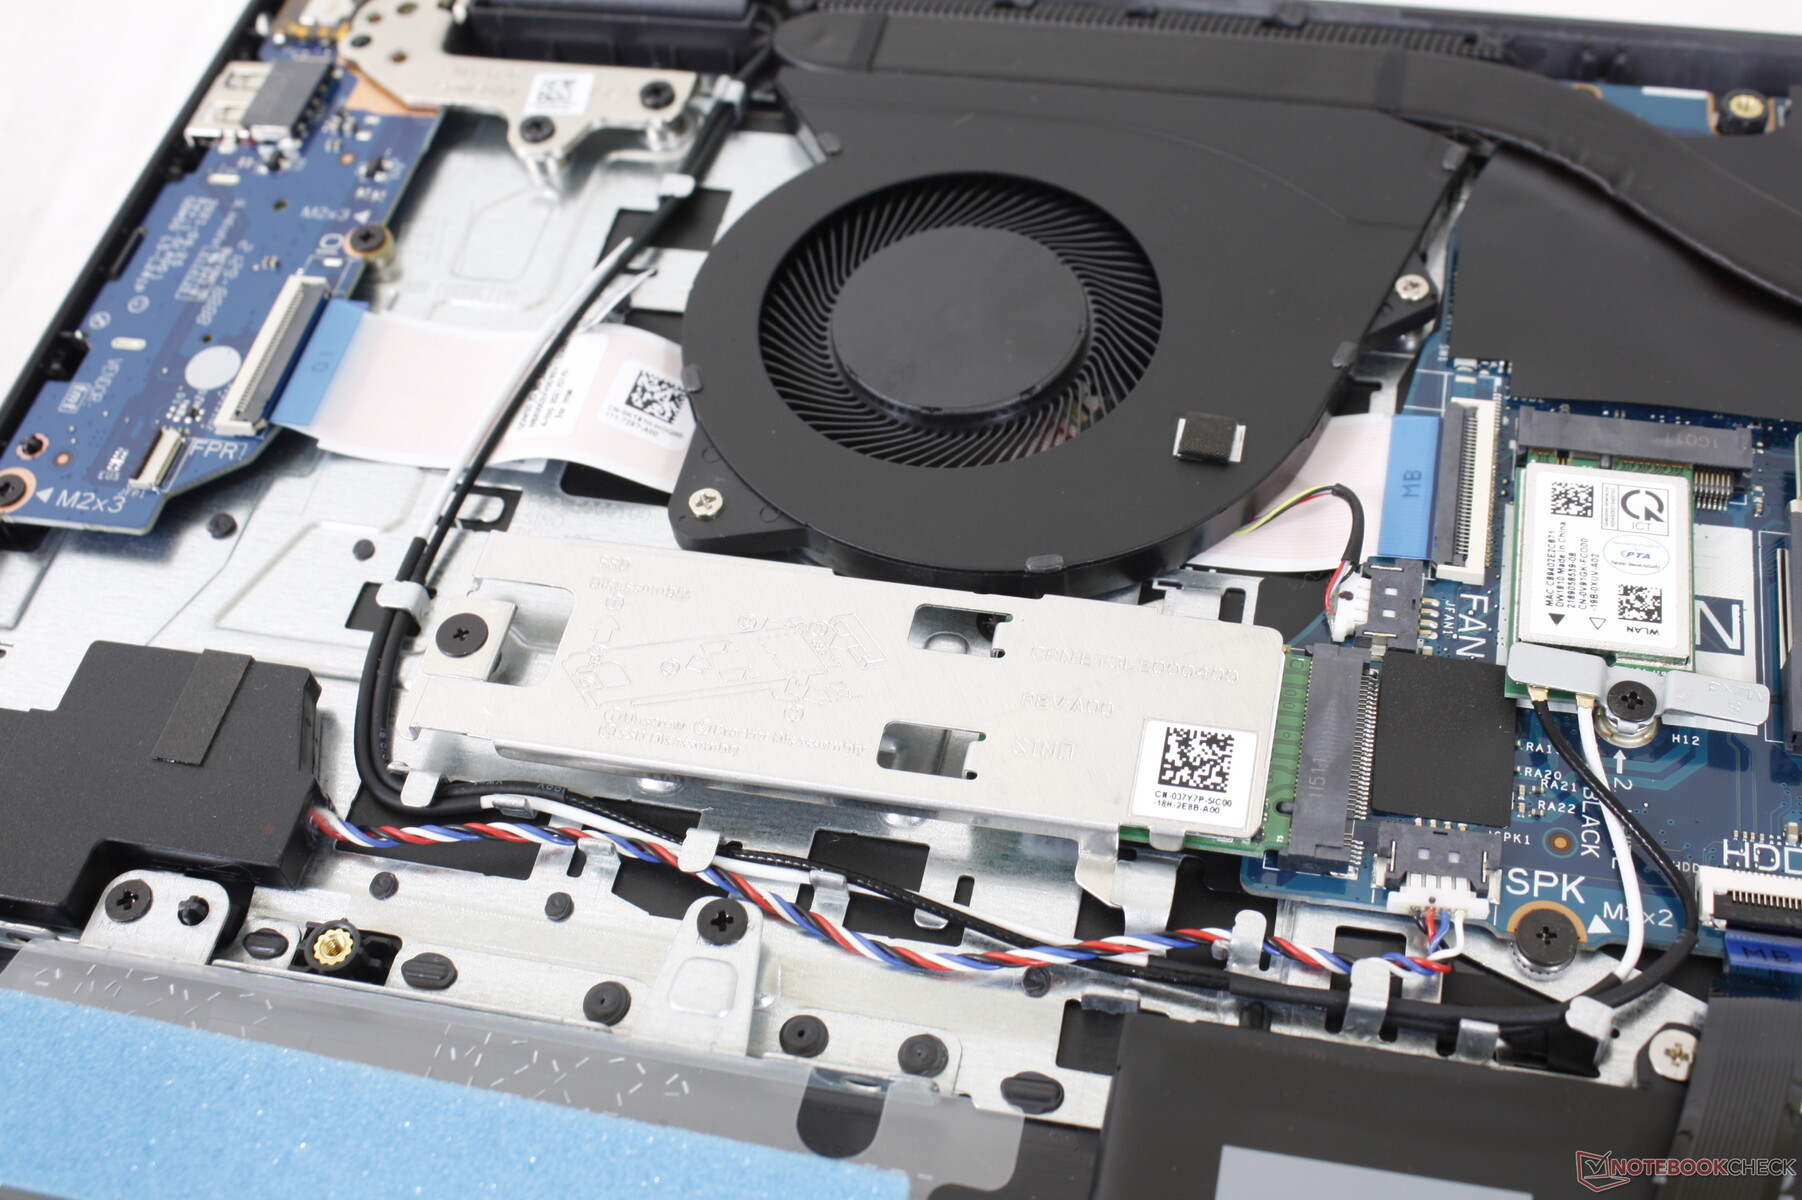
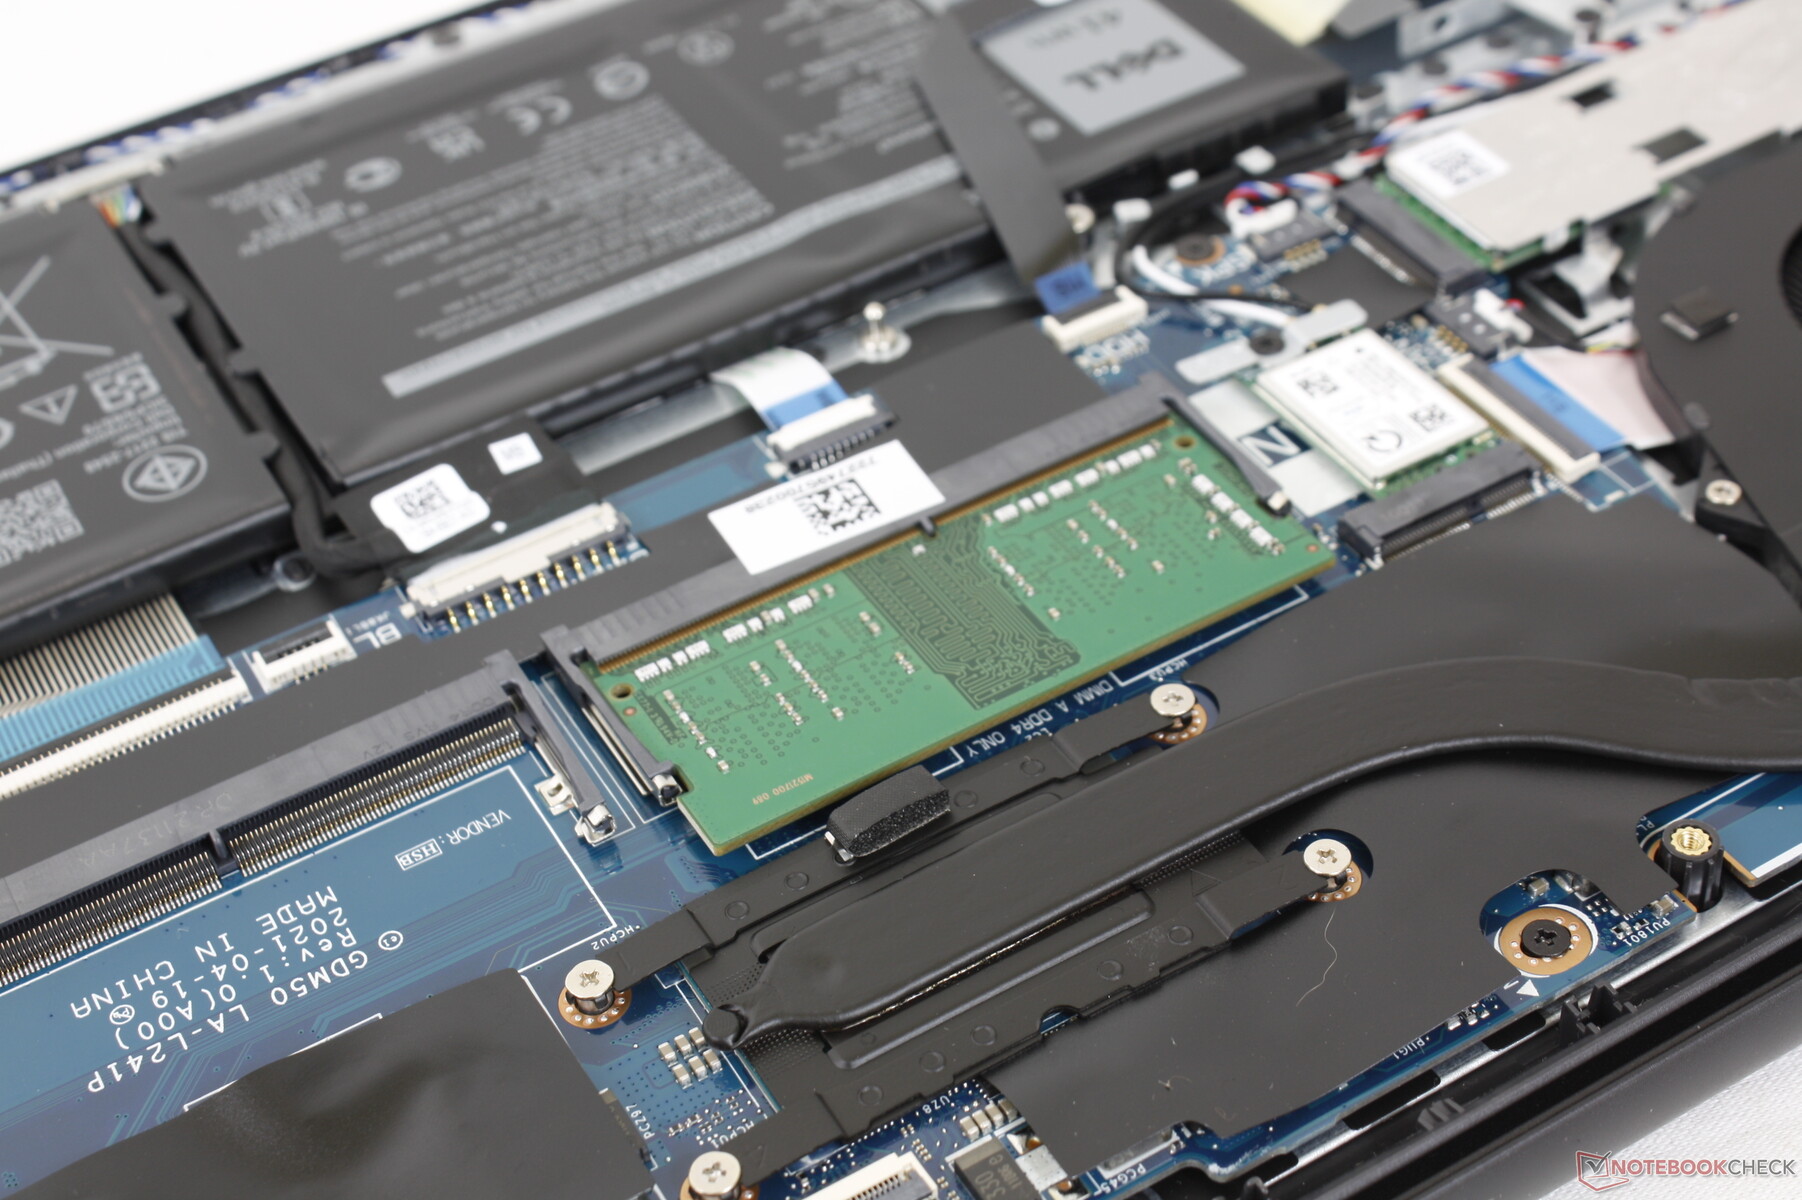
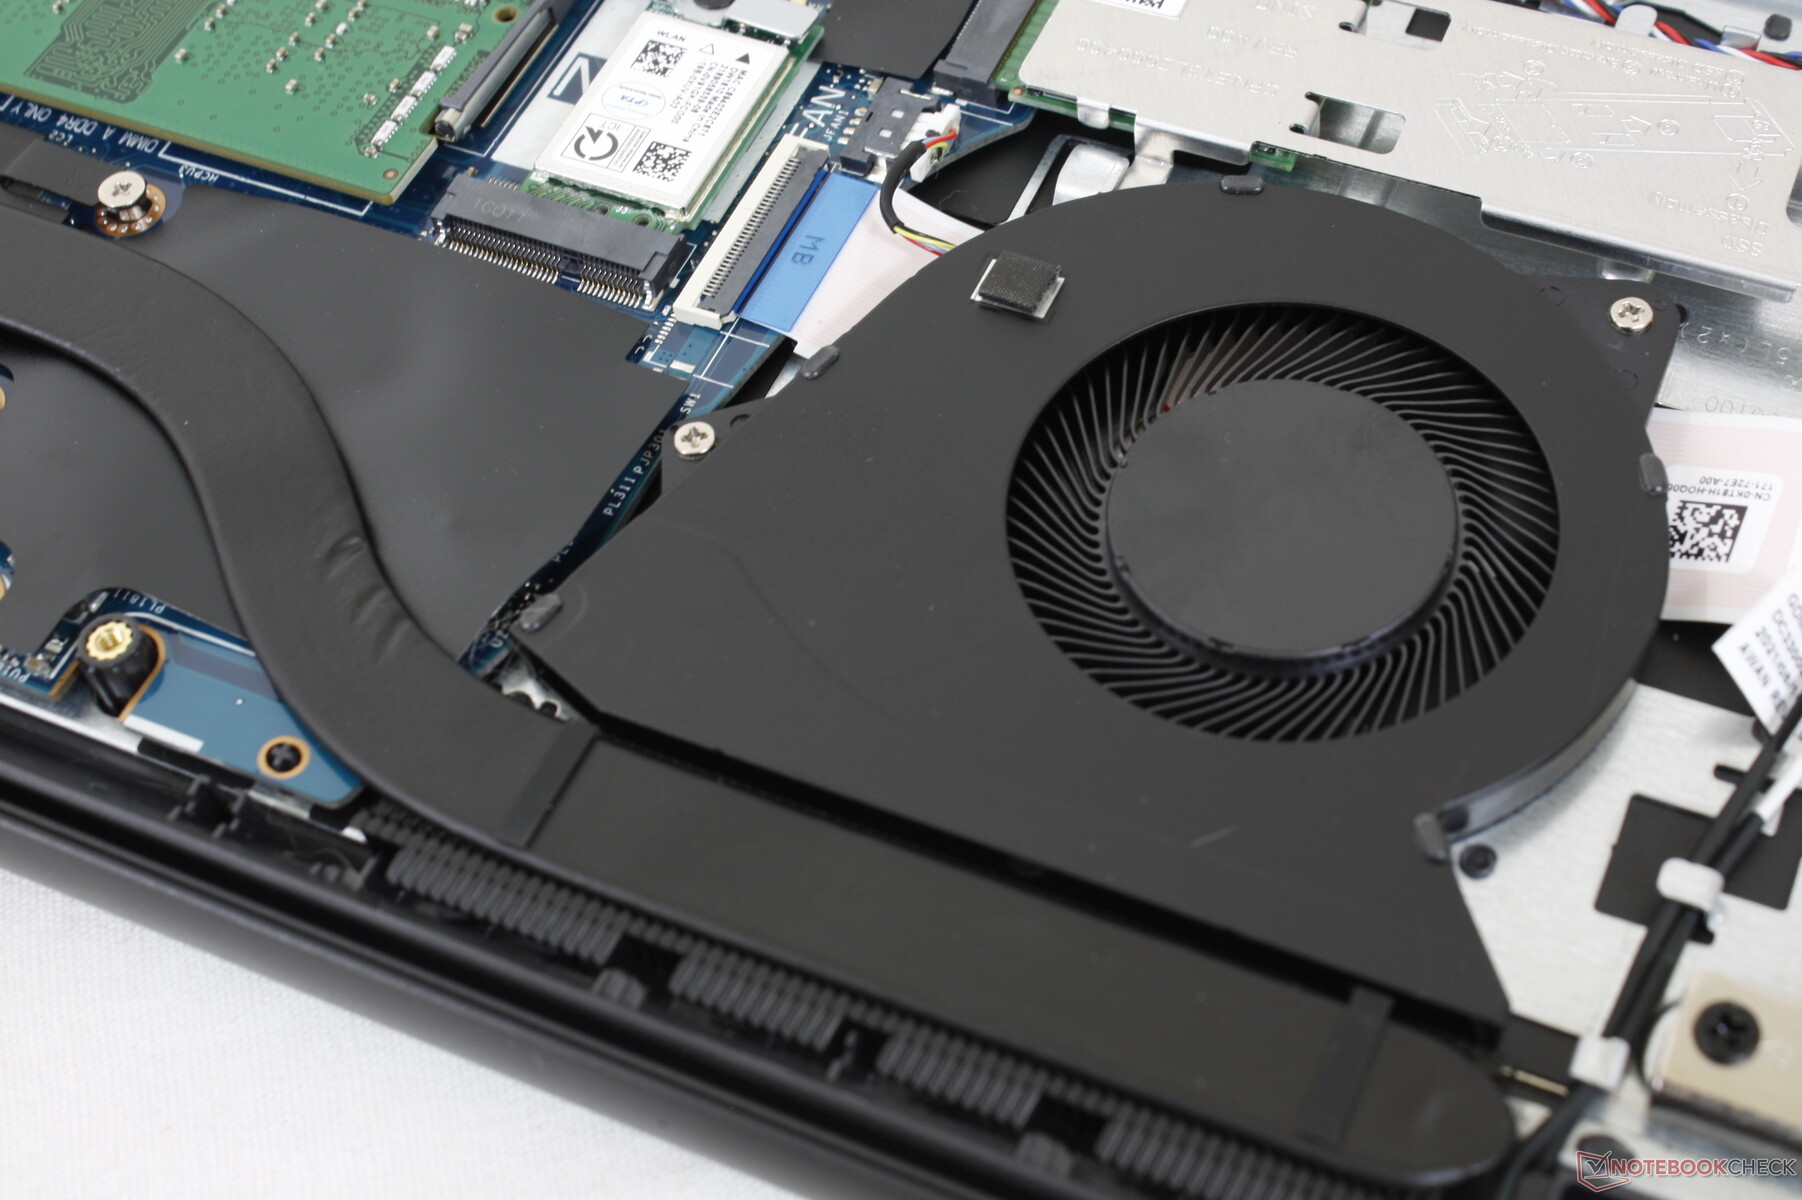
维护
底部面板比预期的更容易弹出,特别是对于这样一个廉价的模型。用户可以直接接触到两个存储托架、两个SODIMM插槽、WLAN模块和大多数主要部件。
配件和保修
除了交流电适配器和文件外,盒子里没有其他额外的东西。标准的一年有限制造商保修适用。
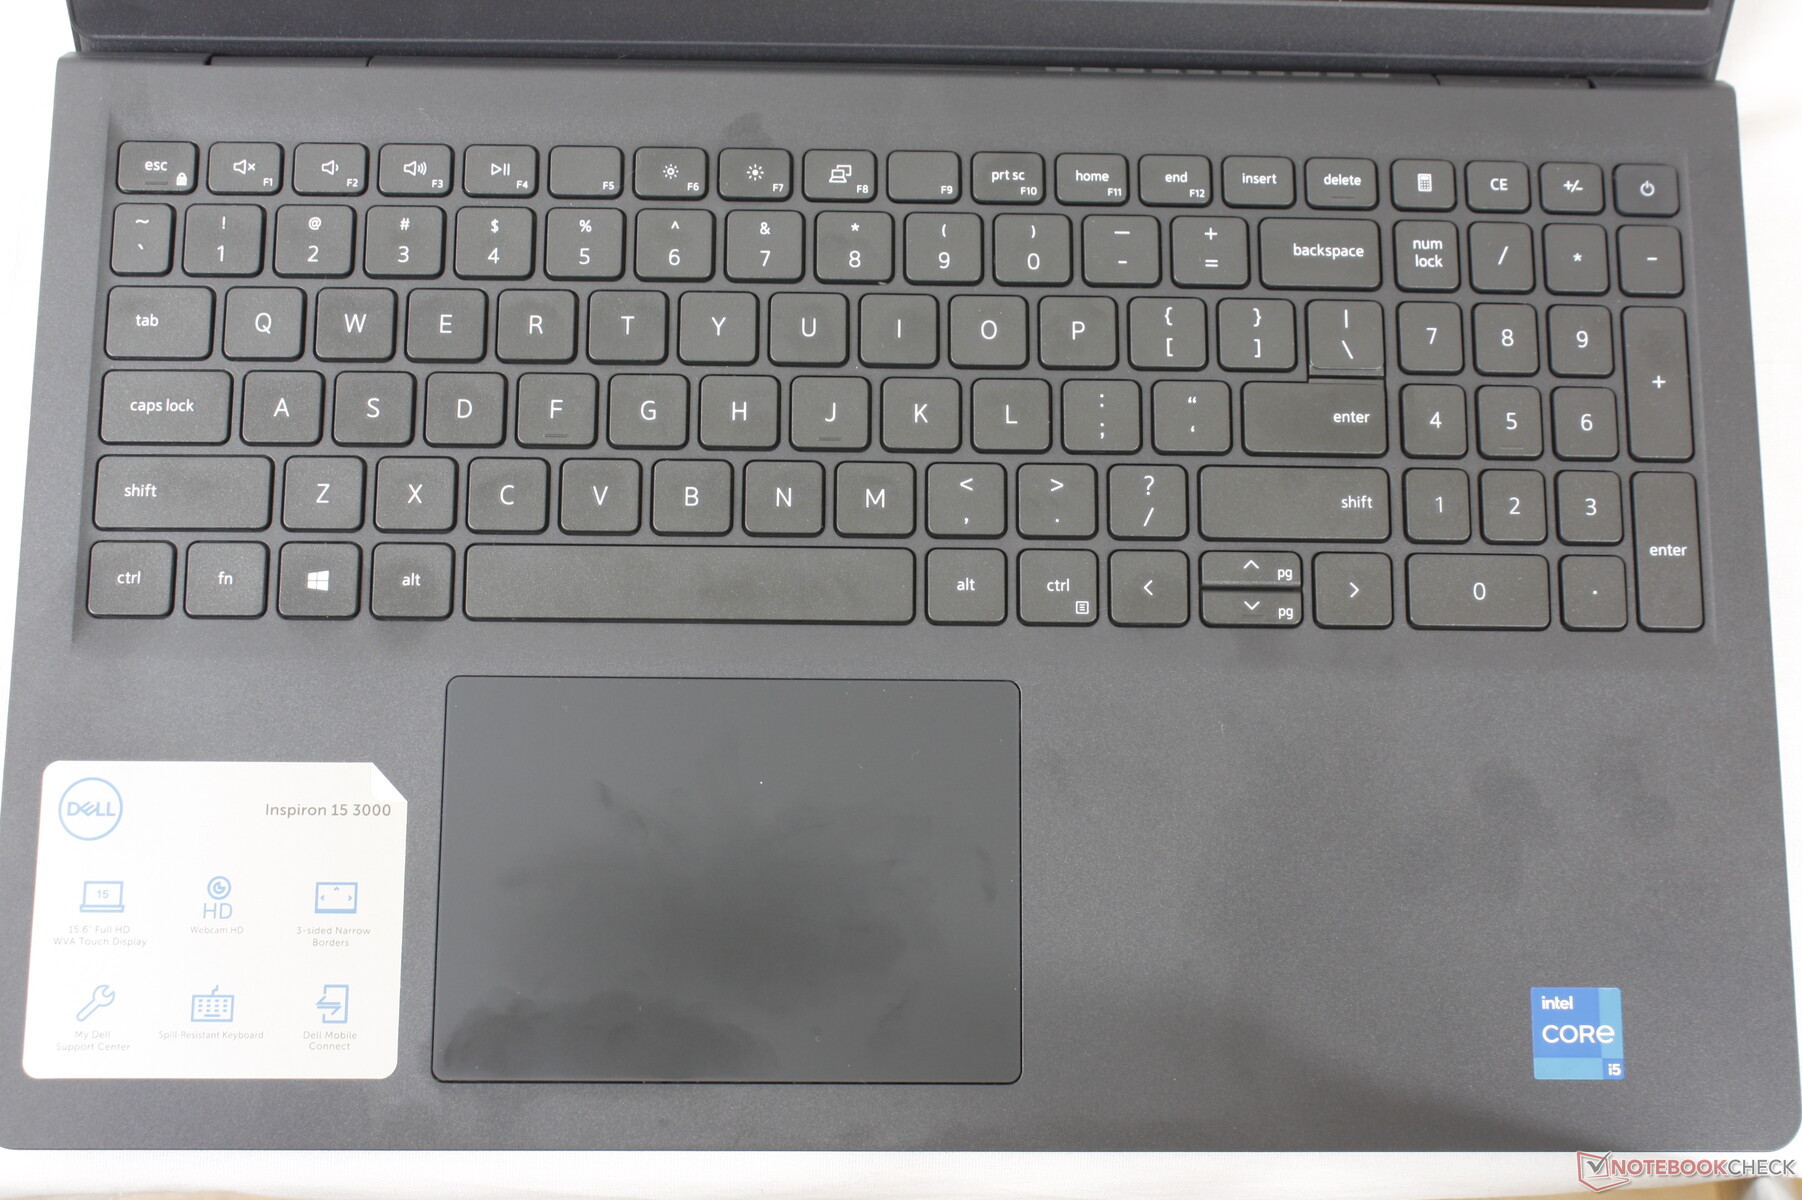
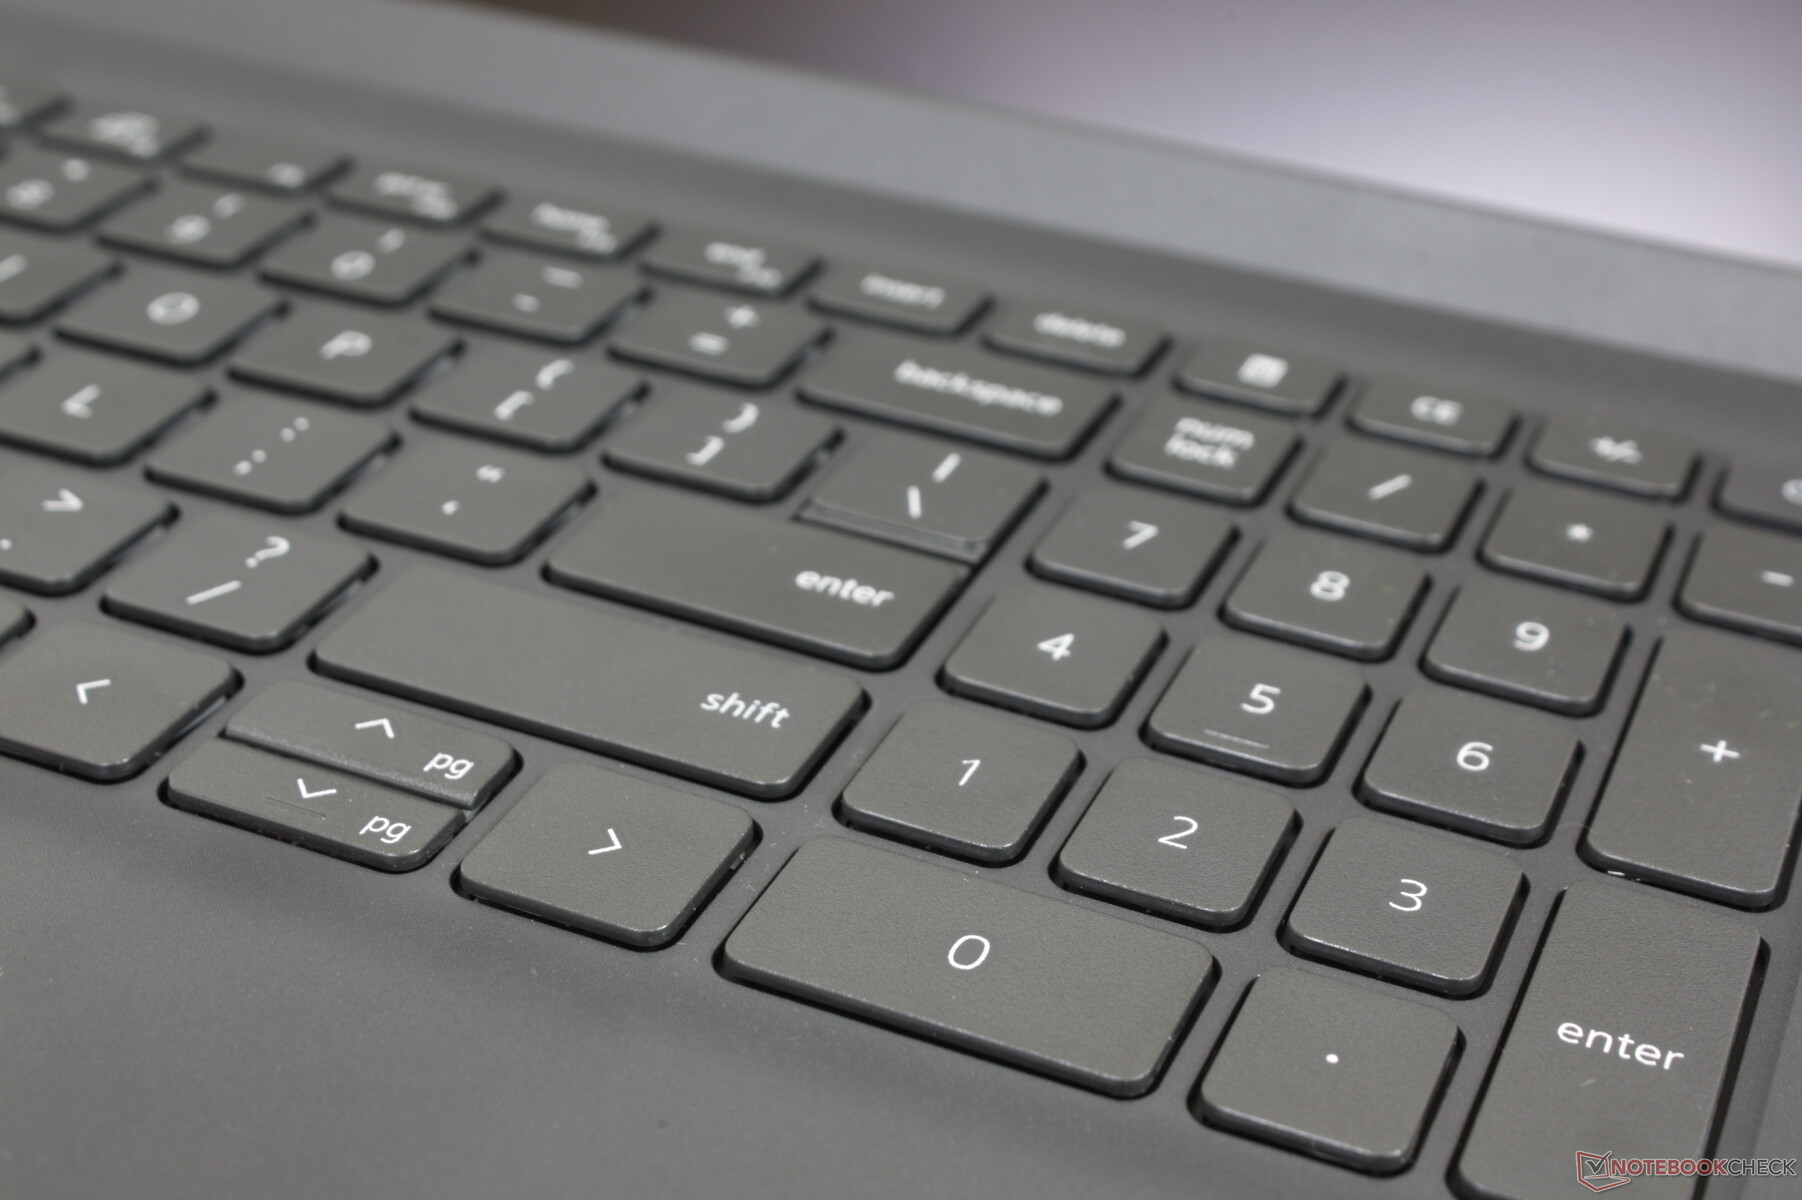
输入设备
键盘
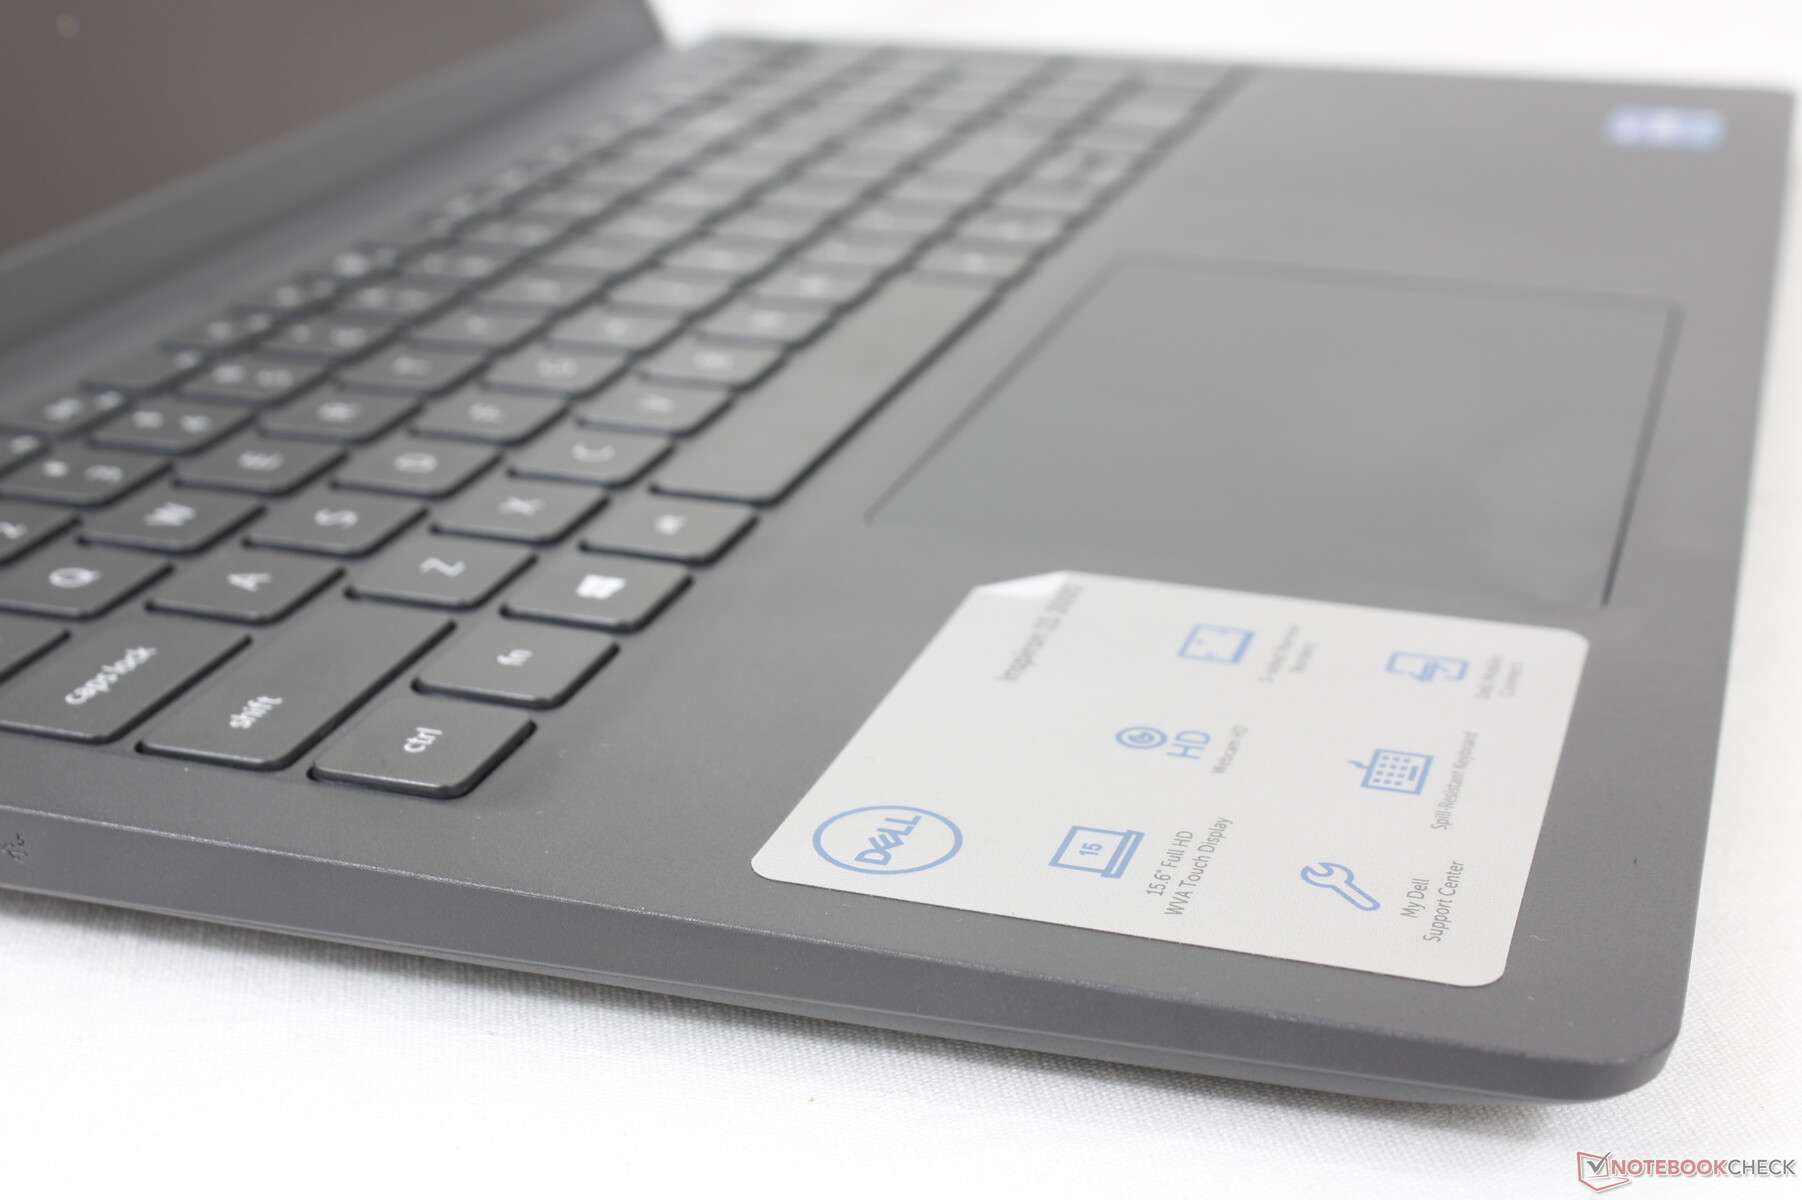
按键反馈比预期的海绵状感觉要轻一些,软一些。特别是空格键和回车键,与惠普Pavilion 、联想IdeaPad或华硕VivoBook上的相同按键相比,感觉要弱一些。
键盘背光灯不可用。
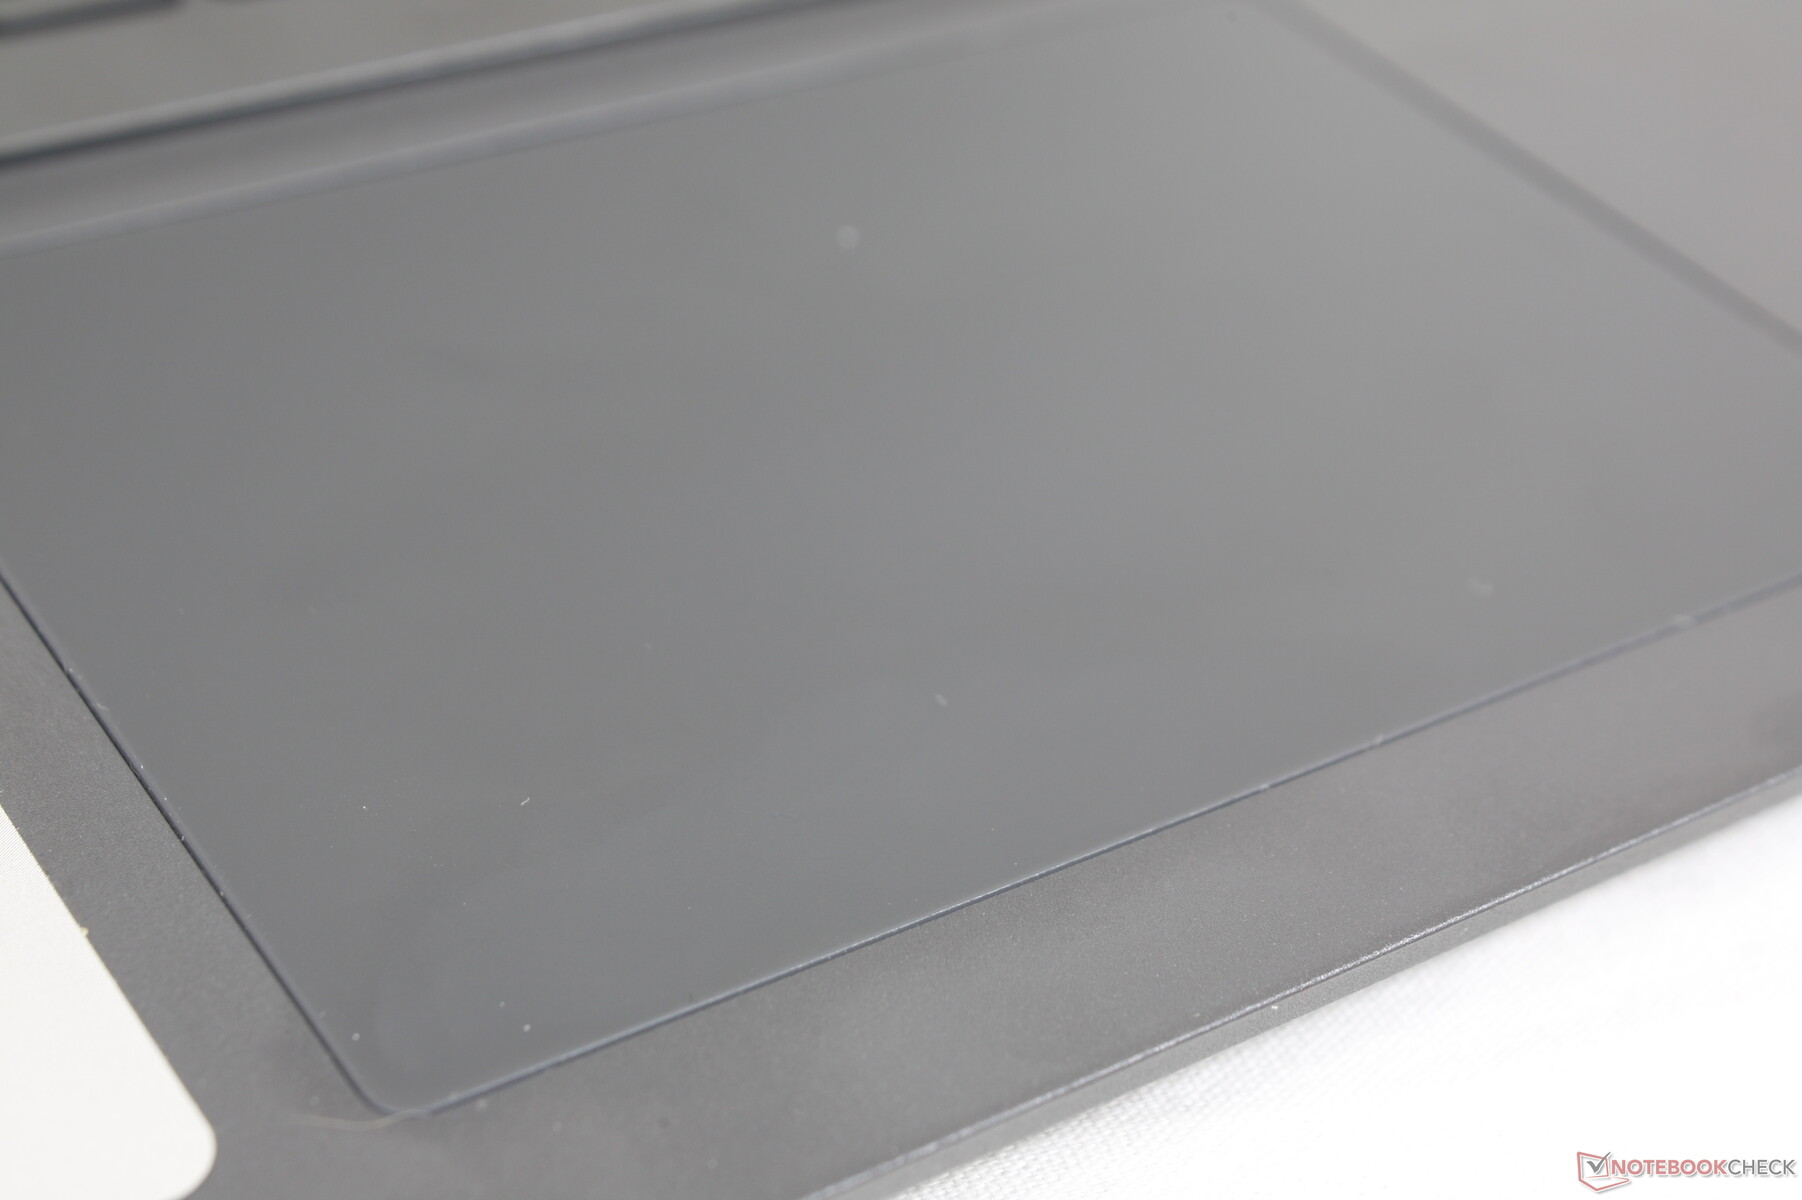
触摸板
点击板相对较大,为11.5 x 8厘米,相比之下,10.5 x 7.3厘米在 华硕Vivobook 15 K513EQ或2021年的惠普Pavilion 15的11.5 x 7.4厘米。它的表面也比许多其他点击板更粘,特别是在以较慢或中慢速滑行时。对于常规的光标控制来说,它足够可靠,但如果没有实际的按钮或USB鼠标,其他动作如点击或拖放可能会很累人。

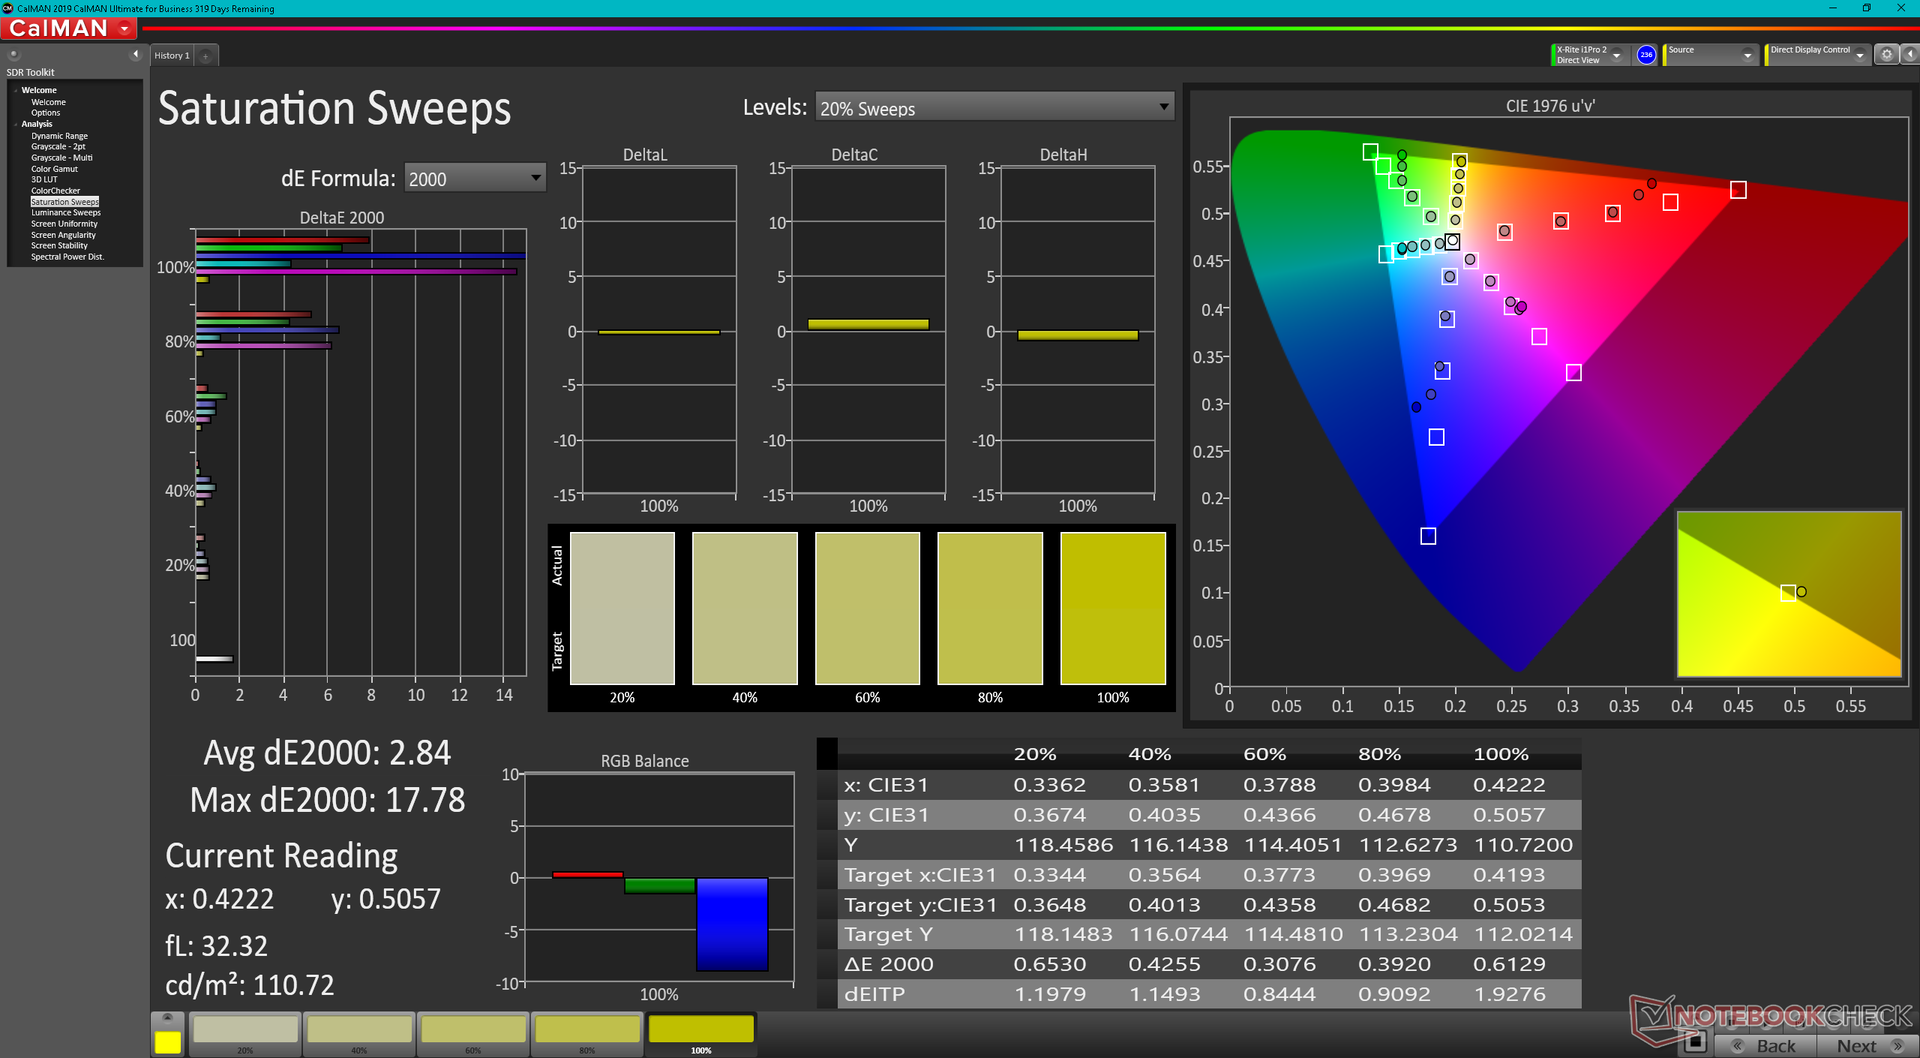
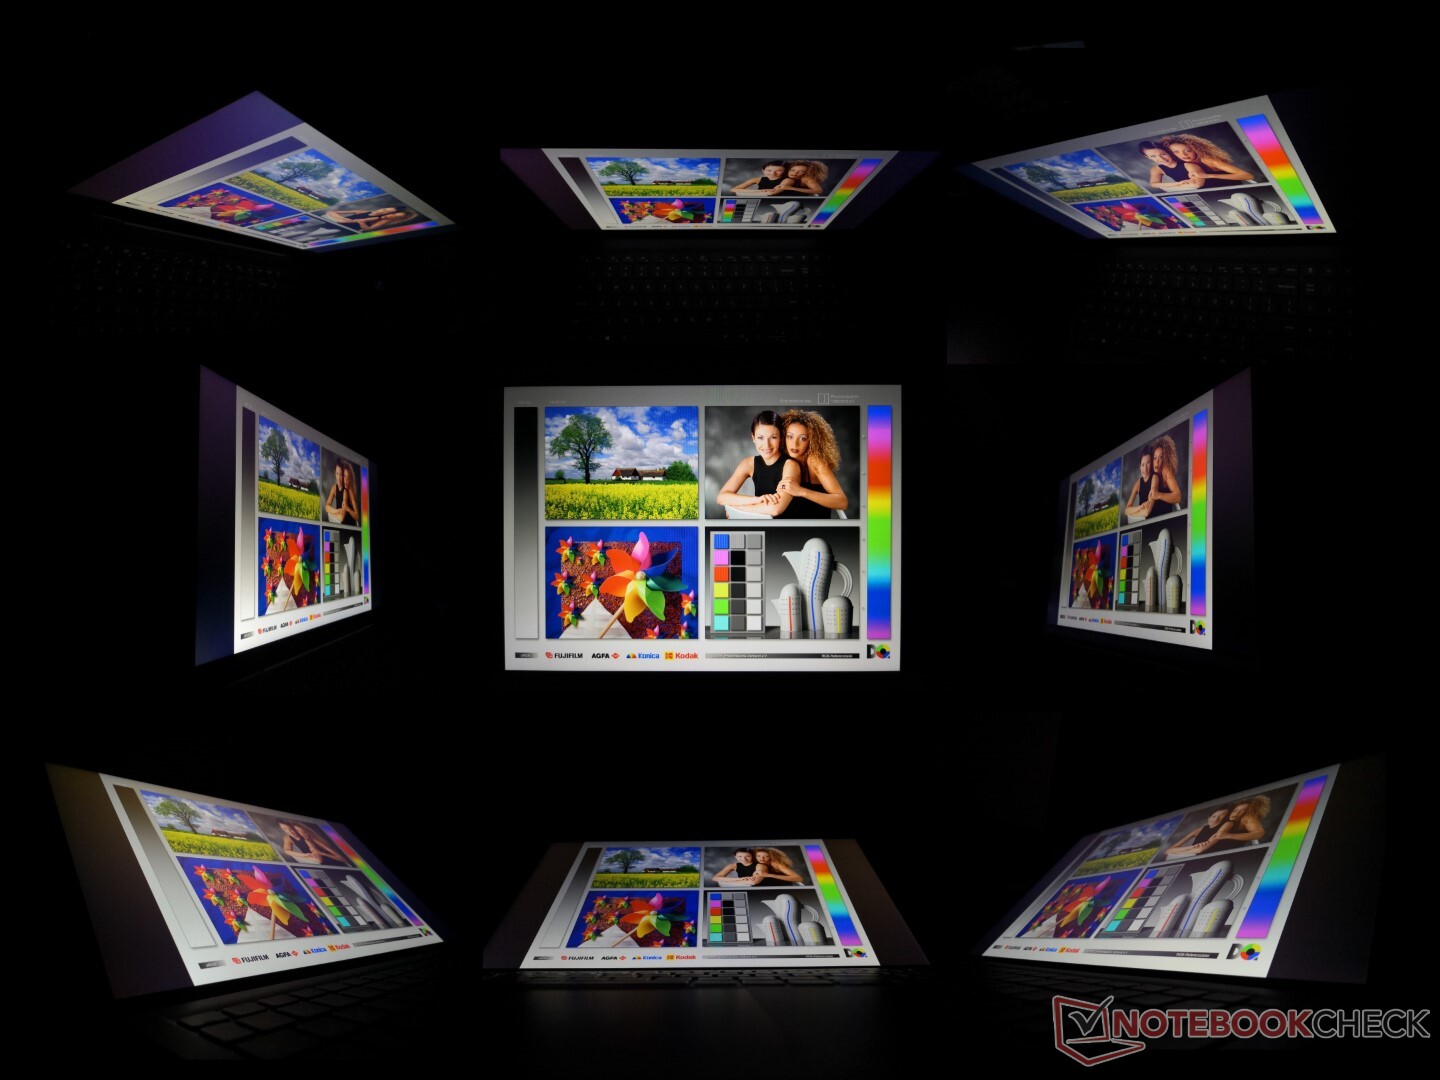
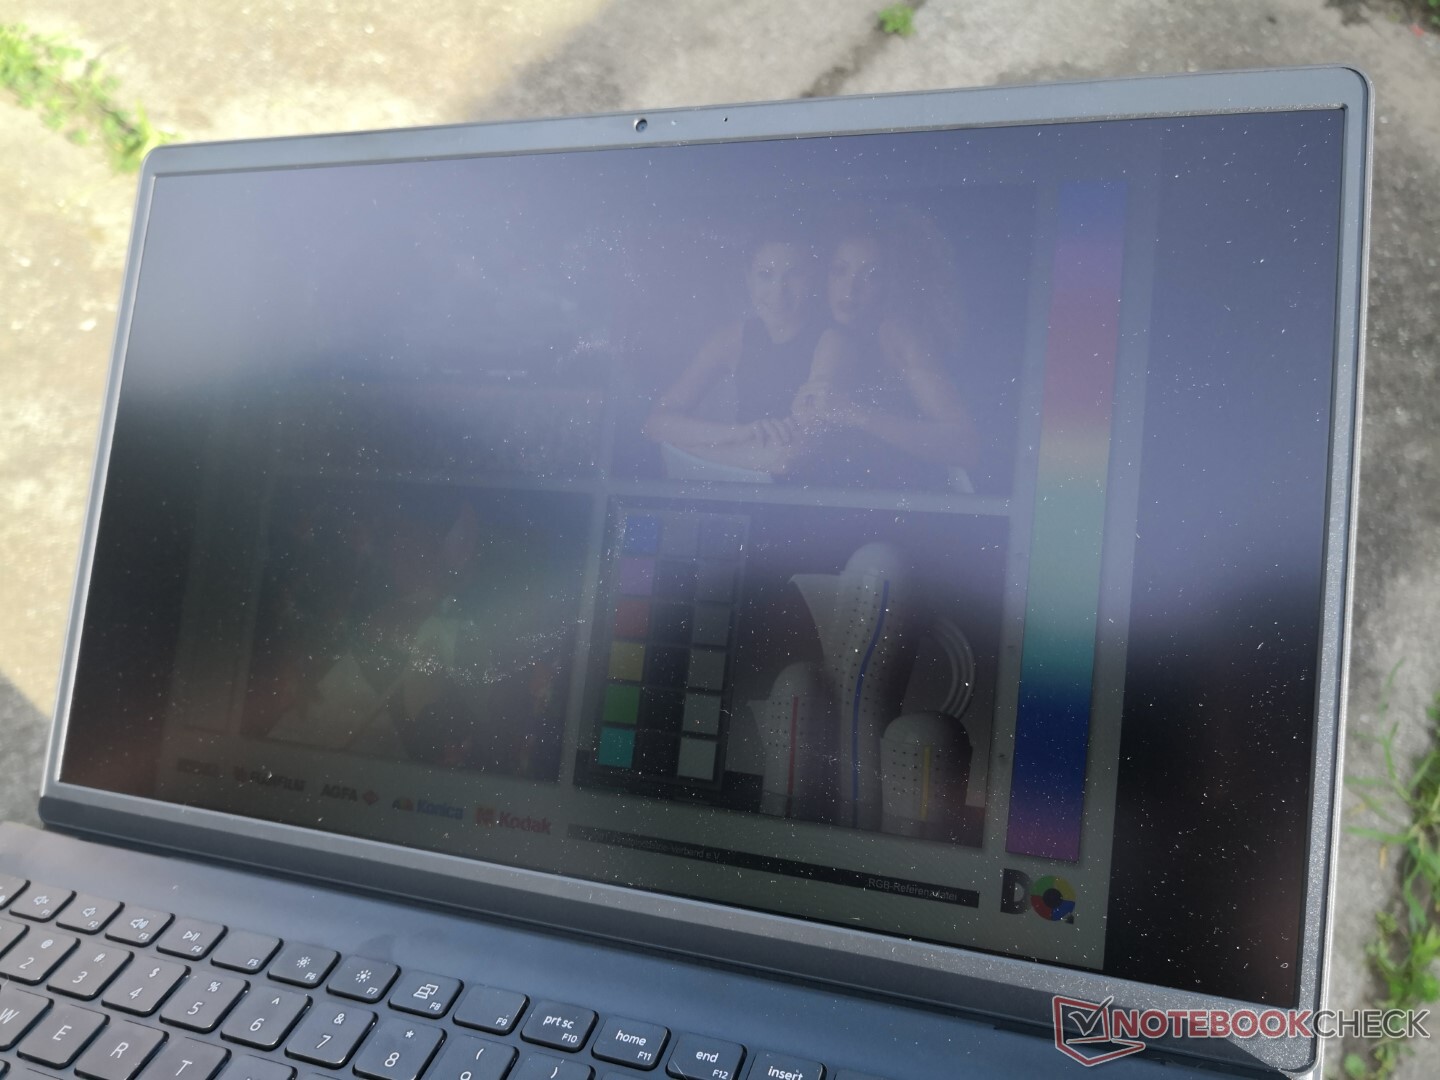
显示
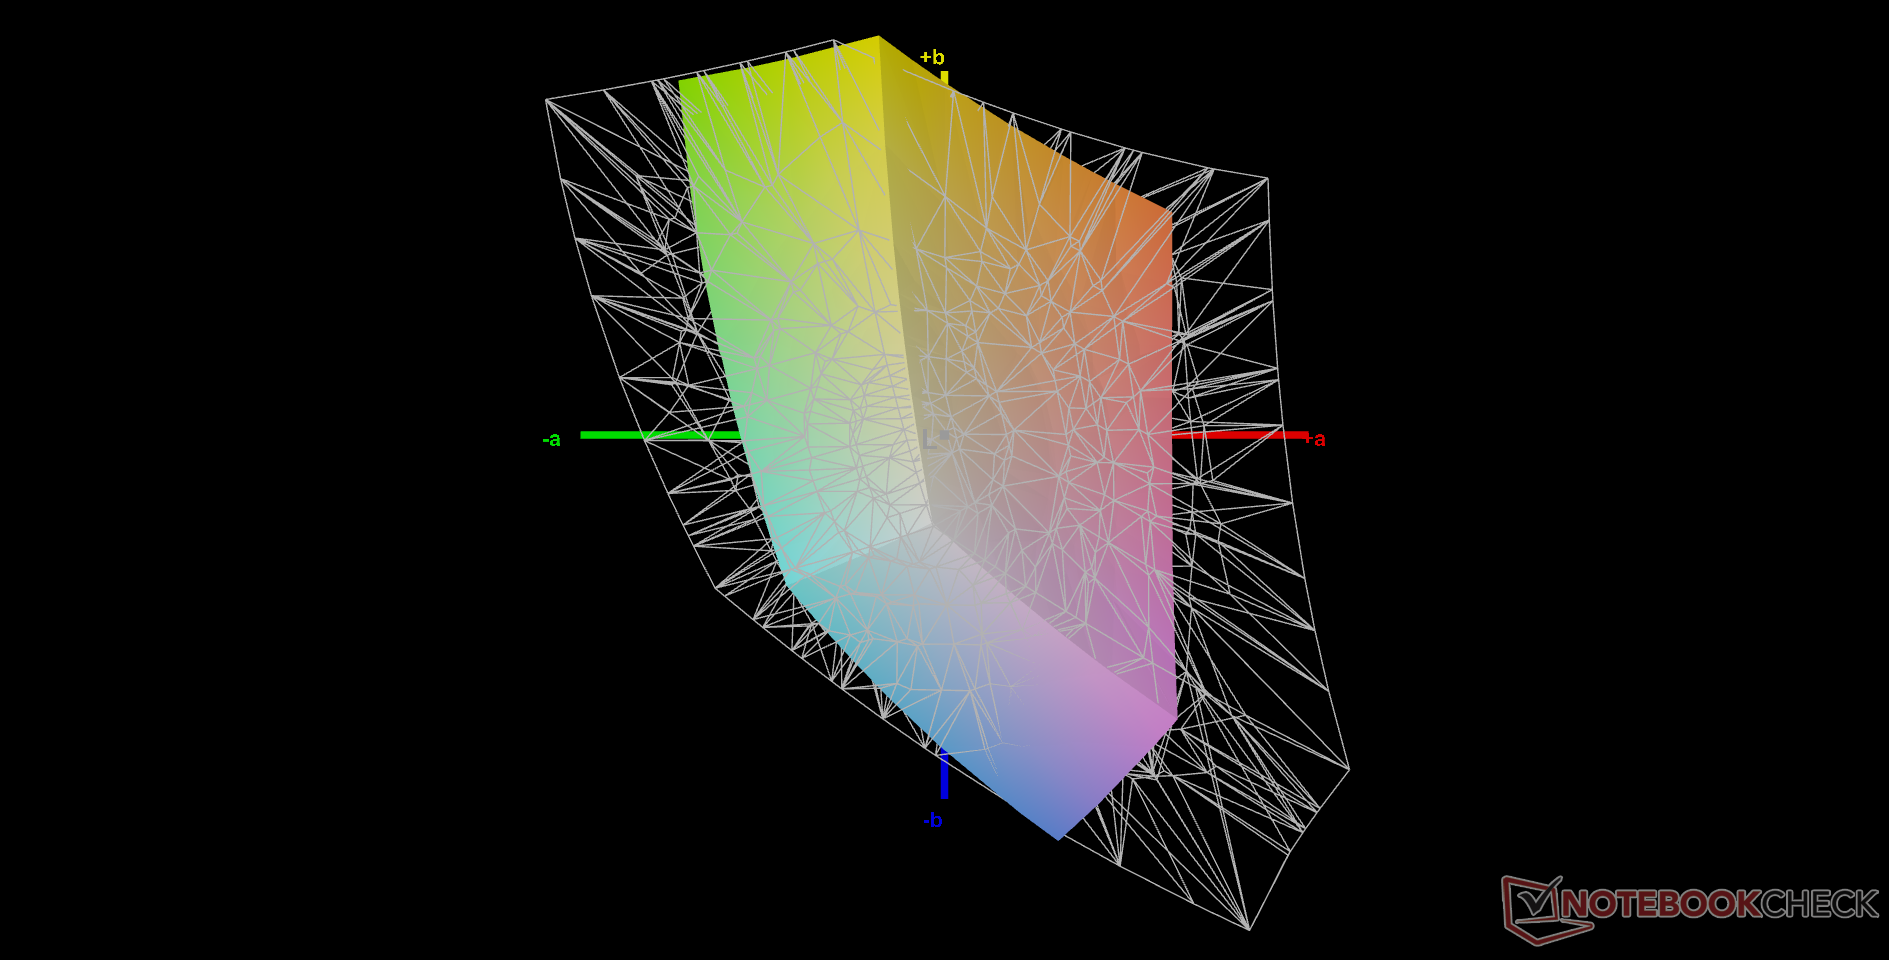
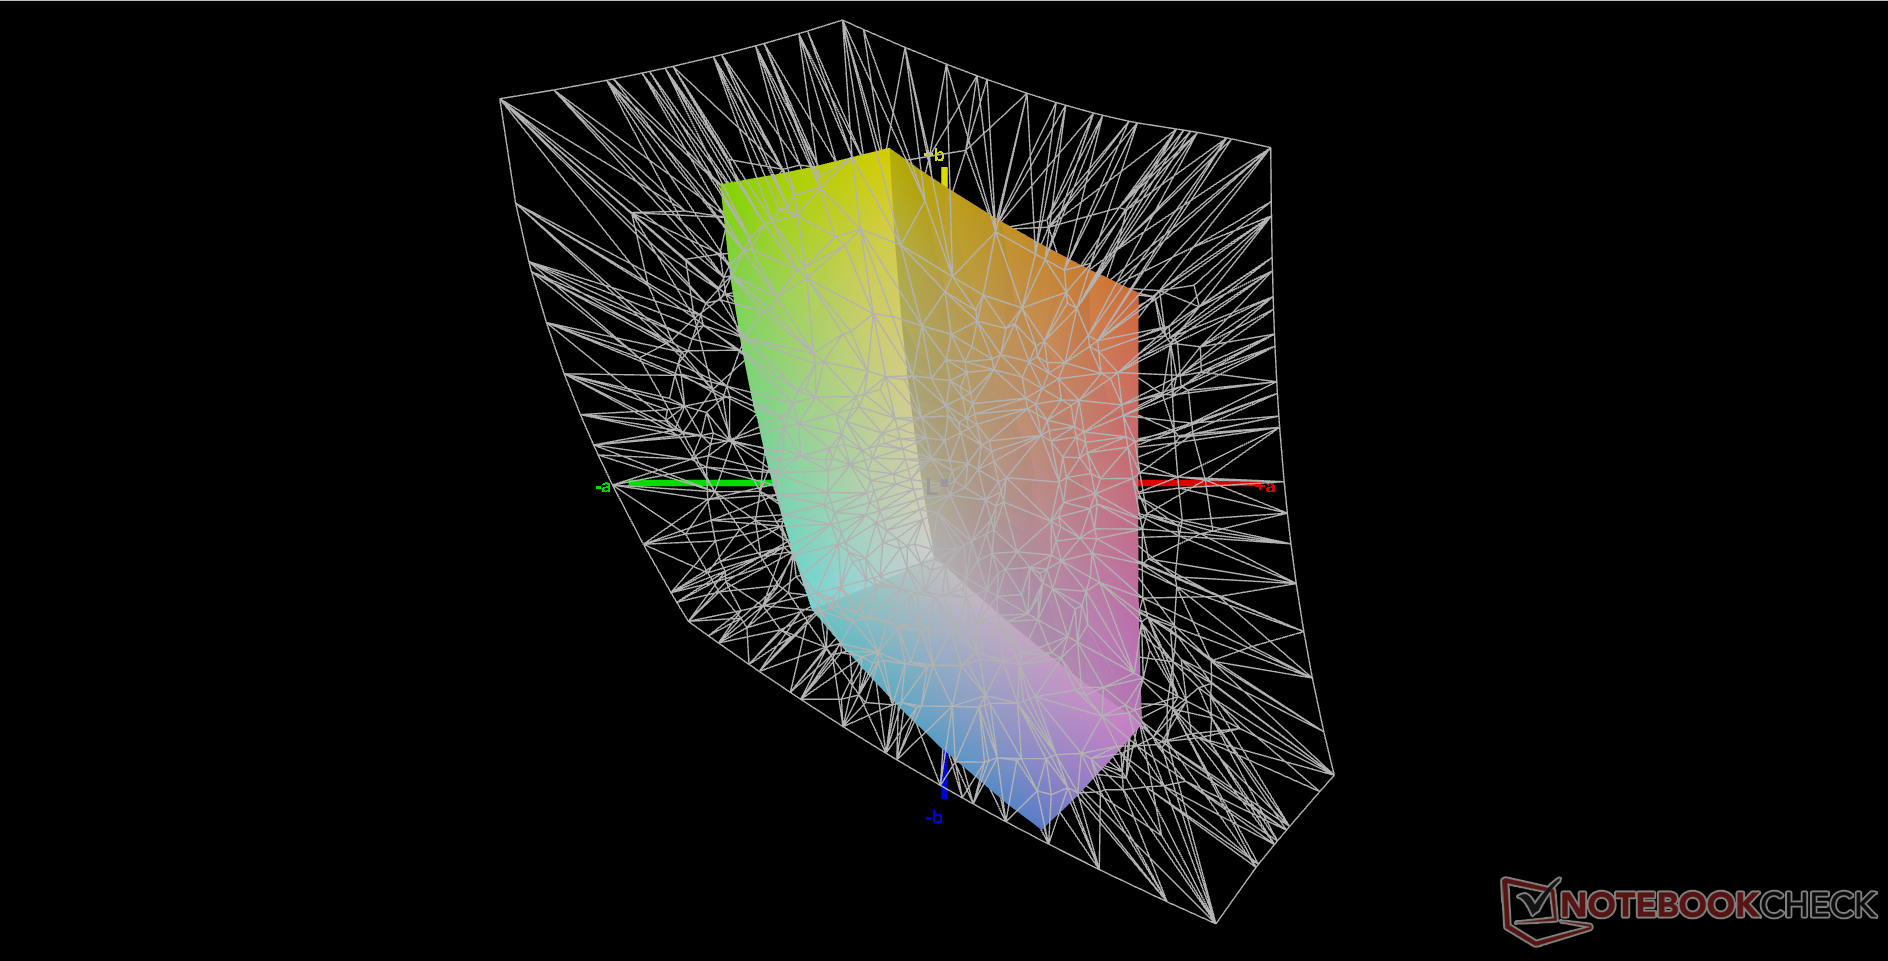
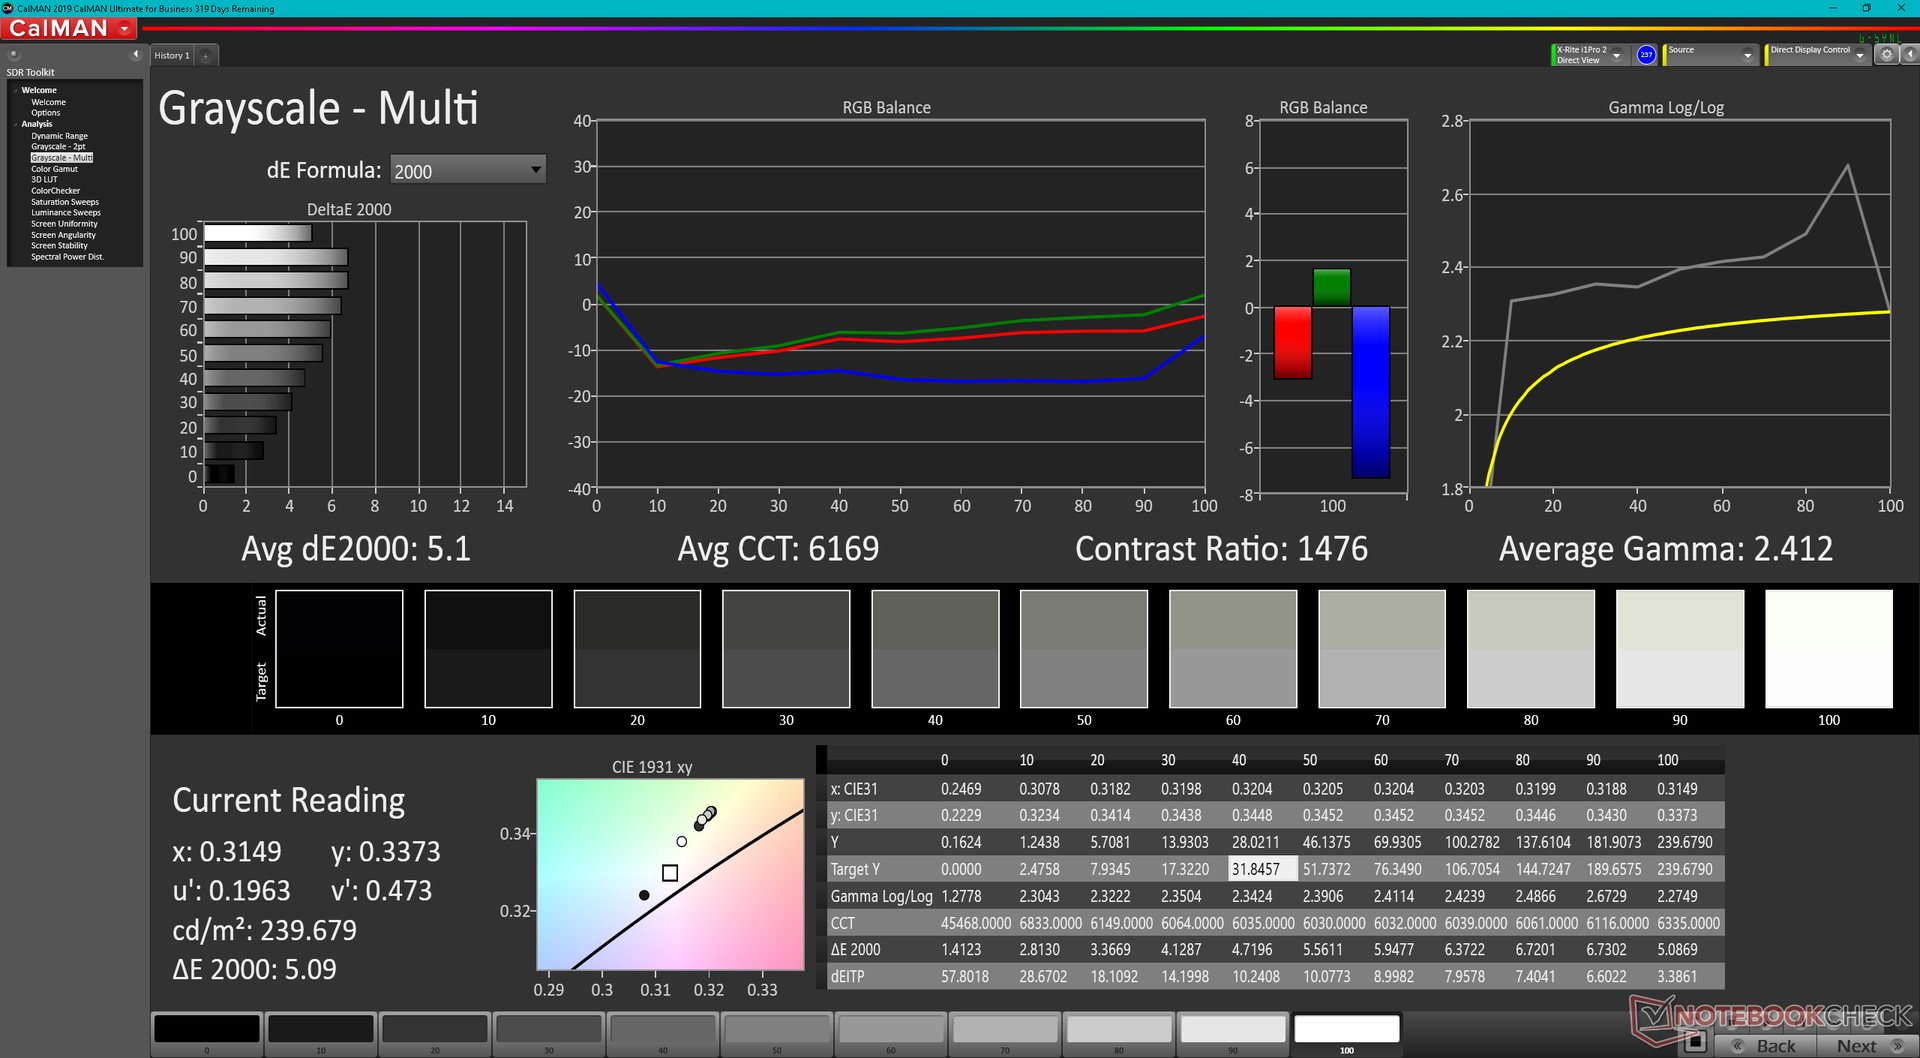
Inspiron 15 3511使用的BOE面板与老款Inspiron 15 3501上的不同(BOE NV15T06与BOE NV15N3D)。尽管如此,核心属性基本上没有变化,包括非常狭窄的色彩空间。对比度和响应时间对于经济型笔记本电脑来说实际上是相当不错的,但特别是有限的sRGB再现是最终将这款Inspiron显示器与价格较高的XPS、Spectre或ZenBook替代品区分开来的原因。颜色看起来比较浅,也没有那么鲜艳,这对大多数廉价笔记本电脑来说是正常的。


| |||||||||||||||||||||||||
Brightness Distribution: 87 %
Center on Battery: 206.8 cd/m²
Contrast: 1142:1 (Black: 0.21 cd/m²)
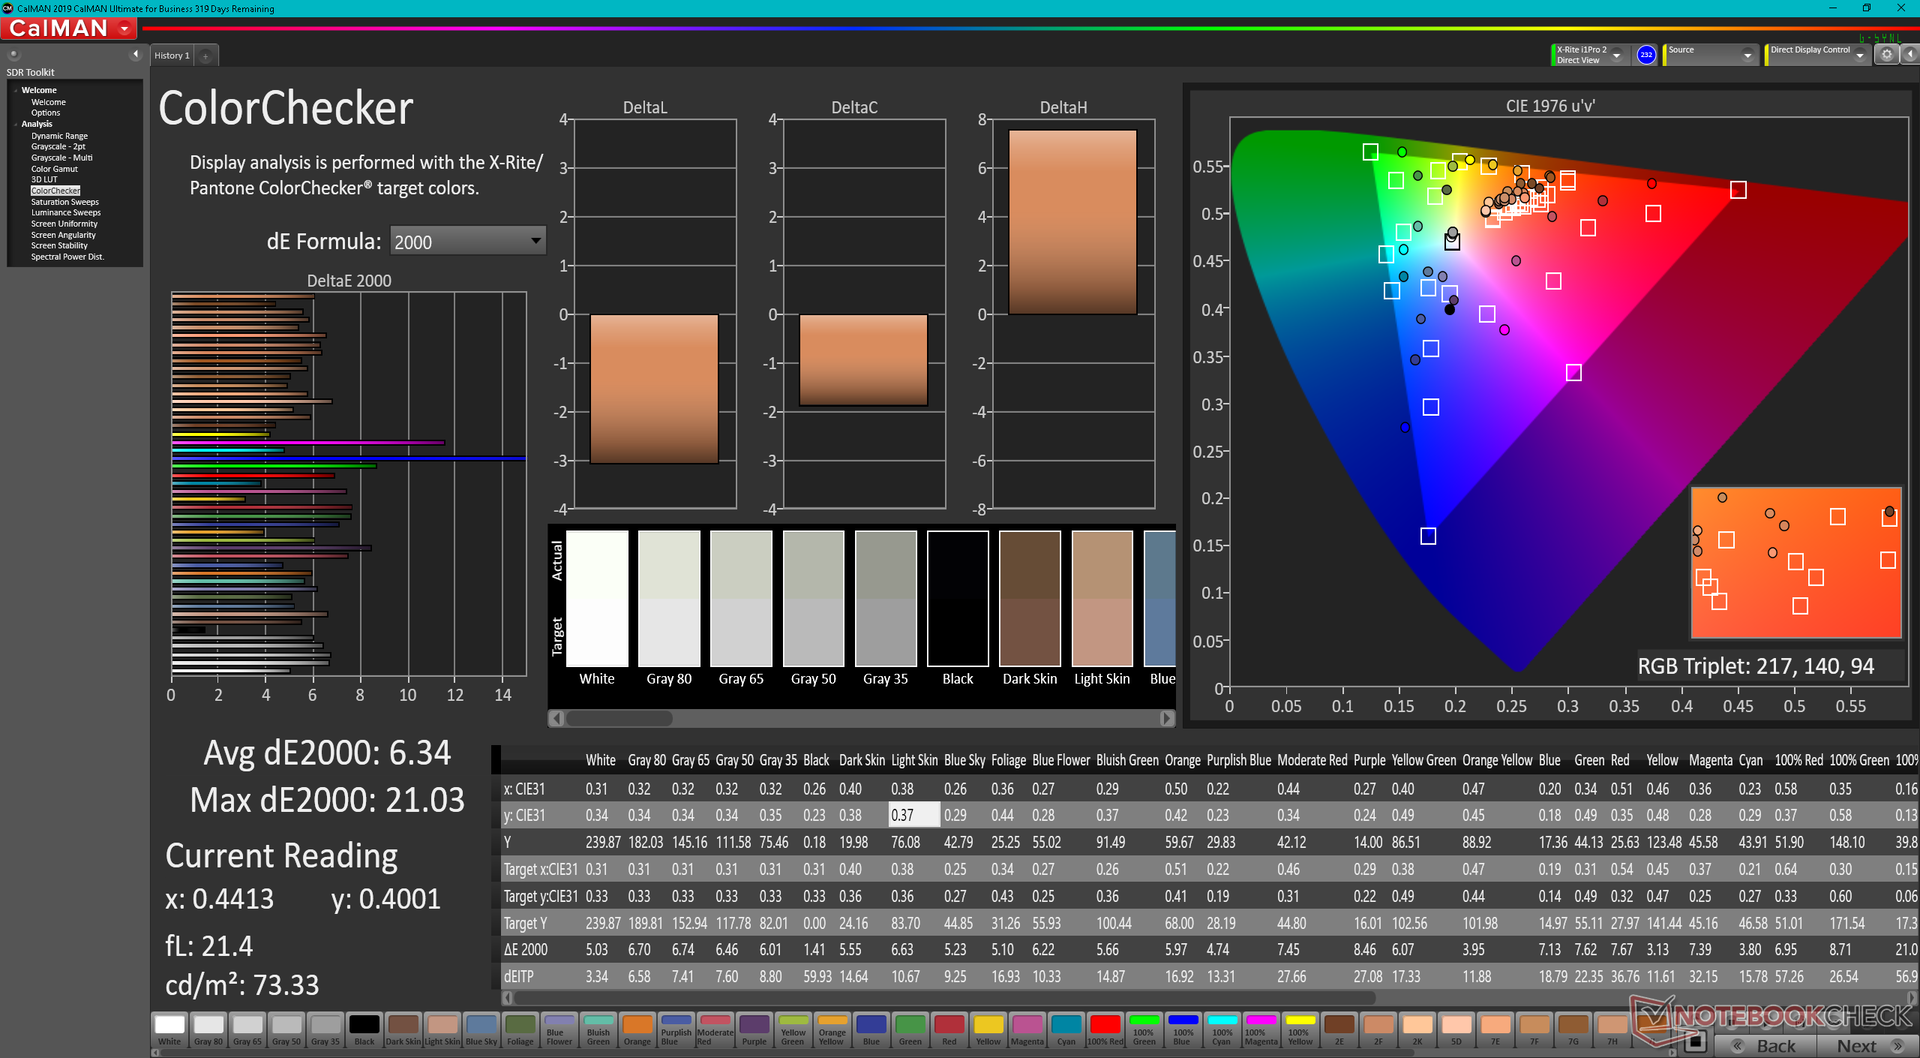
ΔE ColorChecker Calman: 6.34 | ∀{0.5-29.43 Ø4.71}
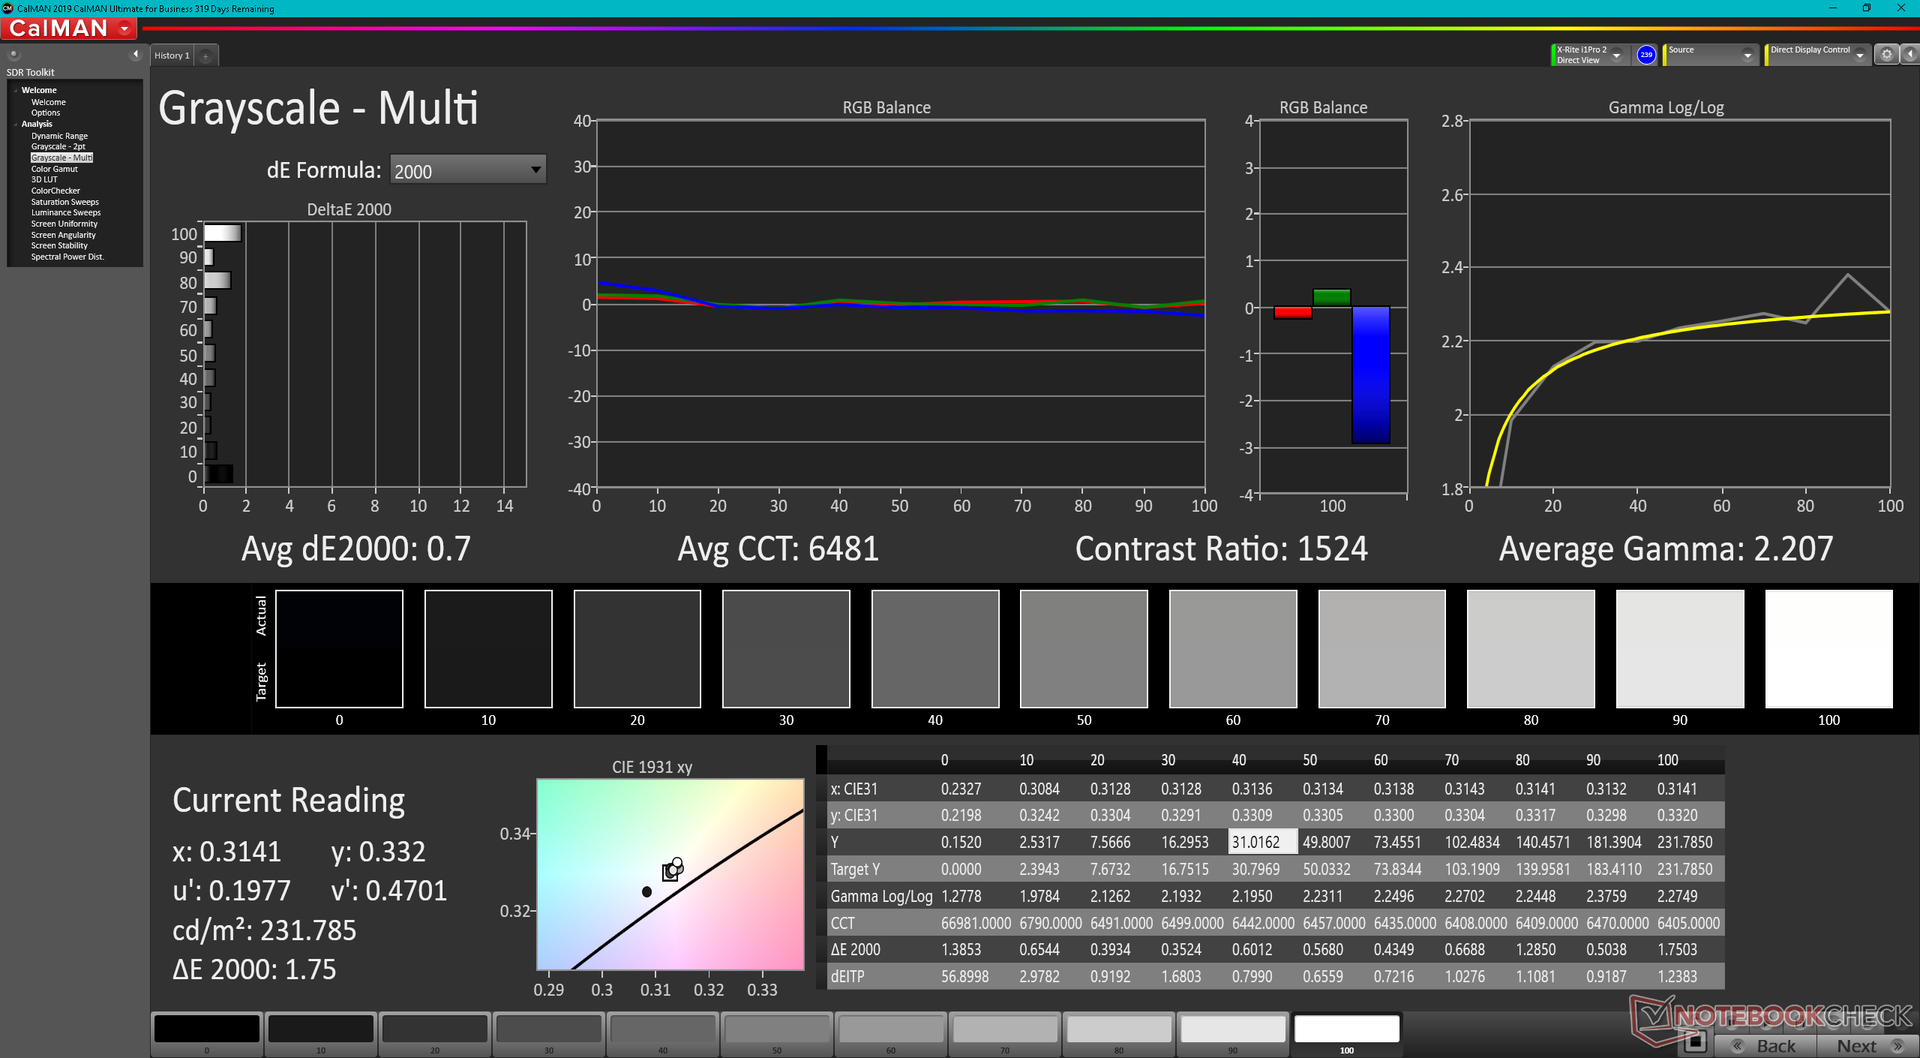
calibrated: 2.08
ΔE Greyscale Calman: 5.1 | ∀{0.09-98 Ø4.96}
41.5% AdobeRGB 1998 (Argyll 3D)
58.8% sRGB (Argyll 3D)
40.1% Display P3 (Argyll 3D)
Gamma: 2.41
CCT: 6169 K
| Dell Inspiron 15 3000 3511 BOE NV15T06, IPS, 1920x1080, 15.6" | Dell XPS 15 9510 i5 11400H FHD Sharp LQ156N1, IPS, 1920x1200, 15.6" | Asus VivoBook S15 D533UA Chi Mei N156HCA-EAB, IPS, 1920x1080, 15.6" | Dell Inspiron 15 3501 BOE NV15N3D (Dell P/N: N39X1), IPS, 1920x1080, 15.6" | Lenovo IdeaPad 3 15ALC6 BOE CQ NV156FHM-T07, IPS, 1920x1080, 15.6" | HP Pavilion 15-eg Chi Mei CMN1523, IPS, 1920x1080, 15.6" | |
|---|---|---|---|---|---|---|
| Display | 88% | 9% | -1% | -1% | 8% | |
| Display P3 Coverage (%) | 40.1 | 80.9 102% | 43.6 9% | 39.4 -2% | 40 0% | 42.9 7% |
| sRGB Coverage (%) | 58.8 | 100 70% | 65.2 11% | 58.7 0% | 57.7 -2% | 64 9% |
| AdobeRGB 1998 Coverage (%) | 41.5 | 79.1 91% | 45 8% | 40.7 -2% | 41.2 -1% | 44.4 7% |
| Response Times | -80% | 32% | -35% | 2% | 15% | |
| Response Time Grey 50% / Grey 80% * (ms) | 31.6 ? | 62.4 ? -97% | 18 ? 43% | 43 ? -36% | 24.8 ? 22% | 22.8 ? 28% |
| Response Time Black / White * (ms) | 24 ? | 38.8 ? -62% | 19 ? 21% | 32 ? -33% | 28.4 ? -18% | 23.6 ? 2% |
| PWM Frequency (Hz) | 1000 ? | 26320 ? | ||||
| Screen | 56% | -6% | 31% | 9% | 0% | |
| Brightness middle (cd/m²) | 239.9 | 632 163% | 289 20% | 271 13% | 336.4 40% | 294.3 23% |
| Brightness (cd/m²) | 230 | 606 163% | 267 16% | 263 14% | 318 38% | 251 9% |
| Brightness Distribution (%) | 87 | 91 5% | 85 -2% | 92 6% | 84 -3% | 76 -13% |
| Black Level * (cd/m²) | 0.21 | 0.29 -38% | 0.56 -167% | 0.15 29% | 0.24 -14% | 0.26 -24% |
| Contrast (:1) | 1142 | 2179 91% | 516 -55% | 1807 58% | 1402 23% | 1132 -1% |
| Colorchecker dE 2000 * | 6.34 | 3.5 45% | 3.96 38% | 4.83 24% | 6.46 -2% | 4.08 36% |
| Colorchecker dE 2000 max. * | 21.03 | 6.4 70% | 6.76 68% | 7 67% | 19.75 6% | 19.49 7% |
| Colorchecker dE 2000 calibrated * | 2.08 | 2 4% | 2.09 -0% | 3.7 -78% | ||
| Greyscale dE 2000 * | 5.1 | 5 2% | 3.43 33% | 3.36 34% | 5.6 -10% | 3 41% |
| Gamma | 2.41 91% | 2.26 97% | 2.28 96% | 2.56 86% | 2.25 98% | 2.21 100% |
| CCT | 6169 105% | 7033 92% | 7191 90% | 6764 96% | 5934 110% | 6616 98% |
| Color Space (Percent of AdobeRGB 1998) (%) | 42 | |||||
| Color Space (Percent of sRGB) (%) | 65 | |||||
| Total Average (Program / Settings) | 21% /
44% | 12% /
3% | -2% /
13% | 3% /
6% | 8% /
4% |
* ... smaller is better
色彩空间仅限于sRGB的59%,而价格较高的替代品如XPS 15的色彩空间则超过90%。 XPS 15.狭窄的色域在预算笔记本上是可以预期的,比如我们的Inspiron 15。
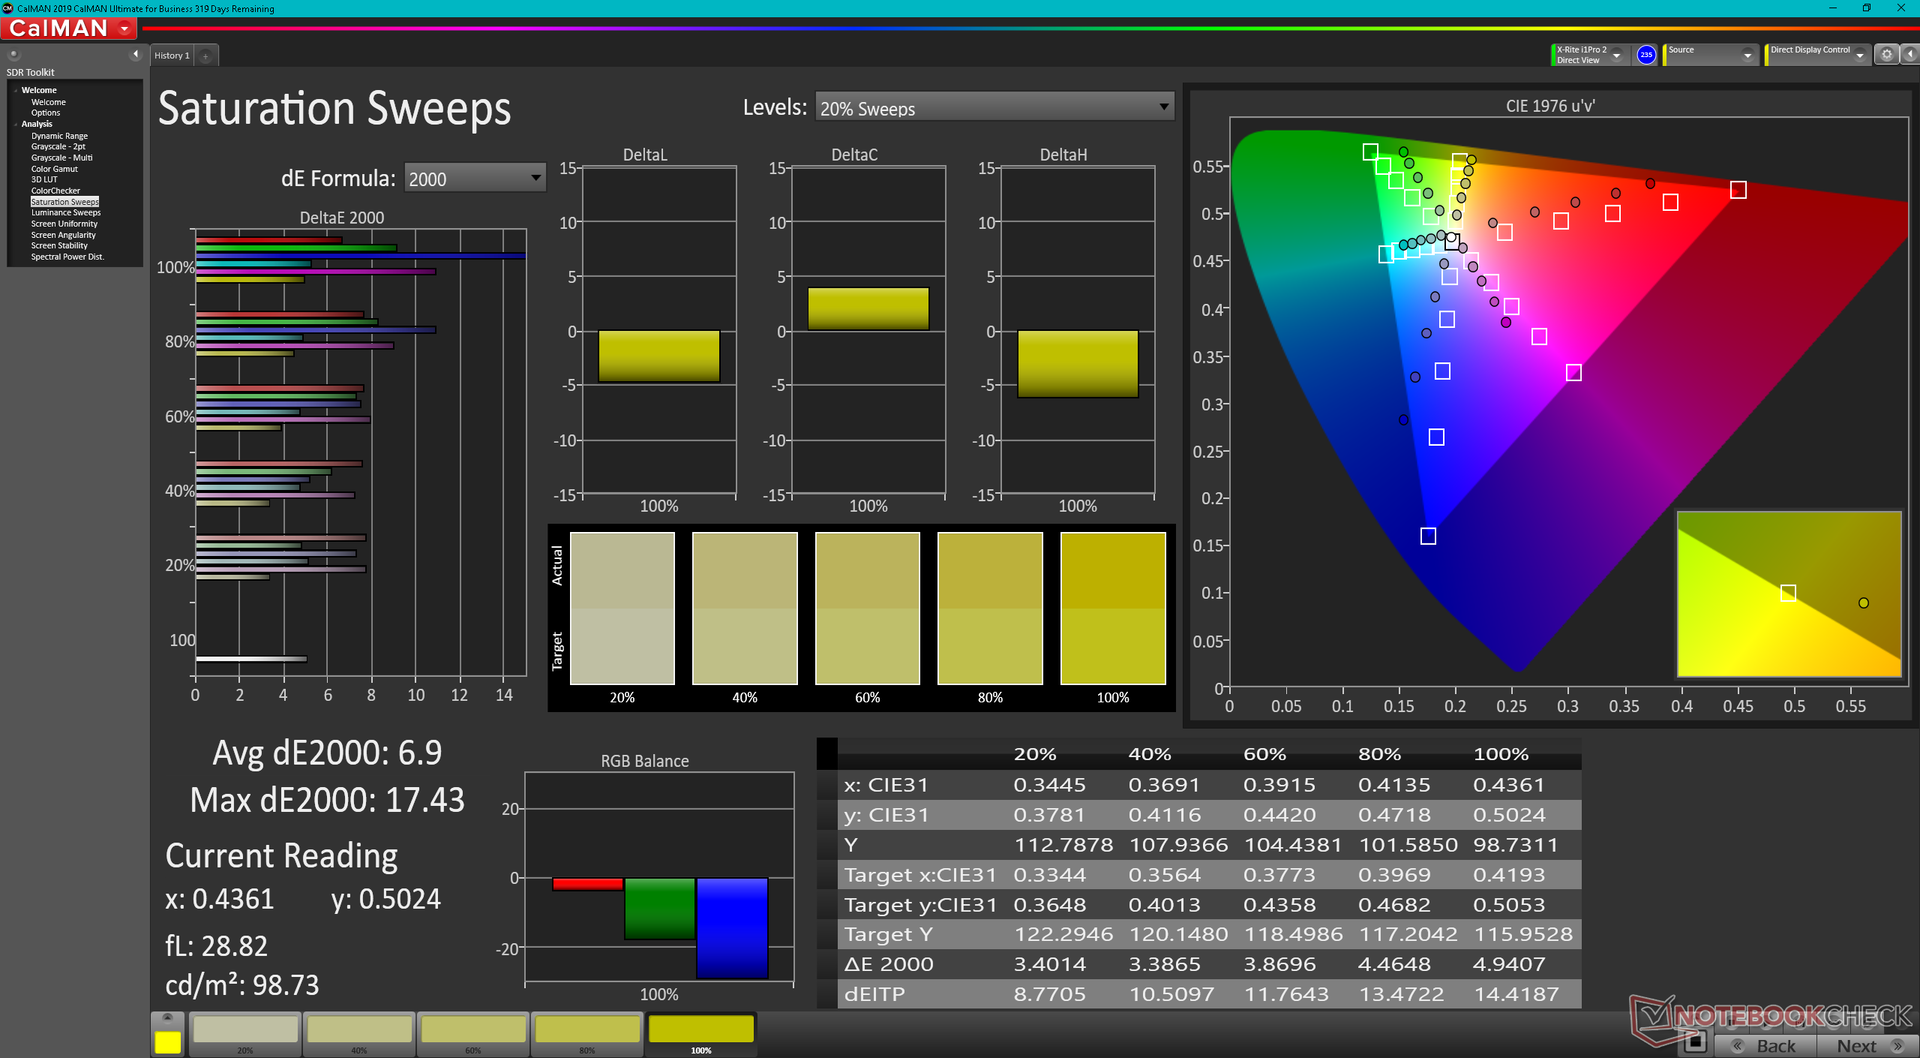
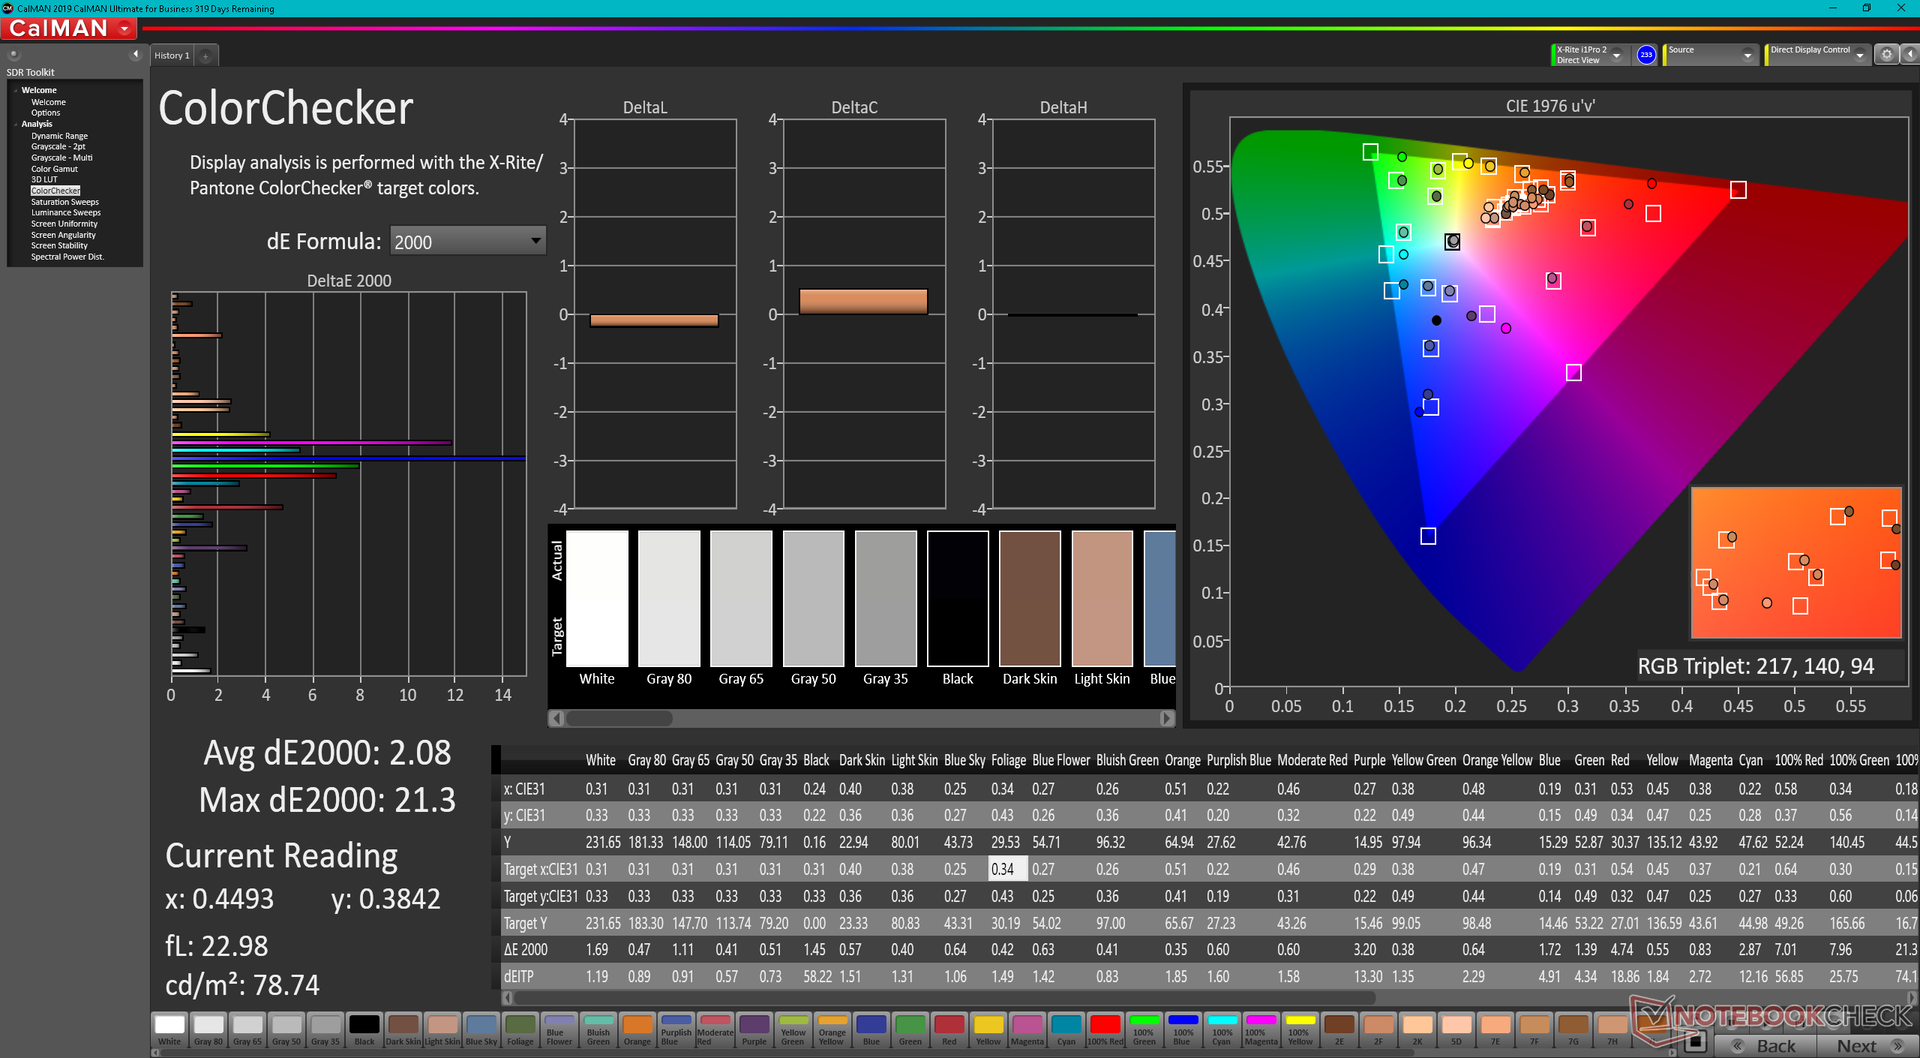
色温在开箱时略微过暖,我们的X-Rite色度计能够解决这个问题。一旦经过校准,平均灰度和彩色DeltaE值将分别从5.1和6.34降至仅0.7和2.08。尽管如此,上面提到的糟糕的色彩再现意味着DeltaE在更高的饱和度下将不可避免地大幅增加。
Display Response Times
| ↔ Response Time Black to White | ||
|---|---|---|
| 24 ms ... rise ↗ and fall ↘ combined | ↗ 14 ms rise | 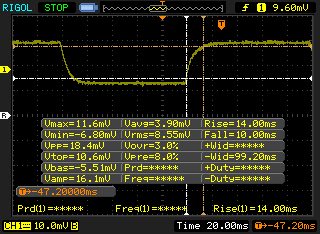 |
| ↘ 10 ms fall | ||
| The screen shows good response rates in our tests, but may be too slow for competitive gamers. In comparison, all tested devices range from 0.1 (minimum) to 240 (maximum) ms. » 54 % of all devices are better. This means that the measured response time is worse than the average of all tested devices (19.8 ms). | ||
| ↔ Response Time 50% Grey to 80% Grey | ||
| 31.6 ms ... rise ↗ and fall ↘ combined | ↗ 17.2 ms rise | 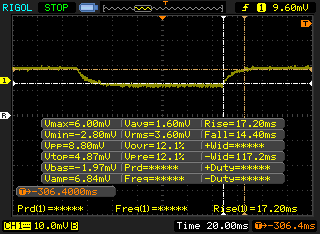 |
| ↘ 14.4 ms fall | ||
| The screen shows slow response rates in our tests and will be unsatisfactory for gamers. In comparison, all tested devices range from 0.165 (minimum) to 636 (maximum) ms. » 43 % of all devices are better. This means that the measured response time is similar to the average of all tested devices (31 ms). | ||
Screen Flickering / PWM (Pulse-Width Modulation)
| Screen flickering / PWM not detected | 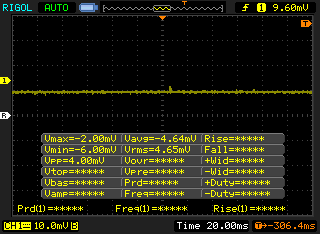 | ||
In comparison: 52 % of all tested devices do not use PWM to dim the display. If PWM was detected, an average of 7757 (minimum: 5 - maximum: 343500) Hz was measured. | |||
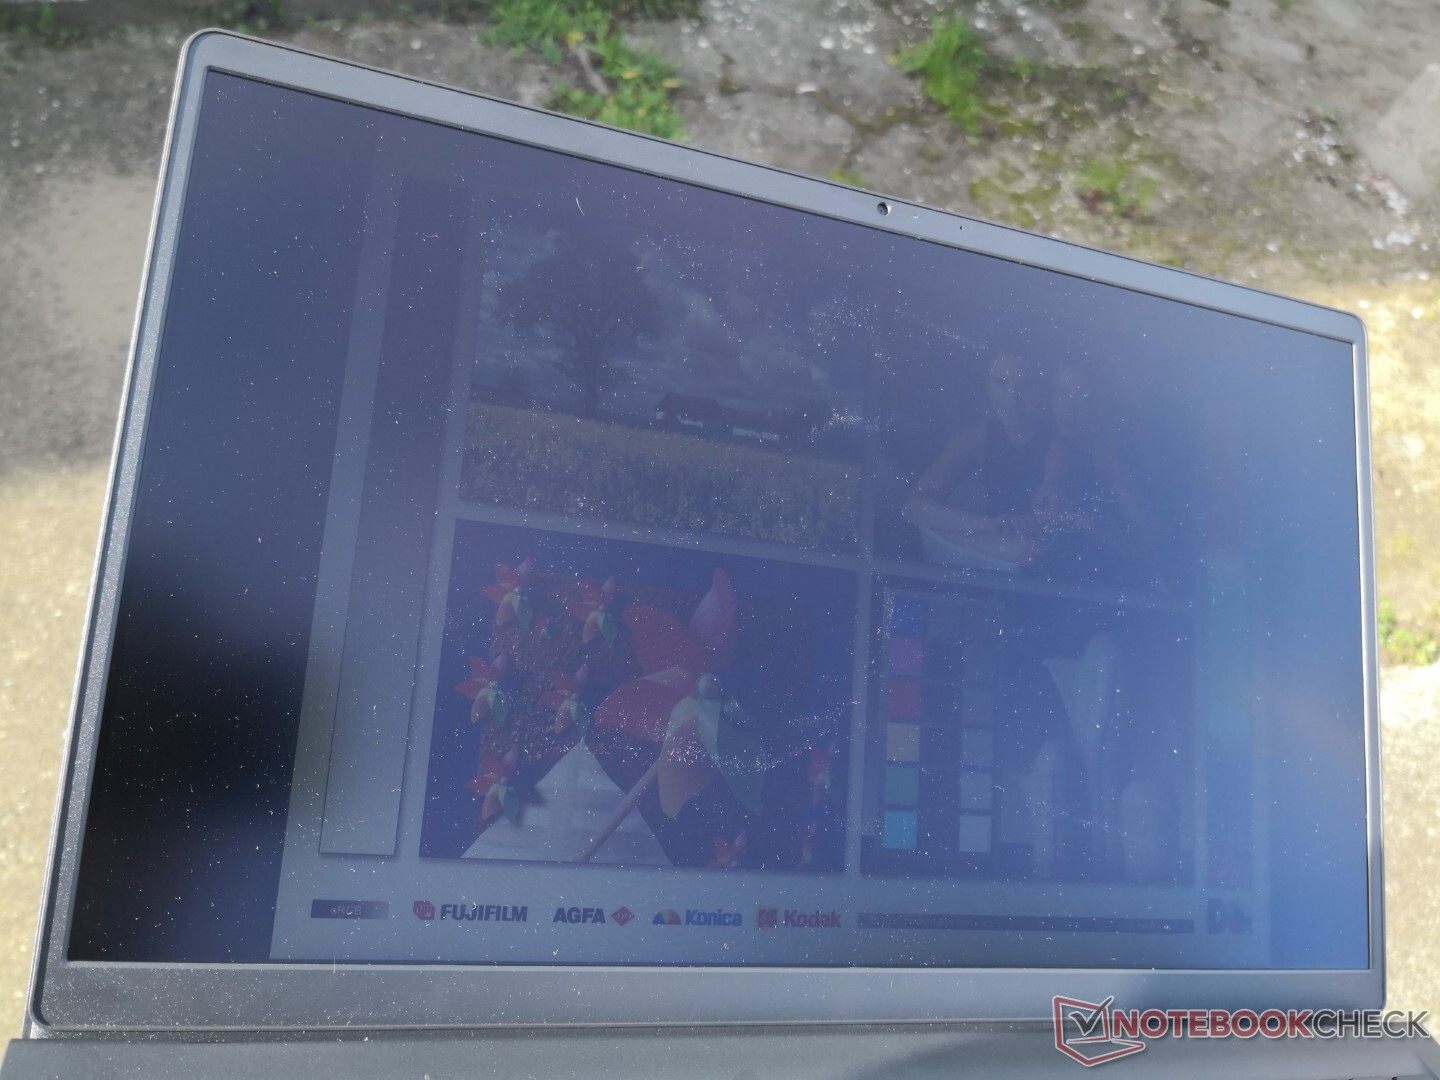
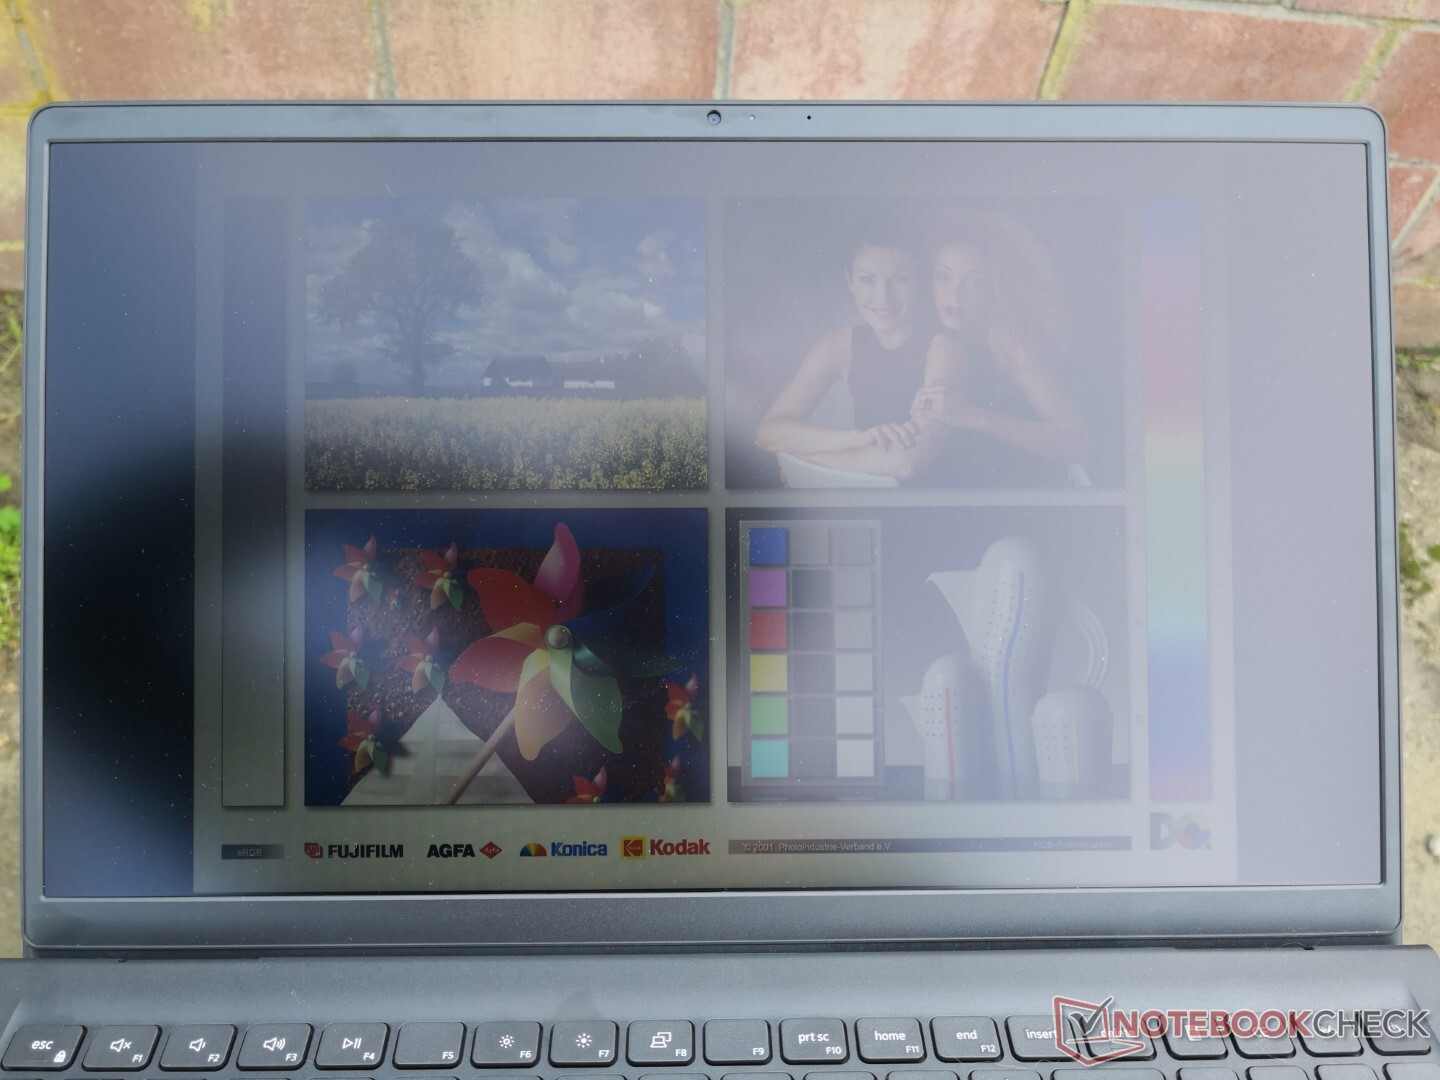
即使在树荫下工作,户外可视性也很差。在电池供电运行时,最大亮度会自动从240尼特降到只有207尼特,如果附近没有交流电插座,就会使已经很暗的显示屏更加暗淡。我们找不到负责电池自动亮度控制的戴尔、Windows或英特尔的相应设置。
业绩
测试条件
在运行以下任何性能基准测试之前,我们的设备通过Windows设置为最佳性能,以获得可能的最高分数。
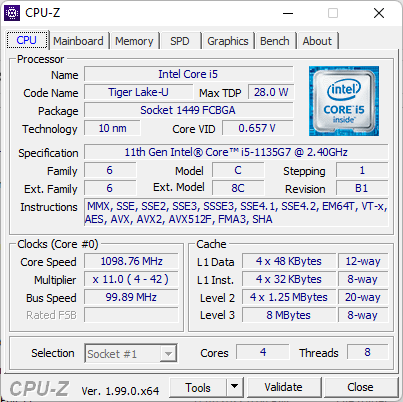
处理器
整体的CPU性能仅在我们数据库中配备相同的笔记本电脑的几个百分点之内。 酷睿i5-1135G7处理器。性能的可持续性也很好,即使最初的Turbo Boost效益与价格较高的替代品相比要小得多,如华硕ExpertBook B1 B1500CEAE或Honor MagicBook 15正如我们下面的CineBench R15 xT循环结果所示。
升级到 酷睿i7-1165G7预计只会将单线程和多线程性能分别提高5%和15%。同时,降级到 酷睿i3-1115G4选项预计会使多线程性能下降近30%。
Cinebench R15 Multi Loop
Cinebench R23: Multi Core | Single Core
Cinebench R15: CPU Multi 64Bit | CPU Single 64Bit
Blender: v2.79 BMW27 CPU
7-Zip 18.03: 7z b 4 | 7z b 4 -mmt1
Geekbench 5.5: Multi-Core | Single-Core
HWBOT x265 Benchmark v2.2: 4k Preset
LibreOffice : 20 Documents To PDF
R Benchmark 2.5: Overall mean
| Cinebench R20 / CPU (Multi Core) | |
| Asus VivoBook S15 D533UA | |
| Lenovo ThinkPad L15 G2 AMD | |
| Lenovo IdeaPad 5 15ALC05 | |
| HP ProBook 455 G7-175W8EA | |
| HP Envy x360 15-ee0257ng | |
| Samsung Galaxy Book Pro 15 NP950XDB-KC5US | |
| Average Intel Core i5-1135G7 (979 - 2382, n=62) | |
| Samsung Galaxy Book Flex 15-NP950 | |
| Dell Inspiron 15 3000 3511 | |
| Lenovo Ideapad C340-15IWL-81N5004QGE | |
| HP 250 G7-15S40ES | |
| HP Pavilion x360 15-dq0065cl | |
| Cinebench R20 / CPU (Single Core) | |
| Lenovo ThinkPad L15 G2 AMD | |
| Samsung Galaxy Book Pro 15 NP950XDB-KC5US | |
| Dell Inspiron 15 3000 3511 | |
| Average Intel Core i5-1135G7 (375 - 527, n=62) | |
| Asus VivoBook S15 D533UA | |
| HP ProBook 455 G7-175W8EA | |
| Samsung Galaxy Book Flex 15-NP950 | |
| Lenovo IdeaPad 5 15ALC05 | |
| HP Envy x360 15-ee0257ng | |
| HP 250 G7-15S40ES | |
| HP Pavilion x360 15-dq0065cl | |
| Lenovo Ideapad C340-15IWL-81N5004QGE | |
| Cinebench R23 / Multi Core | |
| Asus VivoBook S15 D533UA | |
| Lenovo ThinkPad L15 G2 AMD | |
| Lenovo IdeaPad 5 15ALC05 | |
| Samsung Galaxy Book Pro 15 NP950XDB-KC5US | |
| Average Intel Core i5-1135G7 (2786 - 6136, n=55) | |
| Dell Inspiron 15 3000 3511 | |
| Cinebench R23 / Single Core | |
| Samsung Galaxy Book Pro 15 NP950XDB-KC5US | |
| Lenovo ThinkPad L15 G2 AMD | |
| Dell Inspiron 15 3000 3511 | |
| Average Intel Core i5-1135G7 (1062 - 1373, n=53) | |
| Asus VivoBook S15 D533UA | |
| Lenovo IdeaPad 5 15ALC05 | |
| Cinebench R15 / CPU Multi 64Bit | |
| Asus VivoBook S15 D533UA | |
| Lenovo ThinkPad L15 G2 AMD | |
| Lenovo IdeaPad 5 15ALC05 | |
| HP ProBook 455 G7-175W8EA | |
| HP Envy x360 15-ee0257ng | |
| Average Intel Core i5-1135G7 (431 - 941, n=65) | |
| Samsung Galaxy Book Pro 15 NP950XDB-KC5US | |
| Samsung Galaxy Book Flex 15-NP950 | |
| Lenovo Ideapad C340-15IWL-81N5004QGE | |
| Dell Inspiron 15 3000 3511 | |
| HP 250 G7-15S40ES | |
| HP Pavilion x360 15-dq0065cl | |
| Cinebench R15 / CPU Single 64Bit | |
| Lenovo ThinkPad L15 G2 AMD | |
| Average Intel Core i5-1135G7 (141.4 - 205, n=61) | |
| Asus VivoBook S15 D533UA | |
| Dell Inspiron 15 3000 3511 | |
| HP ProBook 455 G7-175W8EA | |
| Samsung Galaxy Book Pro 15 NP950XDB-KC5US | |
| Lenovo IdeaPad 5 15ALC05 | |
| Samsung Galaxy Book Flex 15-NP950 | |
| HP Envy x360 15-ee0257ng | |
| HP Pavilion x360 15-dq0065cl | |
| HP 250 G7-15S40ES | |
| Lenovo Ideapad C340-15IWL-81N5004QGE | |
| Blender / v2.79 BMW27 CPU | |
| HP 250 G7-15S40ES | |
| HP Envy x360 15-ee0257ng | |
| Samsung Galaxy Book Flex 15-NP950 | |
| Dell Inspiron 15 3000 3511 | |
| Average Intel Core i5-1135G7 (499 - 1044, n=60) | |
| Samsung Galaxy Book Pro 15 NP950XDB-KC5US | |
| HP ProBook 455 G7-175W8EA | |
| Lenovo IdeaPad 5 15ALC05 | |
| Lenovo ThinkPad L15 G2 AMD | |
| Asus VivoBook S15 D533UA | |
| 7-Zip 18.03 / 7z b 4 | |
| Asus VivoBook S15 D533UA | |
| Lenovo ThinkPad L15 G2 AMD | |
| Lenovo IdeaPad 5 15ALC05 | |
| HP ProBook 455 G7-175W8EA | |
| HP Envy x360 15-ee0257ng | |
| Samsung Galaxy Book Pro 15 NP950XDB-KC5US | |
| Samsung Galaxy Book Flex 15-NP950 | |
| Average Intel Core i5-1135G7 (14745 - 24873, n=62) | |
| Dell Inspiron 15 3000 3511 | |
| HP 250 G7-15S40ES | |
| 7-Zip 18.03 / 7z b 4 -mmt1 | |
| Lenovo ThinkPad L15 G2 AMD | |
| Samsung Galaxy Book Pro 15 NP950XDB-KC5US | |
| Average Intel Core i5-1135G7 (3924 - 4921, n=62) | |
| Asus VivoBook S15 D533UA | |
| Dell Inspiron 15 3000 3511 | |
| Samsung Galaxy Book Flex 15-NP950 | |
| HP Envy x360 15-ee0257ng | |
| Lenovo IdeaPad 5 15ALC05 | |
| HP 250 G7-15S40ES | |
| HP ProBook 455 G7-175W8EA | |
| Geekbench 5.5 / Multi-Core | |
| Asus VivoBook S15 D533UA | |
| Samsung Galaxy Book Pro 15 NP950XDB-KC5US | |
| Lenovo IdeaPad 5 15ALC05 | |
| HP Envy x360 15-ee0257ng | |
| Lenovo ThinkPad L15 G2 AMD | |
| HP ProBook 455 G7-175W8EA | |
| Samsung Galaxy Book Flex 15-NP950 | |
| Average Intel Core i5-1135G7 (3475 - 5472, n=58) | |
| Dell Inspiron 15 3000 3511 | |
| HP 250 G7-15S40ES | |
| Geekbench 5.5 / Single-Core | |
| Samsung Galaxy Book Pro 15 NP950XDB-KC5US | |
| Average Intel Core i5-1135G7 (1147 - 1428, n=58) | |
| Lenovo ThinkPad L15 G2 AMD | |
| Samsung Galaxy Book Flex 15-NP950 | |
| Asus VivoBook S15 D533UA | |
| HP 250 G7-15S40ES | |
| Dell Inspiron 15 3000 3511 | |
| Lenovo IdeaPad 5 15ALC05 | |
| HP ProBook 455 G7-175W8EA | |
| HP Envy x360 15-ee0257ng | |
| HWBOT x265 Benchmark v2.2 / 4k Preset | |
| Asus VivoBook S15 D533UA | |
| Lenovo ThinkPad L15 G2 AMD | |
| Lenovo IdeaPad 5 15ALC05 | |
| HP ProBook 455 G7-175W8EA | |
| Samsung Galaxy Book Pro 15 NP950XDB-KC5US | |
| Average Intel Core i5-1135G7 (3.57 - 7.6, n=57) | |
| Samsung Galaxy Book Flex 15-NP950 | |
| HP Envy x360 15-ee0257ng | |
| Dell Inspiron 15 3000 3511 | |
| HP 250 G7-15S40ES | |
| LibreOffice / 20 Documents To PDF | |
| HP ProBook 455 G7-175W8EA | |
| HP Envy x360 15-ee0257ng | |
| Lenovo IdeaPad 5 15ALC05 | |
| Dell Inspiron 15 3000 3511 | |
| HP 250 G7-15S40ES | |
| Samsung Galaxy Book Flex 15-NP950 | |
| Asus VivoBook S15 D533UA | |
| Samsung Galaxy Book Pro 15 NP950XDB-KC5US | |
| Average Intel Core i5-1135G7 (44.2 - 62.9, n=60) | |
| Lenovo ThinkPad L15 G2 AMD | |
| R Benchmark 2.5 / Overall mean | |
| HP 250 G7-15S40ES | |
| Samsung Galaxy Book Flex 15-NP950 | |
| Dell Inspiron 15 3000 3511 | |
| HP ProBook 455 G7-175W8EA | |
| Average Intel Core i5-1135G7 (0.619 - 0.727, n=59) | |
| Lenovo IdeaPad 5 15ALC05 | |
| HP Envy x360 15-ee0257ng | |
| Samsung Galaxy Book Pro 15 NP950XDB-KC5US | |
| Asus VivoBook S15 D533UA | |
| Lenovo ThinkPad L15 G2 AMD | |
* ... smaller is better
AIDA64: FP32 Ray-Trace | FPU Julia | CPU SHA3 | CPU Queen | FPU SinJulia | FPU Mandel | CPU AES | CPU ZLib | FP64 Ray-Trace | CPU PhotoWorxx
| Performance rating | |
| Asus VivoBook S15 D533UA | |
| HP Pavilion 15-eg | |
| Average Intel Core i5-1135G7 | |
| Lenovo IdeaPad 3 15ALC6 | |
| Dell Inspiron 15 3501 | |
| Dell Inspiron 15 3000 3511 | |
| Dell XPS 15 9510 i5 11400H FHD -9! | |
| AIDA64 / FP32 Ray-Trace | |
| Asus VivoBook S15 D533UA | |
| Lenovo IdeaPad 3 15ALC6 | |
| Average Intel Core i5-1135G7 (4313 - 7952, n=45) | |
| HP Pavilion 15-eg | |
| Dell Inspiron 15 3501 | |
| Dell Inspiron 15 3000 3511 | |
| AIDA64 / FPU Julia | |
| Asus VivoBook S15 D533UA | |
| Lenovo IdeaPad 3 15ALC6 | |
| HP Pavilion 15-eg | |
| Average Intel Core i5-1135G7 (19402 - 32283, n=45) | |
| Dell Inspiron 15 3501 | |
| Dell Inspiron 15 3000 3511 | |
| AIDA64 / CPU SHA3 | |
| Asus VivoBook S15 D533UA | |
| HP Pavilion 15-eg | |
| Average Intel Core i5-1135G7 (1316 - 2172, n=45) | |
| Dell Inspiron 15 3000 3511 | |
| Dell Inspiron 15 3501 | |
| Lenovo IdeaPad 3 15ALC6 | |
| AIDA64 / CPU Queen | |
| Asus VivoBook S15 D533UA | |
| Lenovo IdeaPad 3 15ALC6 | |
| HP Pavilion 15-eg | |
| Dell Inspiron 15 3501 | |
| Dell Inspiron 15 3000 3511 | |
| Average Intel Core i5-1135G7 (39000 - 46951, n=45) | |
| AIDA64 / FPU SinJulia | |
| Asus VivoBook S15 D533UA | |
| Lenovo IdeaPad 3 15ALC6 | |
| HP Pavilion 15-eg | |
| Dell Inspiron 15 3501 | |
| Average Intel Core i5-1135G7 (3497 - 4445, n=45) | |
| Dell Inspiron 15 3000 3511 | |
| AIDA64 / FPU Mandel | |
| Asus VivoBook S15 D533UA | |
| Lenovo IdeaPad 3 15ALC6 | |
| HP Pavilion 15-eg | |
| Average Intel Core i5-1135G7 (12569 - 19635, n=45) | |
| Dell Inspiron 15 3501 | |
| Dell Inspiron 15 3000 3511 | |
| AIDA64 / CPU AES | |
| HP Pavilion 15-eg | |
| Dell Inspiron 15 3501 | |
| Asus VivoBook S15 D533UA | |
| Dell Inspiron 15 3000 3511 | |
| Average Intel Core i5-1135G7 (28988 - 67977, n=45) | |
| Lenovo IdeaPad 3 15ALC6 | |
| AIDA64 / CPU ZLib | |
| Asus VivoBook S15 D533UA | |
| Lenovo IdeaPad 3 15ALC6 | |
| Dell Inspiron 15 3000 3511 | |
| Dell Inspiron 15 3501 | |
| HP Pavilion 15-eg | |
| Average Intel Core i5-1135G7 (265 - 373, n=51) | |
| Dell XPS 15 9510 i5 11400H FHD | |
| AIDA64 / FP64 Ray-Trace | |
| Asus VivoBook S15 D533UA | |
| Lenovo IdeaPad 3 15ALC6 | |
| Dell Inspiron 15 3501 | |
| HP Pavilion 15-eg | |
| Average Intel Core i5-1135G7 (2226 - 4291, n=45) | |
| Dell Inspiron 15 3000 3511 | |
| AIDA64 / CPU PhotoWorxx | |
| HP Pavilion 15-eg | |
| Average Intel Core i5-1135G7 (9004 - 45366, n=45) | |
| Lenovo IdeaPad 3 15ALC6 | |
| Dell Inspiron 15 3501 | |
| Asus VivoBook S15 D533UA | |
| Dell Inspiron 15 3000 3511 | |
系统性能
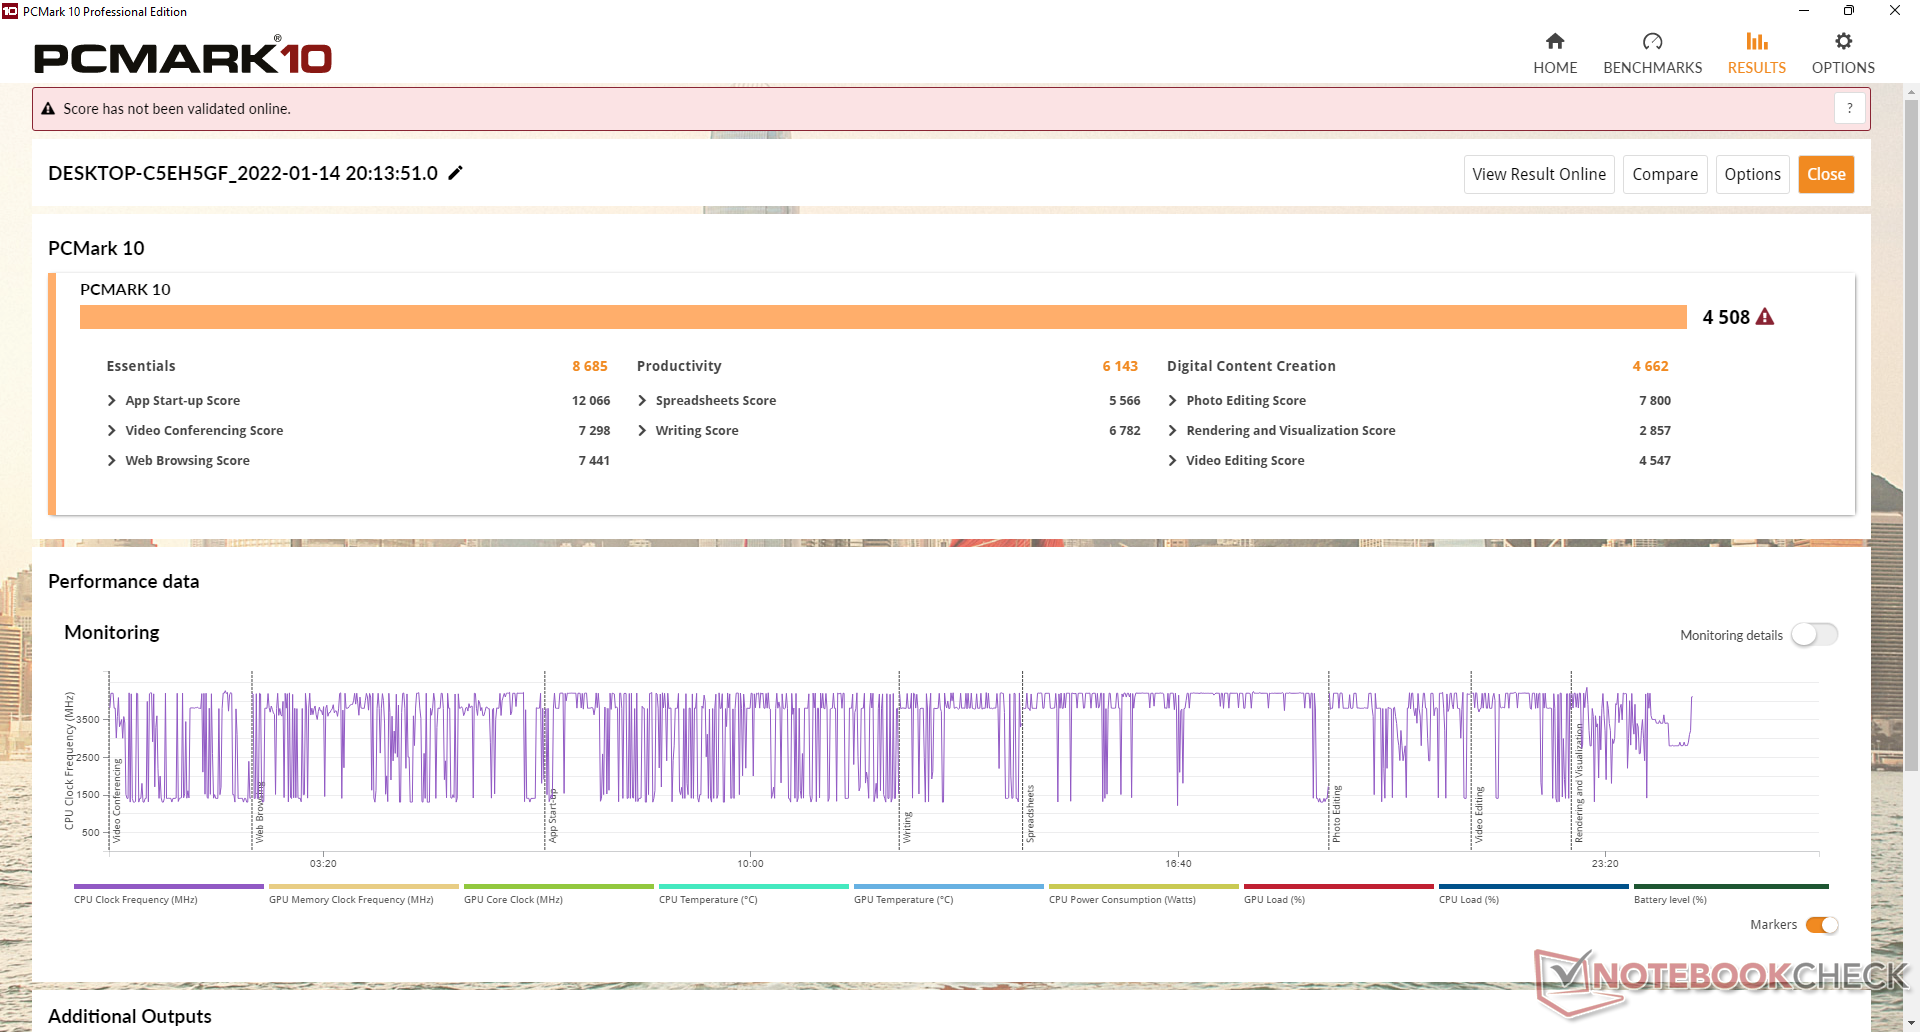
尽管下面提到的GPU结果令人失望,但PCMark的结果是我们期望的,相对于其他具有相同处理器和显卡的笔记本电脑。因此,对于要求不高的日常办公类工作负荷,该系统仍然感觉和其他11代酷睿超极本一样敏捷。
| PCMark 10 / Score | |
| HP Pavilion 15-eg | |
| Asus VivoBook S15 D533UA | |
| Lenovo IdeaPad 3 15ALC6 | |
| Dell Inspiron 15 3501 | |
| Average Intel Core i5-1135G7, Intel Iris Xe Graphics G7 80EUs (4026 - 4952, n=53) | |
| Dell Inspiron 15 3000 3511 | |
| Dell XPS 15 9510 i5 11400H FHD | |
| PCMark 10 / Essentials | |
| HP Pavilion 15-eg | |
| Dell Inspiron 15 3501 | |
| Dell XPS 15 9510 i5 11400H FHD | |
| Average Intel Core i5-1135G7, Intel Iris Xe Graphics G7 80EUs (8149 - 9917, n=53) | |
| Asus VivoBook S15 D533UA | |
| Lenovo IdeaPad 3 15ALC6 | |
| Dell Inspiron 15 3000 3511 | |
| PCMark 10 / Productivity | |
| HP Pavilion 15-eg | |
| Asus VivoBook S15 D533UA | |
| Lenovo IdeaPad 3 15ALC6 | |
| Dell Inspiron 15 3501 | |
| Dell XPS 15 9510 i5 11400H FHD | |
| Average Intel Core i5-1135G7, Intel Iris Xe Graphics G7 80EUs (5040 - 6619, n=53) | |
| Dell Inspiron 15 3000 3511 | |
| PCMark 10 / Digital Content Creation | |
| HP Pavilion 15-eg | |
| Asus VivoBook S15 D533UA | |
| Dell Inspiron 15 3501 | |
| Lenovo IdeaPad 3 15ALC6 | |
| Dell Inspiron 15 3000 3511 | |
| Average Intel Core i5-1135G7, Intel Iris Xe Graphics G7 80EUs (3548 - 5255, n=53) | |
| Dell XPS 15 9510 i5 11400H FHD | |
| PCMark 10 Score | 4508 points | |
Help | ||
| AIDA64 / Memory Copy | |
| HP Pavilion 15-eg | |
| Average Intel Core i5-1135G7 (17443 - 63889, n=45) | |
| Asus VivoBook S15 D533UA | |
| Lenovo IdeaPad 3 15ALC6 | |
| Dell Inspiron 15 3501 | |
| Dell Inspiron 15 3000 3511 | |
| AIDA64 / Memory Read | |
| HP Pavilion 15-eg | |
| Asus VivoBook S15 D533UA | |
| Average Intel Core i5-1135G7 (19716 - 63705, n=45) | |
| Dell Inspiron 15 3501 | |
| Lenovo IdeaPad 3 15ALC6 | |
| Dell Inspiron 15 3000 3511 | |
| AIDA64 / Memory Write | |
| HP Pavilion 15-eg | |
| Average Intel Core i5-1135G7 (18722 - 66778, n=45) | |
| Asus VivoBook S15 D533UA | |
| Lenovo IdeaPad 3 15ALC6 | |
| Dell Inspiron 15 3501 | |
| Dell Inspiron 15 3000 3511 | |
| AIDA64 / Memory Latency | |
| Dell Inspiron 15 3000 3511 | |
| Lenovo IdeaPad 3 15ALC6 | |
| Asus VivoBook S15 D533UA | |
| Dell Inspiron 15 3501 | |
| Average Intel Core i5-1135G7 (68.3 - 107, n=51) | |
| HP Pavilion 15-eg | |
| Dell XPS 15 9510 i5 11400H FHD | |
* ... smaller is better
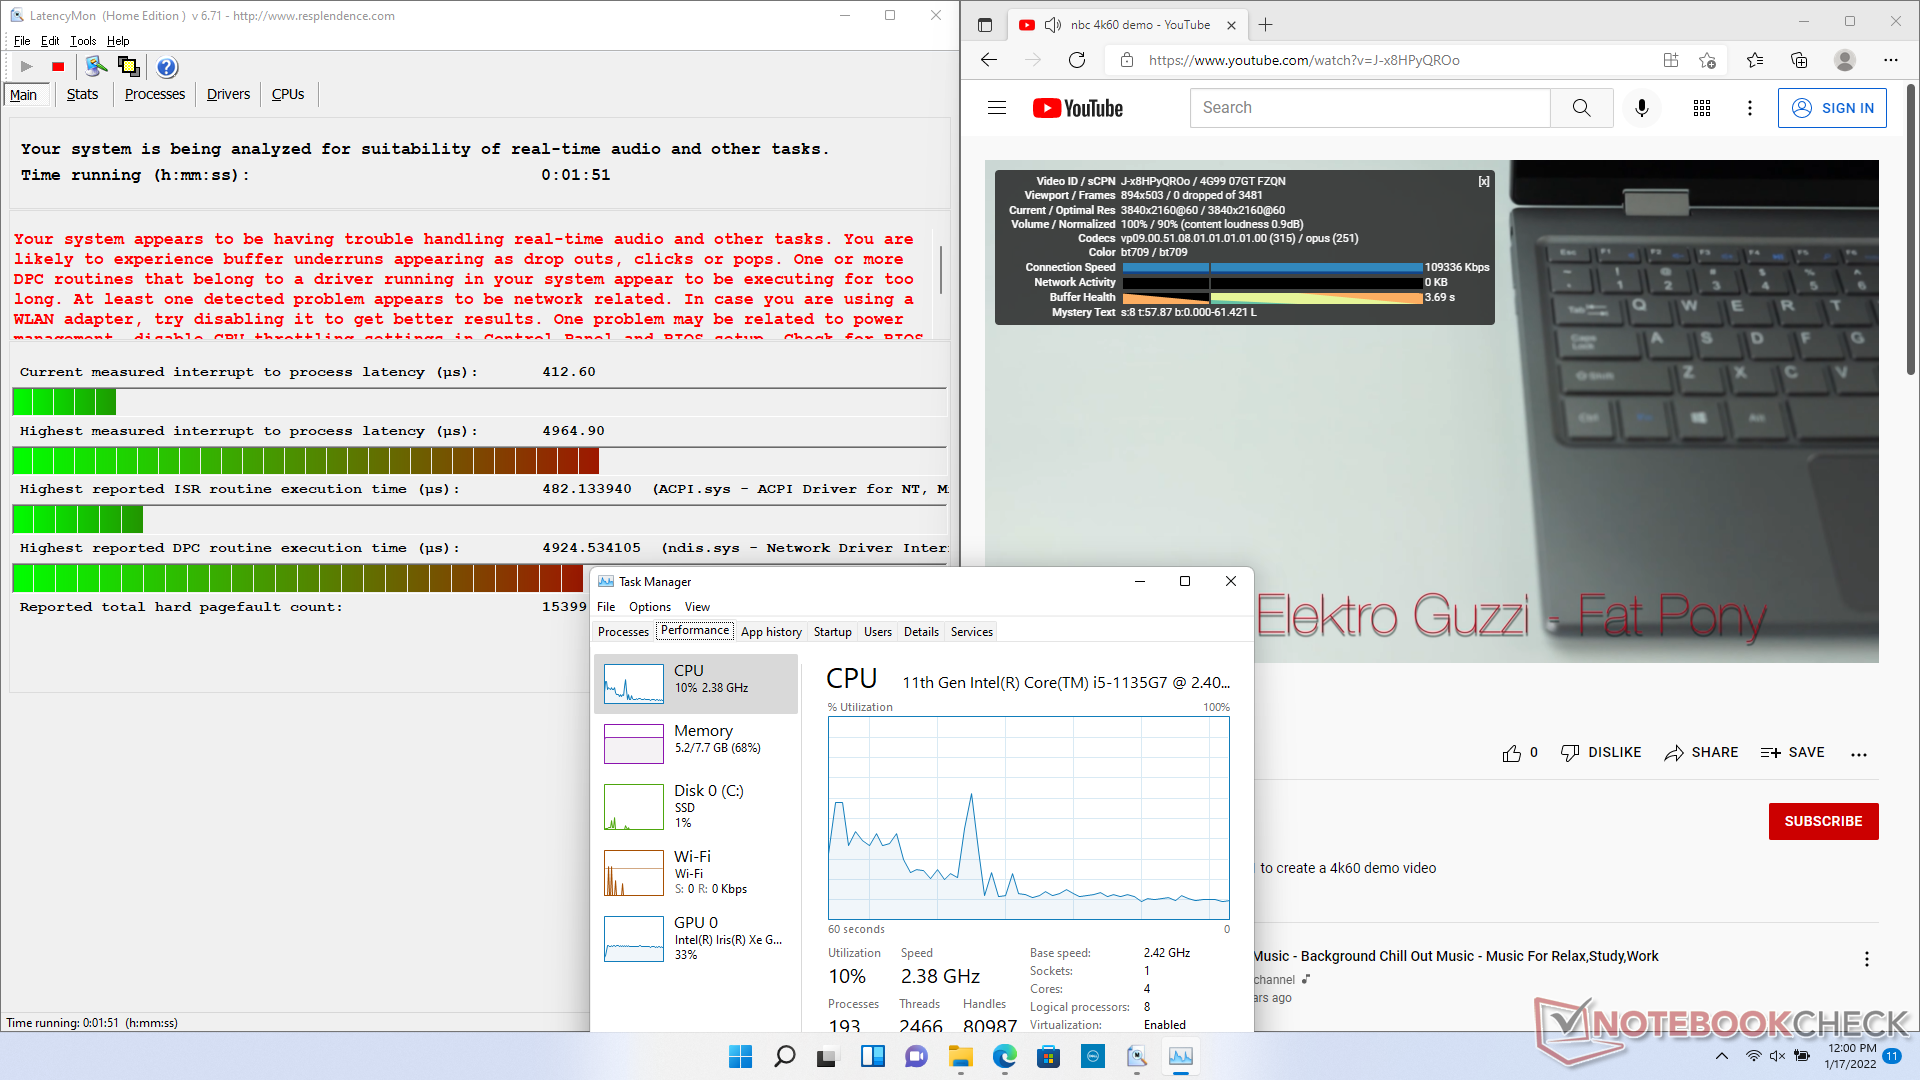
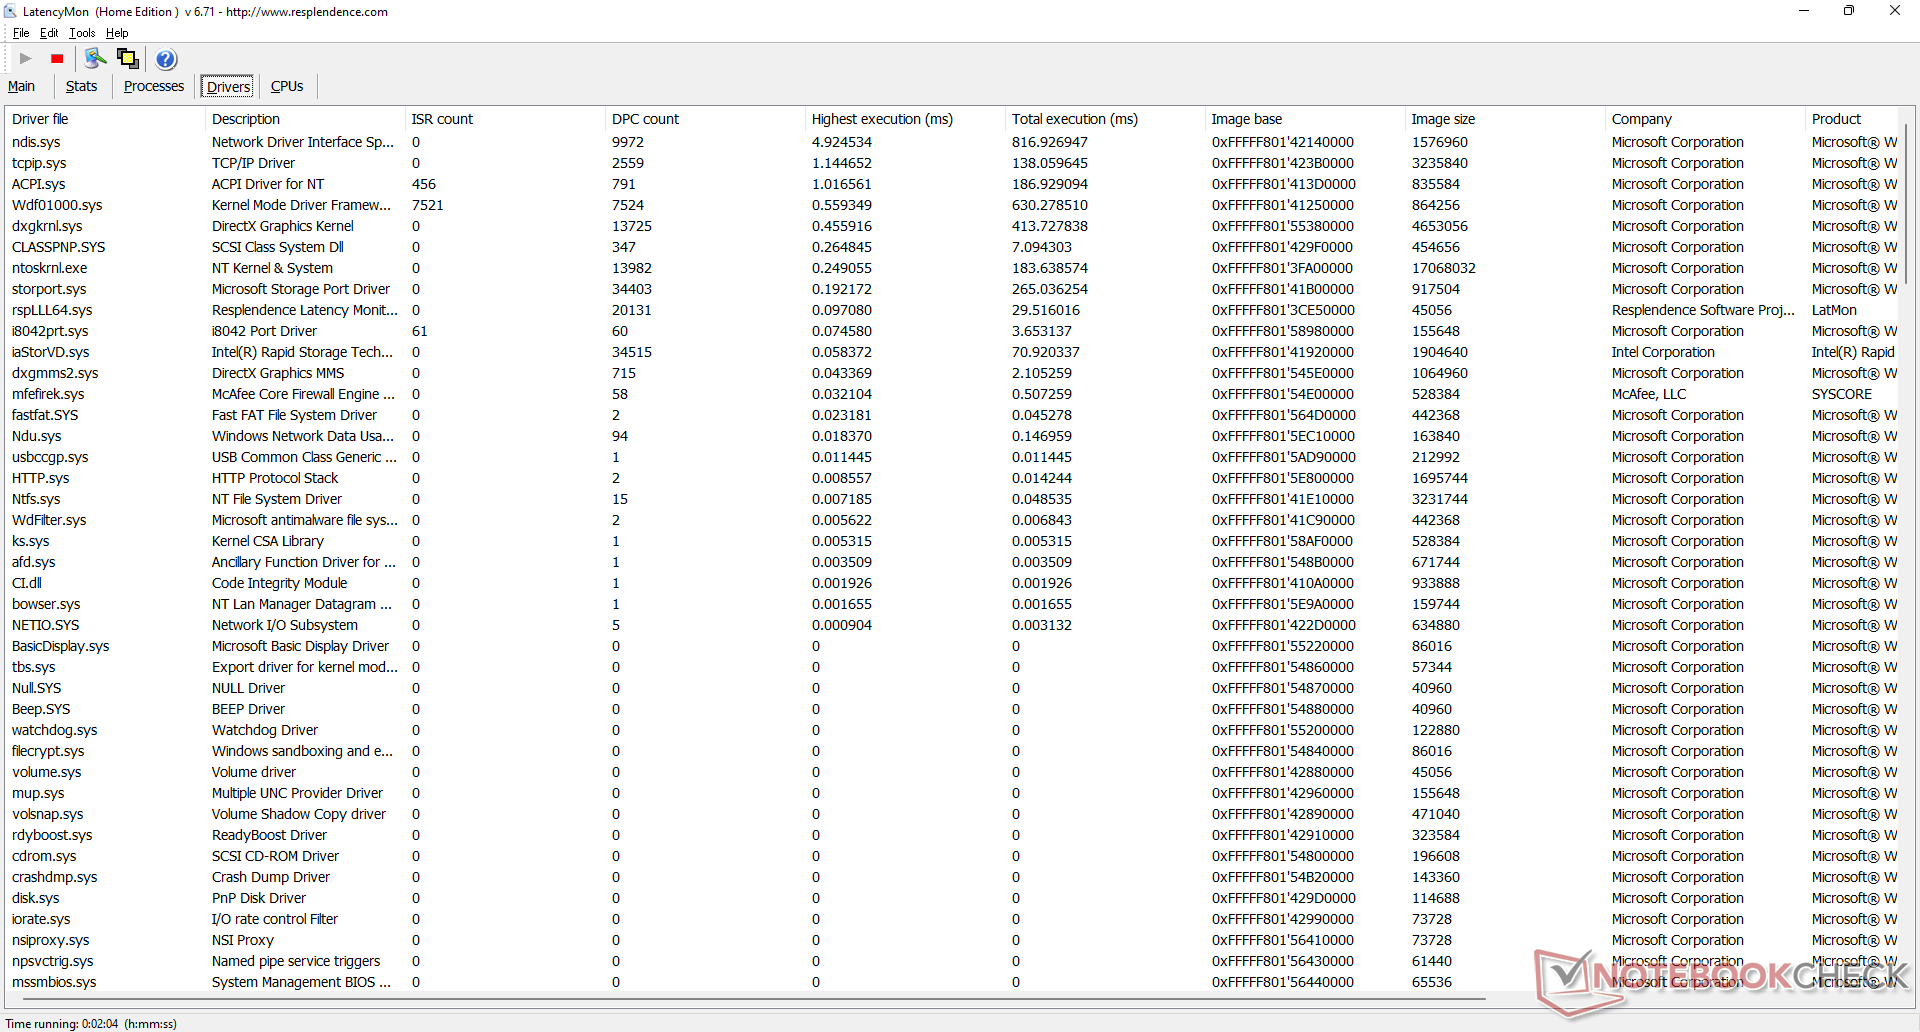
DPC延时
LatencyMon显示在我们的主页上打开多个浏览器标签时存在DPC问题。在60 FPS的情况下,4K视频播放很流畅,没有任何掉帧。
| DPC Latencies / LatencyMon - interrupt to process latency (max), Web, Youtube, Prime95 | |
| Dell Inspiron 15 3000 3511 | |
| HP Pavilion 15-eg | |
| Dell XPS 15 9510 i5 11400H FHD | |
| Dell Inspiron 15 3501 | |
| Lenovo IdeaPad 3 15ALC6 | |
| Asus VivoBook S15 D533UA | |
* ... smaller is better
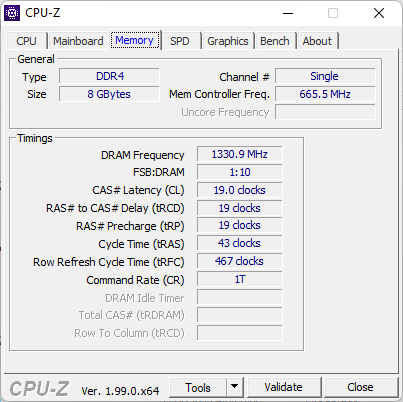
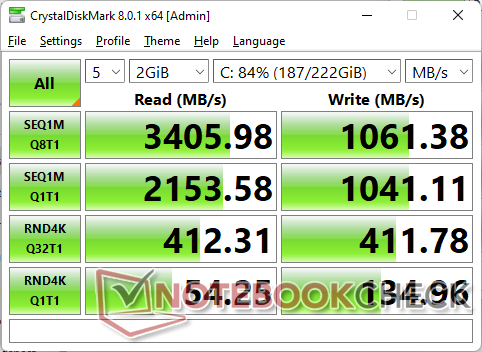
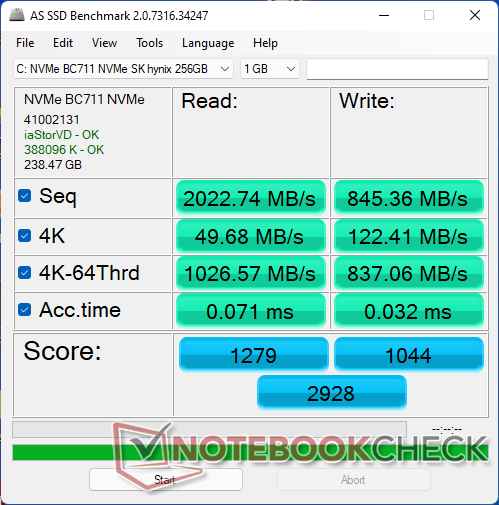
存储设备
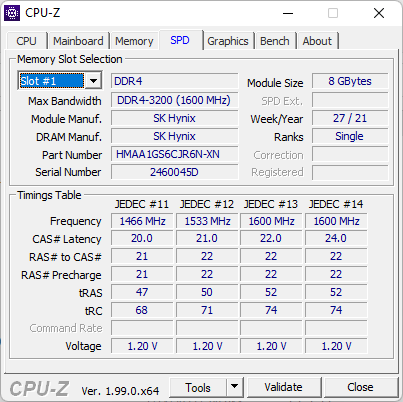
该系统最多可以容纳两个内部驱动器。我们的具体配置配备了一个256GB的PCIe3 x4 SK Hynix SK BC711M.2 2242 NVMe固态硬盘,分别提供高达约3300 MB/s和约1000 MB/s的连续读取和写入速率,对于经济型笔记本电脑来说非常快。该驱动器能够在没有任何热垫或额外冷却的情况下长期保持其最大传输速率。

| Drive Performance rating - Percent | |
| Asus VivoBook S15 D533UA | |
| Dell Inspiron 15 3501 | |
| Lenovo IdeaPad 3 15ALC6 | |
| Dell Inspiron 15 3000 3511 | |
| Average SK Hynix BC711 HFM256GD3GX013N | |
| Dell XPS 15 9510 i5 11400H FHD | |
| HP Pavilion 15-eg | |
* ... smaller is better
Disk Throttling: DiskSpd Read Loop, Queue Depth 8
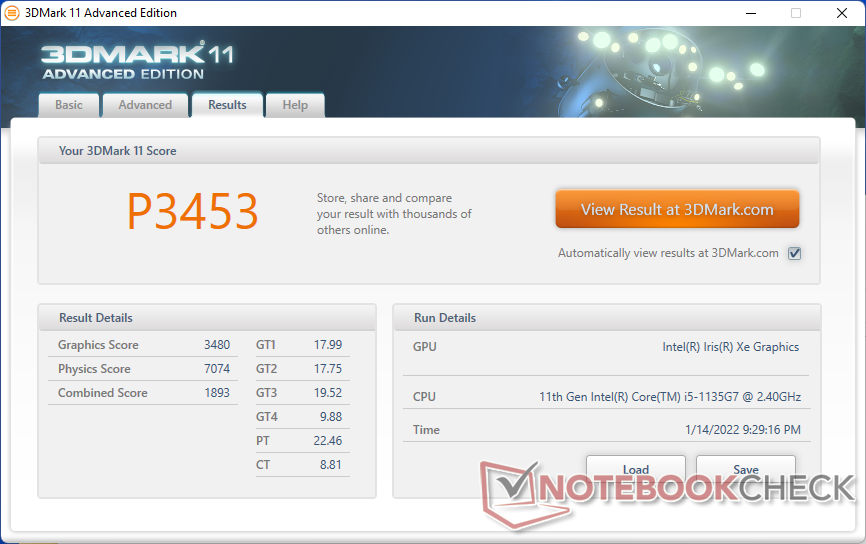
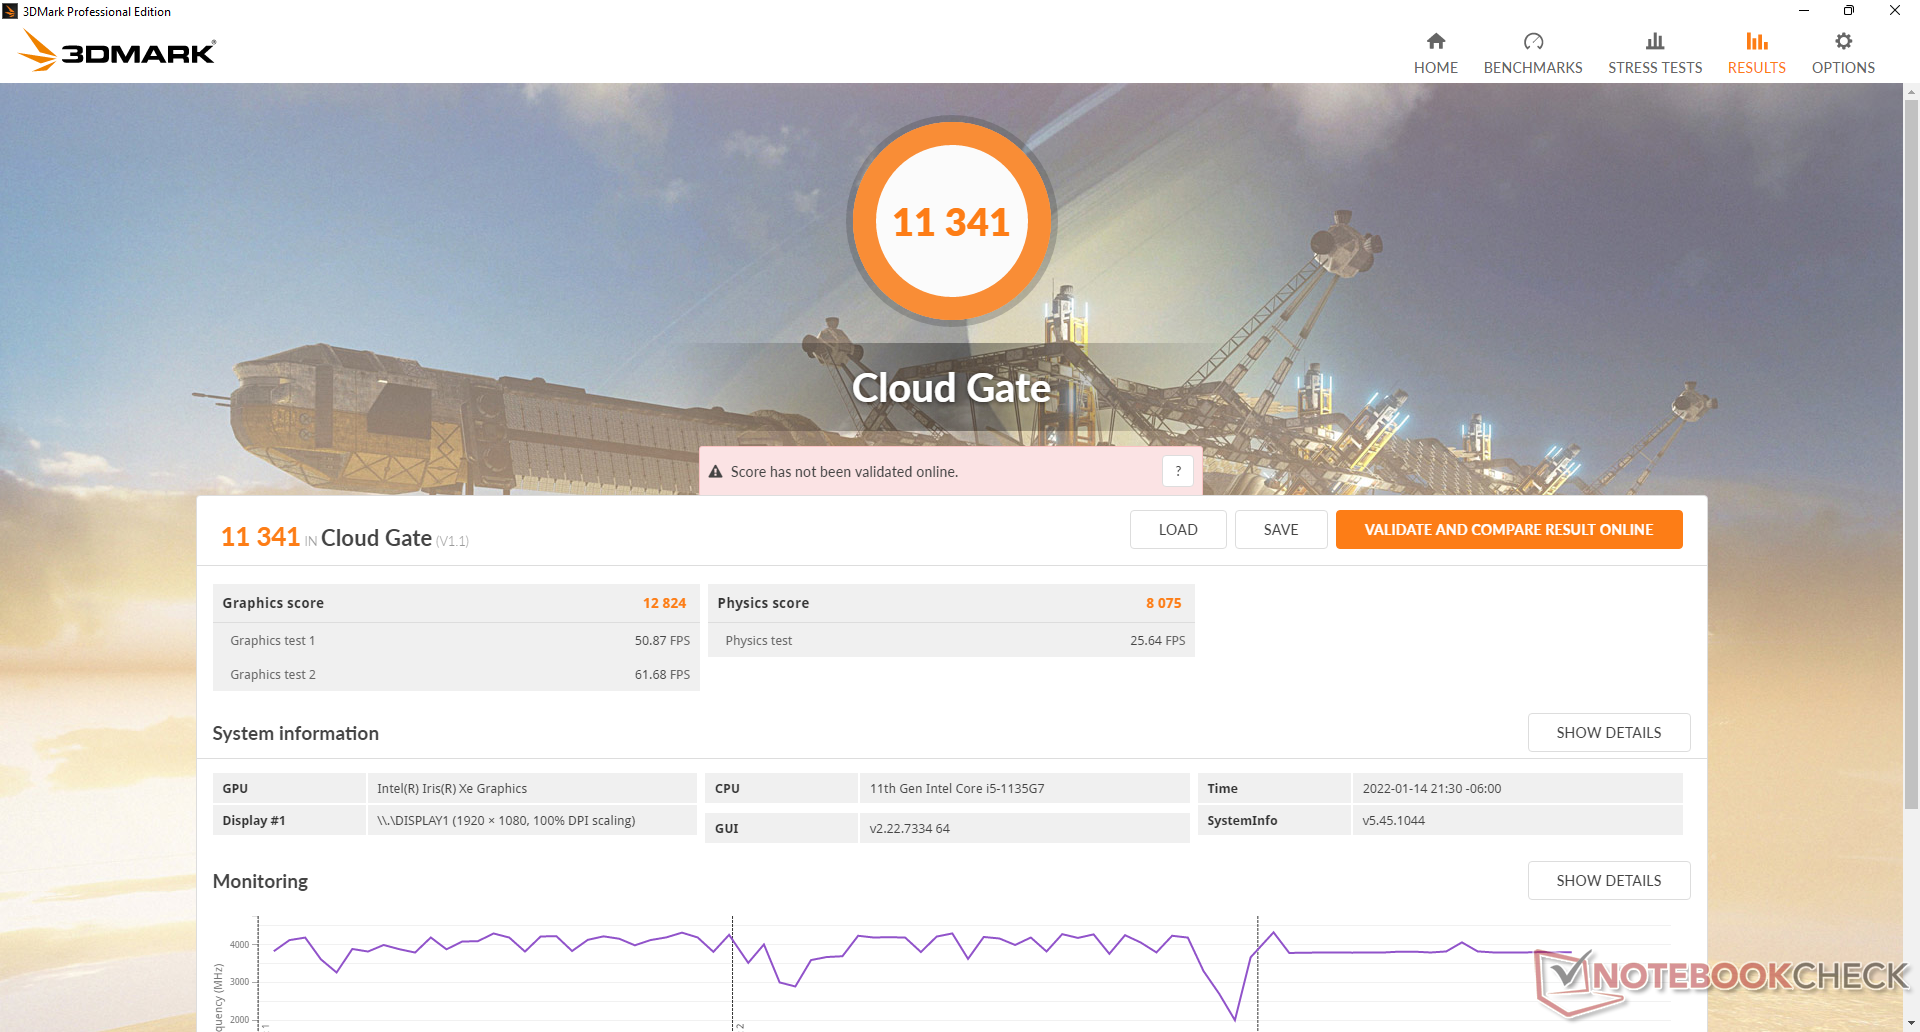
GPU性能
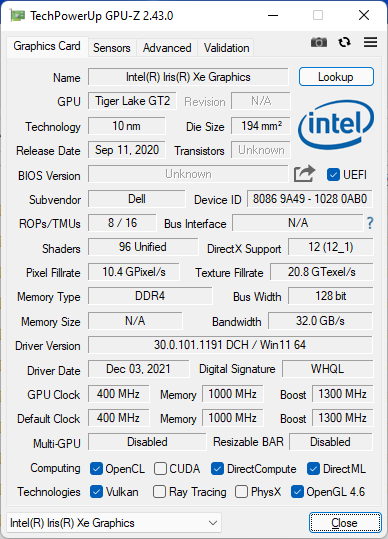
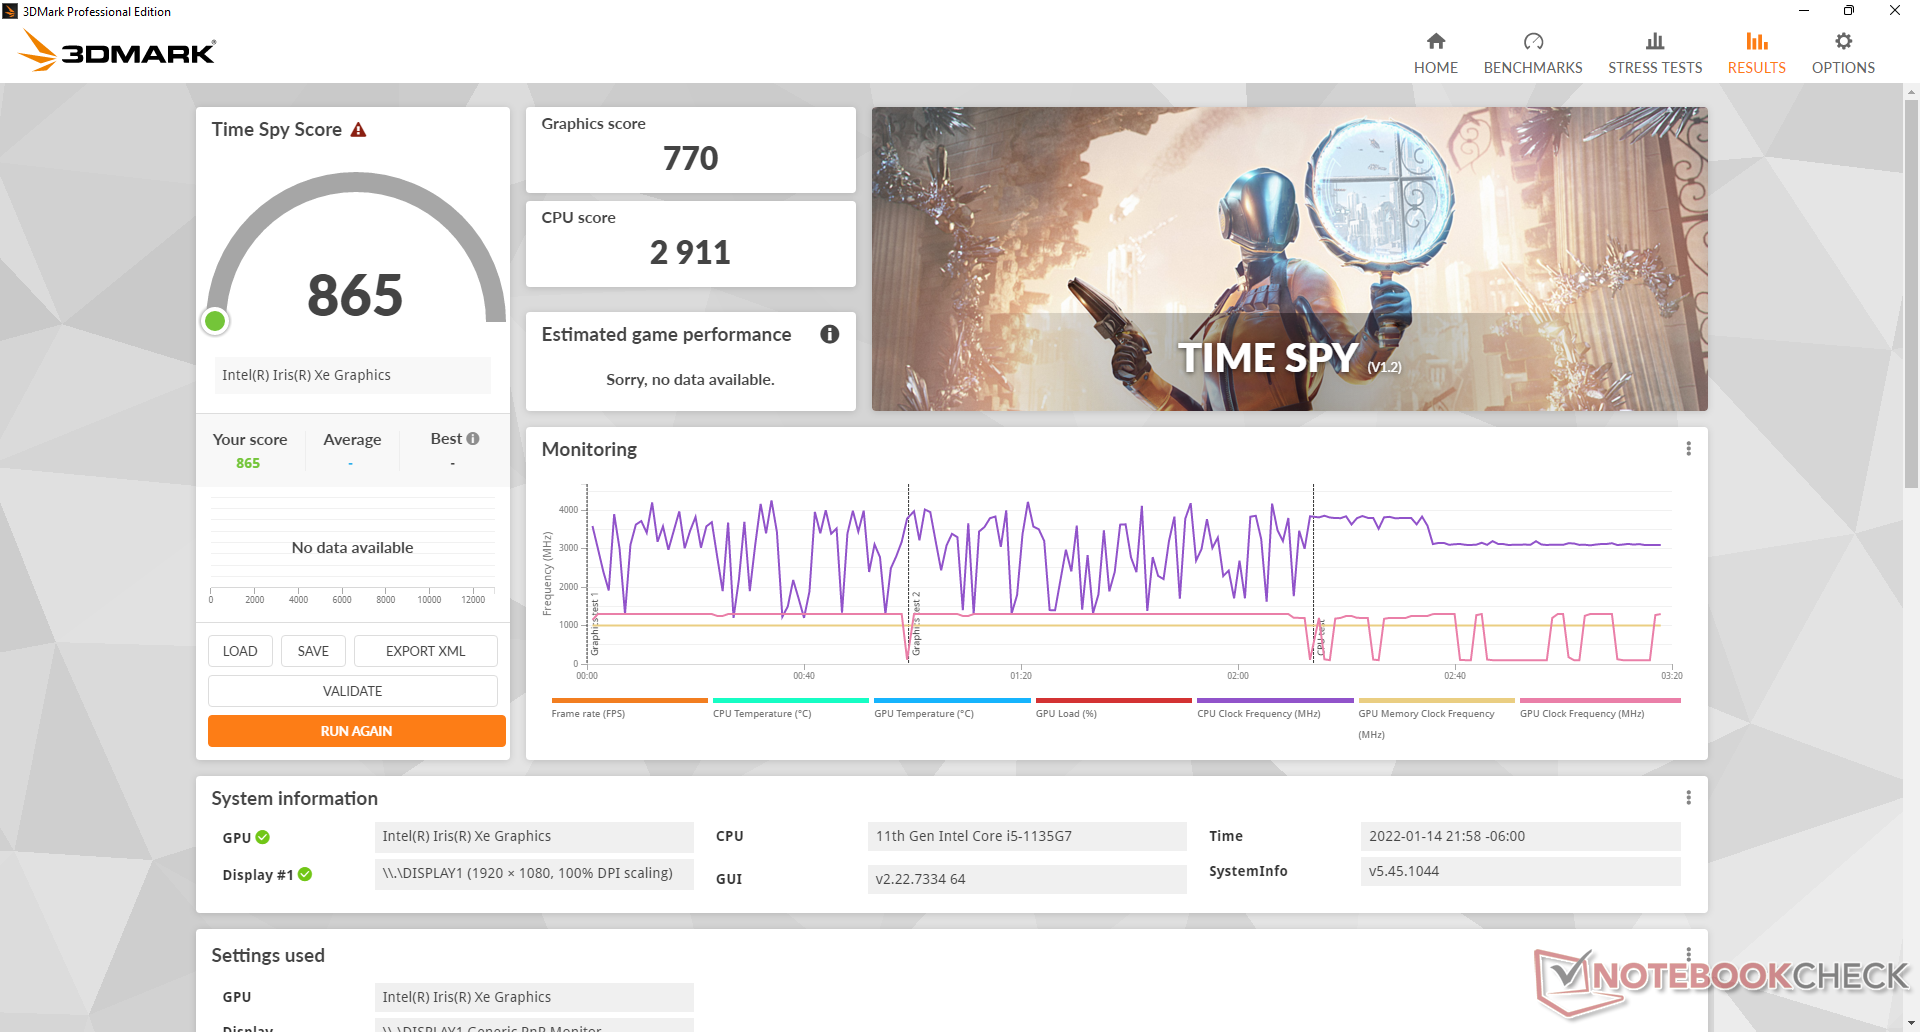
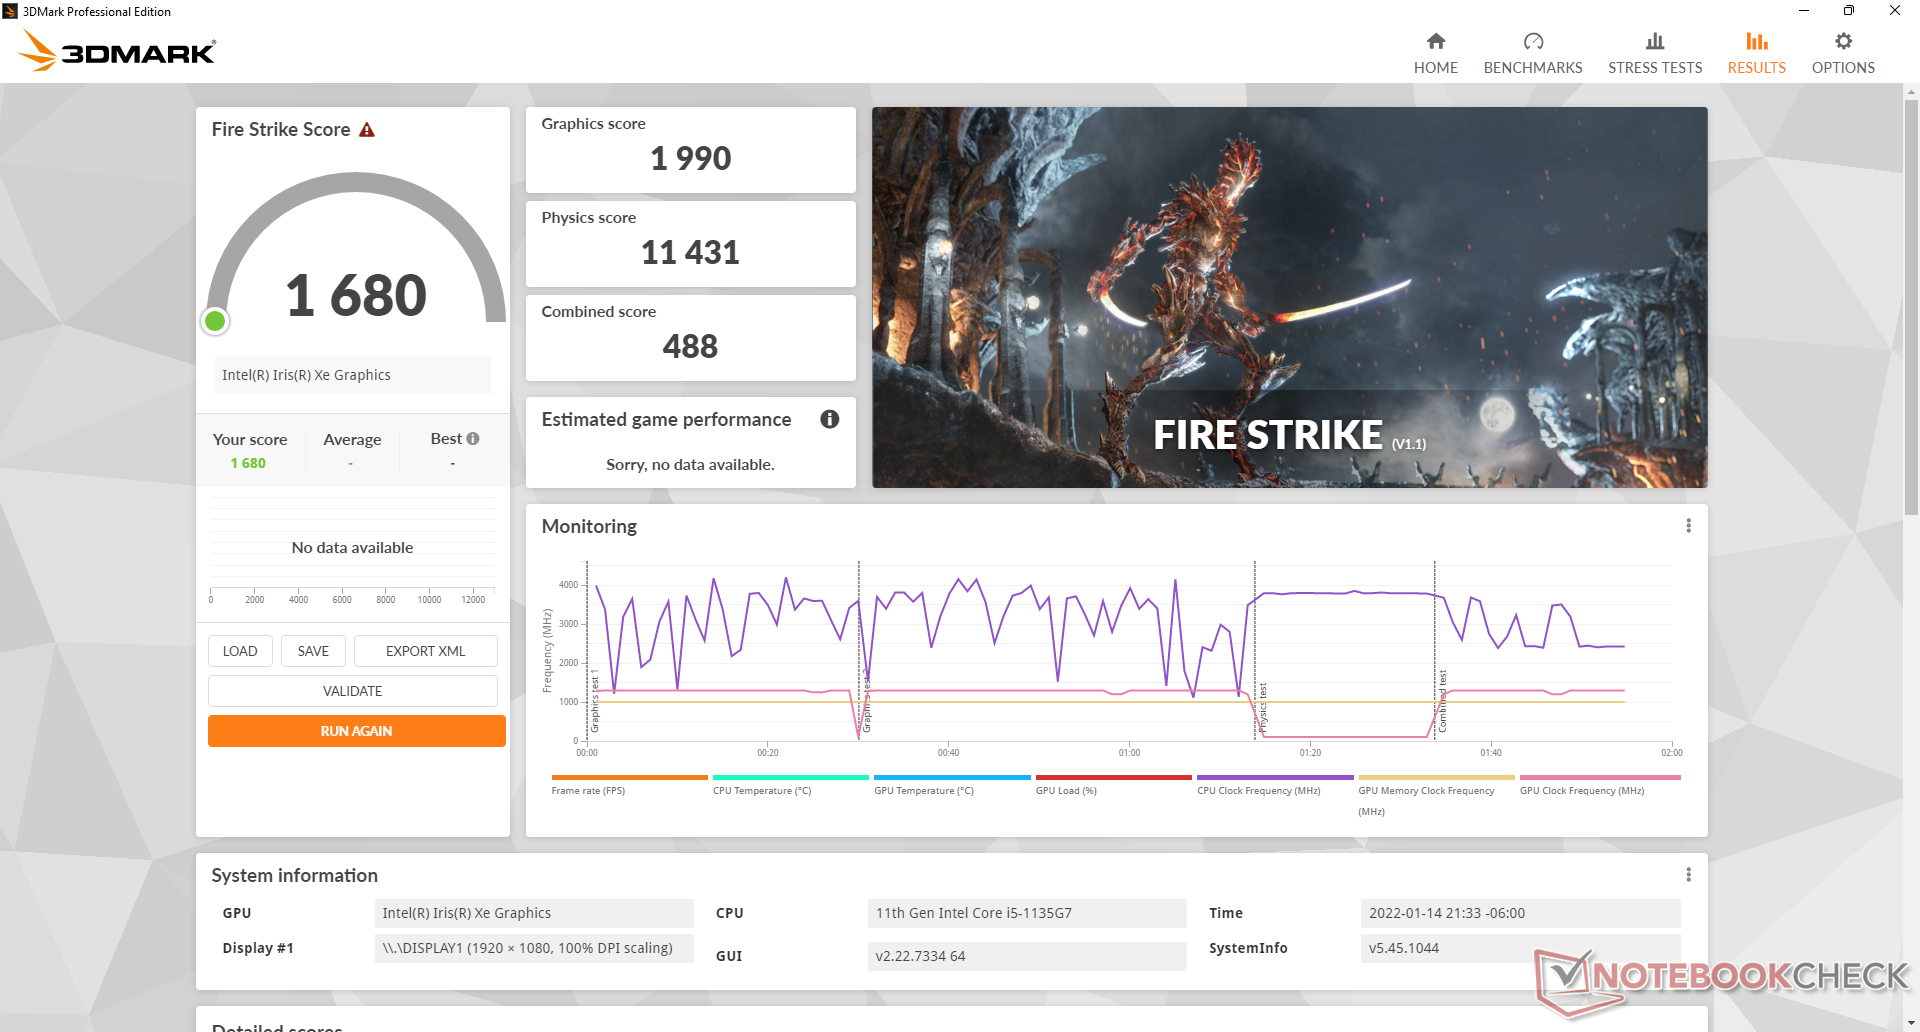
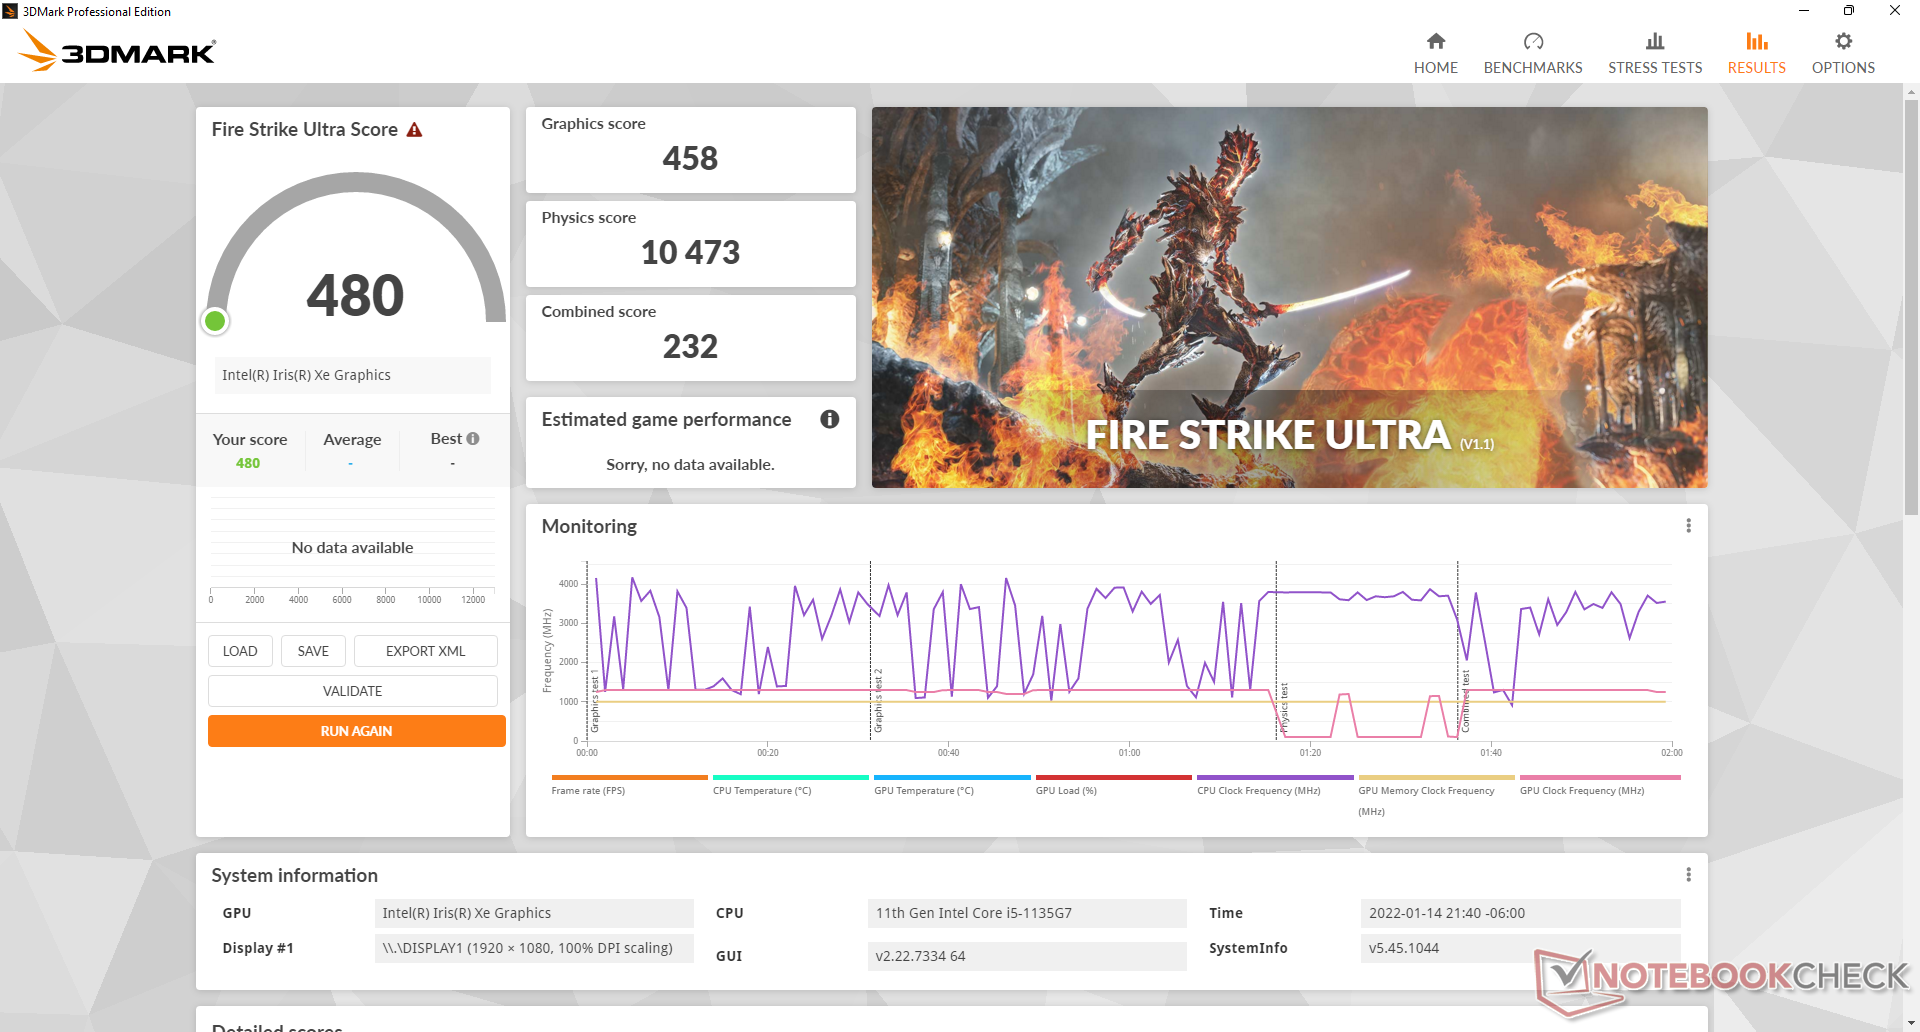
图形性能比我们数据库中配备相同集成Iris Xe 80 EU的普通笔记本电脑慢30%到45%。 相同的集成Iris Xe 80 EUsGPU。令人失望的结果主要是由于仅有8GB的单通道内存,而绝大多数价格较高的机型上都有16GB或更多的双通道内存。如果最大限度地提高GPU性能是一个优先事项,强烈建议再安装一条内存。
| 3DMark Performance rating - Percent | |
| Samsung Galaxy Book Pro 15 NP950XDB-KC5US | |
| Average Intel Iris Xe Graphics G7 80EUs | |
| Asus VivoBook S15 D533UA | |
| Samsung Galaxy Book Flex 15-NP950 | |
| Lenovo IdeaPad 5 15ALC05 | |
| HP Envy x360 15-ee0257ng | |
| Lenovo ThinkPad L15 G2 AMD | |
| Lenovo Ideapad C340-15IWL-81N5004QGE | |
| HP ProBook 455 G7-175W8EA | |
| Dell Inspiron 15 3000 3511 | |
| HP 250 G7-15S40ES | |
| HP Pavilion x360 15-dq0065cl | |
| 3DMark 11 - 1280x720 Performance GPU | |
| Samsung Galaxy Book Pro 15 NP950XDB-KC5US | |
| Asus VivoBook S15 D533UA | |
| Lenovo IdeaPad 5 15ALC05 | |
| Average Intel Iris Xe Graphics G7 80EUs (2246 - 6579, n=112) | |
| HP Envy x360 15-ee0257ng | |
| Samsung Galaxy Book Flex 15-NP950 | |
| Lenovo ThinkPad L15 G2 AMD | |
| HP ProBook 455 G7-175W8EA | |
| Lenovo Ideapad C340-15IWL-81N5004QGE | |
| Dell Inspiron 15 3000 3511 | |
| HP 250 G7-15S40ES | |
| HP Pavilion x360 15-dq0065cl | |
| 3DMark 11 Performance | 3453 points | |
| 3DMark Cloud Gate Standard Score | 11341 points | |
| 3DMark Fire Strike Score | 1680 points | |
| 3DMark Time Spy Score | 865 points | |
Help | ||
| Far Cry 5 | |
| 1280x720 Low Preset AA:T | |
| Samsung Galaxy Book Pro 15 NP950XDB-KC5US | |
| Asus VivoBook S15 D533UA | |
| Average Intel Iris Xe Graphics G7 80EUs (14 - 63, n=50) | |
| Lenovo ThinkPad L15 G2 AMD | |
| HP ProBook 455 G7-175W8EA | |
| HP 250 G7-15S40ES | |
| Dell Inspiron 15 3000 3511 | |
| 1920x1080 Medium Preset AA:T | |
| Samsung Galaxy Book Pro 15 NP950XDB-KC5US | |
| Average Intel Iris Xe Graphics G7 80EUs (9 - 31, n=47) | |
| Asus VivoBook S15 D533UA | |
| Lenovo ThinkPad L15 G2 AMD | |
| HP ProBook 455 G7-175W8EA | |
| HP 250 G7-15S40ES | |
| Dell Inspiron 15 3000 3511 | |
| 1920x1080 High Preset AA:T | |
| Samsung Galaxy Book Pro 15 NP950XDB-KC5US | |
| Average Intel Iris Xe Graphics G7 80EUs (8 - 29, n=39) | |
| Asus VivoBook S15 D533UA | |
| Lenovo ThinkPad L15 G2 AMD | |
| HP ProBook 455 G7-175W8EA | |
| HP 250 G7-15S40ES | |
| Dell Inspiron 15 3000 3511 | |
| Final Fantasy XV Benchmark | |
| 1280x720 Lite Quality | |
| Samsung Galaxy Book Pro 15 NP950XDB-KC5US | |
| Asus VivoBook S15 D533UA | |
| Average Intel Iris Xe Graphics G7 80EUs (8.32 - 45.6, n=107) | |
| Lenovo ThinkPad L15 G2 AMD | |
| Dell Inspiron 15 3000 3511 | |
| 1920x1080 Standard Quality | |
| Samsung Galaxy Book Pro 15 NP950XDB-KC5US | |
| Average Intel Iris Xe Graphics G7 80EUs (4.47 - 25.4, n=100) | |
| Asus VivoBook S15 D533UA | |
| Lenovo ThinkPad L15 G2 AMD | |
| Dell Inspiron 15 3000 3511 | |
| 1920x1080 High Quality | |
| Samsung Galaxy Book Pro 15 NP950XDB-KC5US | |
| Average Intel Iris Xe Graphics G7 80EUs (4.01 - 22, n=92) | |
| Asus VivoBook S15 D533UA | |
| Lenovo ThinkPad L15 G2 AMD | |
| Dell Inspiron 15 3000 3511 | |
| X-Plane 11.11 | |
| 1280x720 low (fps_test=1) | |
| HP 250 G7-15S40ES | |
| Asus VivoBook S15 D533UA | |
| Lenovo ThinkPad L15 G2 AMD | |
| Lenovo IdeaPad 5 15ALC05 | |
| Average Intel Iris Xe Graphics G7 80EUs (9.12 - 74.4, n=111) | |
| HP ProBook 455 G7-175W8EA | |
| Samsung Galaxy Book Pro 15 NP950XDB-KC5US | |
| Dell Inspiron 15 3000 3511 | |
| 1920x1080 med (fps_test=2) | |
| Samsung Galaxy Book Pro 15 NP950XDB-KC5US | |
| Lenovo ThinkPad L15 G2 AMD | |
| Lenovo IdeaPad 5 15ALC05 | |
| Asus VivoBook S15 D533UA | |
| Average Intel Iris Xe Graphics G7 80EUs (6.45 - 40.5, n=112) | |
| HP 250 G7-15S40ES | |
| HP ProBook 455 G7-175W8EA | |
| Dell Inspiron 15 3000 3511 | |
| 1920x1080 high (fps_test=3) | |
| Samsung Galaxy Book Pro 15 NP950XDB-KC5US | |
| Lenovo IdeaPad 5 15ALC05 | |
| Lenovo ThinkPad L15 G2 AMD | |
| Asus VivoBook S15 D533UA | |
| Average Intel Iris Xe Graphics G7 80EUs (5.55 - 36.3, n=110) | |
| HP 250 G7-15S40ES | |
| HP ProBook 455 G7-175W8EA | |
| Dell Inspiron 15 3000 3511 | |
| Strange Brigade | |
| 1280x720 lowest AF:1 | |
| Samsung Galaxy Book Pro 15 NP950XDB-KC5US | |
| Asus VivoBook S15 D533UA | |
| Average Intel Iris Xe Graphics G7 80EUs (22.7 - 98.7, n=84) | |
| Lenovo ThinkPad L15 G2 AMD | |
| Dell Inspiron 15 3000 3511 | |
| 1920x1080 medium AA:medium AF:4 | |
| Samsung Galaxy Book Pro 15 NP950XDB-KC5US | |
| Asus VivoBook S15 D533UA | |
| Average Intel Iris Xe Graphics G7 80EUs (6 - 48.8, n=86) | |
| Lenovo ThinkPad L15 G2 AMD | |
| Dell Inspiron 15 3000 3511 | |
| 1920x1080 high AA:high AF:8 | |
| Samsung Galaxy Book Pro 15 NP950XDB-KC5US | |
| Asus VivoBook S15 D533UA | |
| Average Intel Iris Xe Graphics G7 80EUs (11.4 - 34, n=83) | |
| Lenovo ThinkPad L15 G2 AMD | |
| Dell Inspiron 15 3000 3511 | |
| 1920x1080 ultra AA:ultra AF:16 | |
| Samsung Galaxy Book Pro 15 NP950XDB-KC5US | |
| Asus VivoBook S15 D533UA | |
| Average Intel Iris Xe Graphics G7 80EUs (13.6 - 27, n=60) | |
| Lenovo ThinkPad L15 G2 AMD | |
Witcher 3 FPS Chart
| low | med. | high | ultra | |
|---|---|---|---|---|
| GTA V (2015) | 37.2 | 28.9 | 7.81 | 3.07 |
| The Witcher 3 (2015) | 33.5 | 22.6 | 10.9 | 6.8 |
| Dota 2 Reborn (2015) | 74.7 | 49.2 | 23.5 | 22.2 |
| Final Fantasy XV Benchmark (2018) | 16.7 | 8.11 | 6.38 | |
| X-Plane 11.11 (2018) | 18.4 | 15.8 | 15.4 | |
| Far Cry 5 (2018) | 17 | 9 | 8 | 8 |
| Strange Brigade (2018) | 36.7 | 13.6 | 11.9 |
排放
系统噪音
在大多数日常负荷下,如网络浏览或视频流,该系统非常安静。事实上,它能够保持几乎无声的时间比预期的长。即使在运行3DMark 06的第一个基准场景后,内部风扇也会保持空闲,这在大多数其他笔记本电脑上并不经常发生。
长期运行游戏将最终导致风扇稳定在31.5 dB(A)。如果CPU变得更加紧张,风扇噪音将达到近40 dB(A),这仍然比大多数替代产品如华硕VivoBook S15或联想IdeaPad 3 15.
Noise level
| Idle |
| 23.3 / 23.3 / 23.3 dB(A) |
| Load |
| 23.3 / 39.2 dB(A) |
 | ||
30 dB silent 40 dB(A) audible 50 dB(A) loud |
||
min: | ||
| Dell Inspiron 15 3000 3511 Iris Xe G7 80EUs, i5-1135G7, SK Hynix BC711 HFM256GD3GX013N | Dell XPS 15 9510 i5 11400H FHD UHD Graphics Xe 16EUs, i5-11400H, Micron 2300 512GB MTFDHBA512TDV | Asus VivoBook S15 D533UA Vega 8, R7 5700U, WDC PC SN530 SDBPNPZ-1T00 | Dell Inspiron 15 3501 Iris Xe G7 96EUs, i7-1165G7, Samsung PM991a MZ9LQ512HBLU-00BD1 | Lenovo IdeaPad 3 15ALC6 Vega 6, R3 5300U, Samsung PM991a MZALQ512HBLU | HP Pavilion 15-eg GeForce MX450, i7-1165G7, Samsung PM991 MZVLQ1T0HALB | |
|---|---|---|---|---|---|---|
| Noise | -5% | -28% | -16% | -14% | -20% | |
| off / environment * (dB) | 23.2 | 24.4 -5% | 26 -12% | 26 -12% | 25.2 -9% | 25.4 -9% |
| Idle Minimum * (dB) | 23.3 | 24.4 -5% | 26 -12% | 26 -12% | 25.8 -11% | 25.6 -10% |
| Idle Average * (dB) | 23.3 | 24.4 -5% | 26 -12% | 26 -12% | 25.8 -11% | 25.6 -10% |
| Idle Maximum * (dB) | 23.3 | 24.4 -5% | 28.8 -24% | 26 -12% | 25.8 -11% | 25.6 -10% |
| Load Average * (dB) | 23.3 | 26.1 -12% | 45 -93% | 35.9 -54% | 32.3 -39% | 39.2 -68% |
| Witcher 3 ultra * (dB) | 31.5 | 33.2 -5% | 32 -2% | 39.1 -24% | ||
| Load Maximum * (dB) | 39.2 | 37.7 4% | 45 -15% | 35.8 9% | 44 -12% | 41.5 -6% |
* ... smaller is better
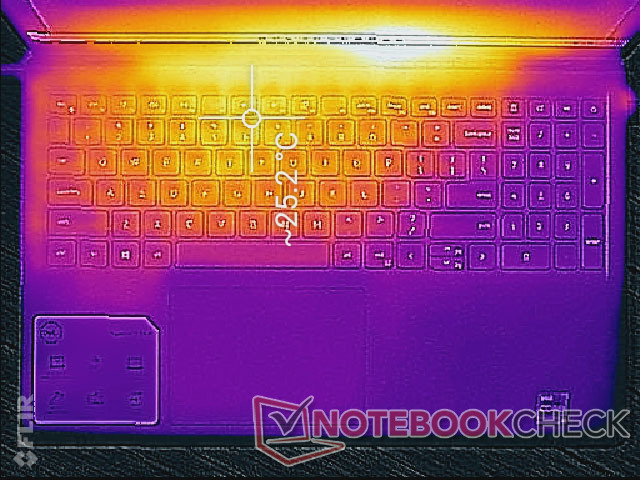
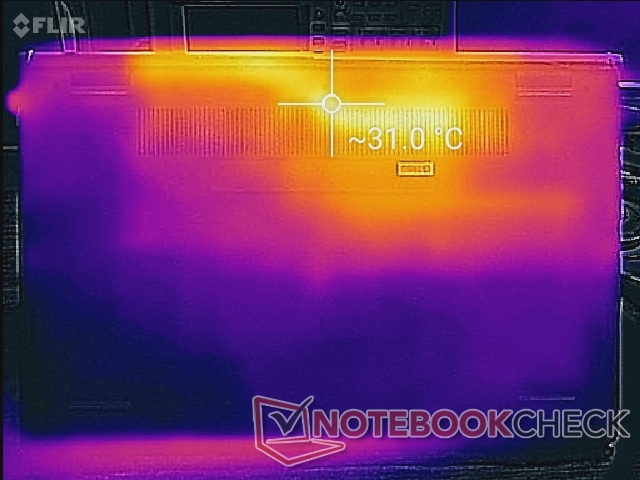
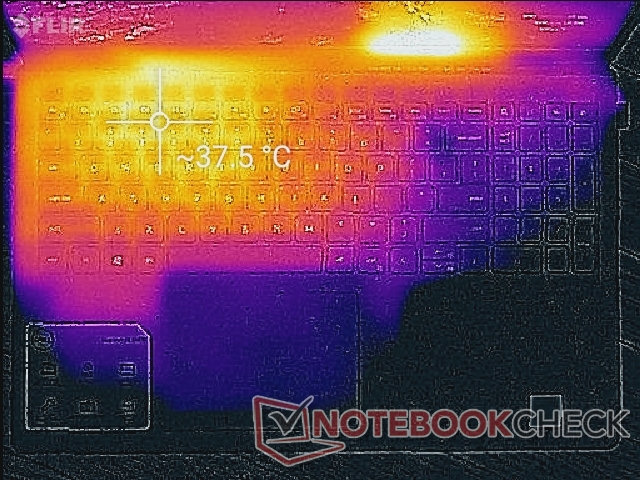
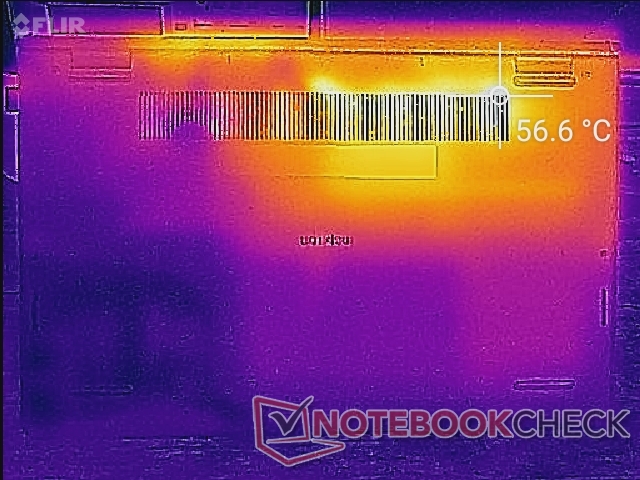
温度
热点集中在系统的背面,处理器及其冷却解决方案被放置在那里。笔记本电脑顶部和底部的温度可分别达到38℃和57℃,而联想IdeaPad 3 15的温度只有31℃和43℃。掌托和大部分键盘将始终保持更低的温度,无论负载如何,都能舒适使用。
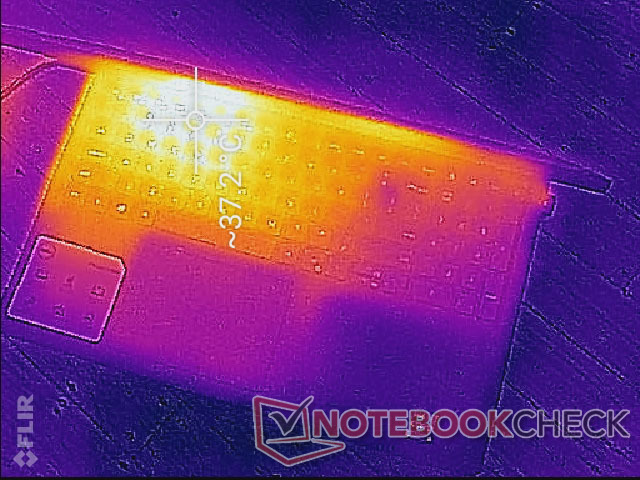
(+) The maximum temperature on the upper side is 37.8 °C / 100 F, compared to the average of 34.3 °C / 94 F, ranging from 21.2 to 62.5 °C for the class Office.
(-) The bottom heats up to a maximum of 55.6 °C / 132 F, compared to the average of 36.8 °C / 98 F
(+) In idle usage, the average temperature for the upper side is 21.8 °C / 71 F, compared to the device average of 29.5 °C / 85 F.
(+) The palmrests and touchpad are cooler than skin temperature with a maximum of 20.6 °C / 69.1 F and are therefore cool to the touch.
(+) The average temperature of the palmrest area of similar devices was 27.5 °C / 81.5 F (+6.9 °C / 12.4 F).
| Dell Inspiron 15 3000 3511 Intel Core i5-1135G7, Intel Iris Xe Graphics G7 80EUs | Dell XPS 15 9510 i5 11400H FHD Intel Core i5-11400H, Intel UHD Graphics Xe 16EUs | Asus VivoBook S15 D533UA AMD Ryzen 7 5700U, AMD Radeon RX Vega 8 (Ryzen 4000/5000) | Dell Inspiron 15 3501 Intel Core i7-1165G7, Intel Iris Xe Graphics G7 96EUs | Lenovo IdeaPad 3 15ALC6 AMD Ryzen 3 5300U, AMD Radeon RX Vega 6 (Ryzen 4000/5000) | HP Pavilion 15-eg Intel Core i7-1165G7, NVIDIA GeForce MX450 | |
|---|---|---|---|---|---|---|
| Heat | 8% | 0% | 2% | 14% | -2% | |
| Maximum Upper Side * (°C) | 37.8 | 42.8 -13% | 46.1 -22% | 45.6 -21% | 31.2 17% | 44 -16% |
| Maximum Bottom * (°C) | 55.6 | 41.2 26% | 46.6 16% | 41 26% | 43 23% | 53.4 4% |
| Idle Upper Side * (°C) | 26.2 | 25.8 2% | 27.4 -5% | 28.2 -8% | 24.8 5% | 27.4 -5% |
| Idle Bottom * (°C) | 32 | 26.2 18% | 28.2 12% | 29.1 9% | 28.2 12% | 28.8 10% |
* ... smaller is better
压力测试
运行Prime95会使CPU在最初的几秒钟内飙升到3.5GHz,直到其核心温度达到100C。然后时钟频率会迅速下降到2.5至2.8GHz范围,以保持80C的冷却温度。 酷睿i7华硕Vivobook 15 K513EQ将导致更高的稳定时钟速率3.1 GHz。
当运行时,CPU将稳定在62摄氏度。 Witcher 3代表重载,而在采用AMD技术的联想IdeaPad 3 15ALC6上则为57摄氏度。
用电池供电运行不会限制性能。3DMark 11的分数在电池供电和AC适配器供电之间将保持基本一致。
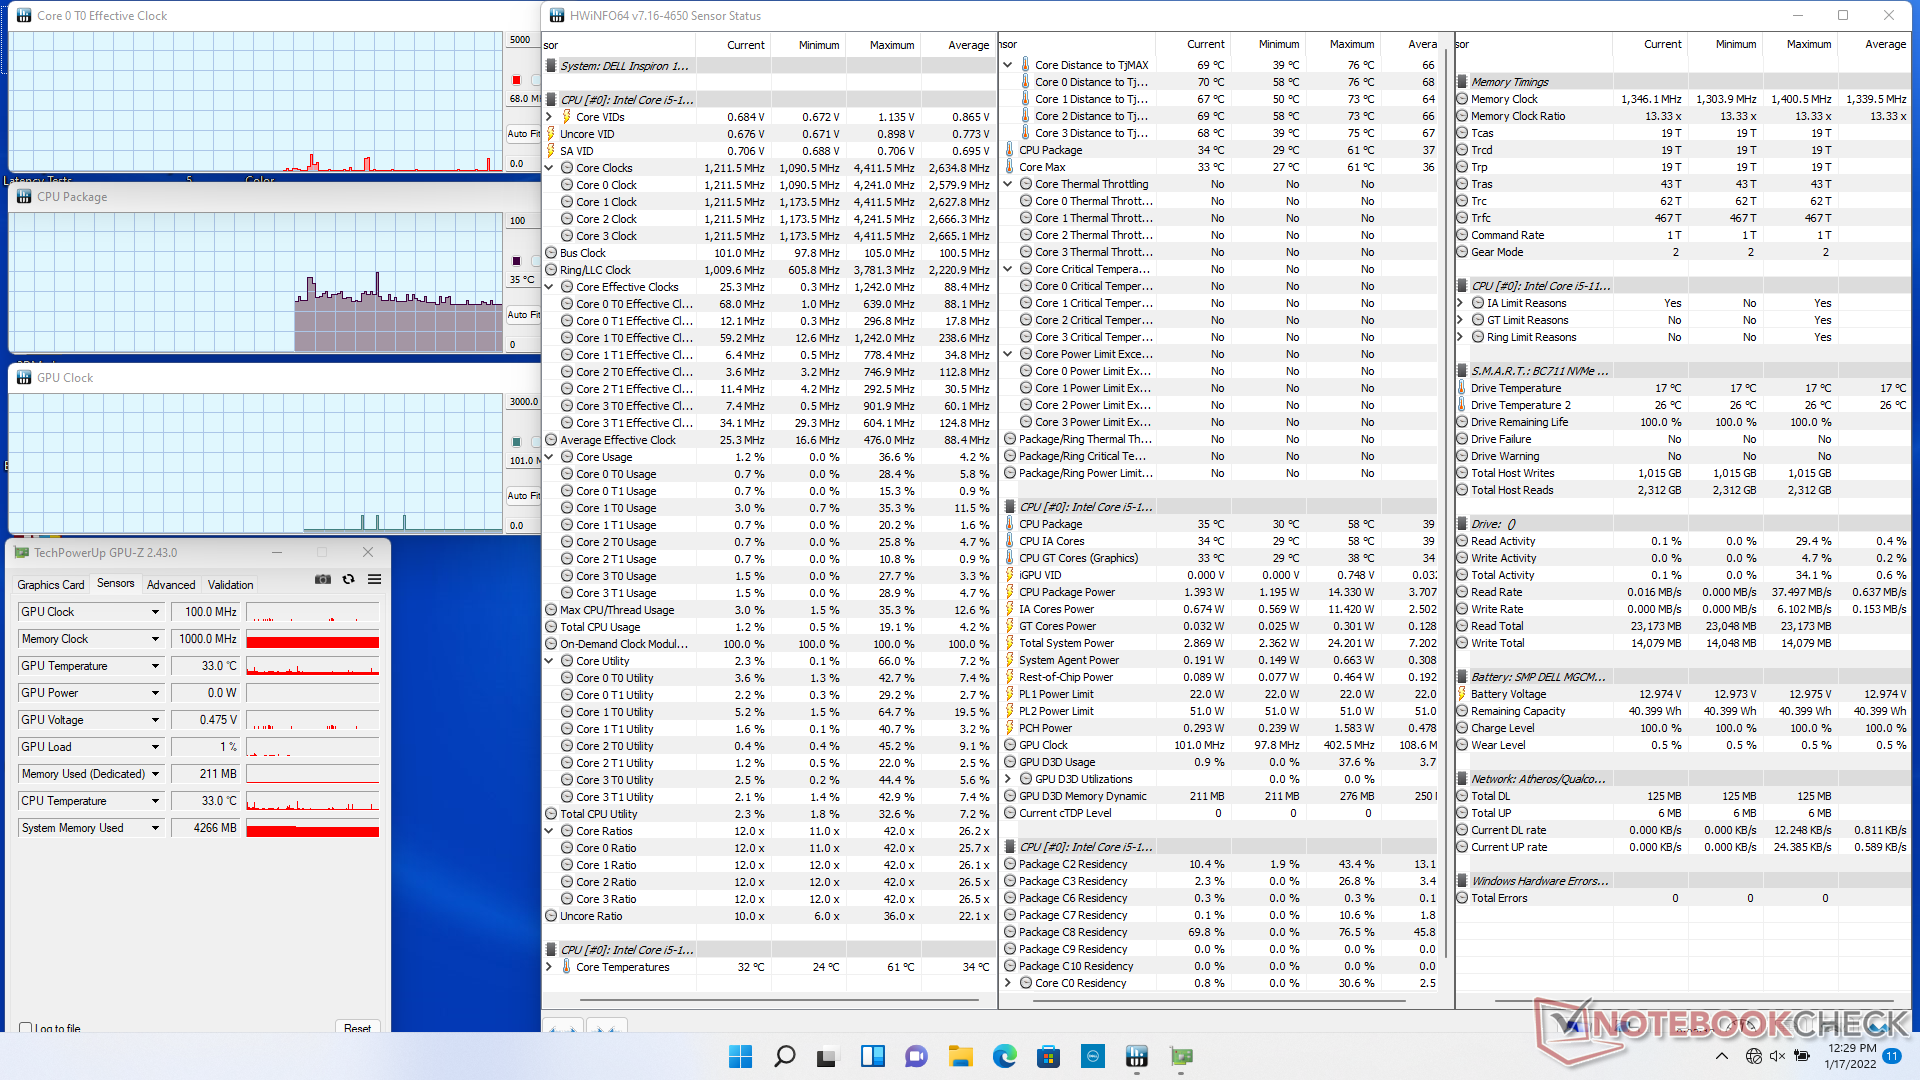
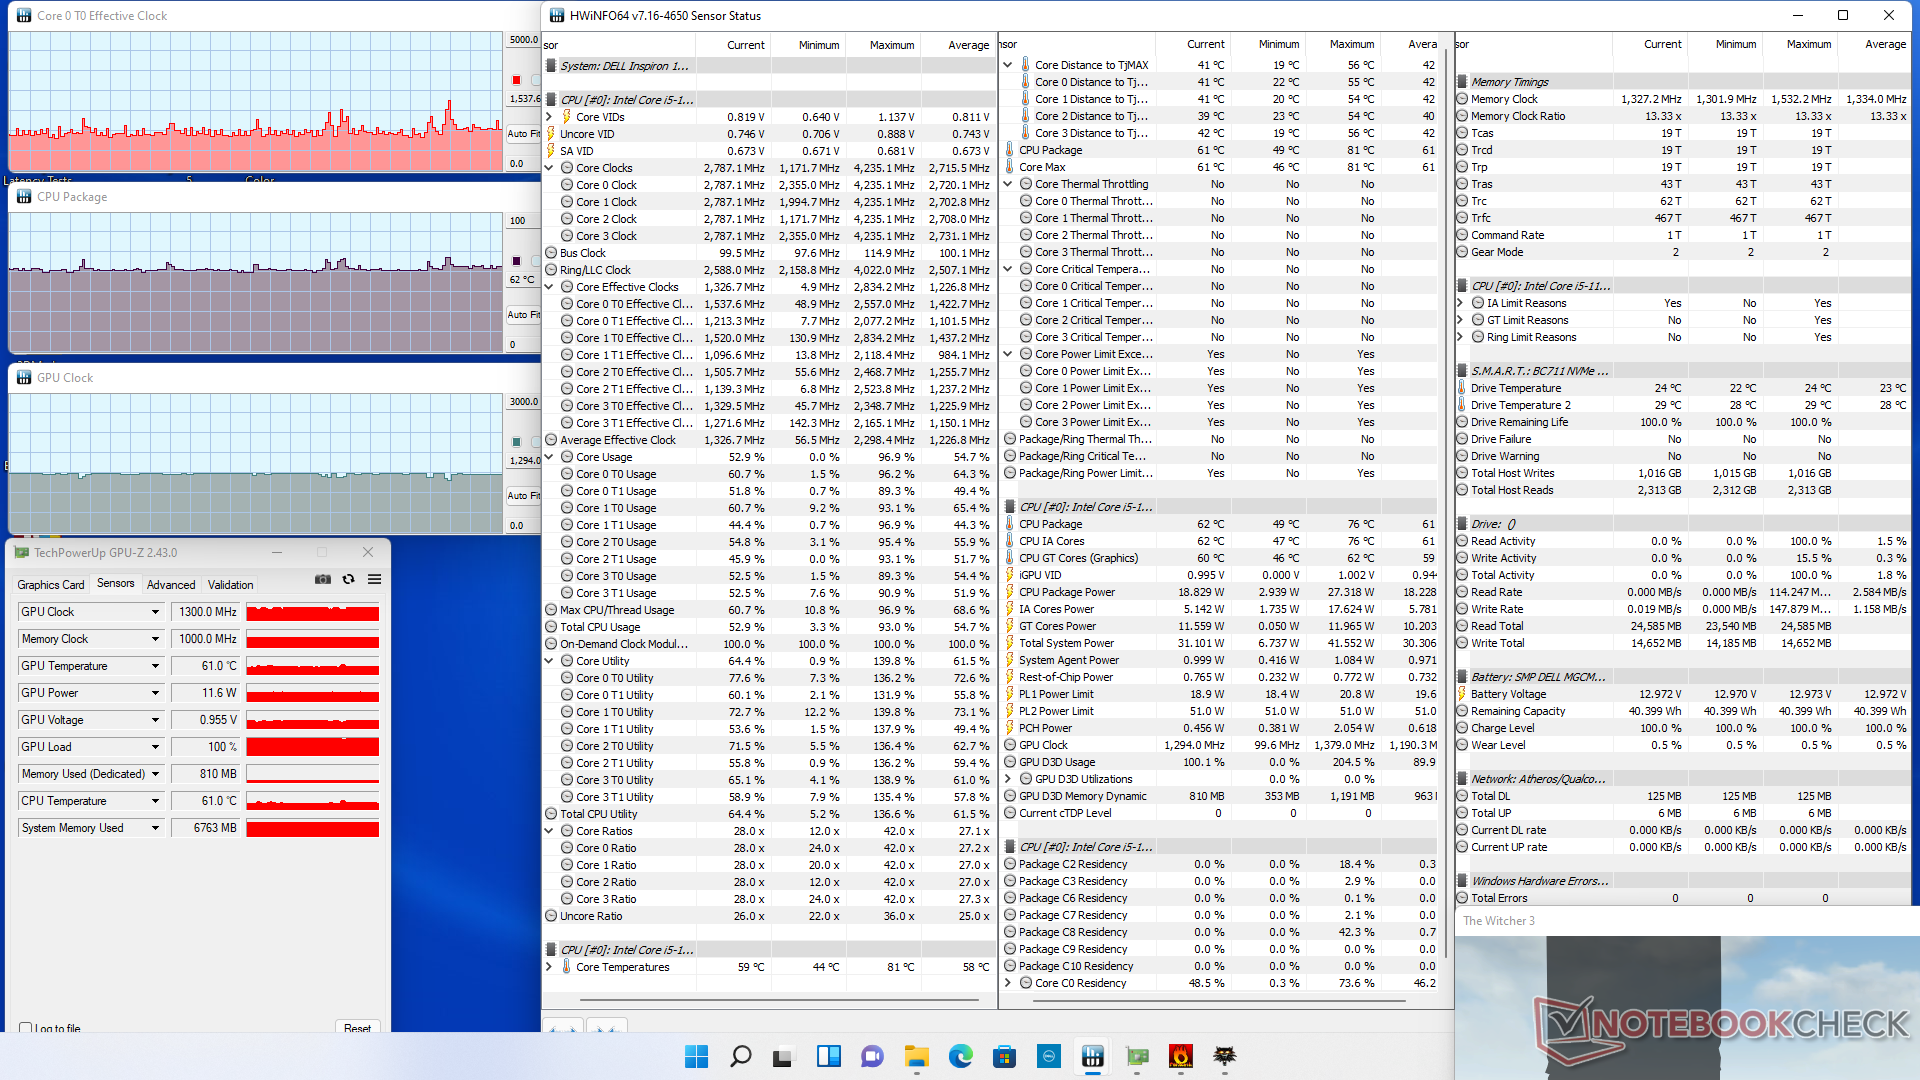
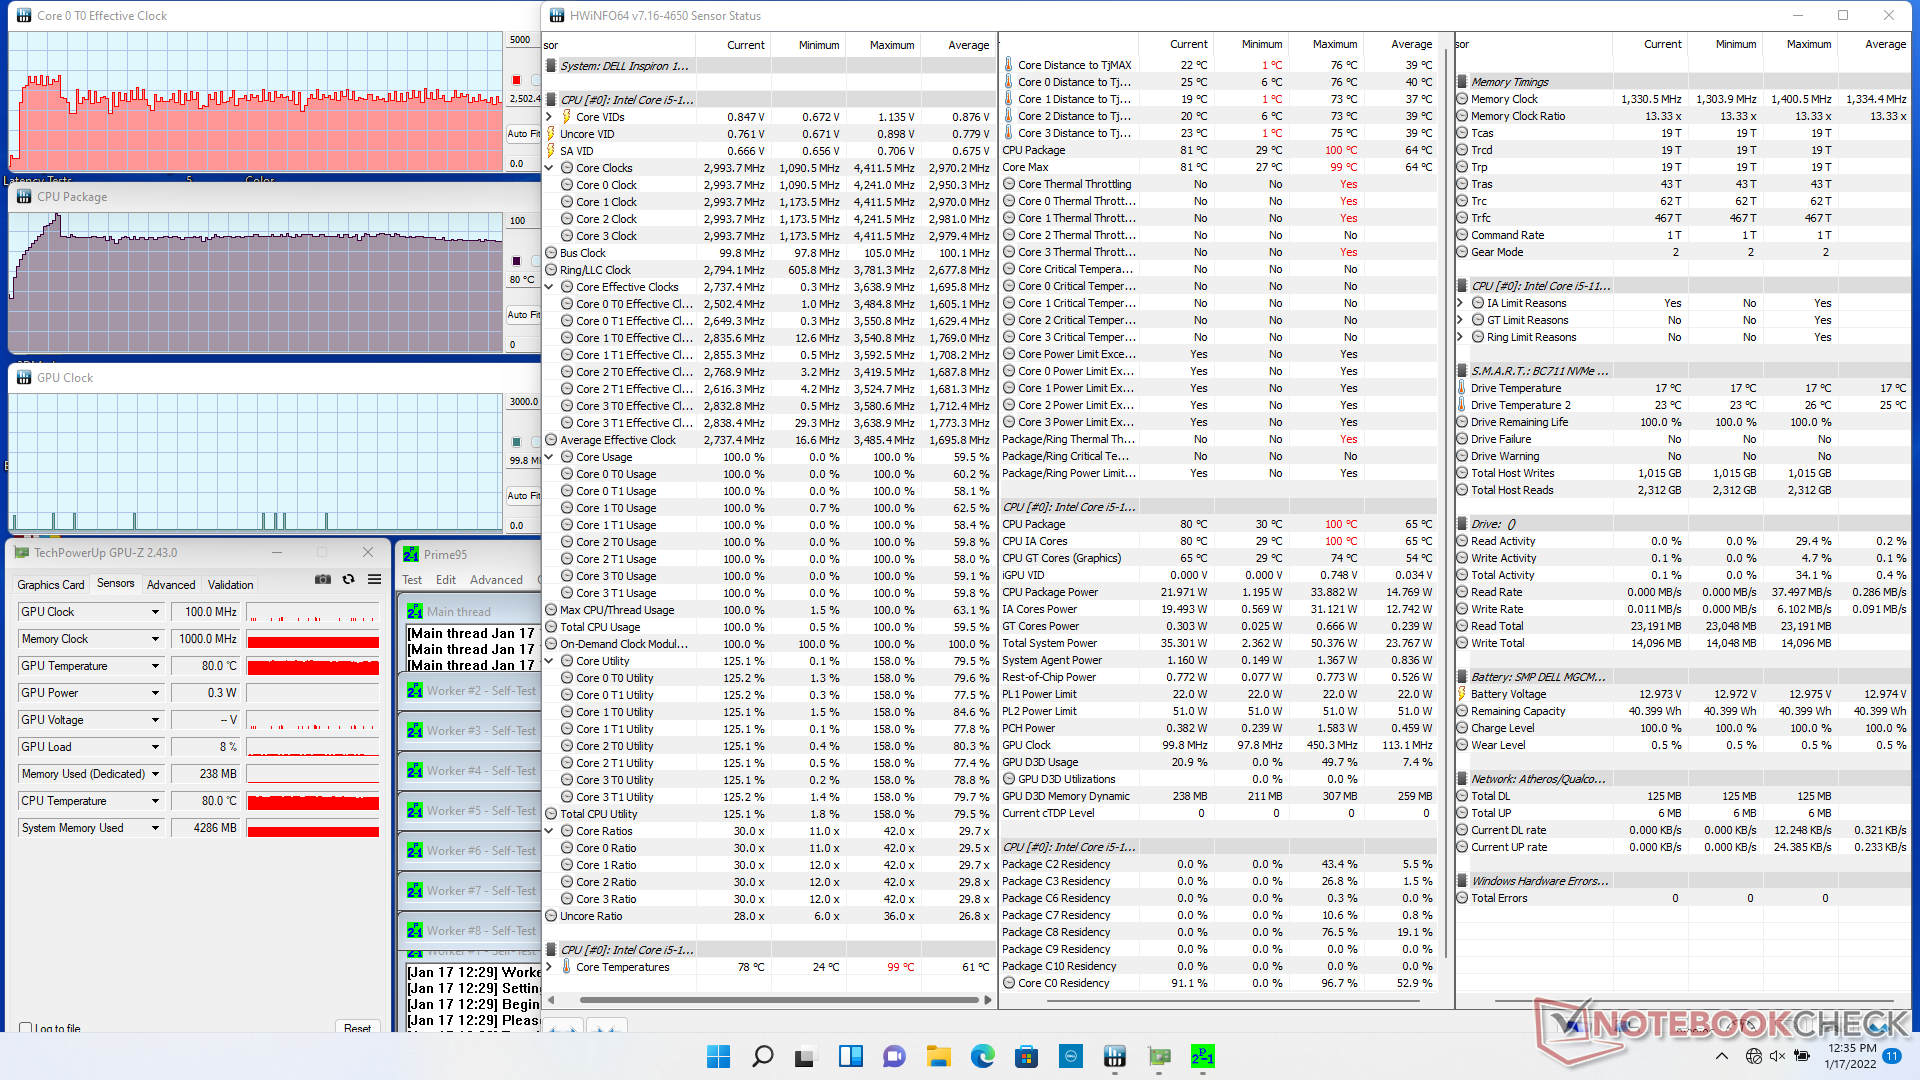
| CPU时钟(GHz) | GPU时钟(MHz) | CPU平均温度(°C) | |
| 系统空闲 | -- | -- | 35 |
| Prime95压力 | 2.5 - 2.8 | - | 80 |
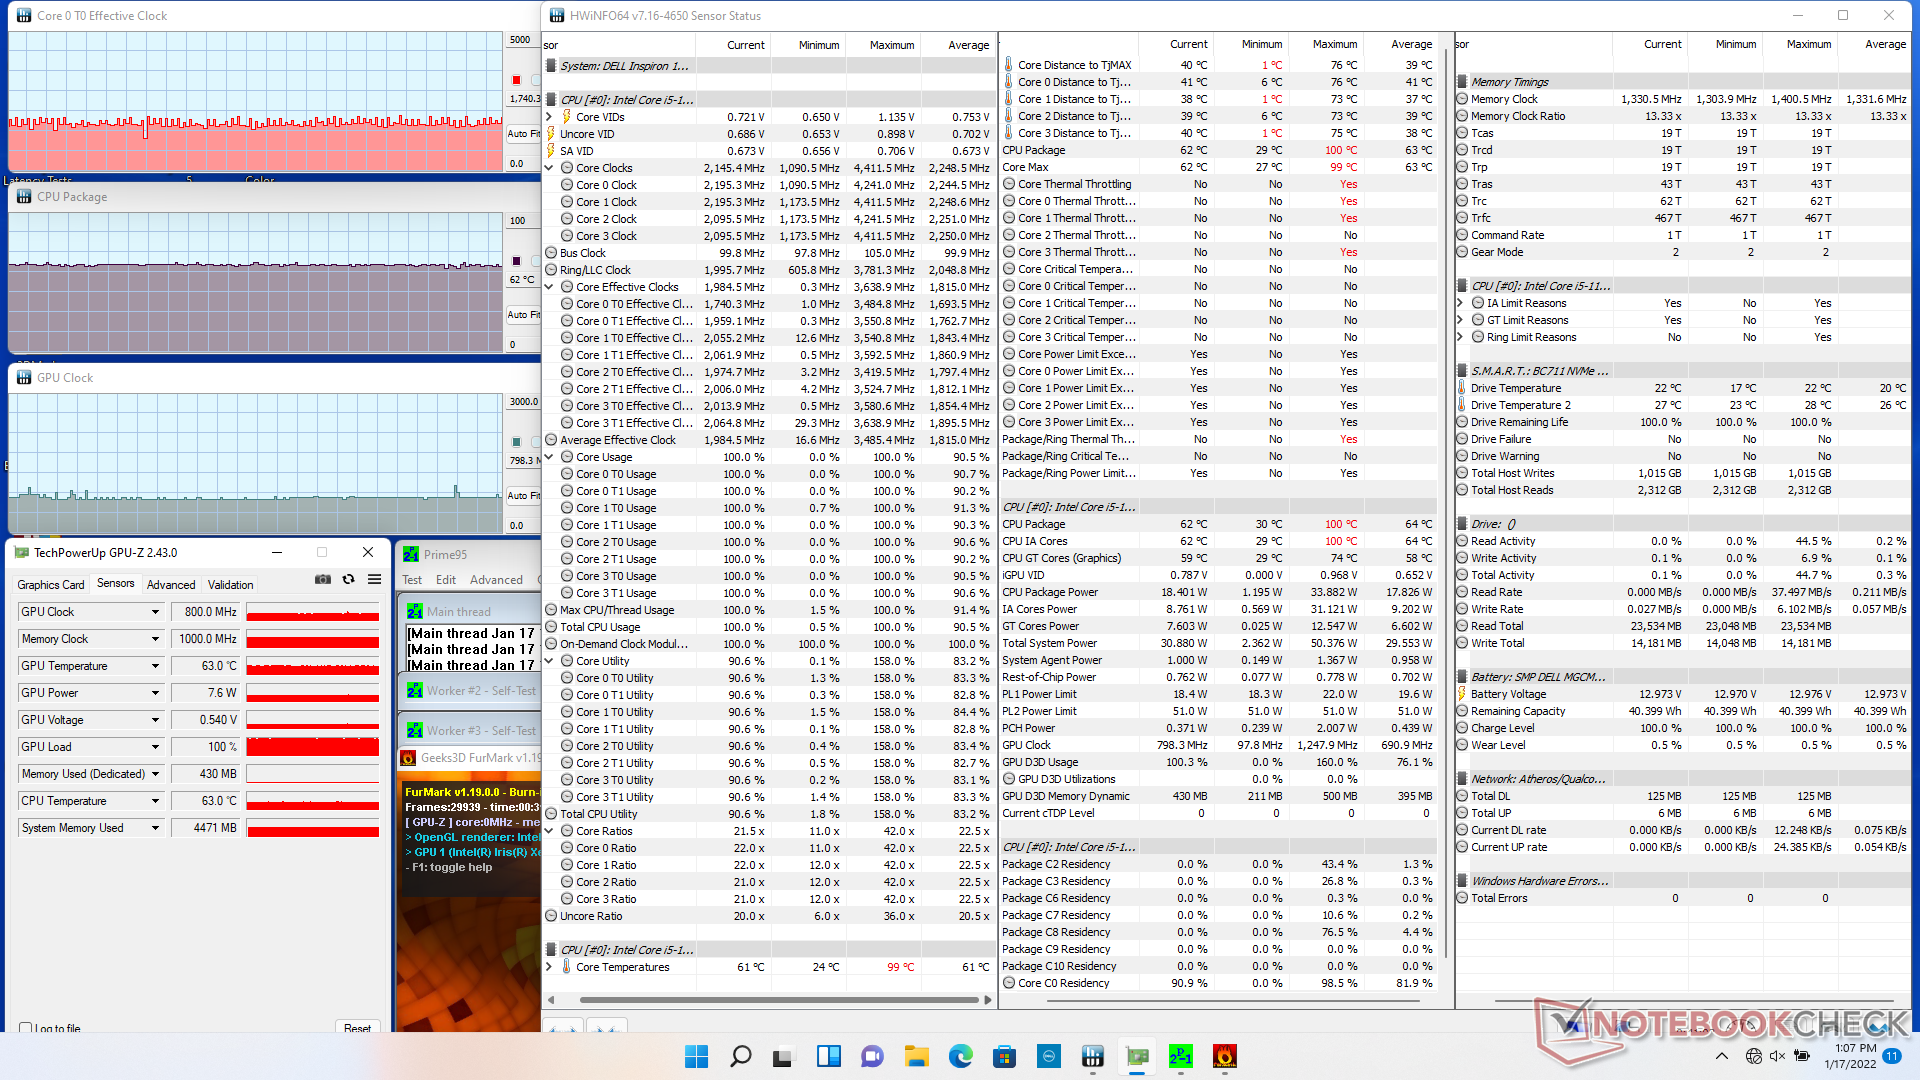
| Prime95 + FurMark压力 | 1.4 - 1.7 | 800 | 62 |
| Witcher 3 应力 | ~1.5 | 1300 | 62 |
发言人
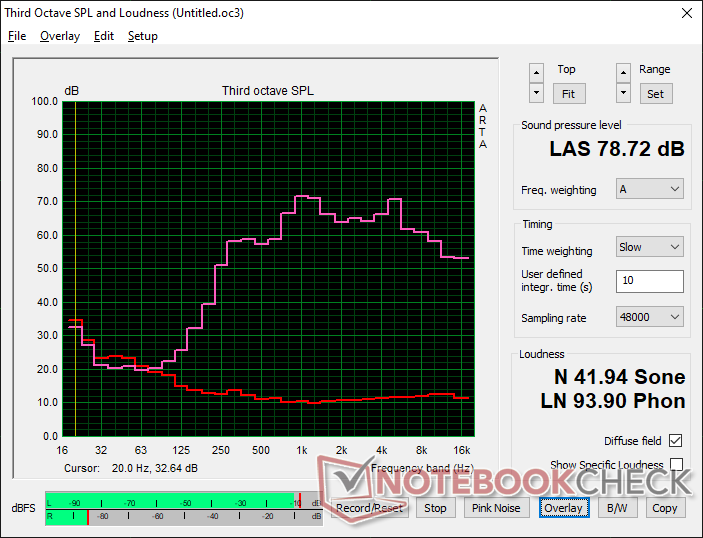
Dell Inspiron 15 3000 3511 audio analysis
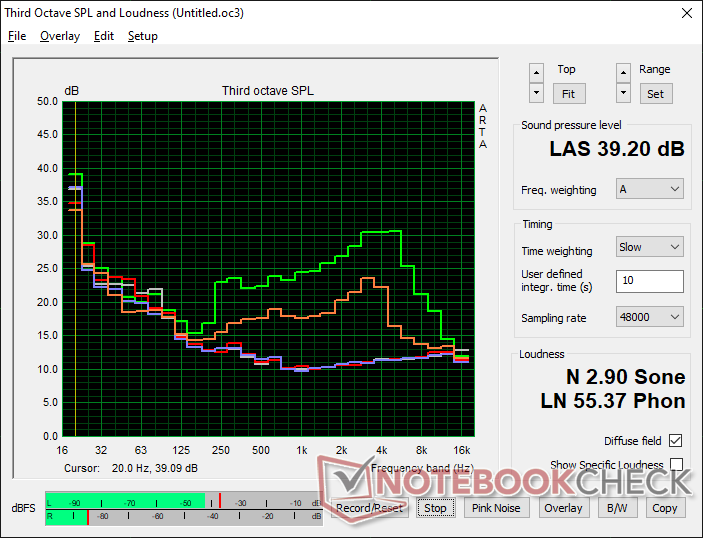
(±) | speaker loudness is average but good (78.7 dB)
Bass 100 - 315 Hz
(-) | nearly no bass - on average 20.8% lower than median
(±) | linearity of bass is average (13.3% delta to prev. frequency)
Mids 400 - 2000 Hz
(±) | higher mids - on average 5.8% higher than median
(+) | mids are linear (6.4% delta to prev. frequency)
Highs 2 - 16 kHz
(±) | higher highs - on average 5.2% higher than median
(+) | highs are linear (6.4% delta to prev. frequency)
Overall 100 - 16.000 Hz
(±) | linearity of overall sound is average (21.6% difference to median)
Compared to same class
» 55% of all tested devices in this class were better, 9% similar, 37% worse
» The best had a delta of 7%, average was 21%, worst was 53%
Compared to all devices tested
» 61% of all tested devices were better, 7% similar, 32% worse
» The best had a delta of 4%, average was 23%, worst was 134%
Apple MacBook Pro 16 2021 M1 Pro audio analysis
(+) | speakers can play relatively loud (84.7 dB)
Bass 100 - 315 Hz
(+) | good bass - only 3.8% away from median
(+) | bass is linear (5.2% delta to prev. frequency)
Mids 400 - 2000 Hz
(+) | balanced mids - only 1.3% away from median
(+) | mids are linear (2.1% delta to prev. frequency)
Highs 2 - 16 kHz
(+) | balanced highs - only 1.9% away from median
(+) | highs are linear (2.7% delta to prev. frequency)
Overall 100 - 16.000 Hz
(+) | overall sound is linear (4.6% difference to median)
Compared to same class
» 0% of all tested devices in this class were better, 0% similar, 100% worse
» The best had a delta of 5%, average was 17%, worst was 45%
Compared to all devices tested
» 0% of all tested devices were better, 0% similar, 100% worse
» The best had a delta of 4%, average was 23%, worst was 134%
能源管理
消耗功率
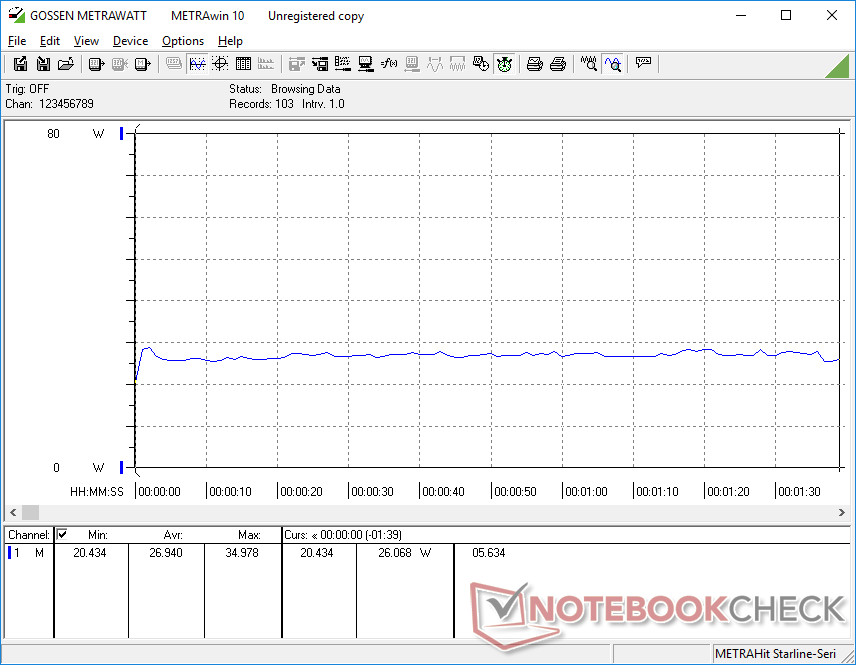
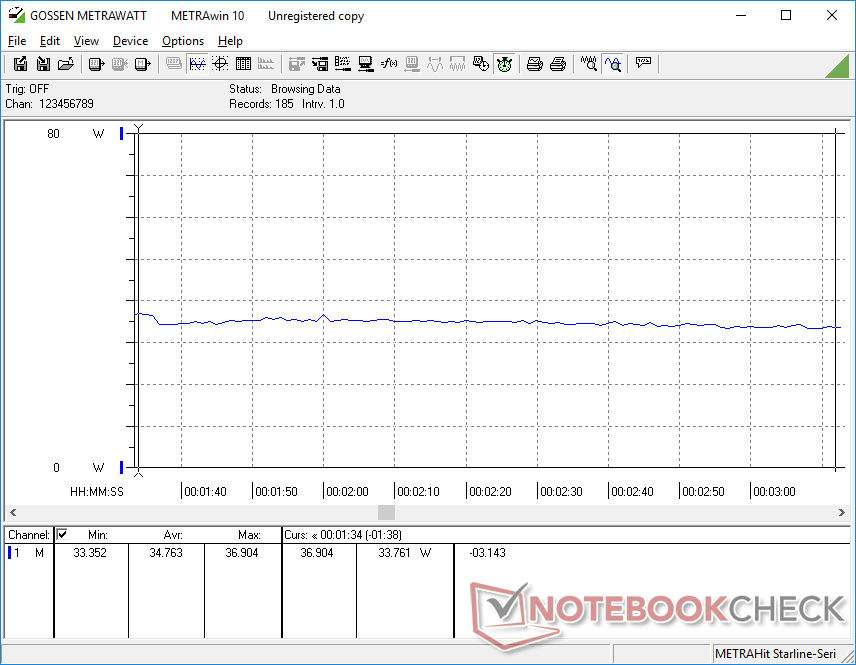
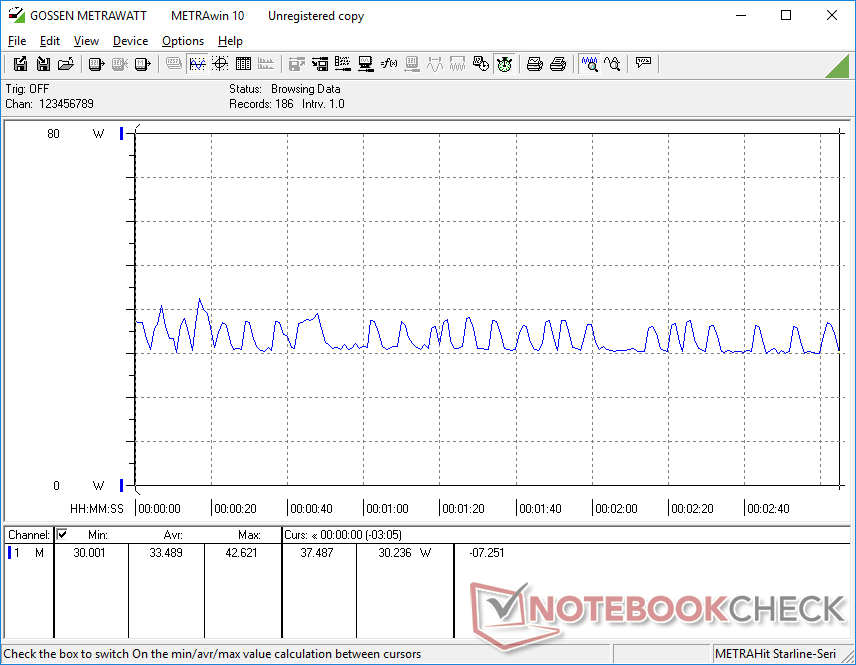
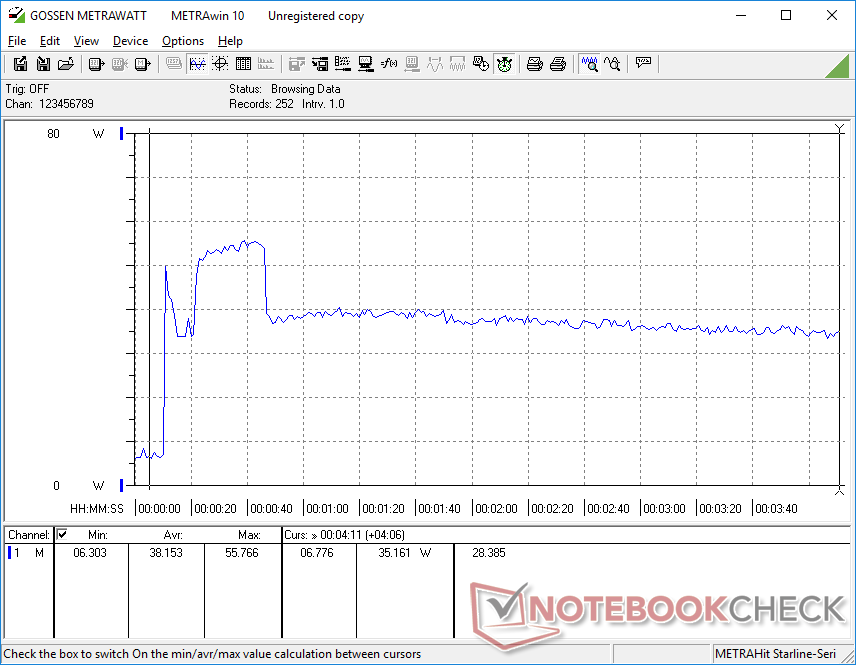
在桌面上空转的时候,相对于其他在U系列CPU上运行的15.6英寸笔记本电脑来说,其效率在3W到7W之间,比预期的要高。有趣的是,运行时的功耗并不稳定。 Witcher 3帧率稳定的情况下,系统会在30瓦和42瓦之间循环。
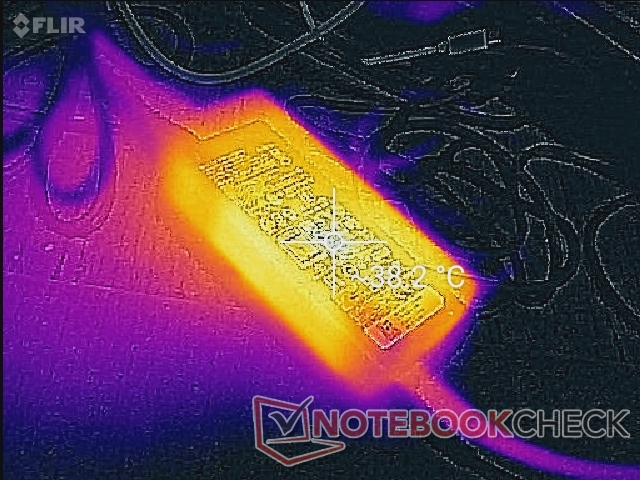
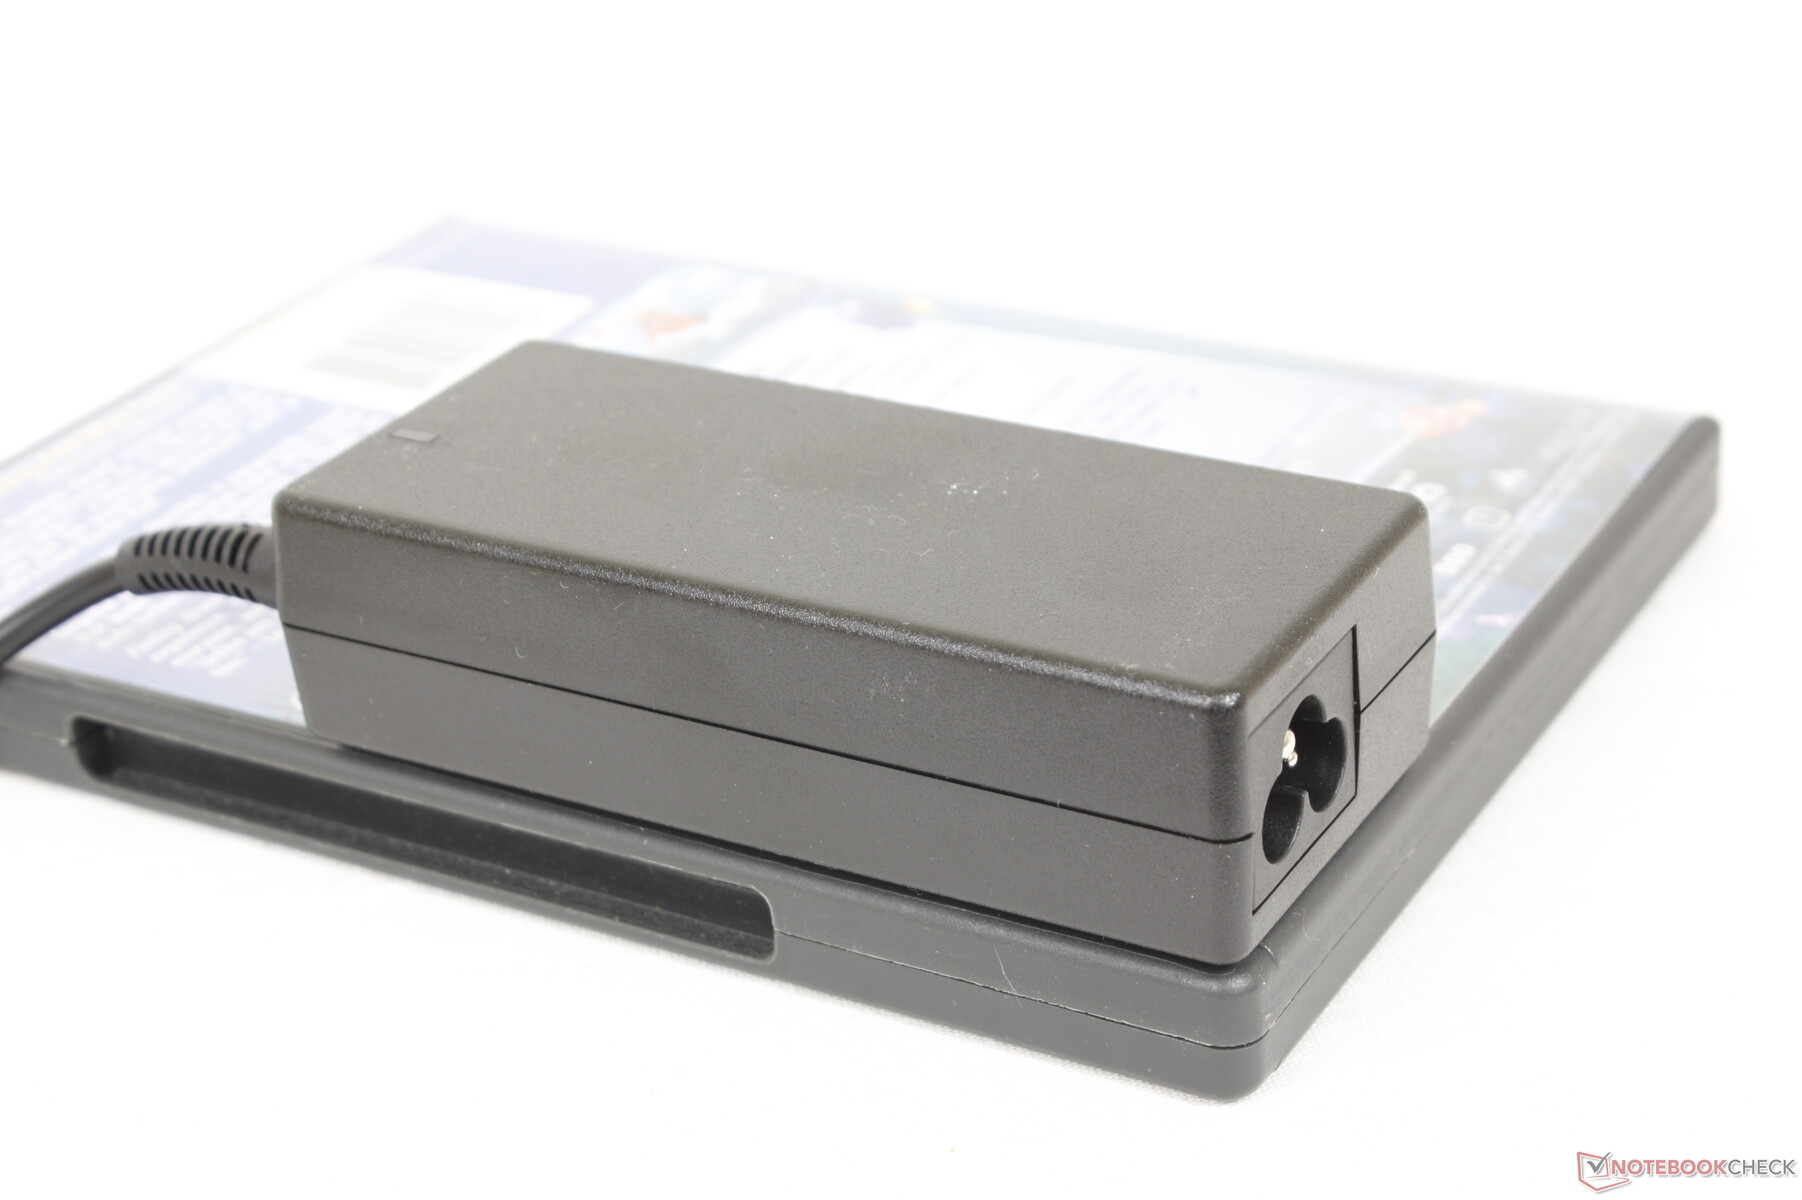
我们能够从小型(约10.6 x 4.5 x 2.8厘米)的65瓦交流适配器中记录到56瓦的最大功耗,当运行极端负载时,CPU达到100%的利用率。正如我们下面的图表所示,这种消耗只是暂时的。
| Off / Standby | |
| Idle | |
| Load |
|
Key:
min: | |
| Dell Inspiron 15 3000 3511 i5-1135G7, Iris Xe G7 80EUs, SK Hynix BC711 HFM256GD3GX013N, IPS, 1920x1080, 15.6" | Dell XPS 15 9510 i5 11400H FHD i5-11400H, UHD Graphics Xe 16EUs, Micron 2300 512GB MTFDHBA512TDV, IPS, 1920x1200, 15.6" | Asus VivoBook S15 D533UA R7 5700U, Vega 8, WDC PC SN530 SDBPNPZ-1T00, IPS, 1920x1080, 15.6" | Dell Inspiron 15 3501 i7-1165G7, Iris Xe G7 96EUs, Samsung PM991a MZ9LQ512HBLU-00BD1, IPS, 1920x1080, 15.6" | Lenovo IdeaPad 3 15ALC6 R3 5300U, Vega 6, Samsung PM991a MZALQ512HBLU, IPS, 1920x1080, 15.6" | HP Pavilion 15-eg i7-1165G7, GeForce MX450, Samsung PM991 MZVLQ1T0HALB, IPS, 1920x1080, 15.6" | |
|---|---|---|---|---|---|---|
| Power Consumption | -38% | -48% | -14% | -20% | -74% | |
| Idle Minimum * (Watt) | 3.1 | 5.3 -71% | 5 -61% | 3.6 -16% | 5.6 -81% | 4.9 -58% |
| Idle Average * (Watt) | 5.6 | 9 -61% | 7.7 -38% | 6.4 -14% | 6 -7% | 7.9 -41% |
| Idle Maximum * (Watt) | 6.4 | 9.7 -52% | 12.2 -91% | 7.9 -23% | 7 -9% | 14.2 -122% |
| Load Average * (Watt) | 26.9 | 30.3 -13% | 41 -52% | 39 -45% | 34.9 -30% | 64.3 -139% |
| Witcher 3 ultra * (Watt) | 33.5 | 30.6 9% | 43 -28% | 37.6 -12% | 32.5 3% | 55.6 -66% |
| Load Maximum * (Watt) | 55.8 | 76.2 -37% | 65 -16% | 41.8 25% | 52.1 7% | 65.4 -17% |
* ... smaller is better
Power Consumption Witcher 3 / Stresstest
Power Consumption external Monitor
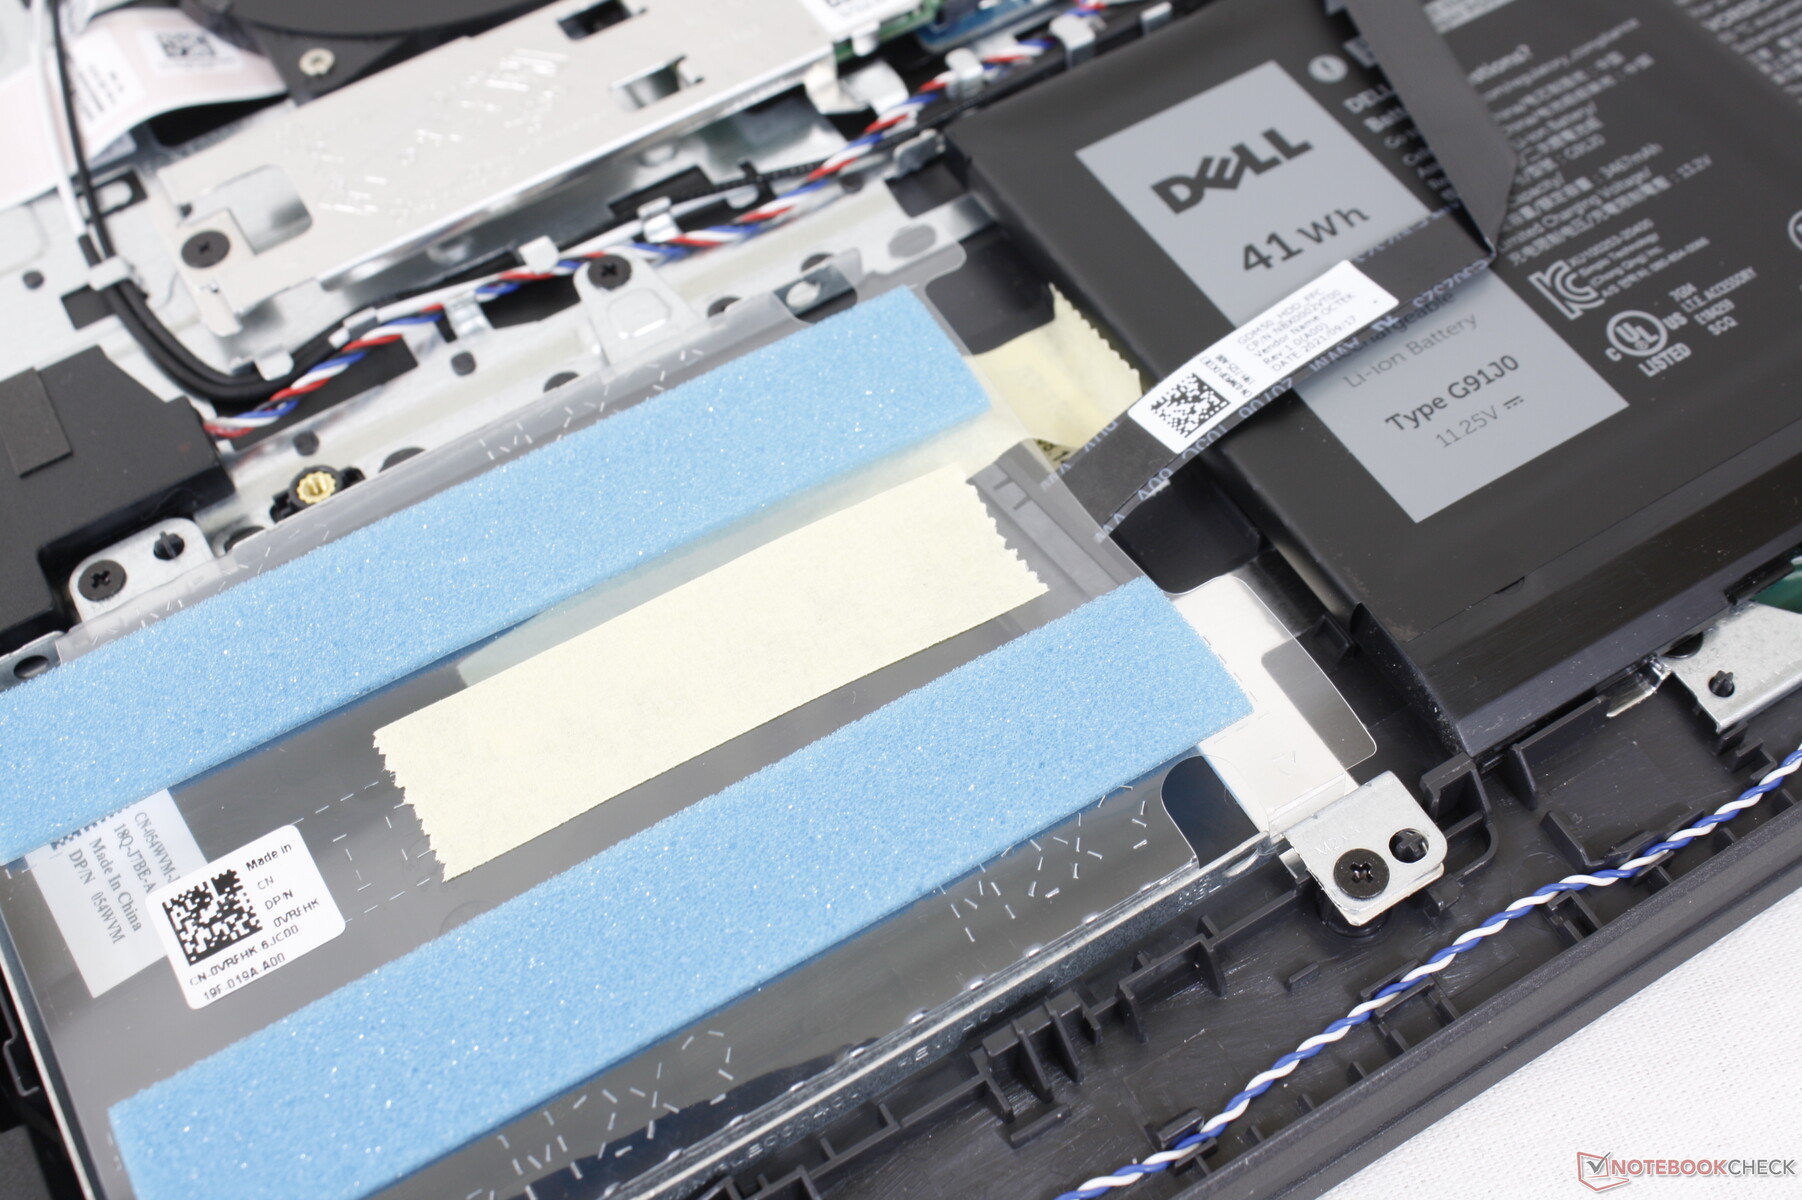
电池寿命
预计在需要为内部40Wh电池充电之前,实际使用WLAN的时间约为6.5小时。结果与惠普Pavilion 15-eg有一定的可比性,后者也配备了类似大小的电池。
使用随附的交流电适配器,从空电到满电大约需要2小时。
| Dell Inspiron 15 3000 3511 i5-1135G7, Iris Xe G7 80EUs, 40 Wh | Dell XPS 15 9510 i5 11400H FHD i5-11400H, UHD Graphics Xe 16EUs, 56 Wh | Asus VivoBook S15 D533UA R7 5700U, Vega 8, 50 Wh | Dell Inspiron 15 3501 i7-1165G7, Iris Xe G7 96EUs, 42 Wh | Lenovo IdeaPad 3 15ALC6 R3 5300U, Vega 6, 45 Wh | HP Pavilion 15-eg i7-1165G7, GeForce MX450, 41 Wh | |
|---|---|---|---|---|---|---|
| Battery runtime | 16% | 41% | 6% | 48% | 4% | |
| Reader / Idle (h) | 12.8 | 20.1 57% | 15 17% | |||
| WiFi v1.3 (h) | 6.4 | 7.4 16% | 9 41% | 6.8 6% | 10.5 64% | 6.6 3% |
| Load (h) | 1.3 | 1.6 23% | 1.2 -8% |
Pros
Cons
判决书
我们最喜欢Inspiron 15 3511的一点是它很容易维修。价格低廉的机型往往通过使其底板难以拆卸或在橡胶脚下隐藏螺丝来阻止终端用户的升级。我们的Inspiron有2个SODIMM插槽和2个存储槽,这意味着用户可以简单地购买低端配置,然后自己增加内存或存储,以节省成本。特别是我们的测试设备上的单通道内存对Iris Xe的图形性能影响很大,因此强烈建议添加另一个模块来提高GPU性能。
风扇噪音,或者说缺乏噪音,是另一个值得称赞的方面。该系统能够比大多数其他超极本保持更长时间的安静,即使在运行更苛刻的负载时也是如此。请记住,该机型使用的是与XPS 13系列相同的第11代酷睿i5和酷睿i7处理器,零售价是其两倍。
Th Inspiron 15 3511也许是最容易维修和升级的预算笔记本电脑之一。每美元的性能很高,但你必须克服不那么出色的机箱设计。
该系统的其他几乎所有东西都很平庸,包括浅色、海绵状的键盘按键和廉价的机箱感觉。这些缺点对于一个预算模型来说通常是可以原谅的,但我们仍然发现,当这些天几乎所有其他消费类笔记本电脑都包括一个USB-C端口时,没有看到USB-C端口是令人难以置信的。
价格和可用性
Dell Inspiron 15 3000 3511
- 01/20/2022 v7 (old)
Allen Ngo
Price comparison

