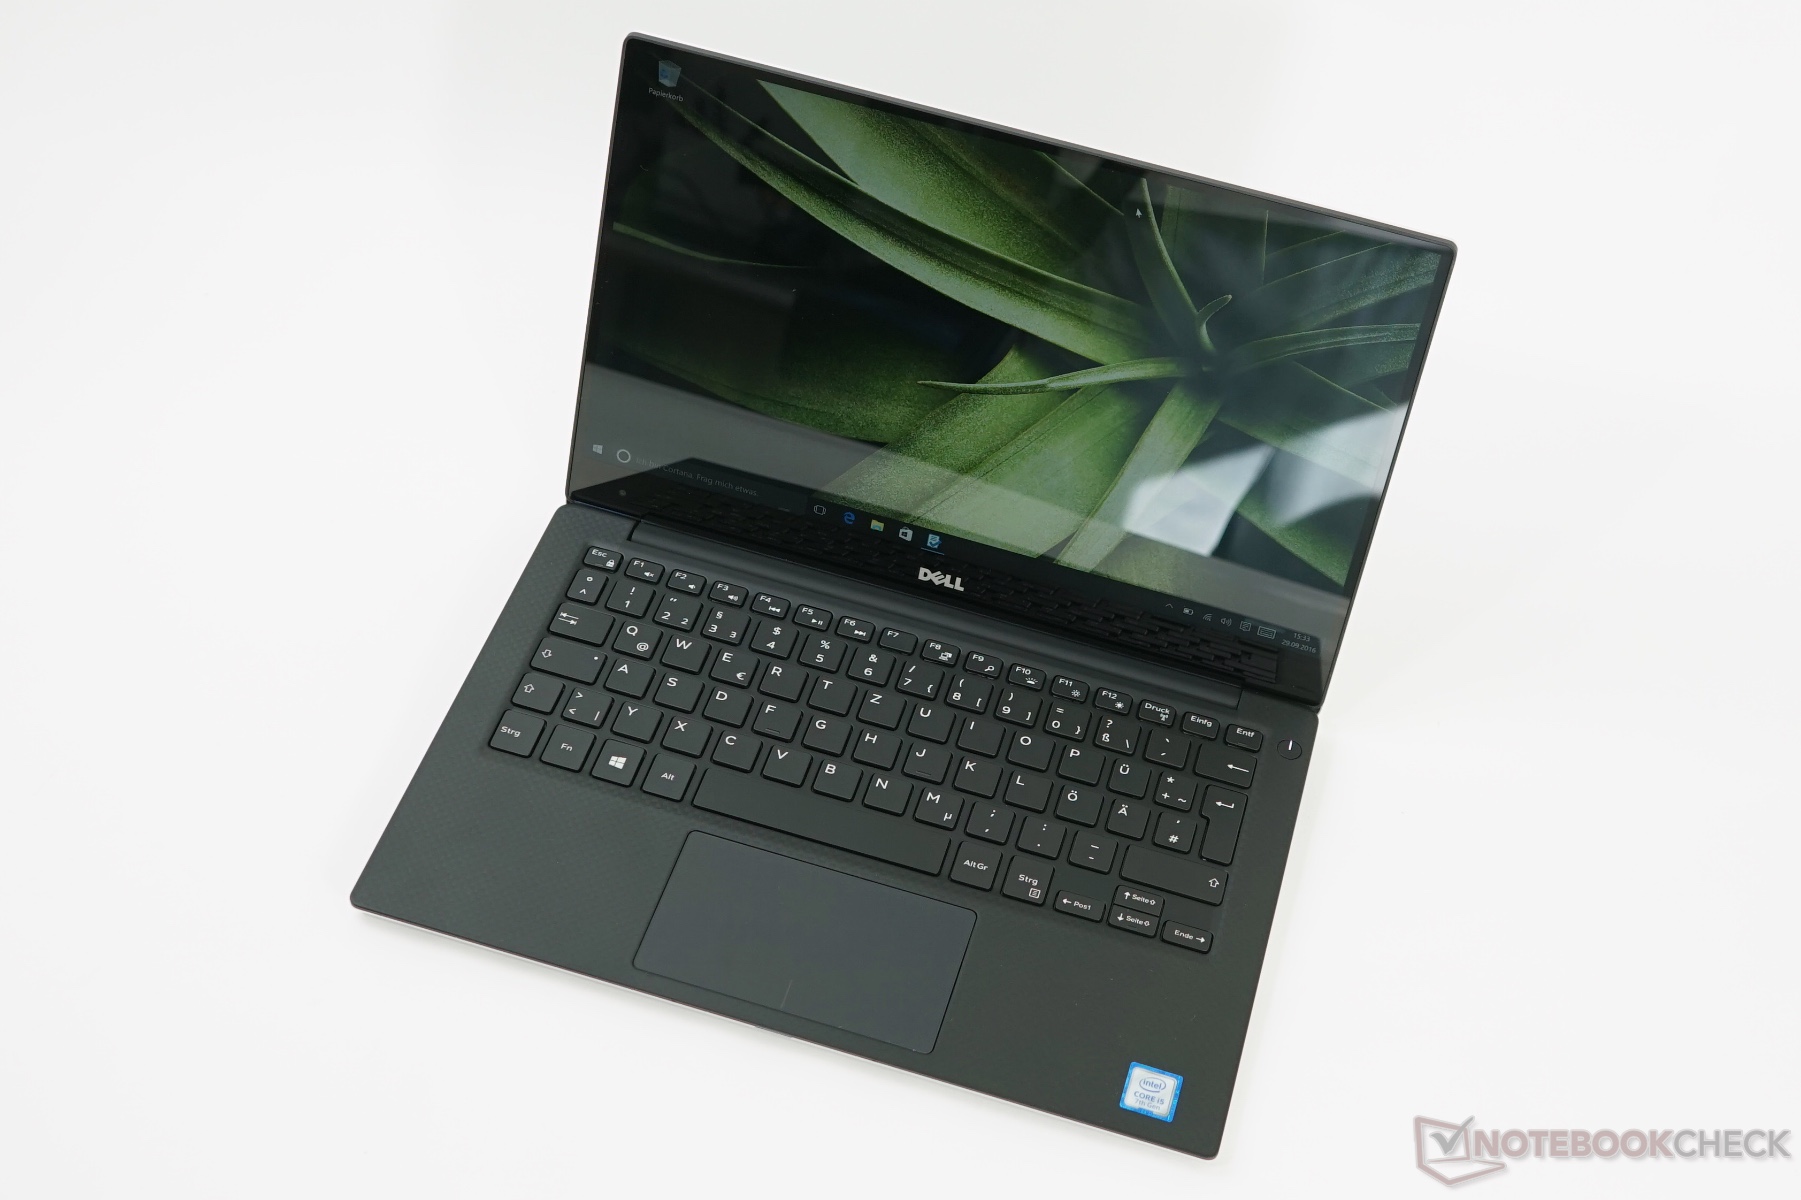
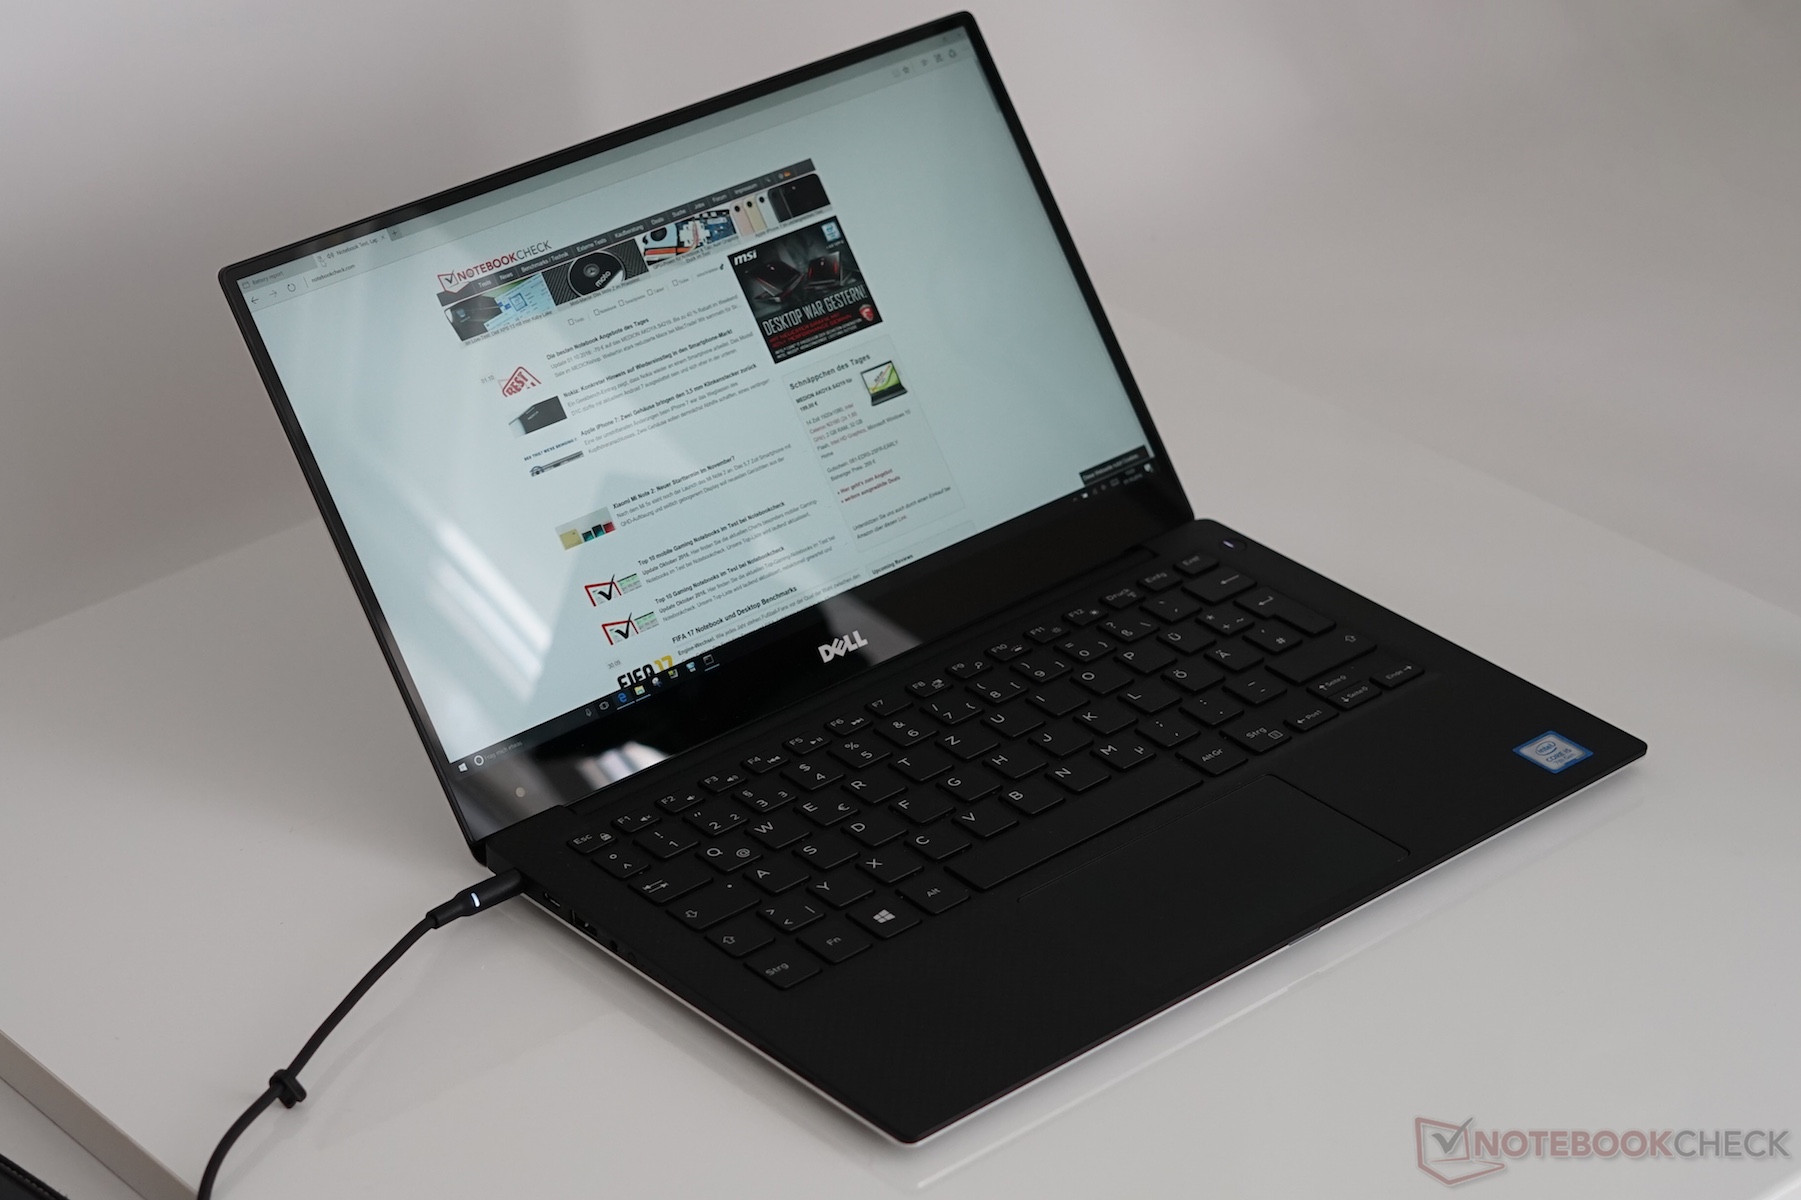
戴尔 XPS 13 9360 QHD+ i5-7200U 笔记本电脑简短评测
| Networking | |
| iperf3 receive AX12 | |
| Apple MacBook Pro Retina 13 inch 2013-10 (Klaus I211) | |
| Dell XPS 13 9360 QHD+ i5 | |
| MSI GT72S-6QEG16SR421BW (Klaus I211) | |
| Lenovo ThinkPad T460s-20FA003GGE | |
| Microsoft Surface Pro 4, Core i5, 128GB (Klaus I211) | |
| Intel NUC5i5RYH (Klaus I211) | |
| MSI PE60 2QD | |
| iperf3 transmit AX12 | |
| Apple MacBook Pro Retina 13 inch 2013-10 (Klaus I211) | |
| Dell XPS 13 9360 QHD+ i5 | |
| MSI GT72S-6QEG16SR421BW (Klaus I211) | |
| Microsoft Surface Pro 4, Core i5, 128GB (Klaus I211) | |
| Intel NUC5i5RYH (Klaus I211) | |
| Lenovo ThinkPad T460s-20FA003GGE | |
| MSI PE60 2QD | |

| |||||||||||||||||||||||||
Brightness Distribution: 82 %
Center on Battery: 444 cd/m²
Contrast: 1345:1 (Black: 0.33 cd/m²)
ΔE ColorChecker Calman: 4 | ∀{0.5-29.43 Ø4.71}
ΔE Greyscale Calman: 2.83 | ∀{0.09-98 Ø4.96}
91.4% sRGB (Argyll 1.6.3 3D)
59.3% AdobeRGB 1998 (Argyll 1.6.3 3D)
66.5% AdobeRGB 1998 (Argyll 3D)
91.6% sRGB (Argyll 3D)
64.6% Display P3 (Argyll 3D)
Gamma: 2.05
CCT: 6963 K
Display Response Times
| ↔ Response Time Black to White | ||
|---|---|---|
| 31.2 ms ... rise ↗ and fall ↘ combined | ↗ 10.8 ms rise | 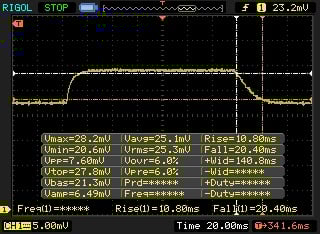 |
| ↘ 20.4 ms fall | ||
| The screen shows slow response rates in our tests and will be unsatisfactory for gamers. In comparison, all tested devices range from 0.1 (minimum) to 240 (maximum) ms. » 84 % of all devices are better. This means that the measured response time is worse than the average of all tested devices (19.8 ms). | ||
| ↔ Response Time 50% Grey to 80% Grey | ||
| 31 ms ... rise ↗ and fall ↘ combined | ↗ 13 ms rise | 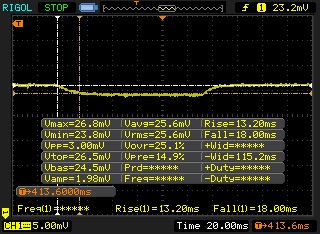 |
| ↘ 18 ms fall | ||
| The screen shows slow response rates in our tests and will be unsatisfactory for gamers. In comparison, all tested devices range from 0.165 (minimum) to 636 (maximum) ms. » 42 % of all devices are better. This means that the measured response time is similar to the average of all tested devices (30.9 ms). | ||
Screen Flickering / PWM (Pulse-Width Modulation)
| Screen flickering / PWM not detected | 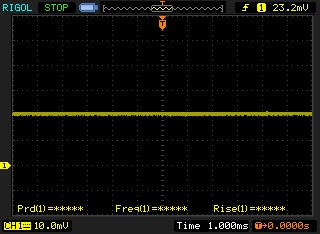 | ||
In comparison: 52 % of all tested devices do not use PWM to dim the display. If PWM was detected, an average of 7748 (minimum: 5 - maximum: 343500) Hz was measured. | |||
| PCMark 8 Home Score Accelerated v2 | 2761 points | |
Help | ||

| 3DMark 11 - 1280x720 Performance GPU | |
| Dell XPS 13 2016 9350 (FHD, i7-6560U) | |
| MSI CX72-7QL | |
| Dell XPS 13 9360 QHD+ i5 | |
| HP Spectre 13 | |
| Acer Aspire S 13 S5-371-71QZ | |
| Dell XPS 13-9350 | |
| 3DMark 2001SE Standard | 67477 points | |
| 3DMark 11 Performance | 1683 points | |
| 3DMark Cloud Gate Standard Score | 5778 points | |
| 3DMark Fire Strike Score | 848 points | |
Help | ||
| low | med. | high | ultra | |
|---|---|---|---|---|
| World of Warcraft (2005) | 48 | 10.1 | ||
| Diablo III (2012) | 30 | 28.6 | ||
| BioShock Infinite (2013) | 50.5 | 30.3 | 25.5 | 8.2 |
| The Witcher 3 (2015) | 12.7 | |||
| World of Warships (2015) | 58 | 39.7 | 20.5 | |
| Rainbow Six Siege (2015) | 35.6 | 22.4 | 12.1 | |
| Rise of the Tomb Raider (2016) | 17.4 | |||
| Far Cry Primal (2016) | 16 | 8 | ||
| Overwatch (2016) | 40.1 | 30 | 13.9 |
Noise level
| Idle |
| 30.6 / 30.6 / 32.2 dB(A) |
| Load |
| 32.2 / 38.5 dB(A) |
 | ||
30 dB silent 40 dB(A) audible 50 dB(A) loud |
||
min: | ||
(±) The maximum temperature on the upper side is 40 °C / 104 F, compared to the average of 35.9 °C / 97 F, ranging from 21.4 to 59 °C for the class Subnotebook.
(±) The bottom heats up to a maximum of 42 °C / 108 F, compared to the average of 39.2 °C / 103 F
(+) In idle usage, the average temperature for the upper side is 26.2 °C / 79 F, compared to the device average of 30.8 °C / 87 F.
(+) The palmrests and touchpad are cooler than skin temperature with a maximum of 30 °C / 86 F and are therefore cool to the touch.
(±) The average temperature of the palmrest area of similar devices was 28.2 °C / 82.8 F (-1.8 °C / -3.2 F).
| Dell XPS 13 9360 (7200U) | Dell XPS 13 9350 (6200U) | Dell XPS 13 9350 (6560U) | Acer Aspire S 13 S5-371-71QZ | Lenovo IdeaPad 710S-13ISK | |
|---|---|---|---|---|---|
| Heat | -8% | -16% | 1% | -7% | |
| Maximum Upper Side * (°C) | 40 | 45.2 -13% | 45 -13% | 38.5 4% | 42 -5% |
| Maximum Bottom * (°C) | 42 | 45.2 -8% | 50 -19% | 47.7 -14% | 37.5 11% |
| Idle Upper Side * (°C) | 28 | 30.4 -9% | 27.2 3% | 34.8 -24% | |
| Idle Bottom * (°C) | 31 | 31.2 -1% | 27.4 12% | 33.4 -8% |
* ... smaller is better
Dell XPS 13 9360 QHD+ i5 audio analysis
(±) | speaker loudness is average but good (79.4 dB)
Bass 100 - 315 Hz
(±) | reduced bass - on average 9.5% lower than median
(±) | linearity of bass is average (14% delta to prev. frequency)
Mids 400 - 2000 Hz
(+) | balanced mids - only 4.5% away from median
(+) | mids are linear (5% delta to prev. frequency)
Highs 2 - 16 kHz
(+) | balanced highs - only 2.9% away from median
(±) | linearity of highs is average (11% delta to prev. frequency)
Overall 100 - 16.000 Hz
(±) | linearity of overall sound is average (15.1% difference to median)
Compared to same class
» 33% of all tested devices in this class were better, 5% similar, 61% worse
» The best had a delta of 5%, average was 18%, worst was 53%
Compared to all devices tested
» 21% of all tested devices were better, 4% similar, 75% worse
» The best had a delta of 4%, average was 23%, worst was 134%
Apple MacBook 12 (Early 2016) 1.1 GHz audio analysis
(+) | speakers can play relatively loud (83.6 dB)
Bass 100 - 315 Hz
(±) | reduced bass - on average 11.3% lower than median
(±) | linearity of bass is average (14.2% delta to prev. frequency)
Mids 400 - 2000 Hz
(+) | balanced mids - only 2.4% away from median
(+) | mids are linear (5.5% delta to prev. frequency)
Highs 2 - 16 kHz
(+) | balanced highs - only 2% away from median
(+) | highs are linear (4.5% delta to prev. frequency)
Overall 100 - 16.000 Hz
(+) | overall sound is linear (10.2% difference to median)
Compared to same class
» 7% of all tested devices in this class were better, 2% similar, 90% worse
» The best had a delta of 5%, average was 18%, worst was 53%
Compared to all devices tested
» 5% of all tested devices were better, 1% similar, 94% worse
» The best had a delta of 4%, average was 23%, worst was 134%
Dell XPS 13 2016 9350 (FHD, i7-6560U) audio analysis
(+) | speakers can play relatively loud (83.8 dB)
Bass 100 - 315 Hz
(-) | nearly no bass - on average 19.4% lower than median
(-) | bass is not linear (15.4% delta to prev. frequency)
Mids 400 - 2000 Hz
(+) | balanced mids - only 4.7% away from median
(±) | linearity of mids is average (9.1% delta to prev. frequency)
Highs 2 - 16 kHz
(+) | balanced highs - only 3.5% away from median
(±) | linearity of highs is average (7.6% delta to prev. frequency)
Overall 100 - 16.000 Hz
(±) | linearity of overall sound is average (18.8% difference to median)
Compared to same class
» 57% of all tested devices in this class were better, 7% similar, 37% worse
» The best had a delta of 5%, average was 18%, worst was 53%
Compared to all devices tested
» 43% of all tested devices were better, 8% similar, 49% worse
» The best had a delta of 4%, average was 23%, worst was 134%
| Off / Standby | |
| Idle | |
| Load |
|
Key:
min: | |
| Dell XPS 13 9360 QHD+ i5 i5-7200U, 3200x1800, 60 Wh | Dell XPS 13 2016 9350 (FHD, i7-6560U) 6560U, 1920x1080, 56 Wh | Asus Zenbook UX302LA-C4003H 4200U, 1920x1080, 50 Wh | Acer Aspire S 13 S5-371-71QZ 6500U, 1920x1080, 45 Wh | HP Spectre 13 6500U, 1920x1080, 38 Wh | Microsoft Surface Pro 4, Core i5, 128GB 6300U, 2736x1824, 38 Wh | Apple MacBook Pro Retina 13 inch 2015-03 5257U, 2560x1600, 75 Wh | |
|---|---|---|---|---|---|---|---|
| Battery runtime | -7% | -26% | -18% | -40% | -18% | -7% | |
| H.264 (h) | 9.1 | 9.7 7% | |||||
| WiFi v1.3 (h) | 8.8 | 7.3 -17% | 7.9 -10% | 5.6 -36% | 7.1 -19% | 9 2% | |
| Load (h) | 2.3 | 2.4 4% | 1.7 -26% | 1.7 -26% | 1.3 -43% | 1.9 -17% | 1.6 -30% |
| Reader / Idle (h) | 15.7 | 11.8 | 17.1 | 11.9 | 15 | 28.2 | |
| WiFi (h) | 5.6 |
Verdict
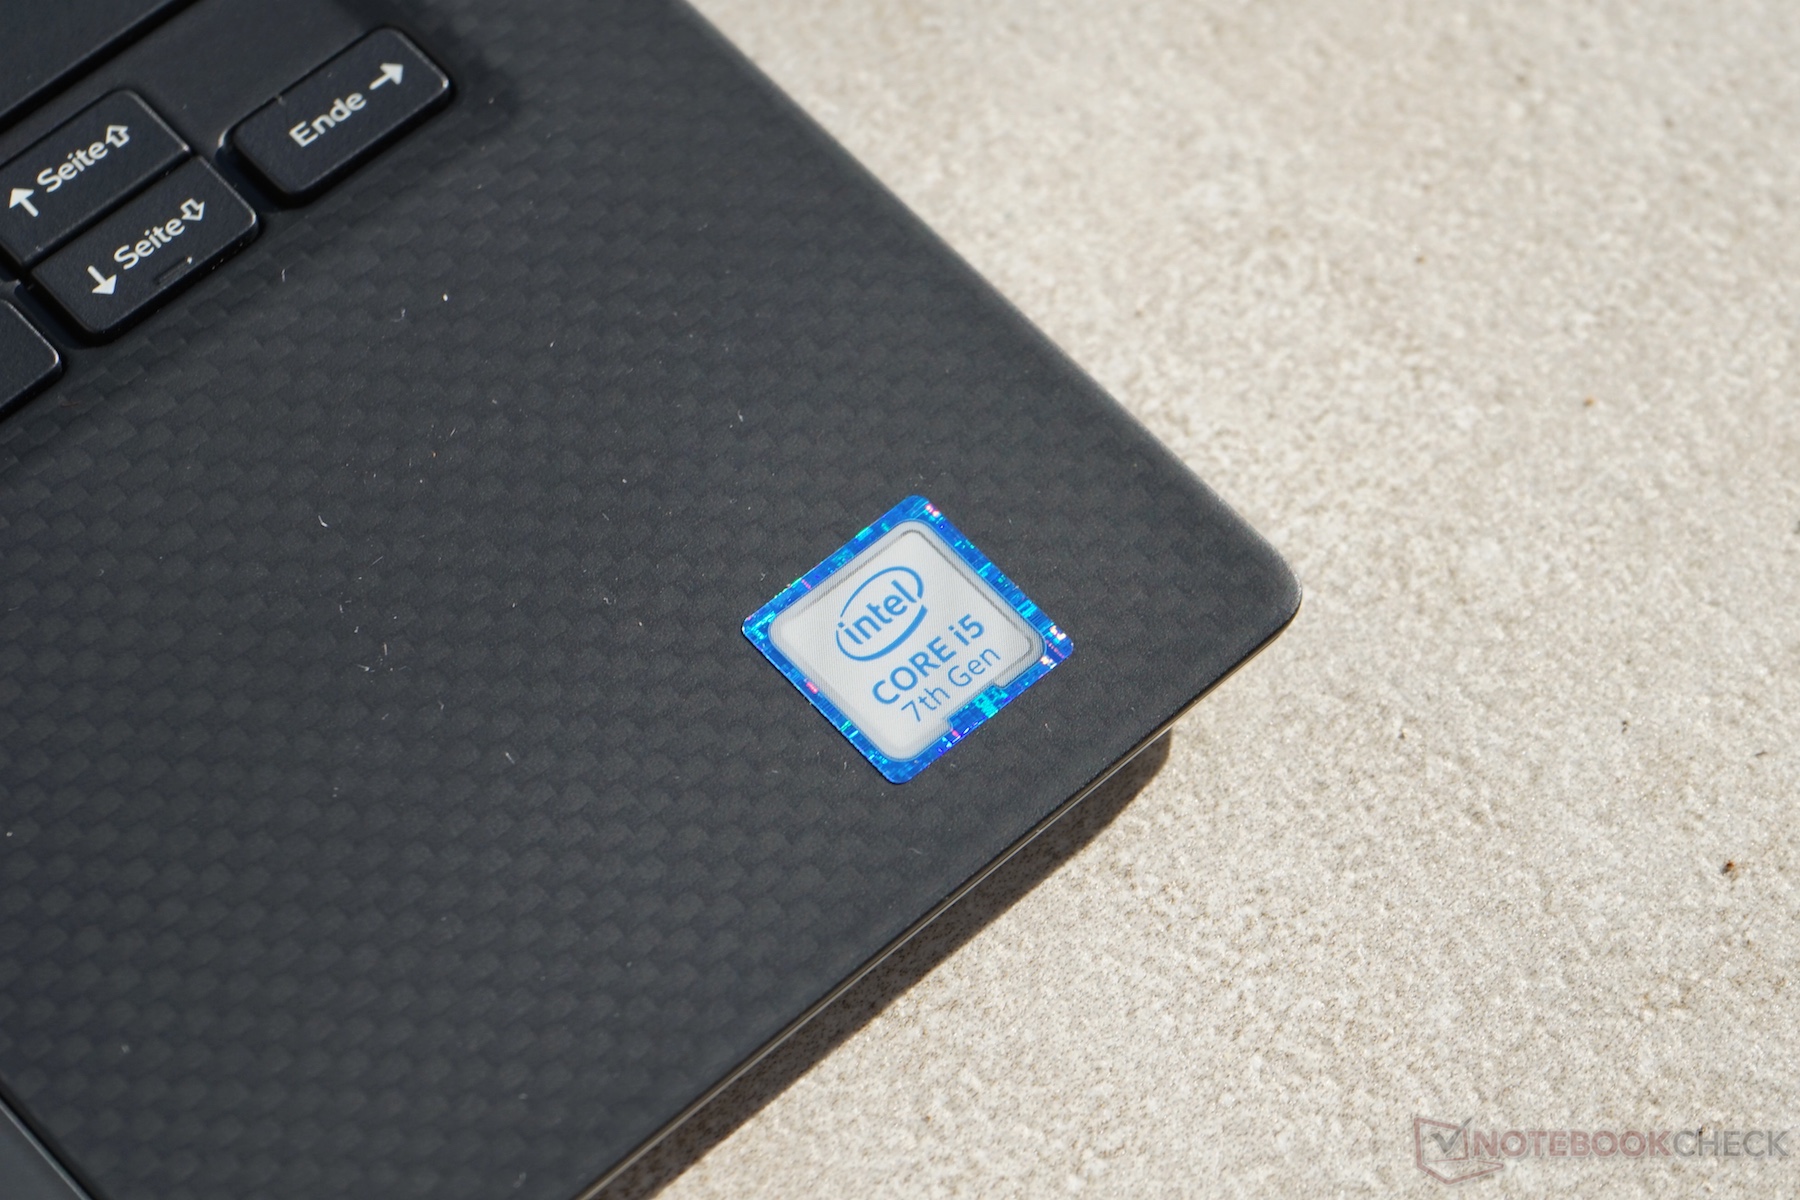
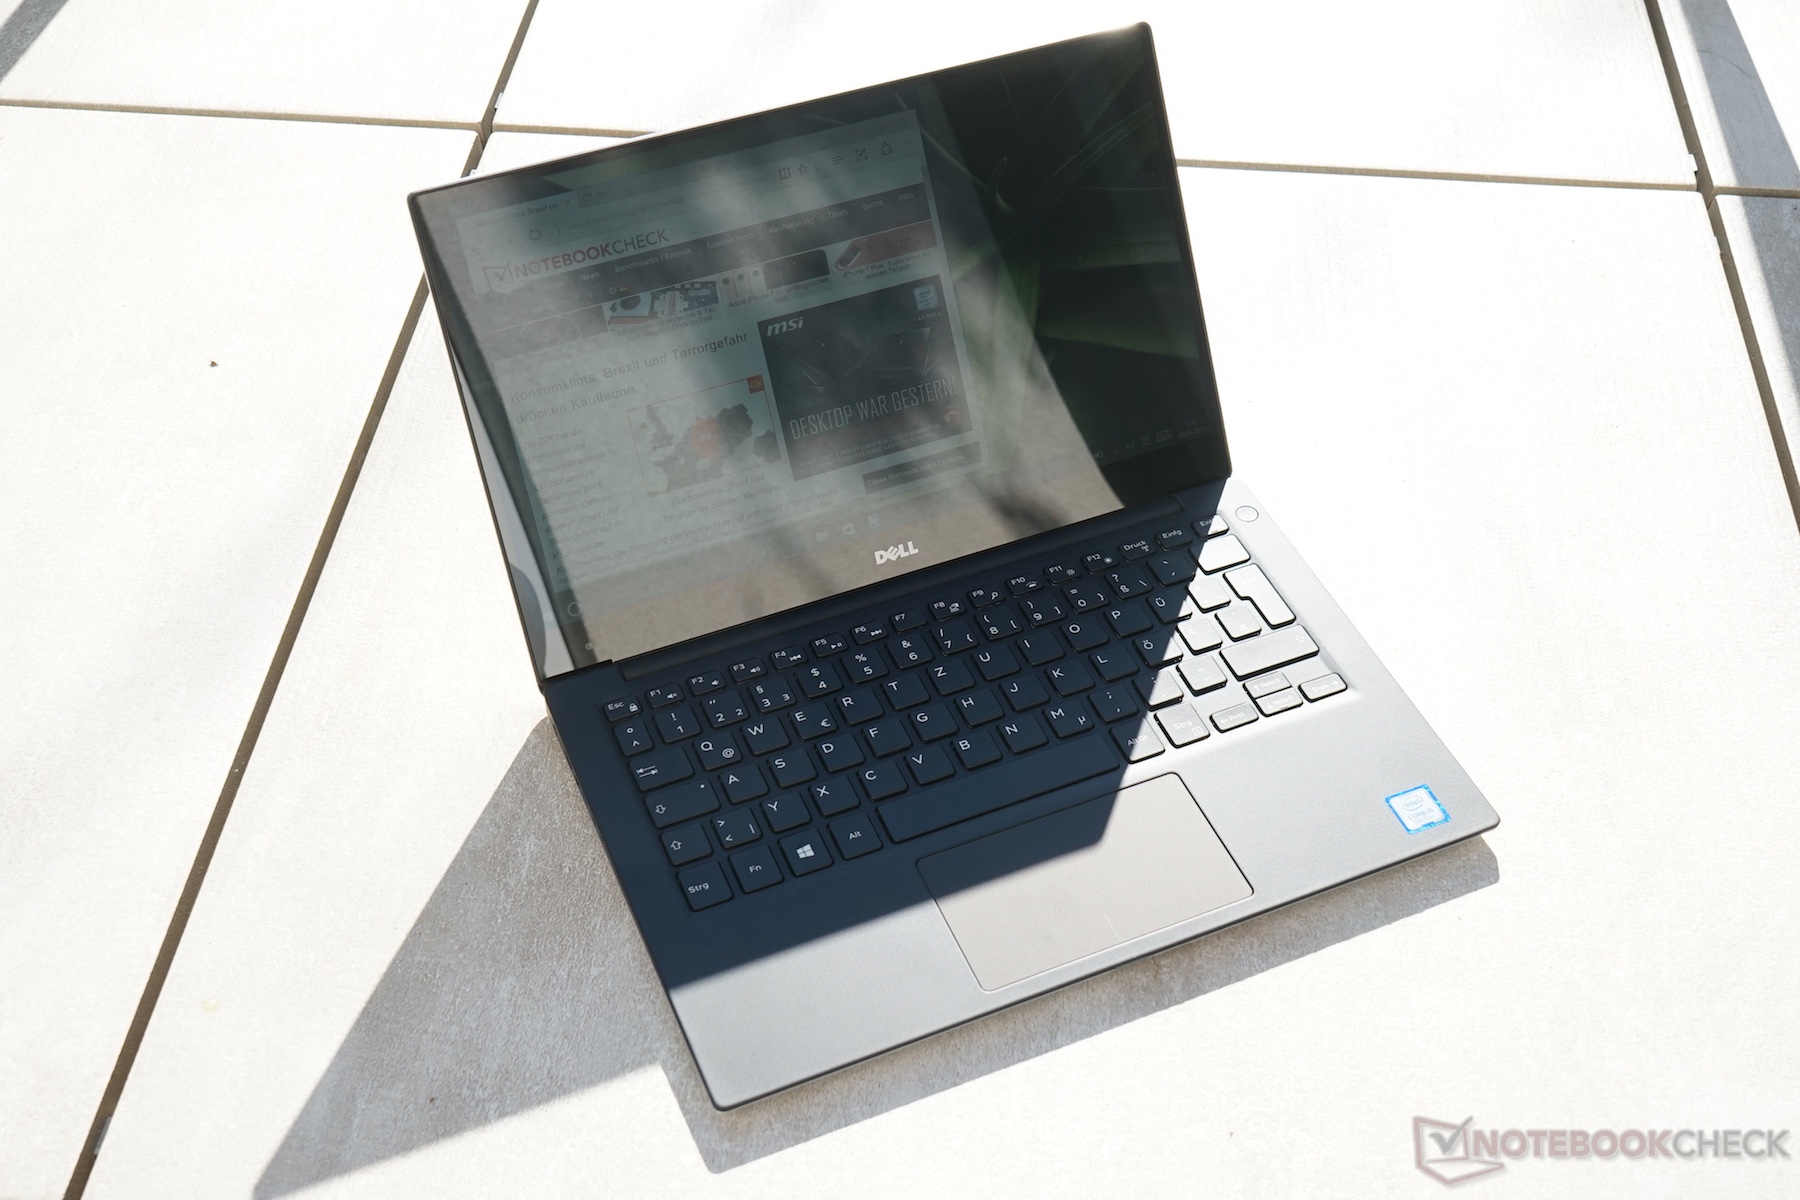
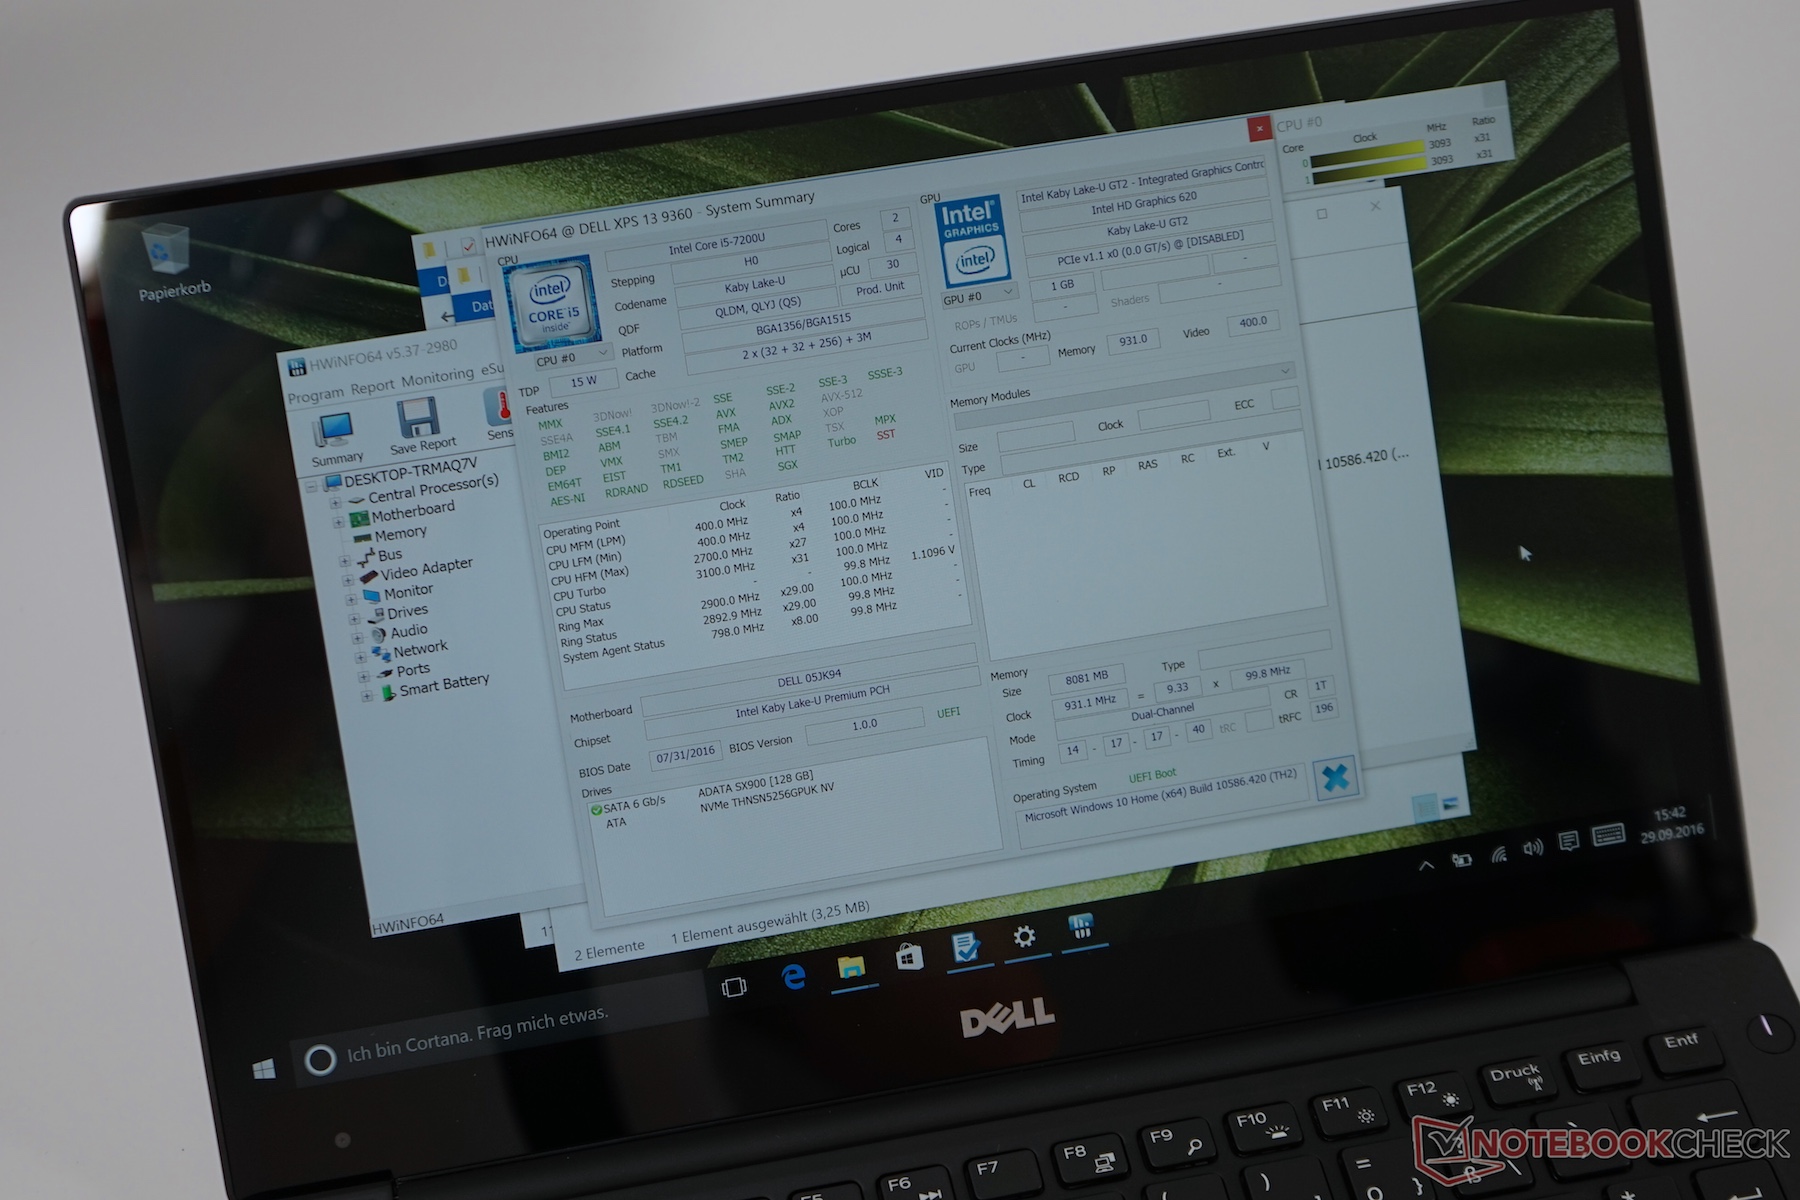
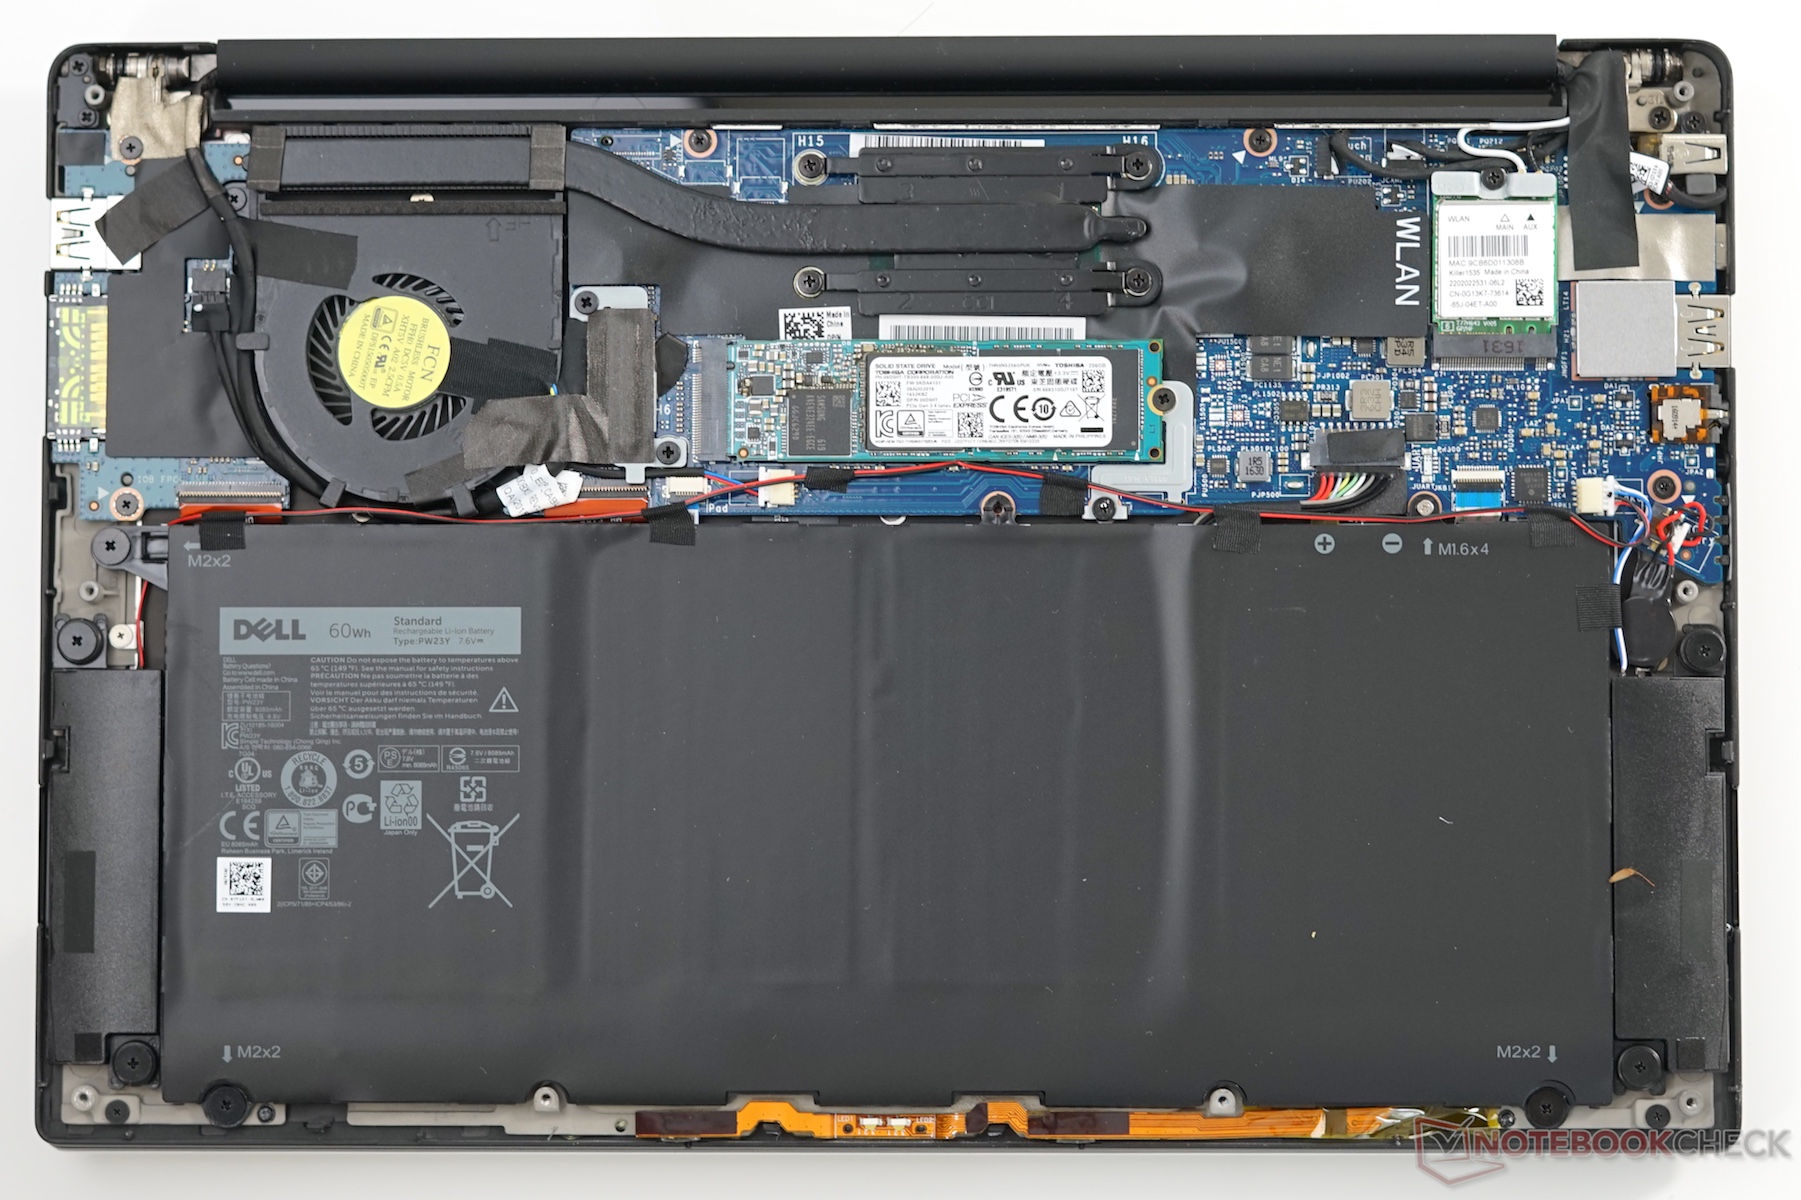
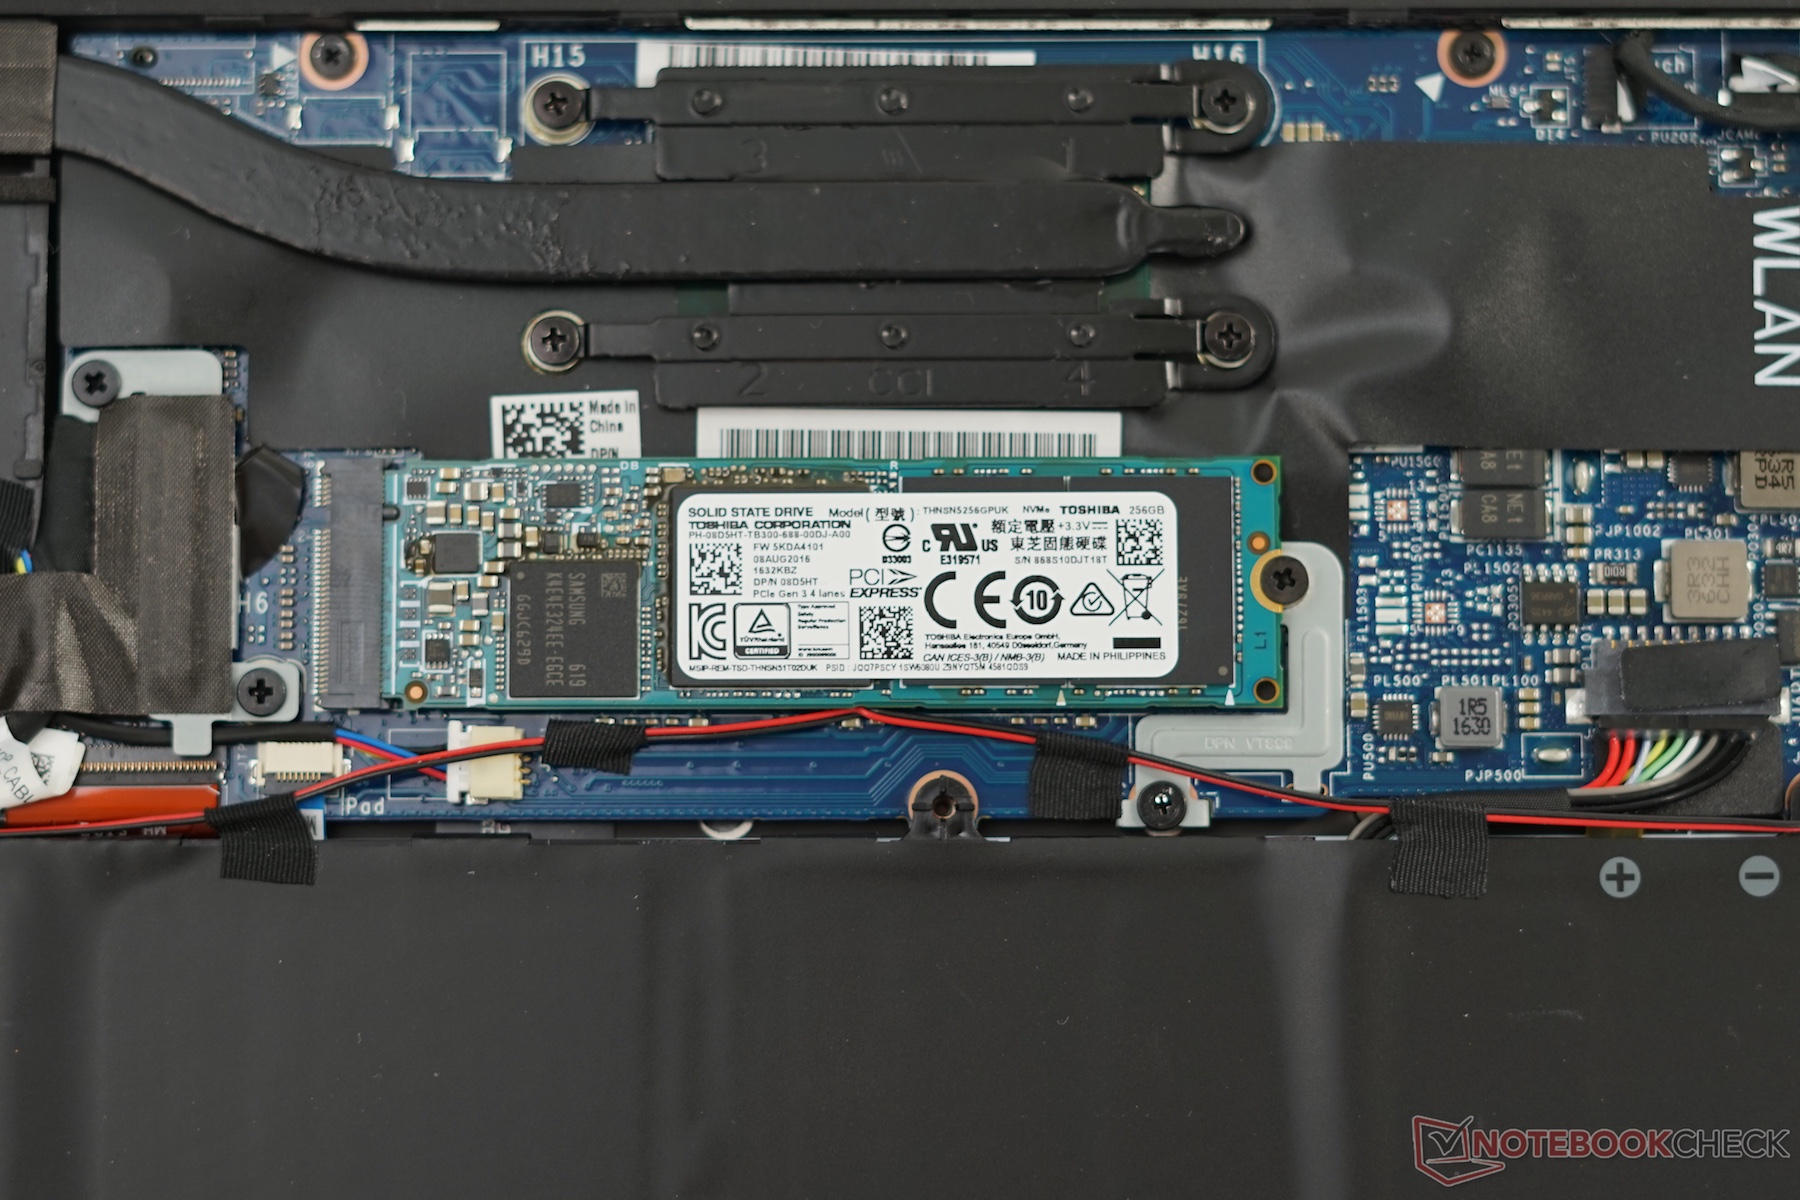
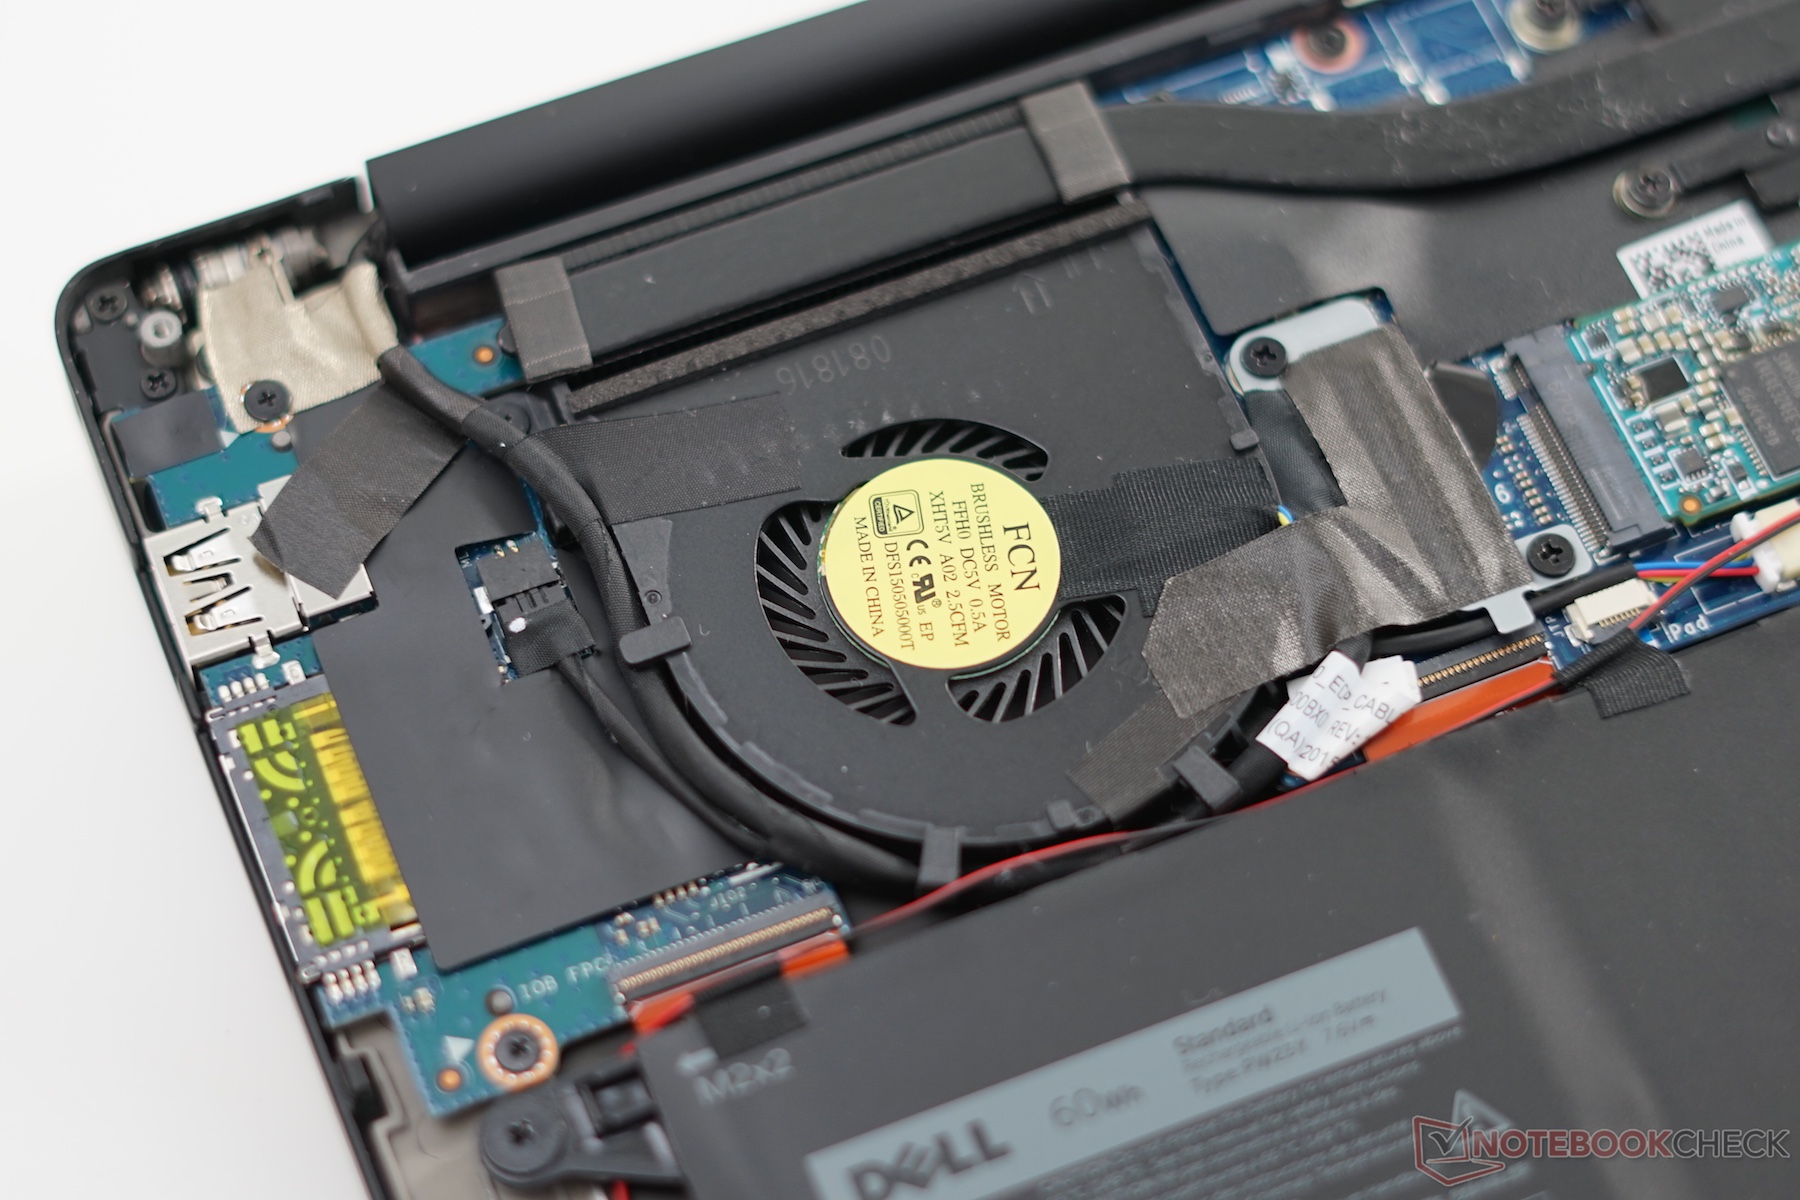
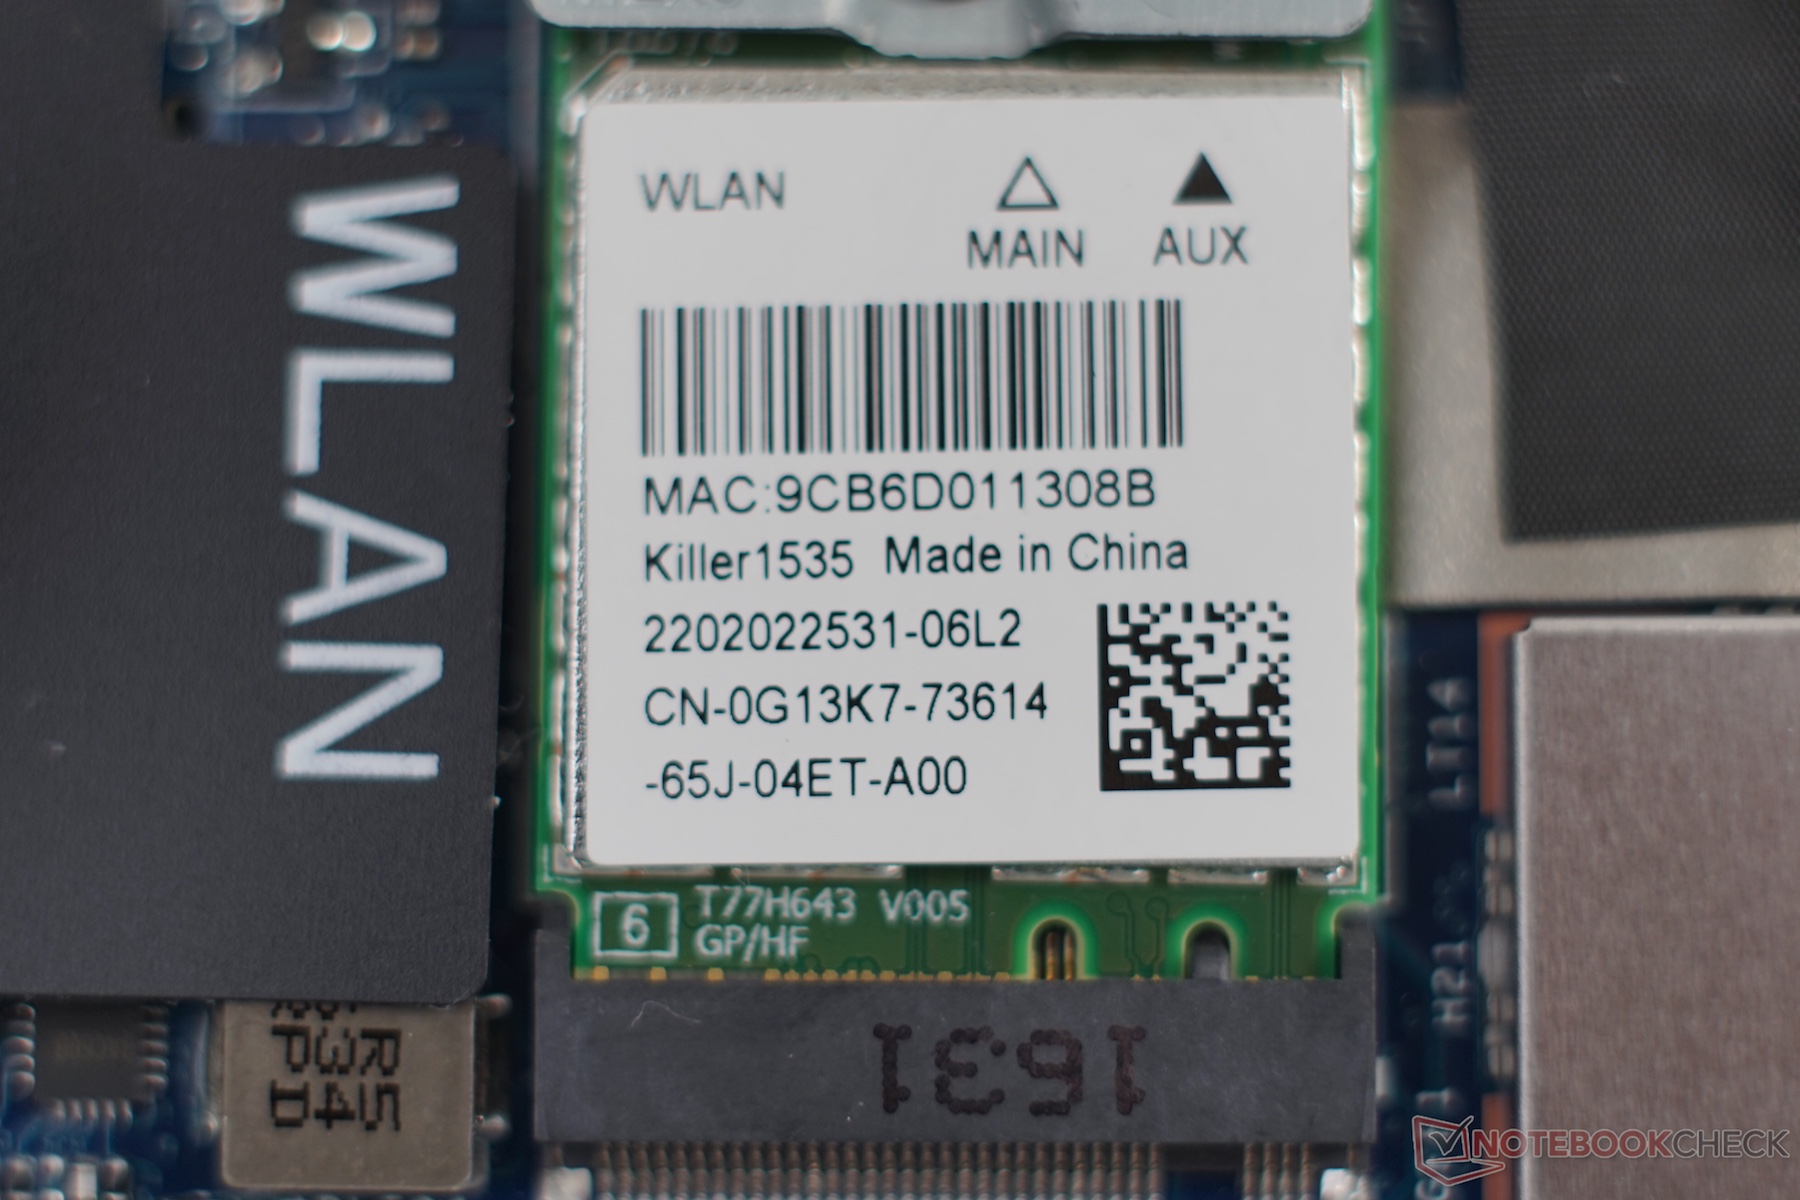
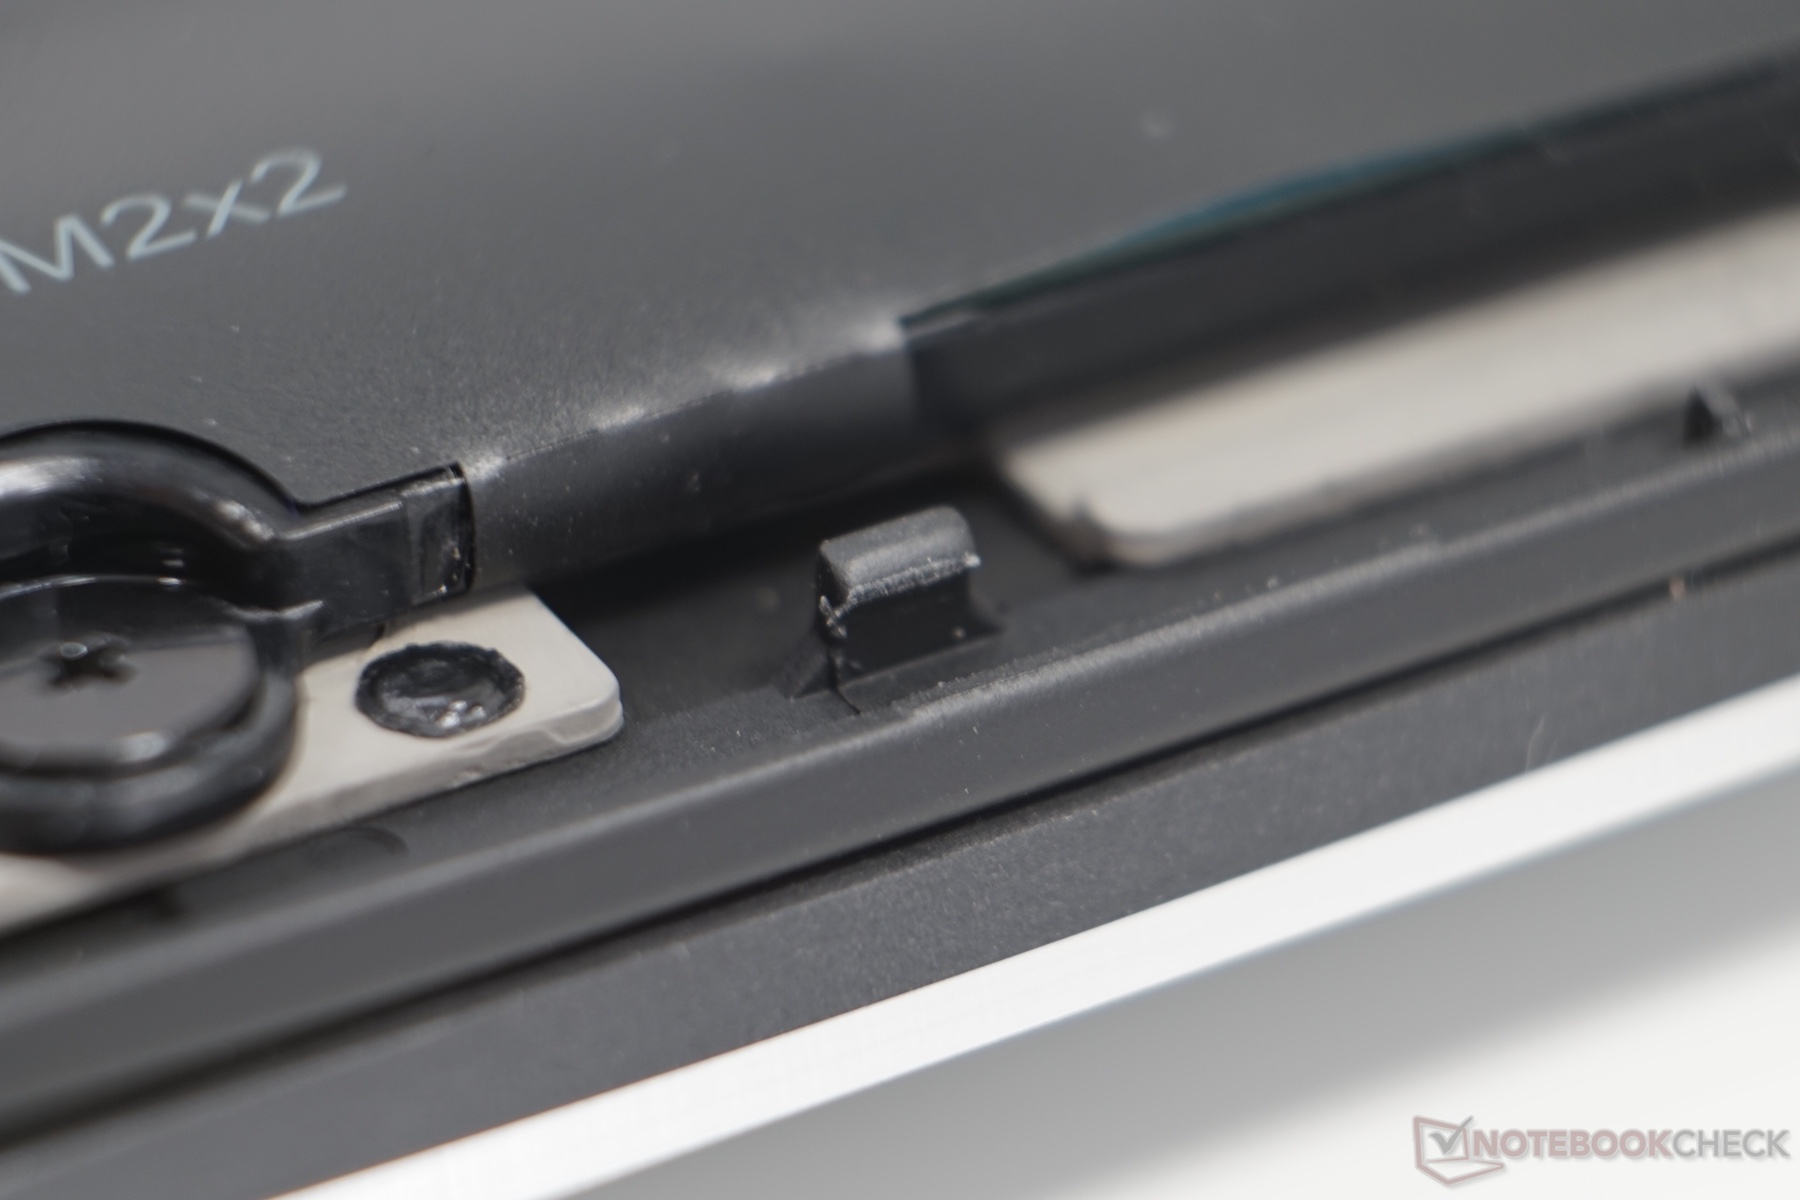
Kaby Lake架构戴尔XPS 13是对即将退出市场的Skylake版本的更新。新的Killer无线网模组在测试中提供了十分出色的性能表现。Kaby Lake处理器在测试中相比Skylake仅仅提供了稍高的测试分数,而落后于我们测试过的宏碁笔记本中的i5-7200U处理器所提供的性能。它的显卡表现也不算特别出色。戴尔宣称它们内部测试成绩相比更高,并希望给我们另外一台新设备一共测试。更换我们测试机的导热胶后它也提供了不小的散热效率,不过它的性能依然低于i5-7200U的理论水平。我们只好等待新的测试机到来,再重新测试来看它的小风扇究竟能否满足处理器全速运行下的散热需求。
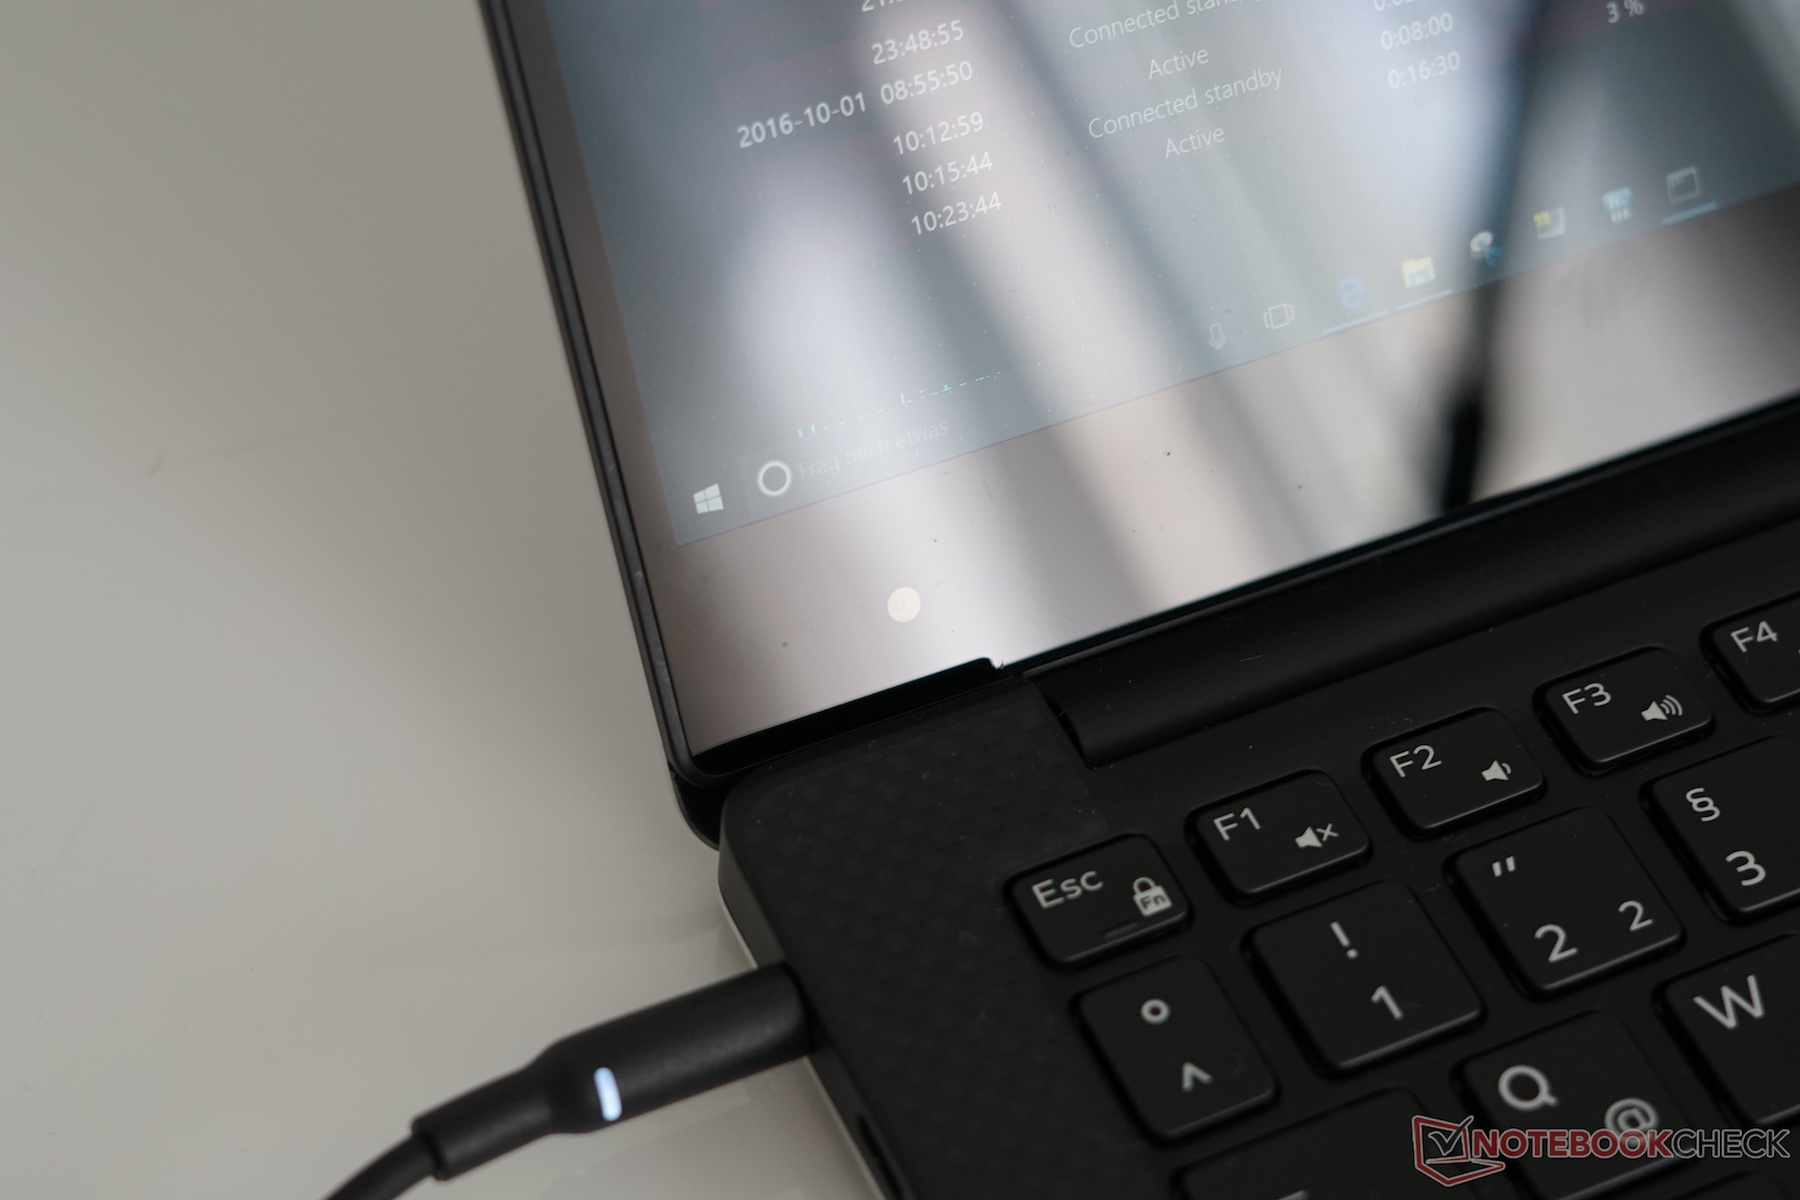
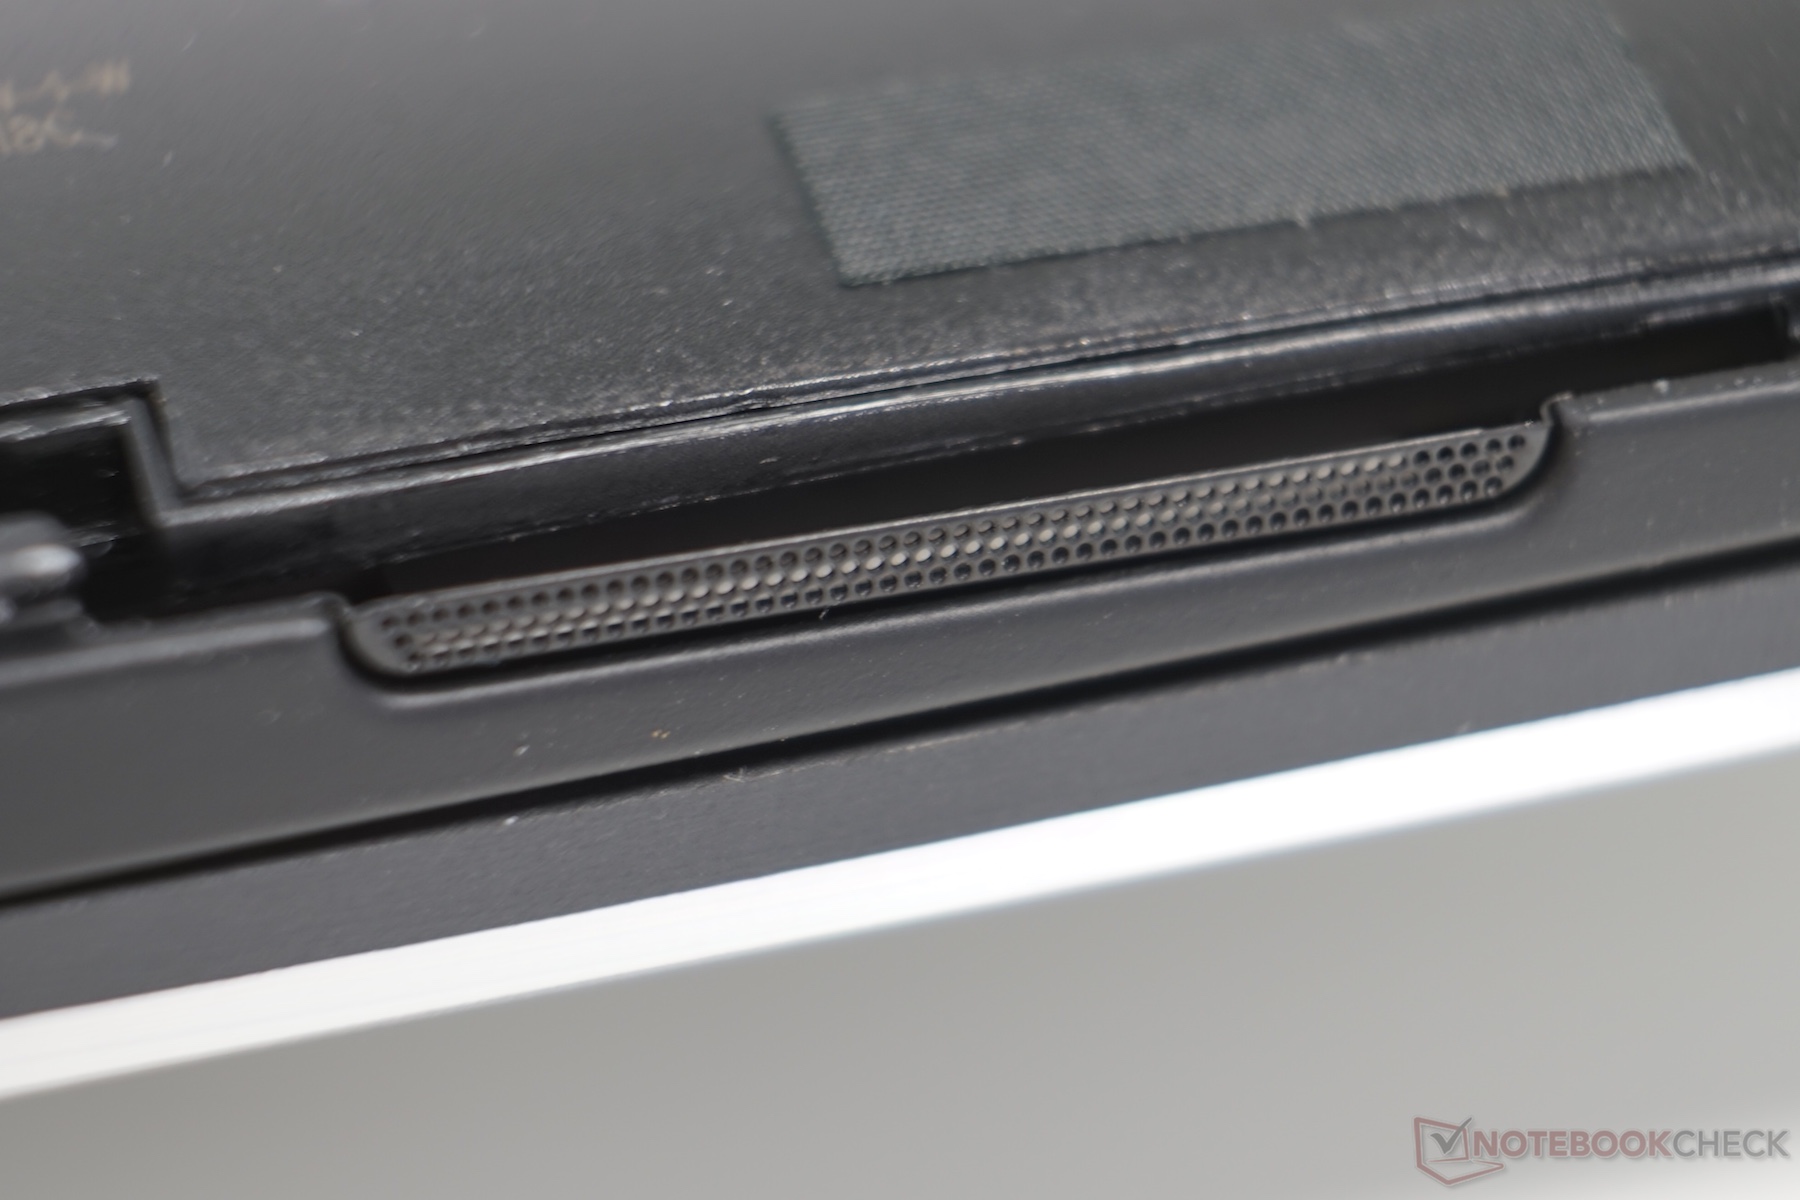
XPS 13系列的另外一个问题在于电流噪音。我们可以在这台测试机运行时听到这种声音,不过只是在周围特别安静时。它有些像机械硬盘发出的声音。另一方面,如果考虑到尺寸小巧的机身,它的散热噪音控制都可以说是做得十分出色。
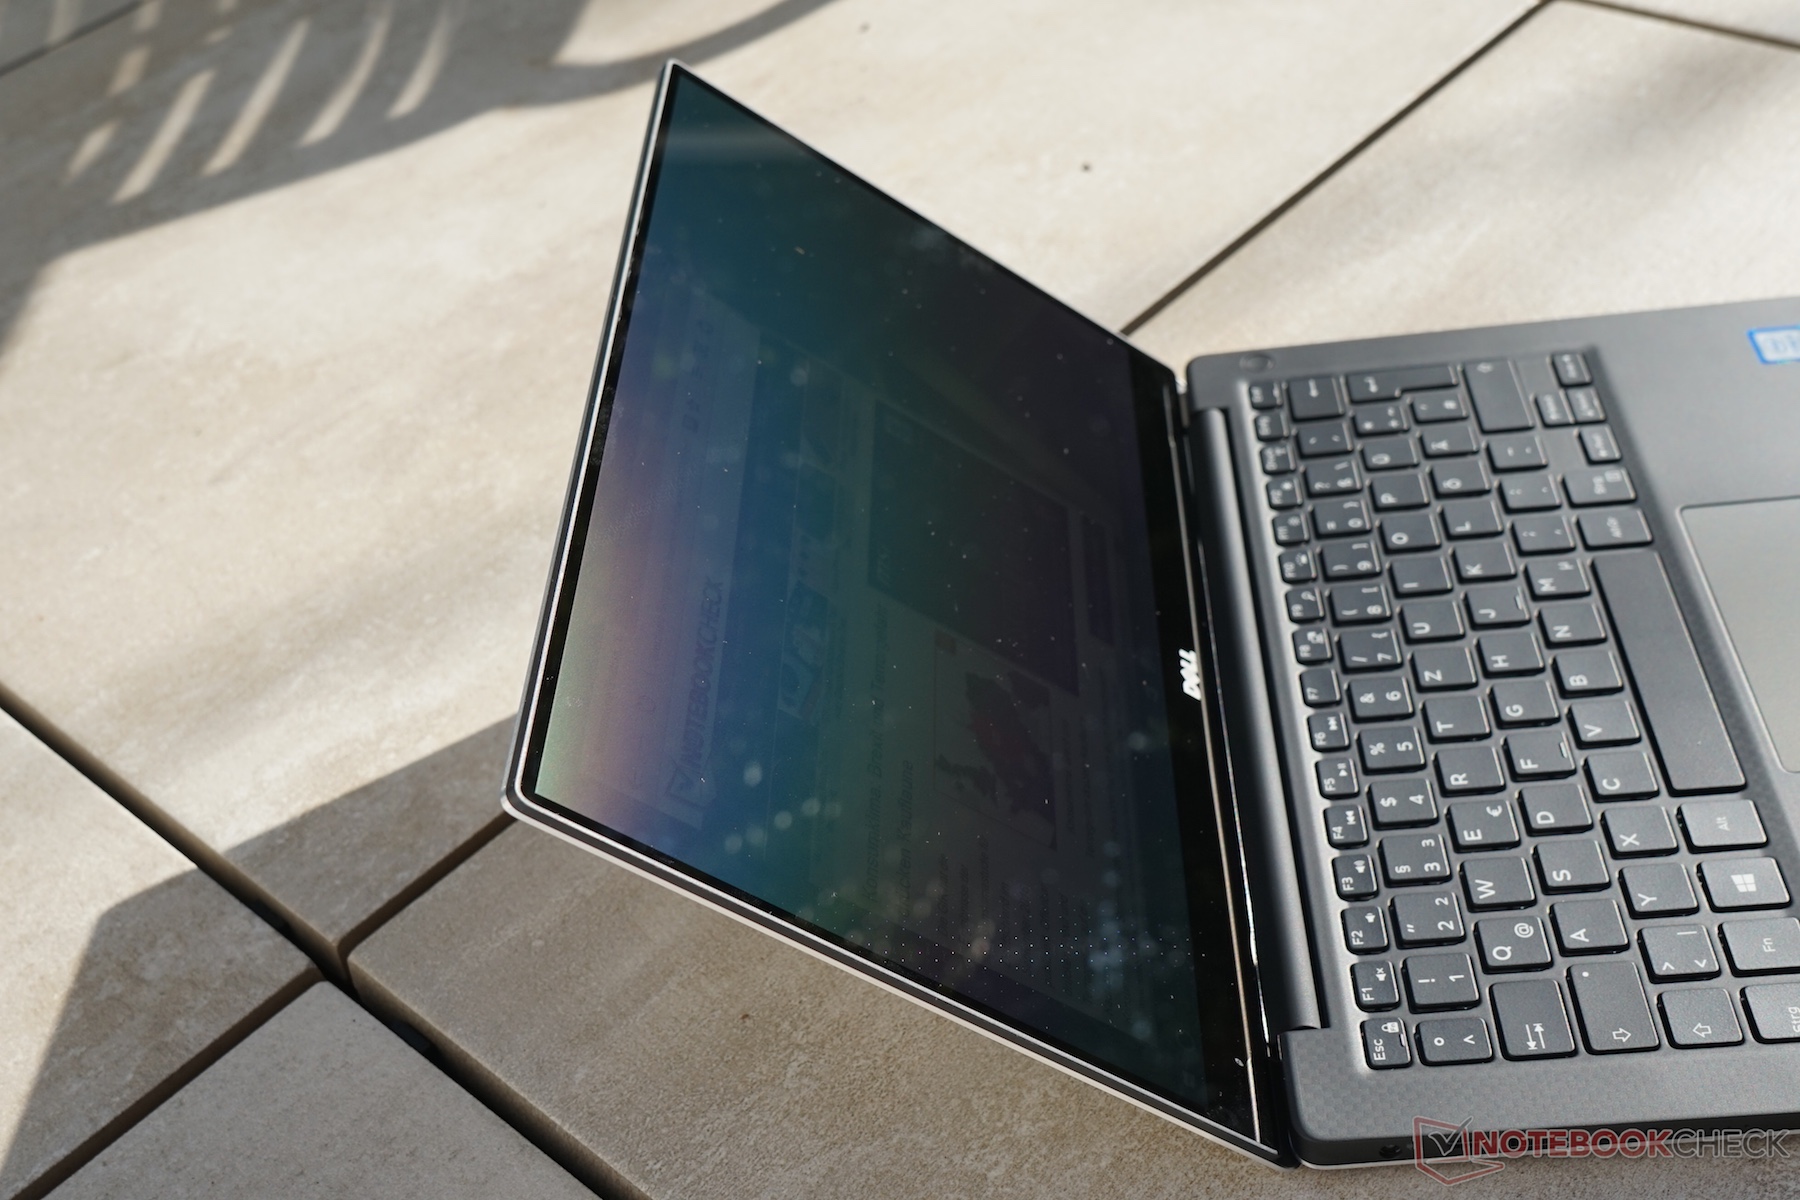
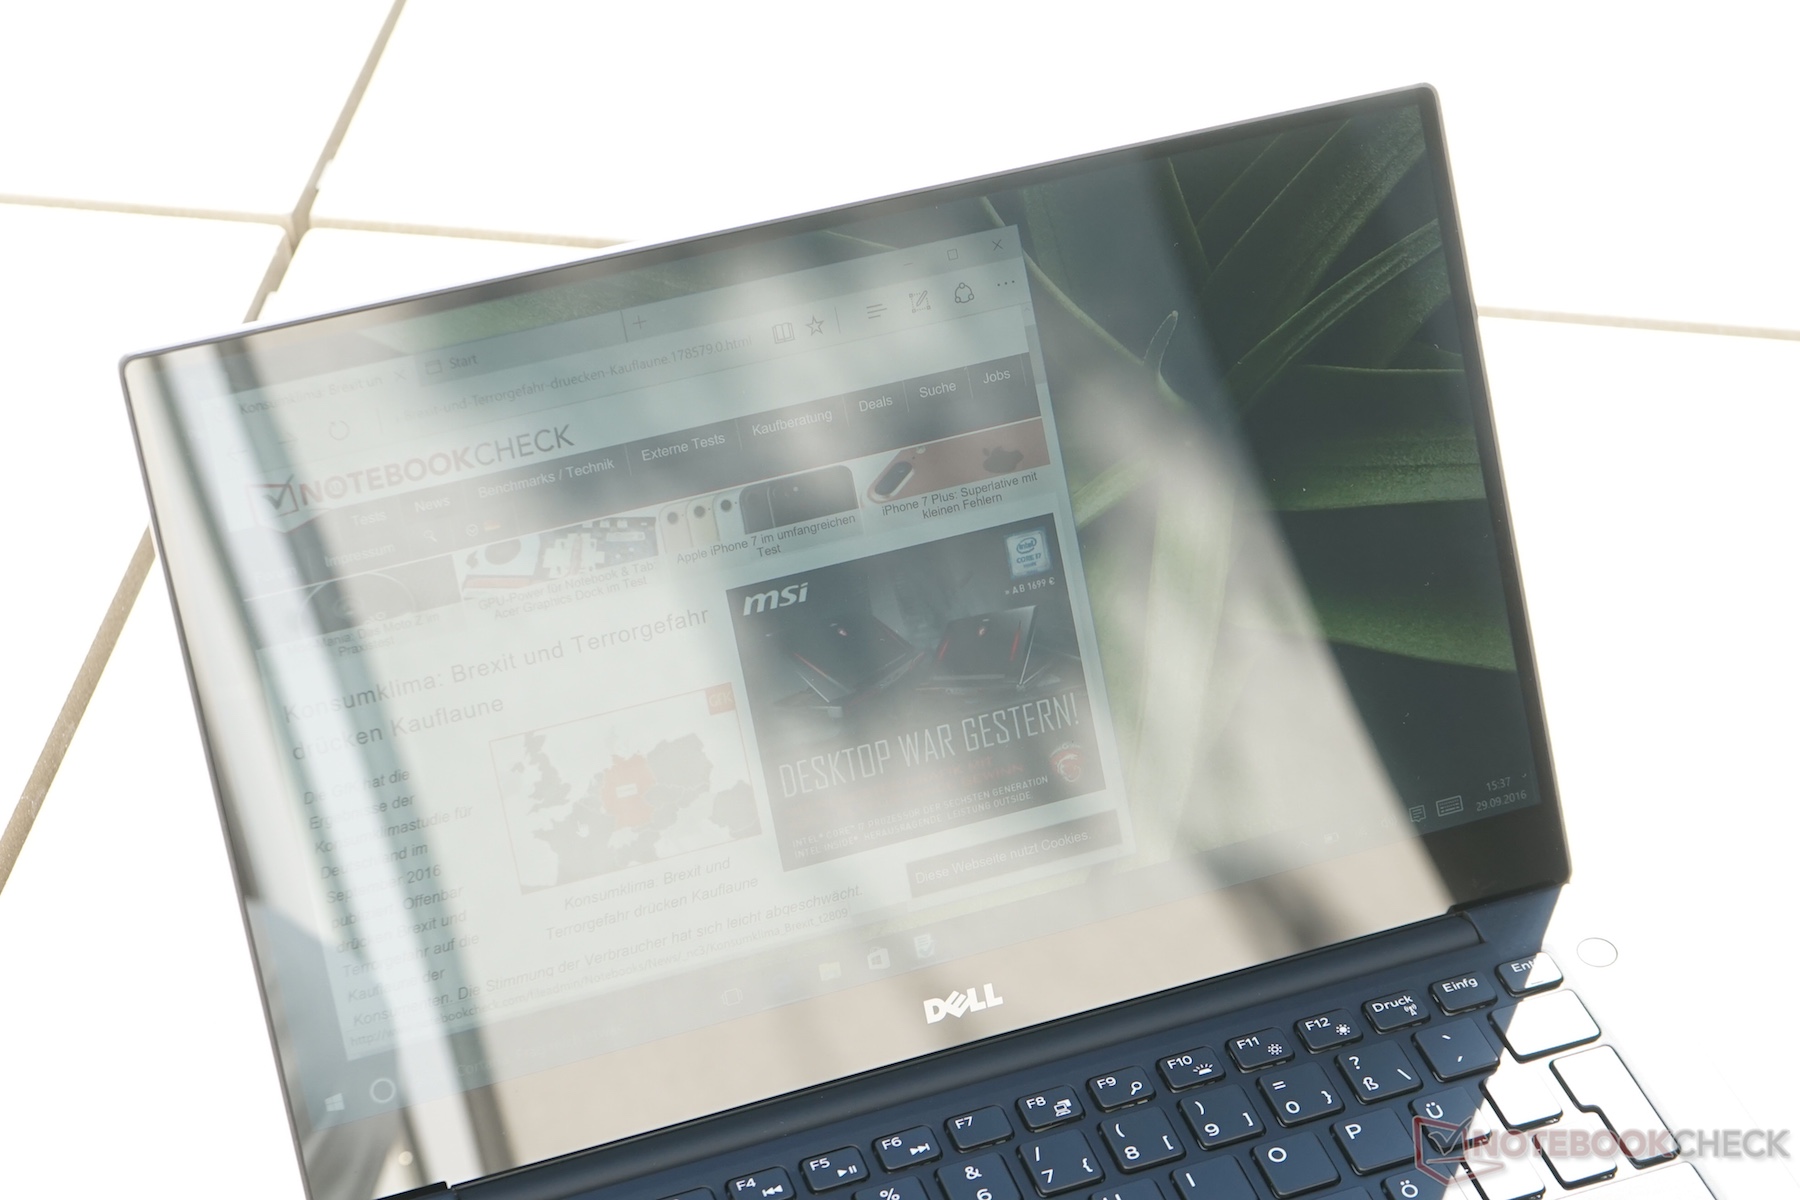
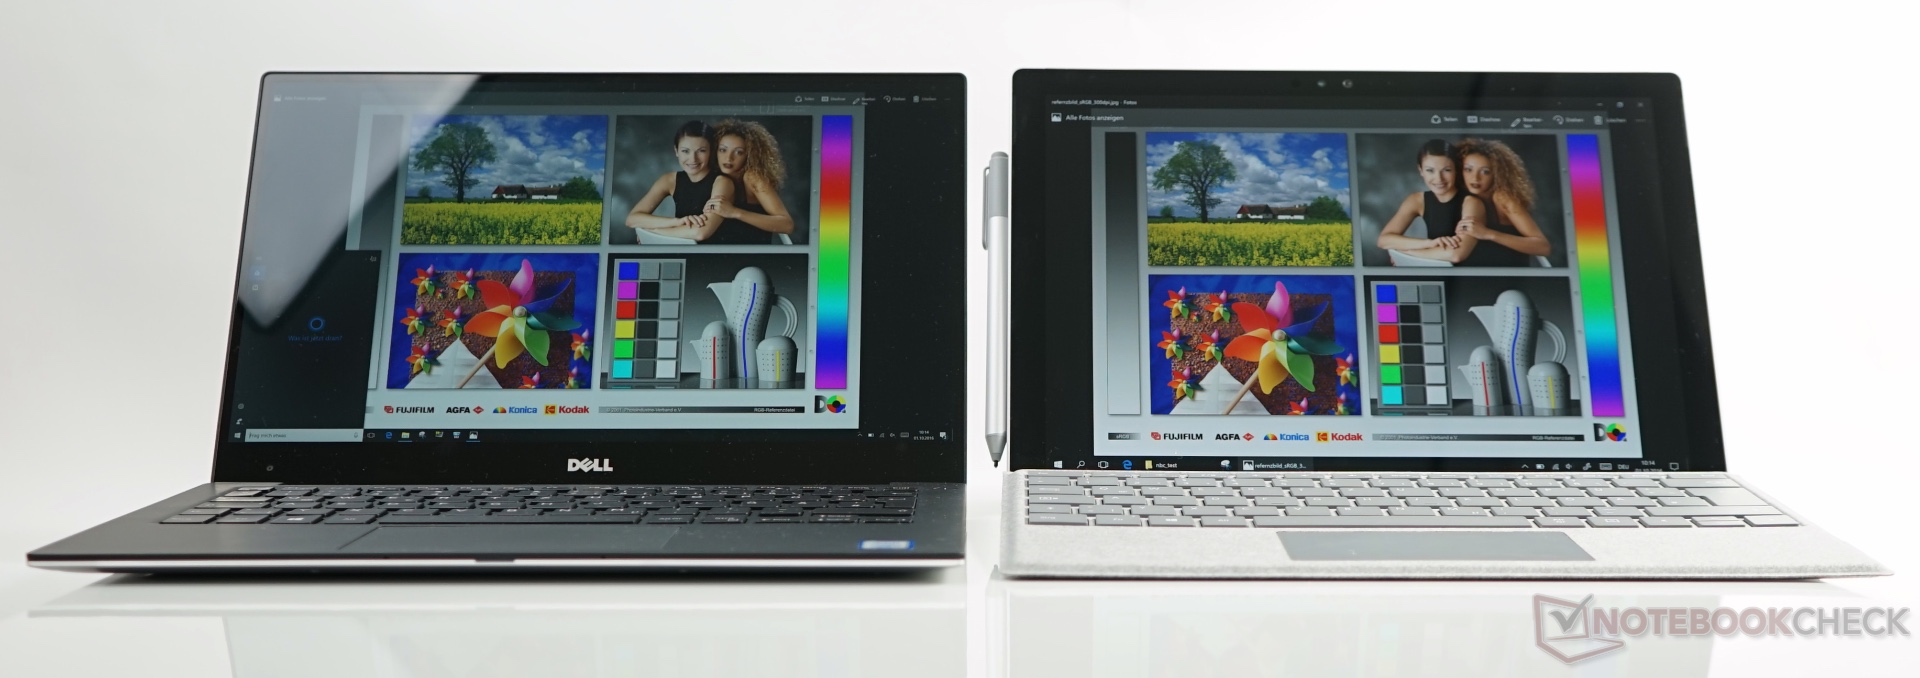
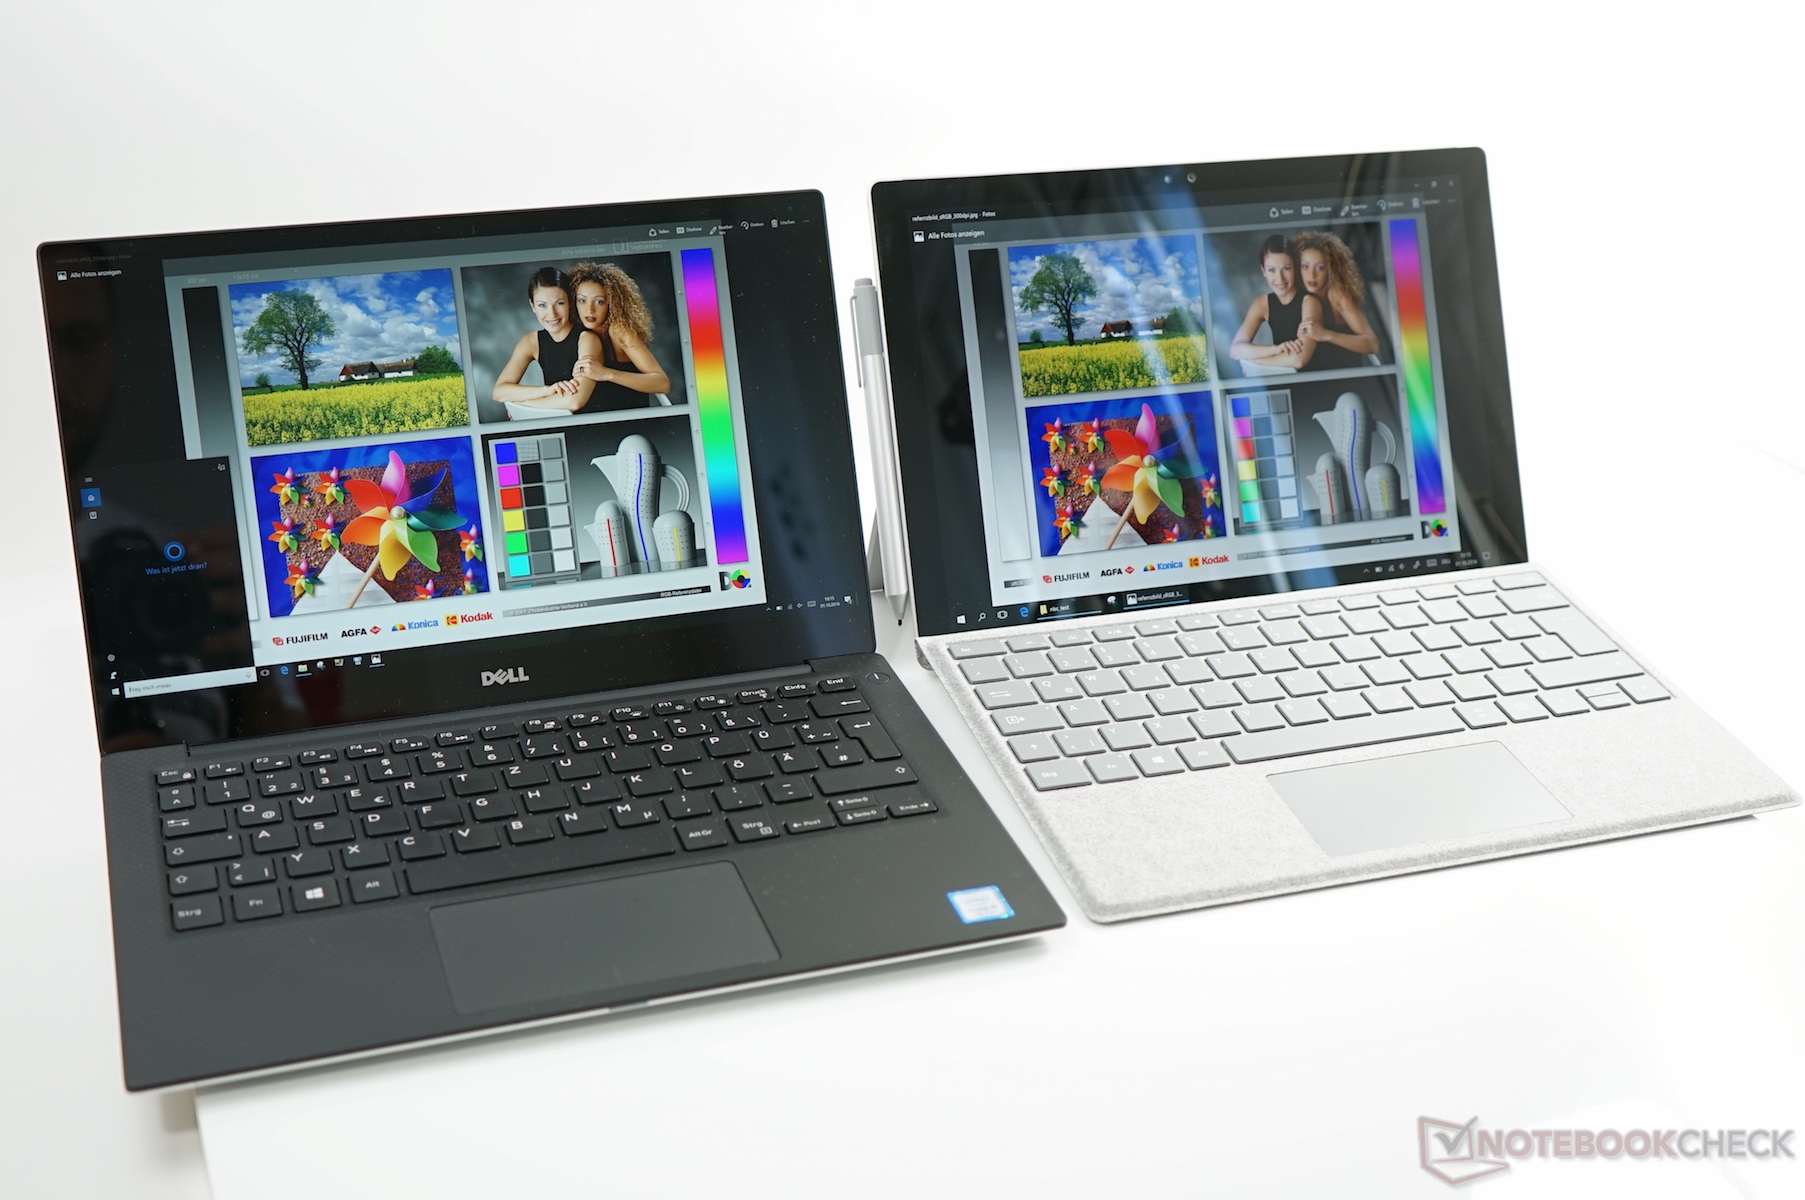
由于采用了动态亮度控制,对它的3K屏幕的测试变得十分困难。主观上,我们认为它除了较强的光线反射外都十分出色,但这在户外使用情况下会变得十分烦人(以及一些明亮的室内环境)。根据我们对前代机型的测试来看,它应该在这个方面没有太大变化。
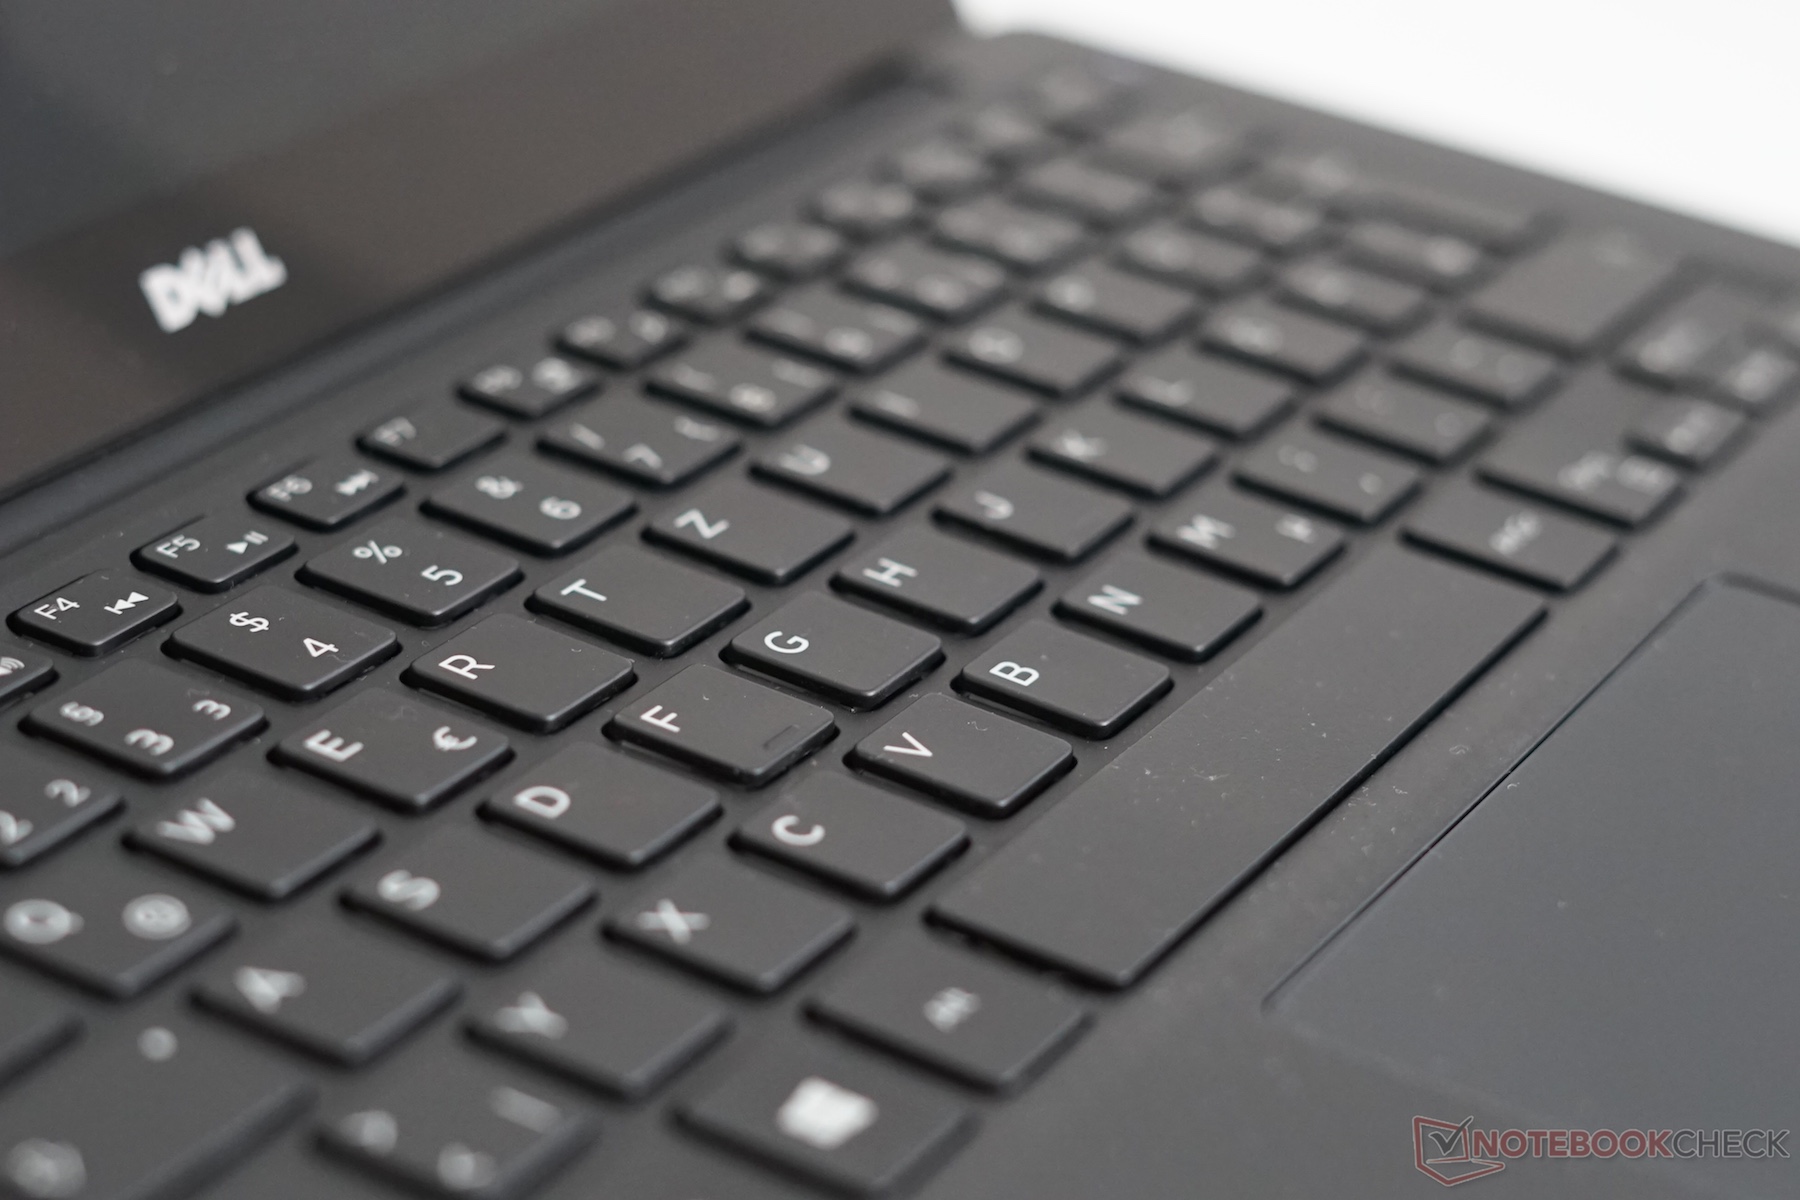
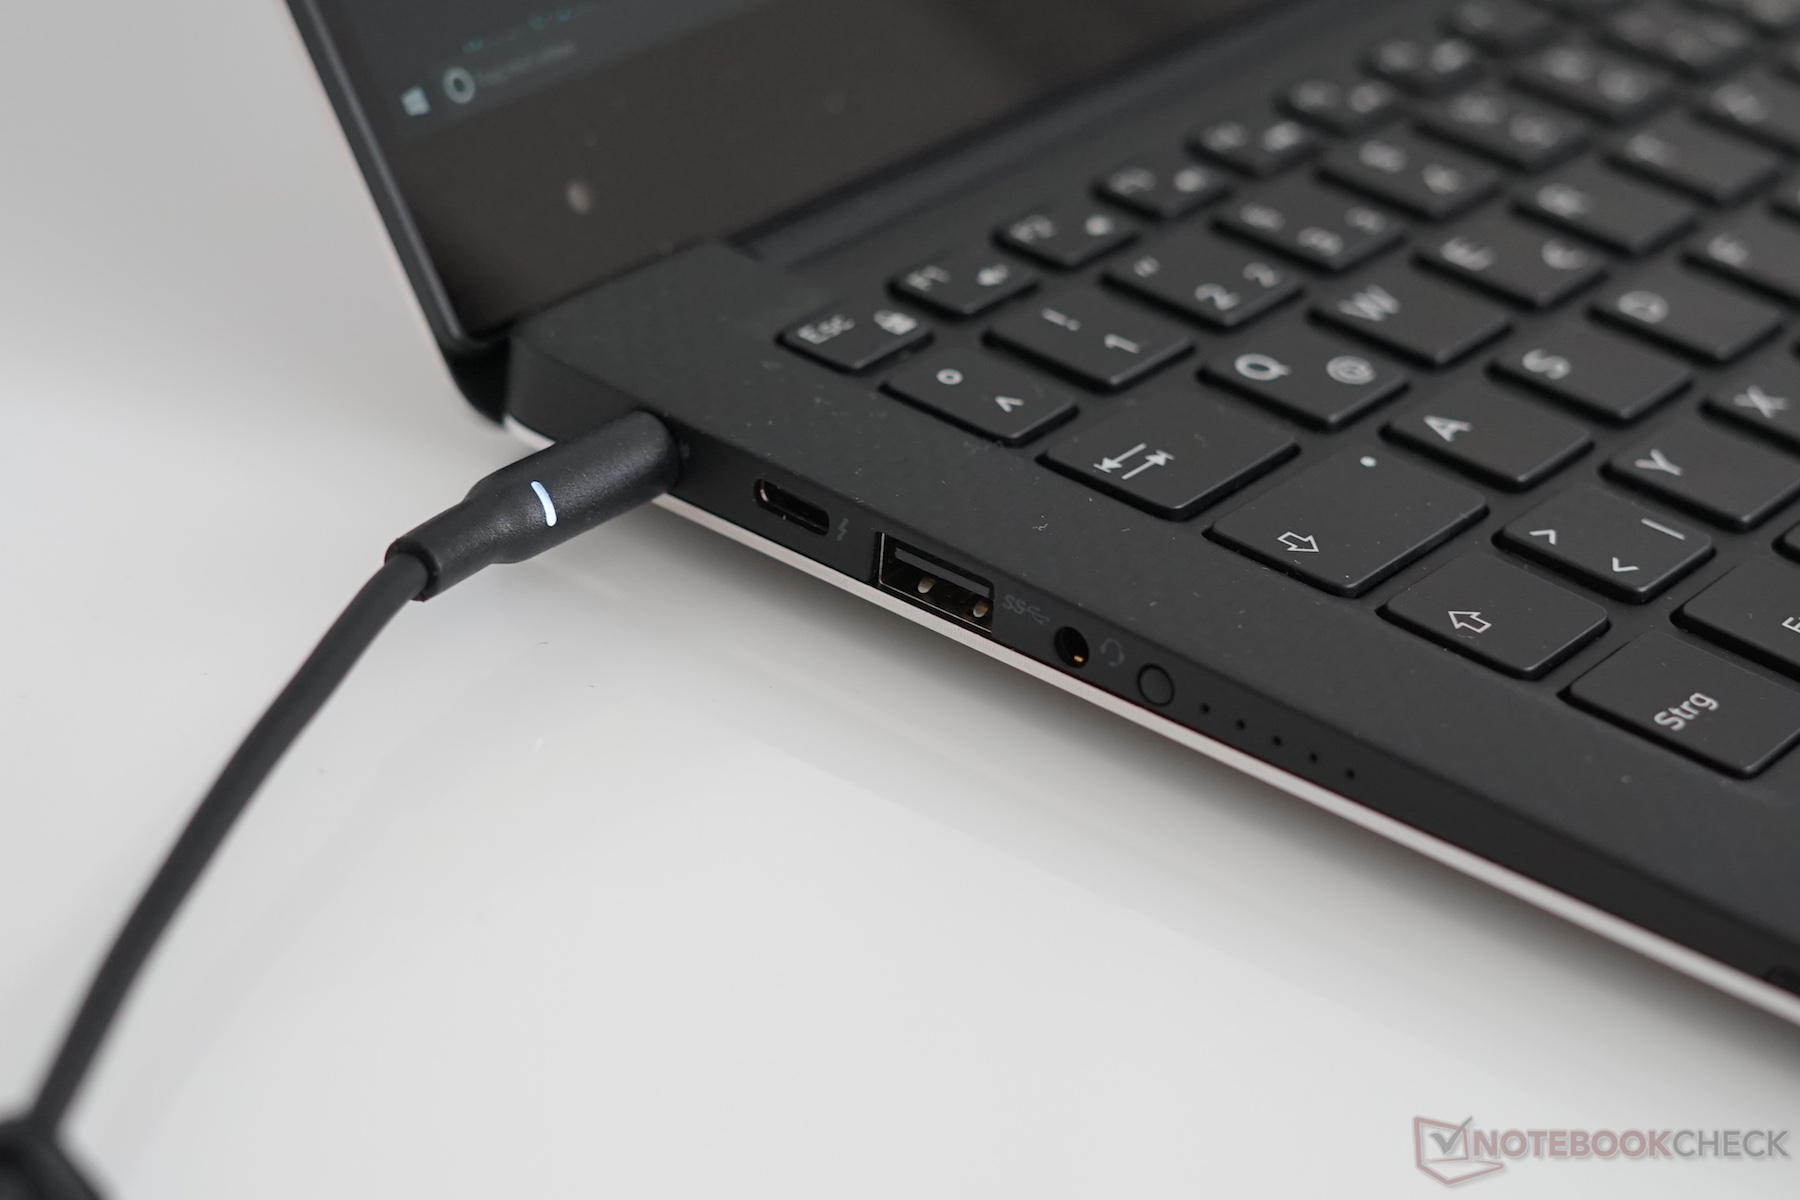
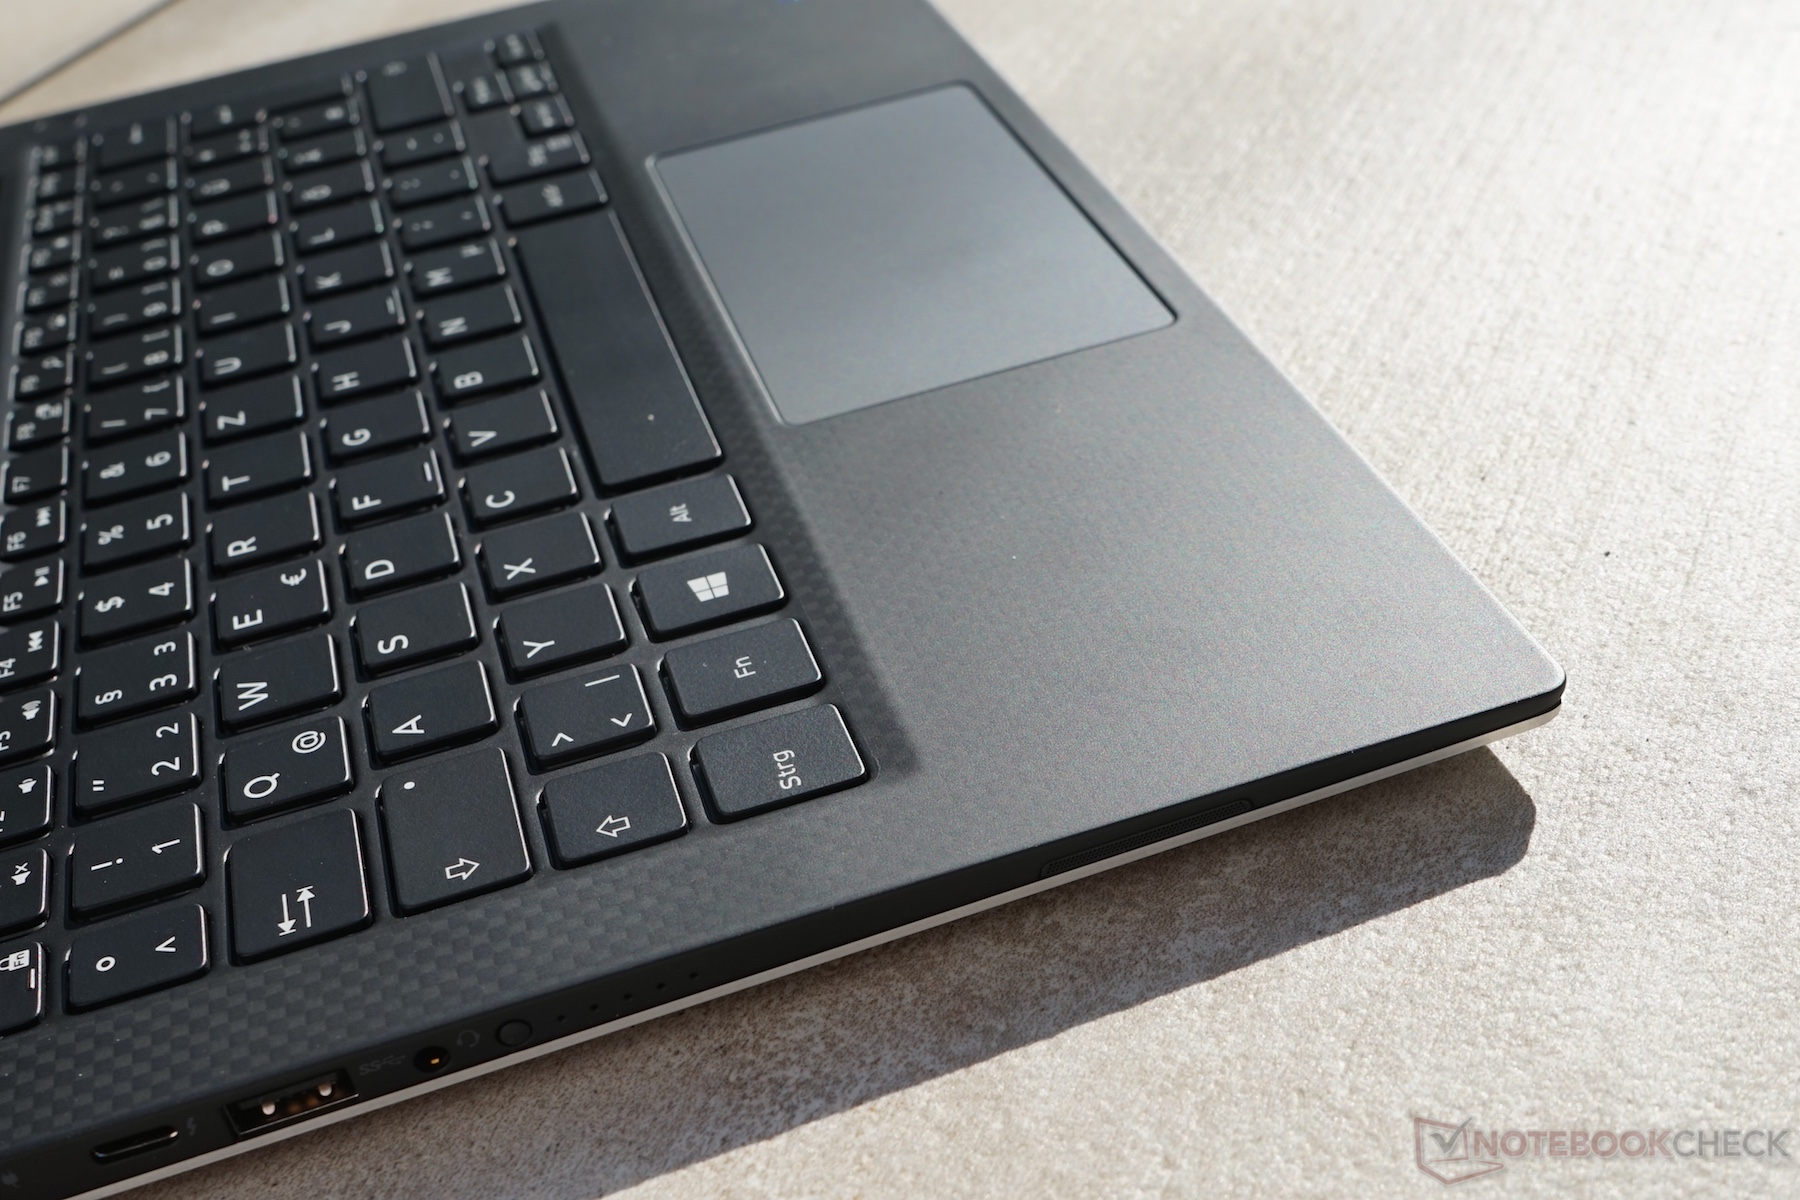
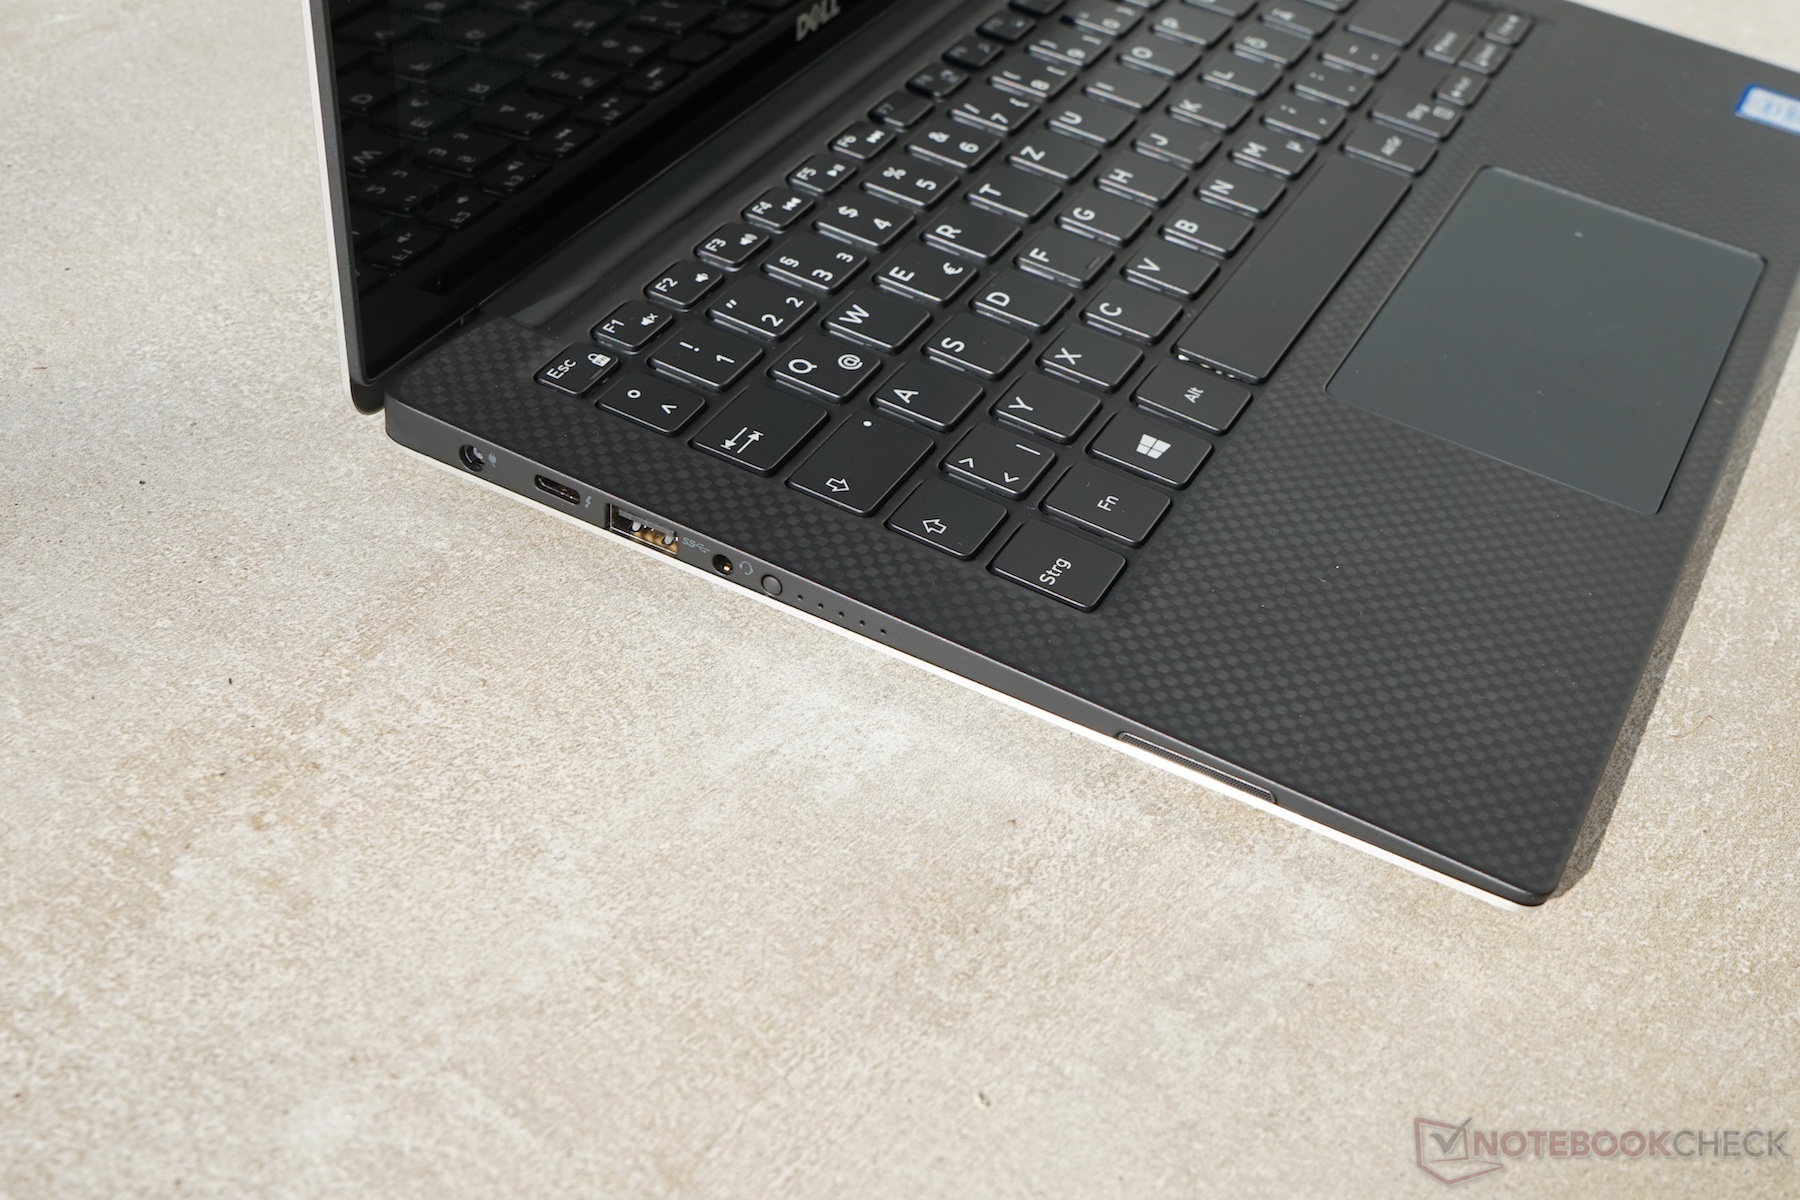
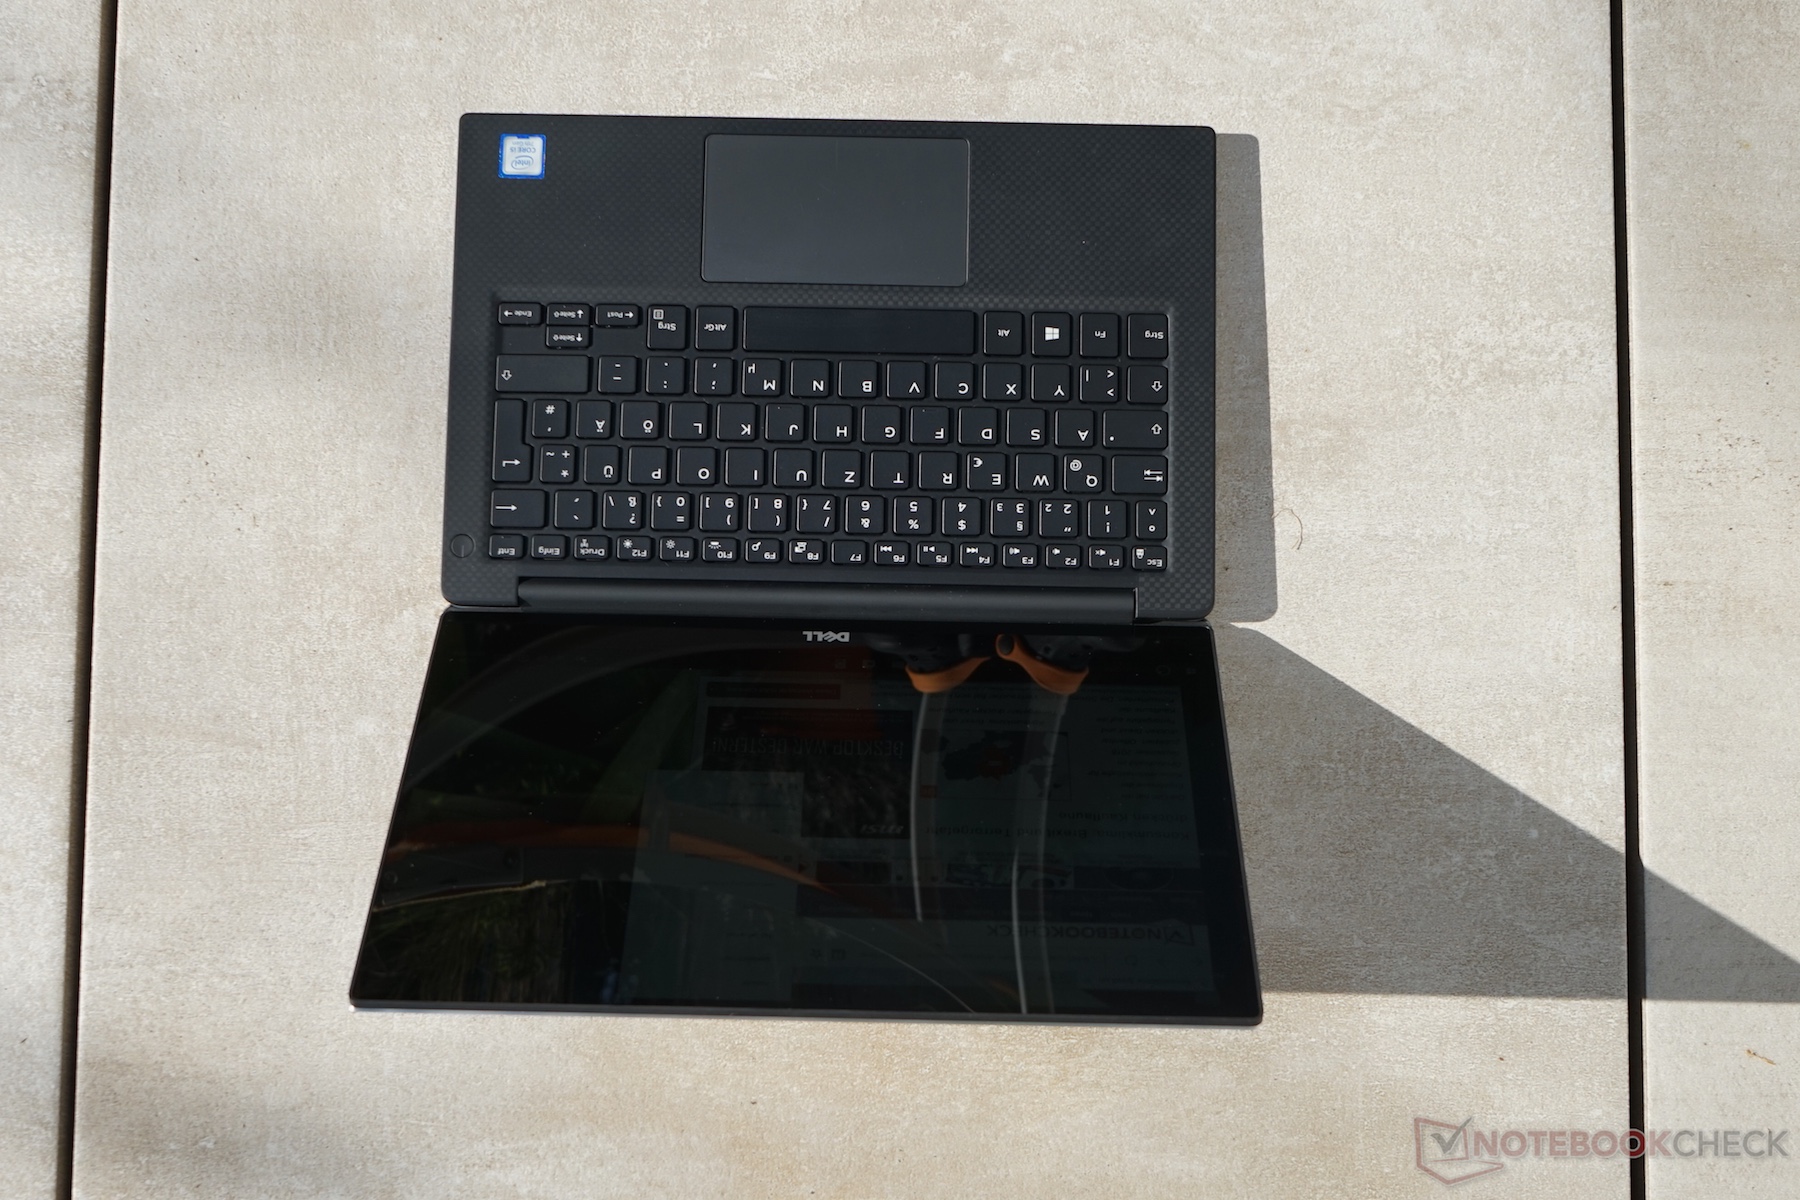
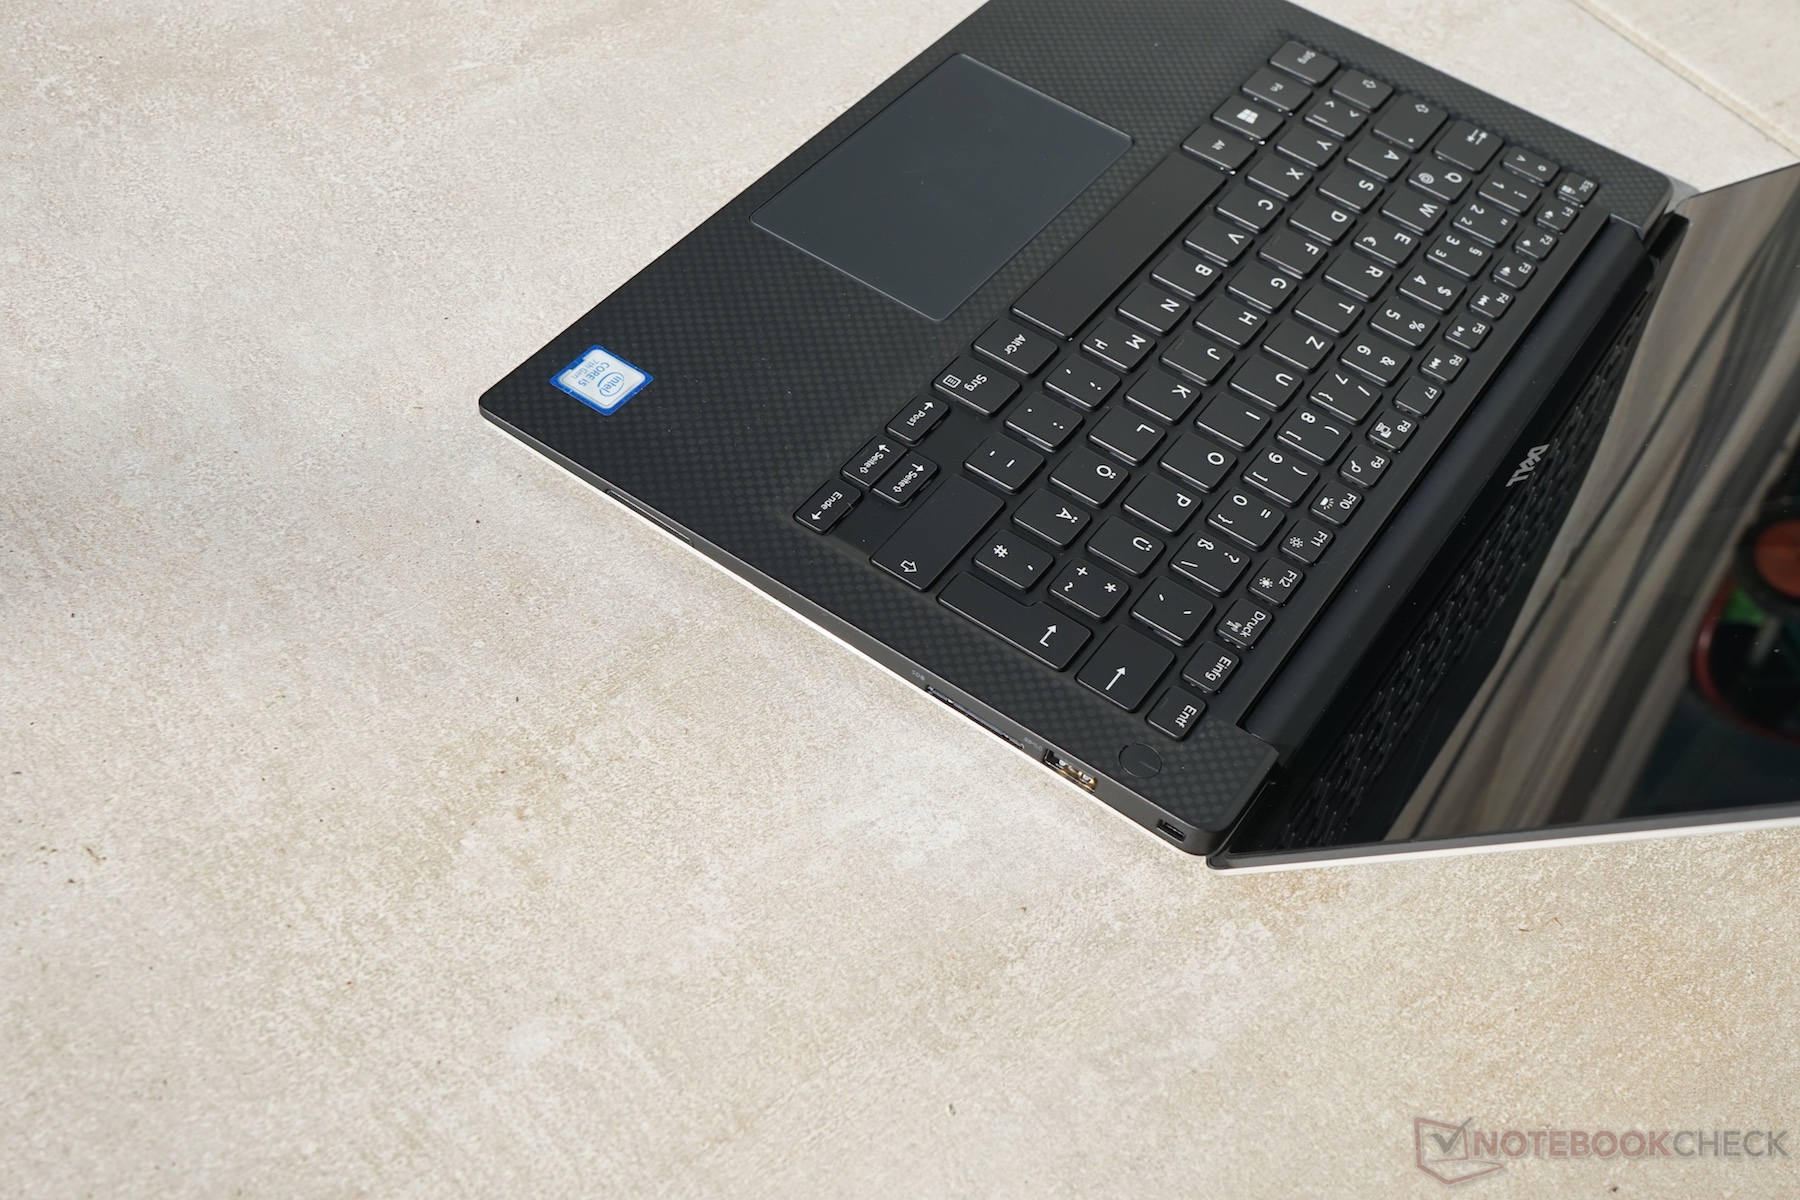
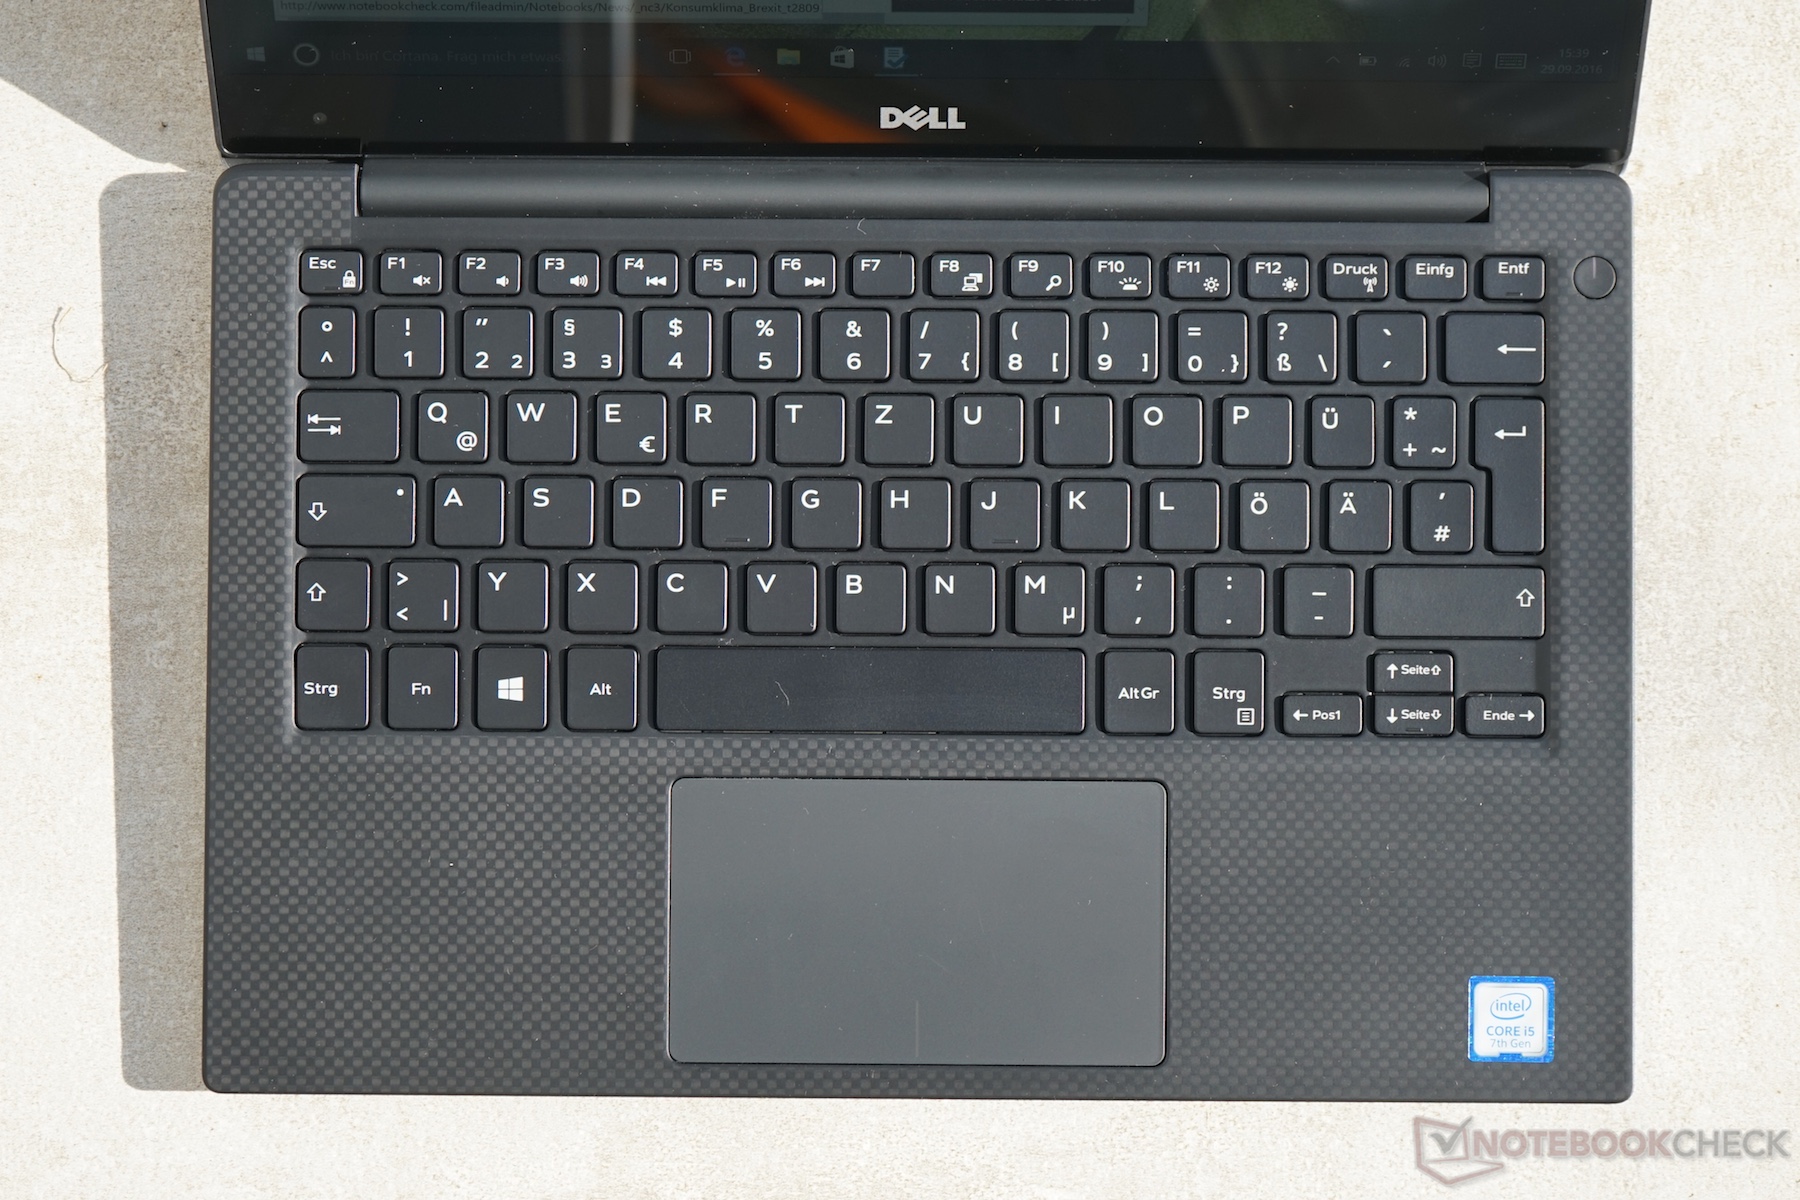
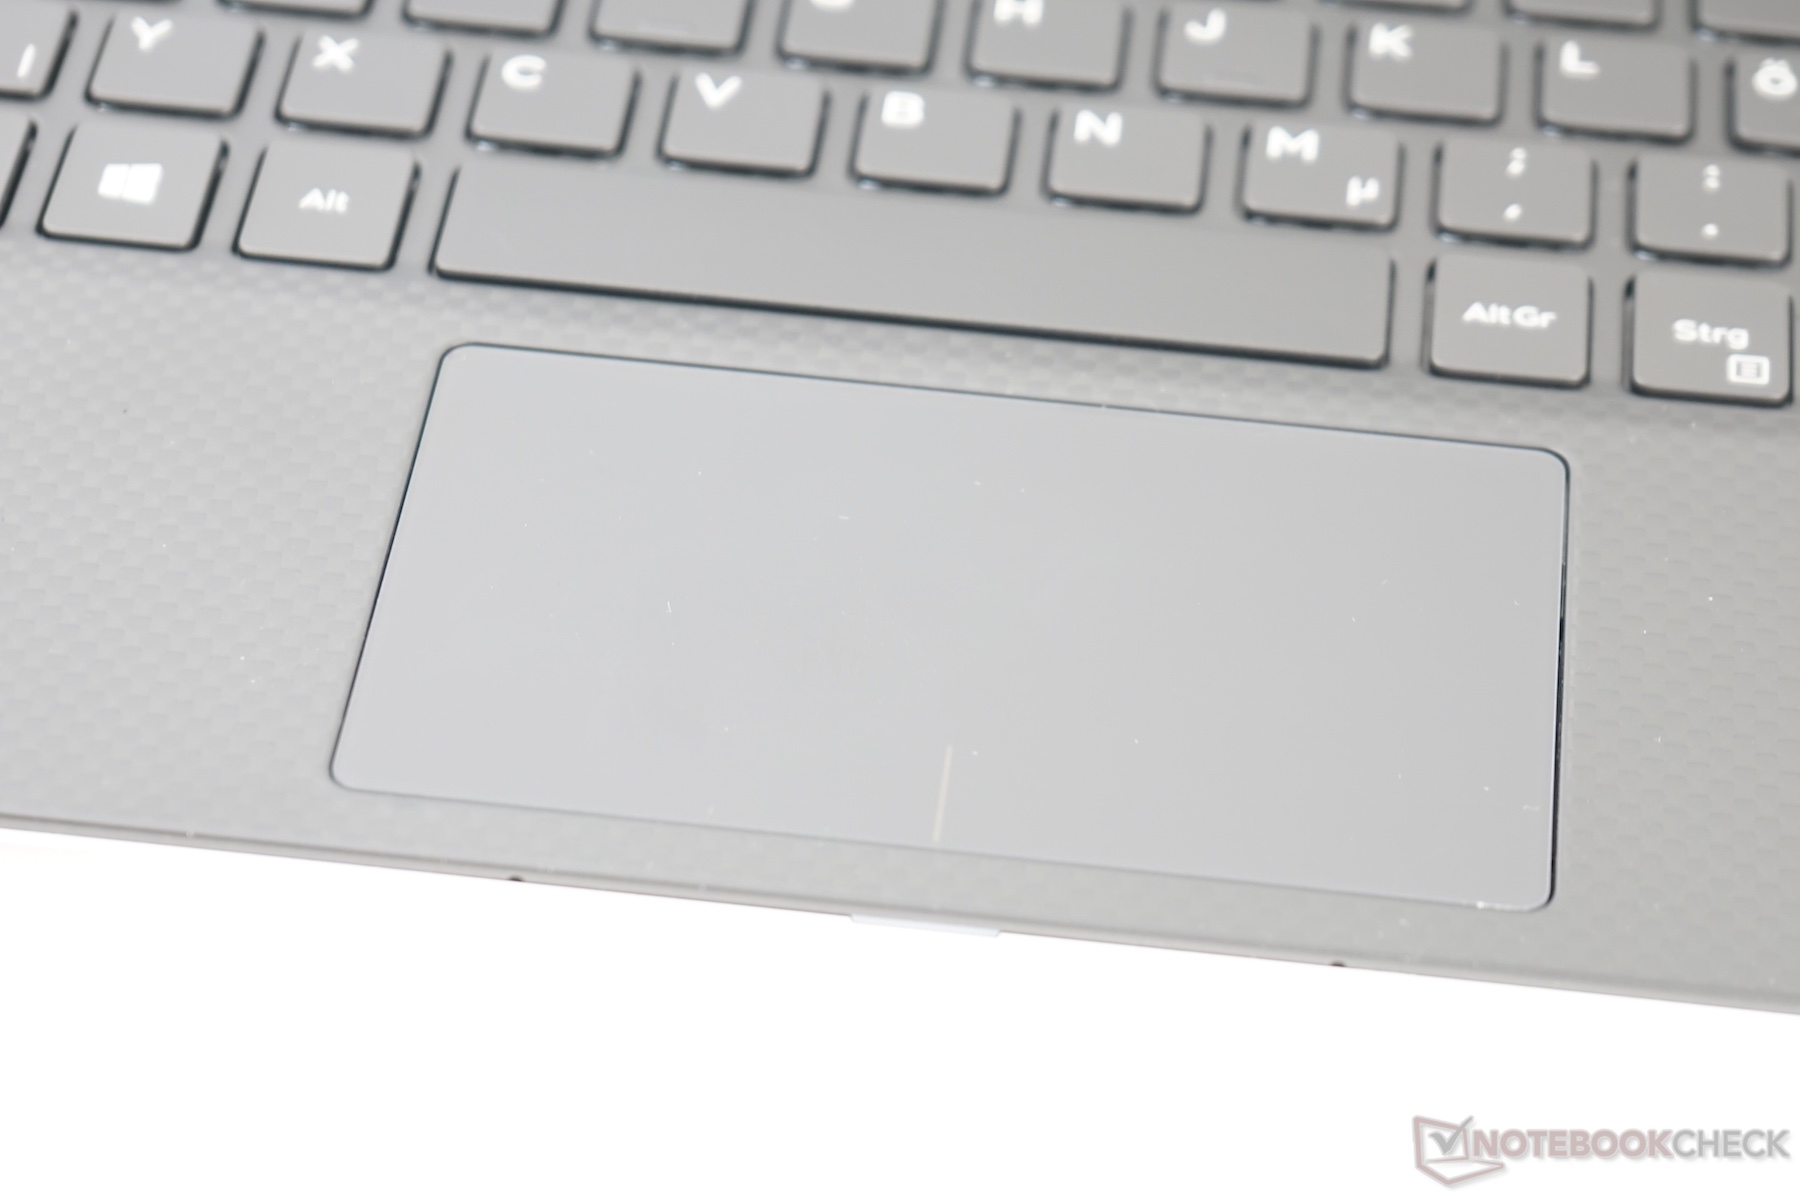
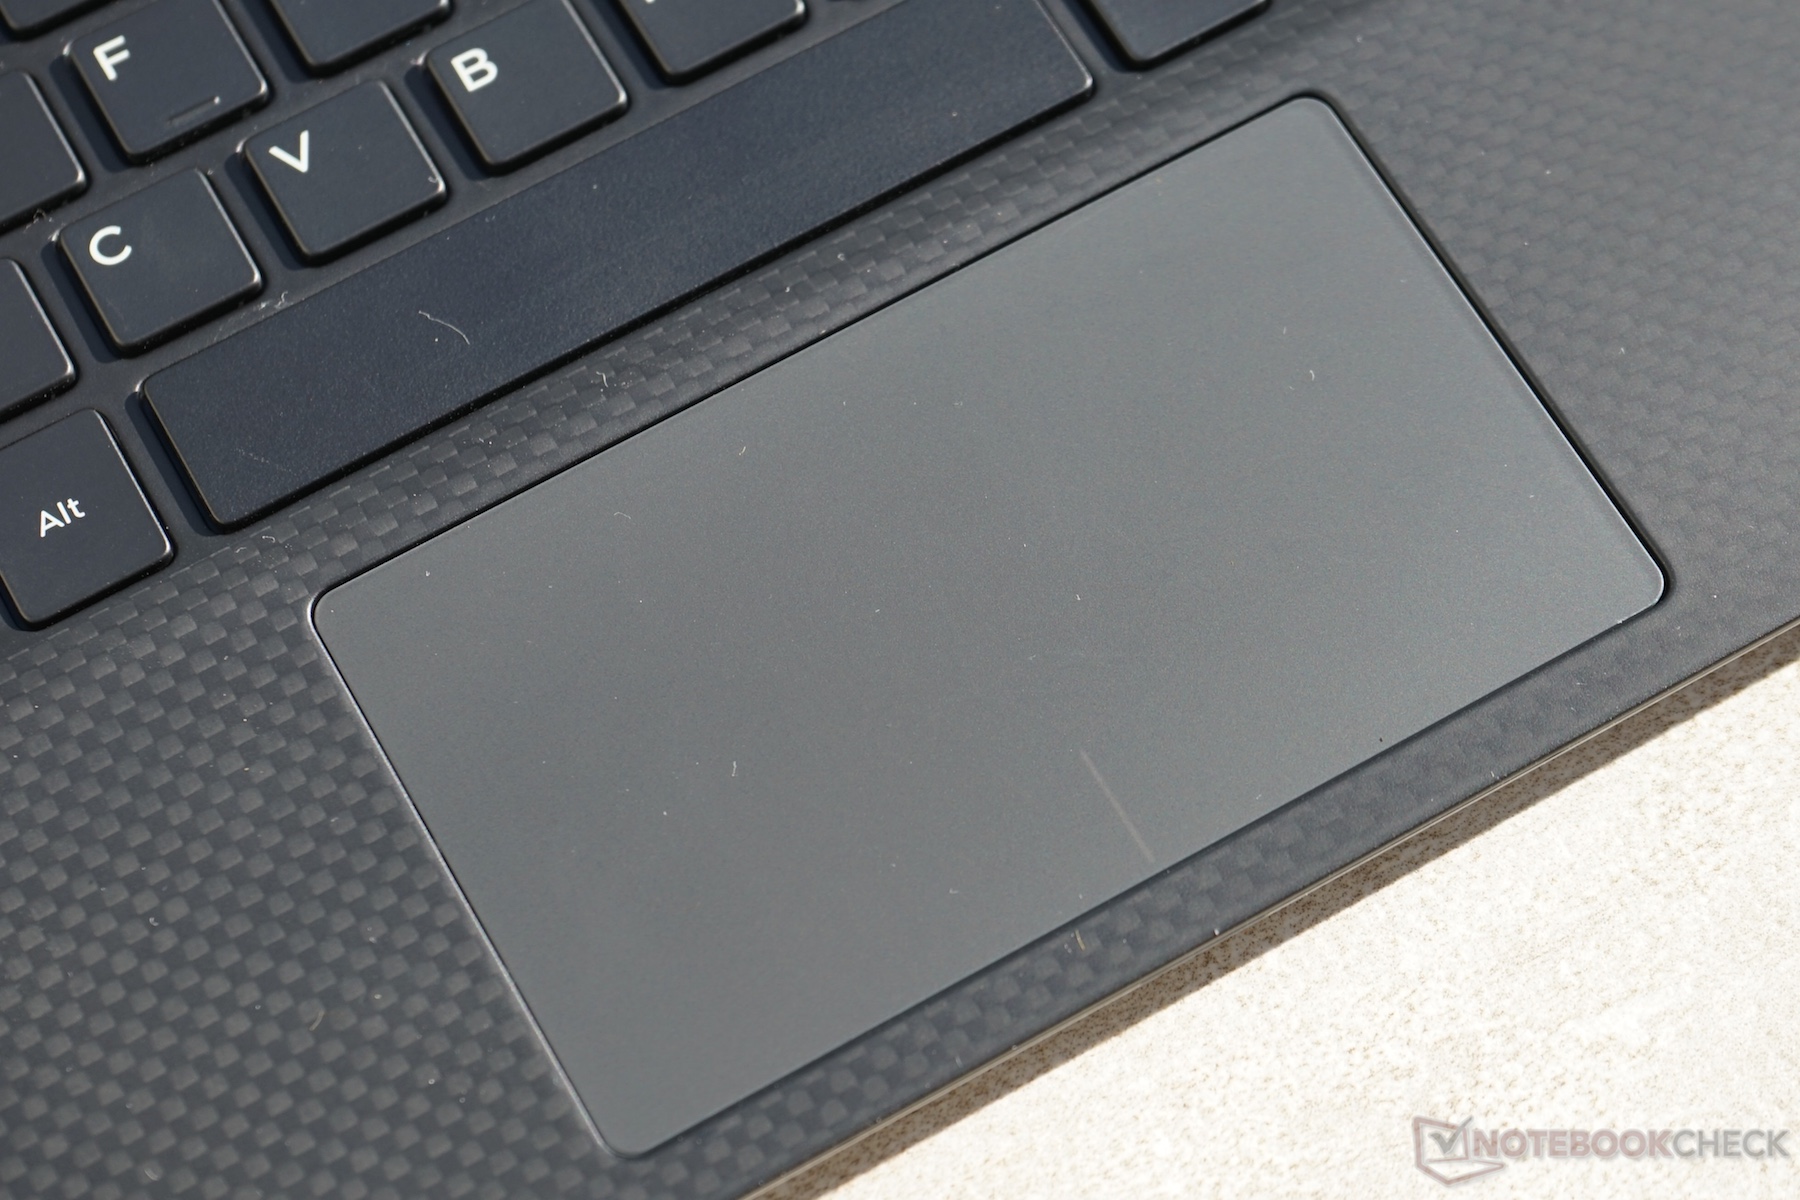
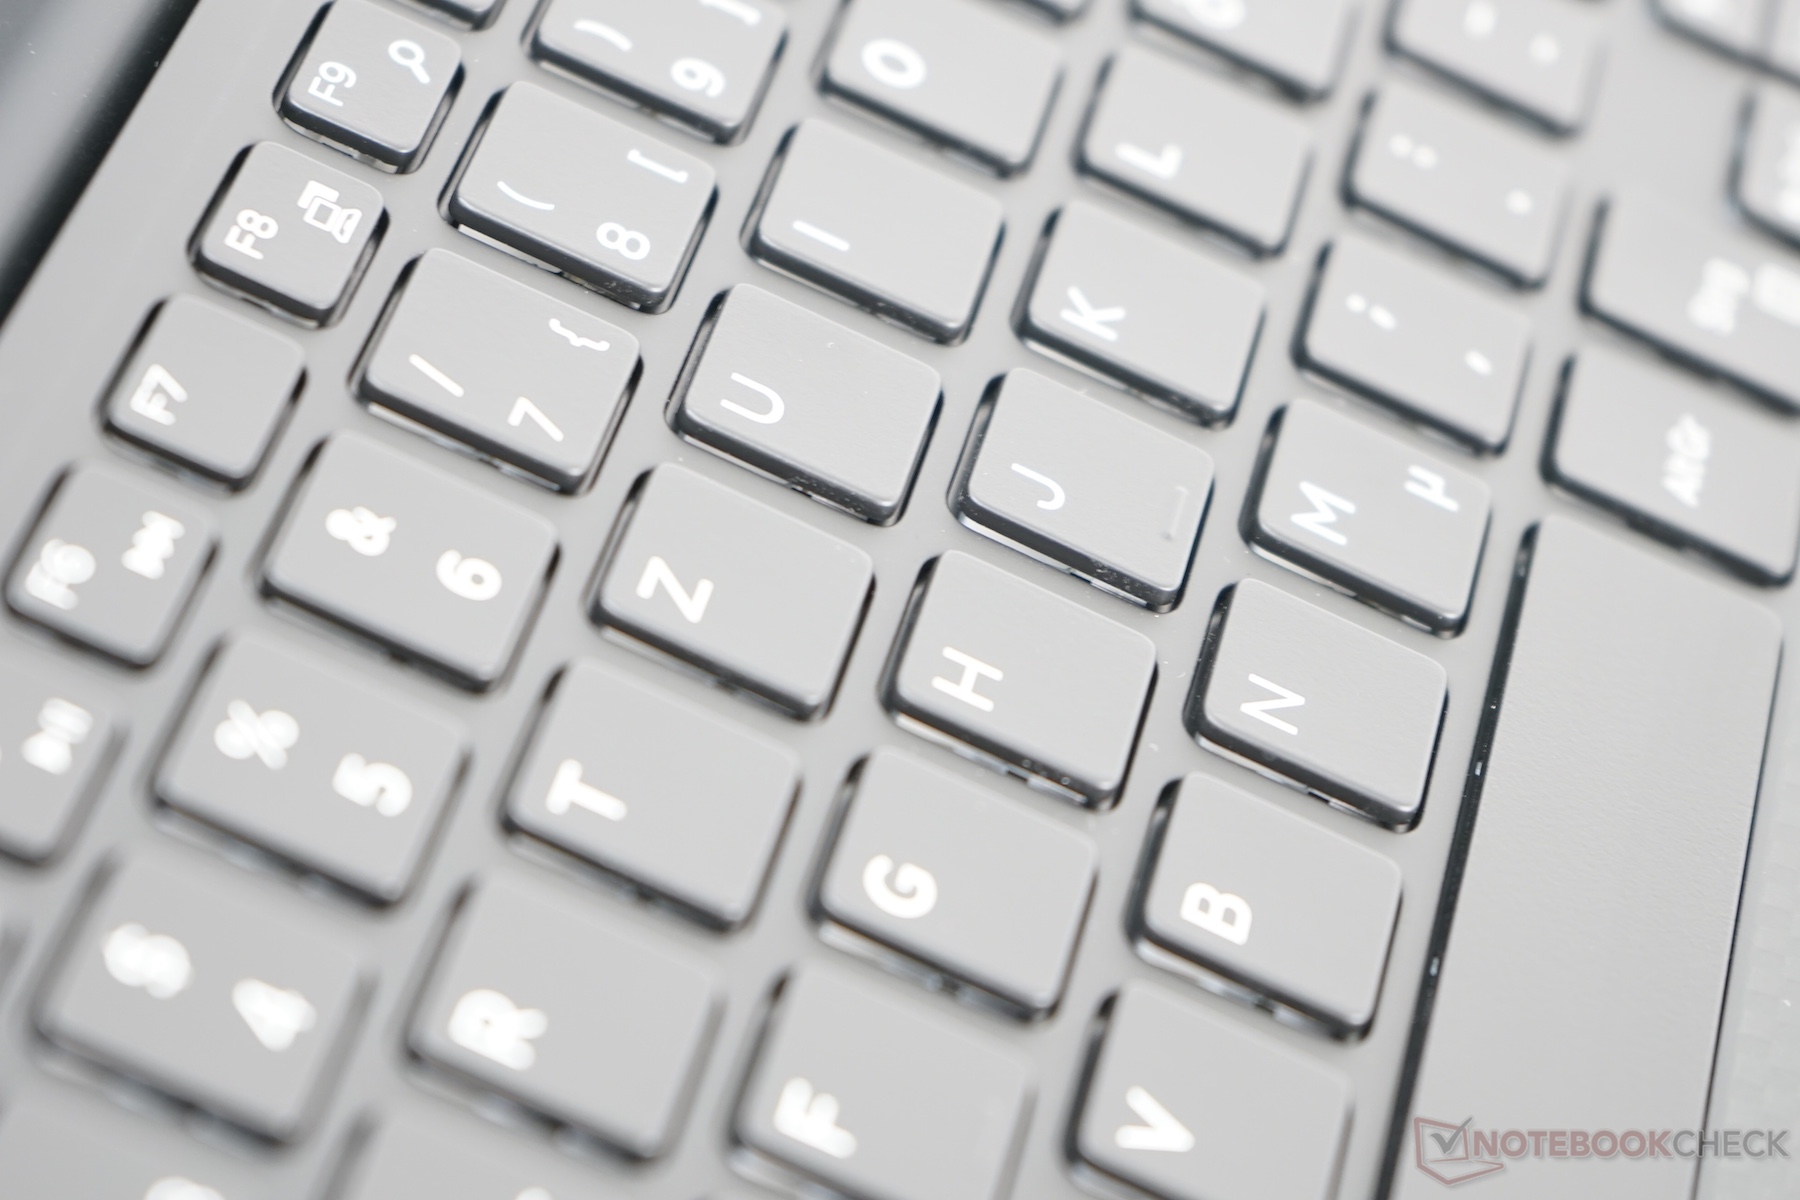
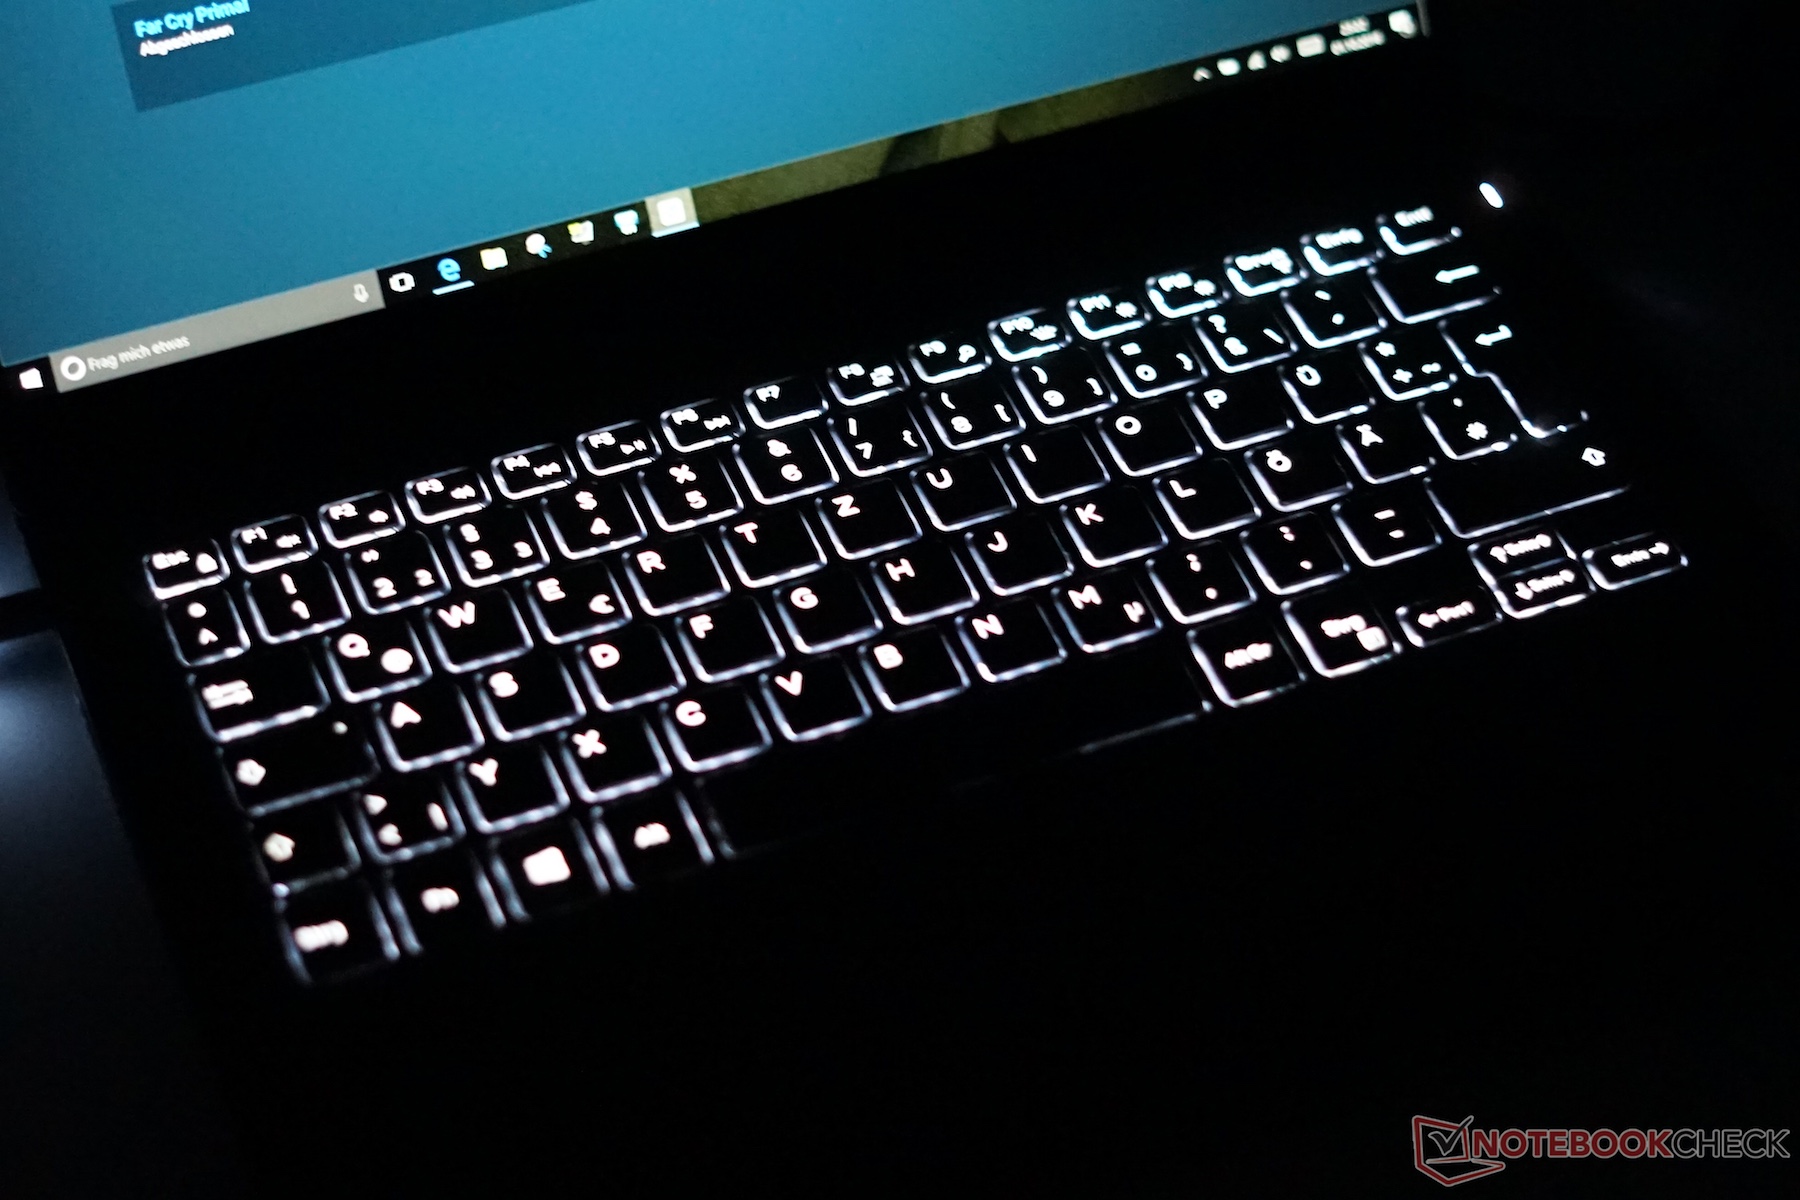
它的键盘和触控板属于Windows设备中的佼佼者,再结合上非常优秀的电池续航,XPS 13是一台非常值得考虑的商务本。我们希望能够尽快得到替换测试机,完成对性能表现的测试。
注:本文是基于完整评测的缩减版本,阅读完整的英文评测,请点击这里。
Price comparison
