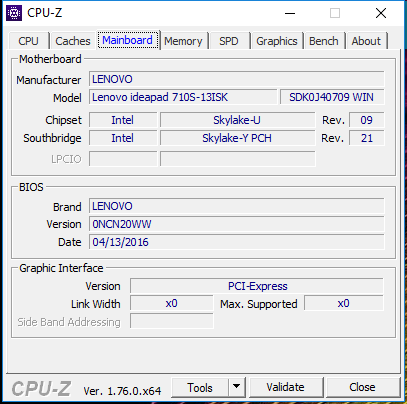
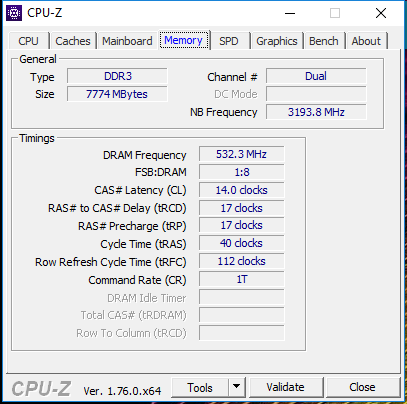
联想 IdeaPad 710S-13ISK (Core i7) 亚笔记本电脑简短评测


| |||||||||||||||||||||||||
Brightness Distribution: 87 %
Center on Battery: 343 cd/m²
Contrast: 956:1 (Black: 0.36 cd/m²)
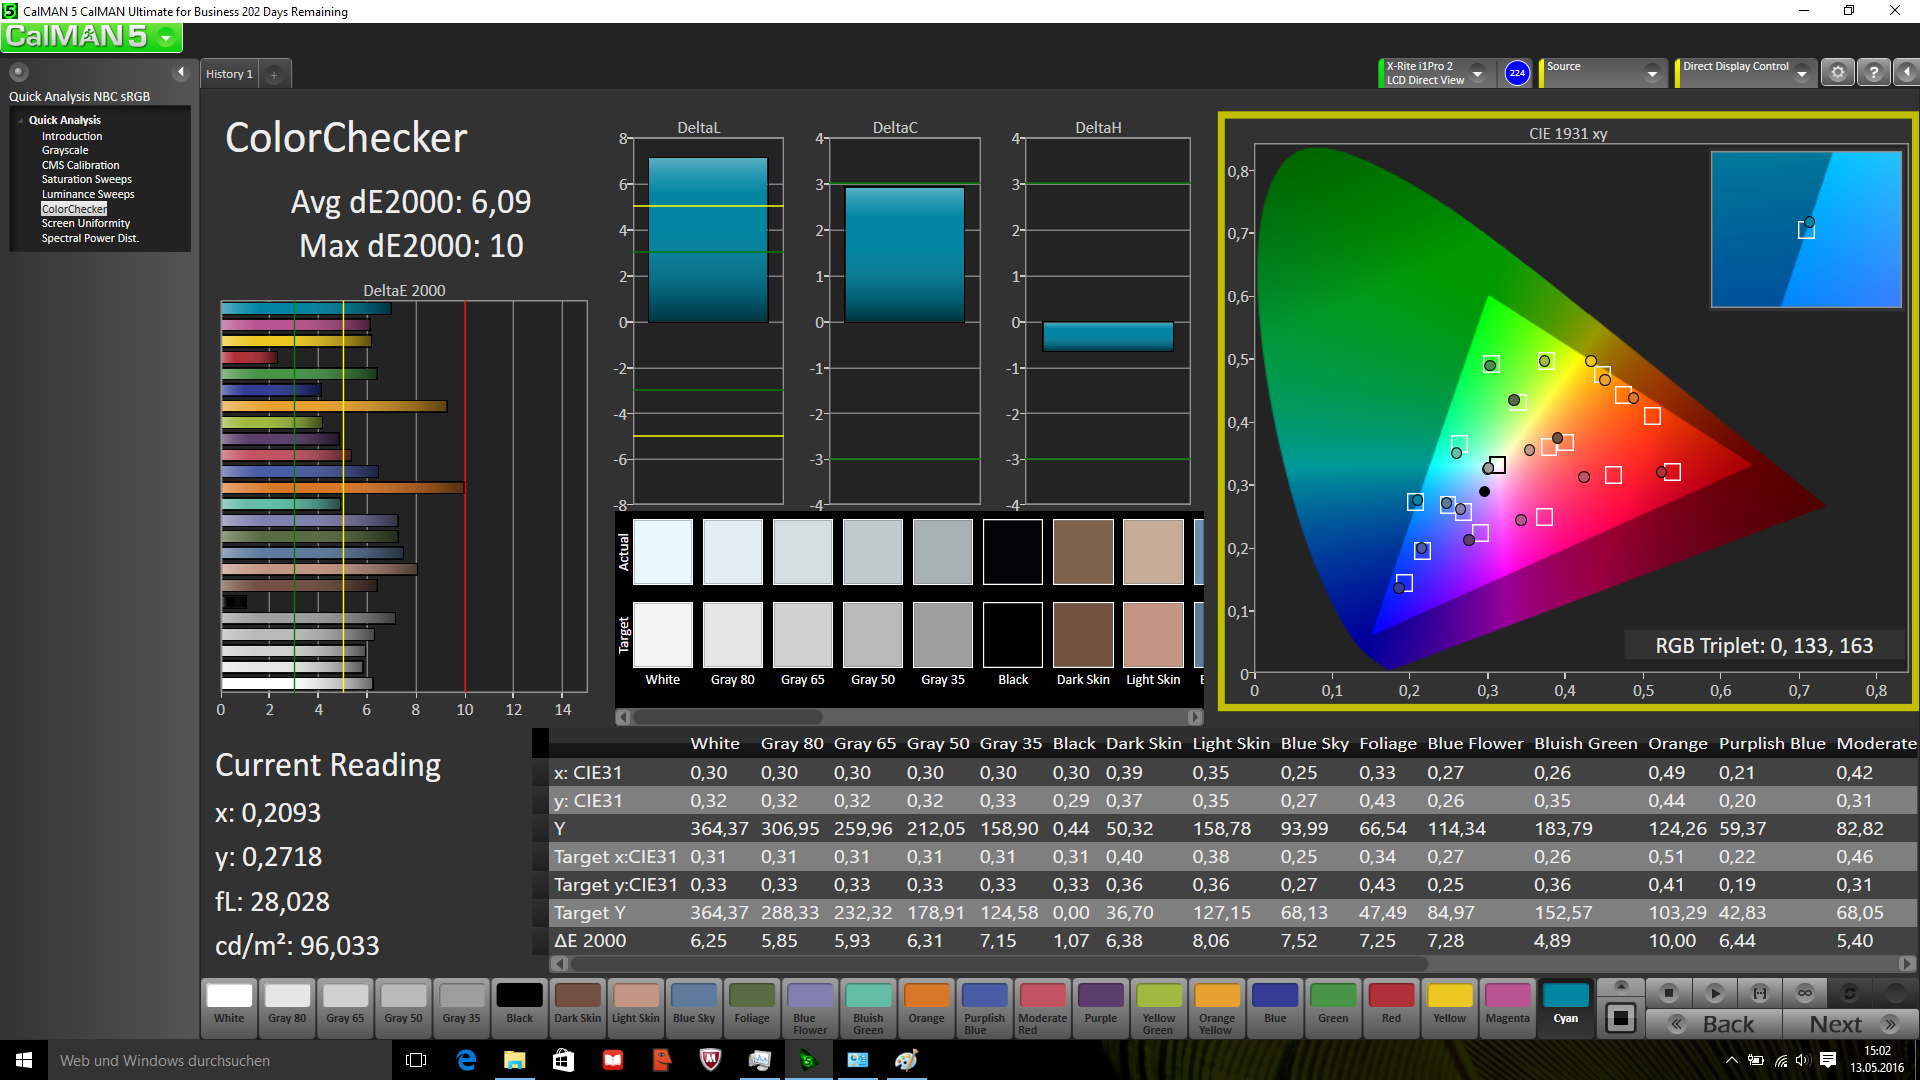
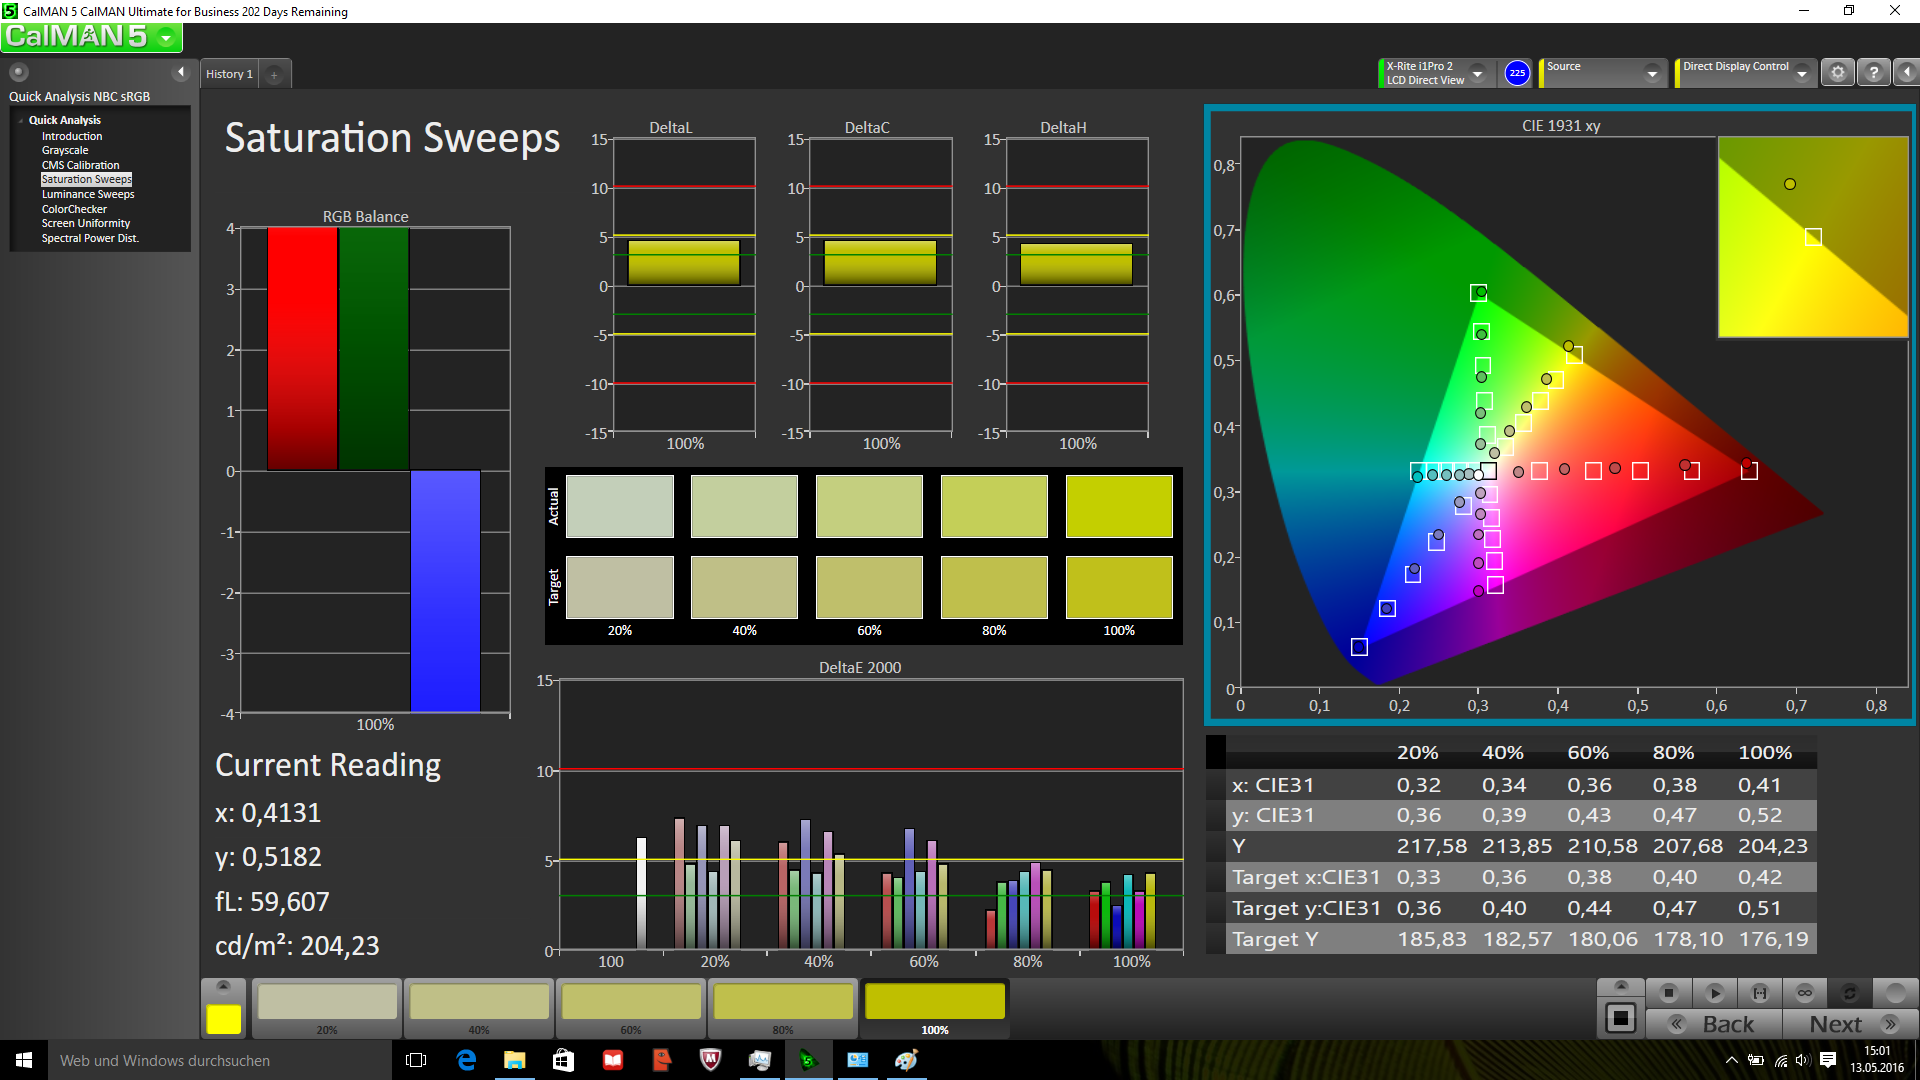
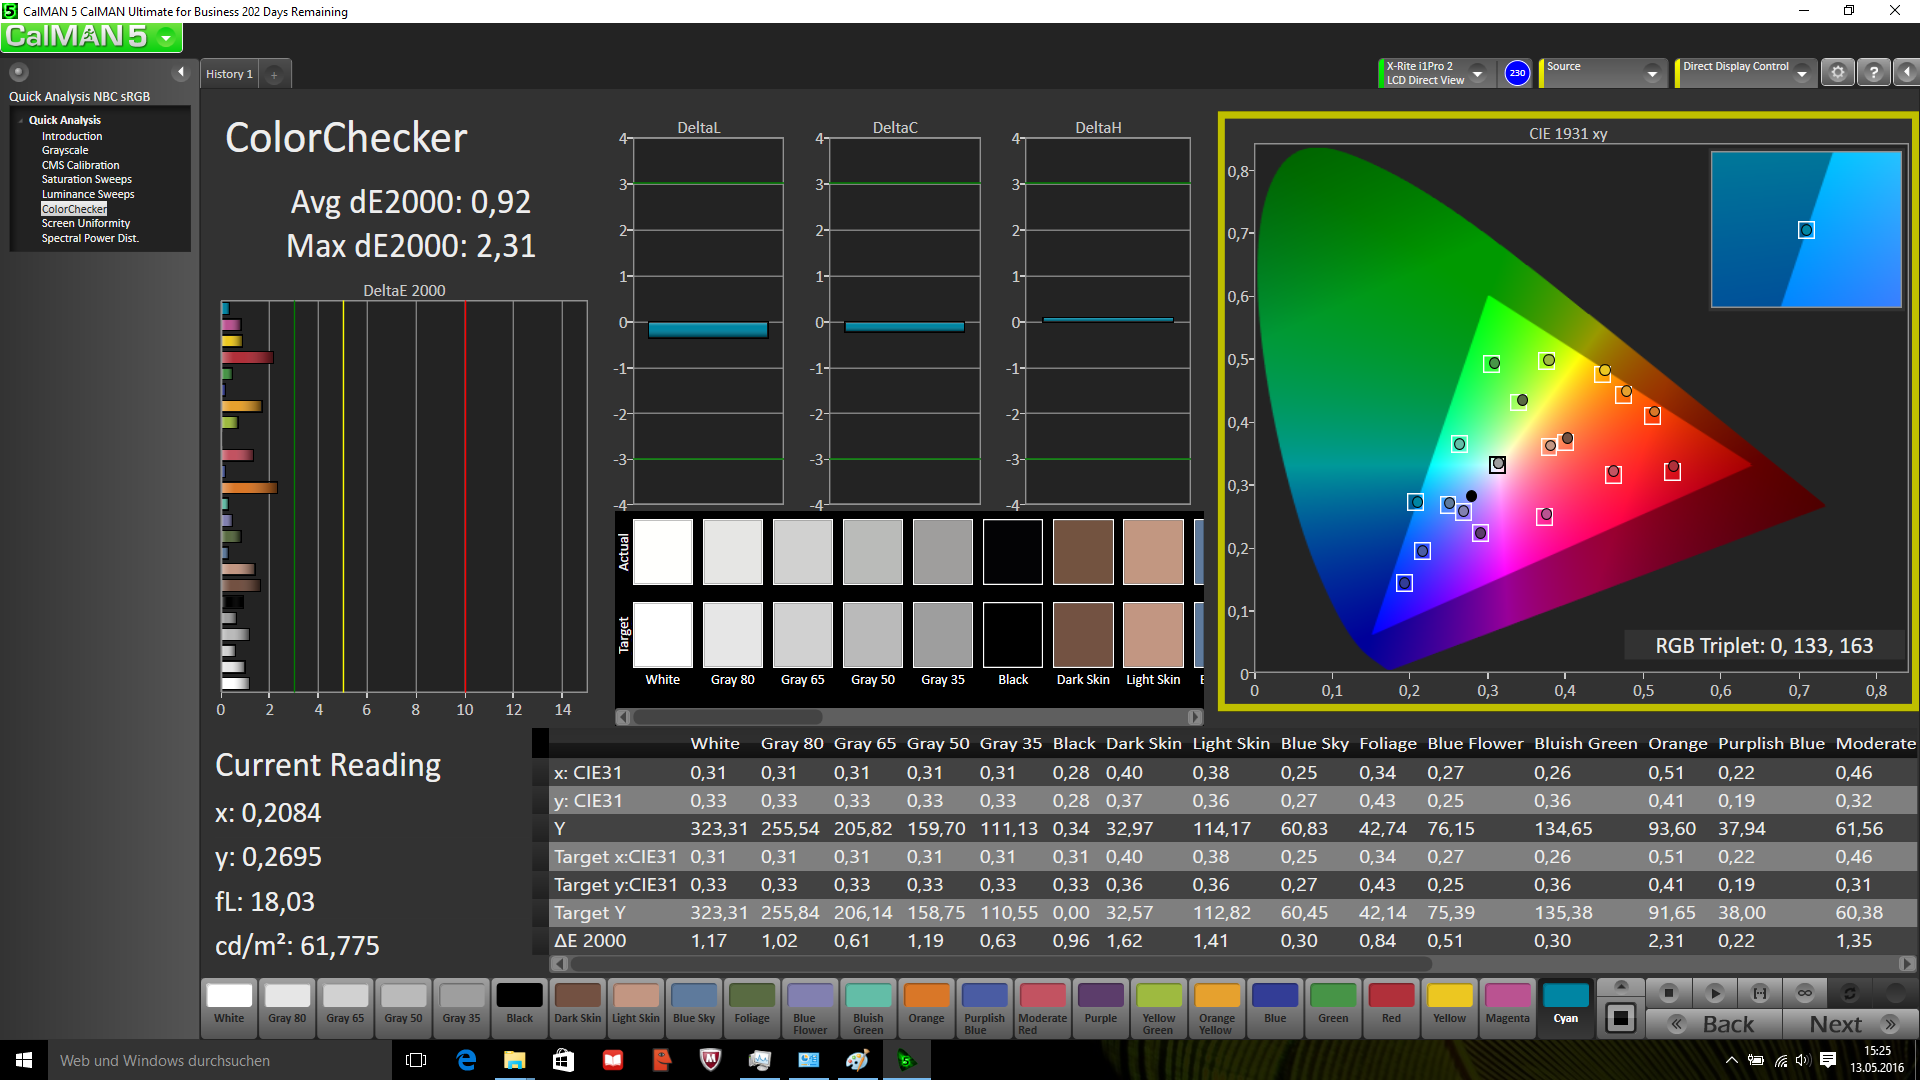
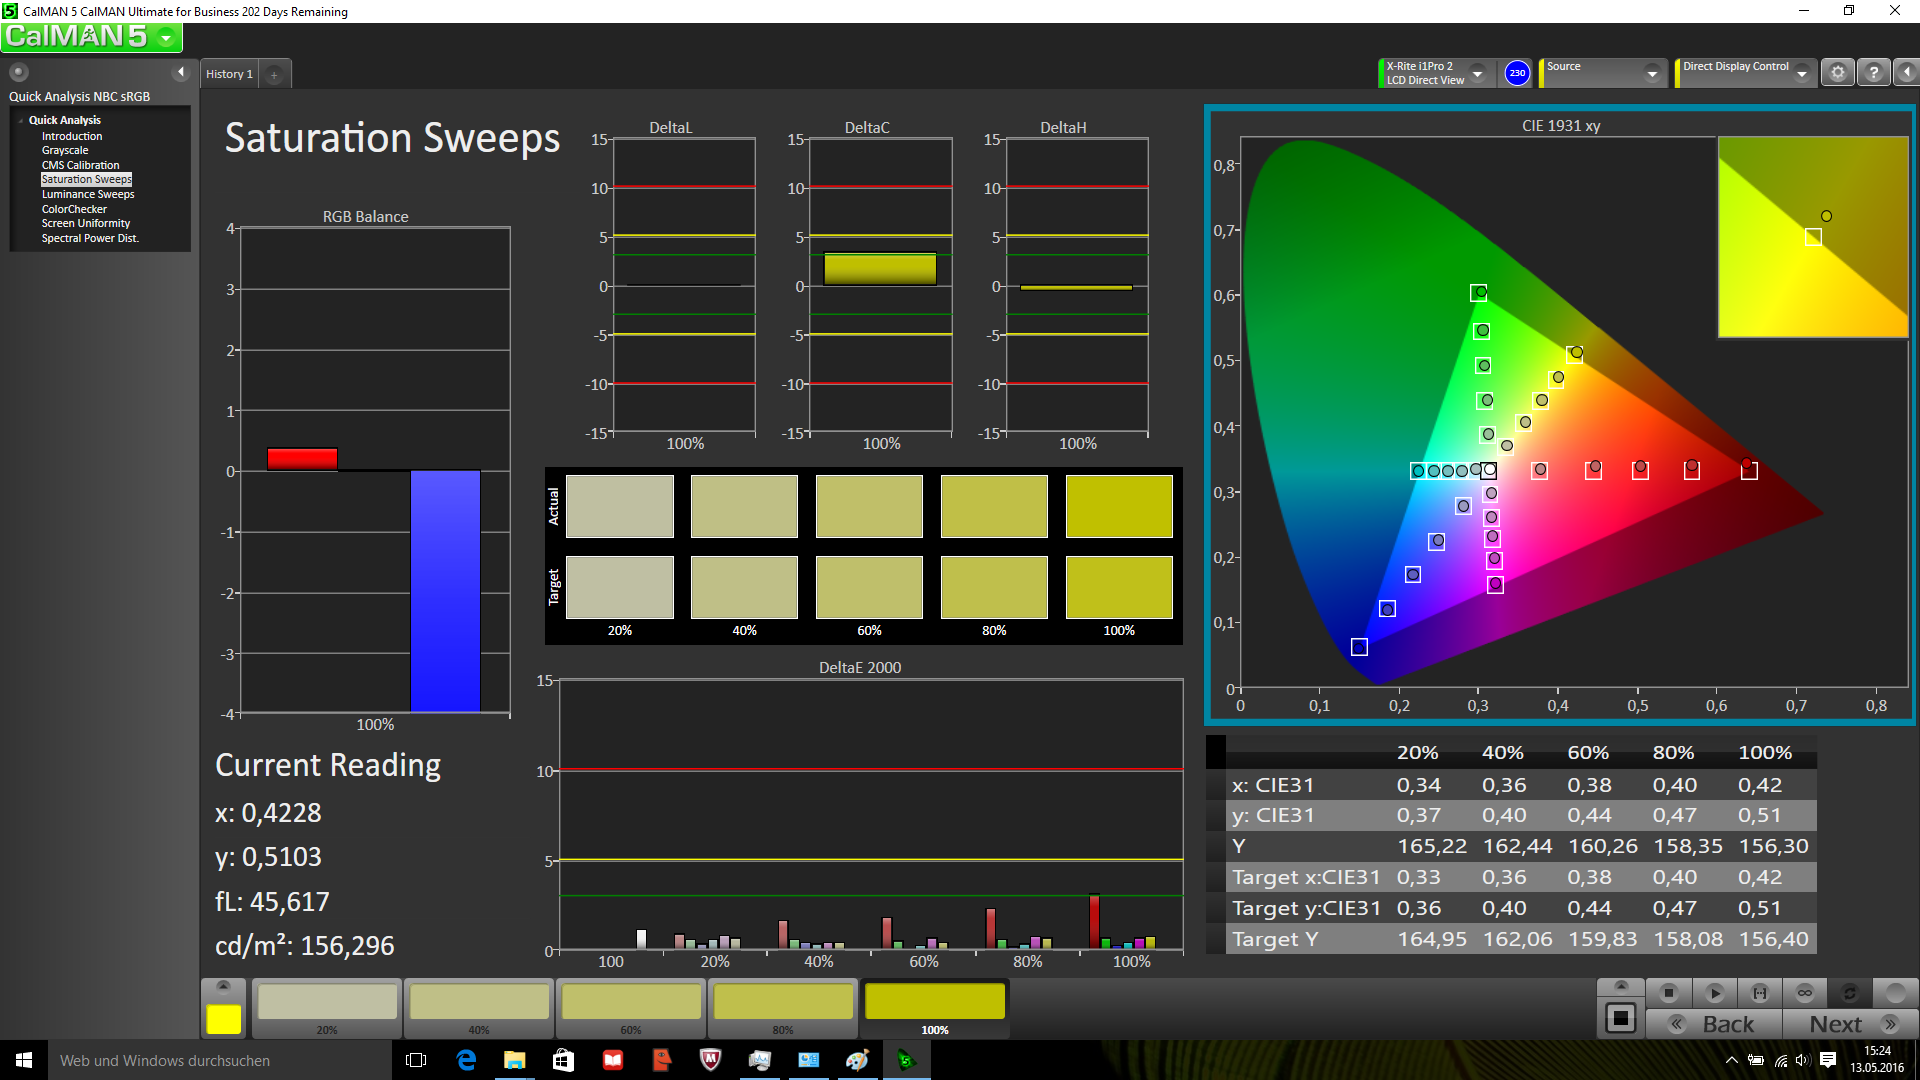
ΔE ColorChecker Calman: 6.09 | ∀{0.5-29.43 Ø4.71}
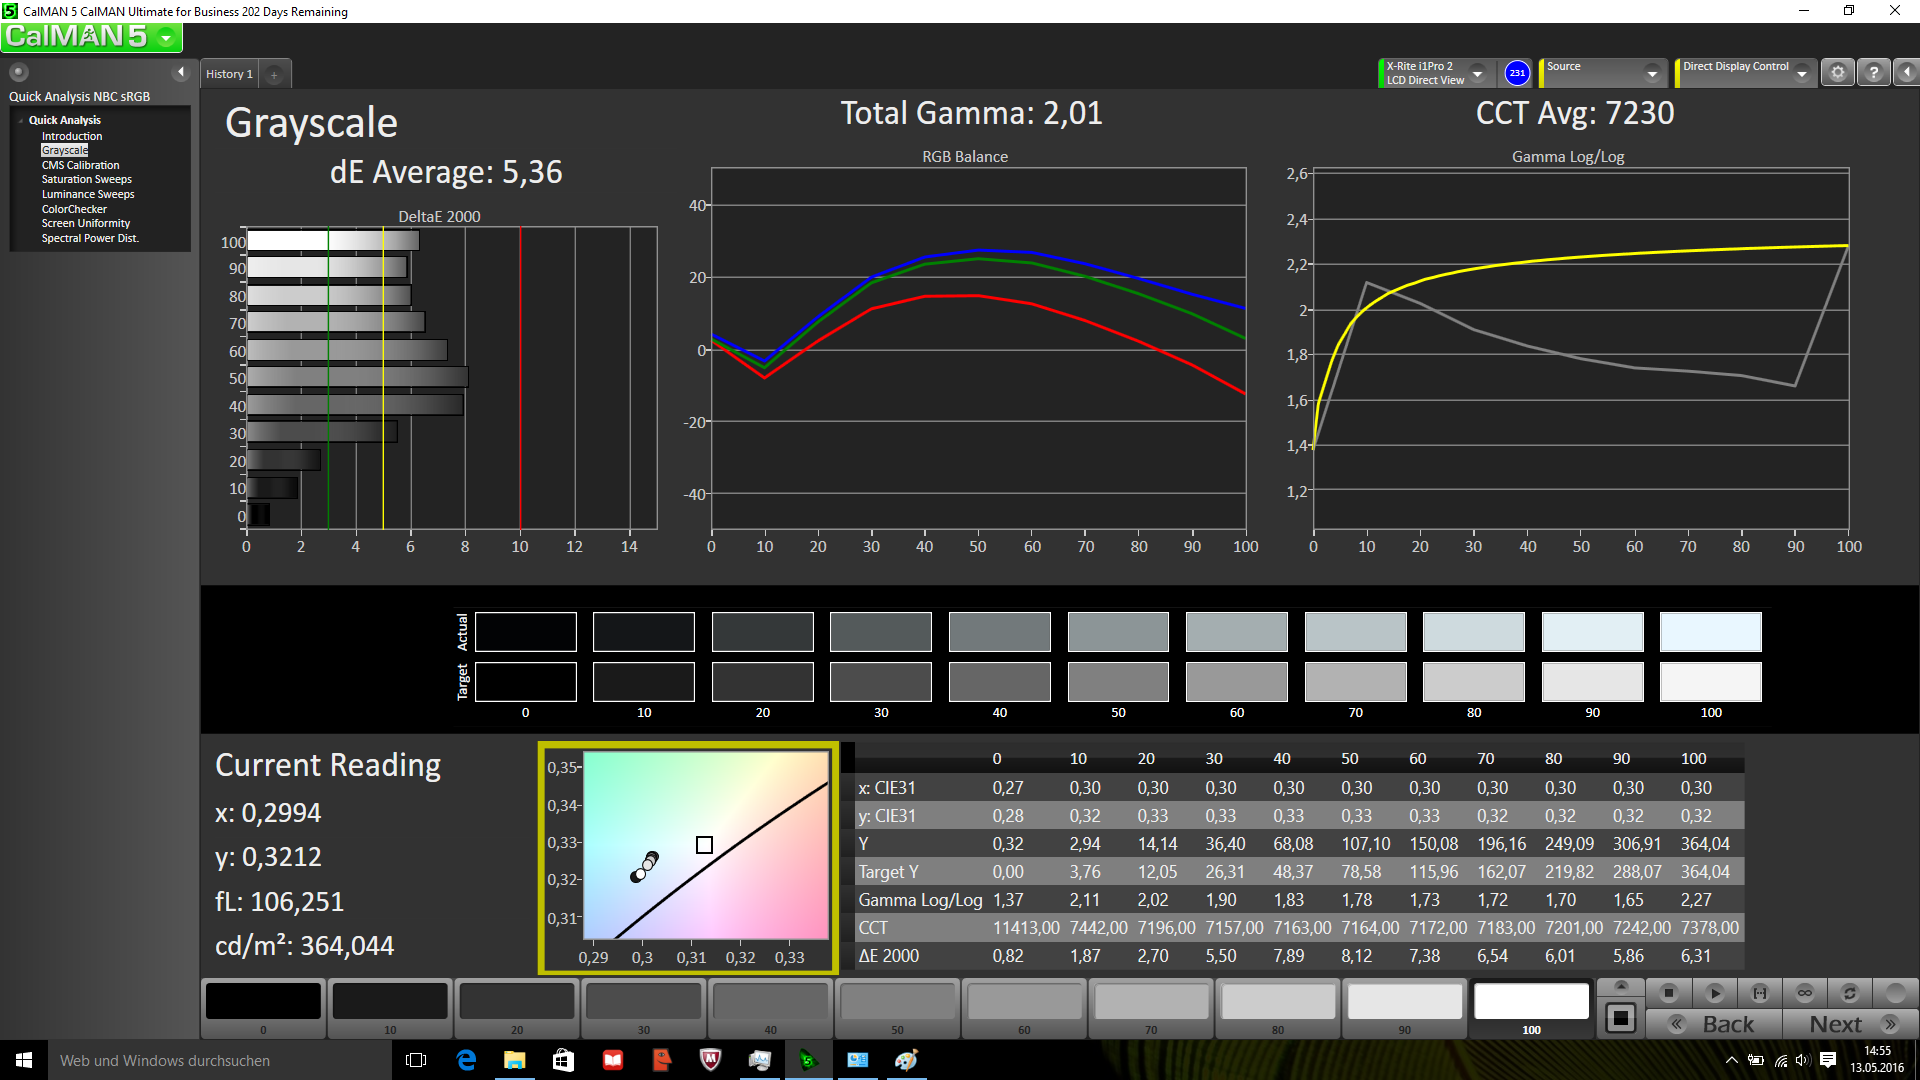
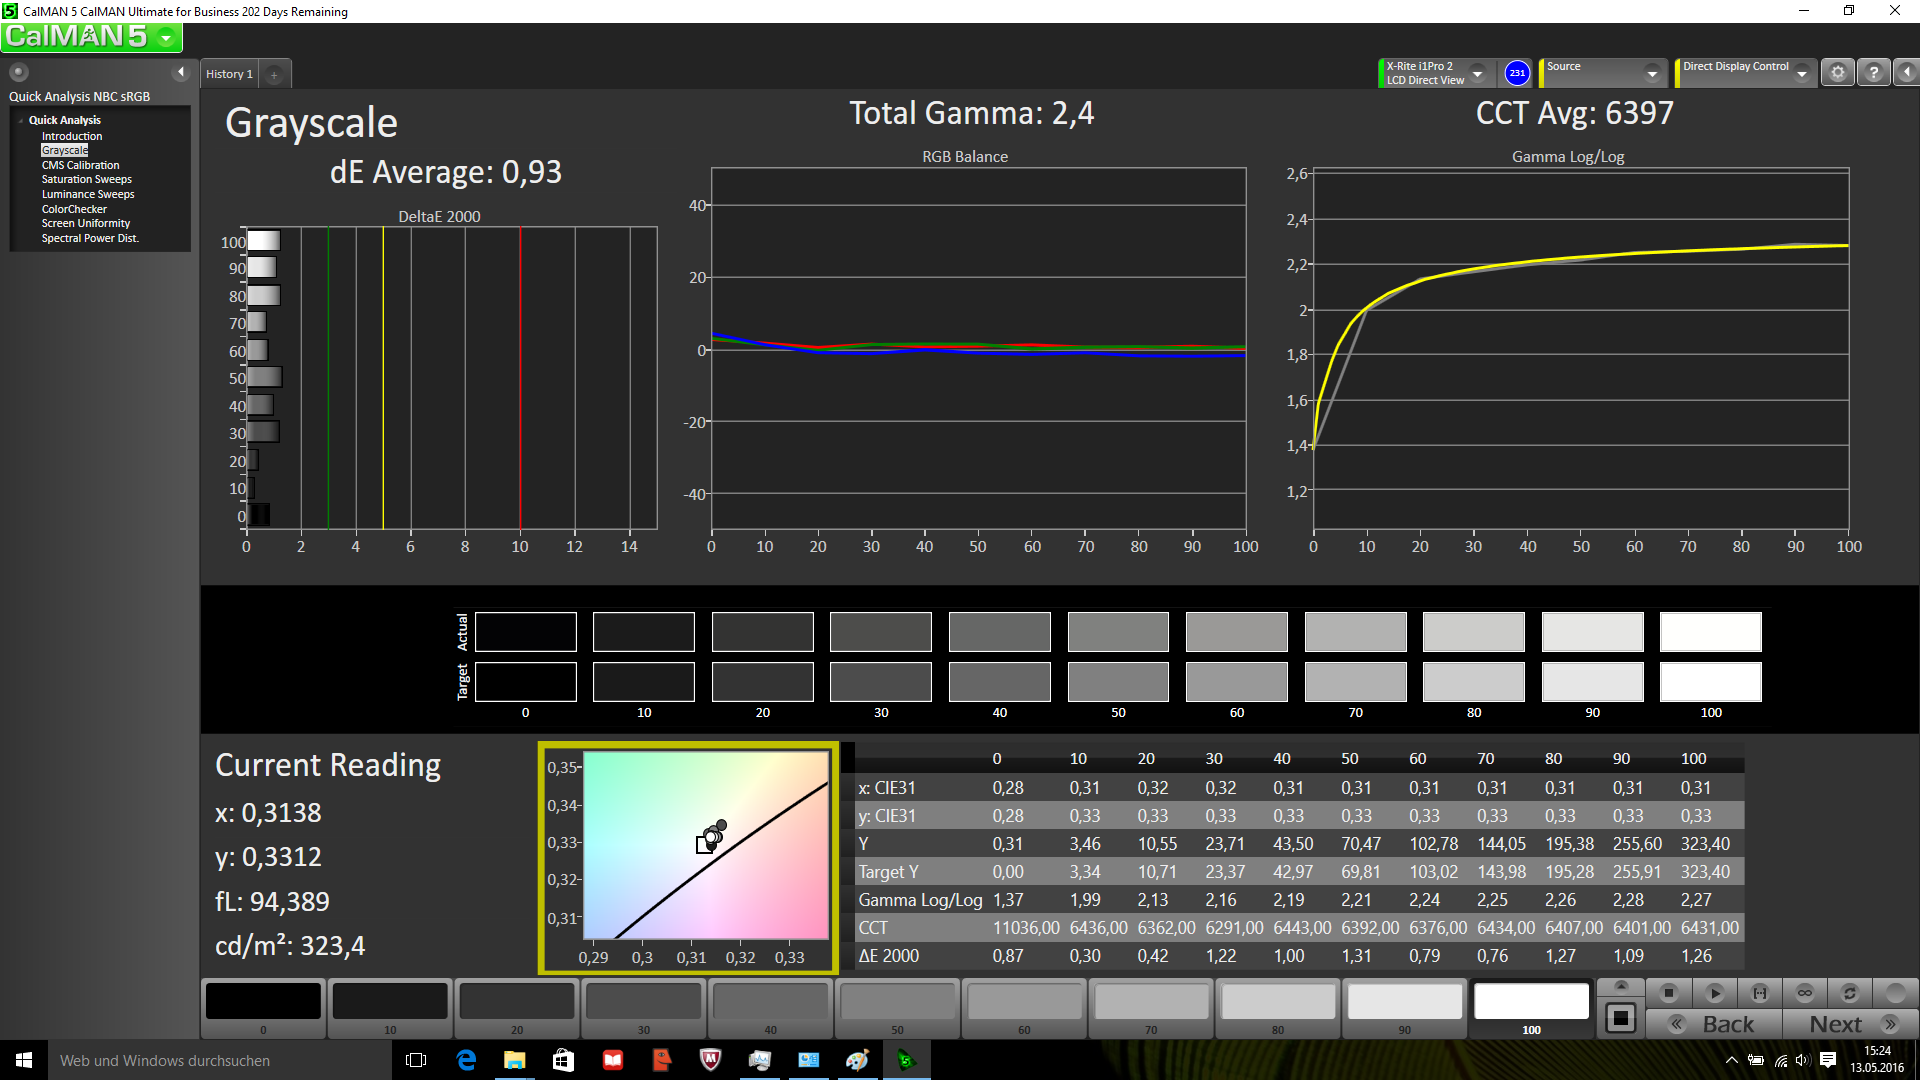
ΔE Greyscale Calman: 5.36 | ∀{0.09-98 Ø4.96}
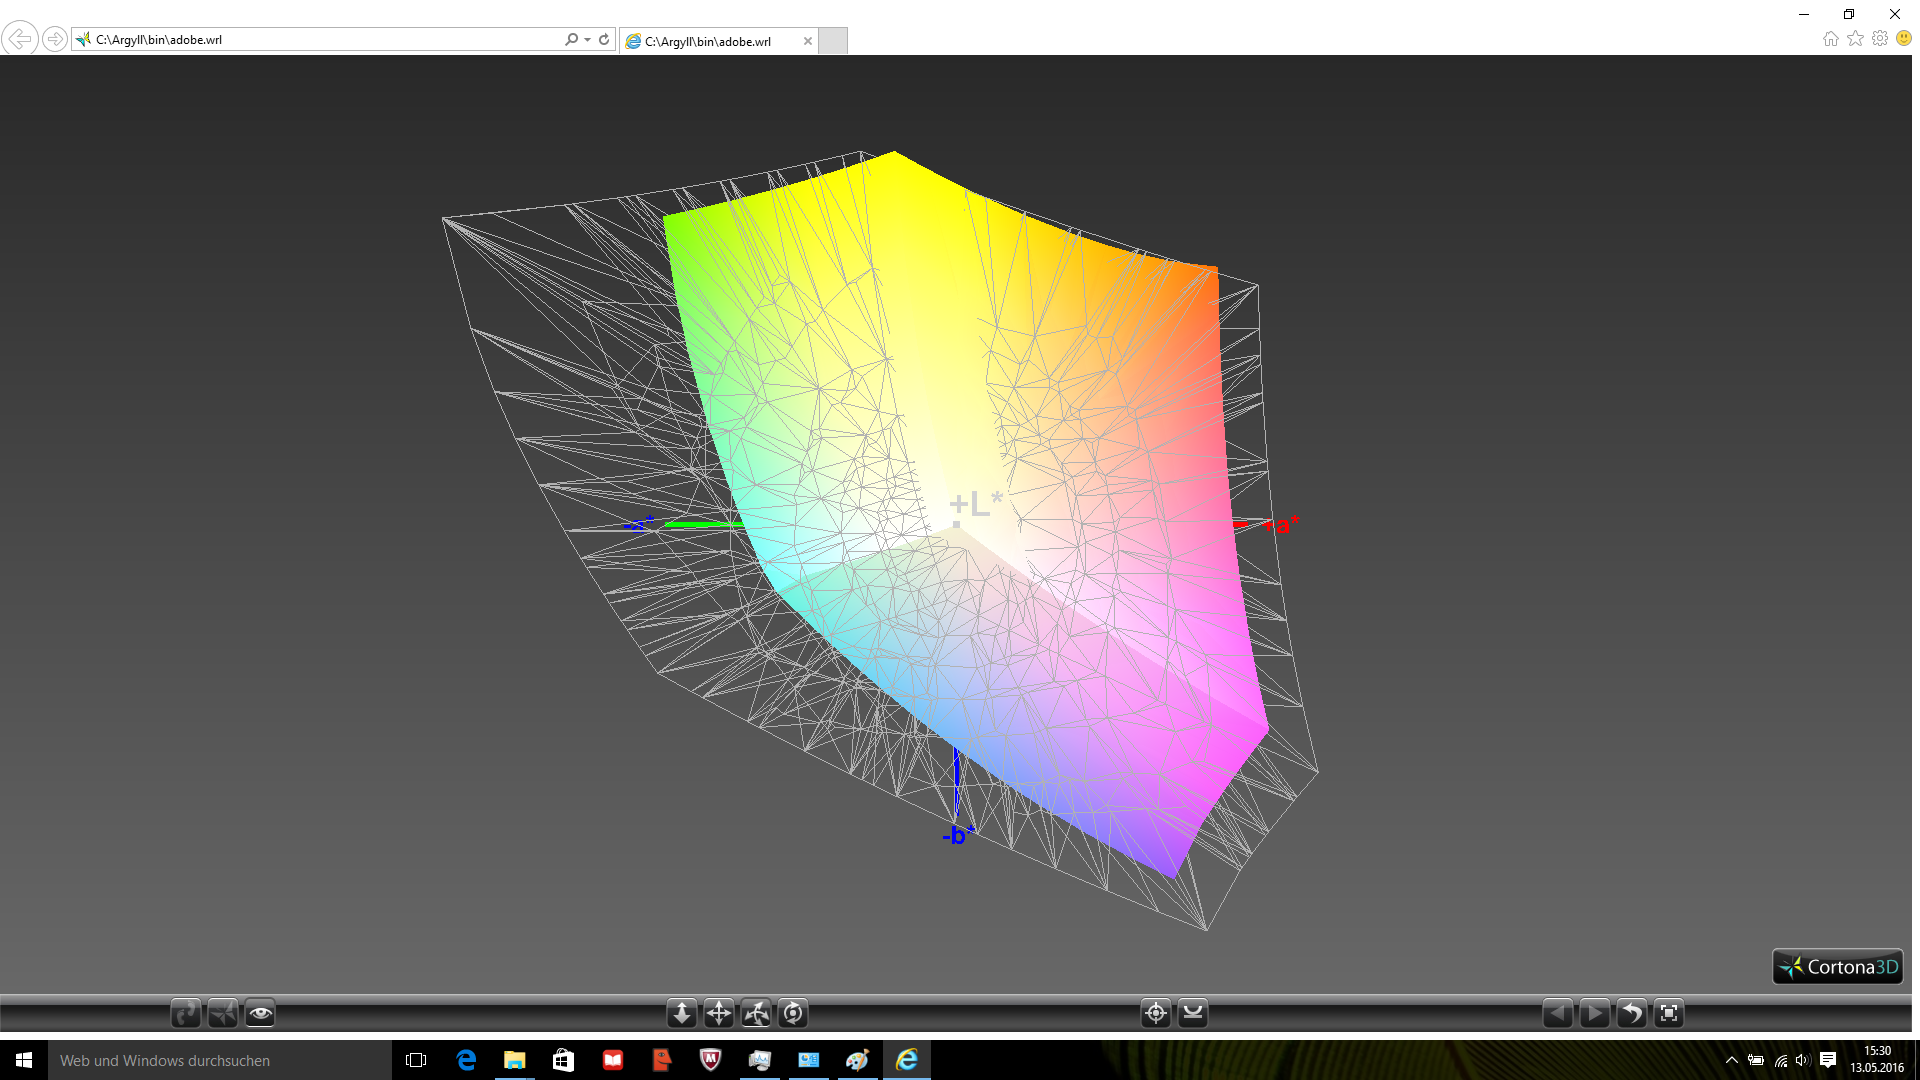
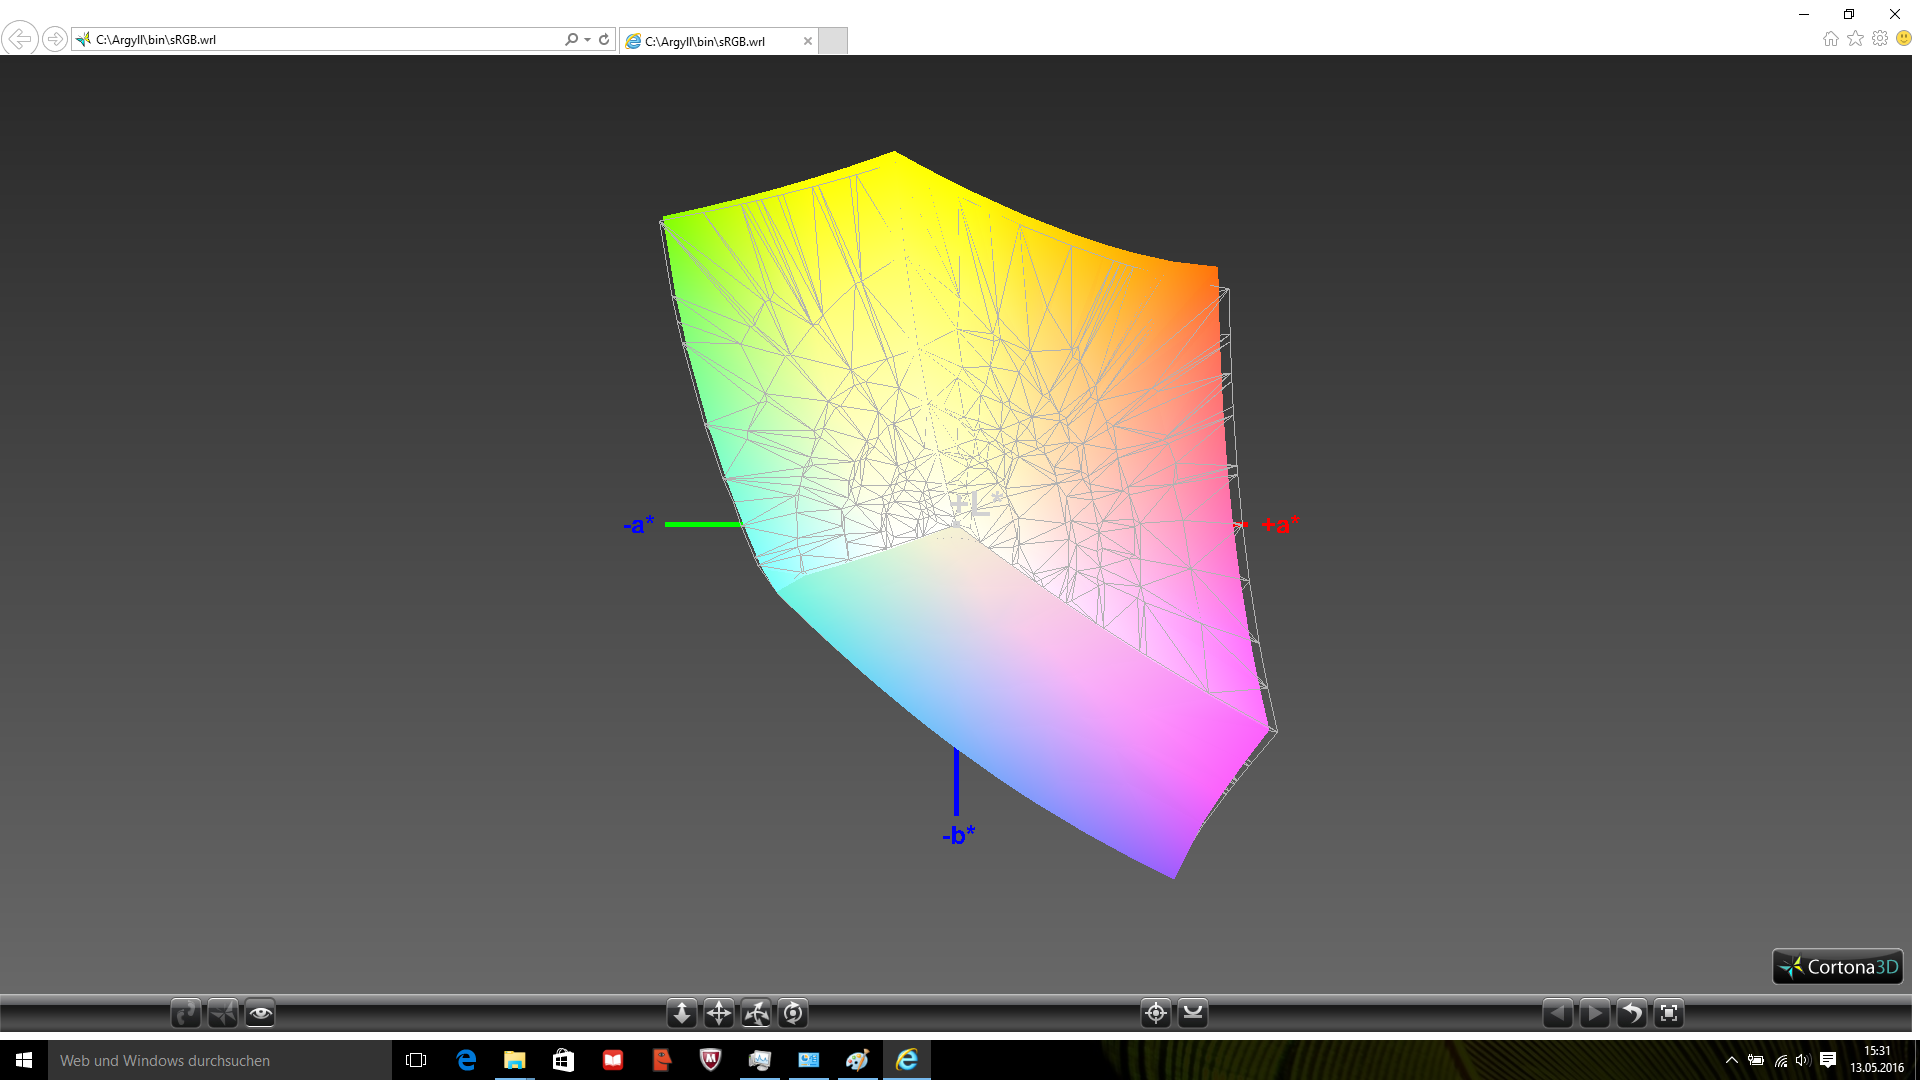
97.54% sRGB (Argyll 1.6.3 3D)
62.25% AdobeRGB 1998 (Argyll 1.6.3 3D)
68.4% AdobeRGB 1998 (Argyll 3D)
97.5% sRGB (Argyll 3D)
66.4% Display P3 (Argyll 3D)
Gamma: 2.01
CCT: 7230 K
| Lenovo IdeaPad 710S-13ISK | Acer Aspire S 13 S5-371-71QZ | Dell XPS 13 9350 WQXGA | Asus Zenbook UX305UA-FC040T | |
|---|---|---|---|---|
| Display | -4% | -3% | ||
| Display P3 Coverage (%) | 66.4 | 63.6 -4% | 65.1 -2% | |
| sRGB Coverage (%) | 97.5 | 92.3 -5% | 92.8 -5% | |
| AdobeRGB 1998 Coverage (%) | 68.4 | 65.4 -4% | 66.3 -3% | |
| Response Times | -10% | -11% | 17% | |
| Response Time Grey 50% / Grey 80% * (ms) | 52.4 ? | 50 ? 5% | 50.8 ? 3% | 25 ? 52% |
| Response Time Black / White * (ms) | 23.6 ? | 29.6 ? -25% | 29.6 ? -25% | 28 ? -19% |
| PWM Frequency (Hz) | 220 ? | 50 ? | ||
| Screen | 6% | 13% | -9% | |
| Brightness middle (cd/m²) | 344 | 375 9% | 307.5 -11% | 358 4% |
| Brightness (cd/m²) | 326 | 358 10% | 297 -9% | 351 8% |
| Brightness Distribution (%) | 87 | 87 0% | 92 6% | 86 -1% |
| Black Level * (cd/m²) | 0.36 | 0.39 -8% | 0.207 43% | 0.4 -11% |
| Contrast (:1) | 956 | 962 1% | 1486 55% | 895 -6% |
| Colorchecker dE 2000 * | 6.09 | 4.6 24% | 4.18 31% | 5.96 2% |
| Colorchecker dE 2000 max. * | 10 | 8.8 12% | 7.84 22% | 10.99 -10% |
| Greyscale dE 2000 * | 5.36 | 4 25% | 4.94 8% | 8.93 -67% |
| Gamma | 2.01 109% | 2.34 94% | 2.31 95% | 2.28 96% |
| CCT | 7230 90% | 7304 89% | 7645 85% | 6548 99% |
| Color Space (Percent of AdobeRGB 1998) (%) | 62.25 | 57.9 -7% | 59 -5% | 60 -4% |
| Color Space (Percent of sRGB) (%) | 97.54 | 88.7 -9% | 92 -6% | 93 -5% |
| Total Average (Program / Settings) | -2% /
3% | -1% /
7% | 2% /
-4% |
* ... smaller is better
Display Response Times
| ↔ Response Time Black to White | ||
|---|---|---|
| 23.6 ms ... rise ↗ and fall ↘ combined | ↗ 12 ms rise | |
| ↘ 11.6 ms fall | ||
| The screen shows good response rates in our tests, but may be too slow for competitive gamers. In comparison, all tested devices range from 0.1 (minimum) to 240 (maximum) ms. » 54 % of all devices are better. This means that the measured response time is worse than the average of all tested devices (19.8 ms). | ||
| ↔ Response Time 50% Grey to 80% Grey | ||
| 52.4 ms ... rise ↗ and fall ↘ combined | ↗ 18.4 ms rise | |
| ↘ 34 ms fall | ||
| The screen shows slow response rates in our tests and will be unsatisfactory for gamers. In comparison, all tested devices range from 0.165 (minimum) to 636 (maximum) ms. » 89 % of all devices are better. This means that the measured response time is worse than the average of all tested devices (30.9 ms). | ||
Screen Flickering / PWM (Pulse-Width Modulation)
| Screen flickering / PWM detected | 220 Hz | ≤ 50 % brightness setting |
The display backlight flickers at 220 Hz (worst case, e.g., utilizing PWM) Flickering detected at a brightness setting of 50 % and below. There should be no flickering or PWM above this brightness setting. The frequency of 220 Hz is relatively low, so sensitive users will likely notice flickering and experience eyestrain at the stated brightness setting and below. In comparison: 52 % of all tested devices do not use PWM to dim the display. If PWM was detected, an average of 7748 (minimum: 5 - maximum: 343500) Hz was measured. | ||
| Cinebench R15 | |
| CPU Multi 64Bit | |
| Lenovo IdeaPad 710S-13ISK | |
| Asus Zenbook UX305UA-FC040T | |
| Dell XPS 13 9350 WQXGA | |
| Acer Aspire S 13 S5-371-71QZ | |
| CPU Single 64Bit | |
| Dell XPS 13 9350 WQXGA | |
| Lenovo IdeaPad 710S-13ISK | |
| Acer Aspire S 13 S5-371-71QZ | |
| Asus Zenbook UX305UA-FC040T | |
| PCMark 8 | |
| Home Score Accelerated v2 | |
| Lenovo IdeaPad 710S-13ISK | |
| Acer Aspire S 13 S5-371-71QZ | |
| Asus Zenbook UX305UA-FC040T | |
| Dell XPS 13 9350 WQXGA | |
| Work Score Accelerated v2 | |
| Lenovo IdeaPad 710S-13ISK | |
| Acer Aspire S 13 S5-371-71QZ | |
| Asus Zenbook UX305UA-FC040T | |
| Dell XPS 13 9350 WQXGA | |
| PCMark 8 Home Score Accelerated v2 | 3883 points | |
| PCMark 8 Work Score Accelerated v2 | 4680 points | |
Help | ||
| Lenovo IdeaPad 710S-13ISK Samsung PM951 NVMe MZVLV256 | Acer Aspire S 13 S5-371-71QZ LiteOn CV1-8B512 | Dell XPS 13 9350 WQXGA Samsung PM951 NVMe 512 GB | Asus Zenbook UX305UA-FC040T SK Hynix Canvas SC300 512GB M.2 (HFS512G39MND) | |
|---|---|---|---|---|
| AS SSD | -46% | 26% | -41% | |
| Seq Read (MB/s) | 1273 | 486 -62% | 1442 13% | 496.8 -61% |
| 4K Read (MB/s) | 39.13 | 27 -31% | 38.29 -2% | 26.87 -31% |
| 4K-64 Read (MB/s) | 1091 | 290 -73% | 1497 37% | 375.5 -66% |
| Score Write (Points) | 429 | 347 -19% | 664 55% | 405 -6% |
| CrystalDiskMark 3.0 | -44% | 3% | -49% | |
| Read Seq (MB/s) | 1193 | 502 -58% | 1236 4% | 469.1 -61% |
| Read 4k (MB/s) | 42.43 | 29.69 -30% | 42.36 0% | 28.08 -34% |
| Read 4k QD32 (MB/s) | 549 | 301.3 -45% | 572 4% | 262 -52% |
| Total Average (Program / Settings) | -45% /
-45% | 15% /
16% | -45% /
-44% |

| 3DMark 11 - 1280x720 Performance GPU | |
| Lenovo IdeaPad 710S-13ISK | |
| Dell XPS 13 9350 WQXGA | |
| Dell Latitude E7470 N001LE747014EMEA | |
| Acer Aspire S 13 S5-371-71QZ | |
| Asus Zenbook UX305UA-FC040T | |
| 3DMark | |
| 1280x720 Ice Storm Standard Graphics | |
| Dell Latitude E7470 N001LE747014EMEA | |
| Lenovo IdeaPad 710S-13ISK | |
| Dell XPS 13 9350 WQXGA | |
| Asus Zenbook UX305UA-FC040T | |
| 1280x720 Cloud Gate Standard Graphics | |
| Lenovo IdeaPad 710S-13ISK | |
| Dell XPS 13 9350 WQXGA | |
| Dell Latitude E7470 N001LE747014EMEA | |
| Asus Zenbook UX305UA-FC040T | |
| 3DMark 11 Performance | 2244 points | |
| 3DMark Ice Storm Standard Score | 60021 points | |
| 3DMark Cloud Gate Standard Score | 7646 points | |
Help | ||
| low | med. | high | ultra | |
|---|---|---|---|---|
| Crysis 3 (2013) | 37.6 | 27.6 | 19.6 | 6.6 |
| BioShock Infinite (2013) | 69.1 | 42.2 | 35.7 | 10 |
| Metro: Last Light (2013) | 21.9 | 9.5 | ||
| Battlefield 4 (2013) | 29 small graphical problems | 18 small graphical problems | 11.4 | |
| Dirt Rally (2015) | 119.2 | 30.4 | 14.3 | 12.5 |
| The Witcher 3 (2015) | 17.8 | 12 | 0 | |
| Mad Max (2015) | 28.9 | 13.2 | ||
| Anno 2205 (2015) | 29 small graphical problems | 15 small graphical problems | 6 small graphical problems | |
| Star Wars Battlefront (2015) | 40.2 | 22.9 | 0 | |
| Assassin's Creed Syndicate (2015) | 4.9 | |||
| Rainbow Six Siege (2015) | 39.1 | 24.2 | 13.5 | 11 |
| Rise of the Tomb Raider (2016) | 21.5 | 0 | 0 | |
| XCOM 2 (2016) | 18 | 6.7 | ||
| Far Cry Primal (2016) | 22 | 10 | 8 | |
| The Division (2016) | 21.7 | 12.9 | ||
| Hitman 2016 (2016) | 13.5 | 13.8 | 7.6 |
Noise level
| Idle |
| 30.1 / 30.1 / 30.1 dB(A) |
| Load |
| 39.2 / 39.3 dB(A) |
 | ||
30 dB silent 40 dB(A) audible 50 dB(A) loud |
||
min: | ||
(±) The maximum temperature on the upper side is 42 °C / 108 F, compared to the average of 35.9 °C / 97 F, ranging from 21.4 to 59 °C for the class Subnotebook.
(+) The bottom heats up to a maximum of 37.5 °C / 100 F, compared to the average of 39.2 °C / 103 F
(+) In idle usage, the average temperature for the upper side is 31.3 °C / 88 F, compared to the device average of 30.8 °C / 87 F.
(+) The palmrests and touchpad are cooler than skin temperature with a maximum of 29.9 °C / 85.8 F and are therefore cool to the touch.
(±) The average temperature of the palmrest area of similar devices was 28.2 °C / 82.8 F (-1.7 °C / -3 F).
| Off / Standby | |
| Idle | |
| Load |
|
Key:
min: | |
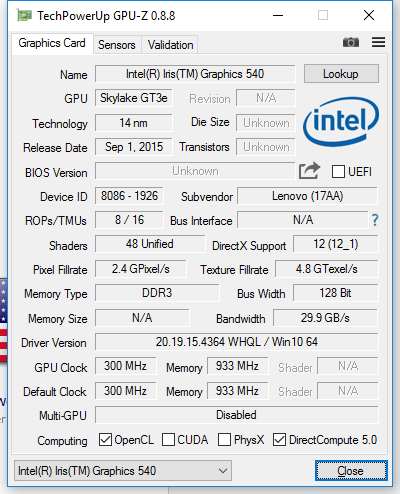
| Lenovo IdeaPad 710S-13ISK Iris Graphics 540, 6560U, Samsung PM951 NVMe MZVLV256 | Acer Aspire S 13 S5-371-71QZ HD Graphics 520, 6500U, LiteOn CV1-8B512 | Dell XPS 13 9350 WQXGA Iris Graphics 540, 6560U, Samsung PM951 NVMe 512 GB | Asus Zenbook UX305UA-FC040T HD Graphics 520, 6500U, SK Hynix Canvas SC300 512GB M.2 (HFS512G39MND) | |
|---|---|---|---|---|
| Battery runtime | 18% | -4% | 39% | |
| Reader / Idle (h) | 13.5 | 17.1 27% | 10.1 -25% | 23.8 76% |
| H.264 (h) | 8.1 | 9.1 12% | ||
| WiFi v1.3 (h) | 7 | 7.9 13% | 5.2 -26% | 9.4 34% |
| Load (h) | 1.5 | 1.7 13% | 2.1 40% | 2 33% |
Pros
Cons
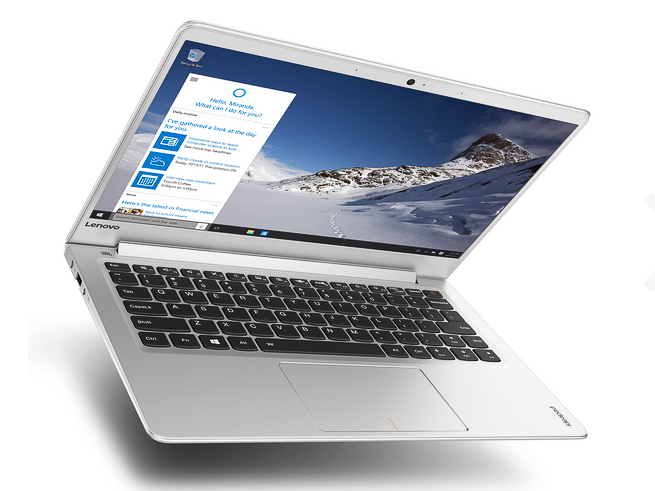
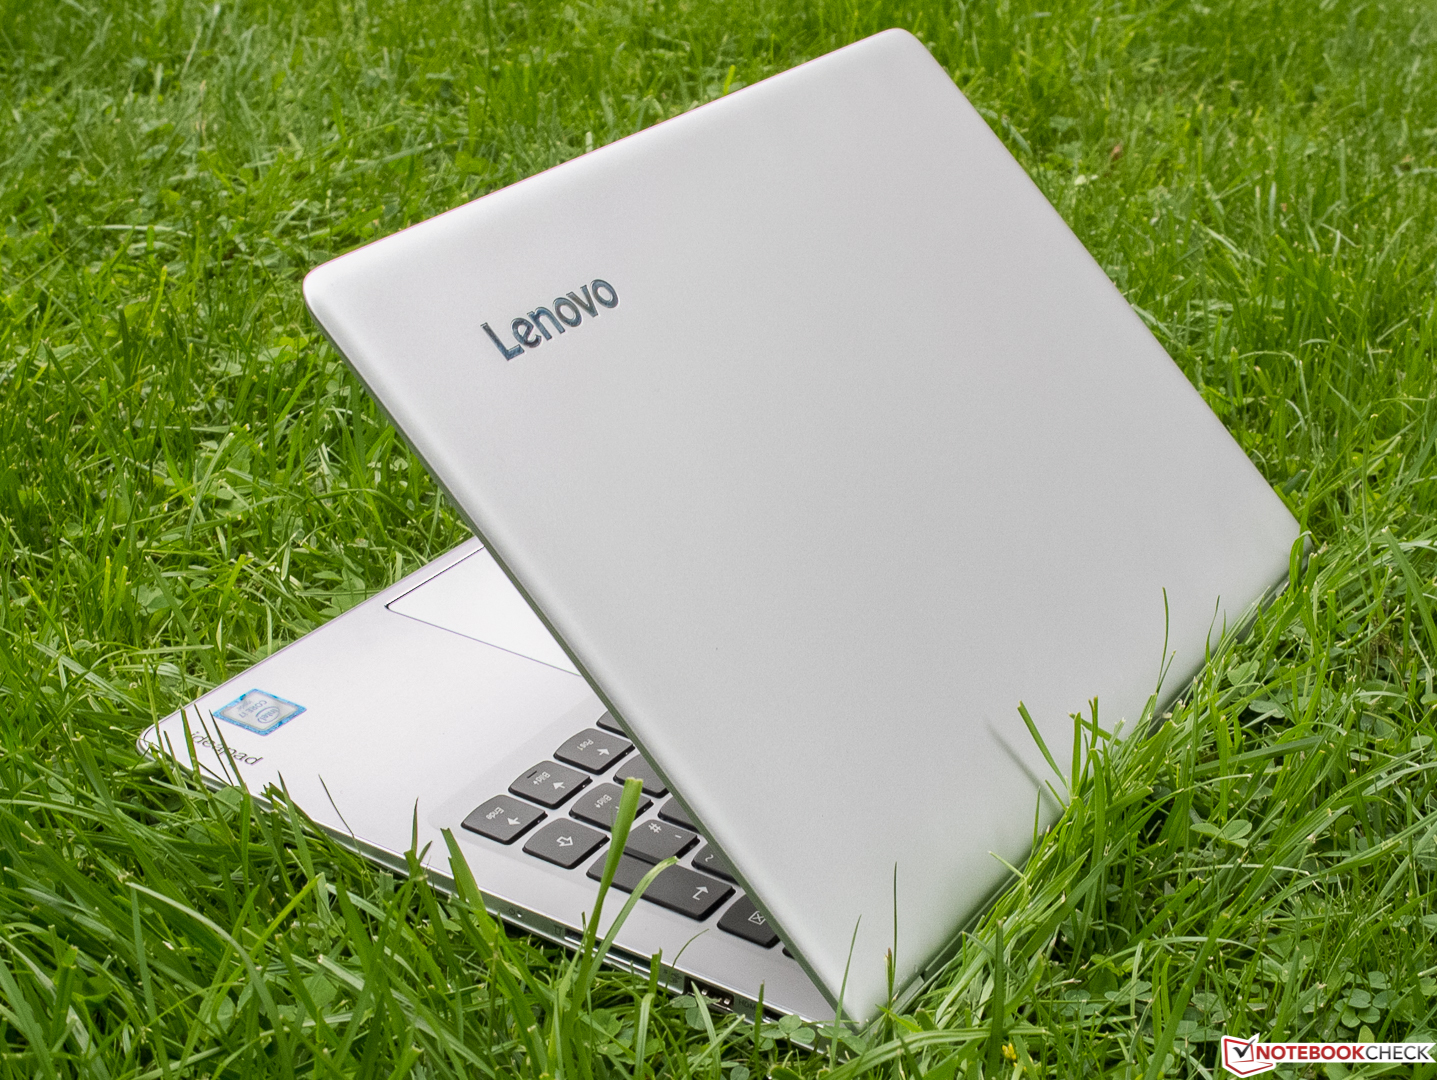
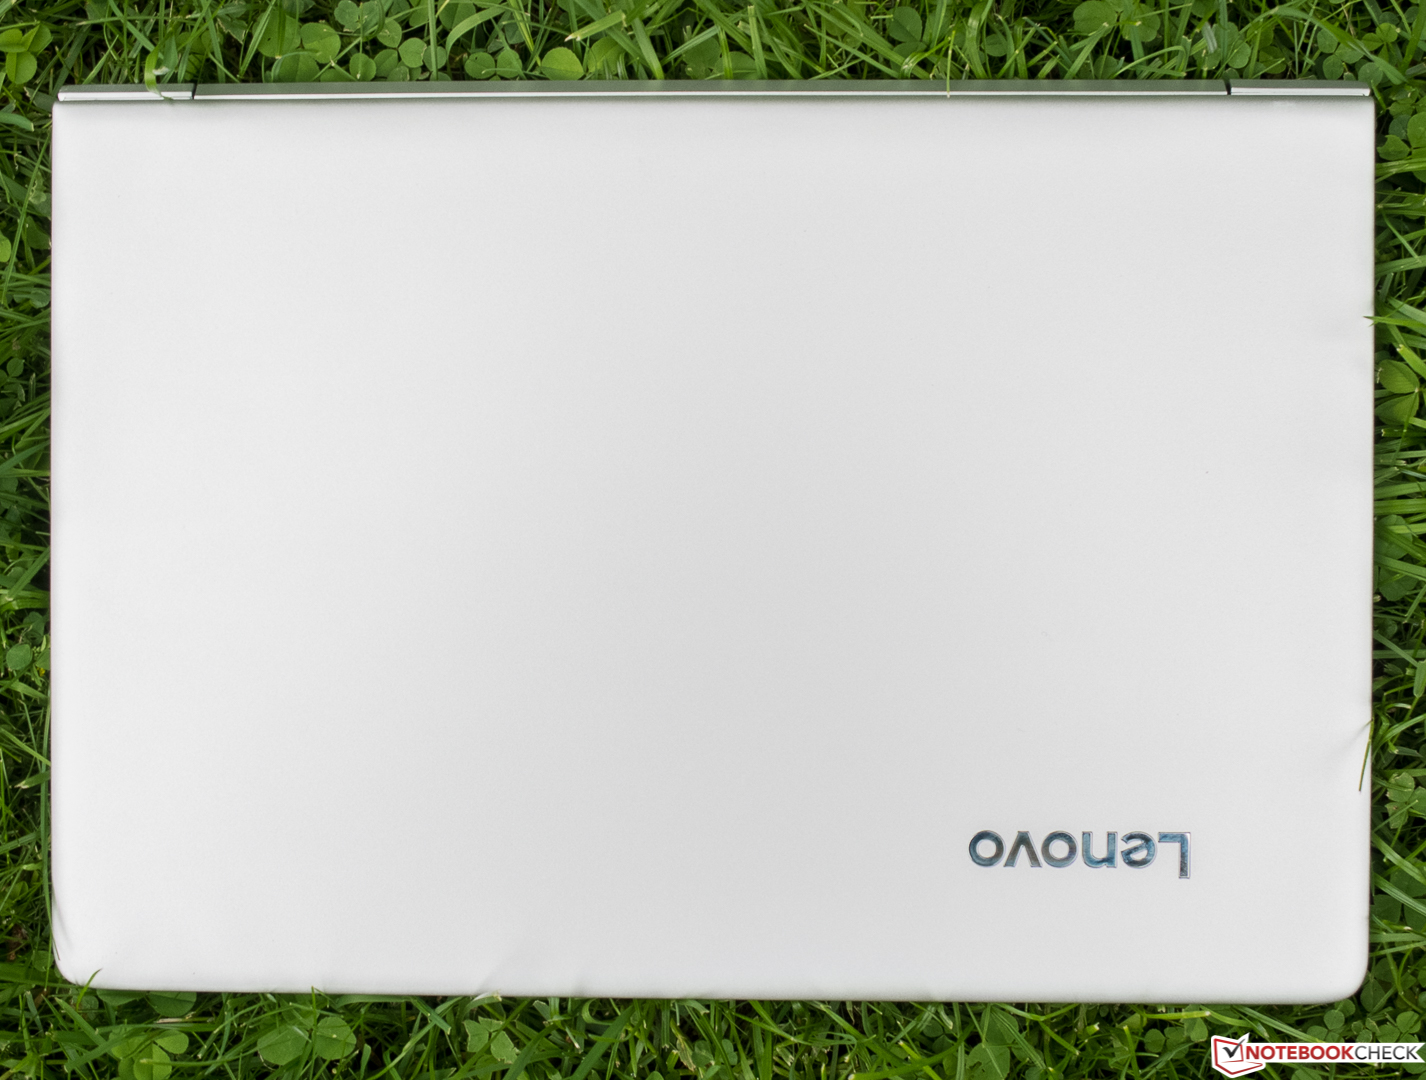
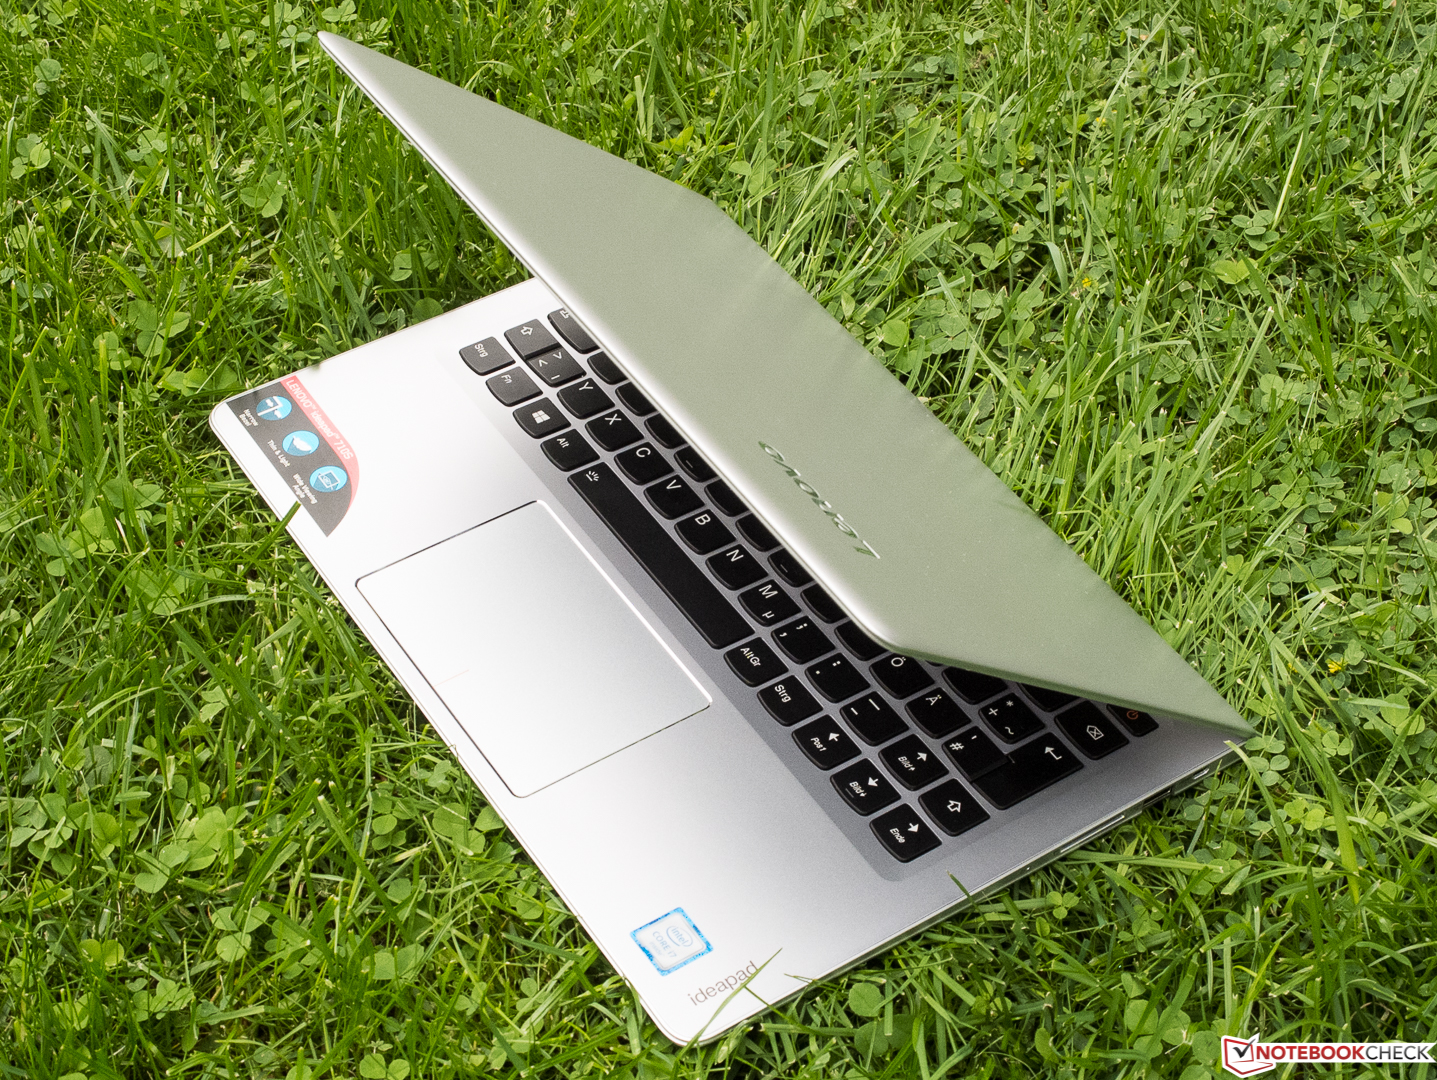
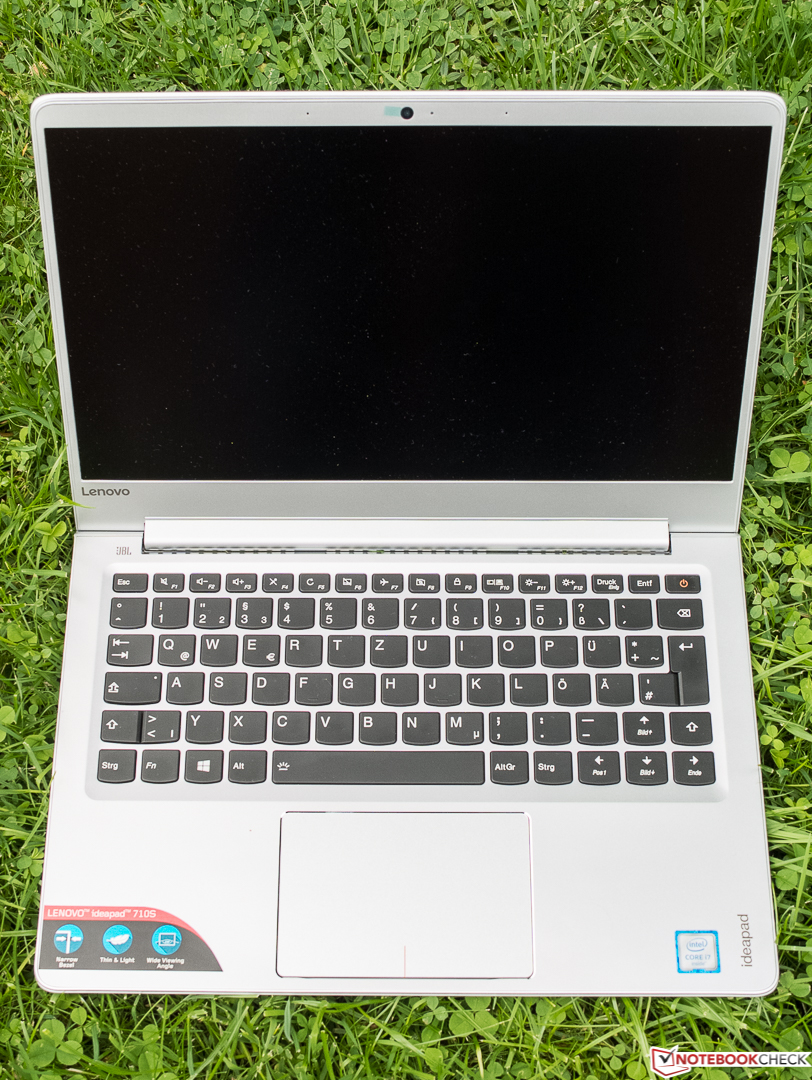
紧凑轻盈的联想IdeaPad 710S-13ISK在测试中给了我们出色的印象,它没有任何严重问题。这台设备的最大优势在于实用的镁铝合金机身,兼具美观和高品质。
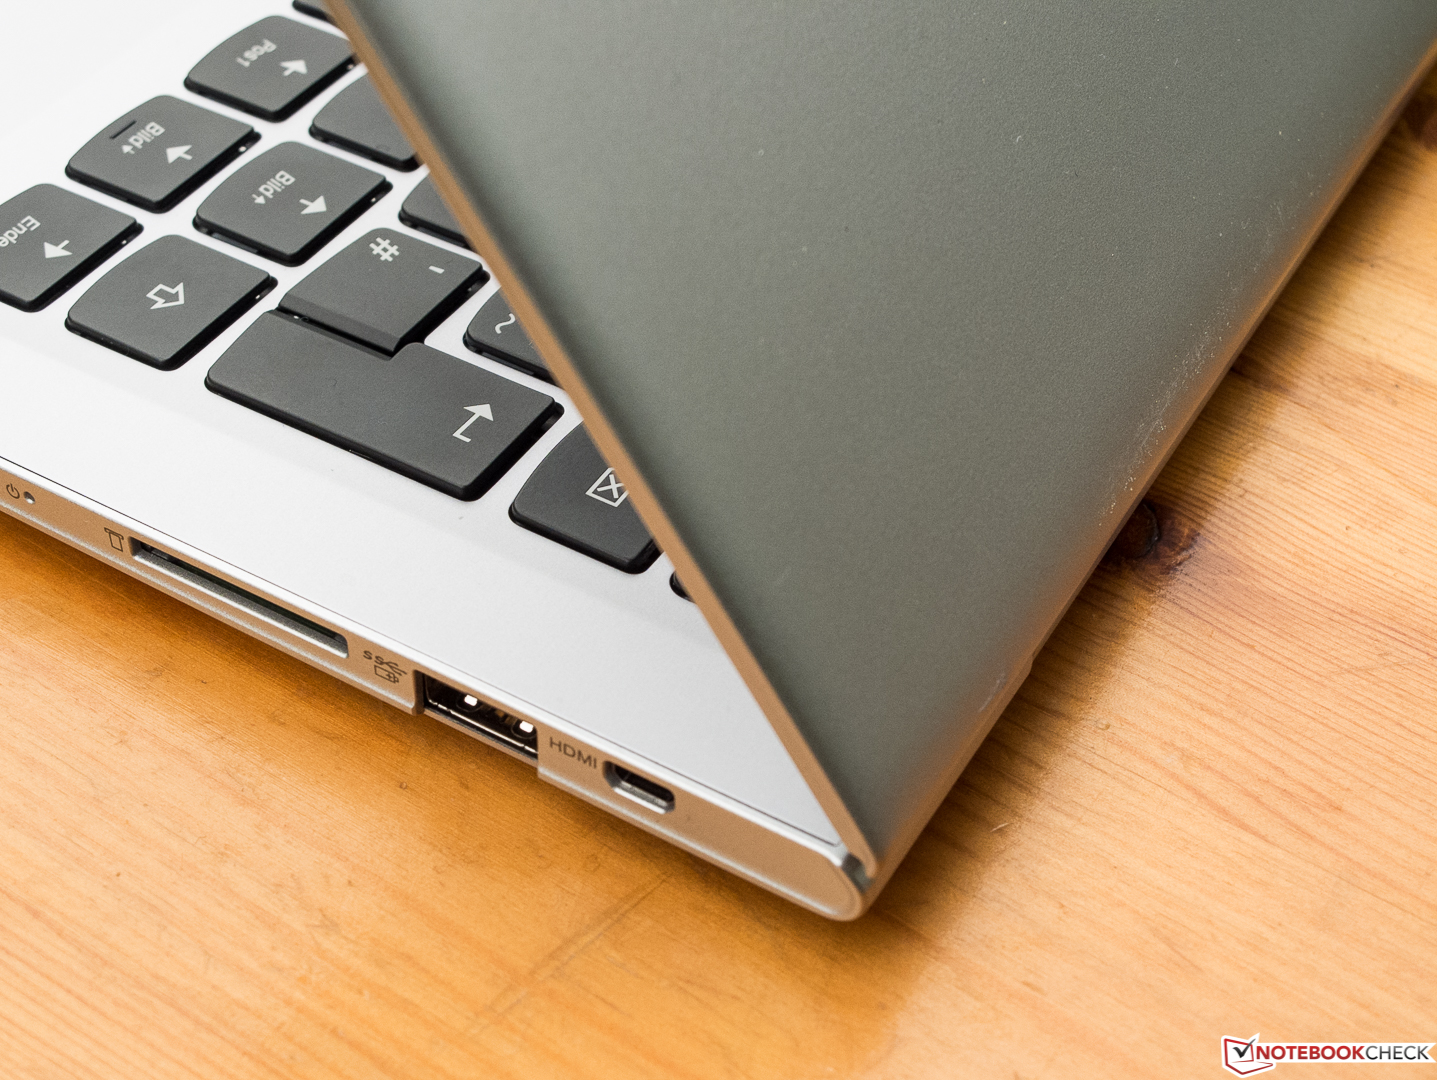
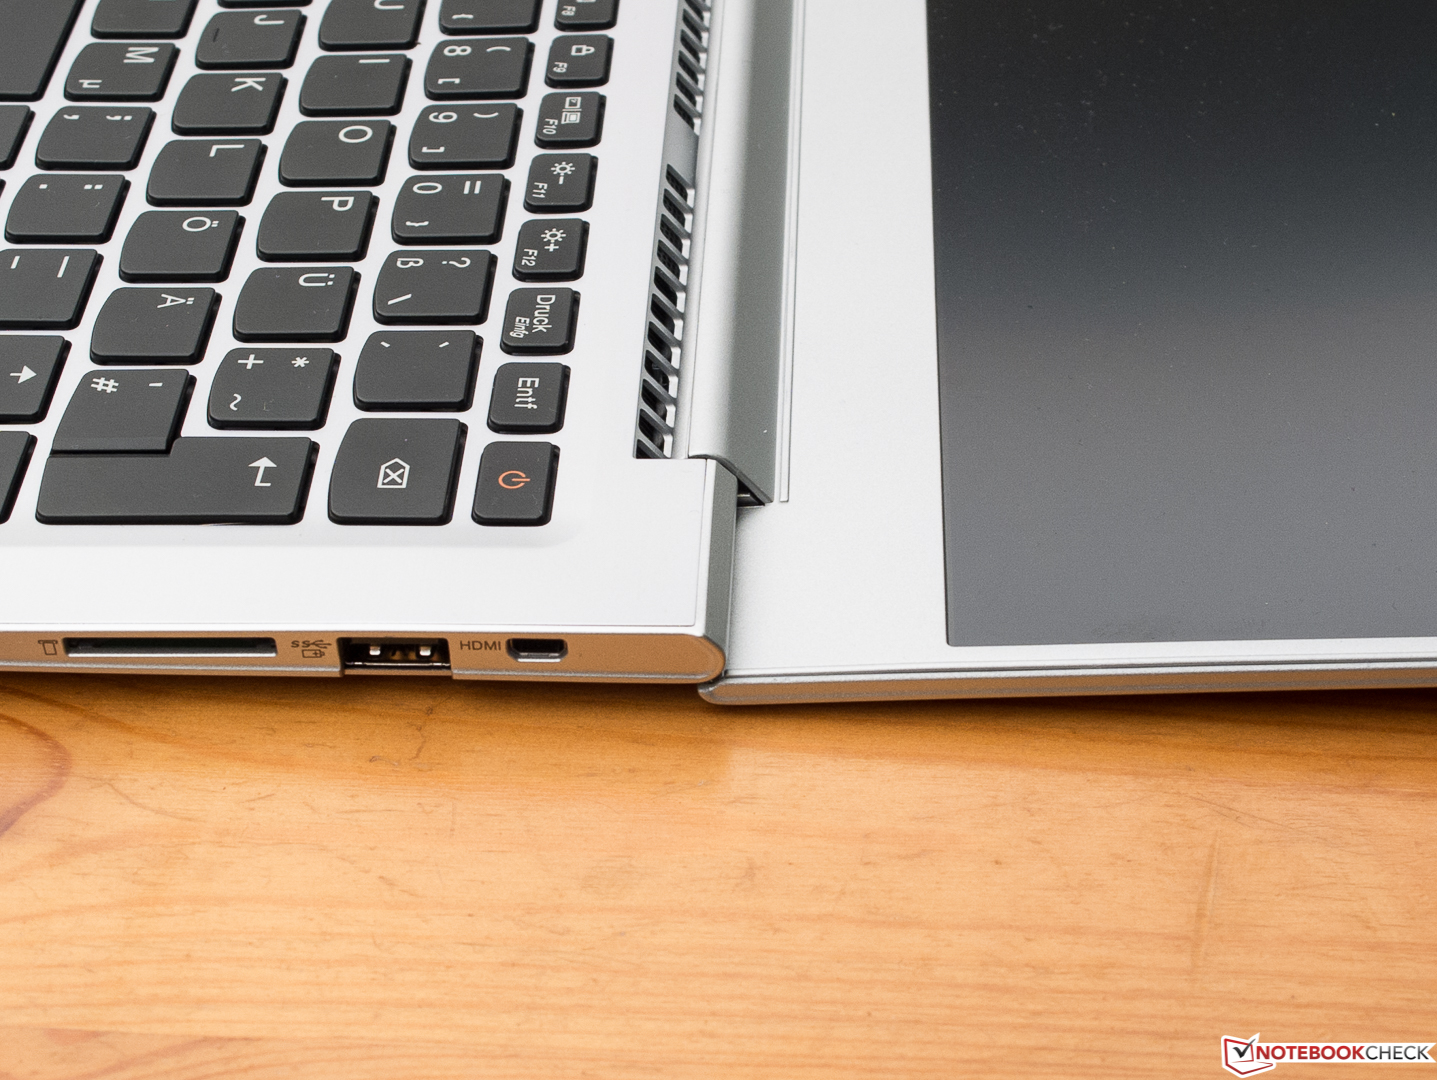
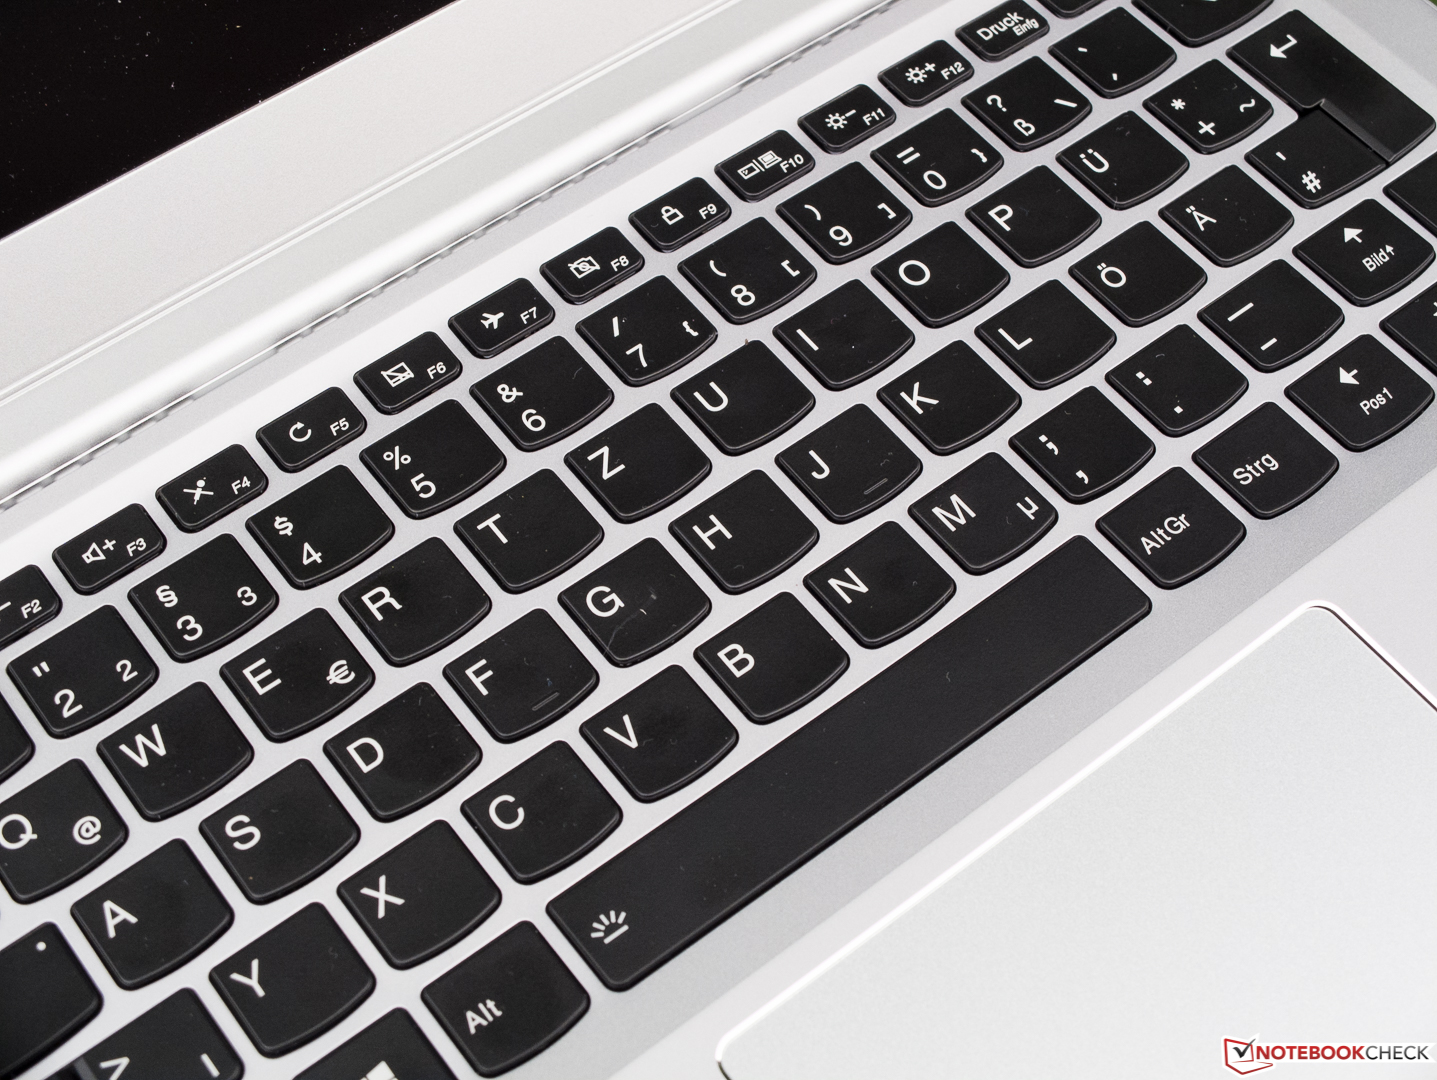
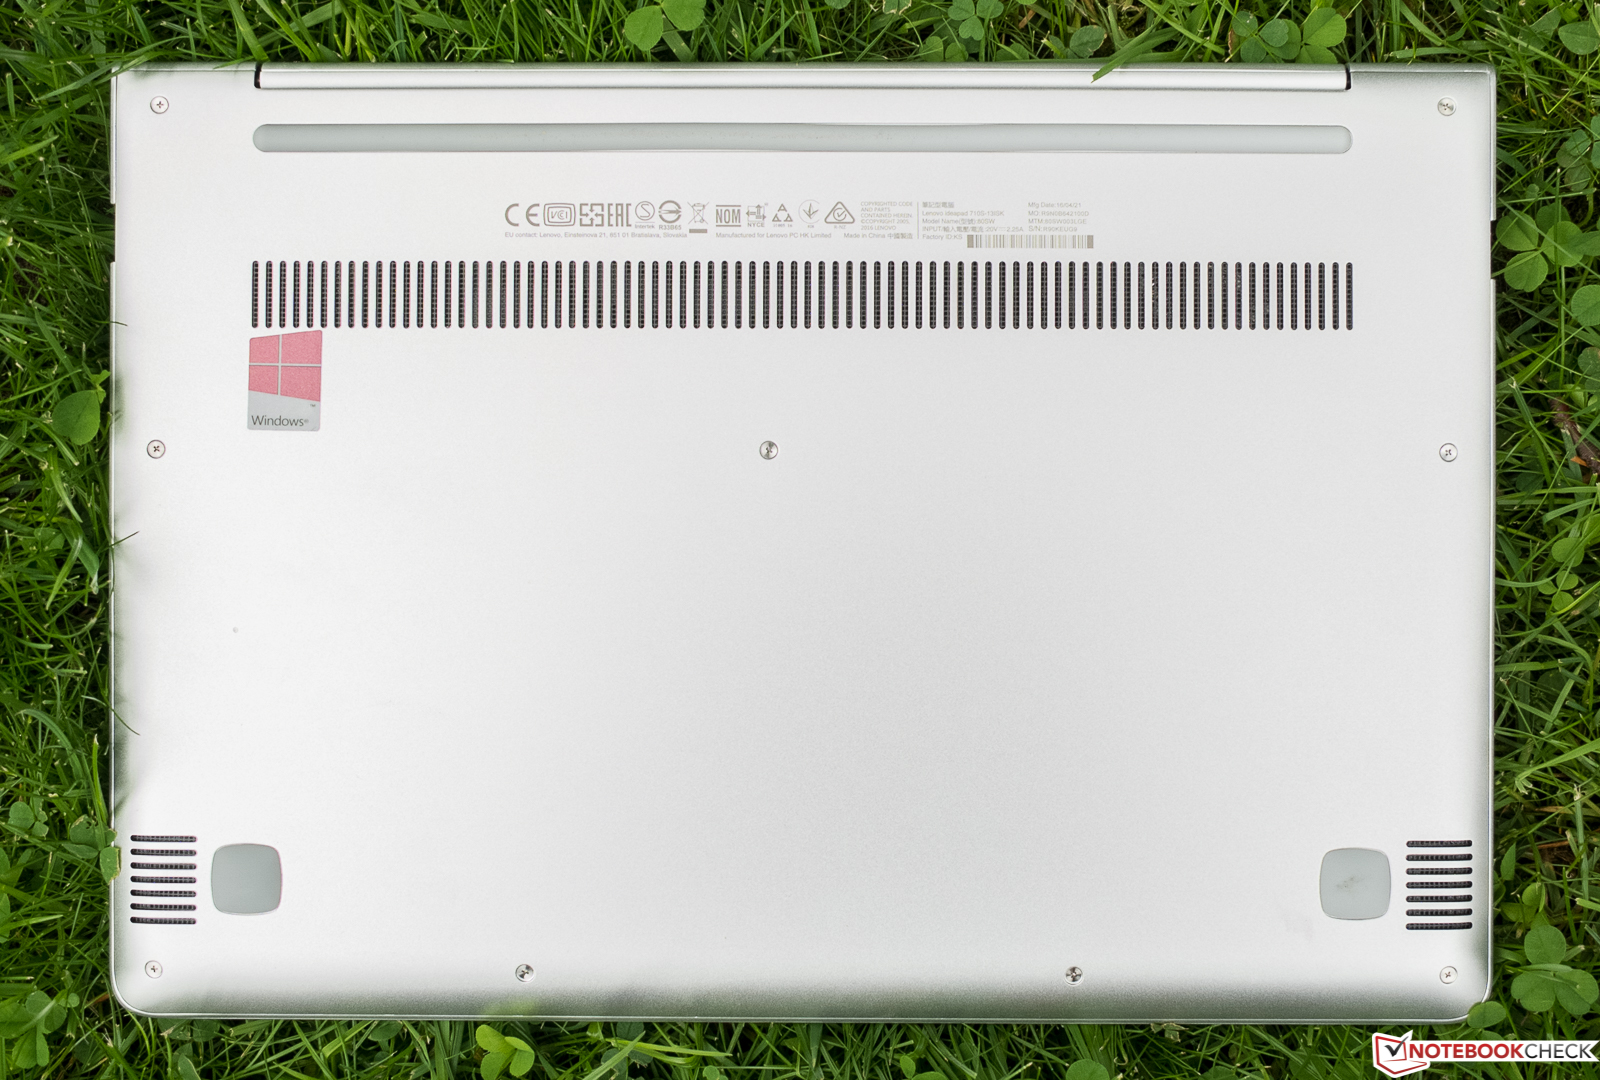
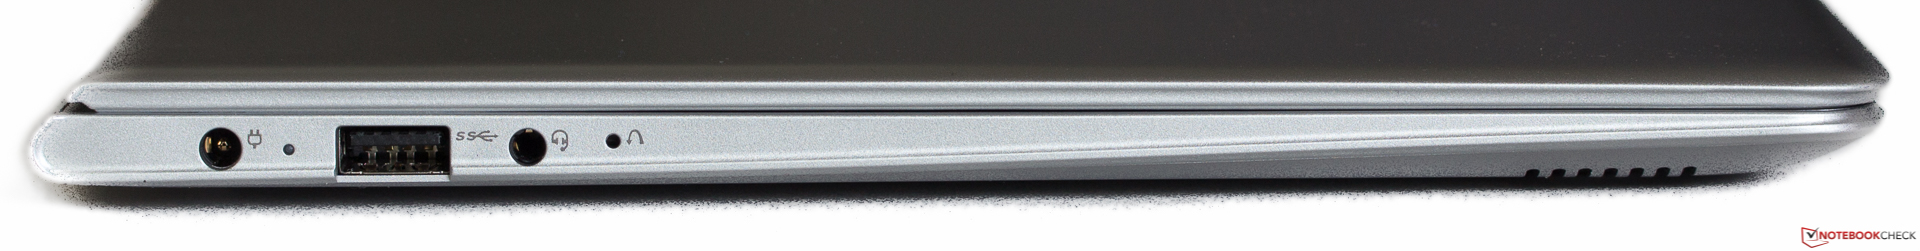
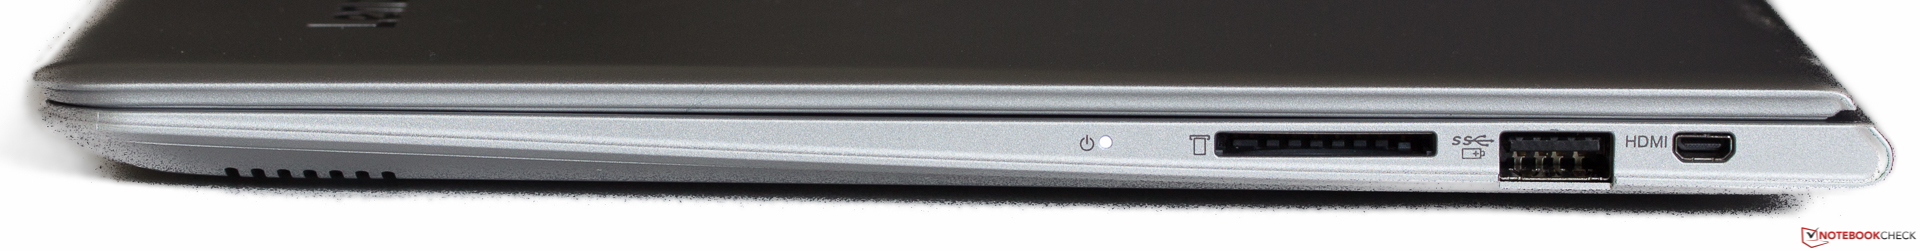
它的另一个亮点是非常优秀的屏幕。它的键盘也可以让人满意,不过触控版的表面在使用中不够顺滑。如果你需要同时连接多个周边设备的话,则需要考虑其他的机型了,因为它的接口数量十分有限。它没有提供维护底盖,不过整个底盖不难打开。
我们在压力测试中发现了它的一些技术短板,如大幅度的降频,和稍吵的风扇,不过这个极端情况下的问题并不会影响日常使用。戴尔XPS 13 9350和华硕Zenbook UX305FA-FC040T都得到了更好的总分。因此,我们认为这台测试机搭配i5-6200U处理器和4GB内存版本特别值得推荐,因为在850-900欧元(约6297到6668人民币)的价位上哪还能找到更好的设备呢?
注:本文是基于完整评测的缩减版本,阅读完整的英文评测,请点击这里。
Lenovo IdeaPad 710S-13ISK
- 06/02/2016 v5.1 (old)
Sven Kloevekorn
Price comparison
