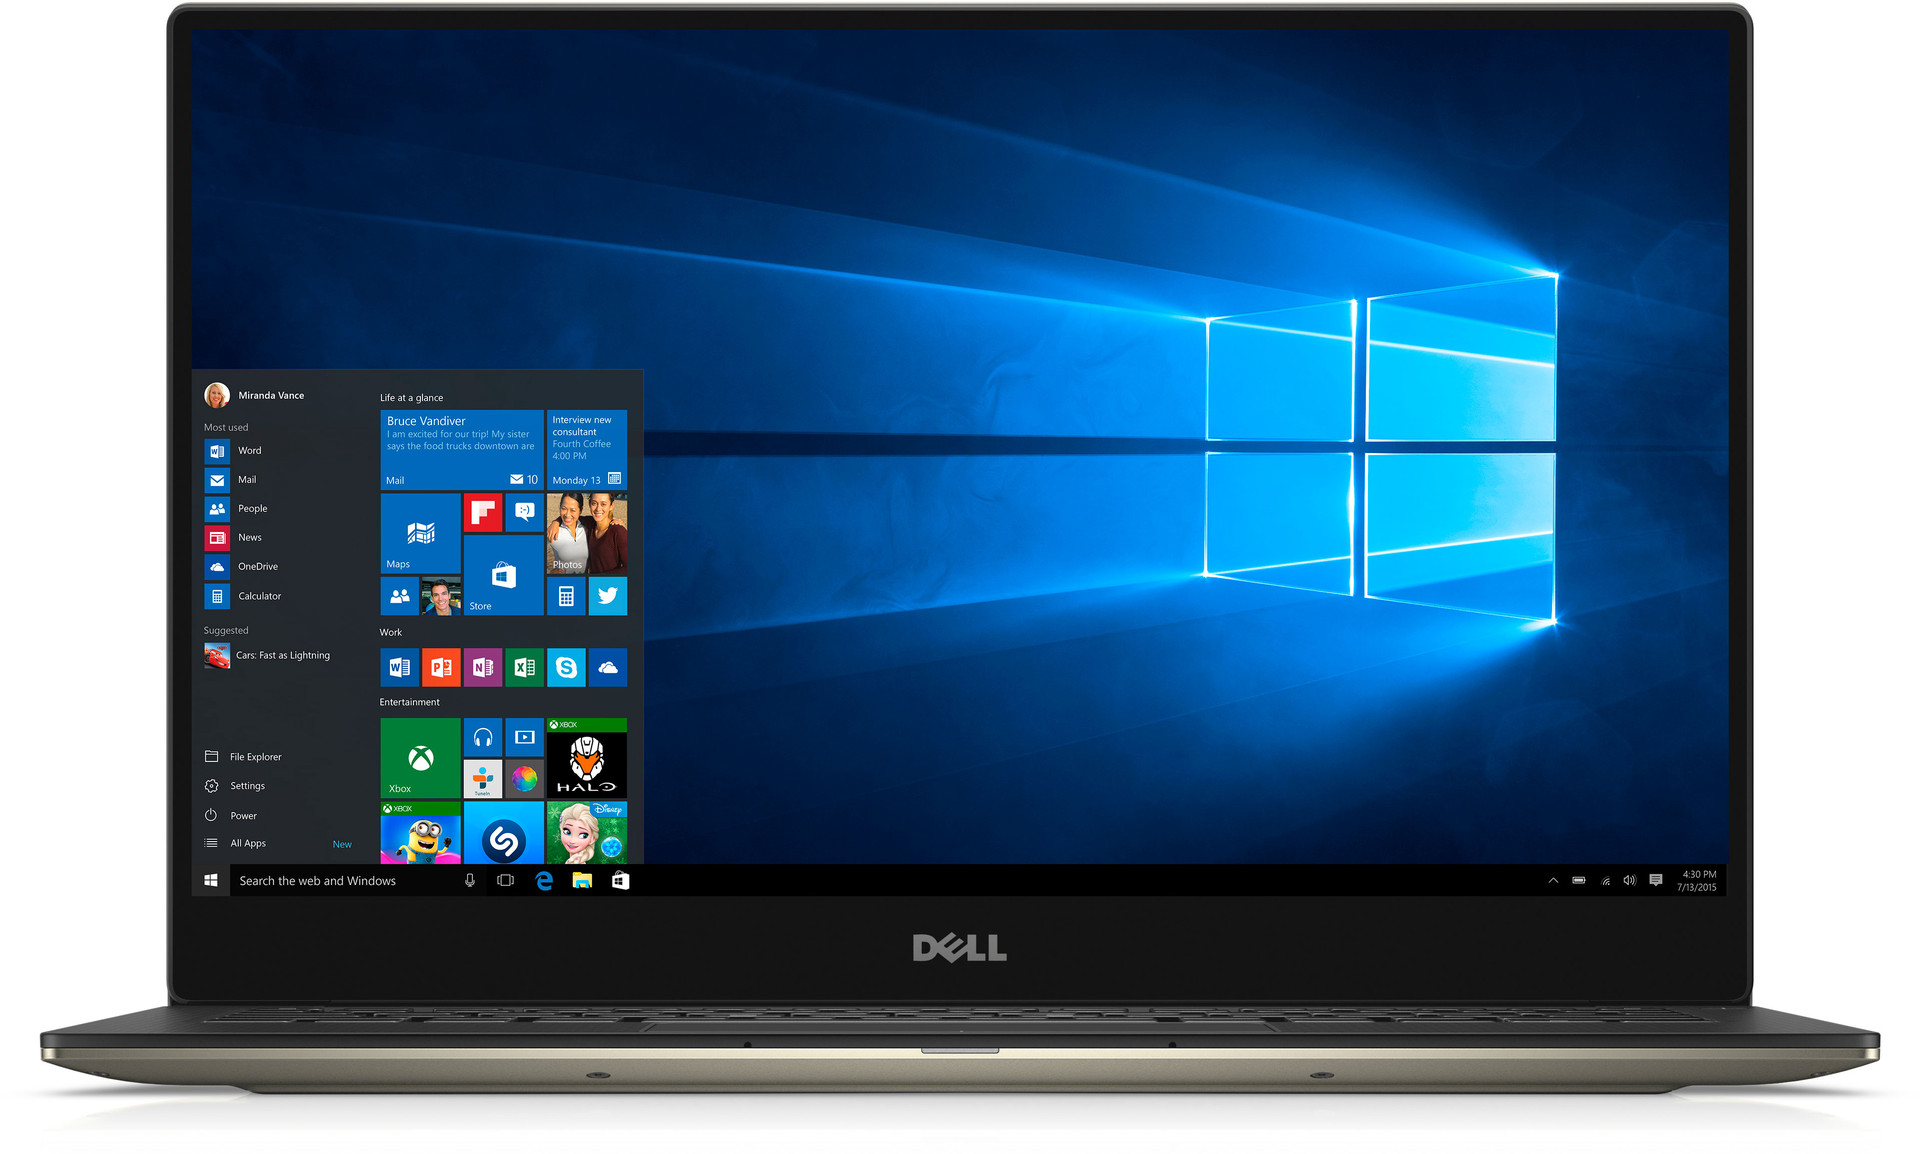
戴尔 XPS 13-9350 InfinityEdge 超极本简短评测
XPS 13 9350 48 (XPS 13 Series)
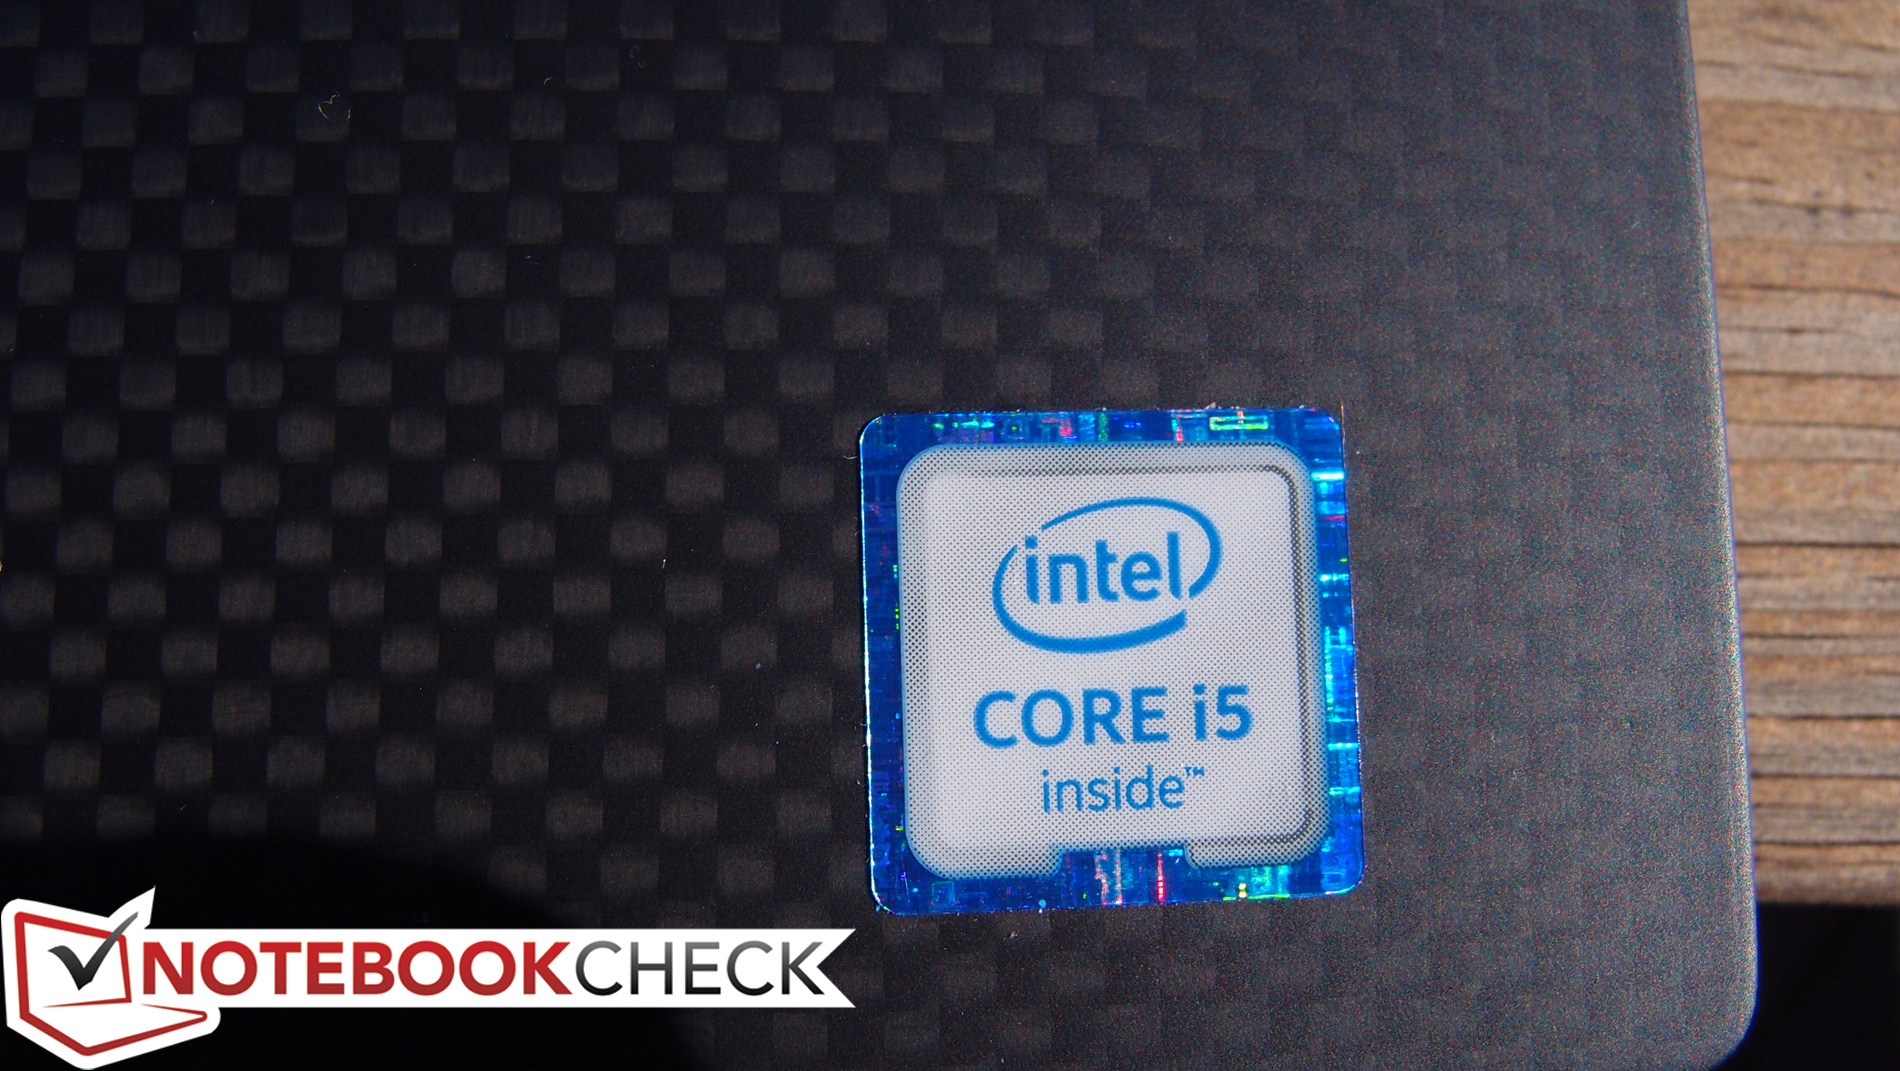
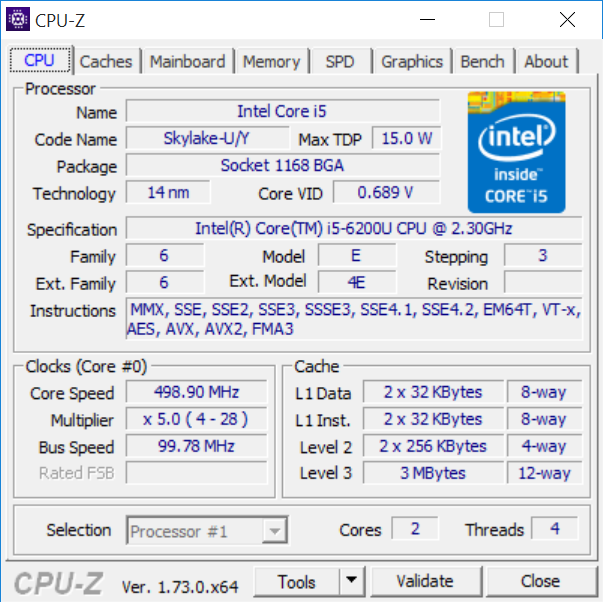
Processor
Intel Core i5-6200U 2c/4t 2 x 2.3 - 2.8 GHz, Skylake
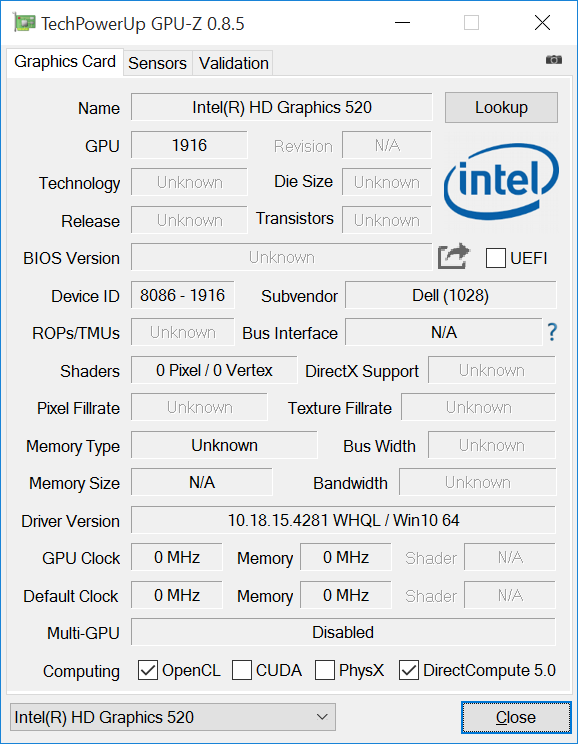
Graphics adapter
Intel HD Graphics 520, Core: 300 MHz, 10.18.15.4281
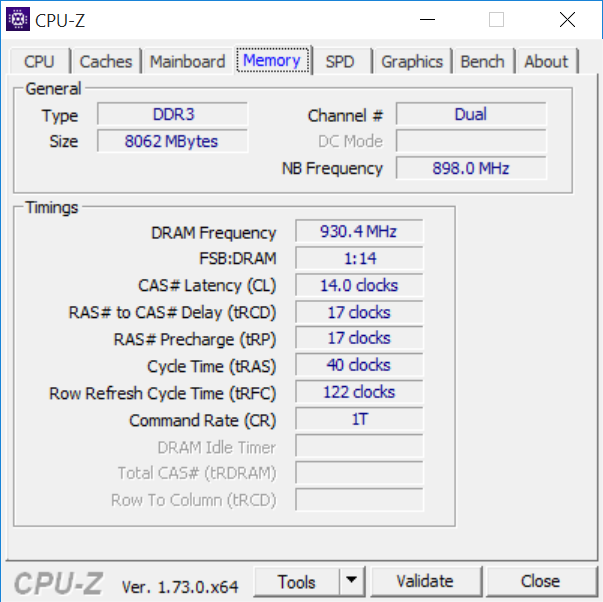
Memory
8 GB
, LPDDR3 1867 MHz 双通道
Display
13.30 inch 16:9, 1920 x 1080 pixel, SHP1420, IPS, glossy: no
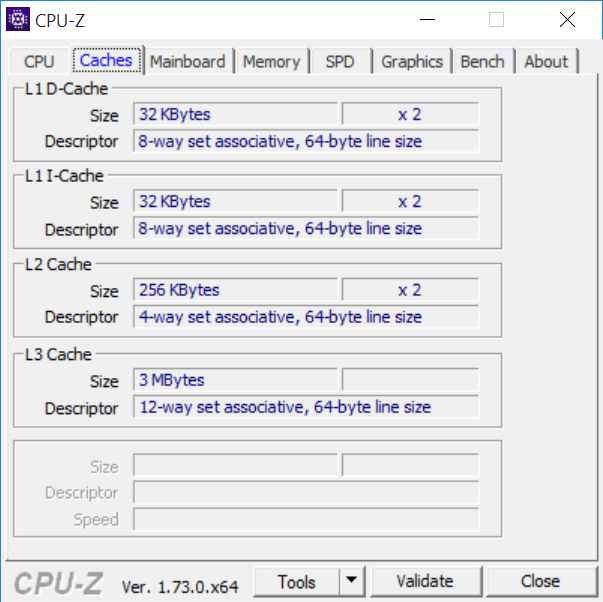
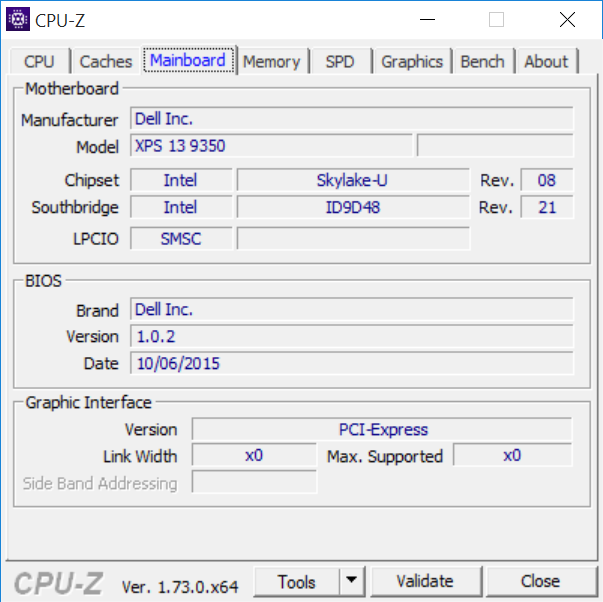
Mainboard
Intel Skylake-U Premium PCH
Storage
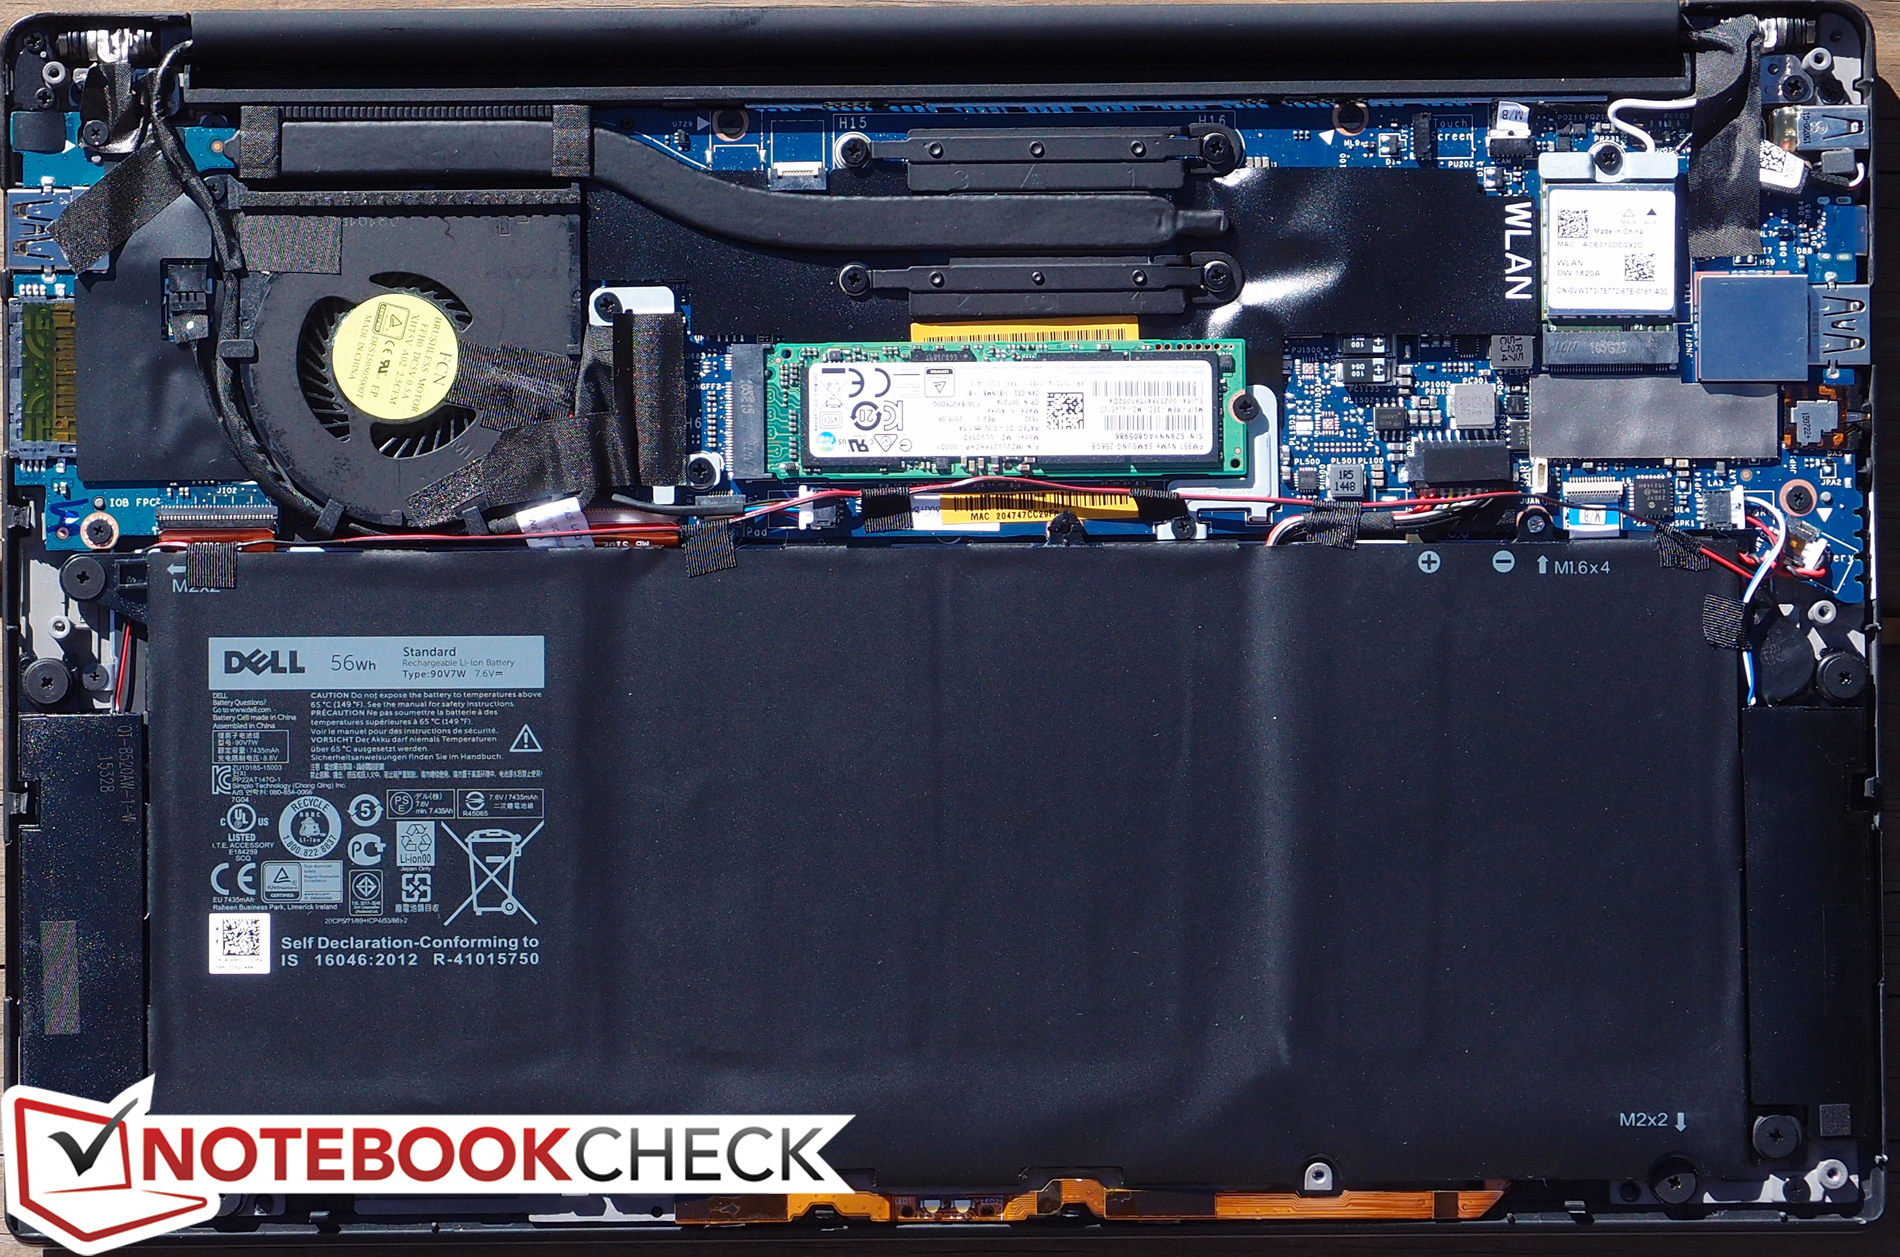
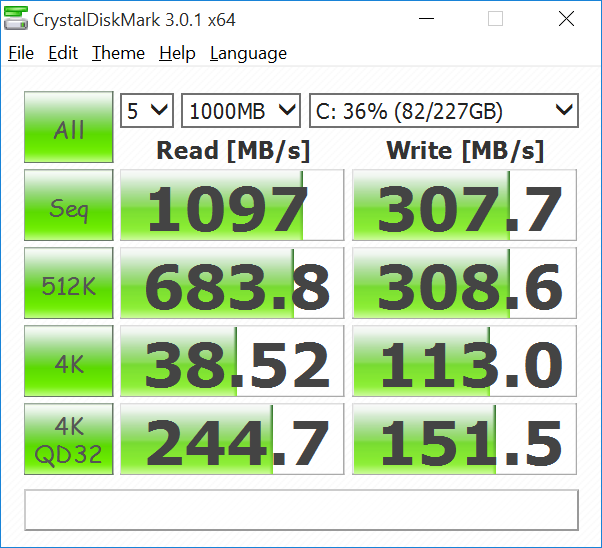
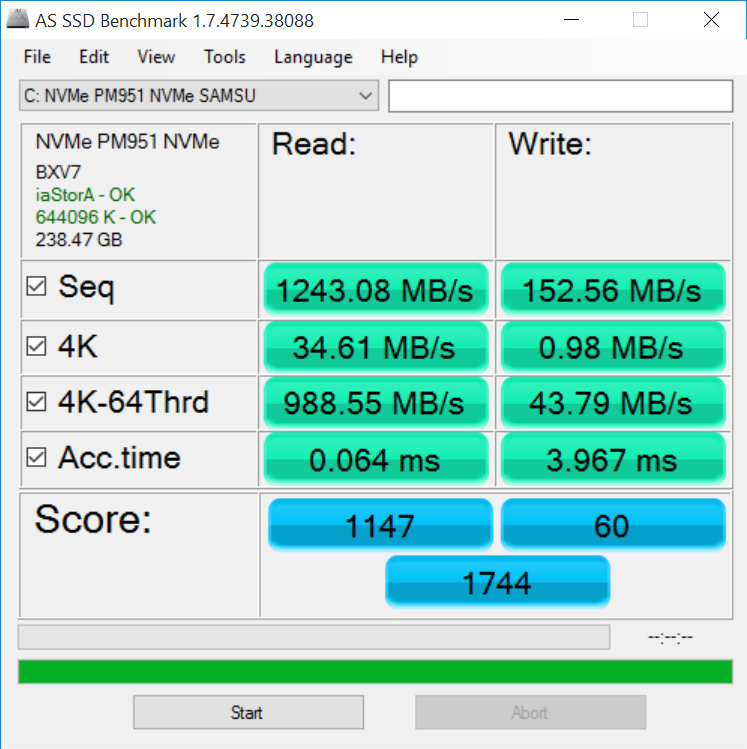
Samsung PM951 NVMe MZ-VLV256D, 256 GB
Weight
1.226 kg, Power Supply: 260 g
Price
0 Euro
Note: The manufacturer may use components from different suppliers including display panels, drives or memory sticks with similar specifications.

| |||||||||||||||||||||||||
SHP1420 tested with X-Rite i1Basic Pro 2
Maximum: 294 cd/m² (Nits) Average: 276.2 cd/m²Brightness Distribution: 88 %
Center on Battery: 277.5 cd/m²
Contrast: 1453:1 (Black: 0.191 cd/m²)
ΔE ColorChecker Calman: 4.88 | ∀{0.5-29.43 Ø4.72}
ΔE Greyscale Calman: 4.26 | ∀{0.09-98 Ø4.97}
65.79% sRGB (Argyll 1.6.3 3D)
41.6% AdobeRGB 1998 (Argyll 1.6.3 3D)
45.97% AdobeRGB 1998 (Argyll 3D)
66.8% sRGB (Argyll 3D)
44.53% Display P3 (Argyll 3D)
Gamma: 2.59
CCT: 6562 K
| Dell XPS 13-9350 | Dell XPS 13-9343 | Dell XPS 13-9343 Non-Touch | Apple MacBook Air 13 inch 2015-03 | Microsoft Surface Book Core i5 | |
|---|---|---|---|---|---|
| Display | 54% | 42% | -10% | 48% | |
| Display P3 Coverage (%) | 44.53 | 72 62% | 65.9 48% | 40.1 -10% | 67 50% |
| sRGB Coverage (%) | 66.8 | 96 44% | 89.6 34% | 59.8 -10% | 95.8 43% |
| AdobeRGB 1998 Coverage (%) | 45.97 | 71.6 56% | 66.2 44% | 41.51 -10% | 68.9 50% |
| Response Times | |||||
| Response Time Grey 50% / Grey 80% * (ms) | 48.4 ? | ||||
| Response Time Black / White * (ms) | 32.8 ? | ||||
| PWM Frequency (Hz) | |||||
| Screen | 19% | -5% | -12% | 33% | |
| Brightness middle (cd/m²) | 277.5 | 367.3 32% | 409.7 48% | 329 19% | 430.9 55% |
| Brightness (cd/m²) | 276 | 372 35% | 405 47% | 310 12% | 410 49% |
| Brightness Distribution (%) | 88 | 77 -12% | 93 6% | 82 -7% | 93 6% |
| Black Level * (cd/m²) | 0.191 | 0.178 7% | 0.366 -92% | 0.405 -112% | 0.254 -33% |
| Contrast (:1) | 1453 | 2063 42% | 1119 -23% | 812 -44% | 1696 17% |
| Colorchecker dE 2000 * | 4.88 | 5.92 -21% | 7.67 -57% | 3.96 19% | 2.06 58% |
| Greyscale dE 2000 * | 4.26 | 4.79 -12% | 4.66 -9% | 3.51 18% | 2.22 48% |
| Gamma | 2.59 85% | 2.42 91% | 1.65 133% | 3.83 57% | 2.13 103% |
| CCT | 6562 99% | 7013 93% | 6502 100% | 6711 97% | 6520 100% |
| Color Space (Percent of AdobeRGB 1998) (%) | 41.6 | 63 51% | 59.65 43% | 38.4 -8% | 64 54% |
| Color Space (Percent of sRGB) (%) | 65.79 | 96.4 47% | 59.8 -9% | 96 46% | |
| Colorchecker dE 2000 max. * | 7.51 | ||||
| Total Average (Program / Settings) | 37% /
28% | 19% /
8% | -11% /
-12% | 41% /
37% |
* ... smaller is better
| Cinebench R11.5 | |
| CPU Single 64Bit (sort by value) | |
| Dell XPS 13-9350 | |
| Dell XPS 13-9343 | |
| Dell XPS 13-9343 Non-Touch | |
| HP EliteBook Folio 1040 G2 H7W22EA | |
| Apple MacBook Air 13 inch 2015-03 | |
| Microsoft Surface Book Core i5 | |
| Apple MacBook Pro Retina 13 inch 2015-03 | |
| Apple MacBook Pro Retina 13 inch 2015-03 | |
| CPU Multi 64Bit (sort by value) | |
| Dell XPS 13-9350 | |
| Dell XPS 13-9343 | |
| Dell XPS 13-9343 Non-Touch | |
| HP EliteBook Folio 1040 G2 H7W22EA | |
| Apple MacBook Air 13 inch 2015-03 | |
| Microsoft Surface Book Core i5 | |
| Apple MacBook Pro Retina 13 inch 2015-03 | |
| Apple MacBook Pro Retina 13 inch 2015-03 | |
| Cinebench R15 | |
| CPU Single 64Bit (sort by value) | |
| Dell XPS 13-9350 | |
| Dell XPS 13-9343 | |
| Dell XPS 13-9343 Non-Touch | |
| HP EliteBook Folio 1040 G2 H7W22EA | |
| Apple MacBook Air 13 inch 2015-03 | |
| Microsoft Surface Book Core i5 | |
| Apple MacBook Pro Retina 13 inch 2015-03 | |
| CPU Multi 64Bit (sort by value) | |
| Dell XPS 13-9350 | |
| Dell XPS 13-9343 | |
| Dell XPS 13-9343 Non-Touch | |
| HP EliteBook Folio 1040 G2 H7W22EA | |
| Apple MacBook Air 13 inch 2015-03 | |
| Microsoft Surface Book Core i5 | |
| Apple MacBook Pro Retina 13 inch 2015-03 | |
| wPrime 2.10 | |
| 32m (sort by value) | |
| Dell XPS 13-9350 | |
| Dell XPS 13-9343 | |
| Dell XPS 13-9343 Non-Touch | |
| HP EliteBook Folio 1040 G2 H7W22EA | |
| Apple MacBook Air 13 inch 2015-03 | |
| Microsoft Surface Book Core i5 | |
| 1024m (sort by value) | |
| Dell XPS 13-9350 | |
| Dell XPS 13-9343 | |
| Dell XPS 13-9343 Non-Touch | |
| HP EliteBook Folio 1040 G2 H7W22EA | |
| Apple MacBook Air 13 inch 2015-03 | |
| Microsoft Surface Book Core i5 | |
| Super Pi Mod 1.5 XS 32M - 32M (sort by value) | |
| Dell XPS 13-9350 | |
| Dell XPS 13-9343 | |
| Dell XPS 13-9343 Non-Touch | |
| HP EliteBook Folio 1040 G2 H7W22EA | |
| Apple MacBook Air 13 inch 2015-03 | |
| Microsoft Surface Book Core i5 | |
| Apple MacBook Pro Retina 13 inch 2015-03 | |
* ... smaller is better
| PCMark 7 Score | 4989 points | |
| PCMark 8 Home Score Accelerated v2 | 2983 points | |
| PCMark 8 Creative Score Accelerated v2 | 3658 points | |
| PCMark 8 Work Score Accelerated v2 | 4078 points | |
Help | ||

Samsung PM951 NVMe MZ-VLV256D
Transfer Rate Minimum:
682 MB/s
Transfer Rate Maximum:
864 MB/s
Transfer Rate Average:
808 MB/s
Access Time:
0.1 ms
Burst Rate:
178.7 MB/s
CPU Usage:
76.1 %
| 3DMark 06 Standard Score | 9313 points | |
| 3DMark 11 Performance | 1558 points | |
| 3DMark Ice Storm Standard Score | 52625 points | |
| 3DMark Cloud Gate Standard Score | 5931 points | |
| 3DMark Fire Strike Score | 861 points | |
Help | ||
| low | med. | high | ultra | |
|---|---|---|---|---|
| Metro 2033 (2010) | 31.33 | 19.67 | 9.67 | |
| StarCraft 2 (2010) | 49 | 32 | 21 | |
| BioShock Infinite (2013) | 54.7 | 28.16 | 23.7 | 7.33 |
| 3DMark 06 - 1280x1024 Standard Score AA:0x AF:0x (sort by value) | |
| Dell XPS 13-9350 | |
| Dell XPS 13-9343 | |
| Dell XPS 13-9343 Non-Touch | |
| Apple MacBook Air 13 inch 2015-03 | |
| Microsoft Surface Book Core i5 | |
| Apple MacBook Pro Retina 13 inch 2015-03 | |
| 3DMark 11 | |
| 1280x720 Performance (sort by value) | |
| Dell XPS 13-9350 | |
| Dell XPS 13-9343 | |
| Dell XPS 13-9343 Non-Touch | |
| HP EliteBook Folio 1040 G2 H7W22EA | |
| Apple MacBook Air 13 inch 2015-03 | |
| Microsoft Surface Book Core i5 | |
| Apple MacBook Pro Retina 13 inch 2015-03 | |
| 1280x720 Performance GPU (sort by value) | |
| Dell XPS 13-9350 | |
| Dell XPS 13-9343 Non-Touch | |
| HP EliteBook Folio 1040 G2 H7W22EA | |
| Apple MacBook Air 13 inch 2015-03 | |
| Microsoft Surface Book Core i5 | |
| Apple MacBook Pro Retina 13 inch 2015-03 | |
Noise level
| Idle |
| 28.2 / 28.3 / 28.4 dB(A) |
| Load |
| 30.2 / 30.2 dB(A) |
 | ||
30 dB silent 40 dB(A) audible 50 dB(A) loud |
||
min: | ||
| Dell XPS 13-9350 | Dell XPS 13-9343 | Dell XPS 13-9343 Non-Touch | Apple MacBook Air 13 inch 2015-03 | Microsoft Surface Book Core i5 | |
|---|---|---|---|---|---|
| Noise | -19% | -8% | -19% | -15% | |
| Idle Minimum * (dB) | 28.2 | 30.2 -7% | 29 -3% | 29.2 -4% | 29.5 -5% |
| Idle Average * (dB) | 28.3 | 30.3 -7% | 29.1 -3% | 29.2 -3% | 29.6 -5% |
| Idle Maximum * (dB) | 28.4 | 30.4 -7% | 29.2 -3% | 29.2 -3% | 29.7 -5% |
| Load Average * (dB) | 30.2 | 34.4 -14% | 31.1 -3% | 40.2 -33% | 37.5 -24% |
| Load Maximum * (dB) | 30.2 | 48 -59% | 38.4 -27% | 46.3 -53% | 40.9 -35% |
* ... smaller is better
(±) The average temperature for the upper side under maximal load is 34.5 °C / 94 F, compared to the average of 30.8 °C / 87 F for the devices in the class Subnotebook.
(-) The maximum temperature on the upper side is 45.2 °C / 113 F, compared to the average of 35.9 °C / 97 F, ranging from 21.4 to 59 °C for the class Subnotebook.
(-) The bottom heats up to a maximum of 45.2 °C / 113 F, compared to the average of 39.2 °C / 103 F
(+) In idle usage, the average temperature for the upper side is 27 °C / 81 F, compared to the device average of 30.8 °C / 87 F.
(+) The palmrests and touchpad are cooler than skin temperature with a maximum of 30.8 °C / 87.4 F and are therefore cool to the touch.
(-) The average temperature of the palmrest area of similar devices was 28.2 °C / 82.8 F (-2.6 °C / -4.6 F).
| Dell XPS 13-9350 | Dell XPS 13-9343 | Dell XPS 13-9343 Non-Touch | Apple MacBook Air 13 inch 2015-03 | Microsoft Surface Book Core i5 | |
|---|---|---|---|---|---|
| Battery runtime | 5% | 32% | 34% | 10% | |
| Reader / Idle (h) | 13 | 15.2 17% | 21.6 66% | 26.2 102% | 17.8 37% |
| WiFi v1.3 (h) | 7.5 | 10 33% | 10.3 37% | 6.7 -11% | |
| Load (h) | 2.5 | 2.3 -8% | 2.4 -4% | 1.6 -36% | 2.6 4% |
| WiFi (h) | 9.7 |
Pros
+ 无暇的金属机身和工艺品质
+ 纤薄的外形;出色的便携性
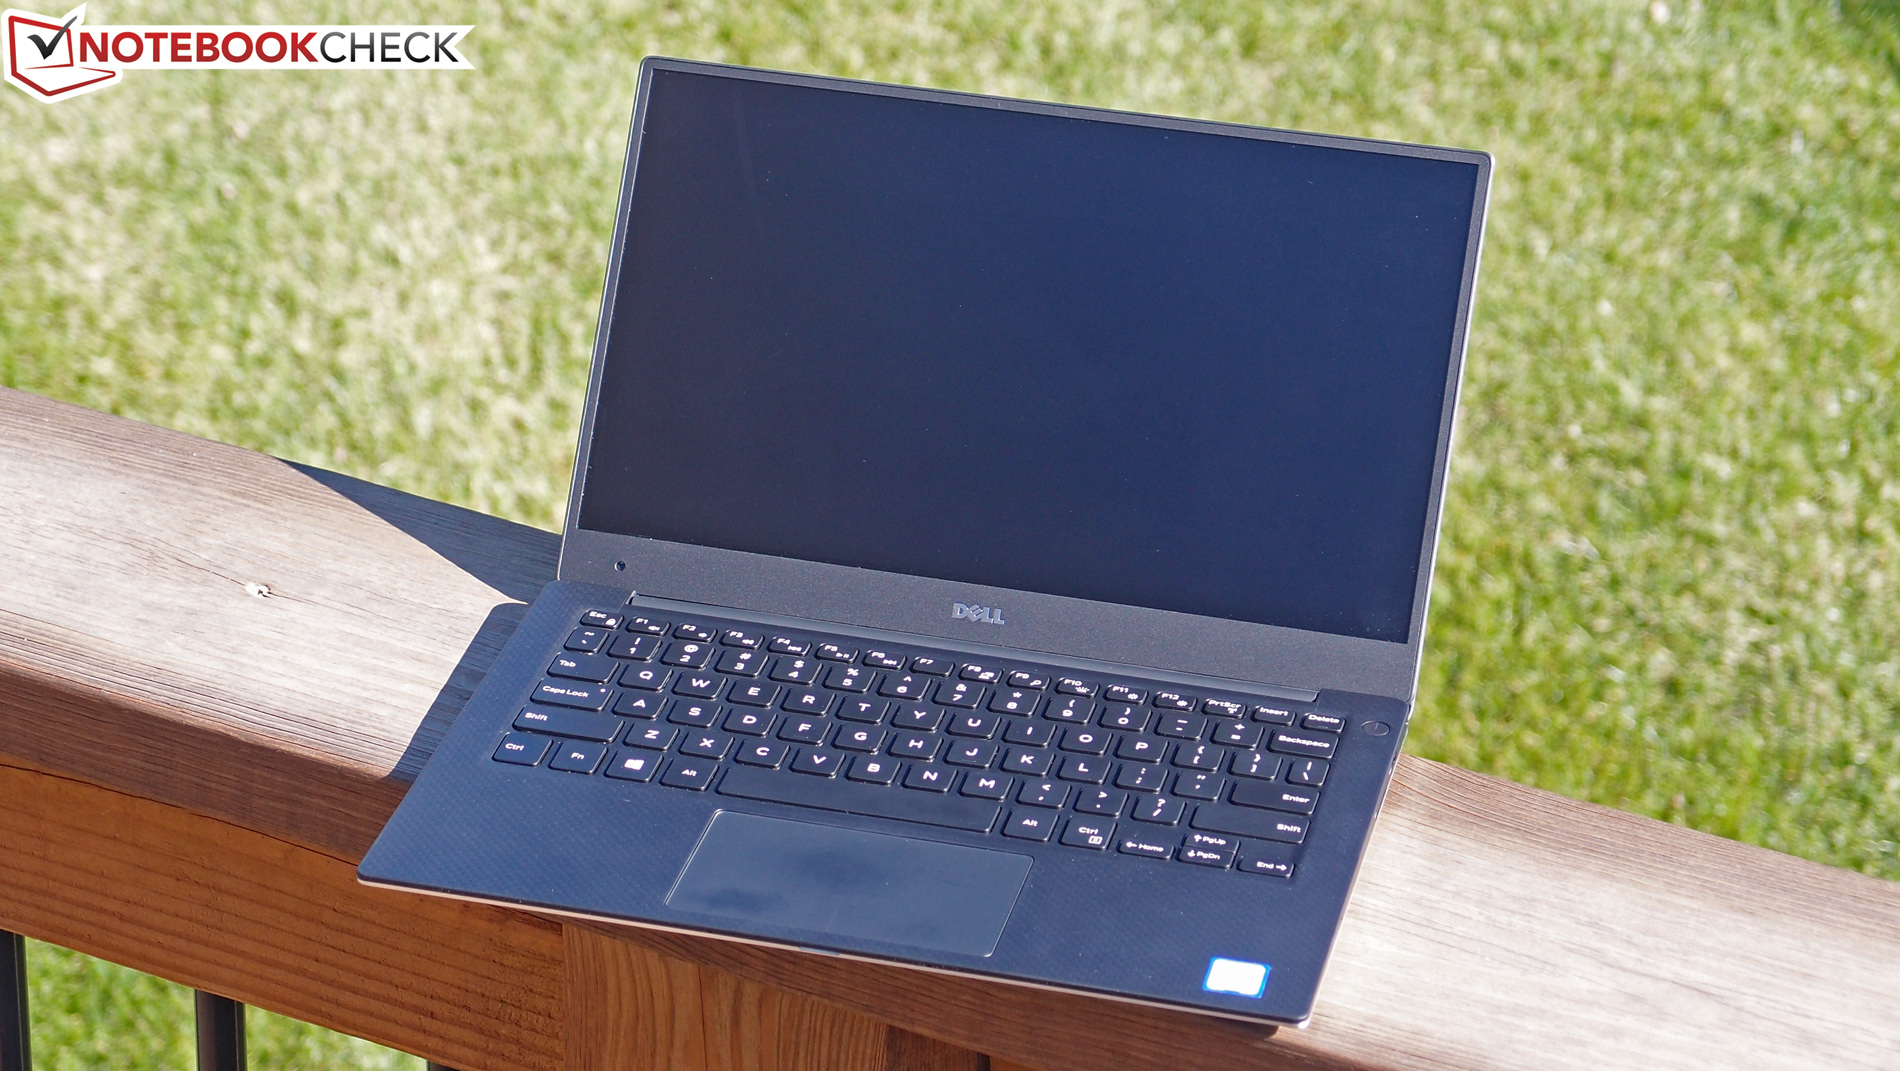
+ 明亮,抗反光1080p屏幕
+ 超窄边框
+ 非常高的系统性能
+ 大幅增强的显卡性能
+ 在高负载下无降频问题
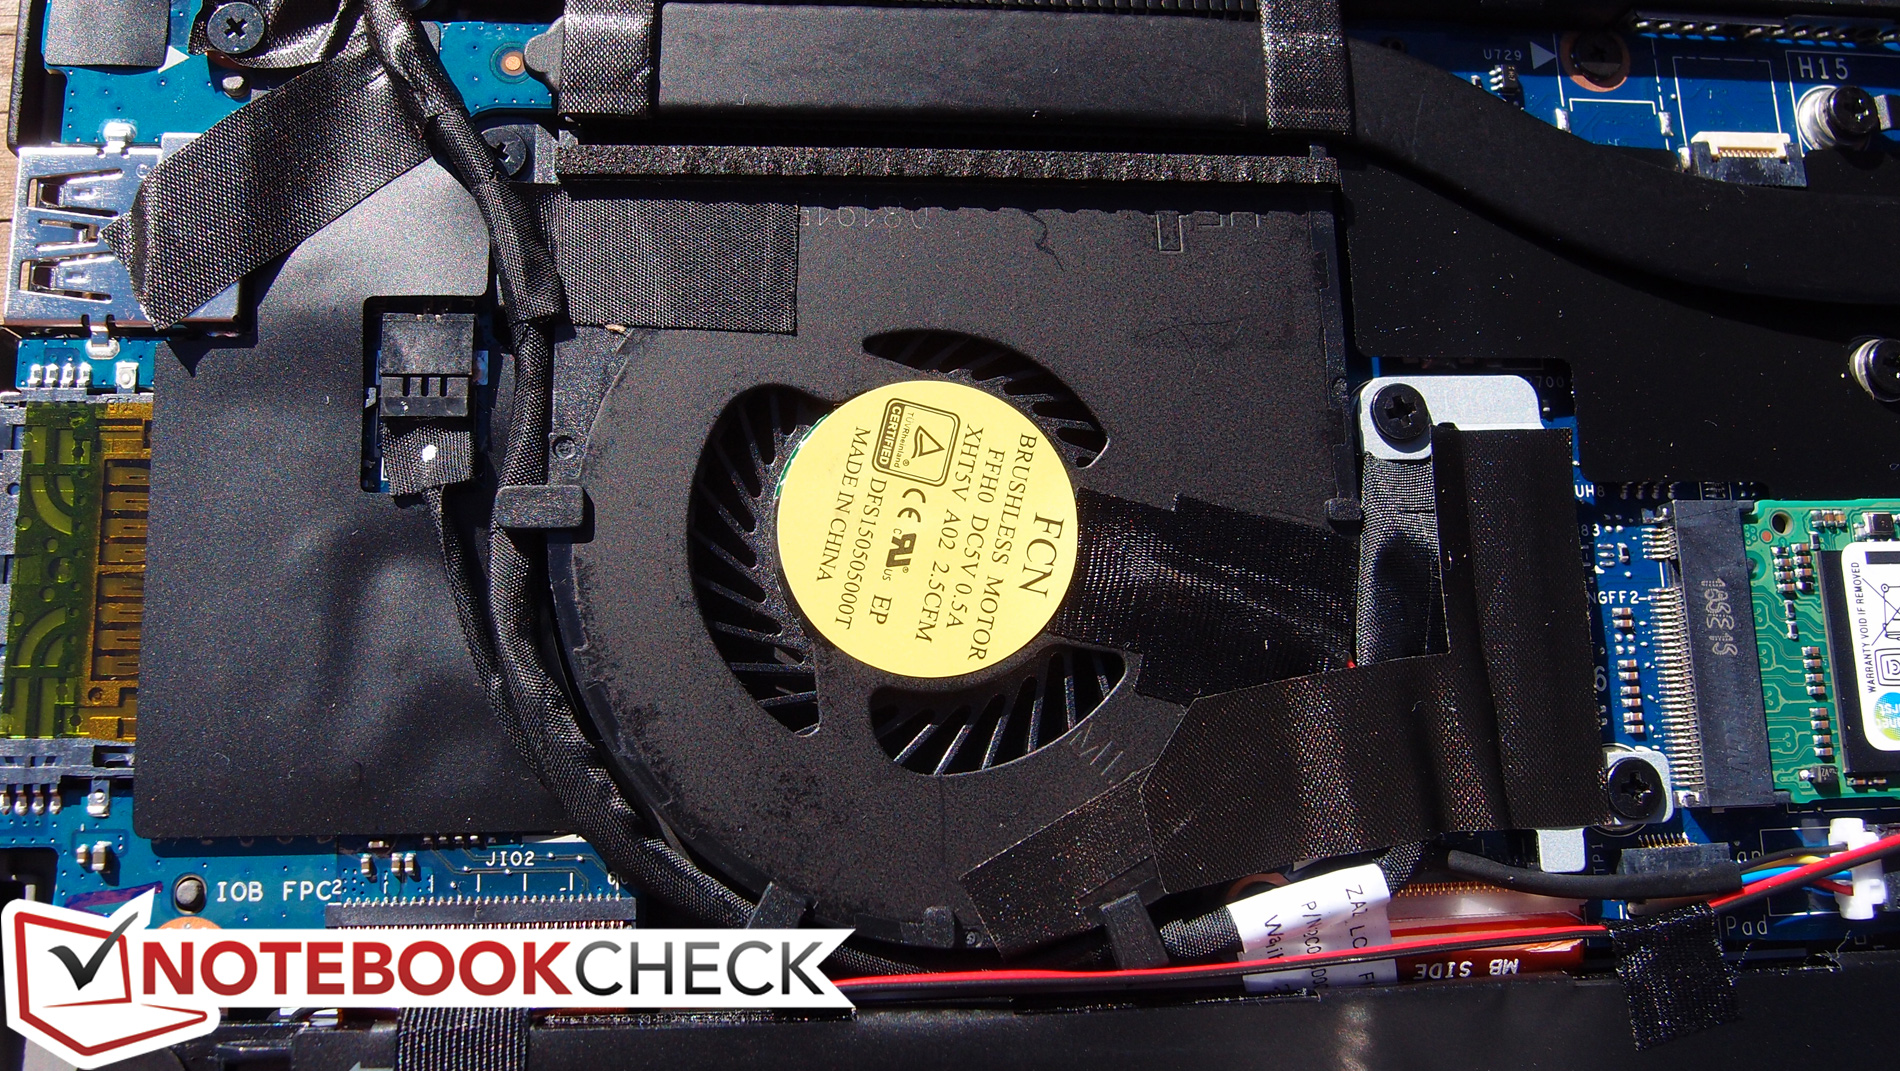
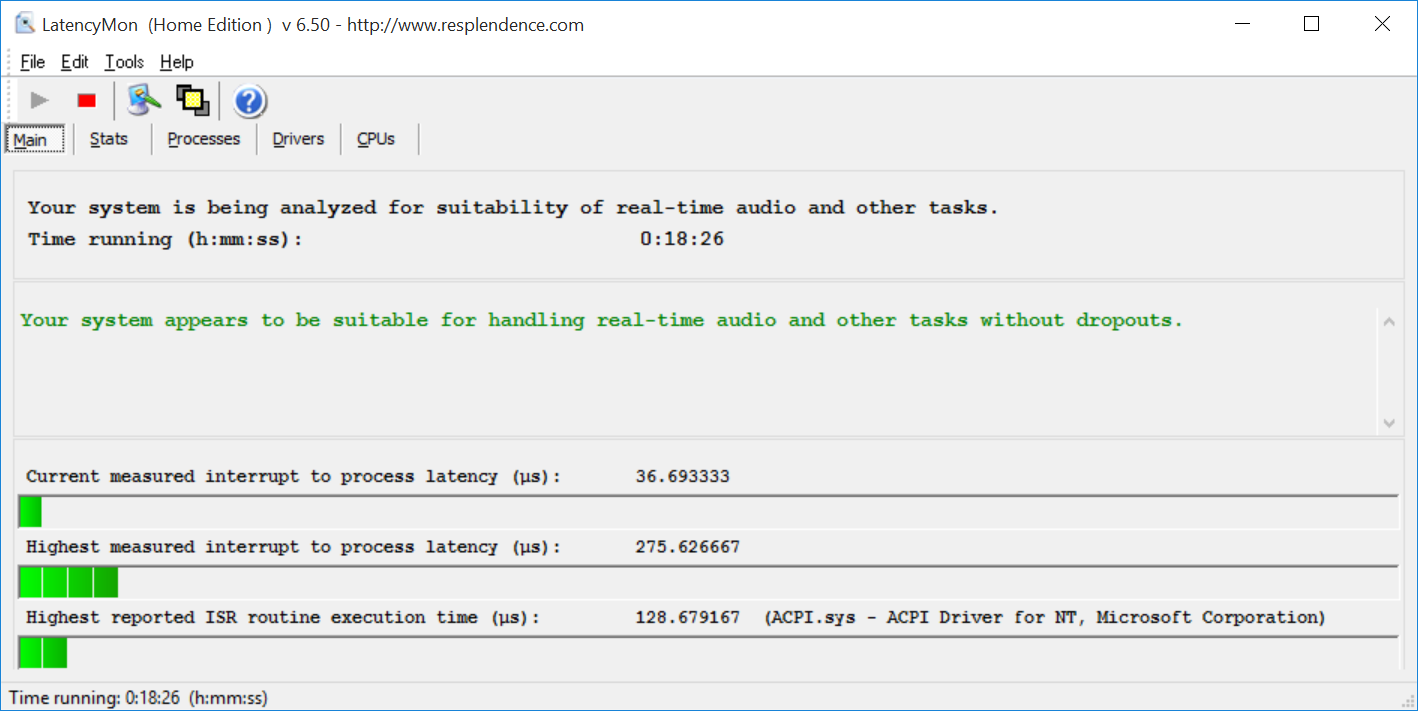
+ 合理的运行温度,相对安静
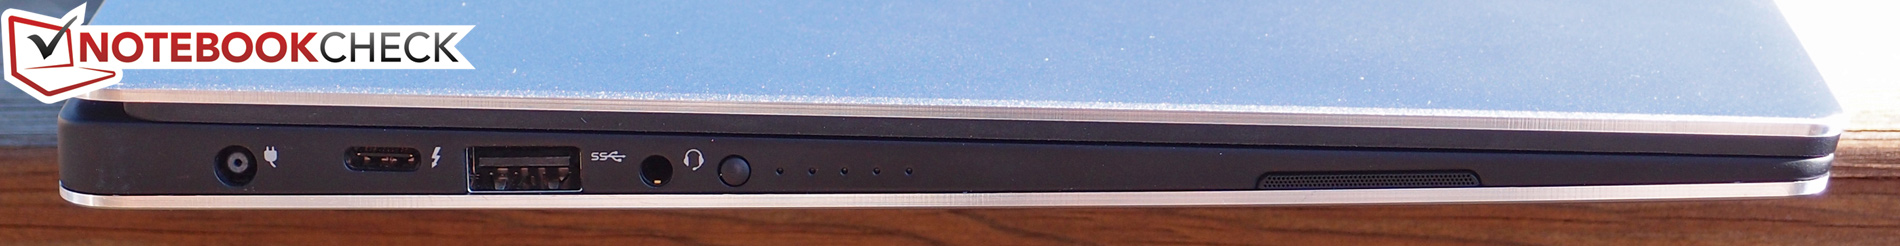
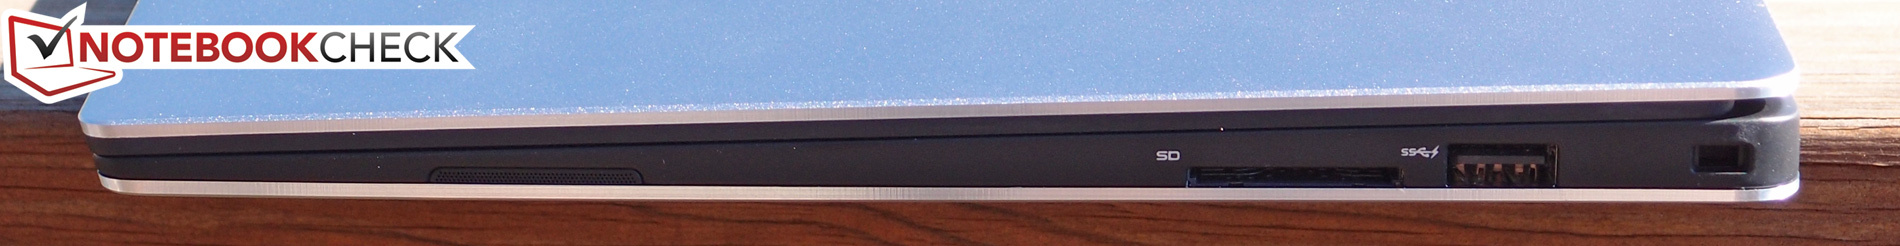
+ 相对尺寸优秀的接口配备
+ 出色的输入设备
+ 稳定的屏幕转轴
Cons
- 尽管屏幕色彩准确,但色域覆盖较小
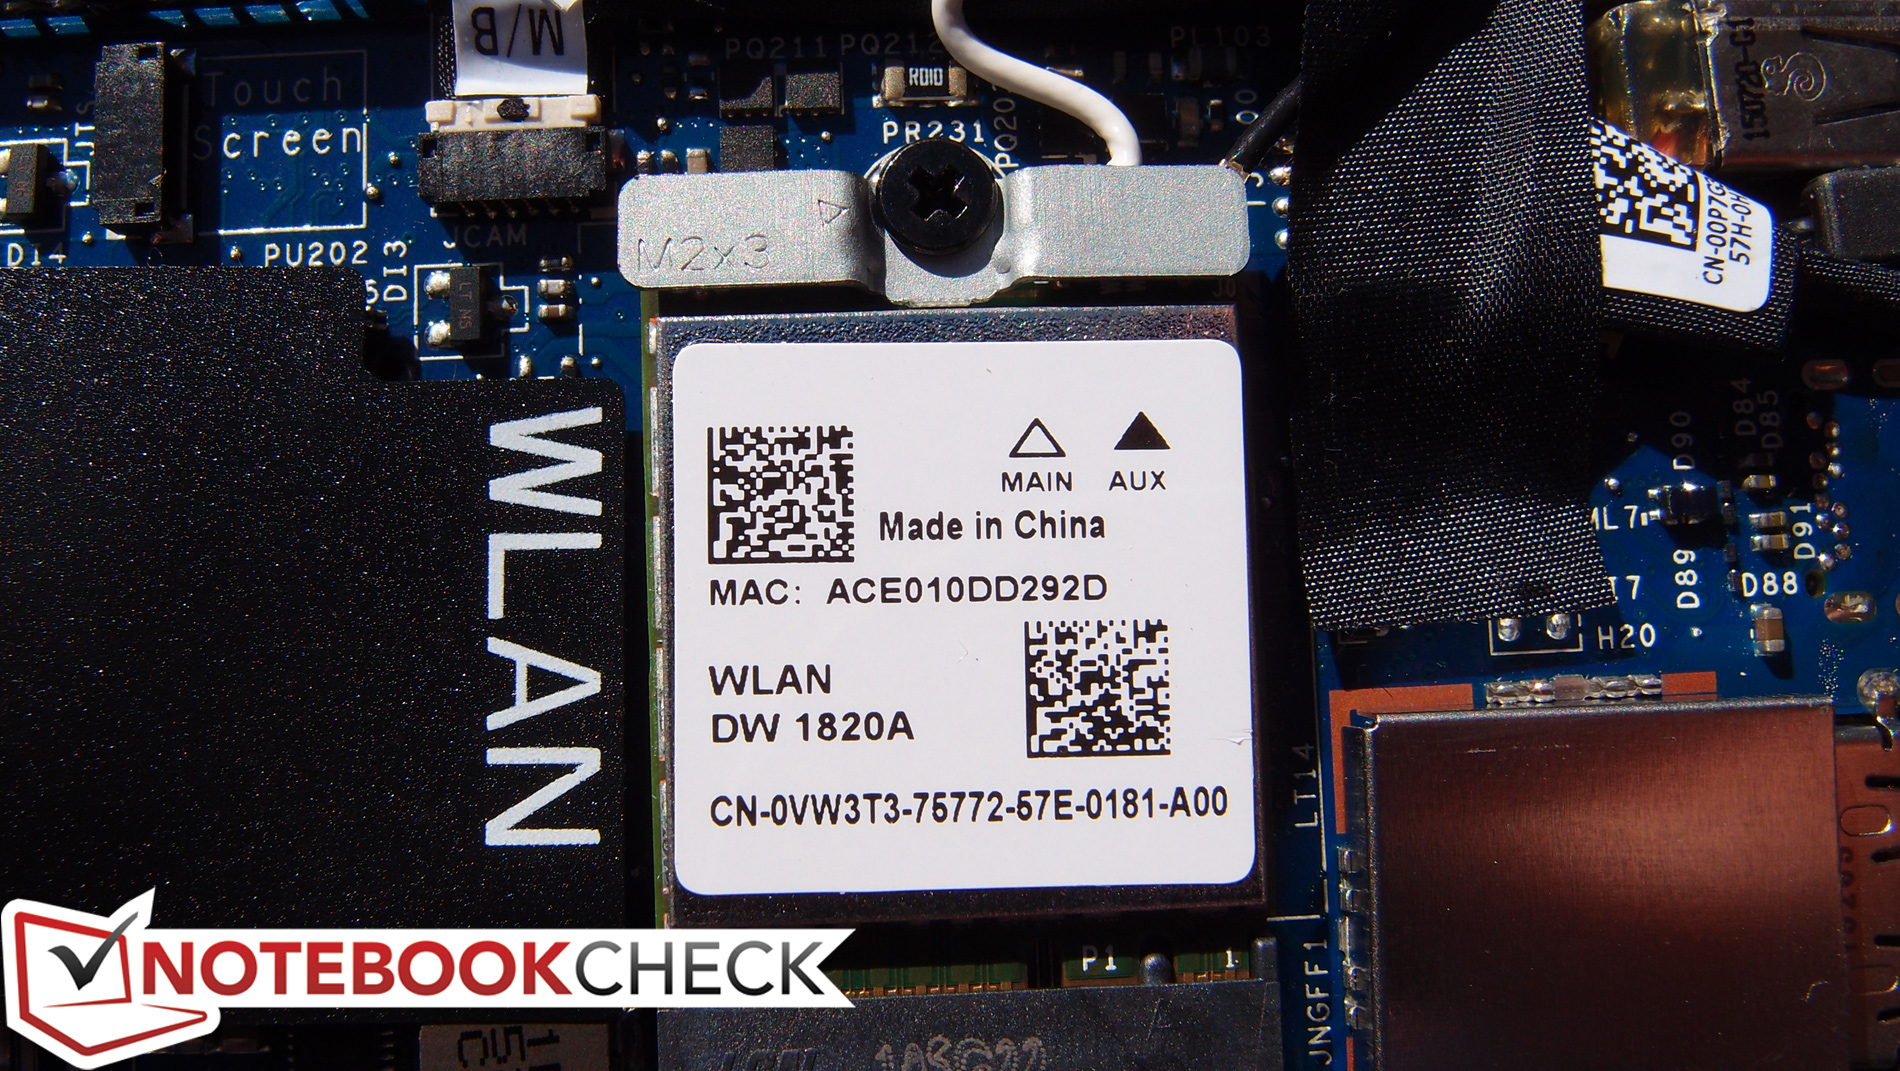
- 有限的可维护性/升级空间
- 标准质保仅提供邮寄方式
- 关闭自动屏幕亮度调整需要戴尔特别工具,且仅QHD+机型提供了支持
- 三星PM951的写入速度过慢
八个月过去了,戴尔的XPS 13依然是超便携设备王座的有力竞争者,采用增强了的芯片组和处理器,更快的NVMe固态硬盘,更优秀的内存设置,更强劲的集成显卡,更丰富的接口配置,最重要的是——更加安静的运行。它不是我们测试过最快的超极本;一些最新设备——例如微软Surface Book和Apple MacBook Air 13——在系统性能上都比它略高。不过这些性能分数的区别已经是在非常强劲的基础之上,而平衡的功能特性也让它非常诱人。主流超便携设备的优胜者并不是由很少的几个方面决定的,而是需要有整体上的平衡。
戴尔XPS 13-9350的强大源自于在超便携设备所必需的各个方面的巧妙平衡。不论是便携,性能,易用,人体工程学,散热噪音控制,甚至是外观设计,它都让人几乎无可挑剔。
我们所发现的缺点相比前代产品的问题显得更加无足轻重了:它屏幕的色域覆盖范围较小,可维护升级空间有限,同时质保需要通过邮寄完成。三星固态硬盘的写入速度在同类产品中也相比较慢,同时无法手动关闭的自动亮度调整也让人有些难以理解。不过,它在我们全面细致的测试中并没有表现出任何明显的缺点。
那么,它是最值得选择的一款产品吗?我们之前提到的每个竞争对手都应该可以满足几乎所有用户的需要——而戴尔XPS 13-9350毋庸置疑是其中设计最前卫也是在便携、性能、价值上最平衡的一款设备。
注:本文是基于完整评测的缩减版本,阅读完整的英文评测,请点击这里。
Dell XPS 13-9350
- 02/16/2016 v5 (old)
Steve Schardein
Subnotebook - Weighted Average
Price comparison
