戴尔 XPS 13 2016 (i7, 256 GB, QHD+) 笔记本电脑简短评测
| |||||||||||||||||||||||||
Brightness Distribution: 90 %
Center on Battery: 216 cd/m²
Contrast: 1583:1 (Black: 0.18 cd/m²)
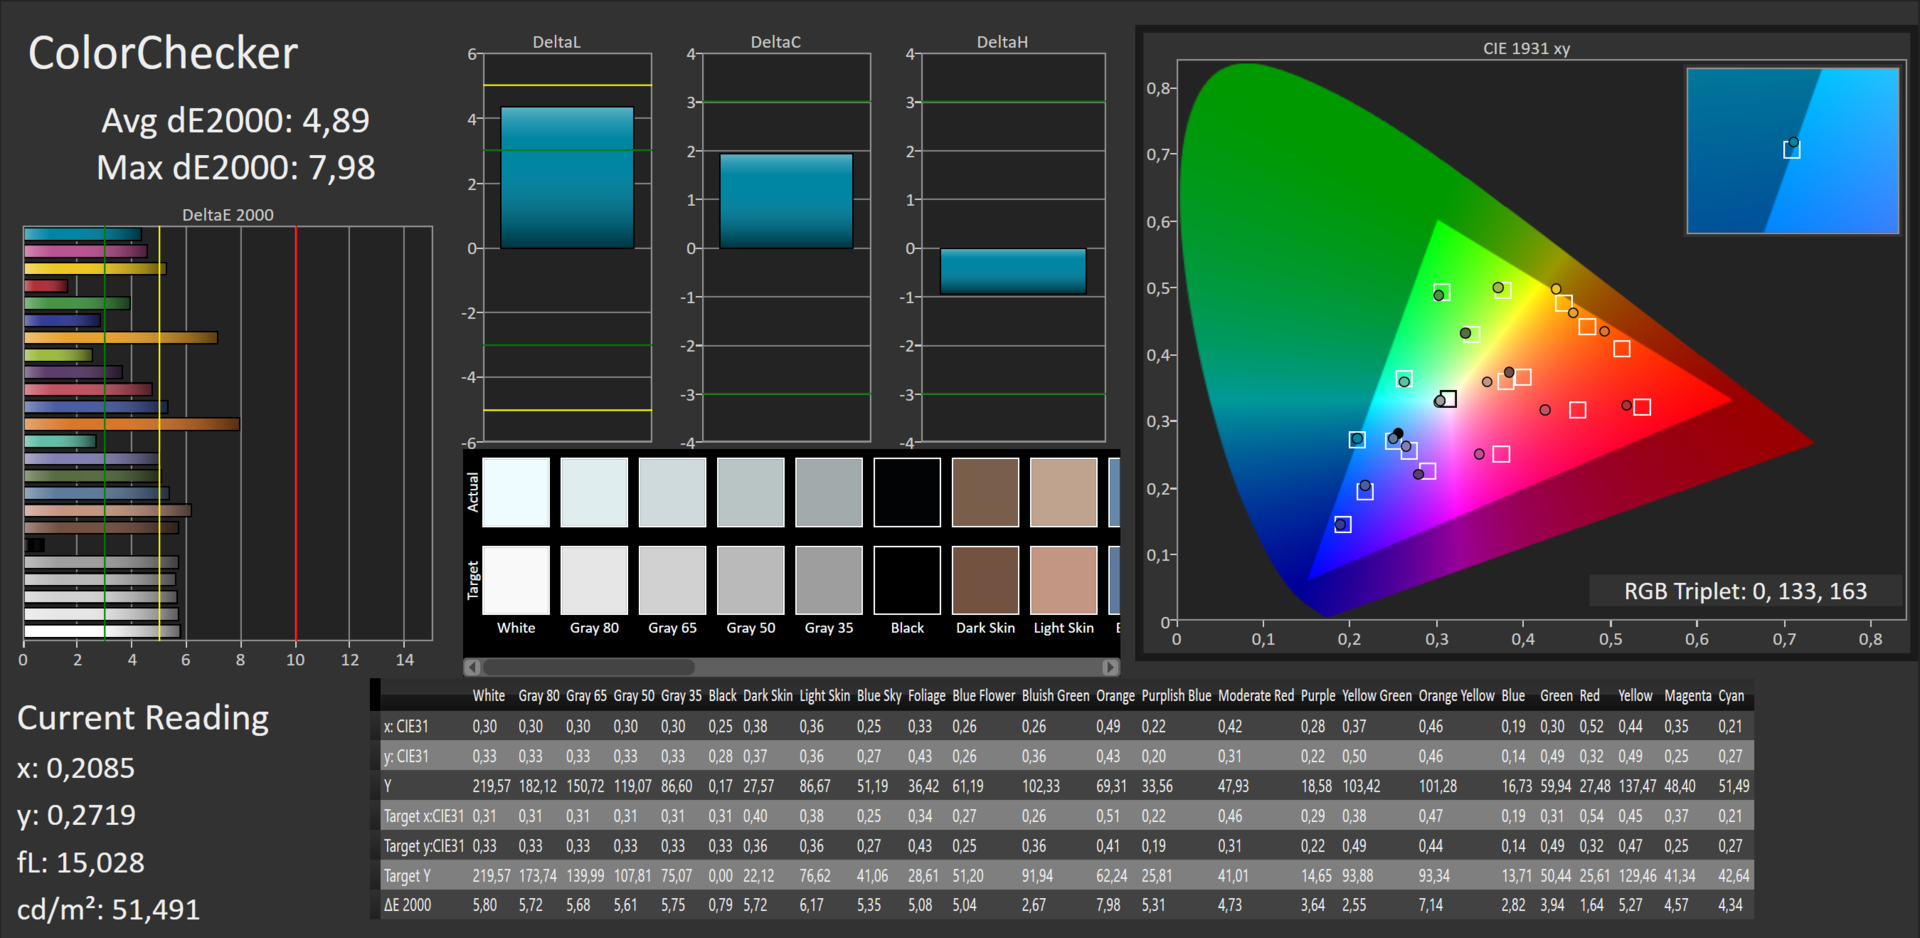
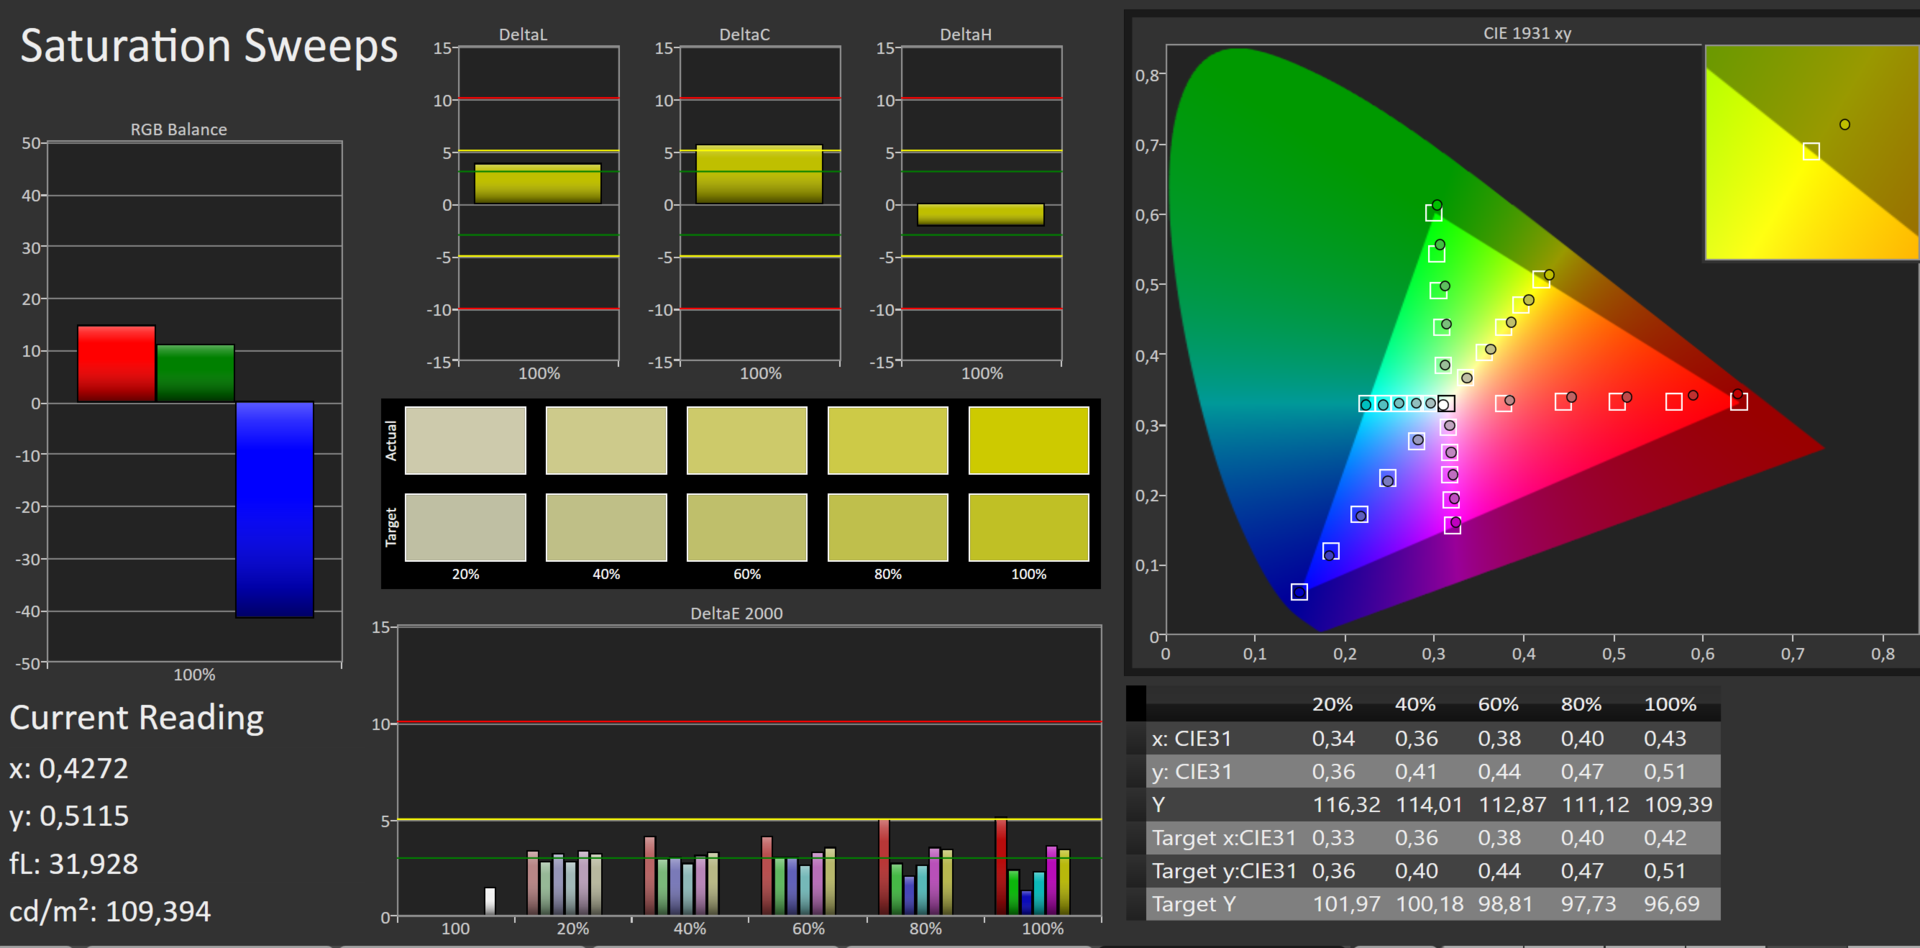
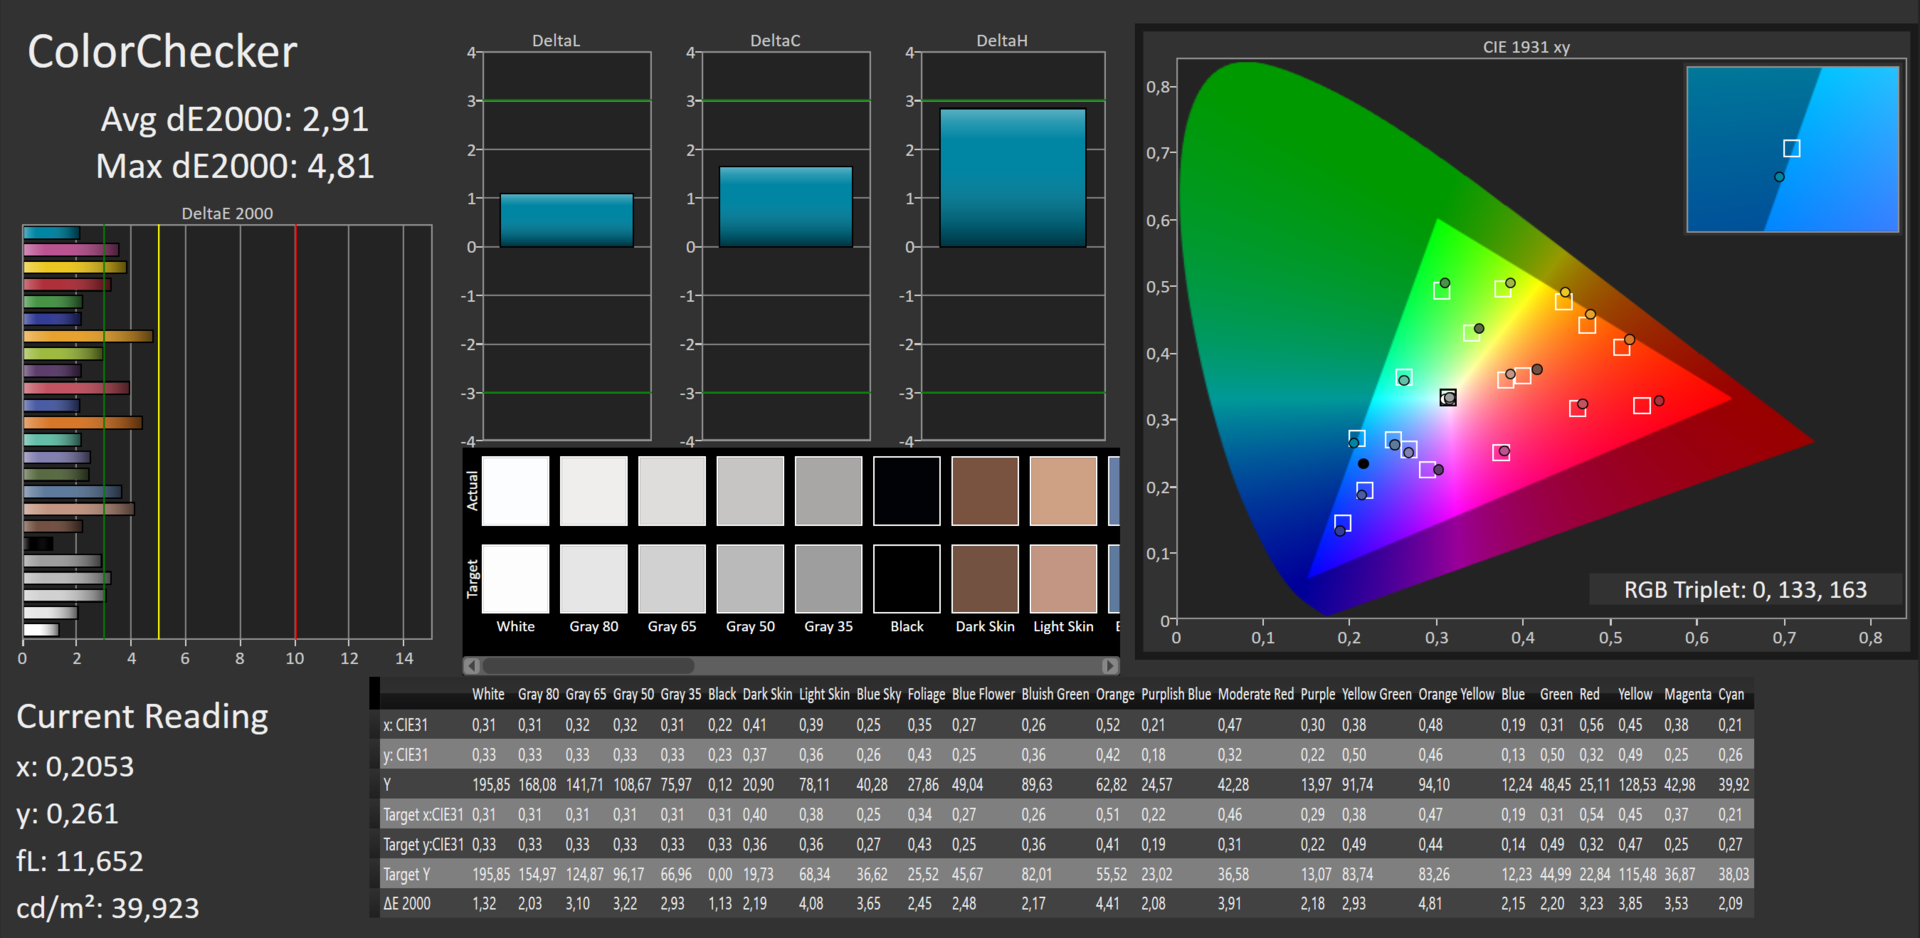
ΔE ColorChecker Calman: 4.89 | ∀{0.5-29.43 Ø4.72}
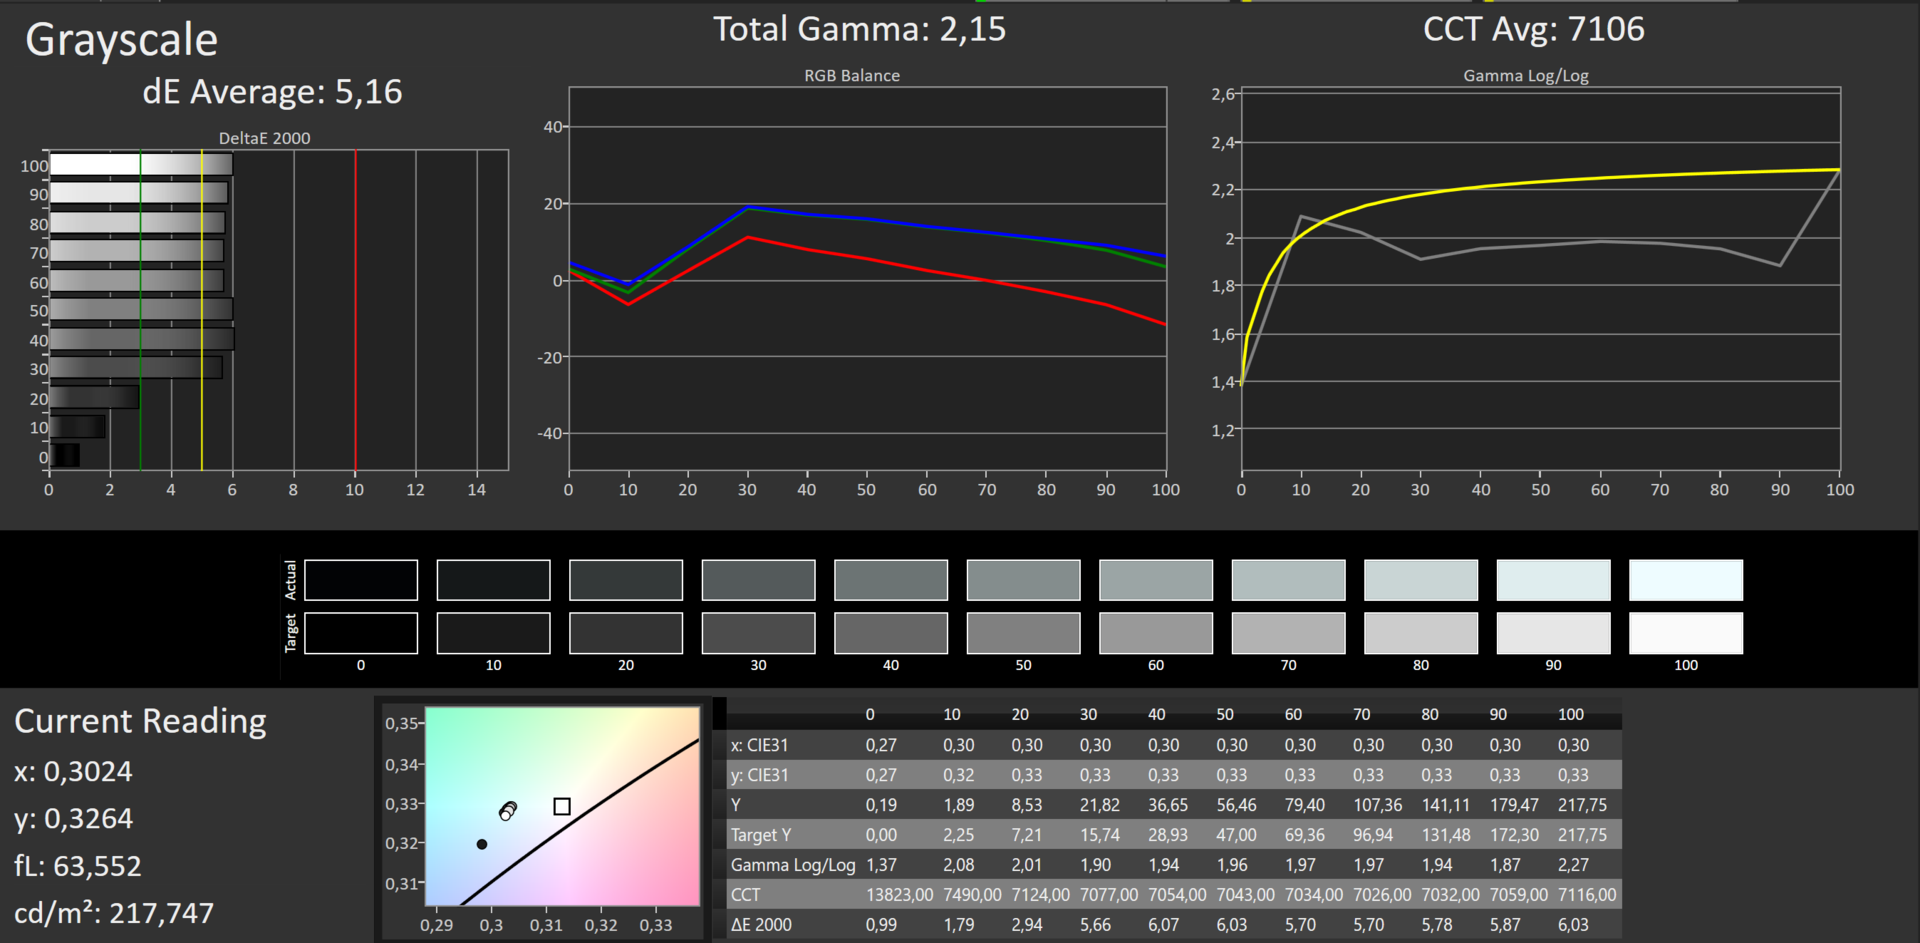
ΔE Greyscale Calman: 5.16 | ∀{0.09-98 Ø4.97}
93% sRGB (Argyll 1.6.3 3D)
59% AdobeRGB 1998 (Argyll 1.6.3 3D)
65.5% AdobeRGB 1998 (Argyll 3D)
93.6% sRGB (Argyll 3D)
63.6% Display P3 (Argyll 3D)
Gamma: 2.15
CCT: 7106 K
| Dell XPS 13-9350 Touch 13.3 3200x1800 IGZO | Dell XPS 13-9350 Non-Touch 13.3 1920x1080 IPS | Dell XPS 13-9343 Touch 13.3 3200x1800 IPS | Dell XPS 13-9343 Non-Touch 13.3 1920x1080 IPS | Apple MB Air 13 2015-03 13.3 1440x900 TN | MS Surface Pro 4 12.3 2736x1824 IPS | MS Surface Book 13.5 3000x2000 IPS | |
|---|---|---|---|---|---|---|---|
| Display | -30% | 8% | 0% | -37% | 2% | 4% | |
| Display P3 Coverage (%) | 63.6 | 44.53 -30% | 72 13% | 65.9 4% | 40.1 -37% | 65 2% | 67 5% |
| sRGB Coverage (%) | 93.6 | 66.8 -29% | 96 3% | 89.6 -4% | 59.8 -36% | 96.5 3% | 95.8 2% |
| AdobeRGB 1998 Coverage (%) | 65.5 | 45.97 -30% | 71.6 9% | 66.2 1% | 41.51 -37% | 67 2% | 68.9 5% |
| Response Times | -10% | -15% | |||||
| Response Time Grey 50% / Grey 80% * (ms) | 40 ? | 46 ? -15% | 48.4 ? -21% | ||||
| Response Time Black / White * (ms) | 30 ? | 31.2 ? -4% | 32.8 ? -9% | ||||
| PWM Frequency (Hz) | 4900 ? | 50 ? | |||||
| Screen | -7% | 8% | -11% | -20% | 3% | 21% | |
| Brightness middle (cd/m²) | 285 | 277.5 -3% | 367.3 29% | 409.7 44% | 329 15% | 413 45% | 430.9 51% |
| Brightness (cd/m²) | 281 | 276 -2% | 372 32% | 405 44% | 310 10% | 396 41% | 410 46% |
| Brightness Distribution (%) | 90 | 88 -2% | 77 -14% | 93 3% | 82 -9% | 87 -3% | 93 3% |
| Black Level * (cd/m²) | 0.18 | 0.191 -6% | 0.178 1% | 0.366 -103% | 0.405 -125% | 0.36 -100% | 0.254 -41% |
| Contrast (:1) | 1583 | 1453 -8% | 2063 30% | 1119 -29% | 812 -49% | 1147 -28% | 1696 7% |
| Colorchecker dE 2000 * | 4.89 | 4.88 -0% | 5.92 -21% | 7.67 -57% | 3.96 19% | 3.09 37% | 2.06 58% |
| Greyscale dE 2000 * | 5.16 | 4.26 17% | 4.79 7% | 4.66 10% | 3.51 32% | 3.92 24% | 2.22 57% |
| Gamma | 2.15 102% | 2.59 85% | 2.42 91% | 1.65 133% | 3.83 57% | 2.3 96% | 2.13 103% |
| CCT | 7106 91% | 6562 99% | 7013 93% | 6502 100% | 6711 97% | 7333 89% | 6520 100% |
| Color Space (Percent of AdobeRGB 1998) (%) | 59 | 41.6 -29% | 63 7% | 59.65 1% | 38.4 -35% | 61 3% | 64 8% |
| Color Space (Percent of sRGB) (%) | 93 | 65.79 -29% | 96.4 4% | 59.8 -36% | 97 4% | 96 3% | |
| Colorchecker dE 2000 max. * | 7.51 | ||||||
| Total Average (Program / Settings) | -19% /
-13% | 8% /
8% | -6% /
-8% | -29% /
-24% | -2% /
1% | 3% /
12% |
* ... smaller is better
Display Response Times
| ↔ Response Time Black to White | ||
|---|---|---|
| 30 ms ... rise ↗ and fall ↘ combined | ↗ 7 ms rise | 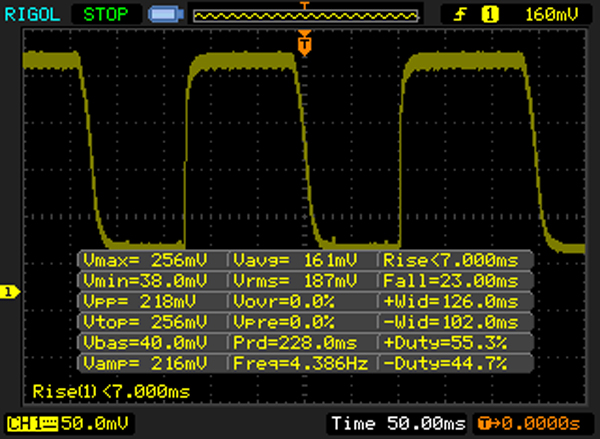 |
| ↘ 23 ms fall | ||
| The screen shows slow response rates in our tests and will be unsatisfactory for gamers. In comparison, all tested devices range from 0.1 (minimum) to 240 (maximum) ms. » 80 % of all devices are better. This means that the measured response time is worse than the average of all tested devices (19.8 ms). | ||
| ↔ Response Time 50% Grey to 80% Grey | ||
| 40 ms ... rise ↗ and fall ↘ combined | ↗ 10 ms rise | 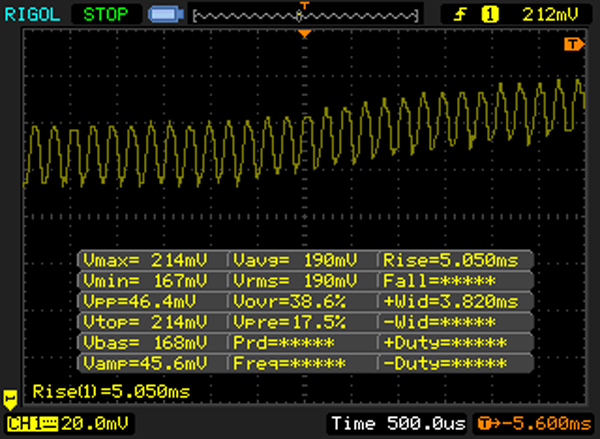 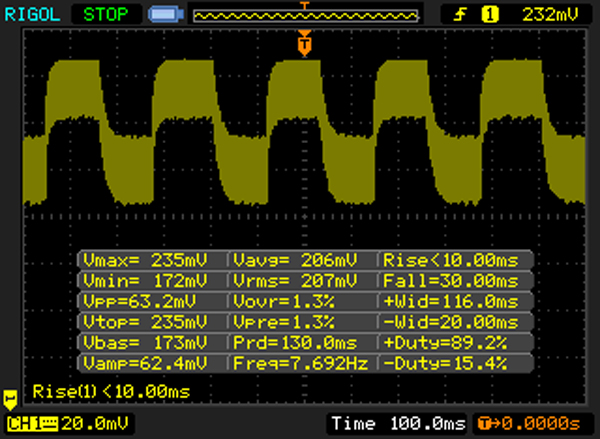 |
| ↘ 30 ms fall | ||
| The screen shows slow response rates in our tests and will be unsatisfactory for gamers. In comparison, all tested devices range from 0.165 (minimum) to 636 (maximum) ms. » 61 % of all devices are better. This means that the measured response time is worse than the average of all tested devices (31 ms). | ||
Screen Flickering / PWM (Pulse-Width Modulation)
| Screen flickering / PWM detected | 4900 Hz | ≤ 100 % brightness setting | 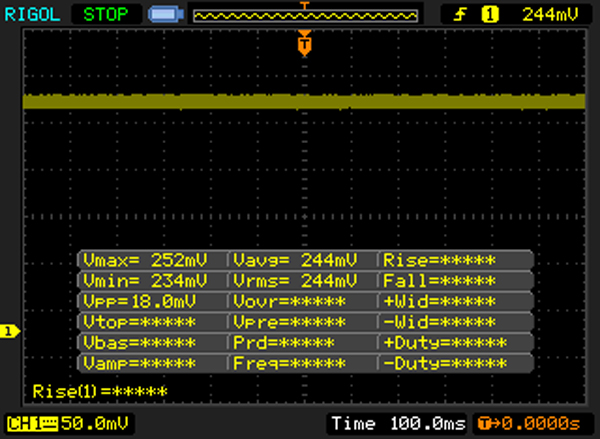 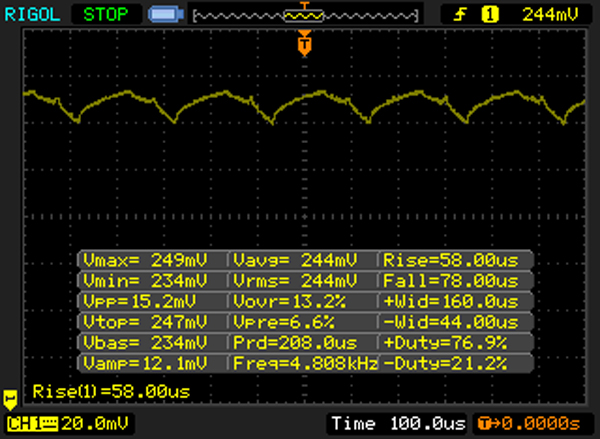 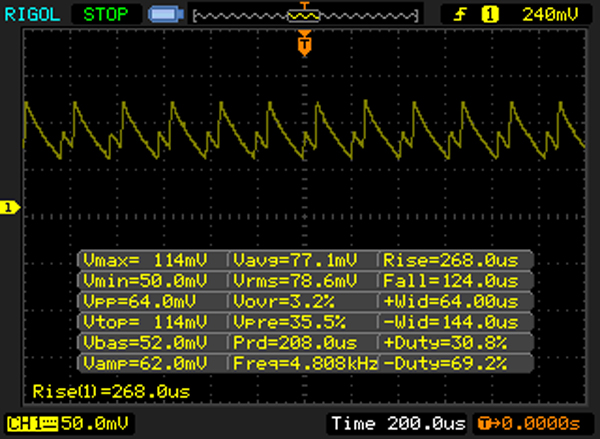 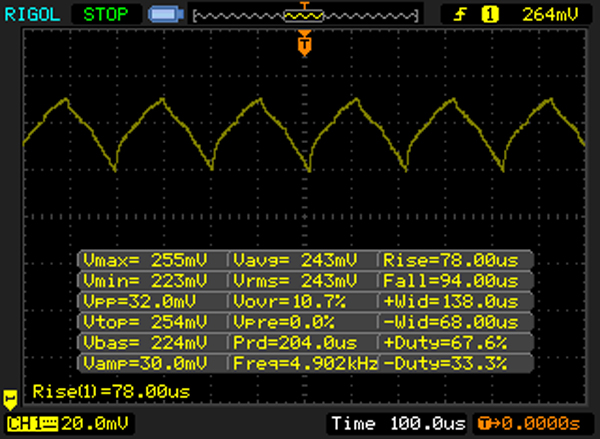 |
The display backlight flickers at 4900 Hz (worst case, e.g., utilizing PWM) Flickering detected at a brightness setting of 100 % and below. There should be no flickering or PWM above this brightness setting. The frequency of 4900 Hz is quite high, so most users sensitive to PWM should not notice any flickering. In comparison: 52 % of all tested devices do not use PWM to dim the display. If PWM was detected, an average of 7747 (minimum: 5 - maximum: 343500) Hz was measured. | |||
| Cinebench R15 | |
| CPU Single 64Bit (sort by value) | |
| Dell XPS 13-9350 Touch | |
| Dell XPS 13-9350 Non-Touch | |
| Dell XPS 13-9343 Touch | |
| Dell XPS 13-9343 Non-Touch | |
| Apple MB Air 13 2015-03 | |
| MS Surface Pro 4 | |
| MS Surface Book | |
| CPU Multi 64Bit (sort by value) | |
| Dell XPS 13-9350 Touch | |
| Dell XPS 13-9350 Non-Touch | |
| Dell XPS 13-9343 Touch | |
| Dell XPS 13-9343 Non-Touch | |
| Apple MB Air 13 2015-03 | |
| MS Surface Pro 4 | |
| MS Surface Book | |
| Cinebench R11.5 | |
| CPU Single 64Bit (sort by value) | |
| Dell XPS 13-9350 Touch | |
| Dell XPS 13-9350 Non-Touch | |
| Dell XPS 13-9343 Touch | |
| Dell XPS 13-9343 Non-Touch | |
| Apple MB Air 13 2015-03 | |
| MS Surface Pro 4 | |
| MS Surface Book | |
| CPU Multi 64Bit (sort by value) | |
| Dell XPS 13-9350 Touch | |
| Dell XPS 13-9350 Non-Touch | |
| Dell XPS 13-9343 Touch | |
| Dell XPS 13-9343 Non-Touch | |
| Apple MB Air 13 2015-03 | |
| MS Surface Pro 4 | |
| MS Surface Book | |
| PCMark 7 | |
| Score (sort by value) | |
| Dell XPS 13-9350 Touch | |
| Dell XPS 13-9350 Non-Touch | |
| Dell XPS 13-9343 Touch | |
| Dell XPS 13-9343 Non-Touch | |
| Apple MB Air 13 2015-03 | |
| MS Surface Pro 4 | |
| MS Surface Book | |
| Productivity (sort by value) | |
| Dell XPS 13-9350 Touch | |
| Dell XPS 13-9343 Non-Touch | |
| Apple MB Air 13 2015-03 | |
| MS Surface Pro 4 | |
| MS Surface Book | |
| Creativity (sort by value) | |
| Dell XPS 13-9350 Touch | |
| Dell XPS 13-9343 Non-Touch | |
| Apple MB Air 13 2015-03 | |
| MS Surface Pro 4 | |
| MS Surface Book | |
| Computation (sort by value) | |
| Dell XPS 13-9350 Touch | |
| Dell XPS 13-9343 Non-Touch | |
| Apple MB Air 13 2015-03 | |
| MS Surface Pro 4 | |
| MS Surface Book | |
| System Storage (sort by value) | |
| Dell XPS 13-9350 Touch | |
| Dell XPS 13-9343 Non-Touch | |
| Apple MB Air 13 2015-03 | |
| MS Surface Pro 4 | |
| MS Surface Book | |
| Entertainment (sort by value) | |
| Dell XPS 13-9350 Touch | |
| Dell XPS 13-9343 Non-Touch | |
| Apple MB Air 13 2015-03 | |
| MS Surface Pro 4 | |
| MS Surface Book | |
| PCMark 8 | |
| Home Score Accelerated v2 (sort by value) | |
| Dell XPS 13-9350 Touch | |
| Dell XPS 13-9350 Non-Touch | |
| Dell XPS 13-9343 Touch | |
| Dell XPS 13-9343 Non-Touch | |
| Apple MB Air 13 2015-03 | |
| MS Surface Pro 4 | |
| MS Surface Book | |
| Work Score Accelerated v2 (sort by value) | |
| Dell XPS 13-9350 Touch | |
| Dell XPS 13-9350 Non-Touch | |
| Dell XPS 13-9343 Touch | |
| Dell XPS 13-9343 Non-Touch | |
| Apple MB Air 13 2015-03 | |
| MS Surface Pro 4 | |
| MS Surface Book | |
| PCMark 7 Score | 4977 points | |
| PCMark 8 Home Score Accelerated v2 | 2822 points | |
| PCMark 8 Work Score Accelerated v2 | 3735 points | |
Help | ||
| Dell XPS 13-9350 Touch Samsung PM951 NVMe MZ-VLV256D | Dell XPS 13-9350 Non-Touch Samsung PM951 NVMe MZ-VLV256D | Dell XPS 13-9343 Touch Lite-On IT L8T-256L9G | Dell XPS 13-9343 Non-Touch Samsung SSD PM851 M.2 2280 128GB | Apple MB Air 13 2015-03 Apple SSD SD0256F | MS Surface Pro 4 Samsung MZFLV128 NVMe | MS Surface Book Samsung MZFLV256 NVMe | |
|---|---|---|---|---|---|---|---|
| CrystalDiskMark 3.0 | -12% | -11% | -40% | 33% | -31% | ||
| Read Seq (MB/s) | 764 | 1097 44% | 489.6 -36% | 526 -31% | 1352 77% | 666 -13% | |
| Write Seq (MB/s) | 311.4 | 307.7 -1% | 424.2 36% | 124.2 -60% | 1111 257% | 154.2 -50% | |
| Read 4k (MB/s) | 42.16 | 38.52 -9% | 34.76 -18% | 27.82 -34% | 21.93 -48% | 28.51 -32% | |
| Write 4k (MB/s) | 121 | 113 -7% | 79.3 -34% | 95.5 -21% | 30.94 -74% | 101.5 -16% | |
| Read 4k QD32 (MB/s) | 485.7 | 244.7 -50% | 354 -27% | 325.7 -33% | 339.5 -30% | 368.3 -24% | |
| Write 4k QD32 (MB/s) | 293.6 | 151.5 -48% | 326.3 11% | 124.5 -58% | 342.9 17% | 153.6 -48% | |
| AS SSD | -22% | -18% | -39% | 41% | -20% | 22% | |
| Seq Read (MB/s) | 735 | 1243 69% | 484.7 -34% | 497.9 -32% | 1212 65% | 832 13% | 1223 66% |
| Seq Write (MB/s) | 301.2 | 152.6 -49% | 416.8 38% | 119.6 -60% | 1001 232% | 142.5 -53% | 275.2 -9% |
| 4K Read (MB/s) | 38.21 | 34.61 -9% | 30.89 -19% | 25.94 -32% | 19.16 -50% | 34.24 -10% | 34.31 -10% |
| 4K Write (MB/s) | 97.6 | 0.98 -99% | 58.8 -40% | 84 -14% | 23.73 -76% | 86.5 -11% | 85 -13% |
| Score Read (Points) | 809 | 1147 42% | 425 -47% | 441 -45% | 1281 58% | 645 -20% | 1566 94% |
| Score Write (Points) | 391 | 60 -85% | 369 -6% | 184 -53% | 463 18% | 239 -39% | 394 1% |
| Copy ISO MB/s (MB/s) | 317.8 | 283.1 | 643 | 121.9 | 388.2 | ||
| Copy Program MB/s (MB/s) | 149.1 | 157.5 | 245 | 63.5 | 174.1 | ||
| Total Average (Program / Settings) | -17% /
-17% | -15% /
-15% | -40% /
-39% | 37% /
37% | -26% /
-25% | 22% /
22% |

| 3DMark - 1280x720 Cloud Gate Standard Score (sort by value) | |
| Dell XPS 13-9350 Touch | |
| Dell XPS 13-9350 Non-Touch | |
| Dell XPS 13-9343 Touch | |
| Dell XPS 13-9343 Non-Touch | |
| Apple MB Air 13 2015-03 | |
| MS Surface Pro 4 | |
| MS Surface Book | |
| 3DMark 11 | |
| 1280x720 Performance GPU (sort by value) | |
| Dell XPS 13-9350 Touch | |
| Dell XPS 13-9350 Non-Touch | |
| Dell XPS 13-9343 Non-Touch | |
| Apple MB Air 13 2015-03 | |
| MS Surface Pro 4 | |
| MS Surface Book | |
| 1280x720 Performance (sort by value) | |
| Dell XPS 13-9350 Touch | |
| Dell XPS 13-9350 Non-Touch | |
| Dell XPS 13-9343 Touch | |
| Dell XPS 13-9343 Non-Touch | |
| Apple MB Air 13 2015-03 | |
| MS Surface Pro 4 | |
| MS Surface Book | |
| 3DMark 11 Performance | 1556 points | |
| 3DMark Ice Storm Standard Score | 52990 points | |
| 3DMark Cloud Gate Standard Score | 5896 points | |
| 3DMark Fire Strike Score | 847 points | |
Help | ||
| Metro 2033 - 1360x768 Normal DX10 AA:A AF:4x (sort by value) | |
| Dell XPS 13-9350 Non-Touch | |
| Dell XPS 13-9343 Touch | |
| BioShock Infinite - 1366x768 Medium Preset (sort by value) | |
| Dell XPS 13-9350 Touch | |
| Dell XPS 13-9350 Non-Touch | |
| Dell XPS 13-9343 Touch | |
| Apple MB Air 13 2015-03 | |
| MS Surface Pro 4 | |
| MS Surface Book | |
| Tomb Raider - 1366x768 Normal Preset AA:FX AF:4x (sort by value) | |
| Dell XPS 13-9350 Touch | |
| Apple MB Air 13 2015-03 | |
| MS Surface Pro 4 | |
| MS Surface Book | |
| low | med. | high | ultra | |
|---|---|---|---|---|
| Tomb Raider (2013) | 71.8 | 36.6 | 24.4 | 11.2 |
| BioShock Infinite (2013) | 51.4 | 27.9 | 24.1 | 7.4 |
| Dirt Rally (2015) | 95 | 23.6 | 12.7 | |
| Metal Gear Solid V (2015) | 43.7 | 28.3 | 11.5 |
| Dell XPS 13-9350 Touch HD Graphics 520, 6500U, Samsung PM951 NVMe MZ-VLV256D | Dell XPS 13-9350 Non-Touch HD Graphics 520, 6200U, Samsung PM951 NVMe MZ-VLV256D | Dell XPS 13-9343 Touch HD Graphics 5500, 5200U, Lite-On IT L8T-256L9G | Dell XPS 13-9343 Non-Touch HD Graphics 5500, 5200U, Samsung SSD PM851 M.2 2280 128GB | Apple MB Air 13 2015-03 HD Graphics 6000, 5650U, Apple SSD SD0256F | MS Surface Pro 4 HD Graphics 520, 6300U, Samsung MZFLV128 NVMe | MS Surface Book Maxwell GPU (940M, GDDR5), 6300U, Samsung MZFLV256 NVMe | |
|---|---|---|---|---|---|---|---|
| Noise | 13% | -3% | 7% | -3% | -4% | 1% | |
| Idle Minimum * (dB) | 31.8 | 28.2 11% | 30.2 5% | 29 9% | 29.2 8% | 31.5 1% | 29.5 7% |
| Idle Average * (dB) | 31.8 | 28.3 11% | 30.3 5% | 29.1 8% | 29.2 8% | 31.5 1% | 29.6 7% |
| Idle Maximum * (dB) | 34.8 | 28.4 18% | 30.4 13% | 29.2 16% | 29.2 16% | 31.5 9% | 29.7 15% |
| Load Average * (dB) | 34.8 | 30.2 13% | 34.4 1% | 31.1 11% | 40.2 -16% | 40.5 -16% | 37.5 -8% |
| Load Maximum * (dB) | 34.8 | 30.2 13% | 48 -38% | 38.4 -10% | 46.3 -33% | 40.7 -17% | 40.9 -18% |
* ... smaller is better
Noise level
| Idle |
| 31.8 / 31.8 / 34.8 dB(A) |
| Load |
| 34.8 / 34.8 dB(A) |
 | ||
30 dB silent 40 dB(A) audible 50 dB(A) loud |
||
min: | ||
| Dell XPS 13-9350 Touch HD Graphics 520, 6500U, Samsung PM951 NVMe MZ-VLV256D | Dell XPS 13-9350 Non-Touch HD Graphics 520, 6200U, Samsung PM951 NVMe MZ-VLV256D | Dell XPS 13-9343 Touch HD Graphics 5500, 5200U, Lite-On IT L8T-256L9G | Dell XPS 13-9343 Non-Touch HD Graphics 5500, 5200U, Samsung SSD PM851 M.2 2280 128GB | Apple MB Air 13 2015-03 HD Graphics 6000, 5650U, Apple SSD SD0256F | MS Surface Pro 4 HD Graphics 520, 6300U, Samsung MZFLV128 NVMe | MS Surface Book Maxwell GPU (940M, GDDR5), 6300U, Samsung MZFLV256 NVMe | |
|---|---|---|---|---|---|---|---|
| Heat | 15% | 19% | 19% | 20% | -4% | 26% | |
| Maximum Upper Side * (°C) | 57 | 45.2 21% | 40.6 29% | 44.6 22% | 43.8 23% | 52.3 8% | 44.2 22% |
| Maximum Bottom * (°C) | 56 | 45.2 19% | 41.2 26% | 44.8 20% | 42.1 25% | 51.4 8% | 41.2 26% |
| Idle Upper Side * (°C) | 34.1 | 30.4 11% | 31.2 9% | 28.8 16% | 28.5 16% | 43.2 -27% | 26 24% |
| Idle Bottom * (°C) | 34.3 | 31.2 9% | 30.6 11% | 28.8 16% | 28.9 16% | 36 -5% | 23.8 31% |
* ... smaller is better
(-) The maximum temperature on the upper side is 57 °C / 135 F, compared to the average of 35.9 °C / 97 F, ranging from 21.4 to 59 °C for the class Subnotebook.
(-) The bottom heats up to a maximum of 56 °C / 133 F, compared to the average of 39.2 °C / 103 F
(+) In idle usage, the average temperature for the upper side is 29.9 °C / 86 F, compared to the device average of 30.8 °C / 87 F.
(±) The palmrests and touchpad can get very hot to the touch with a maximum of 37.5 °C / 99.5 F.
(-) The average temperature of the palmrest area of similar devices was 28.2 °C / 82.8 F (-9.3 °C / -16.7 F).
| Dell XPS 13-9350 Touch 6500U | Dell XPS 13-9350 Non-Touch 6200U | Dell XPS 13-9343 Touch 5500U | Dell XPS 13-9343 Non-Touch 5200U | |
|---|---|---|---|---|
| Power Consumption | -0% | 26% | 24% | |
| Idle Minimum * (Watt) | 6.8 | 6.6 3% | 2.7 60% | 4.4 35% |
| Idle Average * (Watt) | 10 | 9.3 7% | 5.7 43% | 9 10% |
| Idle Maximum * (Watt) | 10.5 | 11 -5% | 6 43% | 10.7 -2% |
| Load Average * (Watt) | 30.2 | 32.2 -7% | 32.1 -6% | 19.6 35% |
| Load Maximum * (Watt) | 33.6 | 33.2 1% | 36.2 -8% | 19.9 41% |
* ... smaller is better
| Off / Standby | |
| Idle | |
| Load |
|
Key:
min: | |
| Dell XPS 13-9350 Touch 6500U 56Wh | Dell XPS 13-9350 Non-Touch 6200U 56Wh | Dell XPS 13-9343 Touch 5200U 52Wh | Dell XPS 13-9343 Non-Touch 5200U 54Wh | Apple MB Air 13 2015-03 5650U 54Wh | MS Surface Pro 4 6300U 38Wh | MS Surface Book 6300U 69Wh | |
|---|---|---|---|---|---|---|---|
| Battery runtime | 17% | 26% | 48% | 46% | 9% | 27% | |
| Reader / Idle (h) | 13.1 | 13 -1% | 15.2 16% | 21.6 65% | 26.2 100% | 15 15% | 17.8 36% |
| WiFi v1.3 (h) | 7.2 | 7.5 4% | 10 39% | 10.3 43% | 7.1 -1% | 6.7 -7% | |
| Load (h) | 1.7 | 2.5 47% | 2.3 35% | 2.4 41% | 1.6 -6% | 1.9 12% | 2.6 53% |
| WiFi (h) | 9.7 | ||||||
| H.264 (h) | 10.1 |
Pros
Cons
市面上有很多设备可供选择:我应该买超窄边框外观时尚的XPS 13超极本呢,还是Surface Pro 4平板呢?或者更简单地:XPS 13全高清 vs. XPS 13 QHD?这个决定和性能无关;XPS和Surface在性能上都可以达到相似的高水平而没有降频问题。相比售价较低的酷睿i5机型的性能差别我们认为可以忽略不计。
XPS 13 i7/QHD版本相比i5/全高清机型续航时间较短,相比同类机型也显得较弱。仅仅5小时30分钟的续航时间对于高端超极本来说有些说不过去。一些细节如环境光传感器控制和屏幕亮度PWM,较差的维护升级功能和摄像头都值得质疑。我们也会尽力为读者提供更多关于内容适应亮度控制(CABC)的信息。
也有很多方面是XPS 13的长项——对于i5版本也是如此。高品质窄边框机身和相对优秀的性能,低噪音,高对比度高分辨率屏幕面板都是它的优势。感兴趣的用户需要决定这是否真的必要。而它的触控功能和点击触控版也都无可挑剔。
支付1549欧元(约10986人民币,不包括邮费),用户可以得到一台堪称最优秀的之一的精致亚笔记本电脑。搭配i7-5500U和256 GB固态硬盘的2015年前代机型仍然在销售,起售价约1500欧元(约10636人民币)。尽管新版本没有采用更快的处理器和显卡,不过搭配了Thunderbolt 3和USB Type C整合接口,支持USB 3.1第二代标准。因此,相比之下前代产品并不是特别值得选择;Thunderbolt 3和拓展坞可以为用户保障更长的适用性。
注:本文是基于完整评测的缩减版本,阅读完整的英文评测,请点击这里。
Dell XPS 13 2016 i7 256GB QHD
- 02/16/2016 v5 (old)
Sebastian Jentsch