戴尔XPS 13 9315笔记本电脑在审查。性能低下,电池寿命惊人

戴尔流行的13英寸笔记本电脑的最新版本不仅推出了一个 "Plus "姐妹型号,而且还更新了机箱,端口更少。由于极简主义是一种时尚,英特尔的Alder Lake-U CPU作为唯一的选择符合 "基本 "XPS 13的整体概念。虽然这个CPU阵容提供的峰值和连续性能明显较低,但由于大量的E核心,它的能效非常高。因此,我们的测试设备在降低亮度的情况下,设法在Wi-Fi测试中突破15小时的大关。
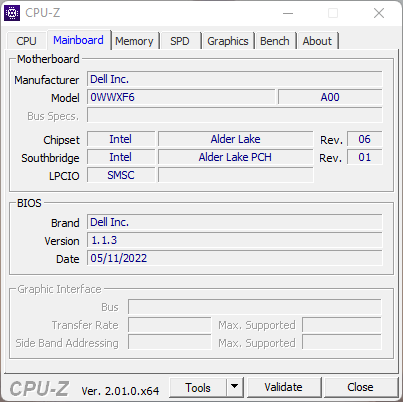
今天,我们来看看XPS 13 9315的基本型号。i5-1230U ,只有8GB的内存和256GB的固态硬盘,它不太可能打破任何记录。由于包括Wi-Fi模块在内的所有(!)组件都是焊接的,所以以后不可能升级系统。
我们将XPS 13 9315与Plus型号9320(P处理器,4K)和戴尔的竞争对手的型号进行比较。下表显示了接近XPS 13的机型和获得更好评价的机型。
更多由Notebookcheck评测的戴尔的XPS笔记本电脑。
XPS 13 Plus 9320 i7-1260P(4K, Alder Lake 2022)
XPS 13 Plus 9320 i5-1240P(FHD, 不久将公布)
XPS 13 9310 Core i7(FHD,Tiger Lake 2021)
潜在的竞争对手比较
Rating | Date | Model | Weight | Height | Size | Resolution | Price |
|---|---|---|---|---|---|---|---|
| 88.2 % v7 (old) | 08 / 2022 | Dell XPS 13 9315, i5-1230U i5-1230U, Iris Xe G7 80EUs | 1.2 kg | 14 mm | 13.40" | 1920x1200 | |
| 91.1 % v7 (old) | 12 / 2020 | Apple MacBook Air 2020 M1 Entry M1, M1 7-Core GPU | 1.3 kg | 16.1 mm | 13.30" | 2560x1600 | |
| 90.1 % v7 (old) | 07 / 2022 | Asus Zenbook S 13 OLED R7 6800U, Radeon 680M | 1.1 kg | 14.9 mm | 13.30" | 2880x1800 | |
| 89.8 % v7 (old) | 02 / 2021 | Lenovo ThinkPad X1 Nano-20UN002UGE i7-1160G7, Iris Xe G7 96EUs | 946 g | 16 mm | 13.00" | 2160x1350 | |
| 88.8 % v7 (old) | 02 / 2022 | Huawei MateBook 13s i5 11300H i5-11300H, Iris Xe G7 80EUs | 1.3 kg | 16.5 mm | 13.40" | 2520x1680 | |
| 86.9 % v7 (old) | 07 / 2022 | Dell XPS 13 Plus 9320 4K i7-1260P, Iris Xe G7 96EUs | 1.2 kg | 15.3 mm | 13.40" | 3840x2400 | |
| 86.1 % v7 (old) | 08 / 2022 | Dell XPS 13 Plus 9320 i5-1240p i5-1240P, Iris Xe G7 80EUs | 1.2 kg | 15.3 mm | 13.40" | 1920x1200 |
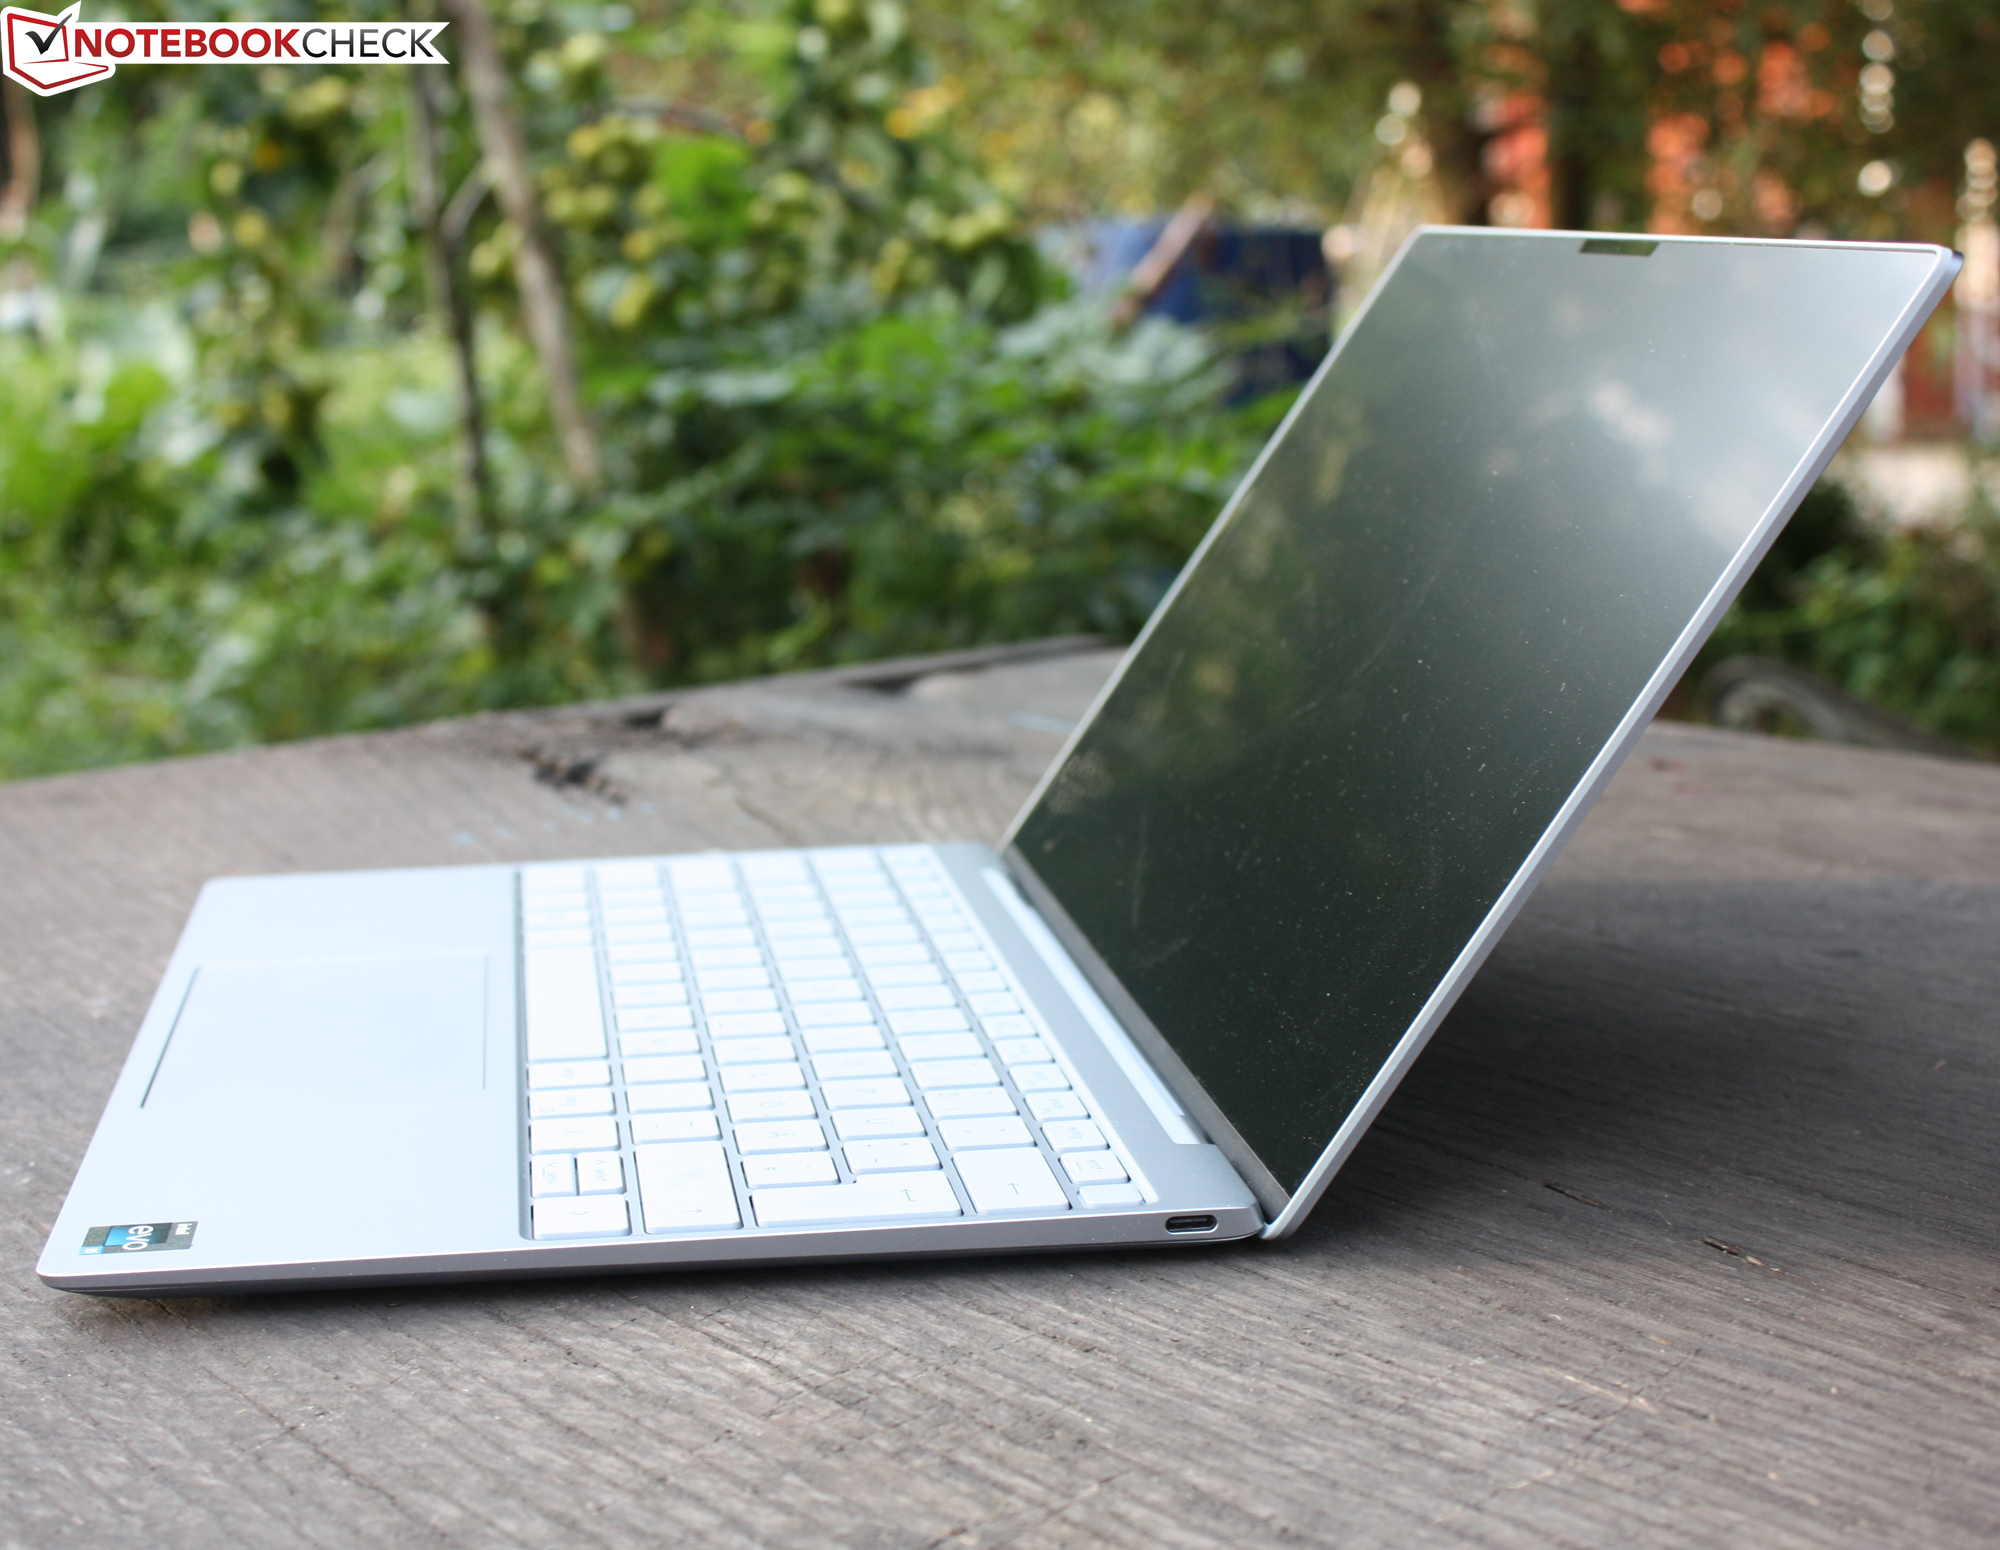
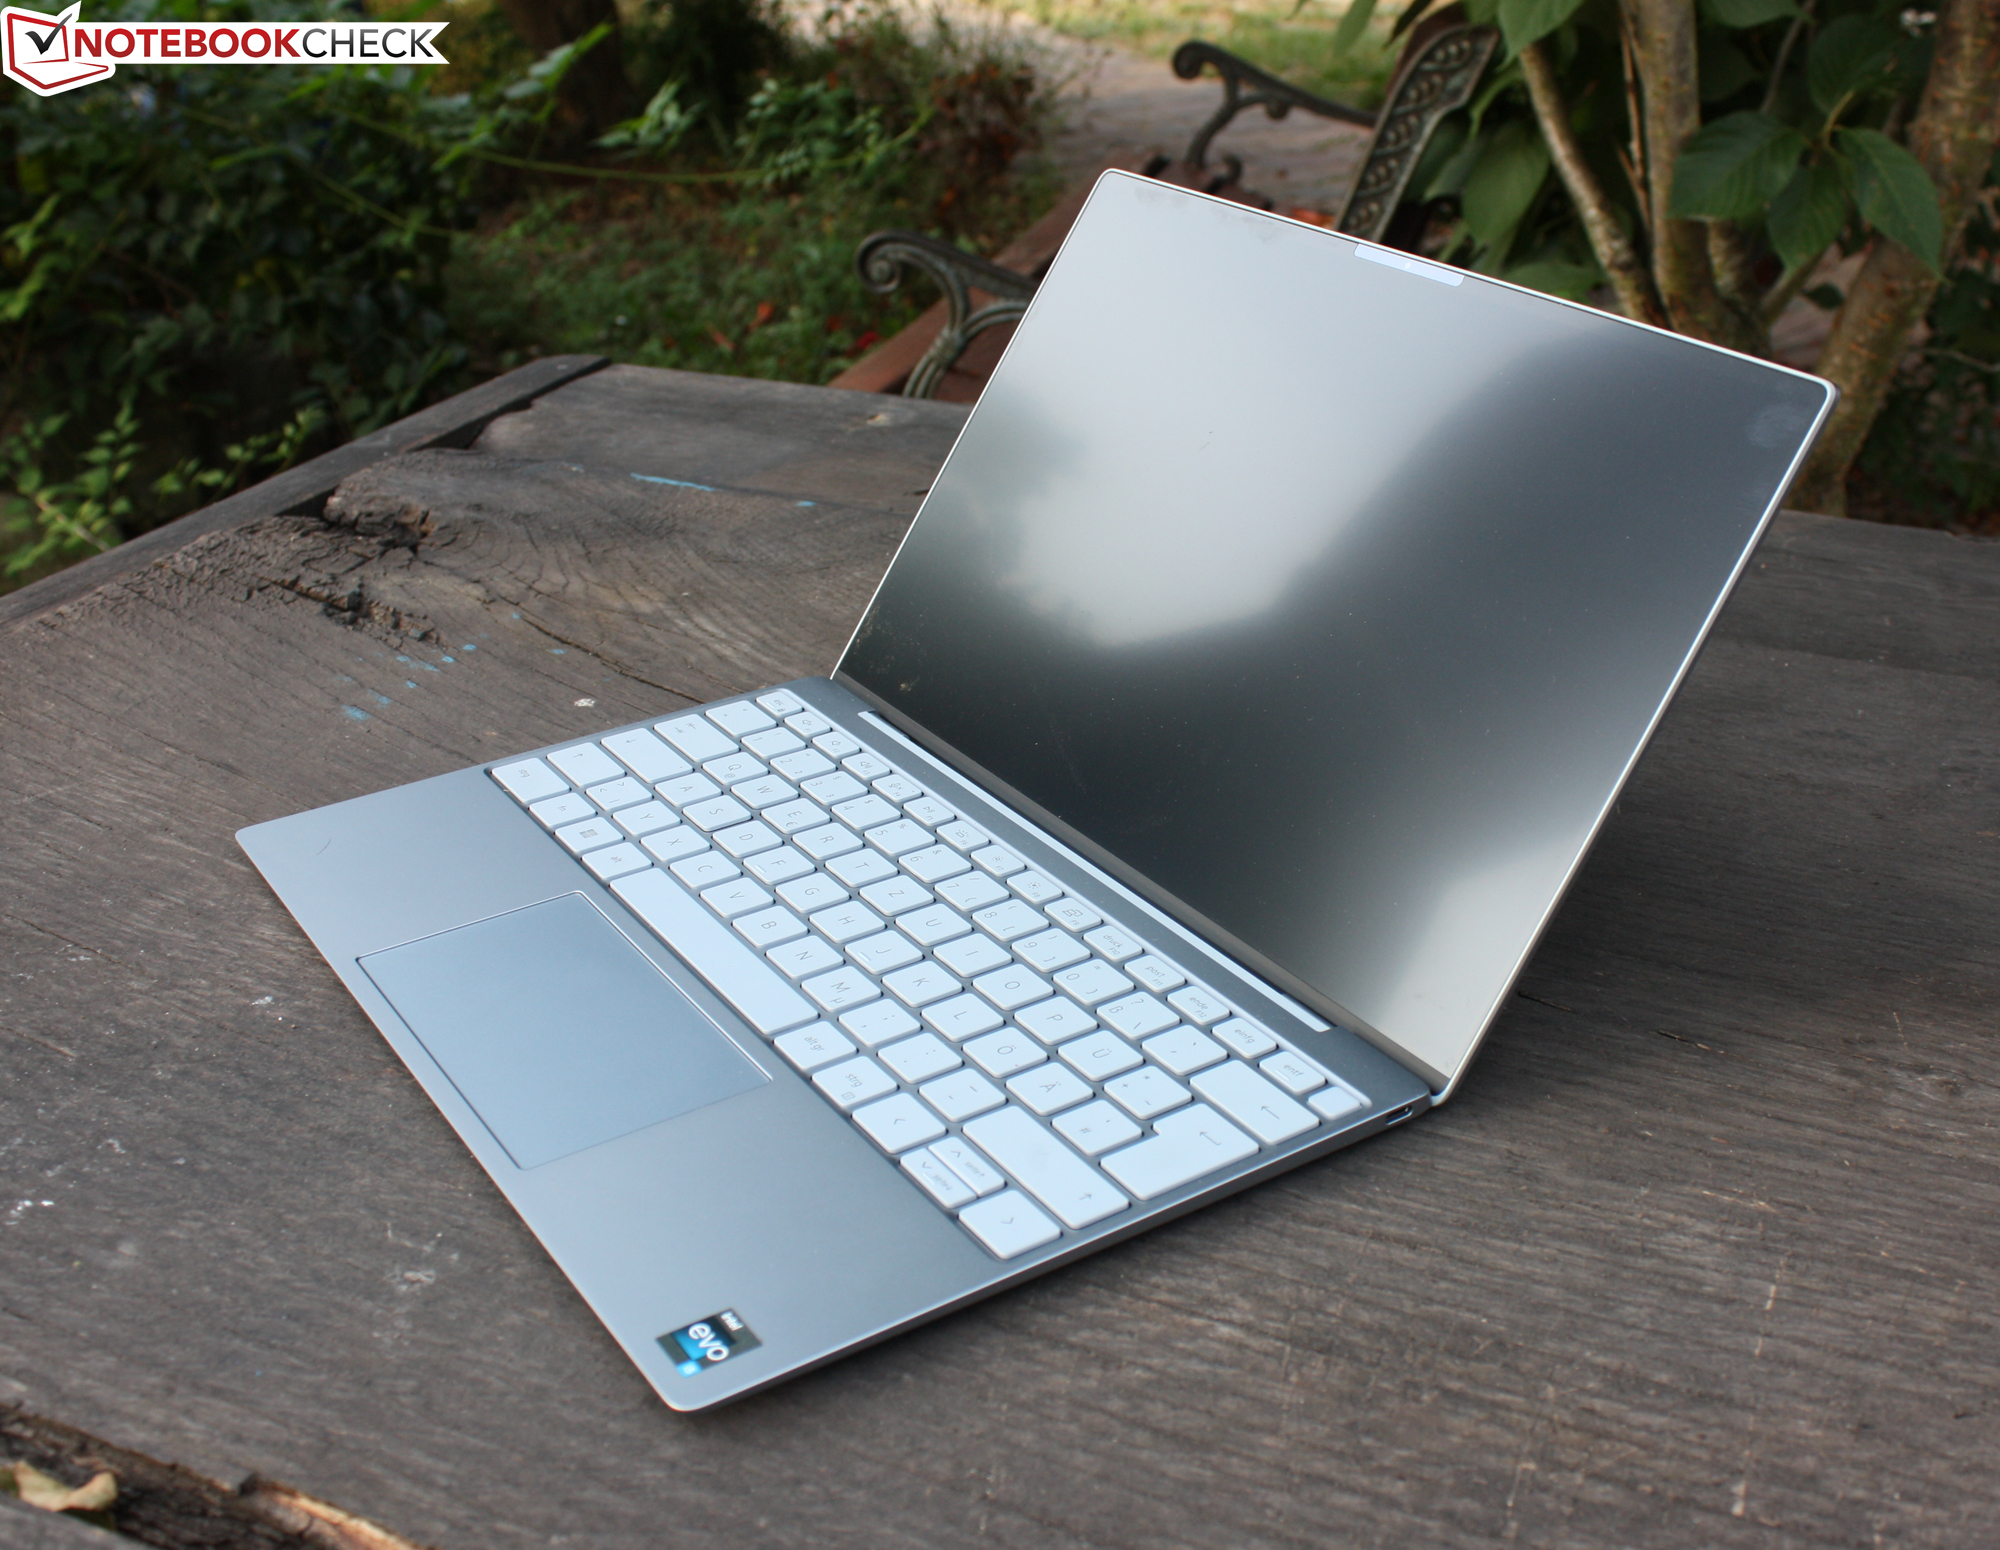
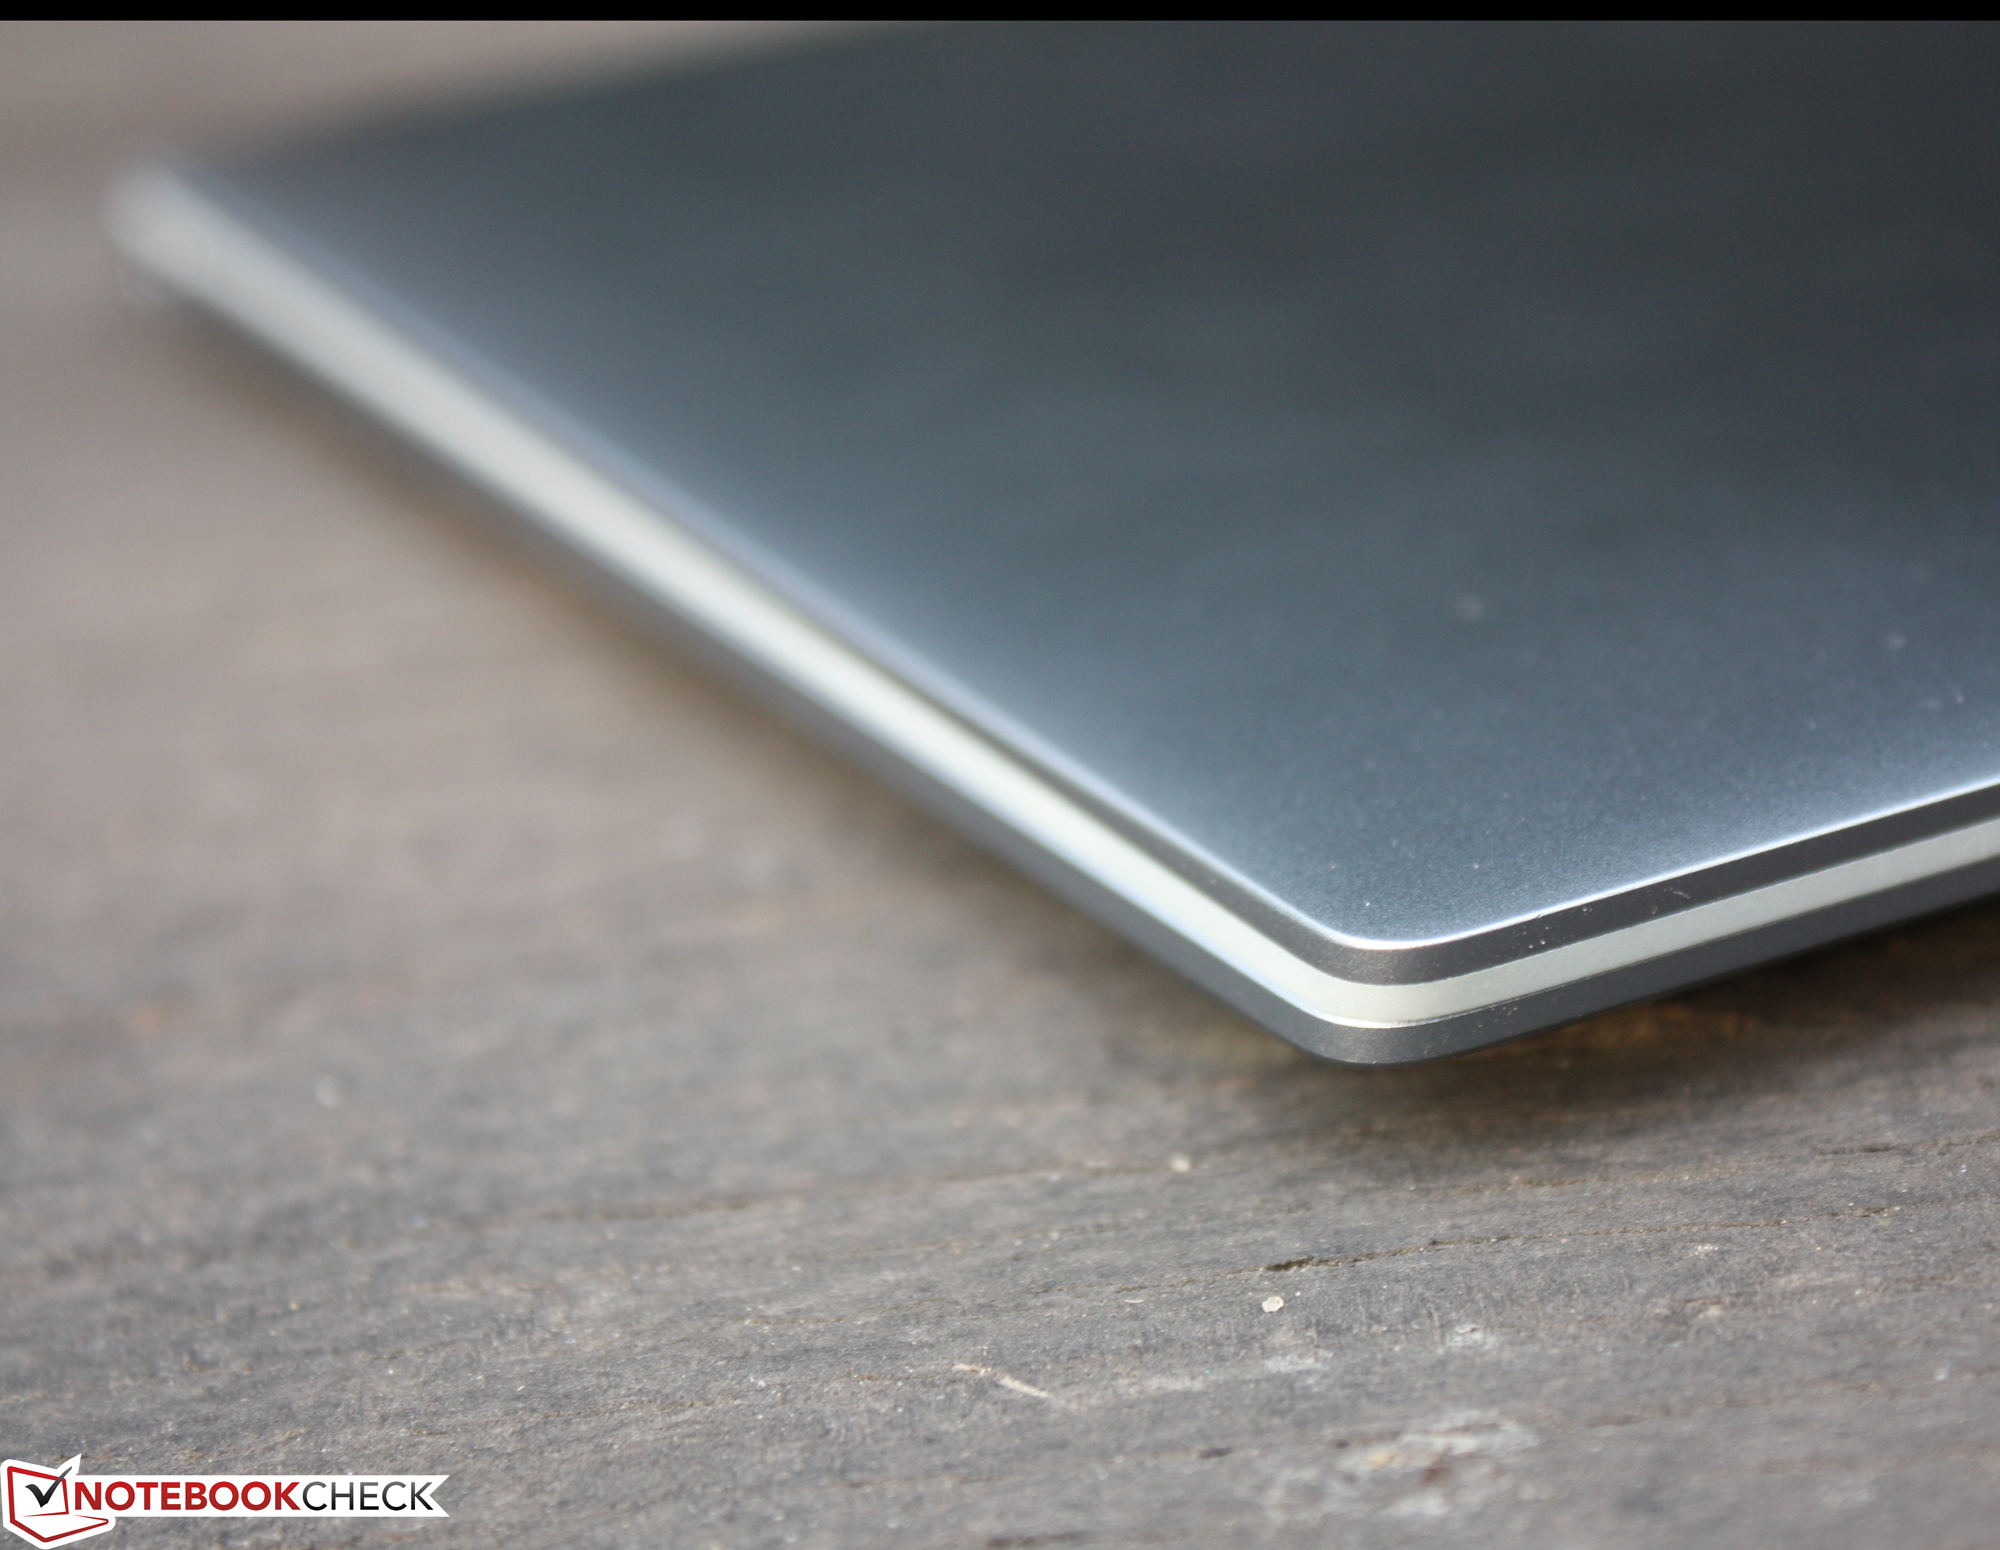
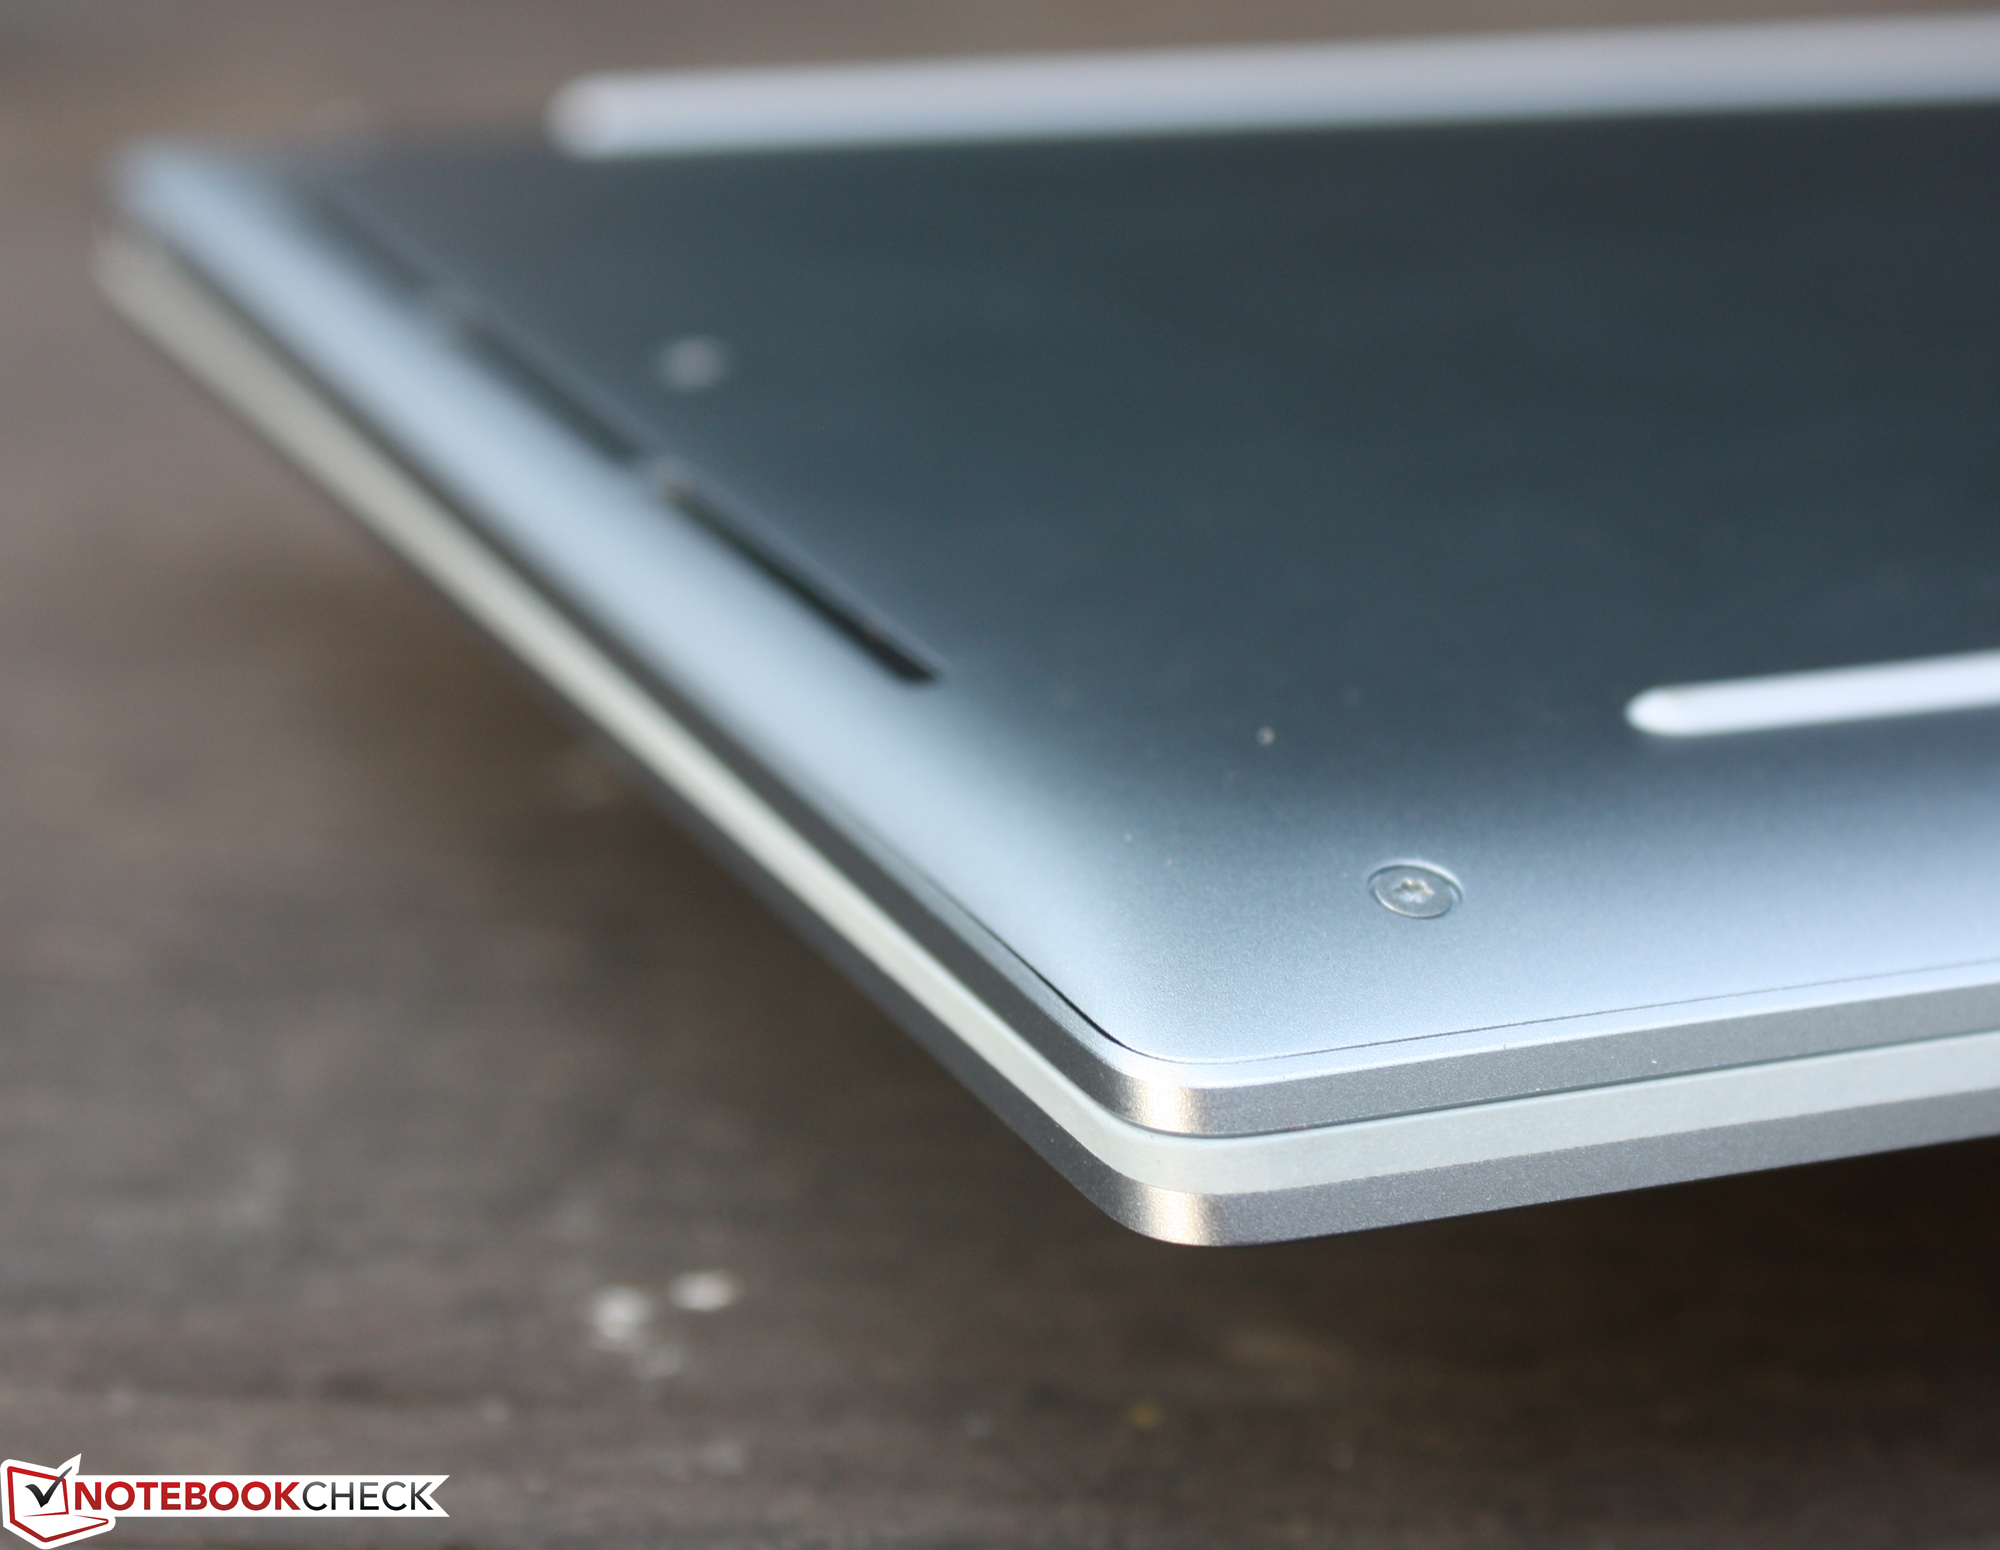
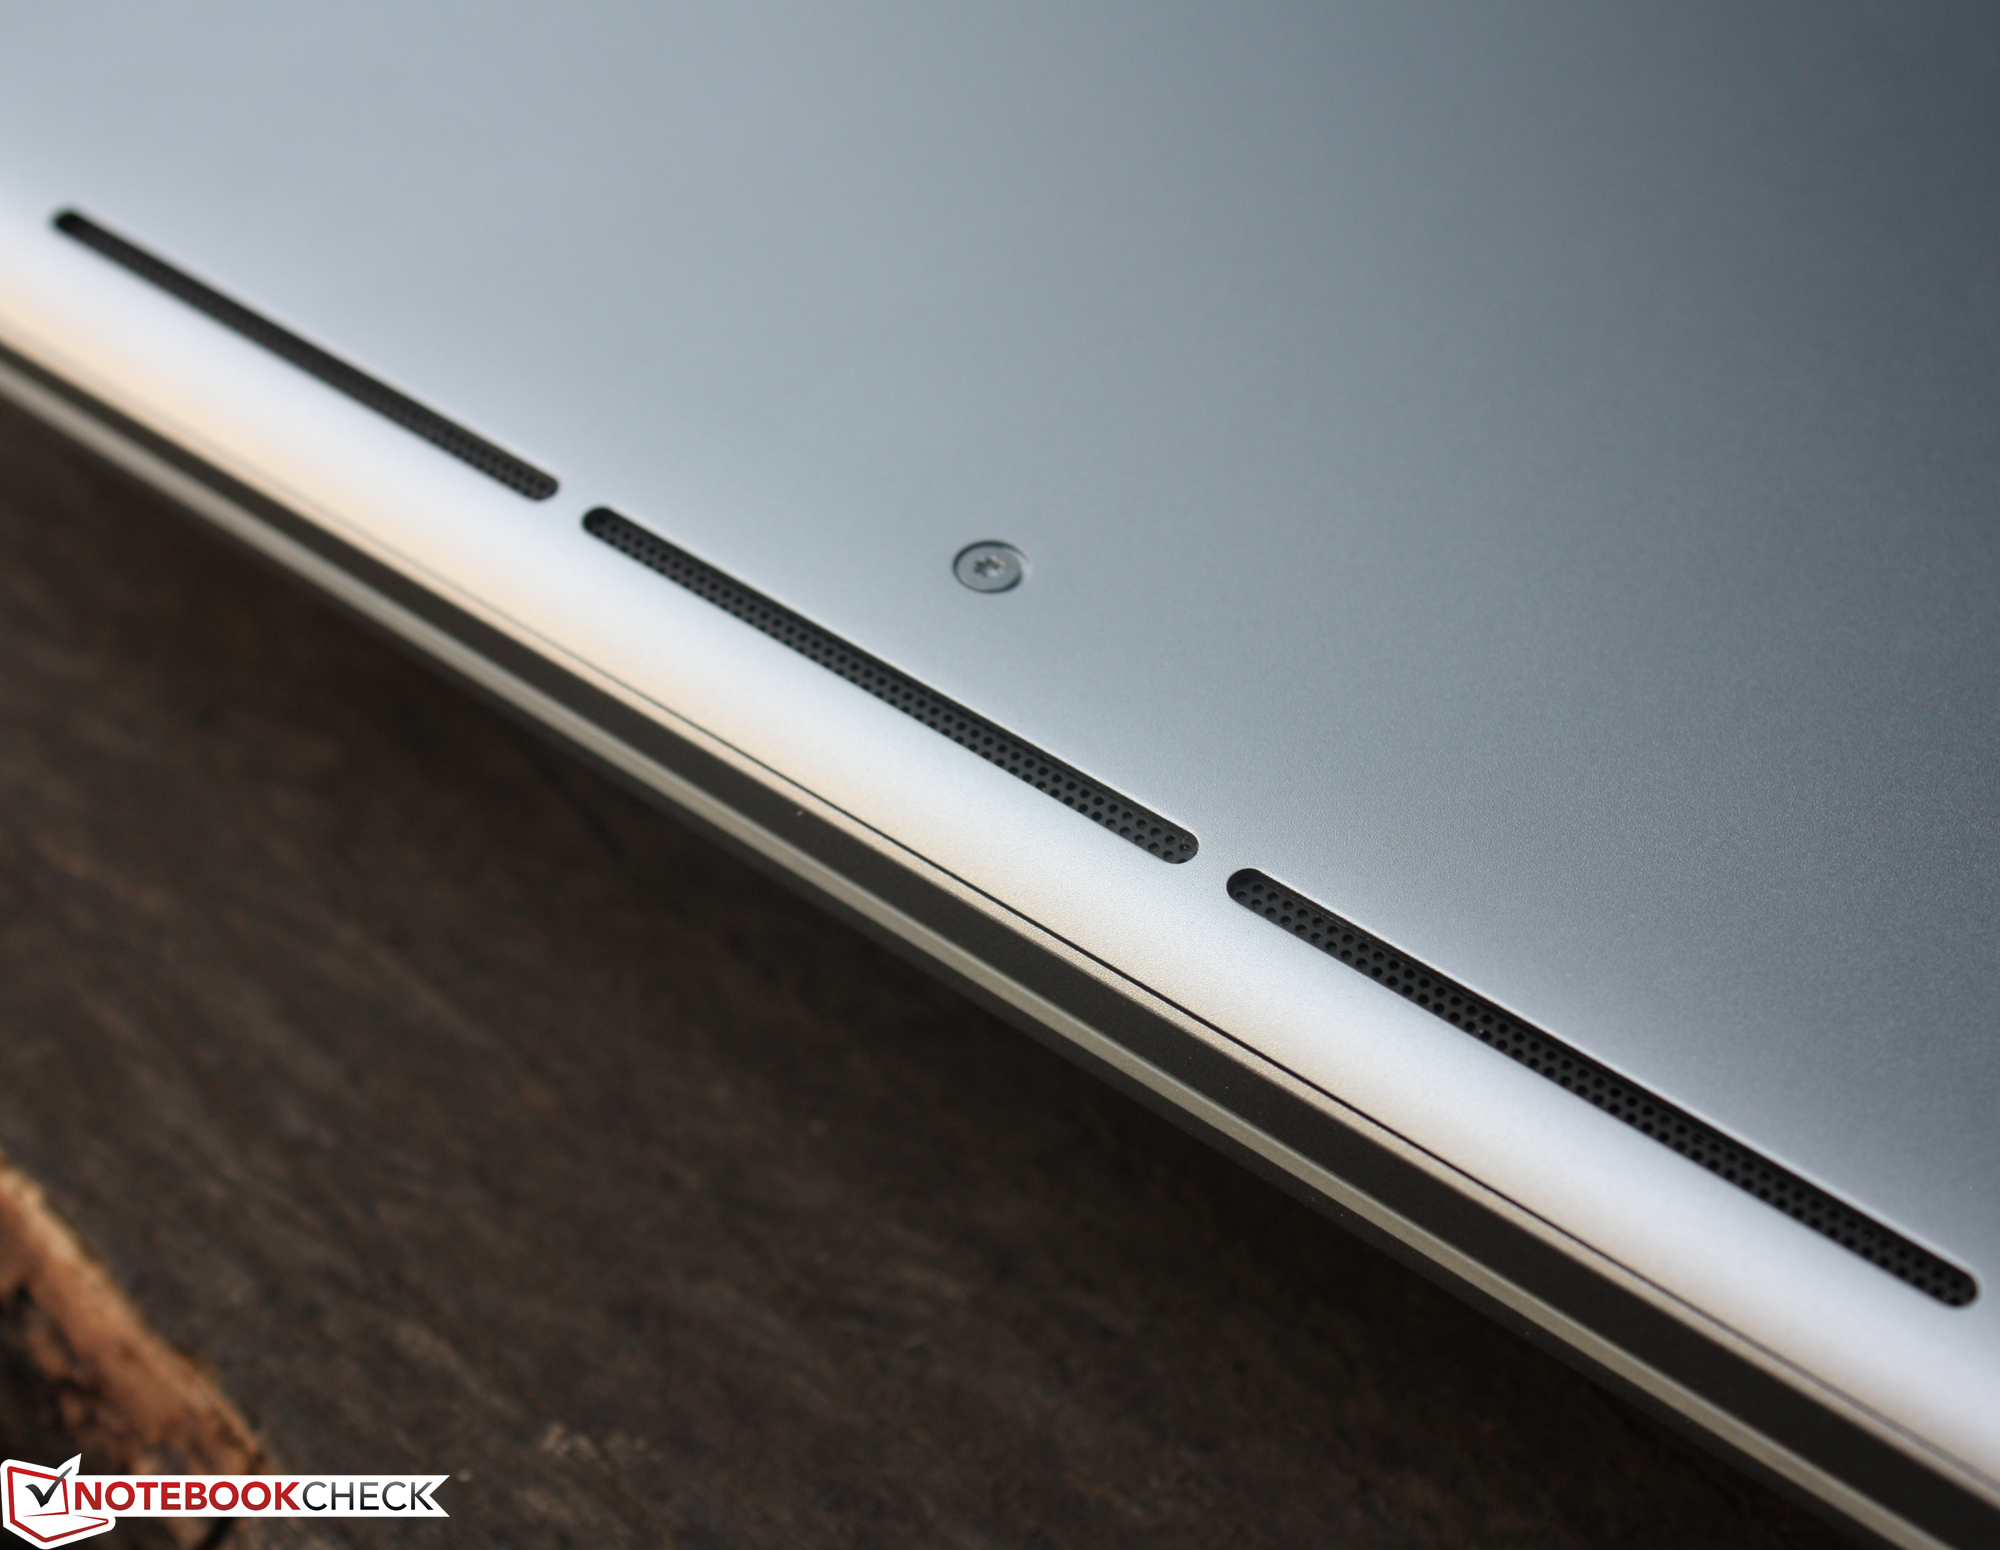
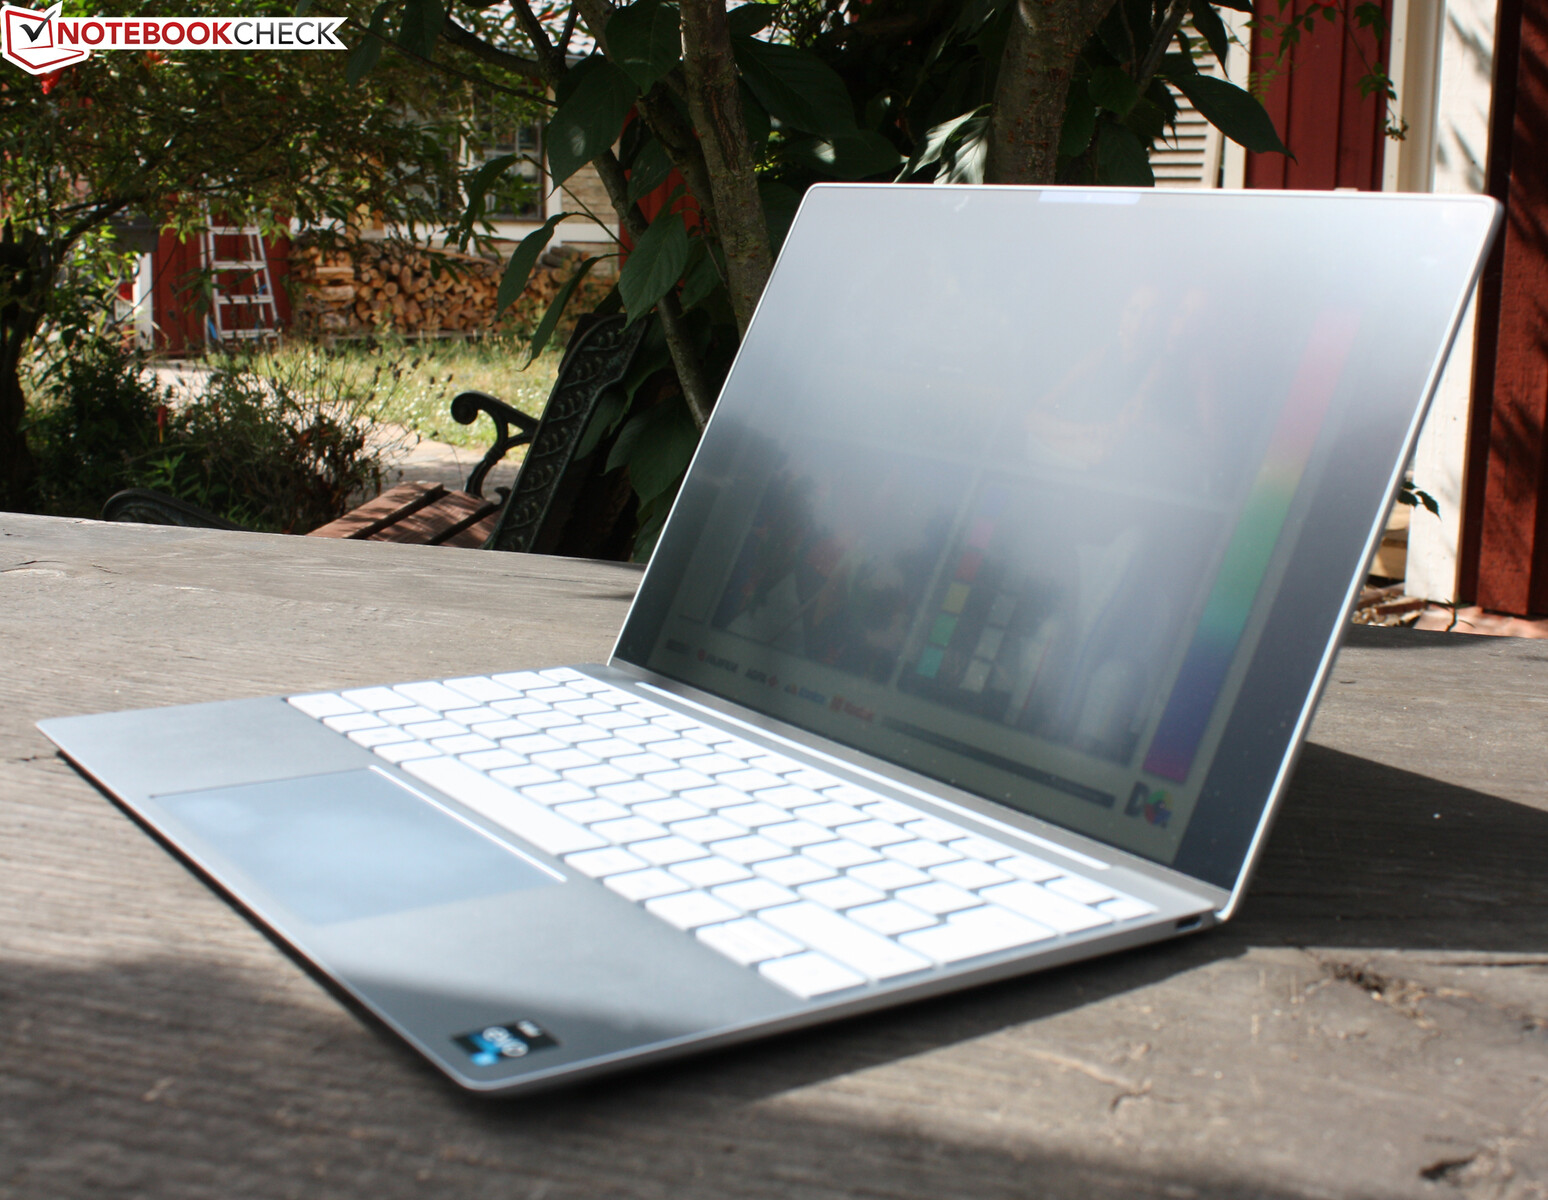
外壳 - 坚固和光滑的超极本
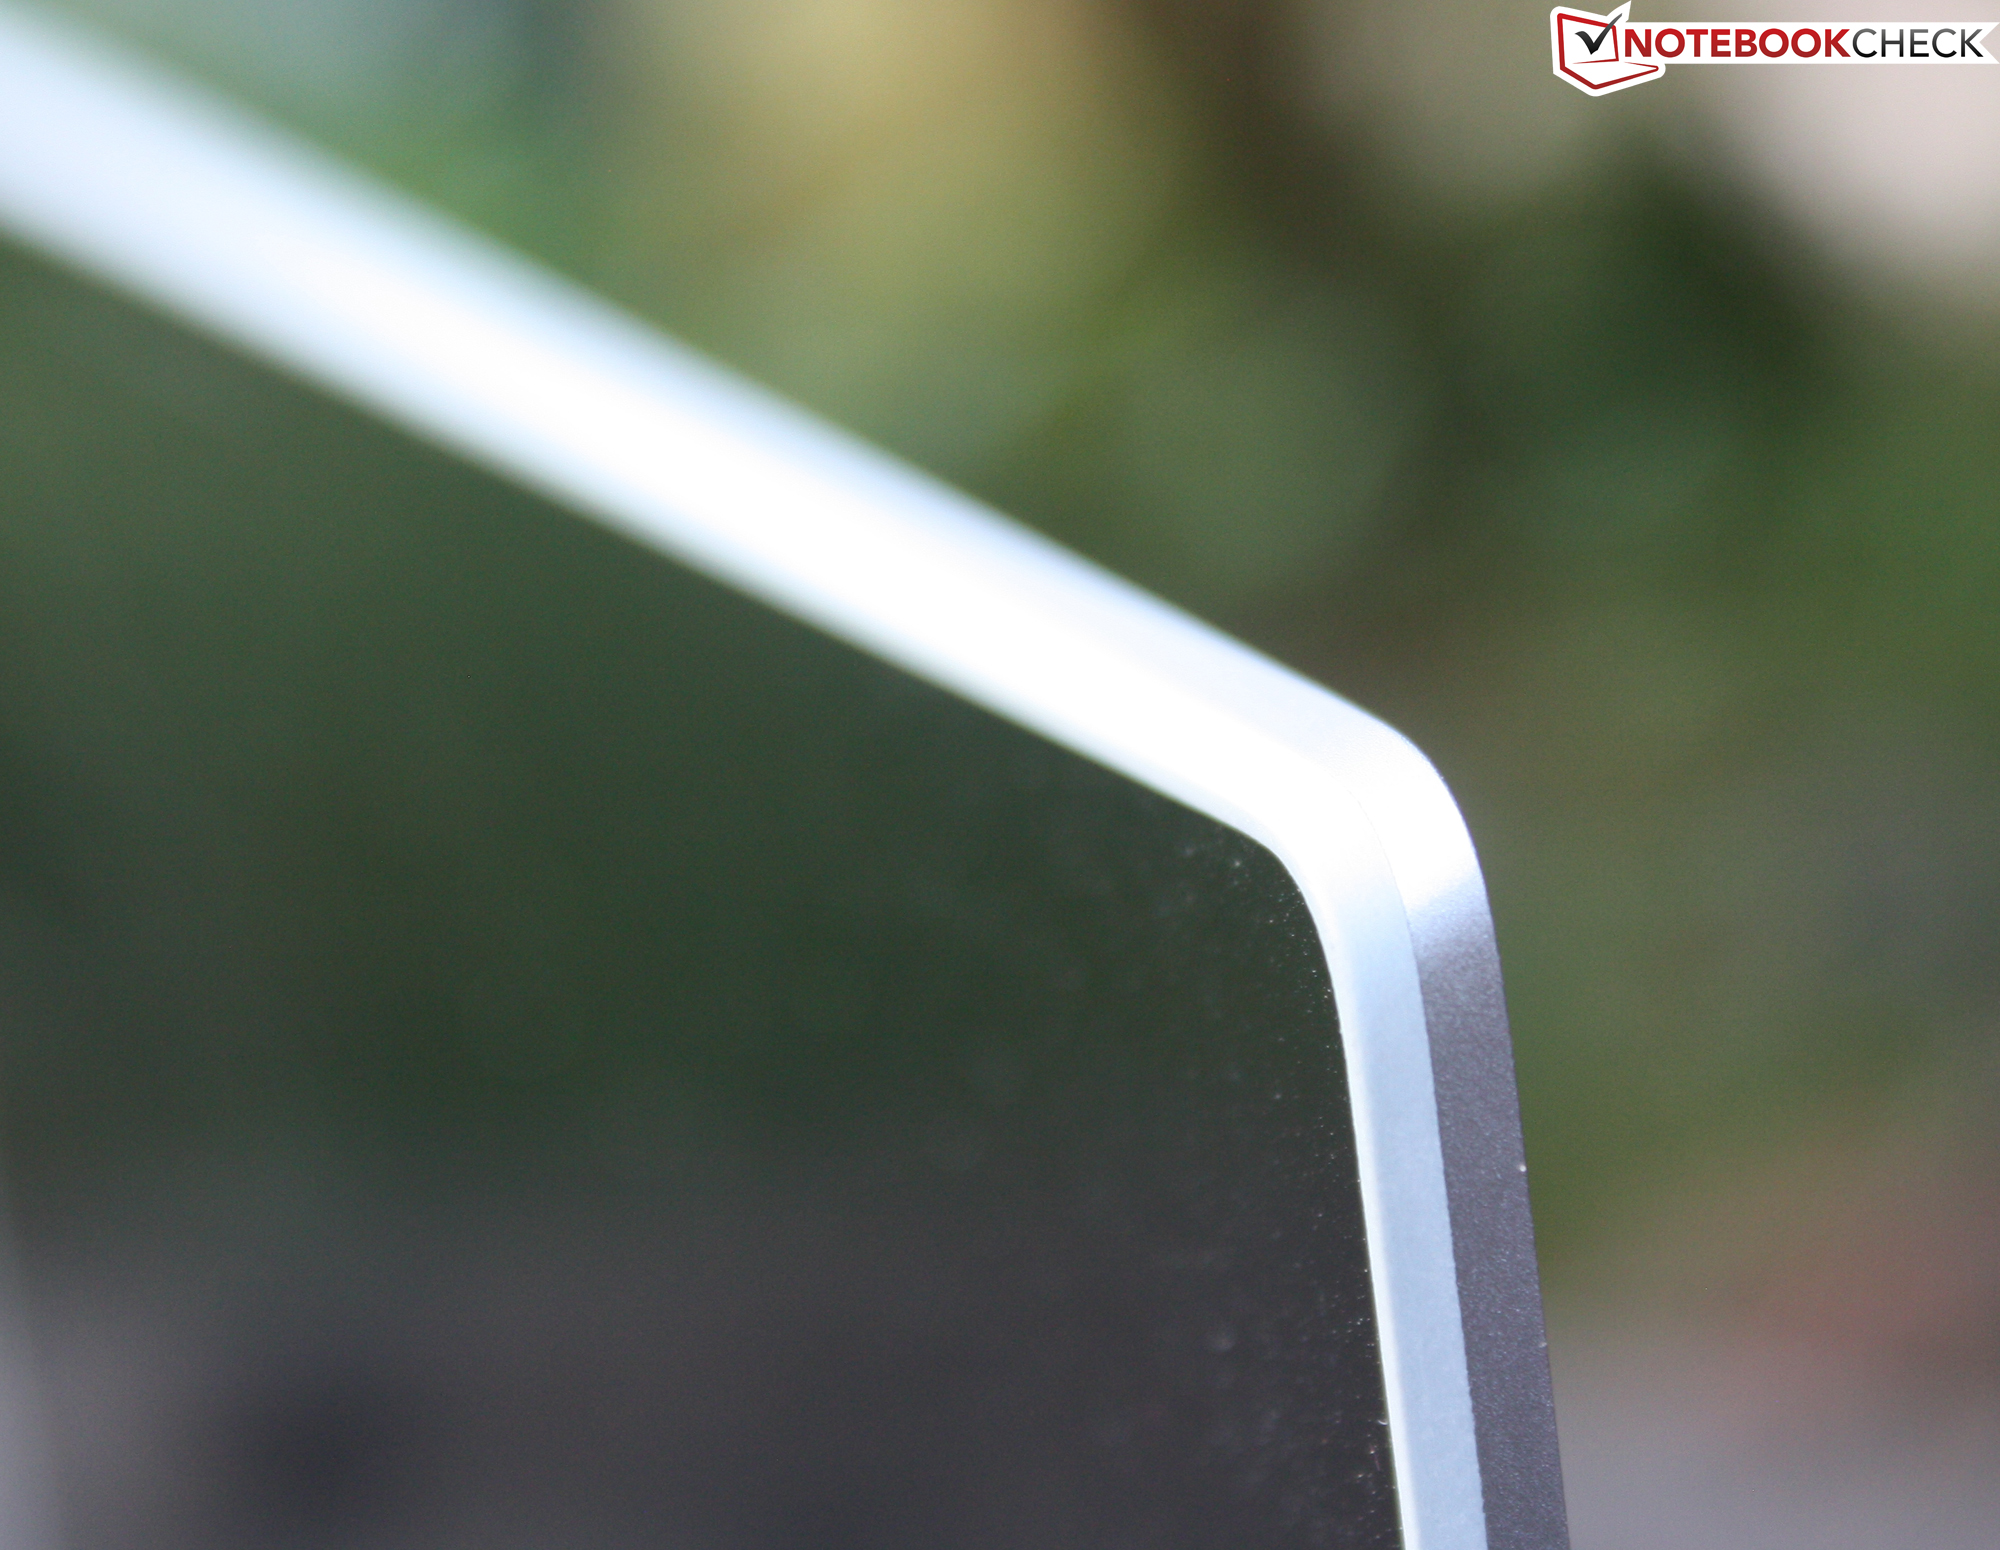
尽管过去偏爱尖锐的边缘,但这次的东西略微圆润一些。所有的角都是圆的,底板有一个轻微的曲线。削减几乎所有的端口--除了两个Type-C端口--允许一个极简的设计语言,非常耐扭。底部单元感觉坚固耐用,尽管在试图从角落里扭动它时有一些吱吱作响。键盘区域是刚性的,在压力下不会屈服。掌托也是如此,它坚如磐石。
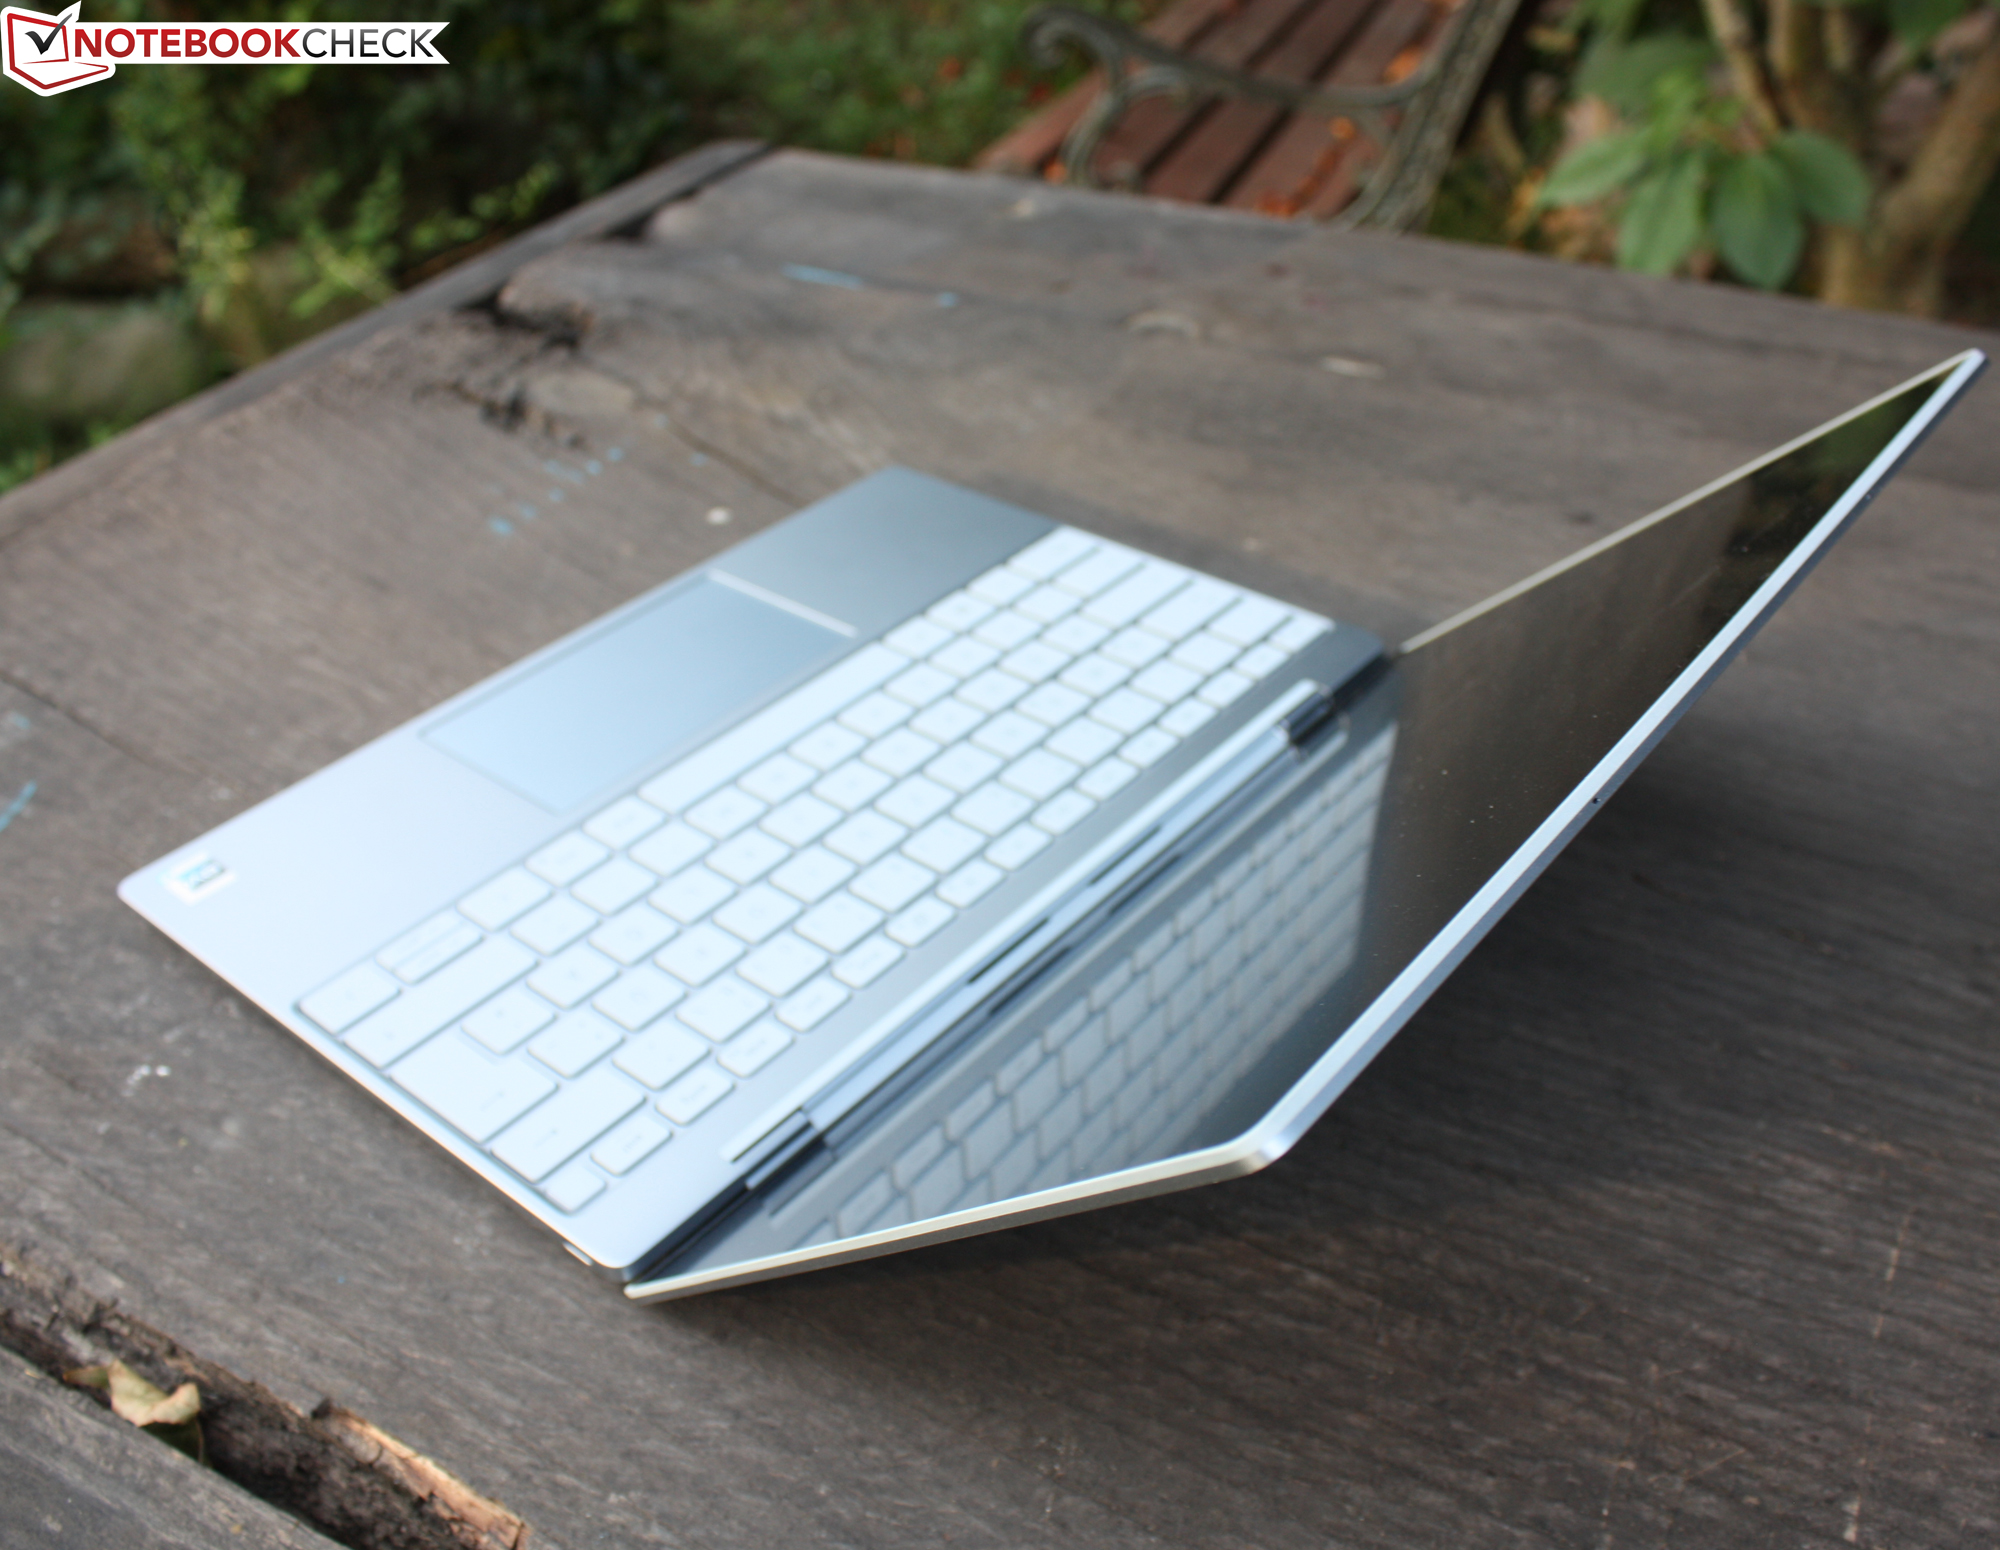
铰链很牢固,并通过磁力固定在关闭位置。打开盖子有些困难,因为边缘没有任何东西可以帮助抓住它,而且它可以无缝地过渡到基本单元。然而,在固定了一个小缺口后,用一只手打开笔记本电脑是可能的。在此期间,沉重的底座确保设备保持在桌面上。
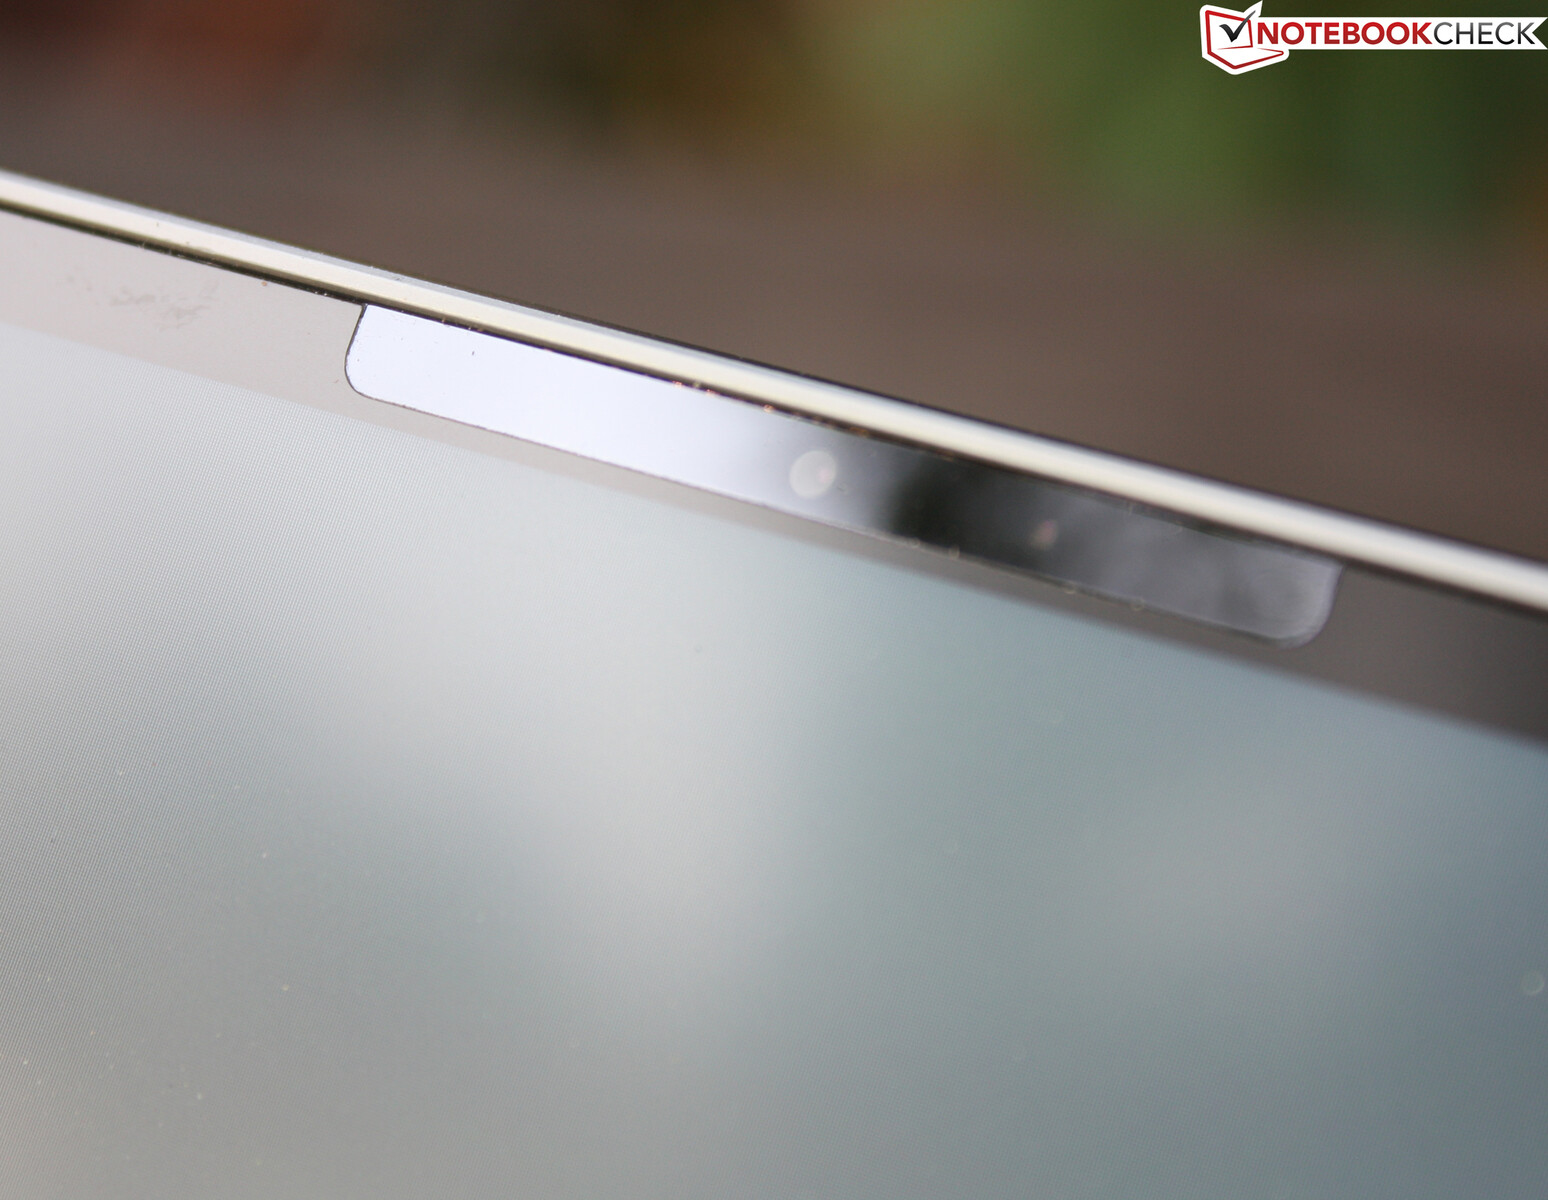
铰链可以打开到大约135度的最大角度,在这里它突然停止,没有任何跷动。铝制的盖子是抗扭曲的。对其背面施加压力不会导致显示器的任何屈服或扭曲。网络摄像头被移到了黑色的显示屏边框上,使其在视觉上有效地消失。然而,网络摄像头的凹槽并没有突出到显示区域。屏幕边框非常小,导致屏幕与身体的比率达到89%。
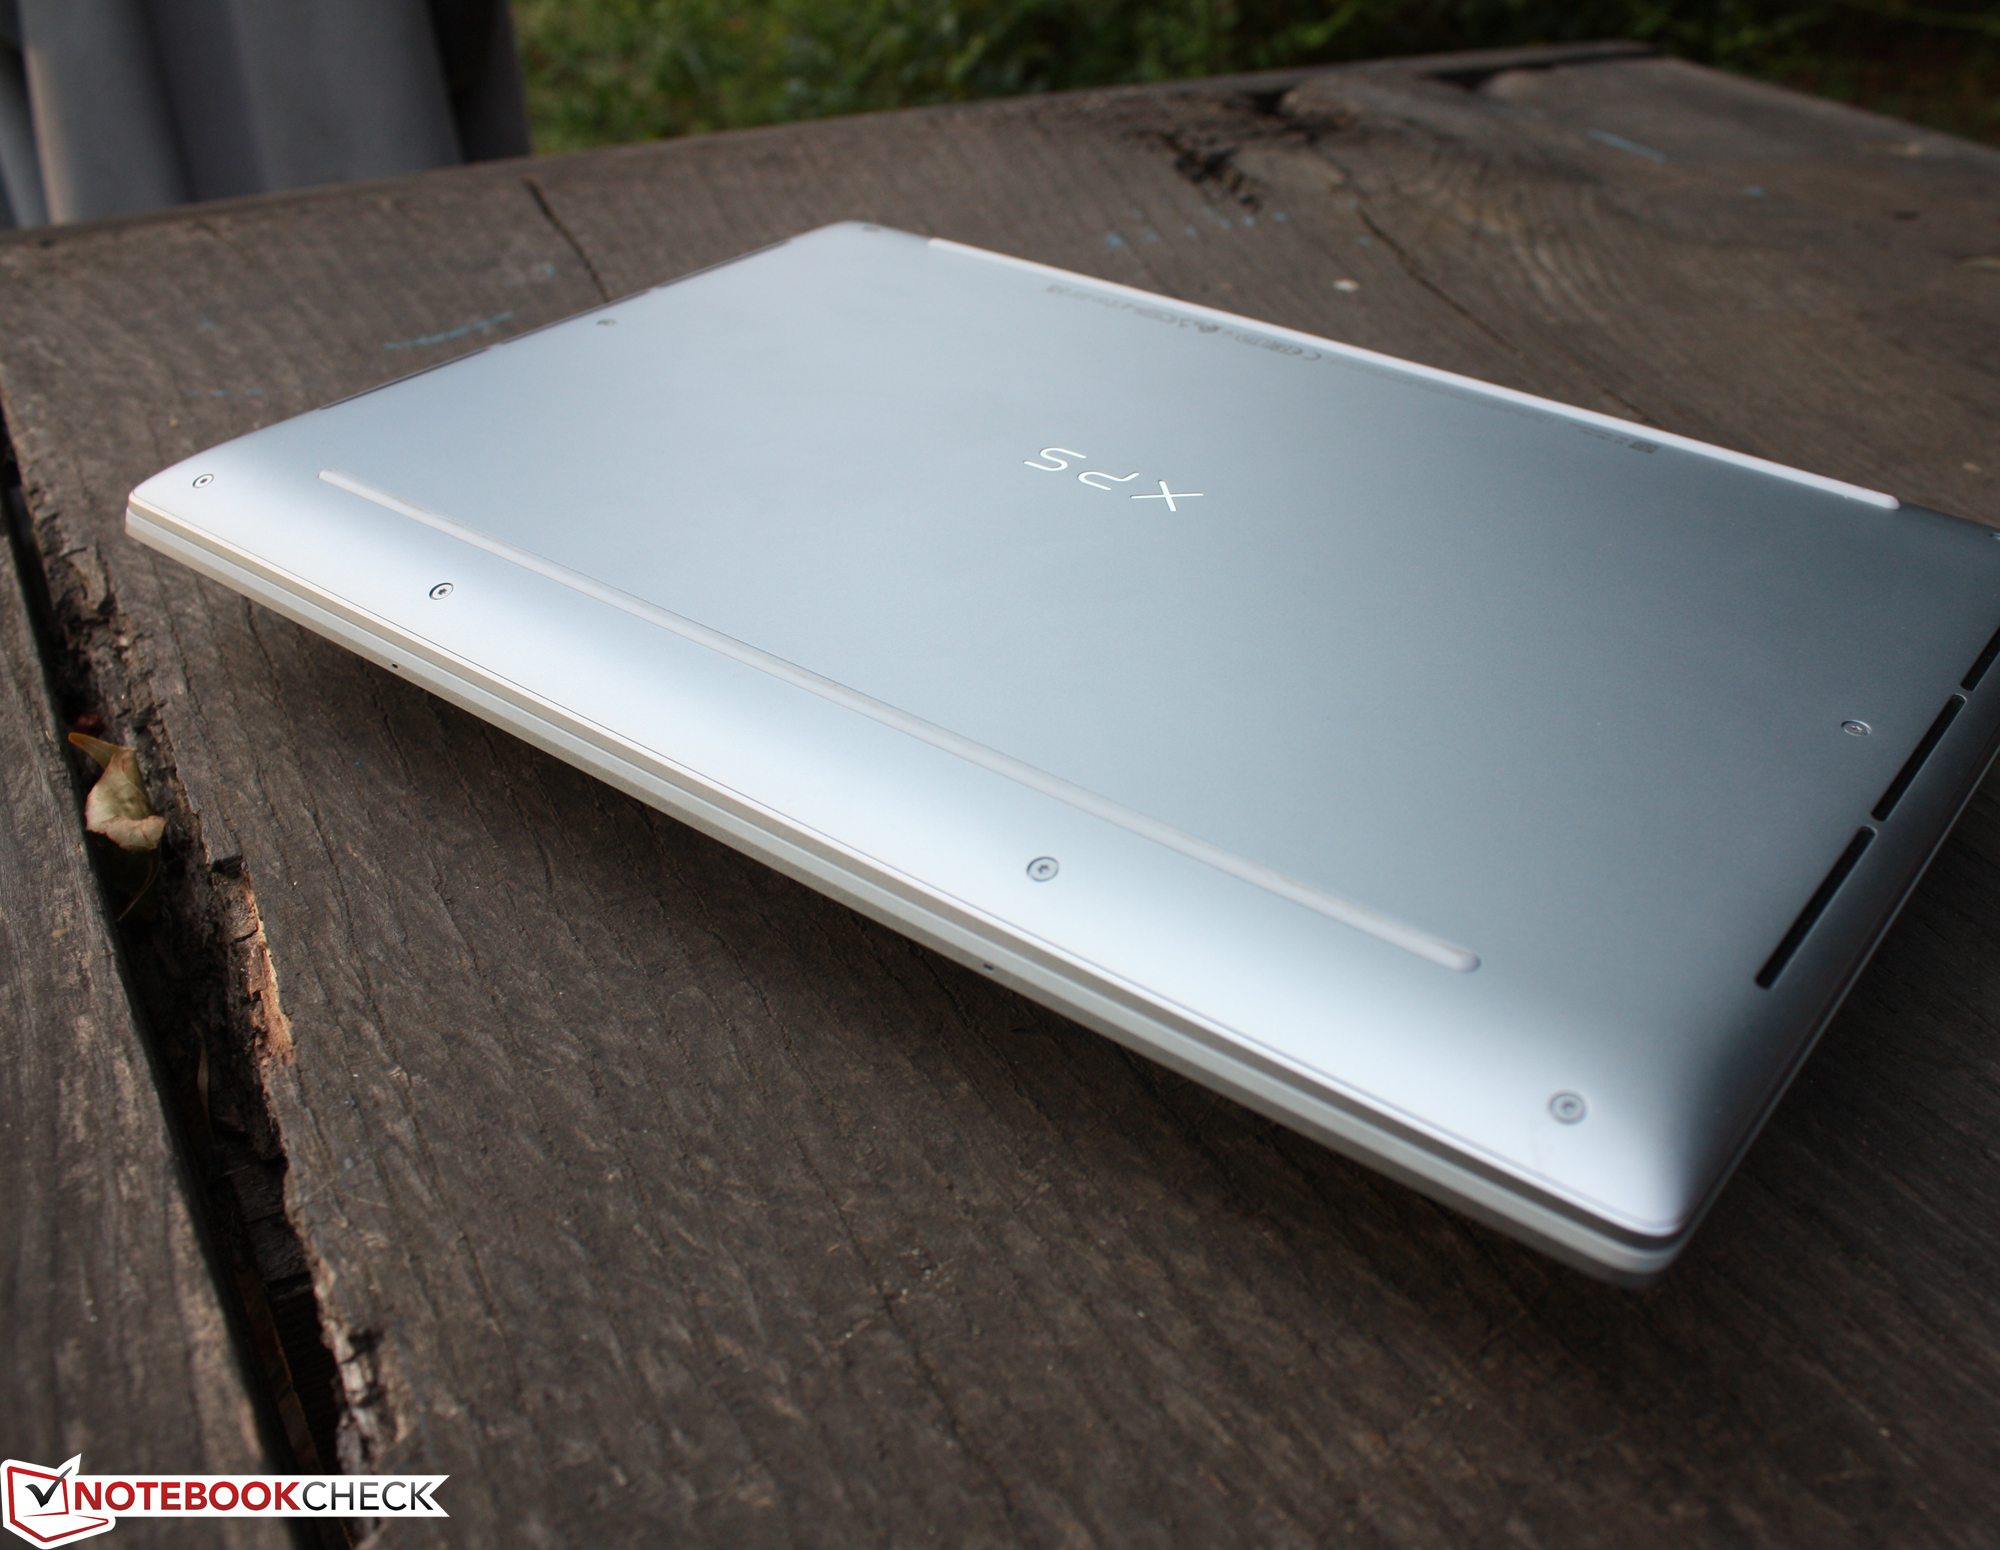
新的XPS 13 9315和旧的戴尔XPS 13 9310是我们比较中最紧凑的设备,可以很容易地放在任何袋子或背包中运输。在重量方面,它与这两款产品都是平均水平。 华硕Zenbook S 13和 ThinkPad X1 Nano更轻。然而,9315的重量比2021年的9310少100克。Plus和非Plus版本之间只有一个微小的差异,即81克或~0.18磅(1161对1242克/~2.56对2.74磅),有利于非Plus。虽然45瓦的交流适配器像钱包一样紧凑,但长电缆导致245克(约0.54磅)的重量。Plus型号的65瓦充电器也有同样的小尺寸。
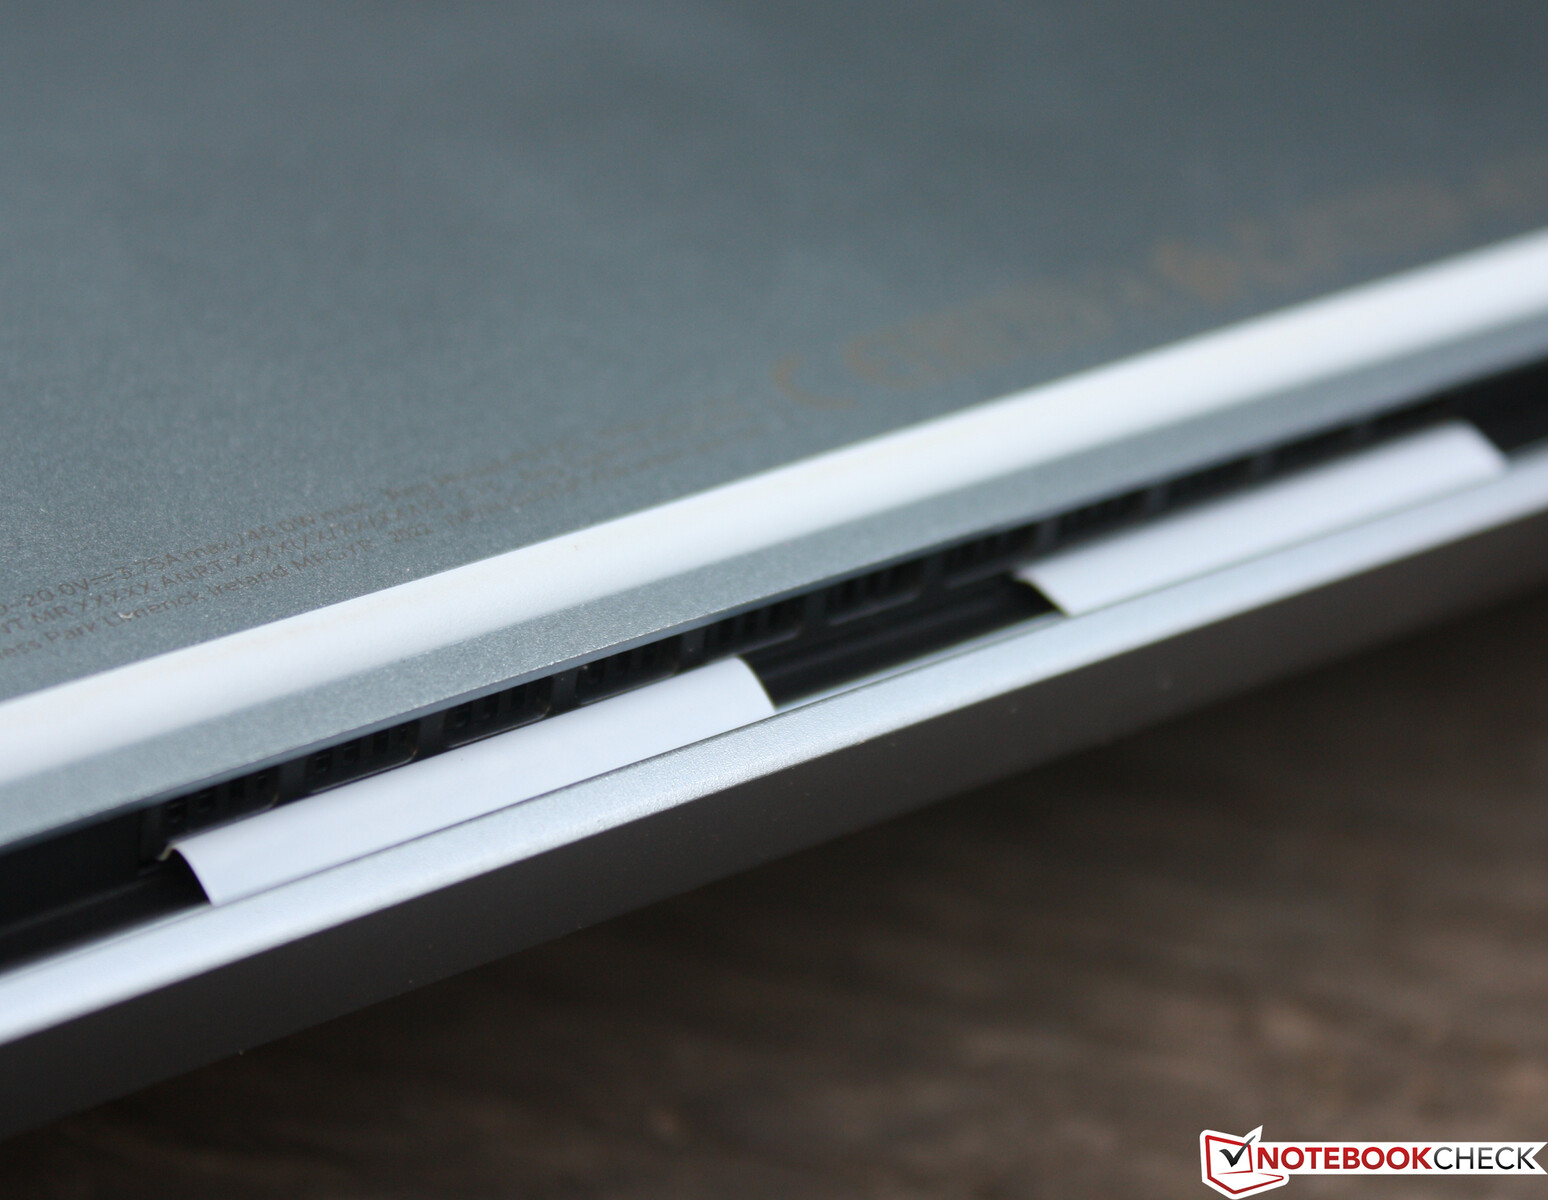
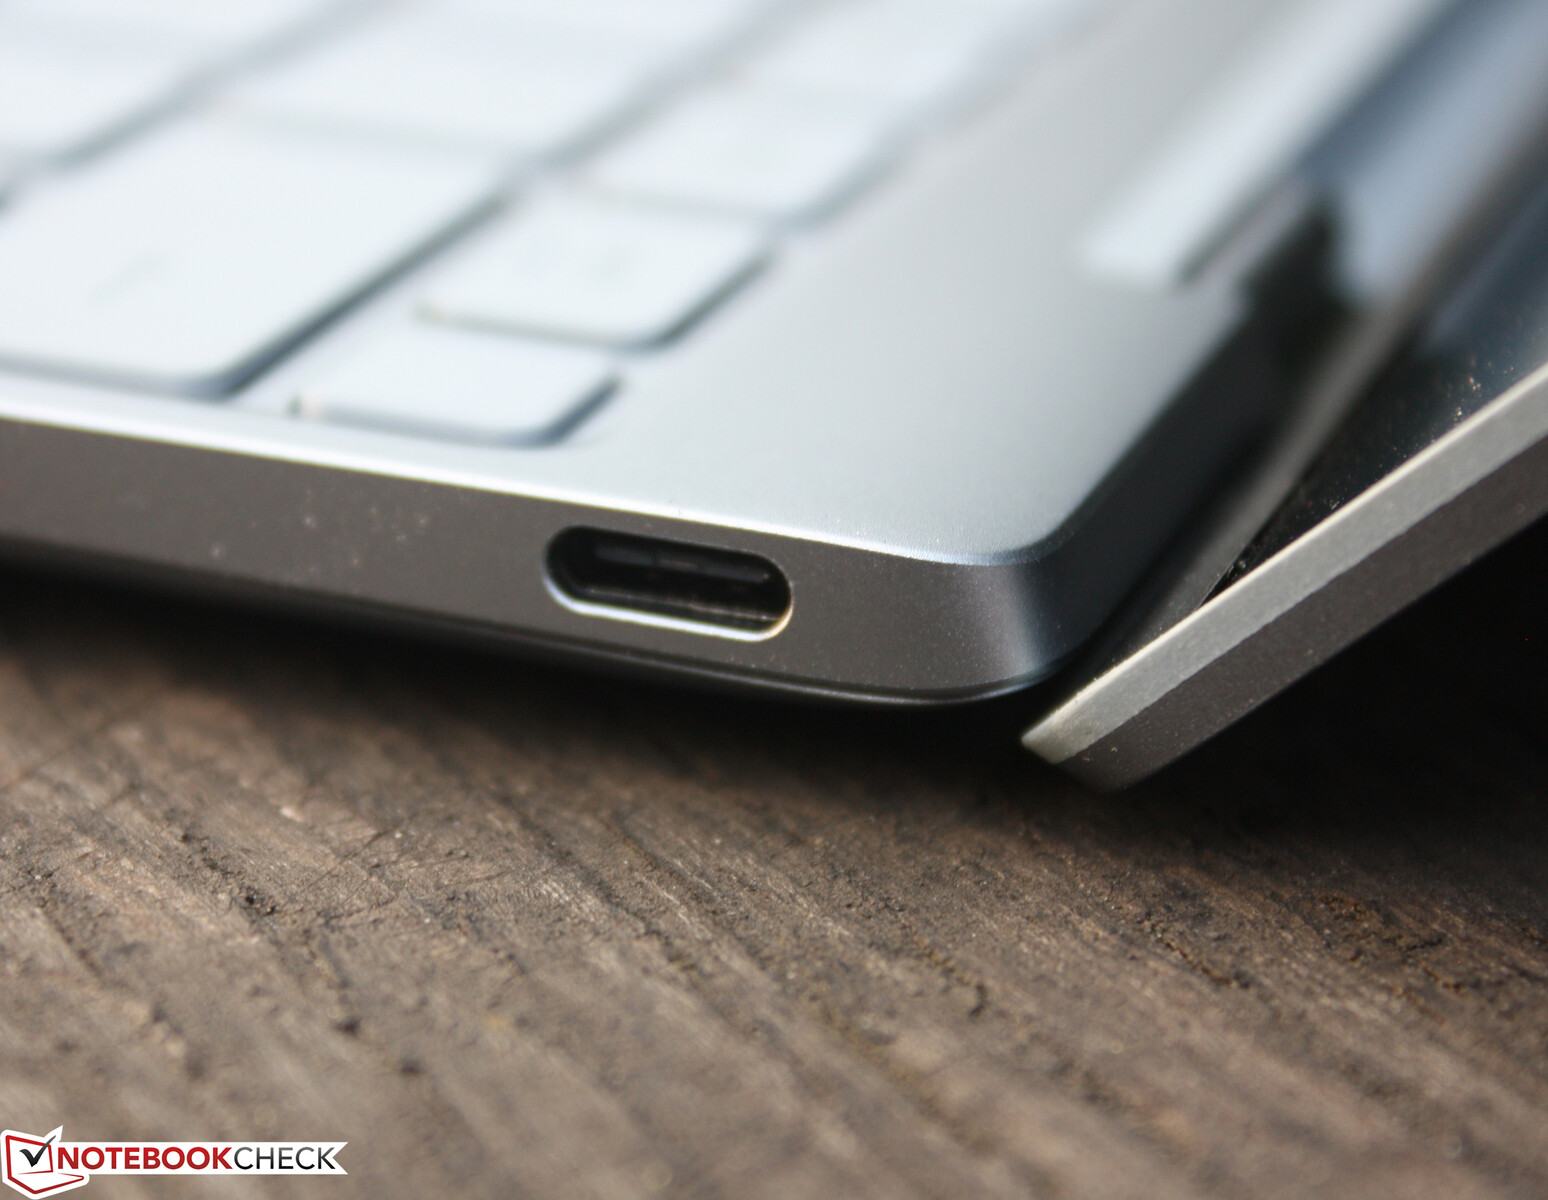
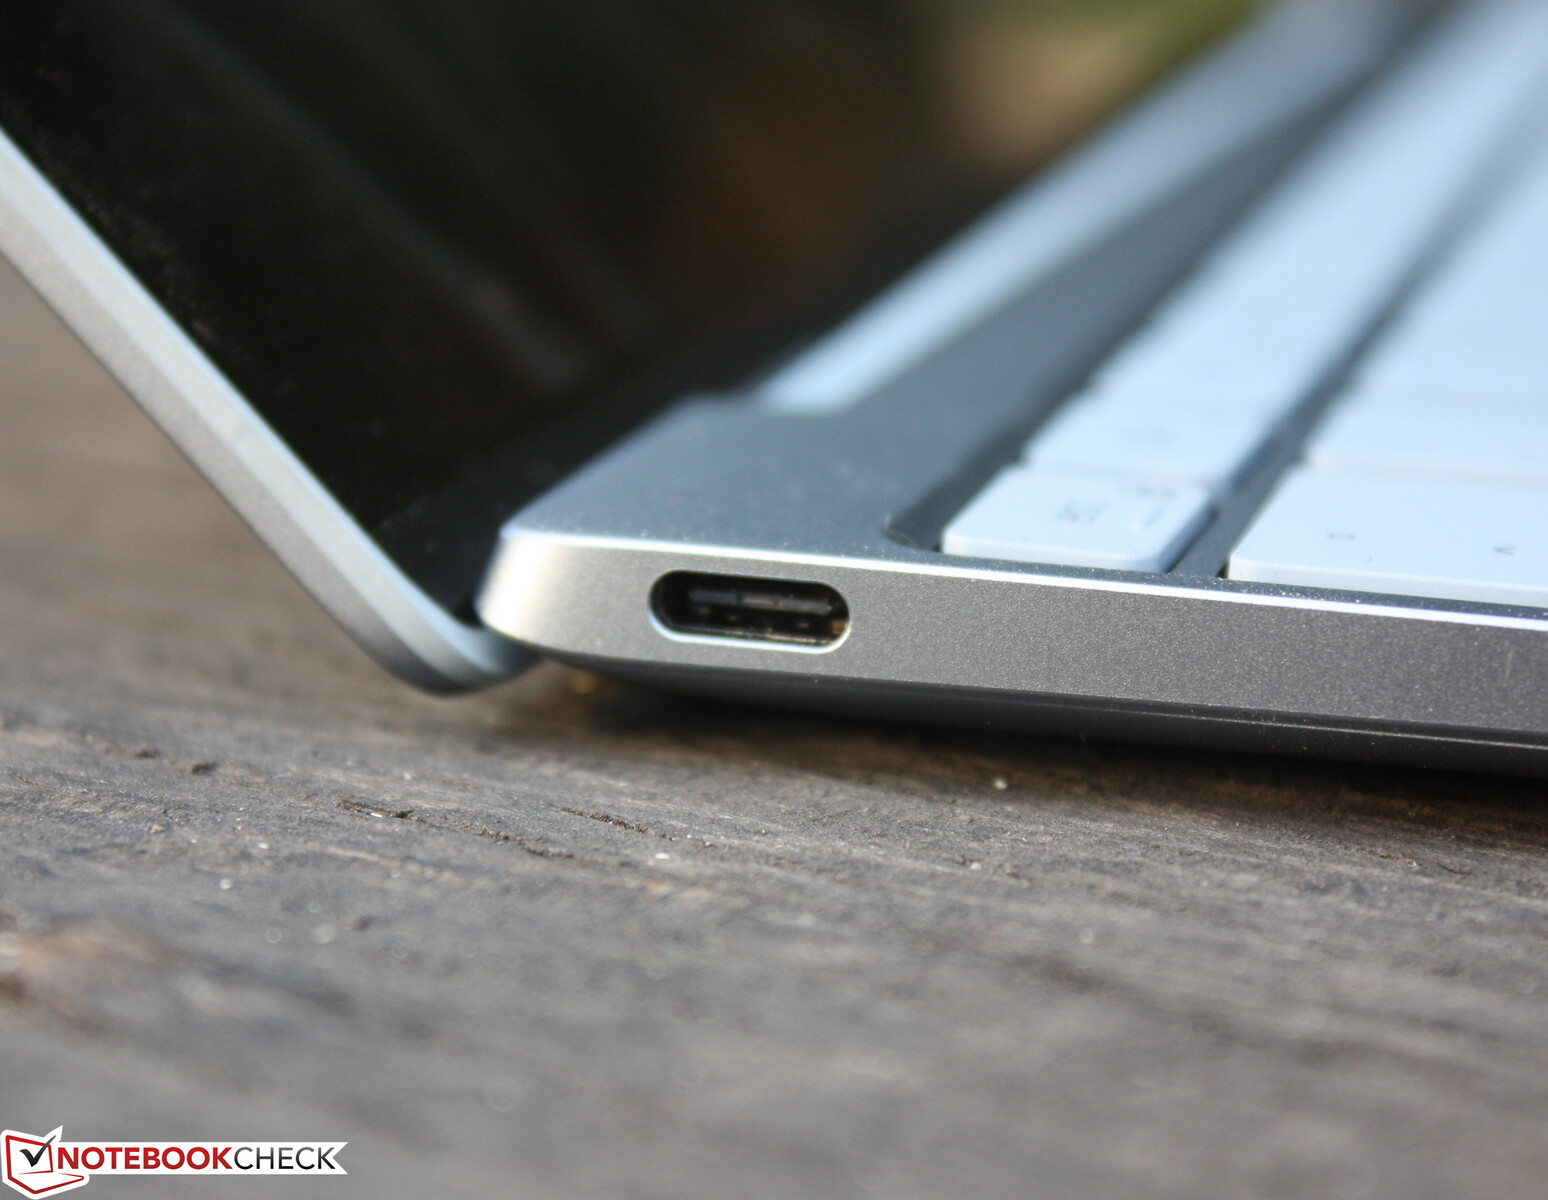
连接性 - 仅有两个端口的戴尔笔记本电脑
为了不让用户在试图连接3.5毫米耳机或USB Type-A鼠标时挠头,戴尔包括两个适配器。一个微小的Type-C转Type-A转换器和一个Type-C转3.5mm的加密狗,用于连接耳机和耳麦。Type-C Thunderbolt端口通过Power Delivery兼作充电端口。按照惯例,它们也能够输出带有音频的DisplayPort信号。2021年的XPS的读卡器不再包括在内。钱包大小的45瓦交流适配器被用来为XPS供电。
沟通
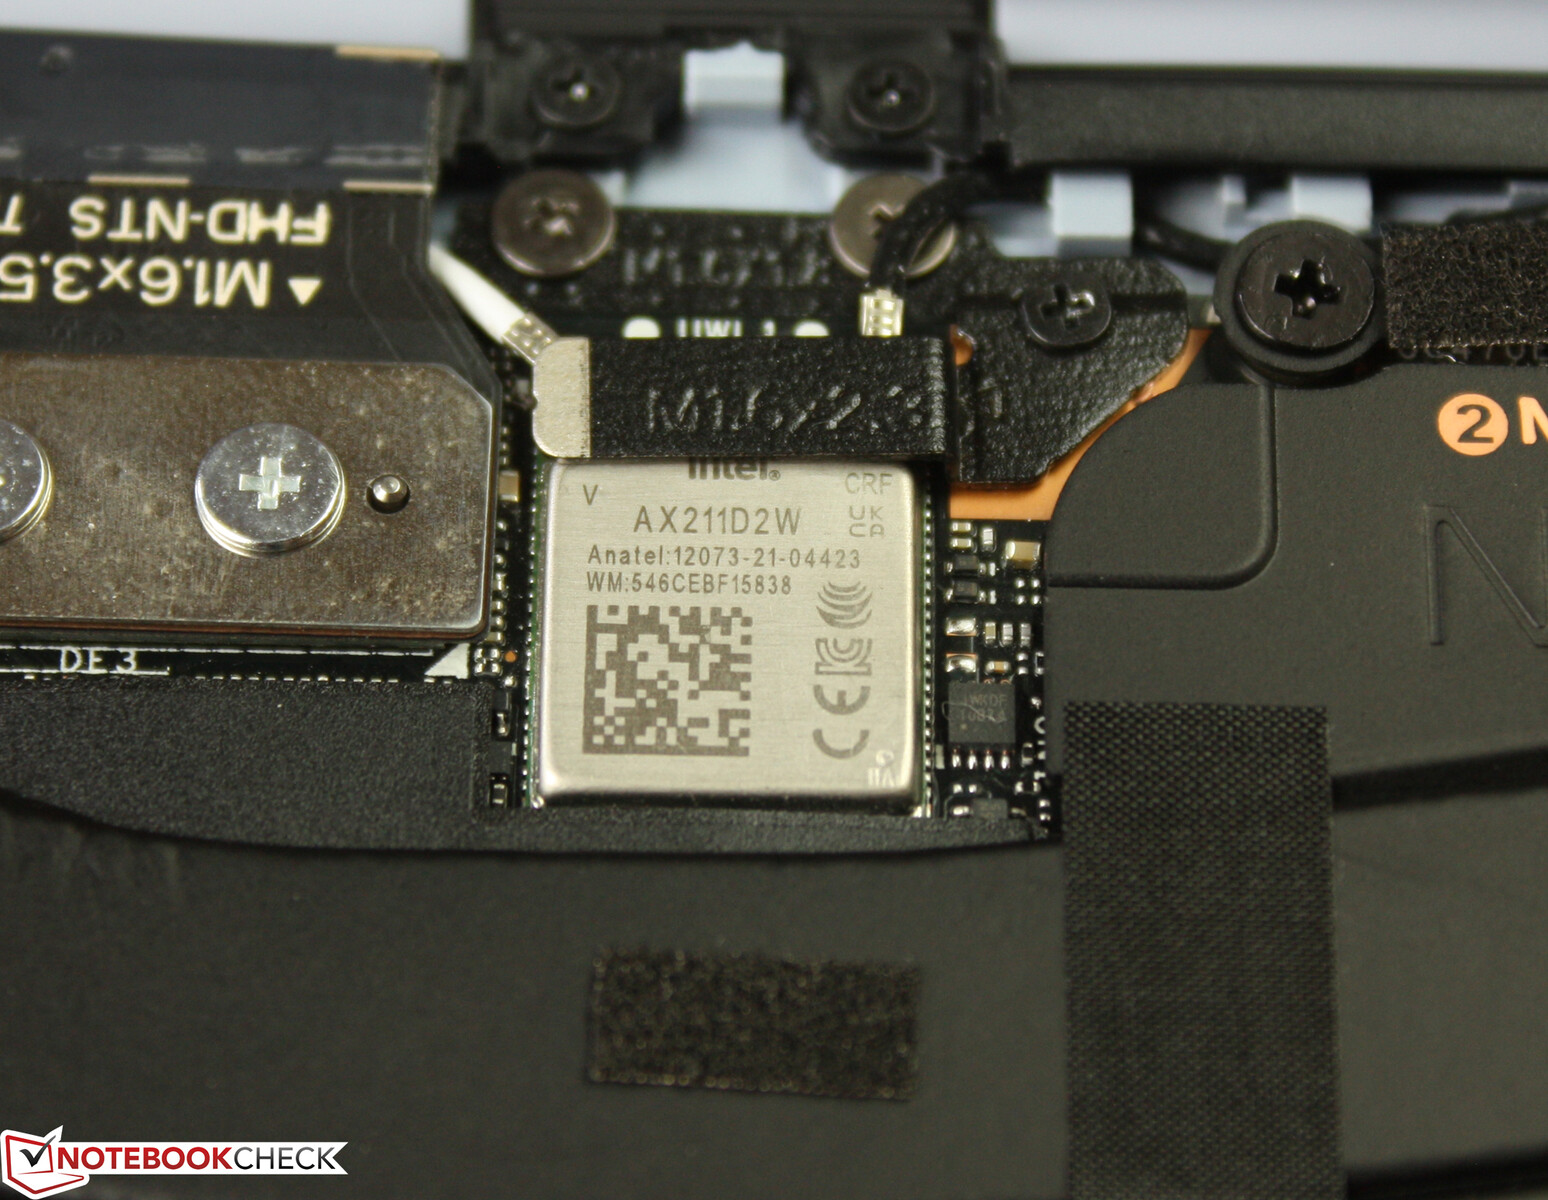
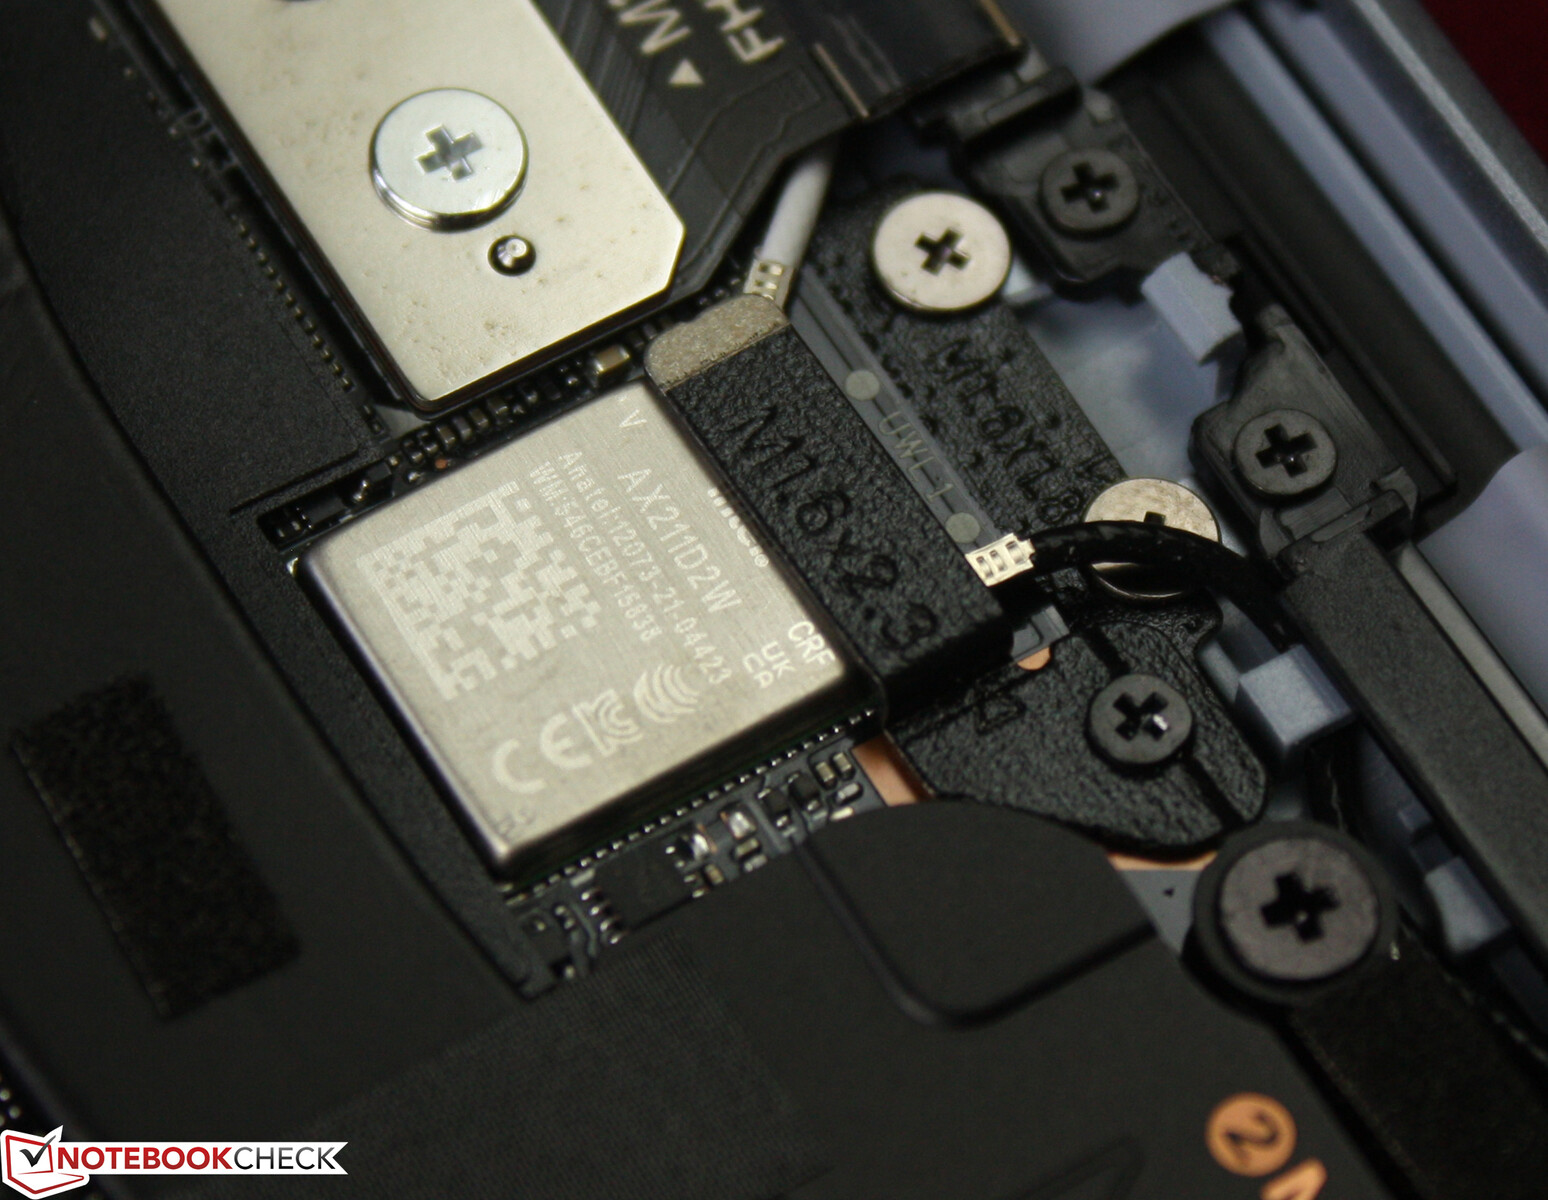
戴尔为最新的XPS 13配备了现代英特尔AX211E模块,用于Wi-Fi 6E连接。在我们的Wi-Fi 6E网络中,Wi-Fi性能非常好,而且稳定。在与我们的华硕参考路由器的测试中,我们没有遇到任何Wi-Fi连接问题,数据传输率也很稳定。蓝牙5.2也被支持。
网络摄像头
网络摄像头既没有通过Fn键配备机械快门,也没有配备电动快门。麦克风确实有自己的热键。至少,摄像头旁边的白色LED灯可以清楚地显示它正在录制。1280 x 720像素的分辨率没什么可写的--分辨率低,即使在白天也有明显的图像噪音。


安全问题
XPS 13上有两种认证方法:电源按钮内有一个指纹传感器和一个具有红外线功能的双传感器摄像头。这使得用户可以从Windows设置中选择面部识别。如果需要,笔记本电脑可以在当前用户离开时自动登出。午餐后回来时,Windows Hello会自动重新登录。
辅料
该包装包括一个USB-C转USB-A适配器,一个用于3.5毫米设备的音频加密狗,以及一个带有固定C型电缆的45瓦交流适配器。Plus型号的65瓦交流适配器的Type-C电缆是模块化的。
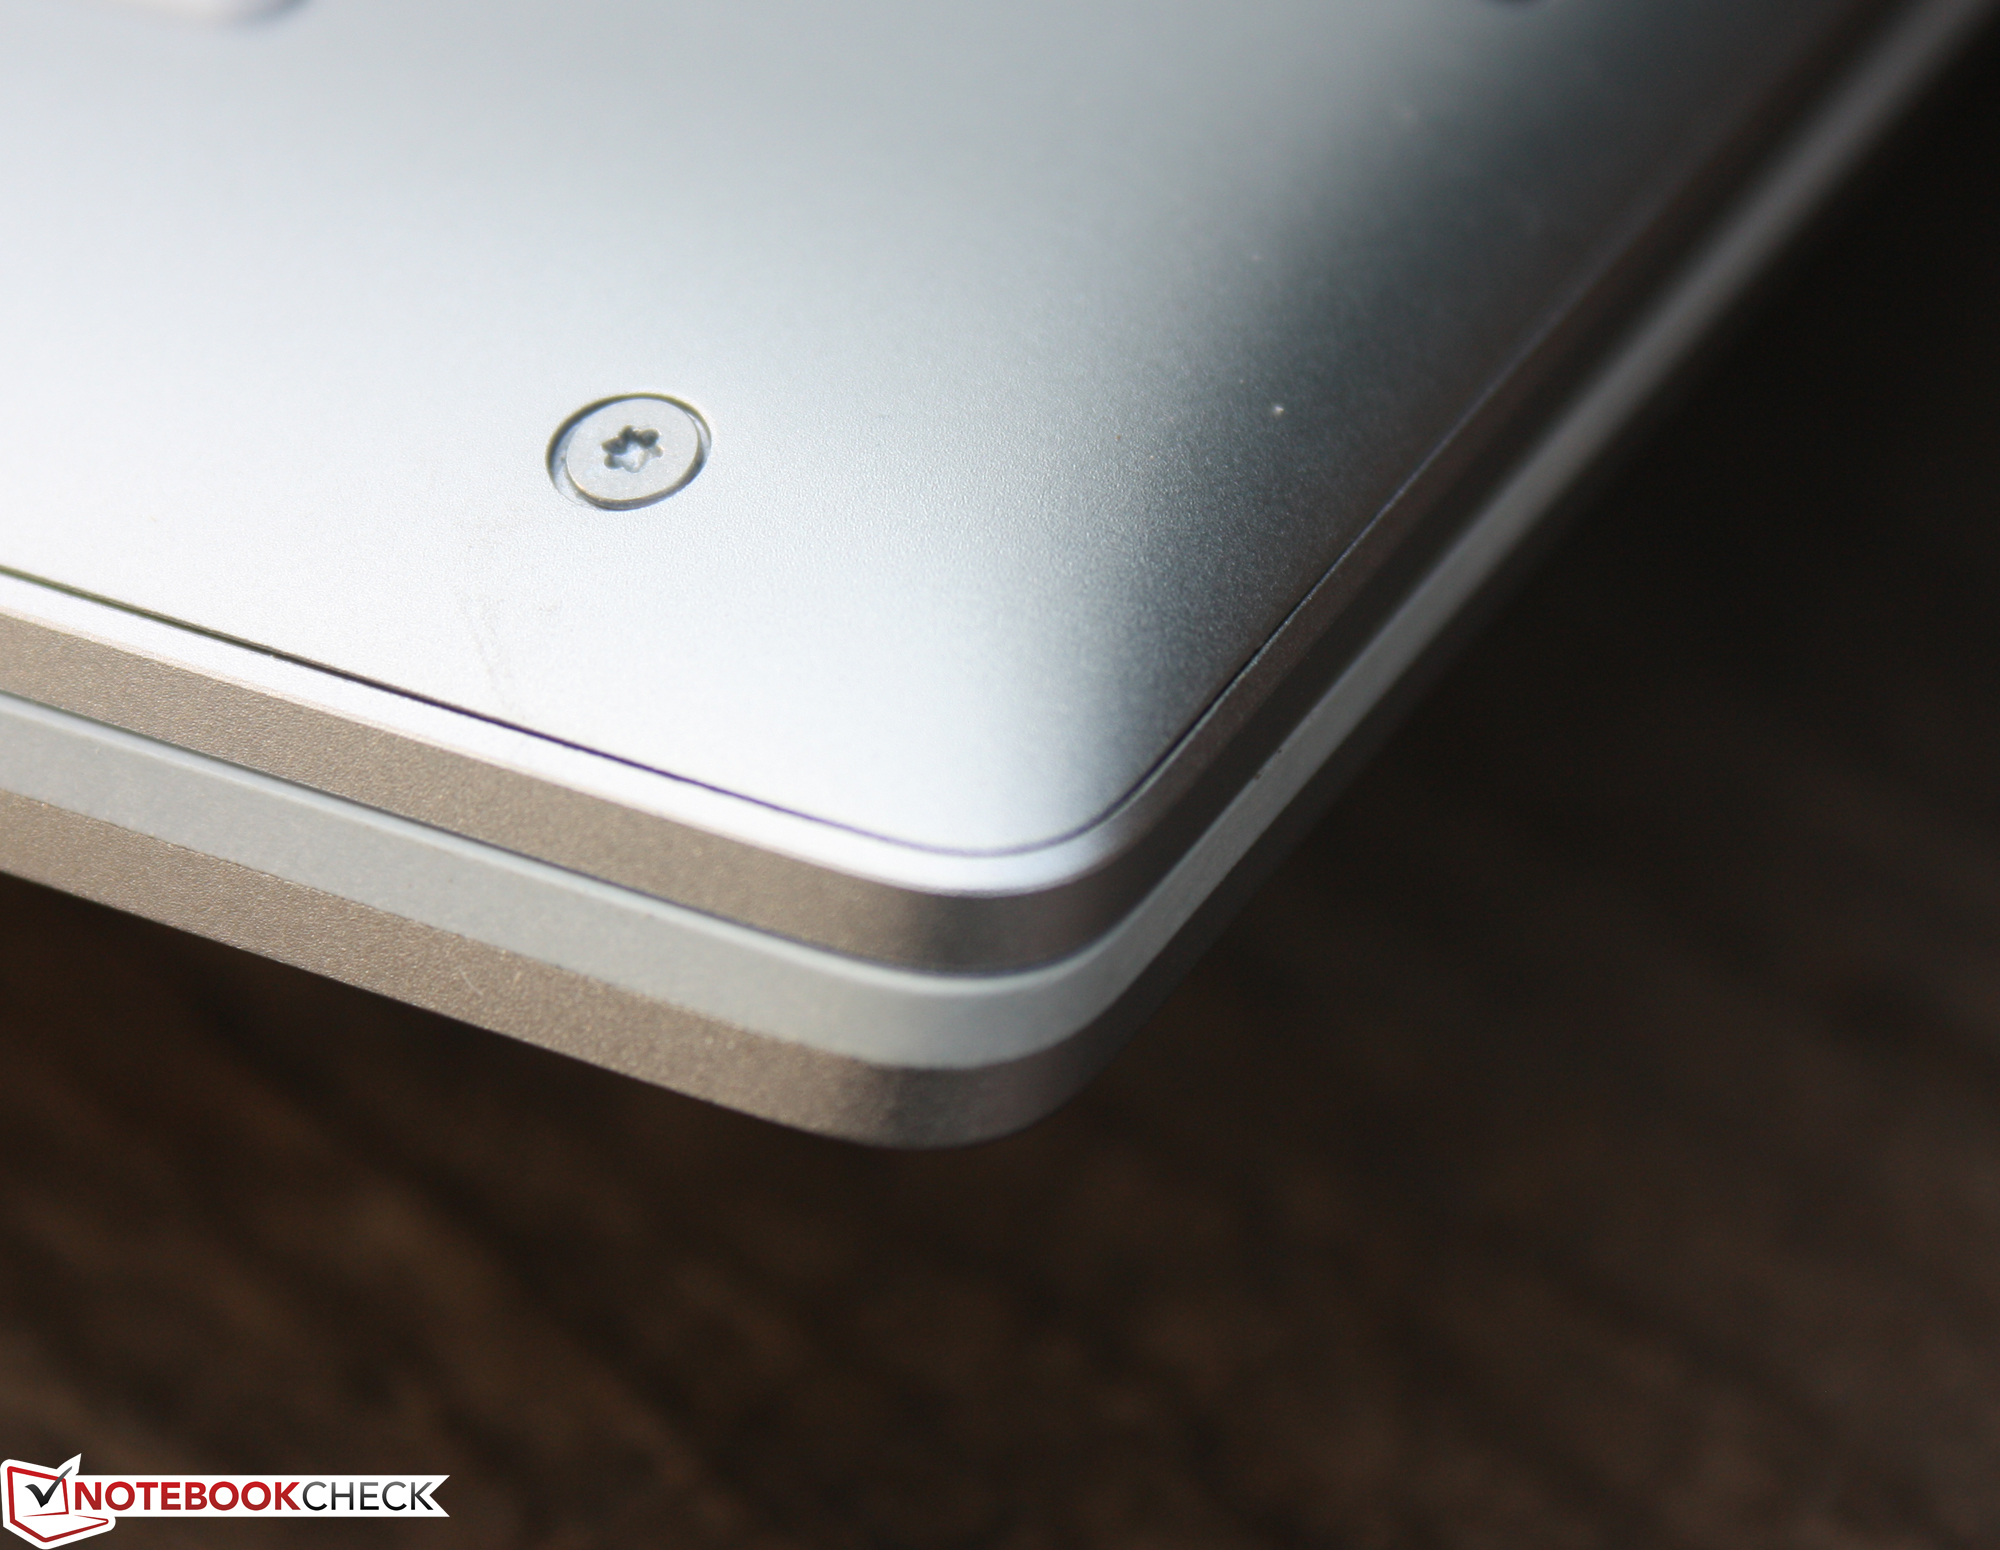
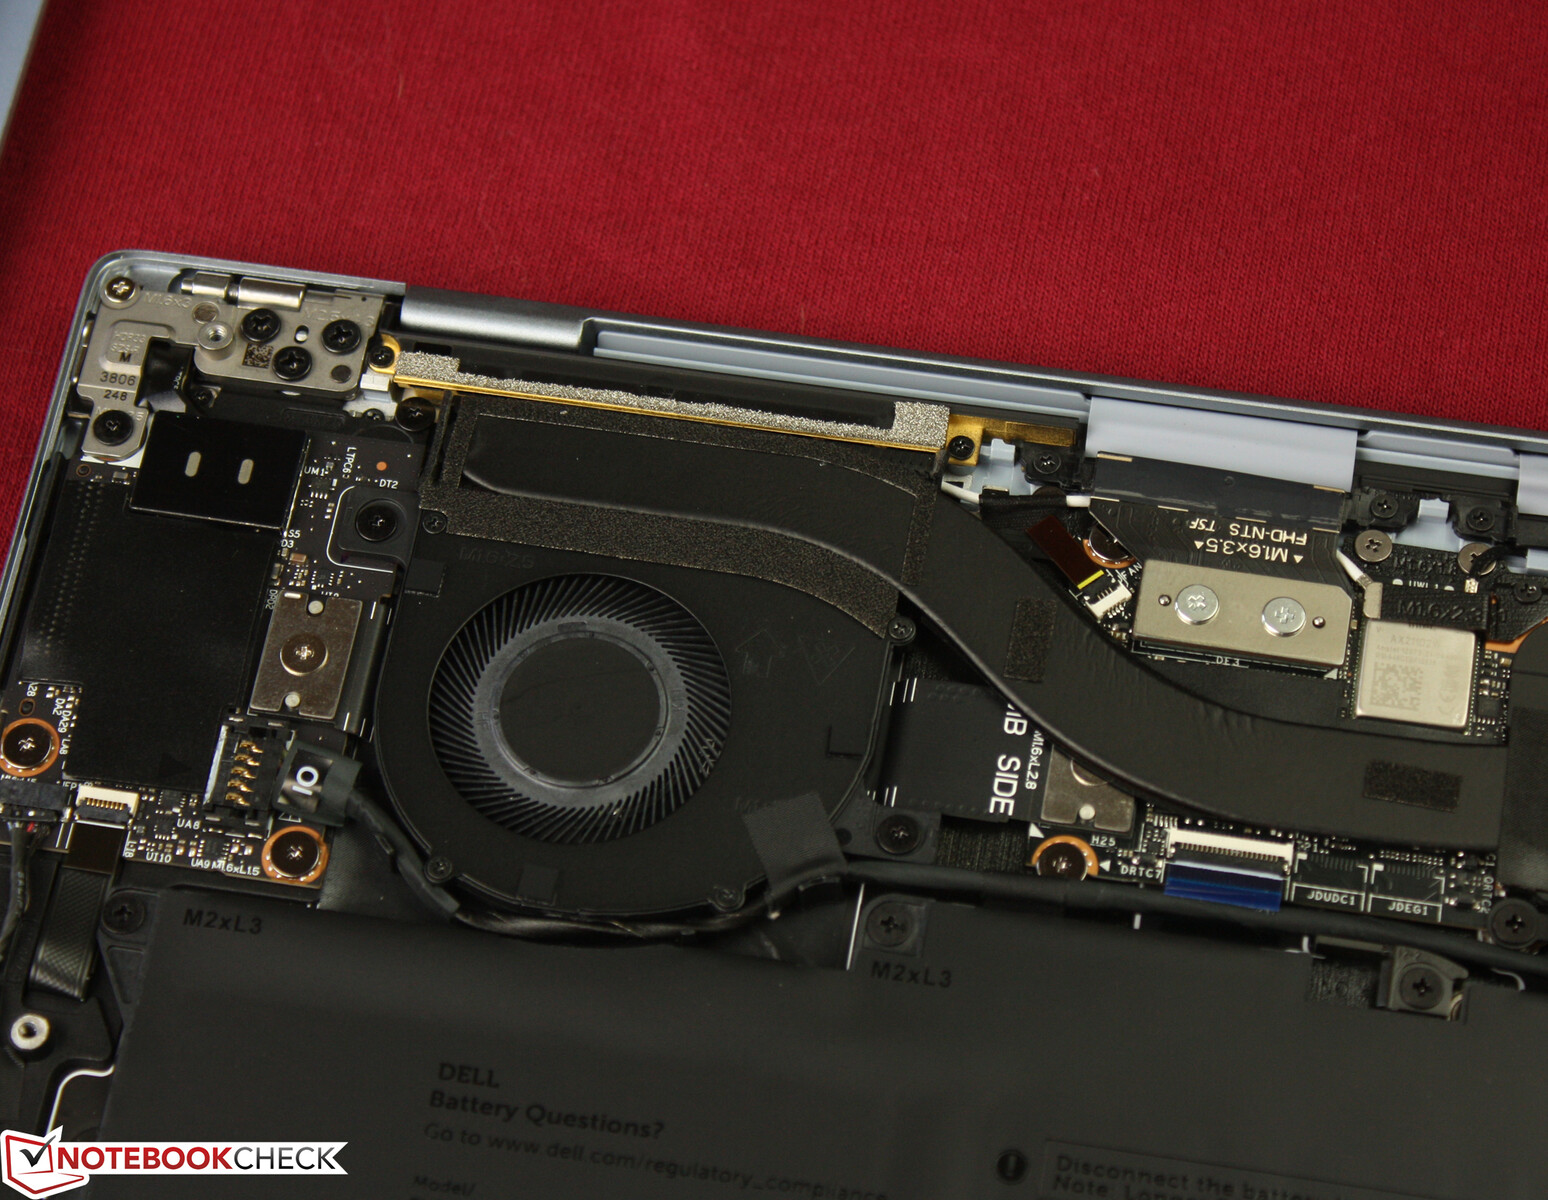
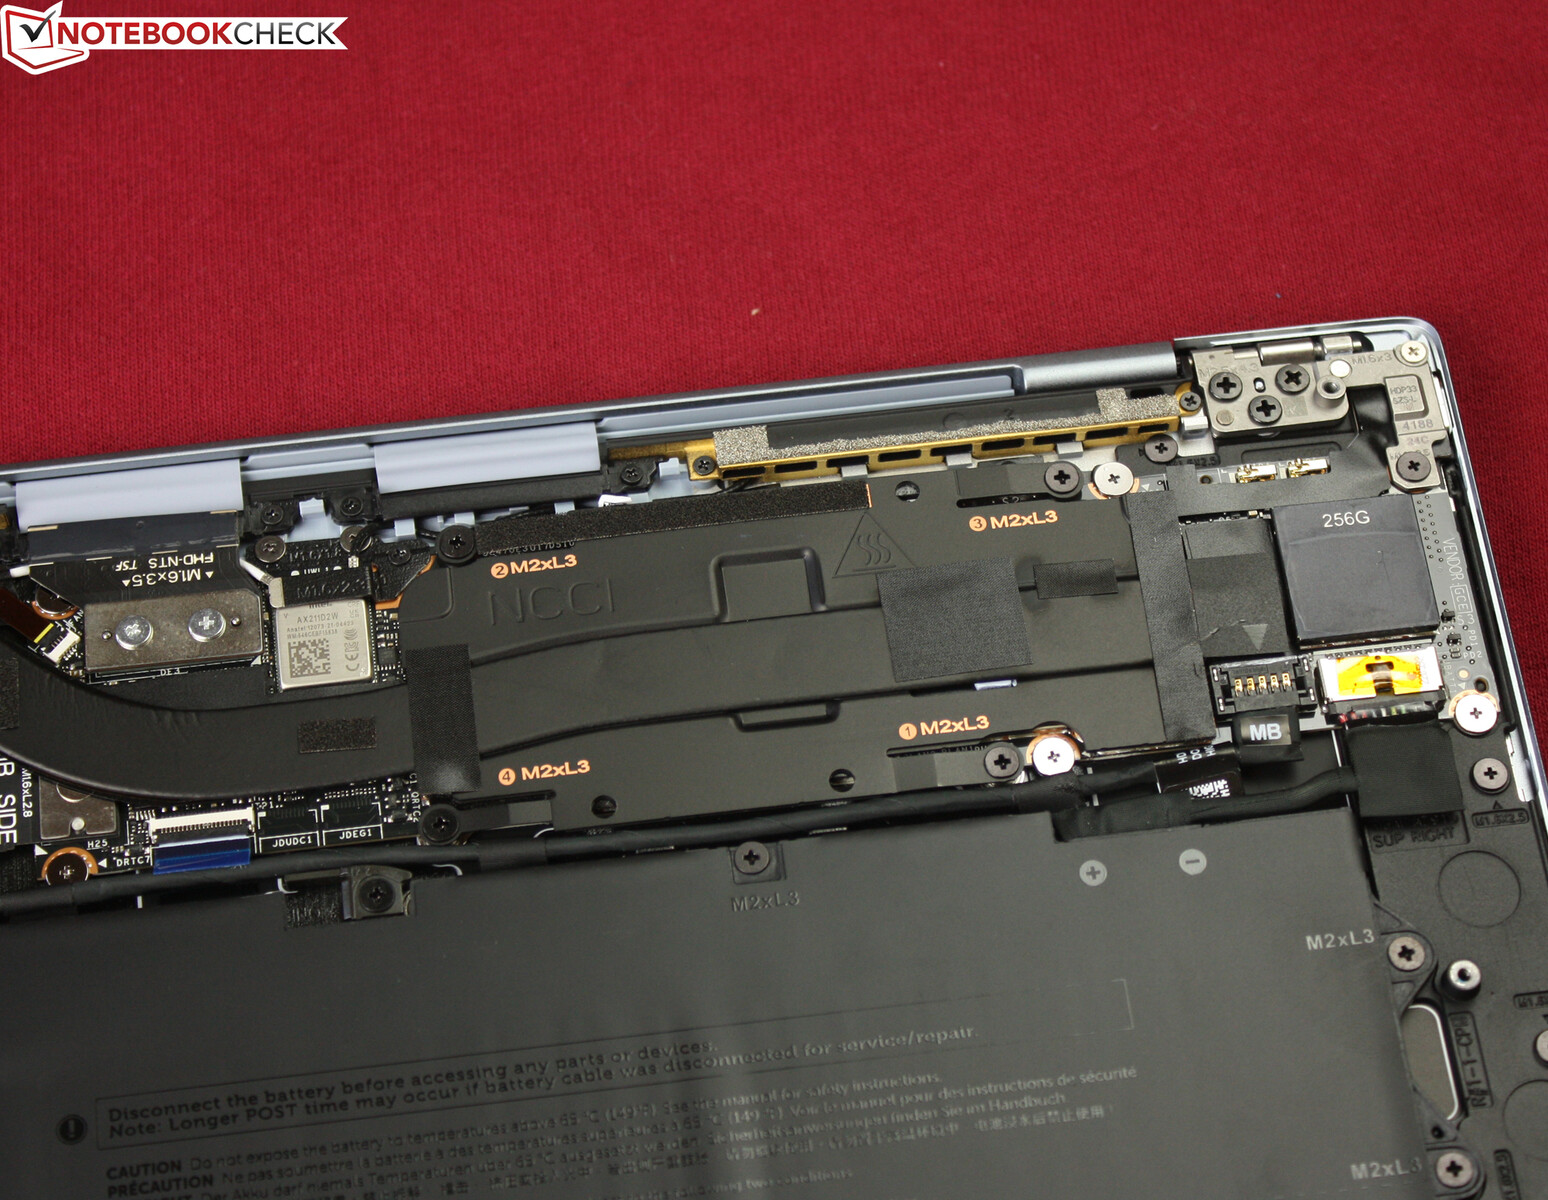
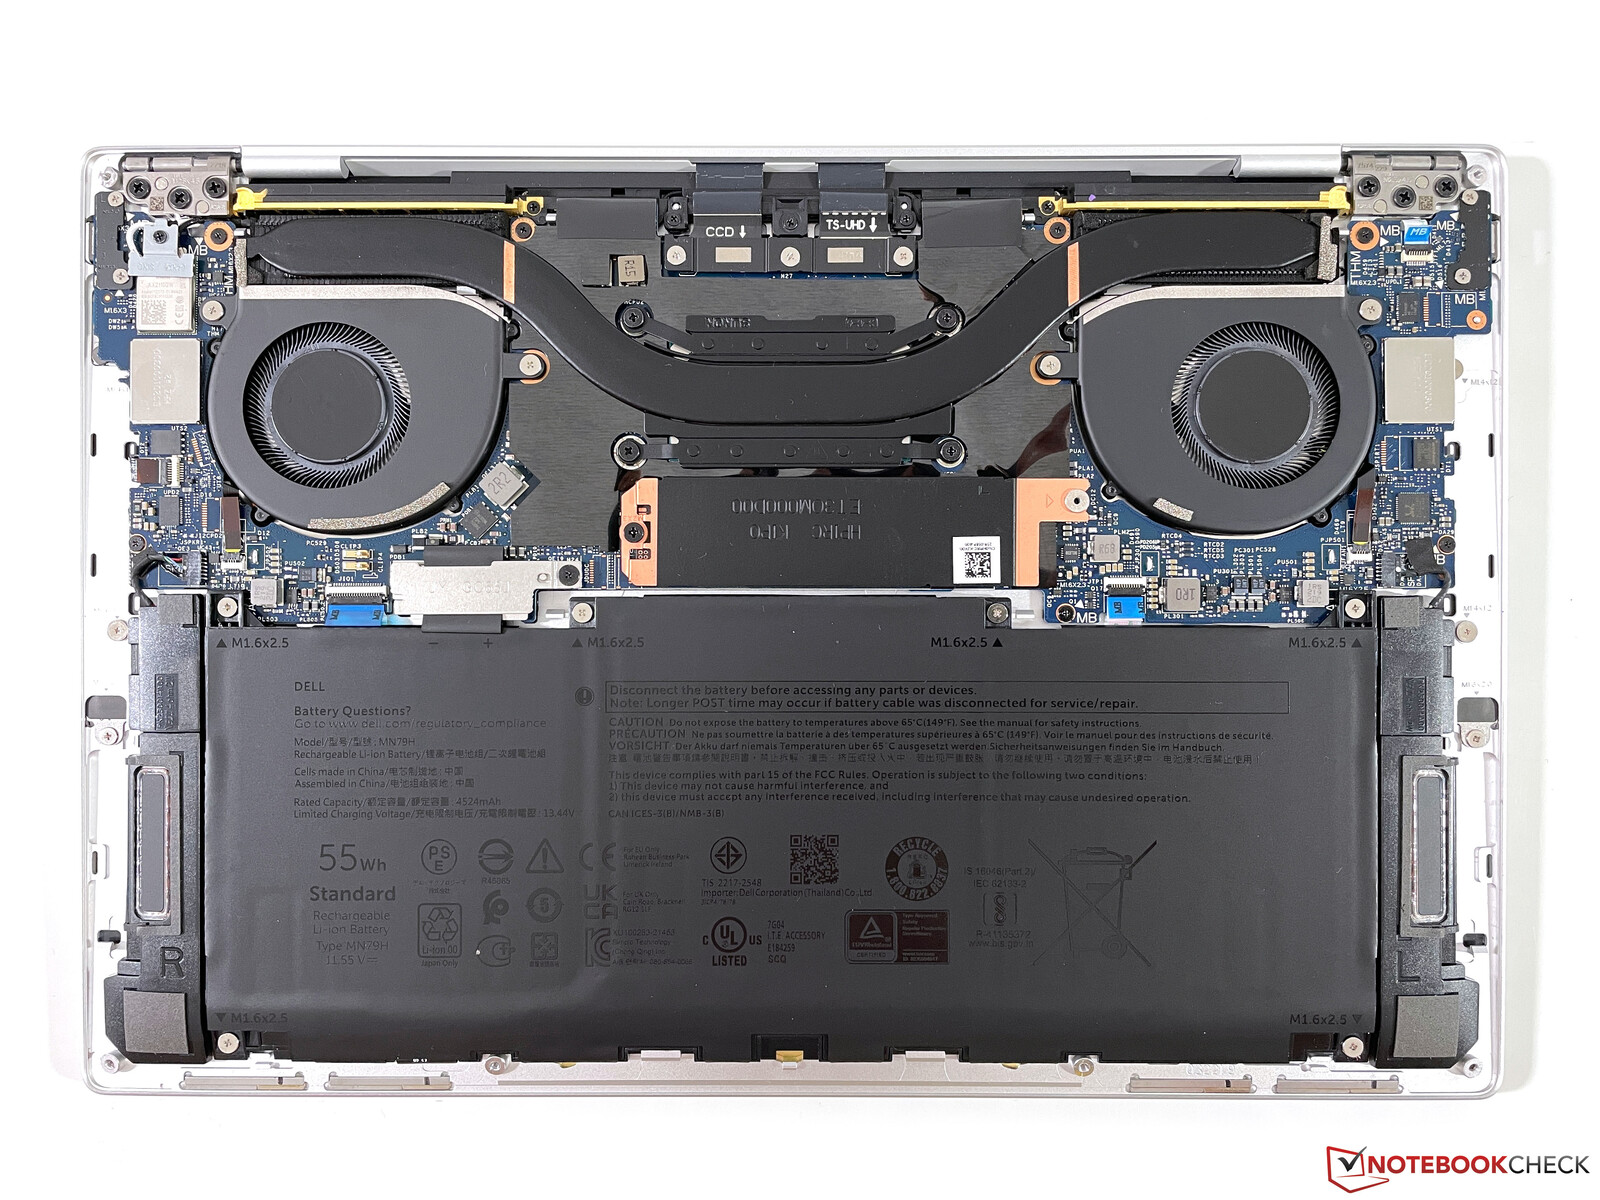
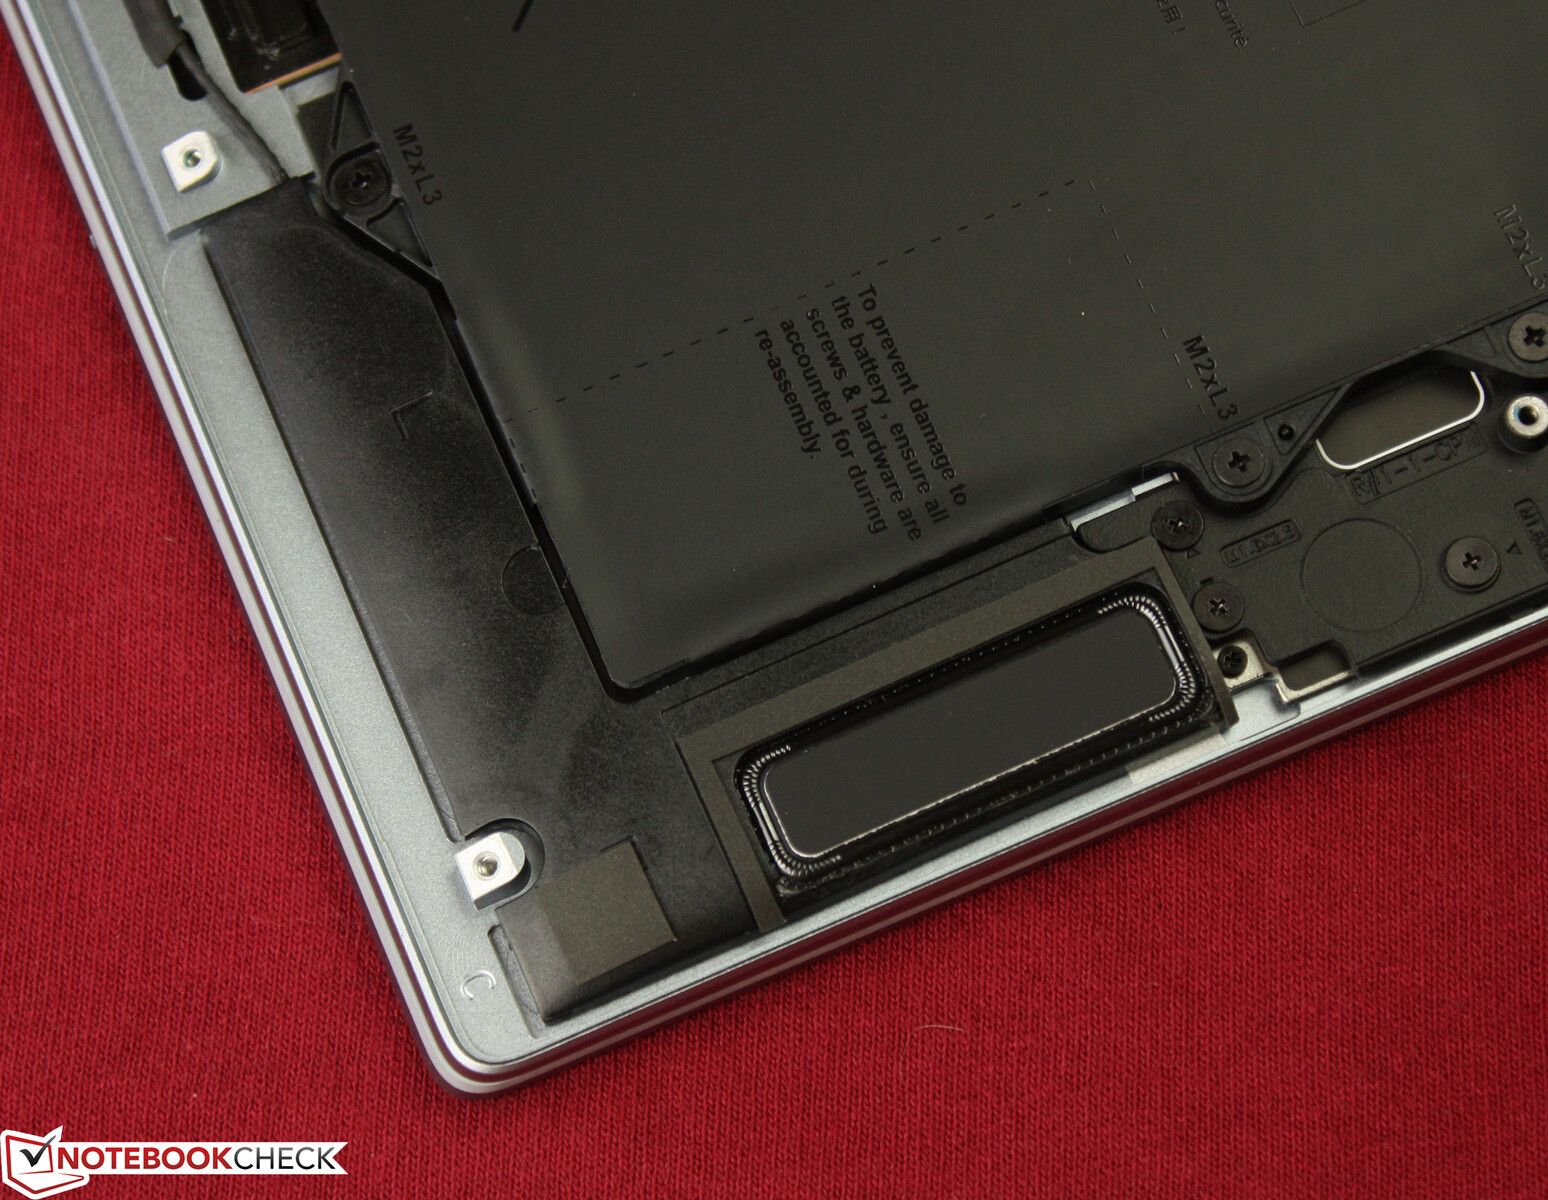
维护
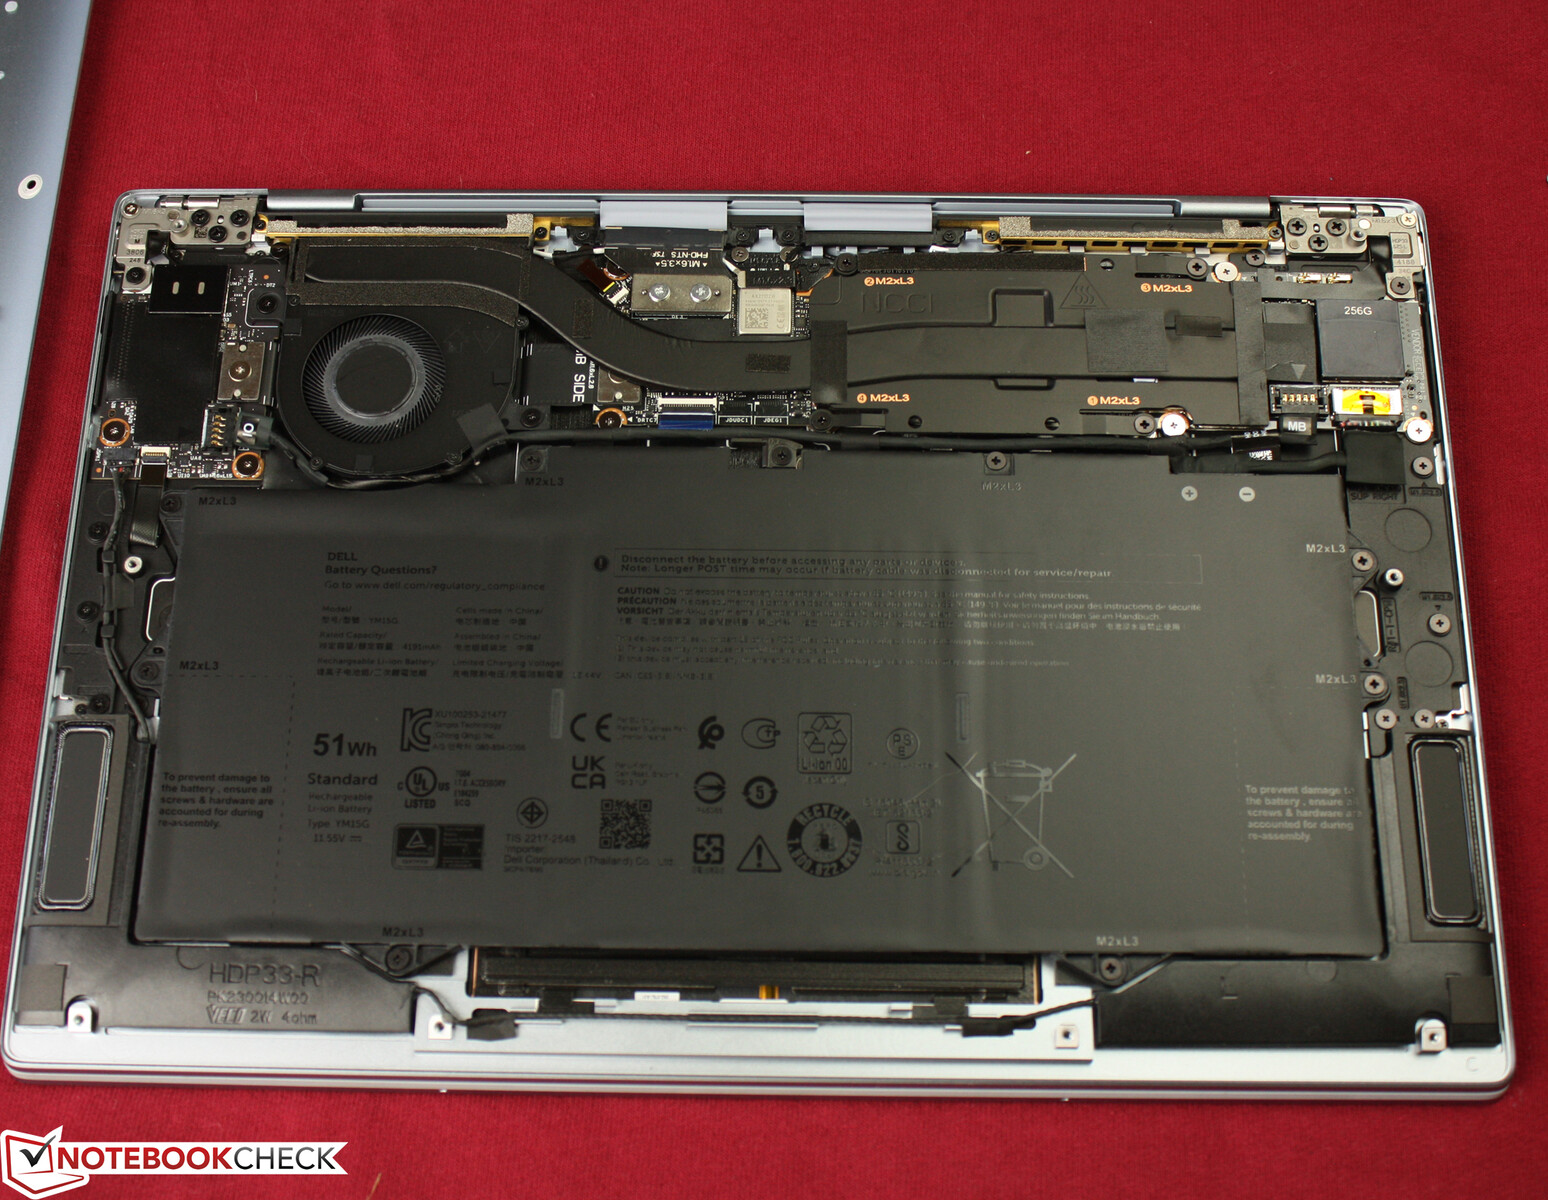
底板用6颗Torx螺钉(T5)固定,很容易拆卸。内部结构看起来很有条理,维护选项仅限于清洁风扇。美光的固态硬盘是焊接的,不能更换!这与XPS 13 Plus形成鲜明对比,后者的M.2-2280固态硬盘可以更换,不过内存和Wi-Fi模块仍然是固定的。
担保
戴尔提供12个月的标准保修。
输入设备 - 带防滑打字的戴尔笔记本电脑
键盘
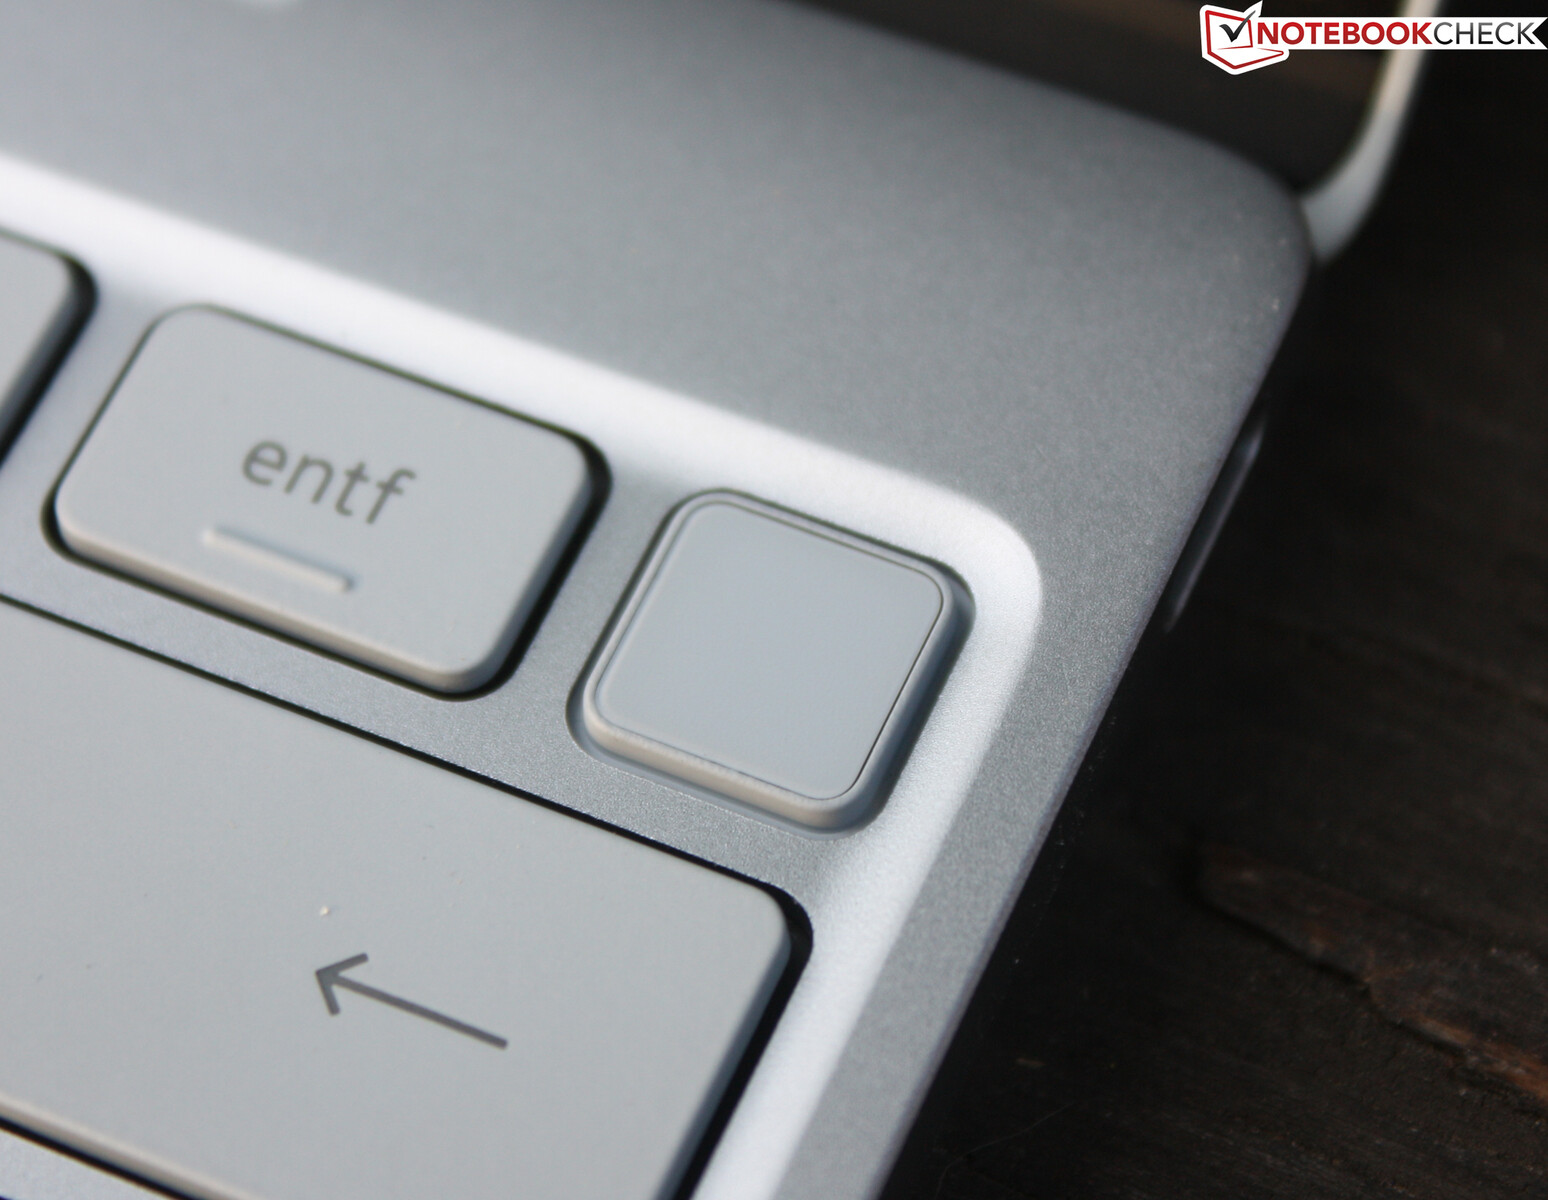
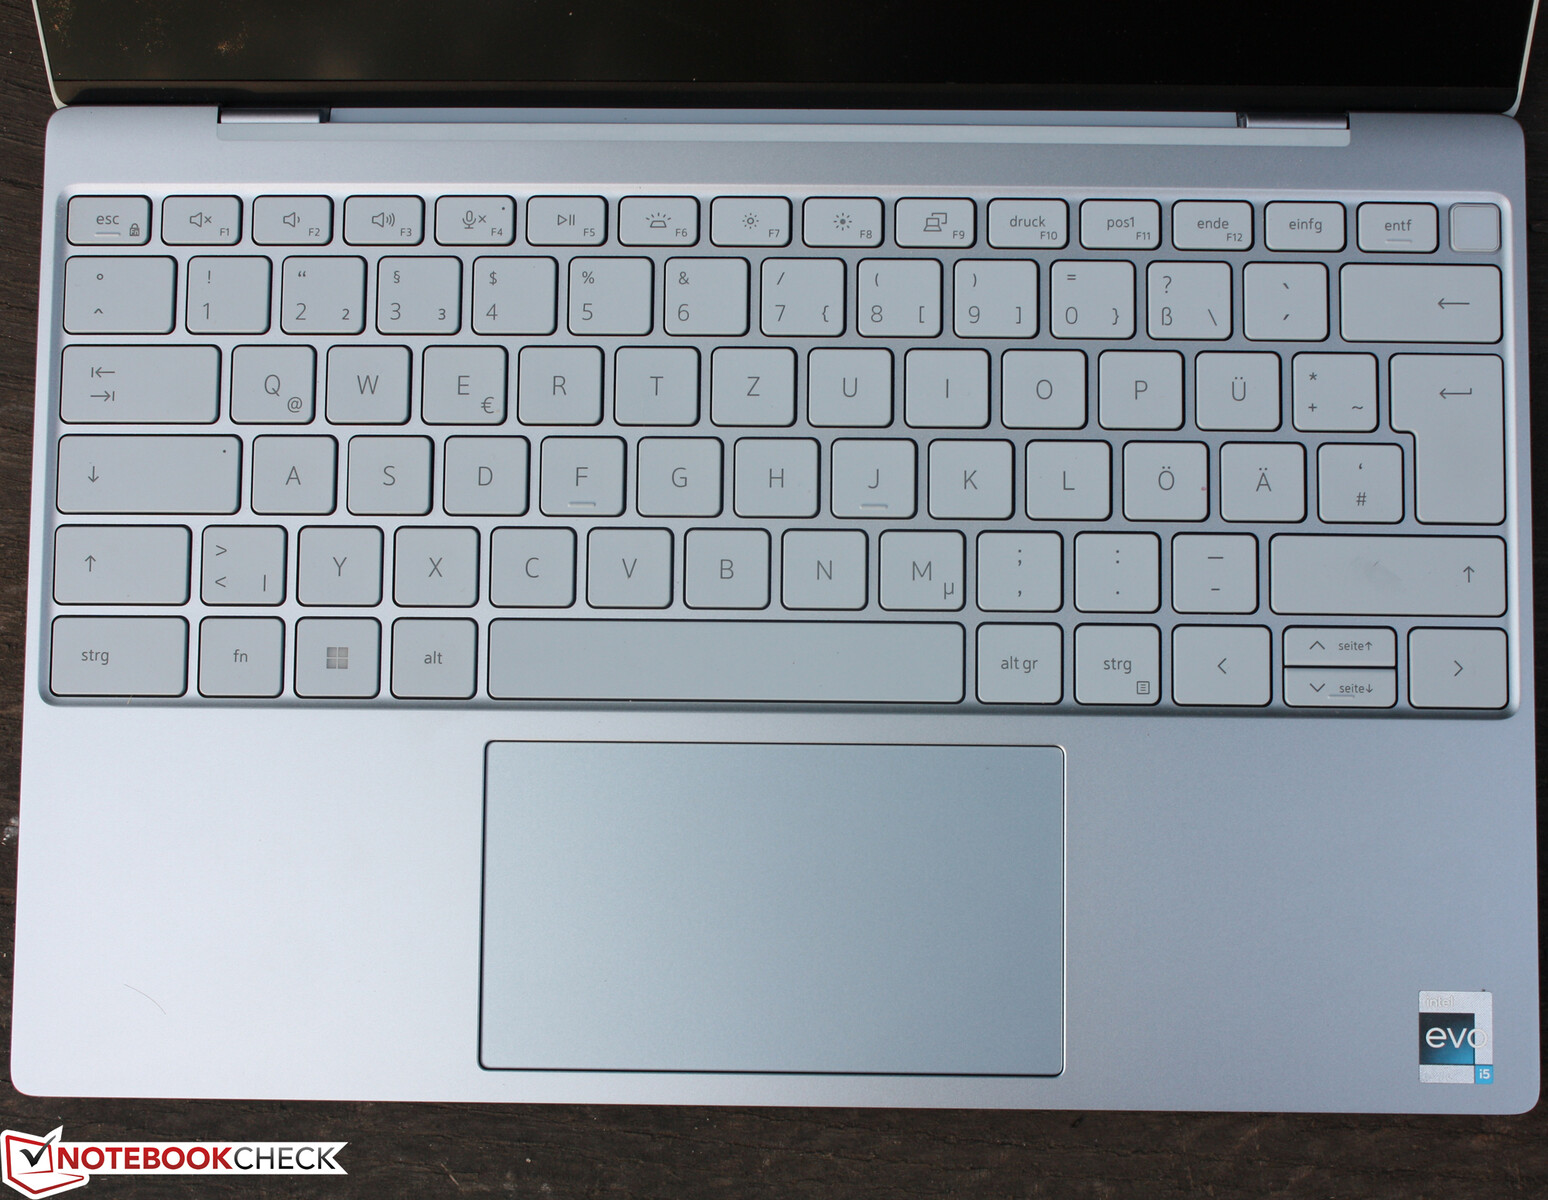
与2021年的XPS 13相比,键盘在反馈和布局方面都没有变化。它自己延伸到了底座的整个宽度,虽然上下方向键非常小,但上面有触觉标记。F键的第二层可以用于通常的目的。它可以通过Esc+Fn永久切换,如果你反正不使用F1-F12键,这很方便。该键提供了一个坚定的反馈,接近于过于坚定。启动点很明显。它可能会感到有些无力,这部分源于较浅的行程。粗糙的防滑橡胶圆顶键带来了快速、精确和愉快的打字体验。在这方面,按键之间的大量空间也是一个优点。由于其几乎是橡胶的质地,按键是平的,不像其他笔记本键盘的按键那样有光泽。
触摸板
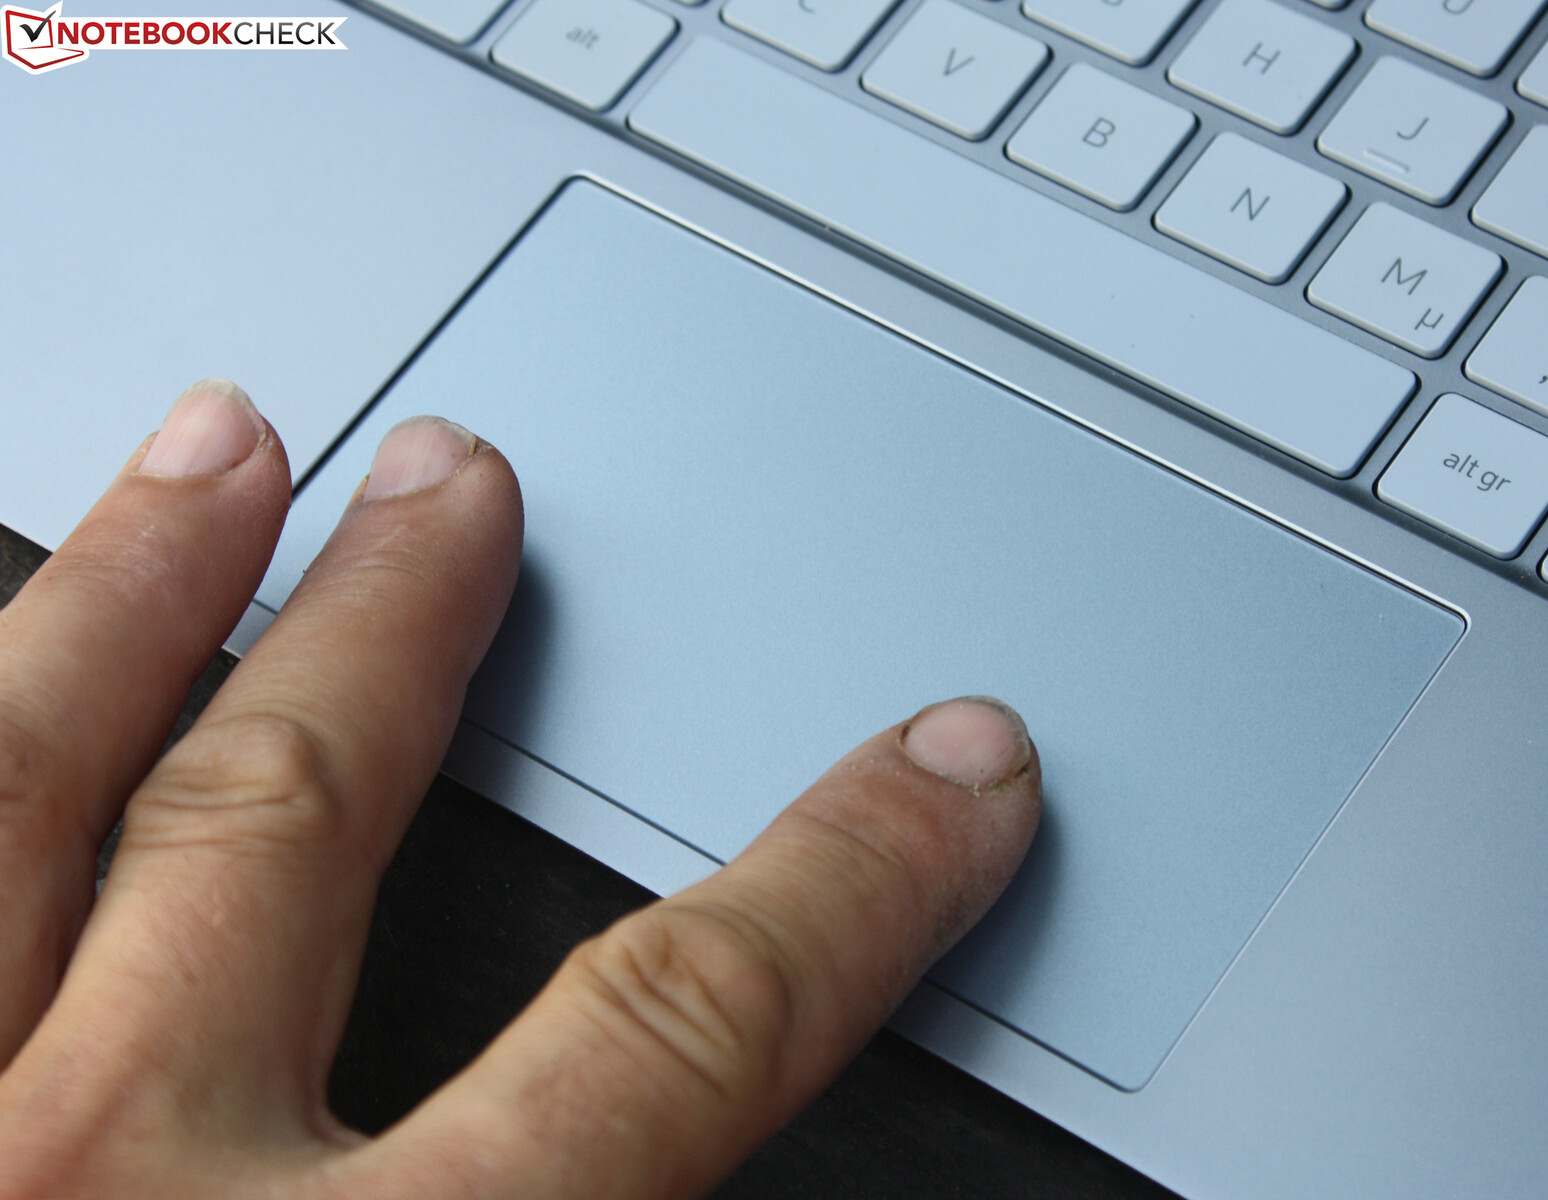
平滑的触控板产生沉闷、安静的点击声。行程很浅,在触摸板的上三分之一处几乎看不出来。略微凹陷的垫子支持通常的双指手势控制,可以实现快速工作流程。虽然它的对角线相当大,达到12.7厘米(5英寸),但这在当今已不再罕见。点击板在掌托之间完全居中。没有Fn键用于禁用鼠标的替换。值得庆幸的是,这几乎已经没有必要了,因为垫子可以可靠地识别搁置在上面的手掌,防止意外输入。
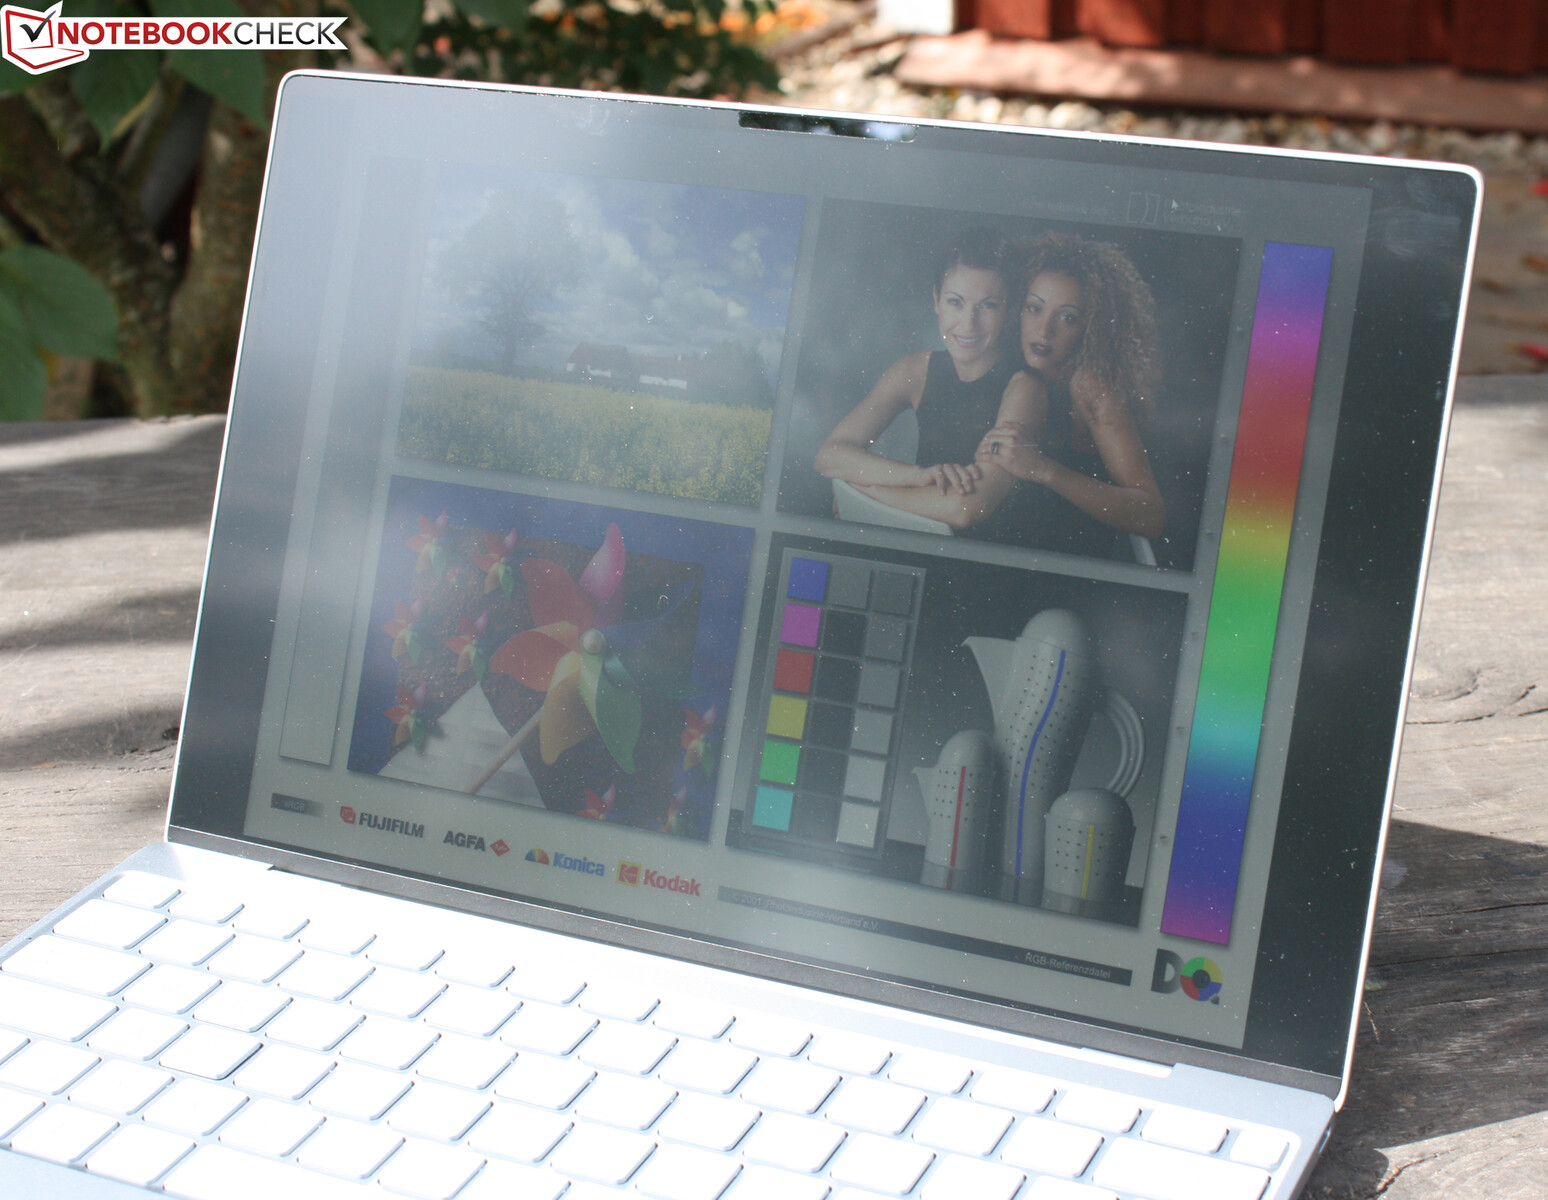
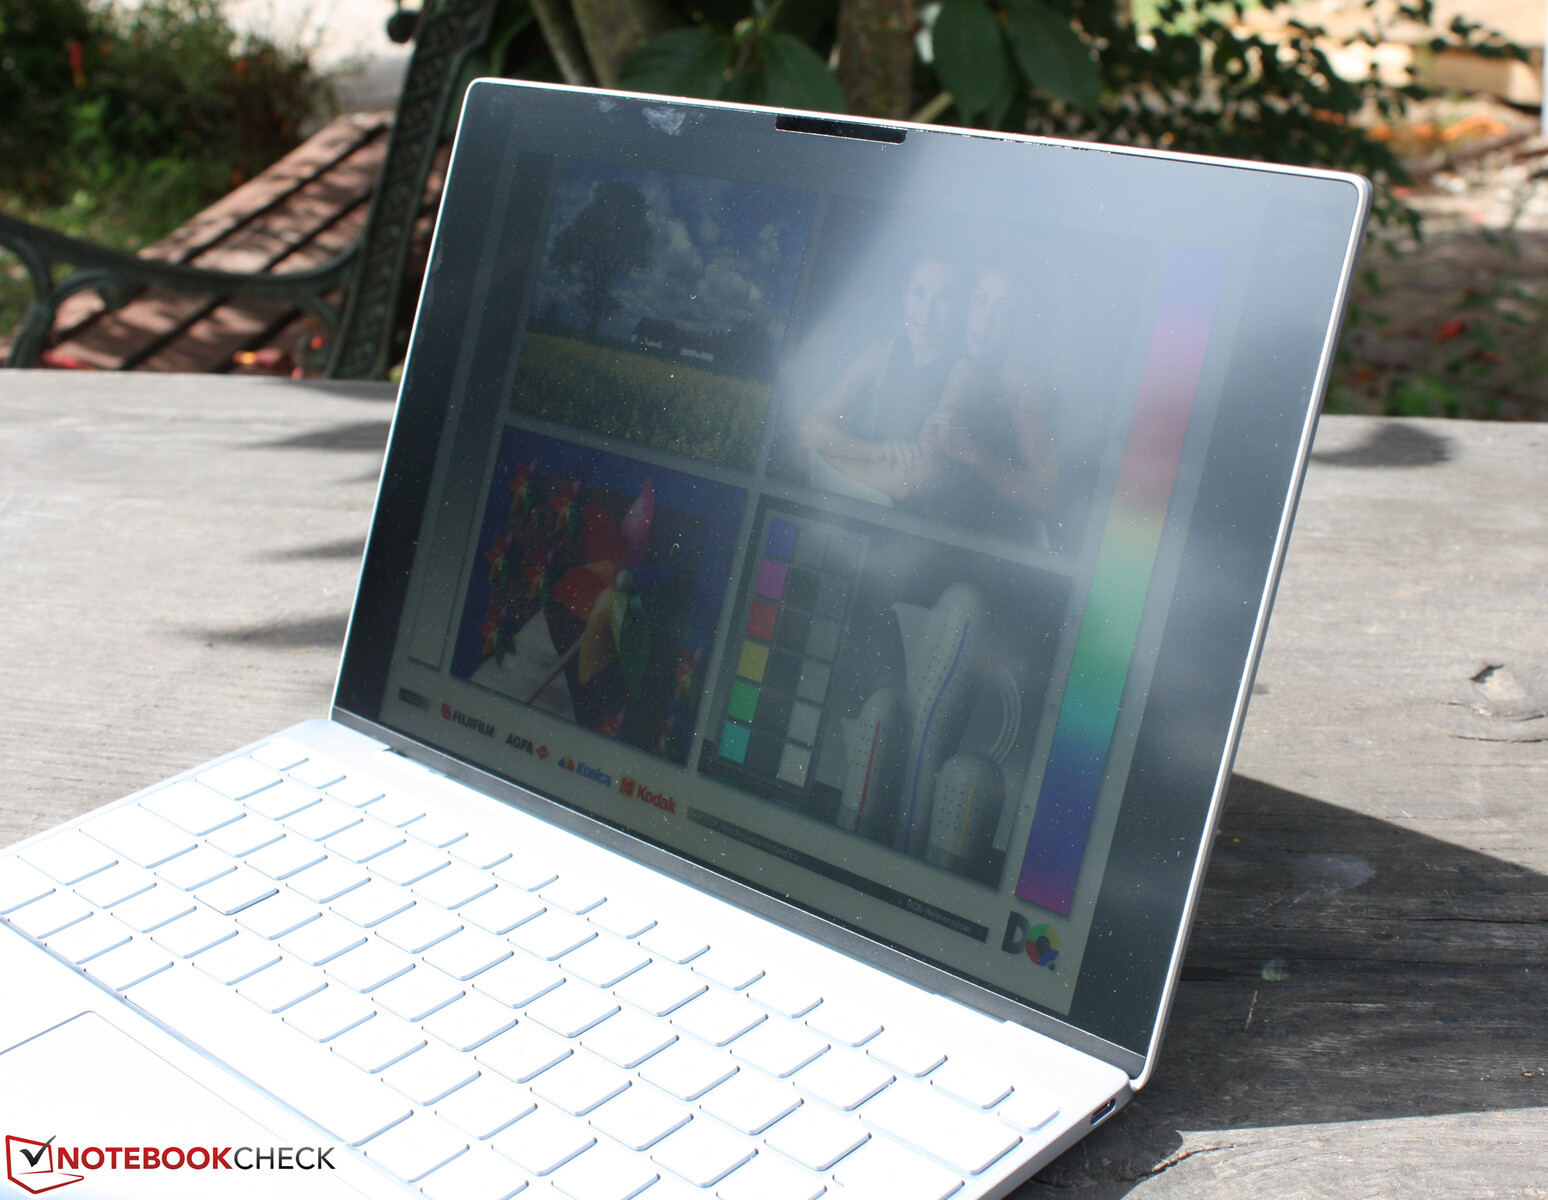
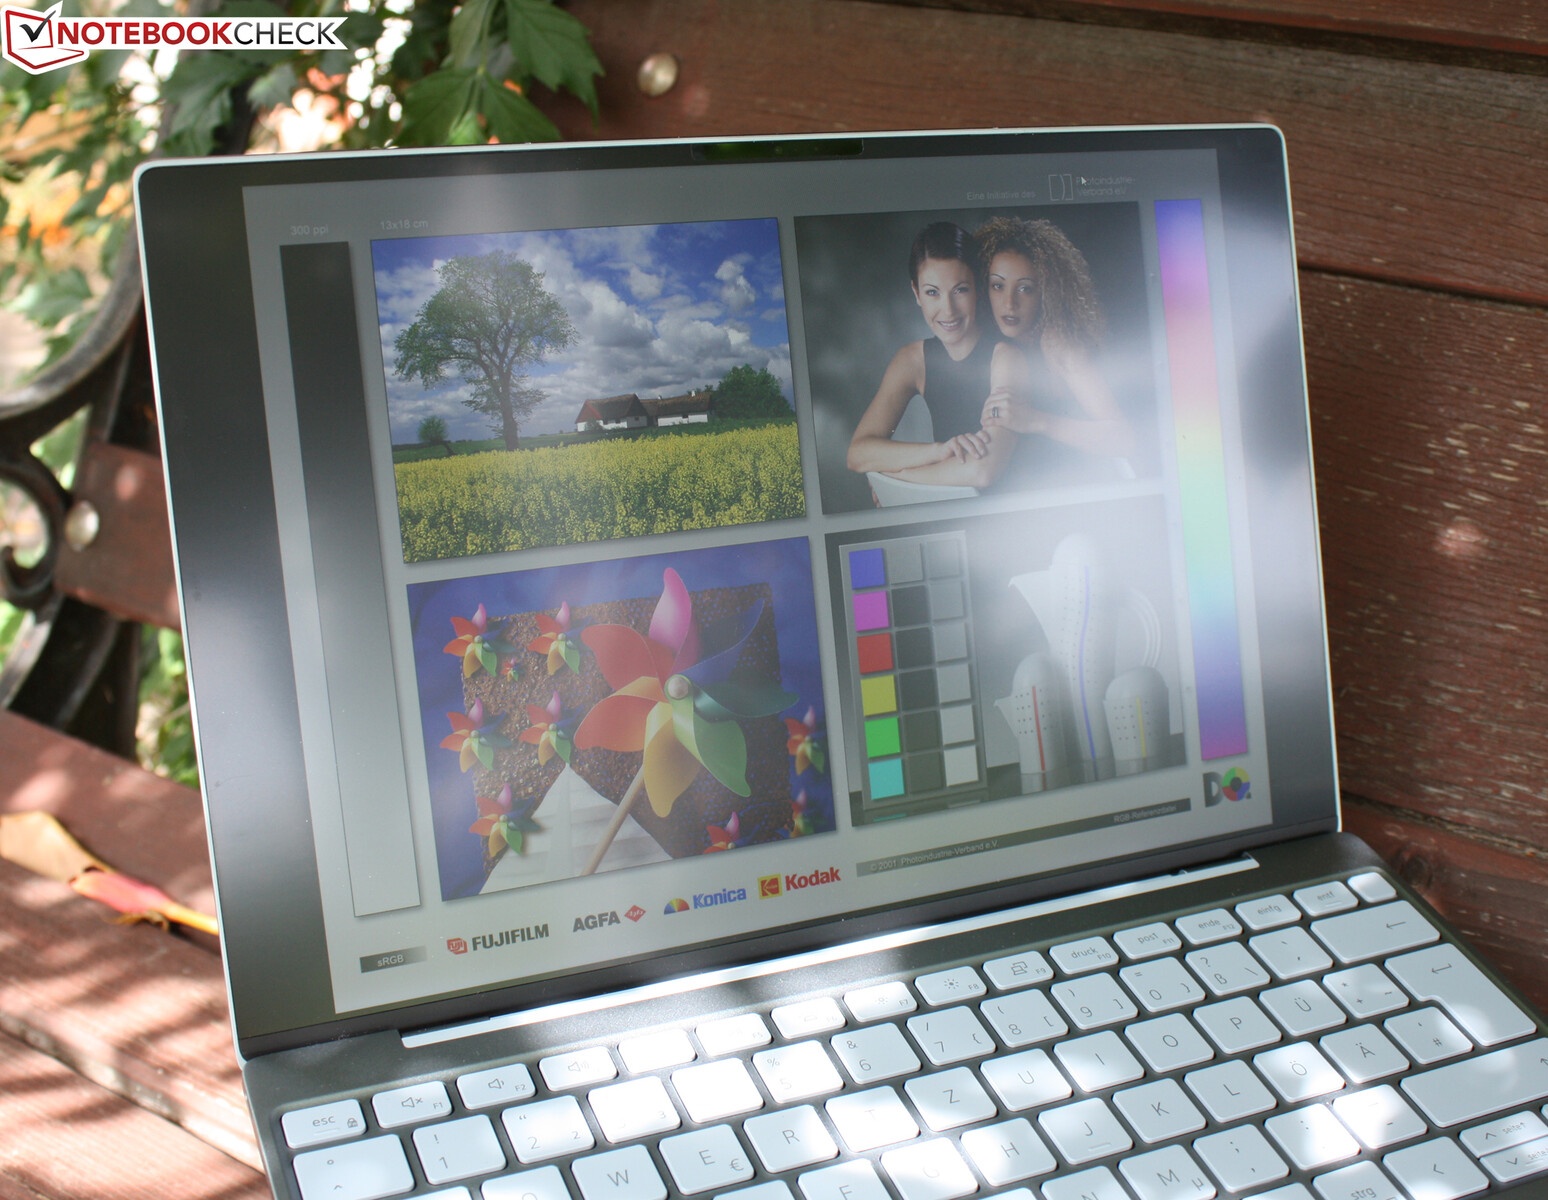
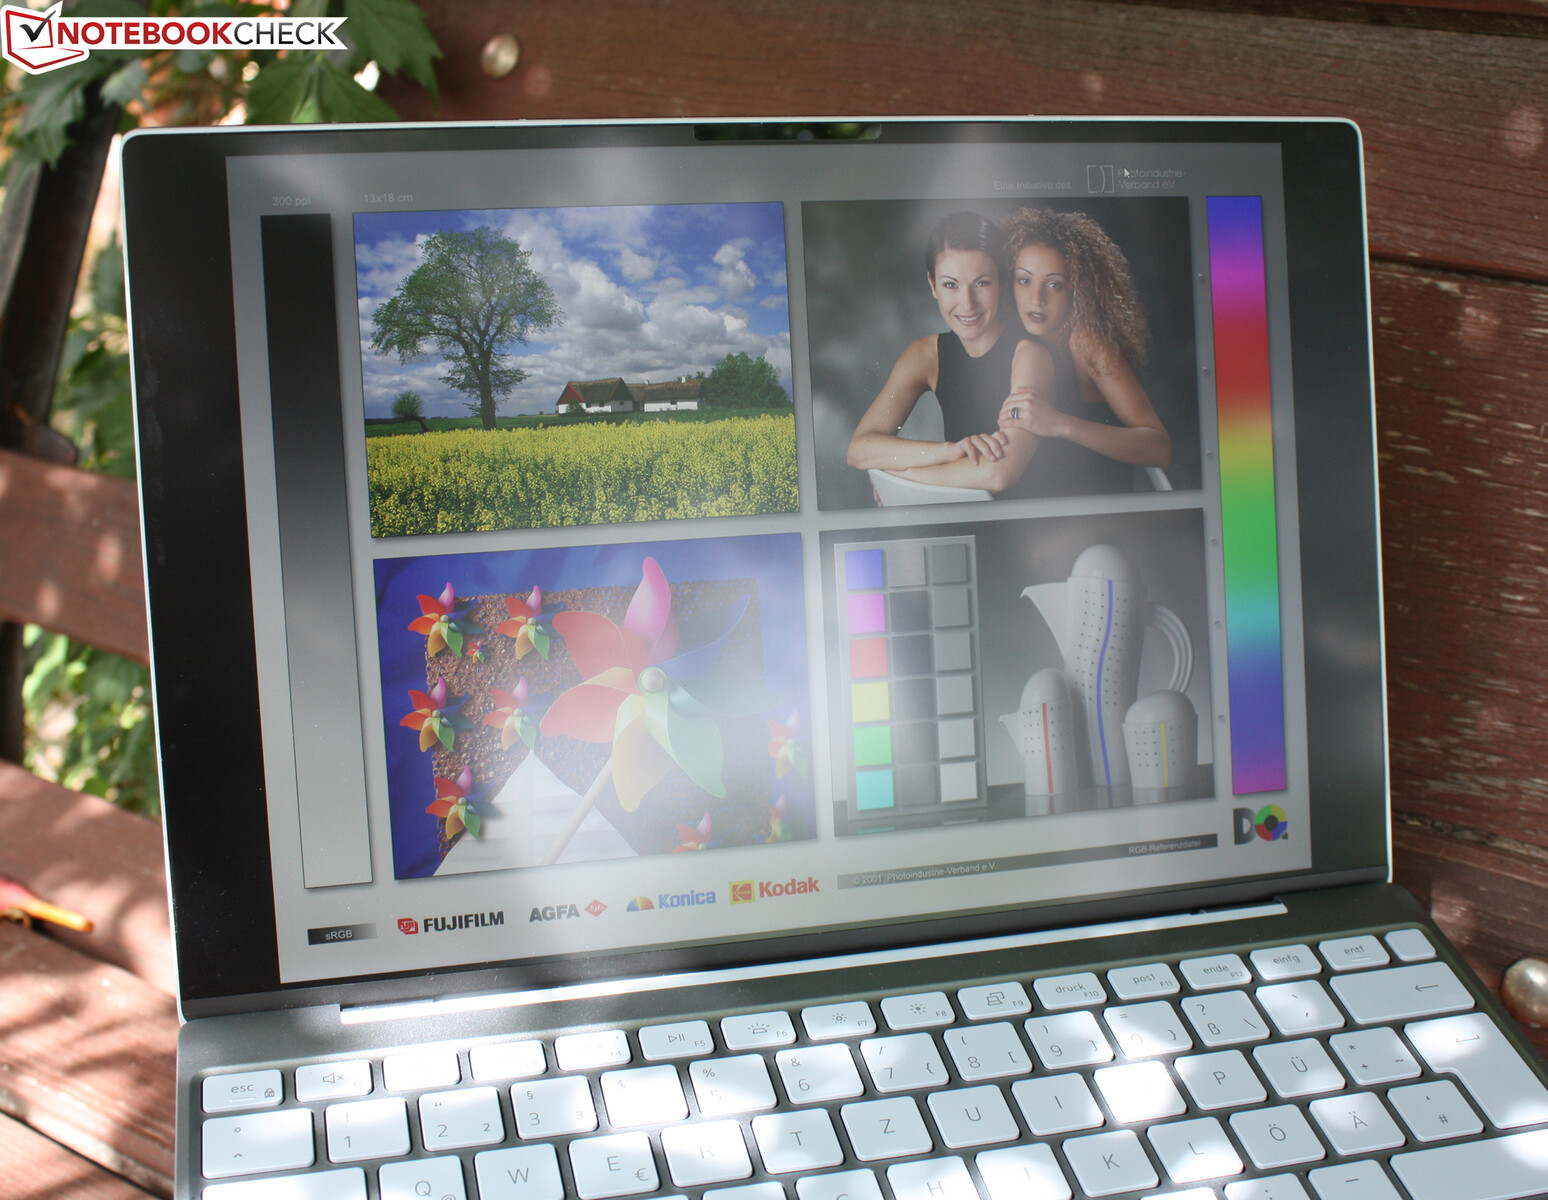
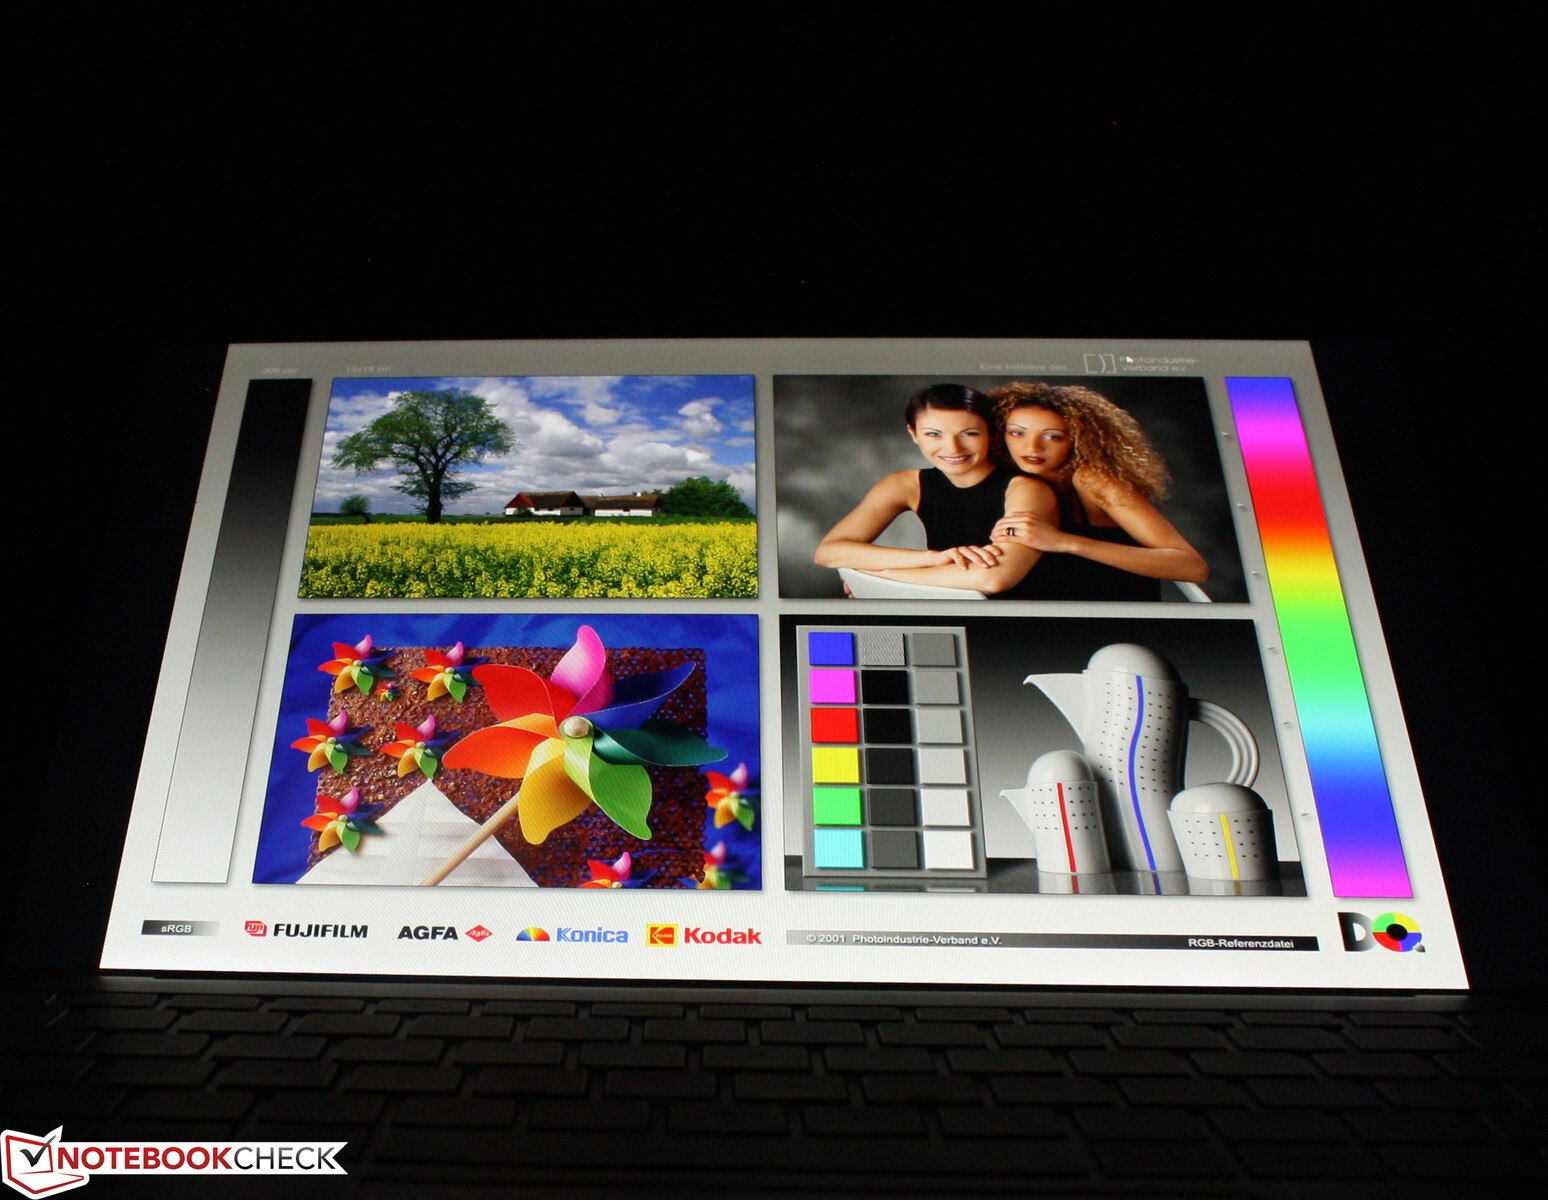
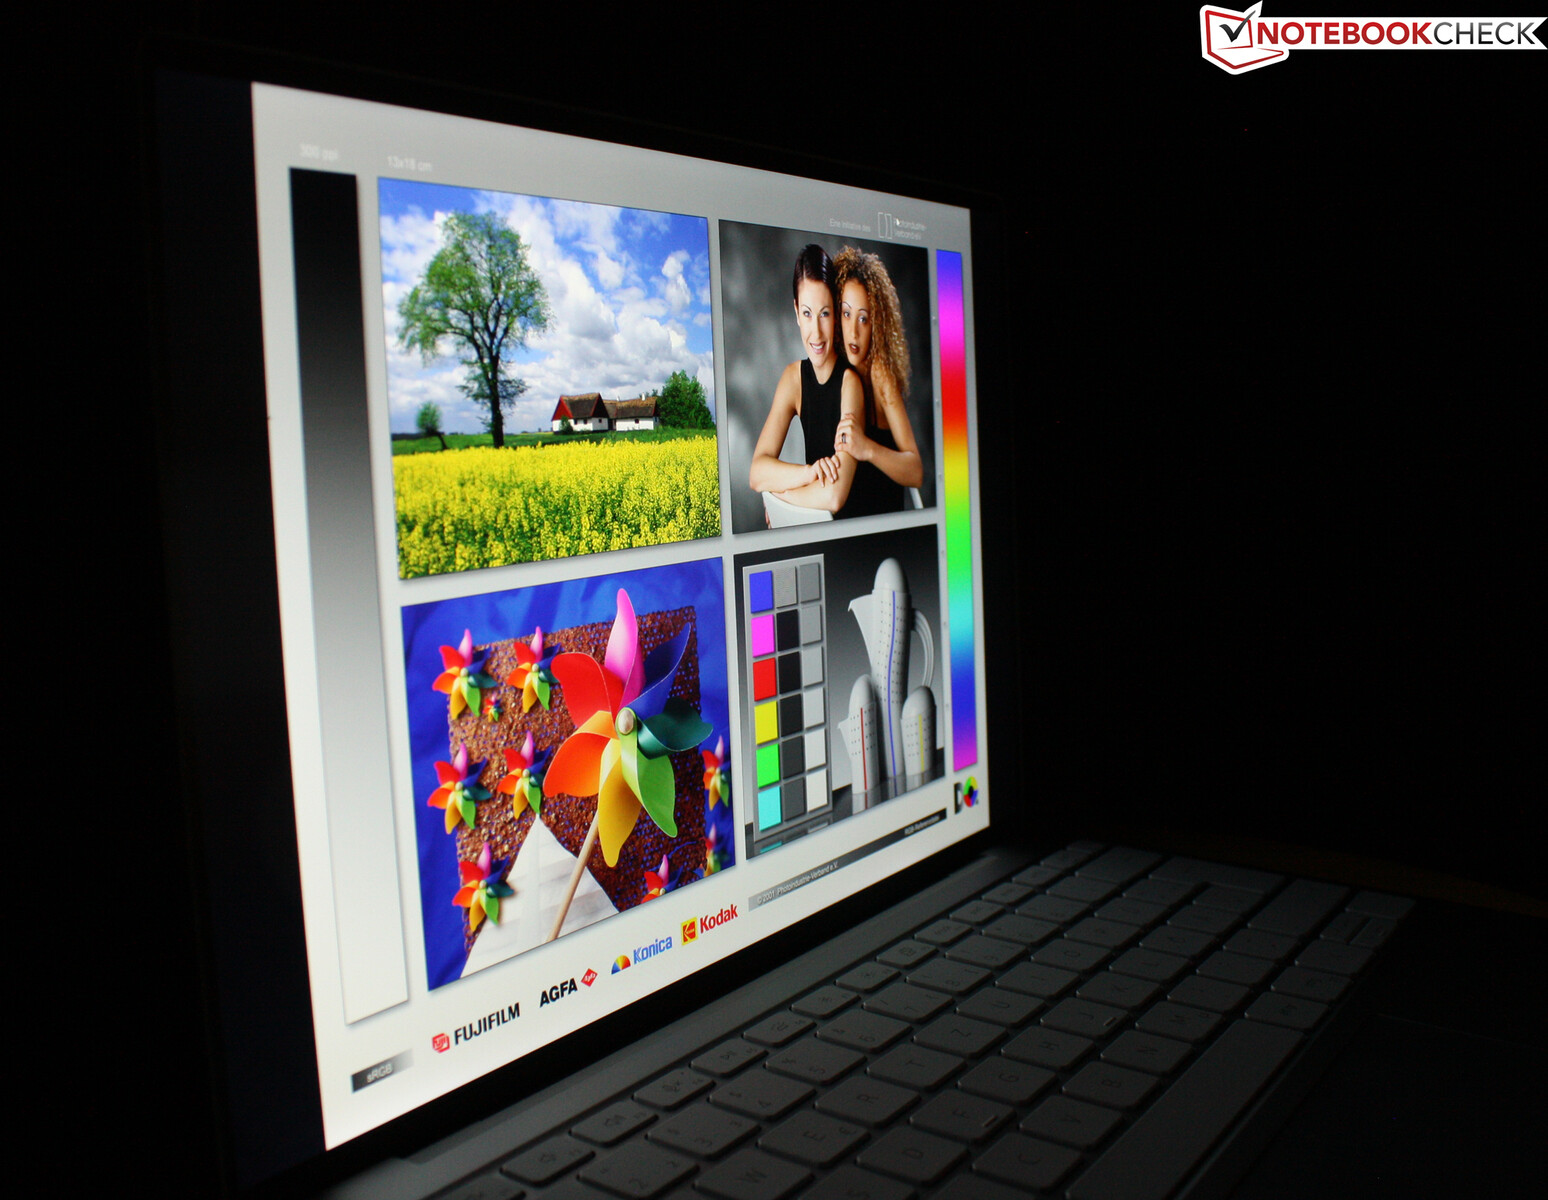
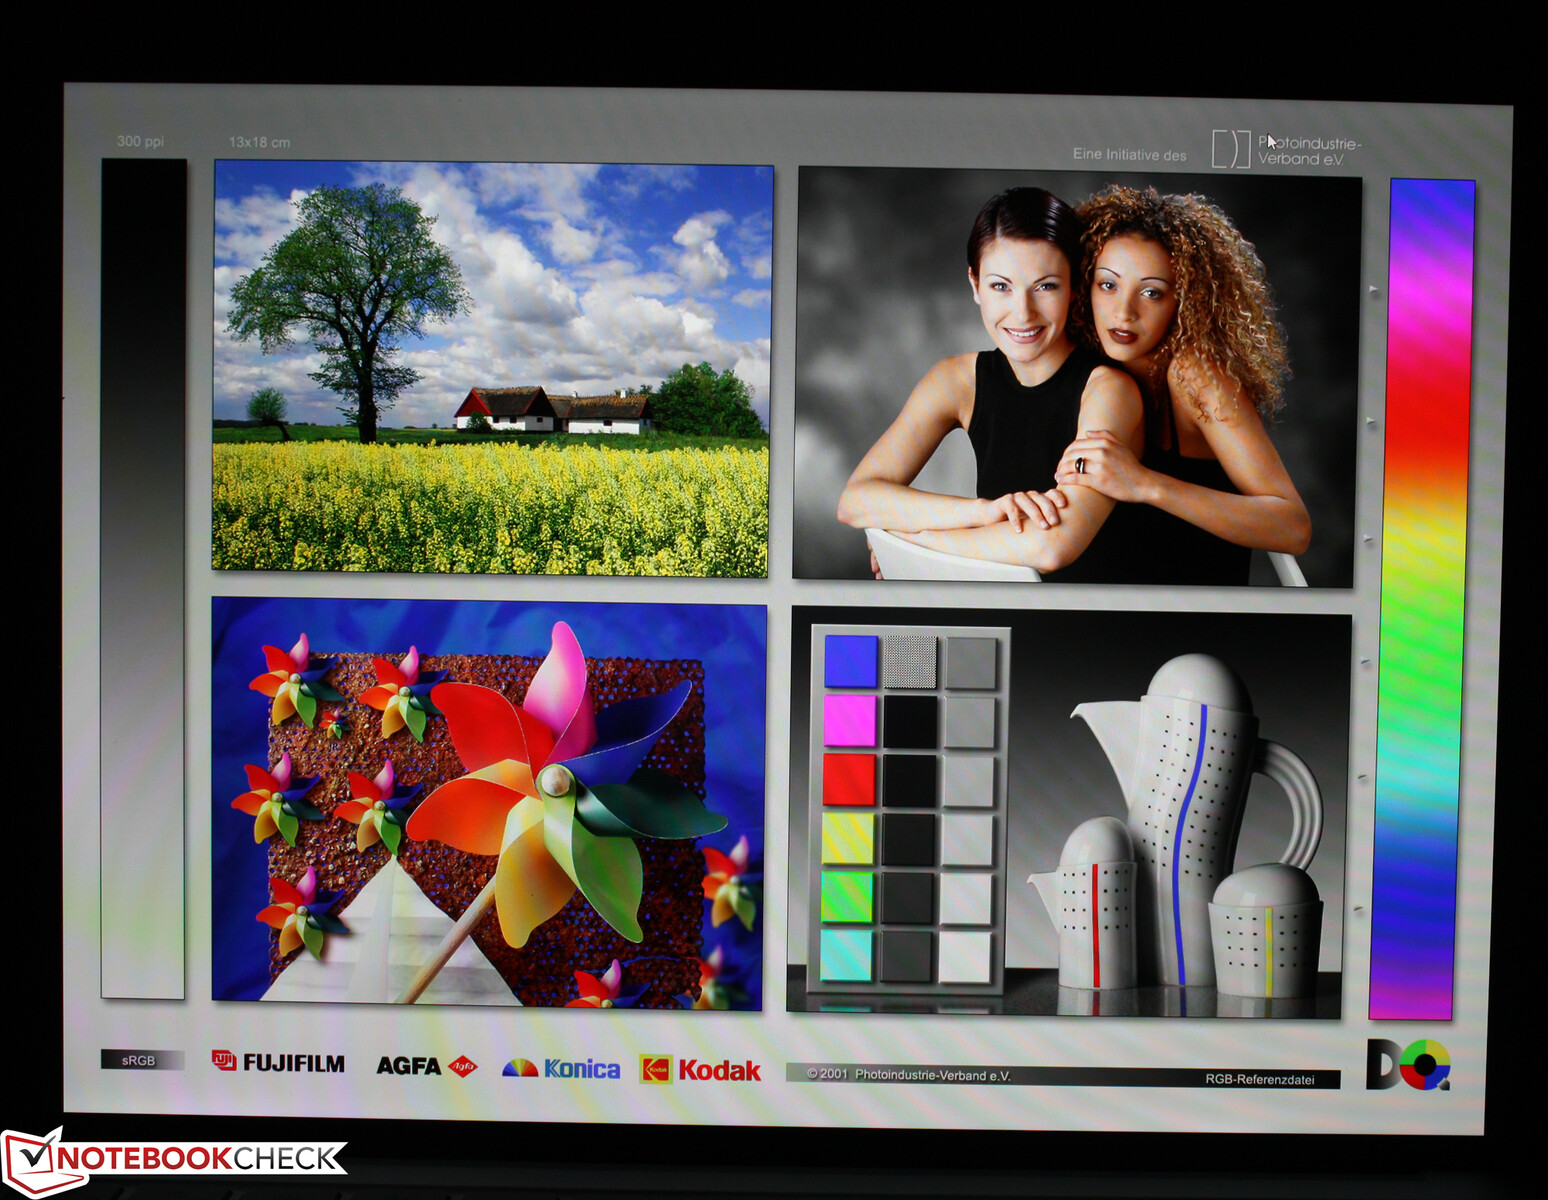
显示器 - 用于户外的明亮笔记本电脑显示器
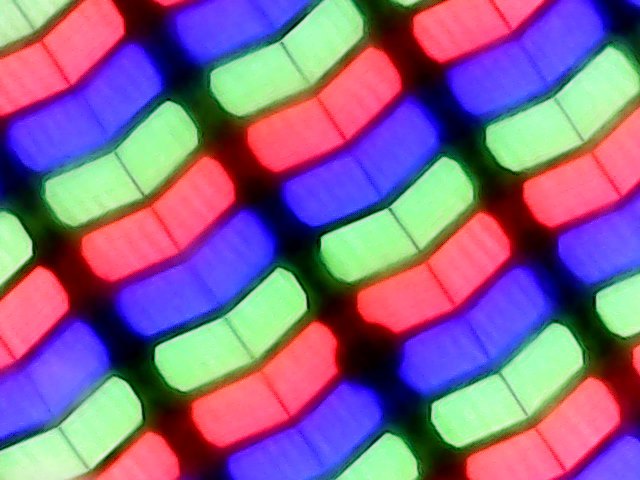
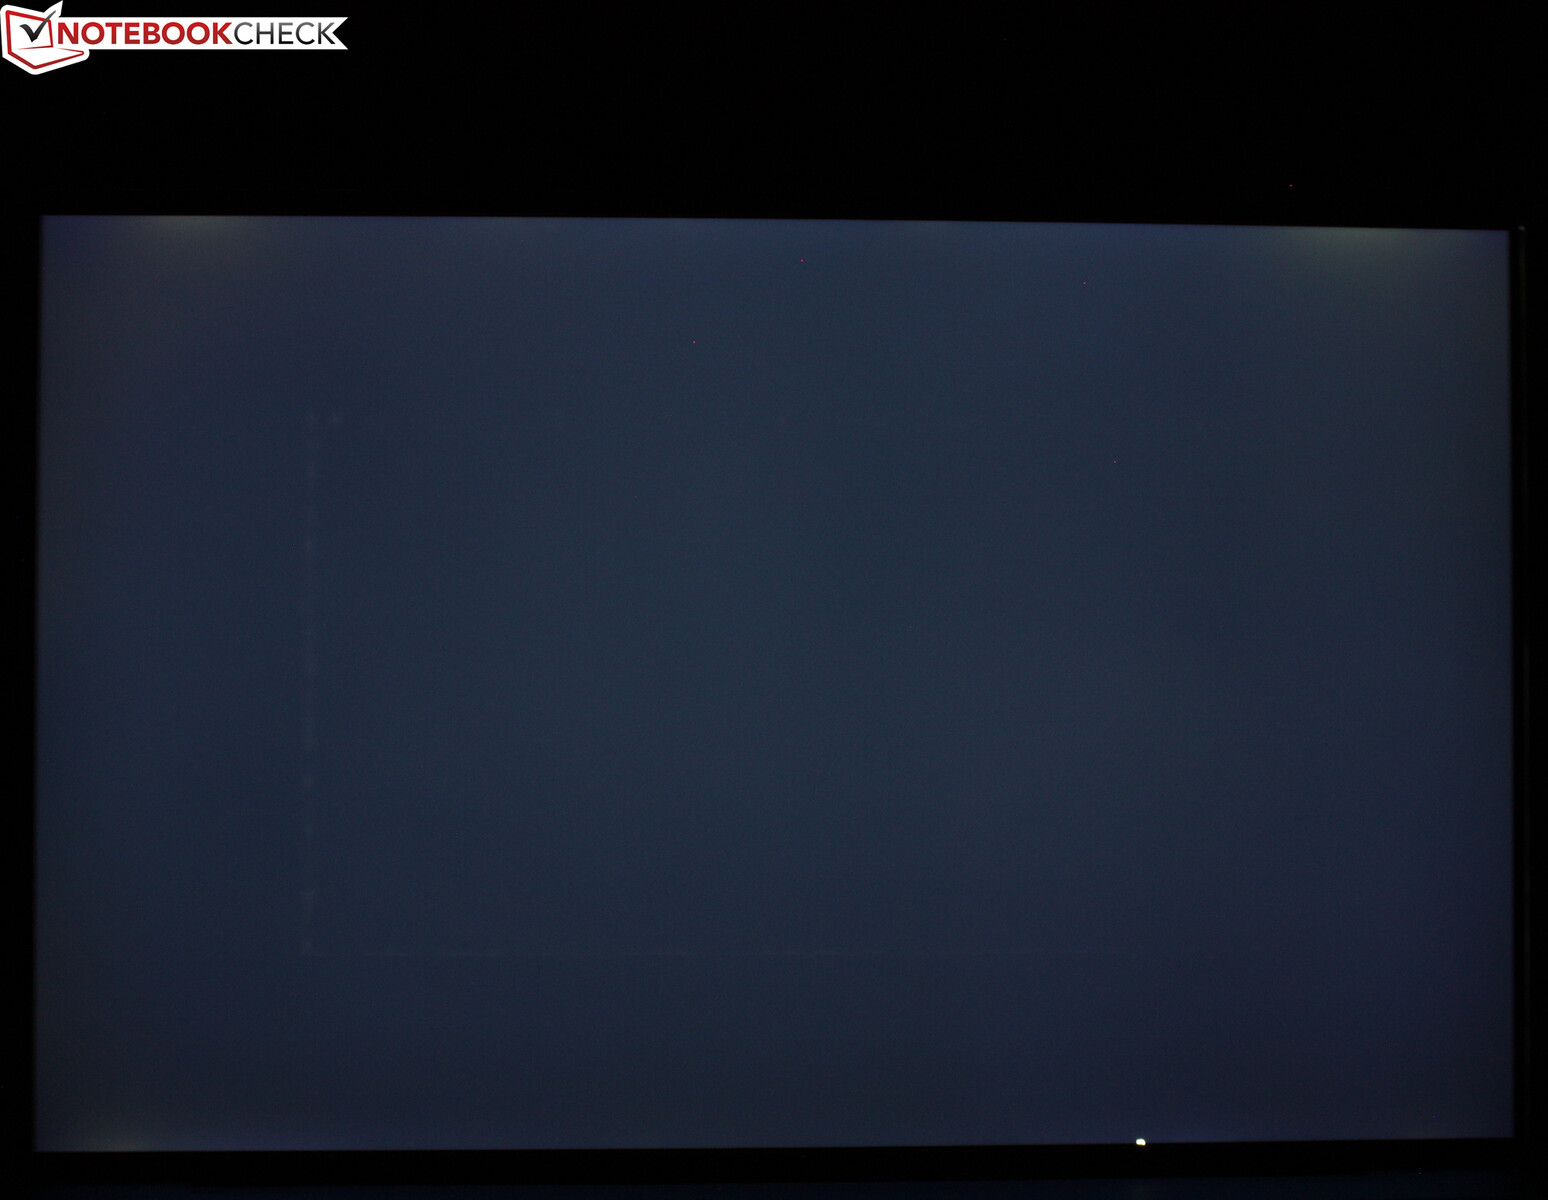
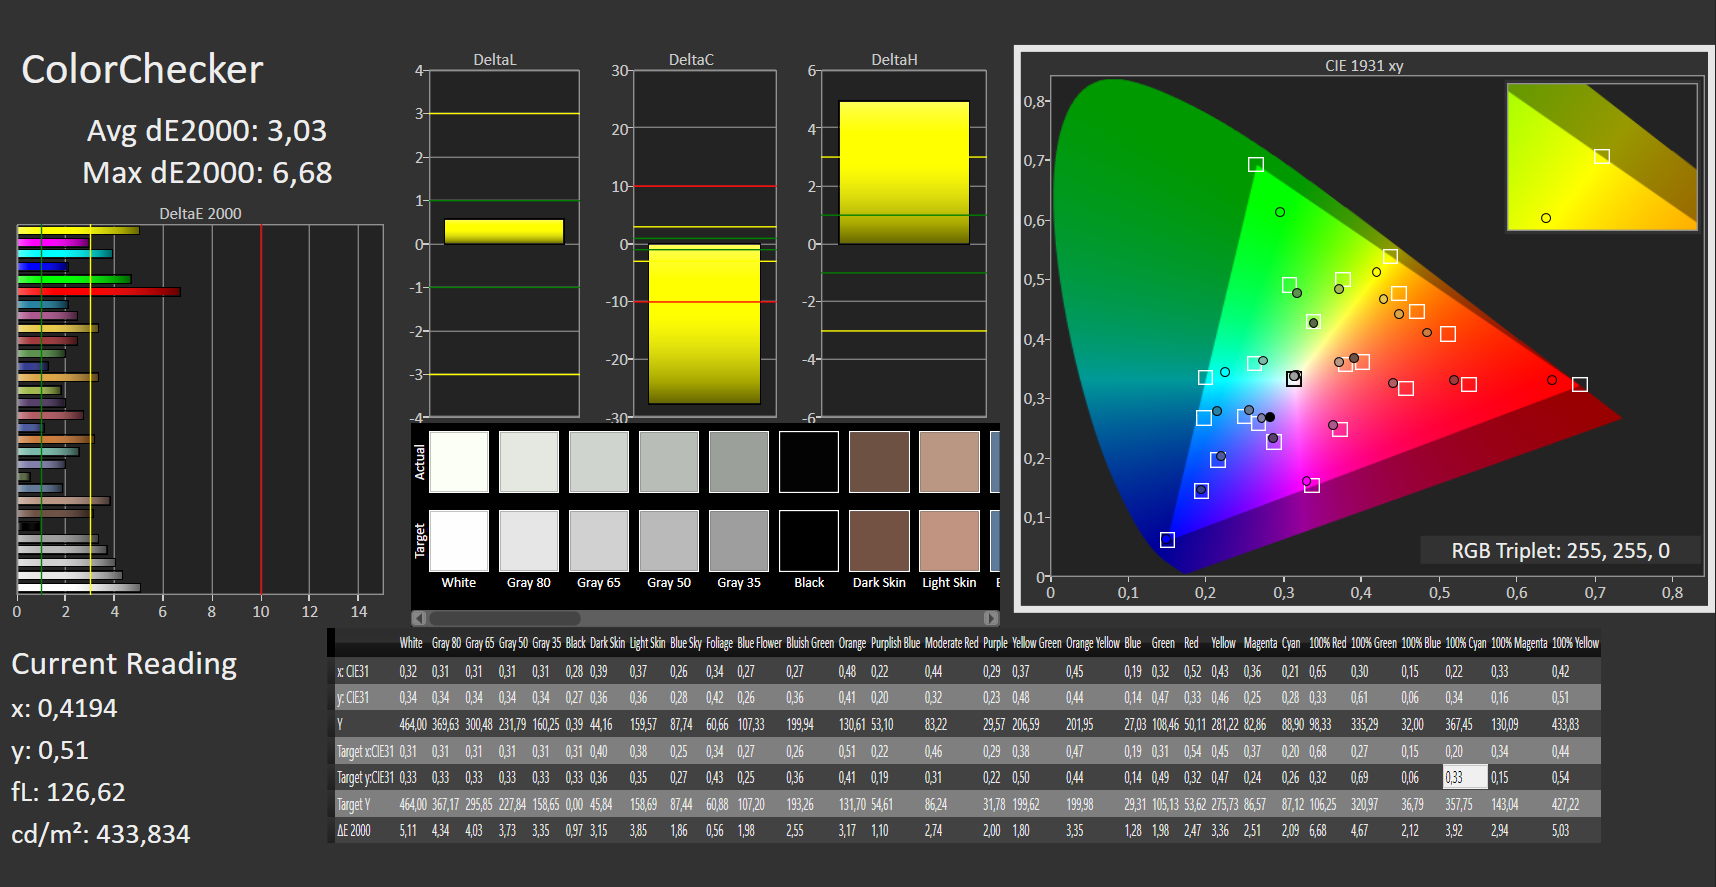
我们的XPS 9315使用默认的夏普显示屏,分辨率为1920 x 1200像素,采用LQ134N1 IPS面板,在最大亮度下显示全黑图像时,在顶部边缘附近表现出轻微的背光出血。虽然442尼特(平均)的亮度很高,但它没有达到制造商声称的500尼特(我们只测量到466尼特)。
Plus版本(夏普LQ134R1)的4K面板以473尼特(平均)的亮度略高,但主要提供更好的对比度。1165:1而不是1764:1使得Plus的4K面板成为明显的赢家。
注意:在电池模式下,亮度略有下降,减少了60尼特(平均:406尼特)。OLED显示屏选项仅在Plus版本上提供。
XPS 13没有使用PWM来控制显示屏的亮度。我们的三张屏幕截图显示了100%、50%和0%亮度下的同质线。
| |||||||||||||||||||||||||
Brightness Distribution: 89 %
Center on Battery: 406 cd/m²
Contrast: 1165:1 (Black: 0.4 cd/m²)
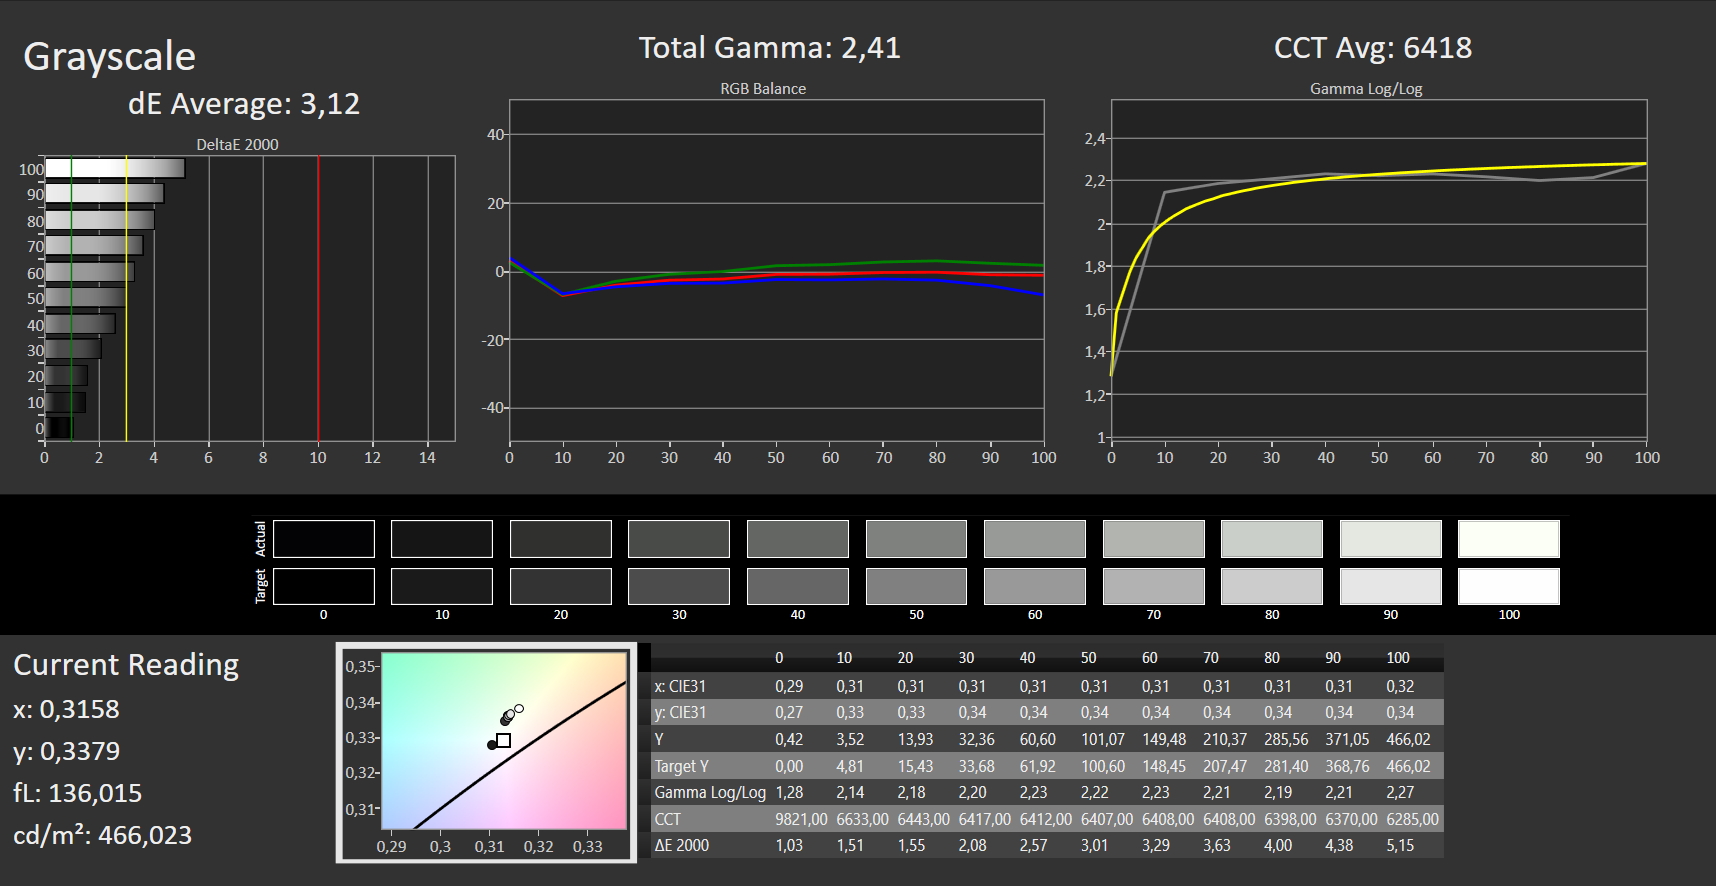
ΔE ColorChecker Calman: 3.03 | ∀{0.5-29.43 Ø4.72}
calibrated: 2.34
ΔE Greyscale Calman: 3.12 | ∀{0.09-98 Ø4.97}
71% AdobeRGB 1998 (Argyll 3D)
100% sRGB (Argyll 3D)
69% Display P3 (Argyll 3D)
Gamma: 2.41
CCT: 6418 K
| Dell XPS 13 9315, i5-1230U Sharp SHP1548 LQ134N1, IPS, 1920x1200, 13.4" | Apple MacBook Air 2020 M1 Entry IPS, 2560x1600, 13.3" | Asus Zenbook S 13 OLED SDC4172, OLED, 2880x1800, 13.3" | Lenovo ThinkPad X1 Nano-20UN002UGE MND007ZA1-2, IPS, 2160x1350, 13" | Huawei MateBook 13s i5 11300H TL134GDXP02-0, LTPS, 2520x1680, 13.4" | Dell XPS 13 Plus 9320 4K LQ134R1, IPS, 3840x2400, 13.4" | |
|---|---|---|---|---|---|---|
| Display | 21% | 28% | 1% | -6% | 6% | |
| Display P3 Coverage (%) | 69 | 98.6 43% | 99.8 45% | 70.4 2% | 65.2 -6% | 76.5 11% |
| sRGB Coverage (%) | 100 | 100 0% | 100 0% | 99.9 0% | 92 -8% | 100 0% |
| AdobeRGB 1998 Coverage (%) | 71 | 85.9 21% | 97.8 38% | 72 1% | 67.5 -5% | 76 7% |
| Response Times | 2% | 94% | -22% | -8% | 2% | |
| Response Time Grey 50% / Grey 80% * (ms) | 40 ? | 31 ? 22% | 2.1 ? 95% | 46.8 ? -17% | 44.8 ? -12% | 38.9 ? 3% |
| Response Time Black / White * (ms) | 22 ? | 26.1 ? -19% | 1.68 ? 92% | 28 ? -27% | 22.8 ? -4% | 21.9 ? -0% |
| PWM Frequency (Hz) | 118000 ? | 240.4 ? | 9804 ? | |||
| Screen | 23% | 175% | 31% | 25% | 18% | |
| Brightness middle (cd/m²) | 466 | 417 -11% | 336 -28% | 460 -1% | 468 0% | 494 6% |
| Brightness (cd/m²) | 442 | 395 -11% | 338 -24% | 434 -2% | 450 2% | 474 7% |
| Brightness Distribution (%) | 89 | 91 2% | 99 11% | 92 3% | 92 3% | 89 0% |
| Black Level * (cd/m²) | 0.4 | 0.39 2% | 0.02 95% | 0.27 32% | 0.23 43% | 0.28 30% |
| Contrast (:1) | 1165 | 1069 -8% | 16800 1342% | 1704 46% | 2035 75% | 1764 51% |
| Colorchecker dE 2000 * | 3.03 | 1.12 63% | 1.8 41% | 1.1 64% | 2 34% | 3.1 -2% |
| Colorchecker dE 2000 max. * | 6.68 | 2.71 59% | 3.8 43% | 4.5 33% | 5.5 18% | 4.2 37% |
| Colorchecker dE 2000 calibrated * | 2.34 | 0.77 67% | 1.8 23% | 1 57% | 1.5 36% | 1.5 36% |
| Greyscale dE 2000 * | 3.12 | 1.7 46% | 0.9 71% | 1.6 49% | 2.6 17% | 3.2 -3% |
| Gamma | 2.41 91% | 2207 0% | 2.22 99% | 2.2 100% | 2.17 101% | 2.41 91% |
| CCT | 6418 101% | 6870 95% | 6580 99% | 6475 100% | 6511 100% | 6189 105% |
| Color Space (Percent of AdobeRGB 1998) (%) | 65.7 | |||||
| Color Space (Percent of sRGB) (%) | 99.9 | |||||
| Total Average (Program / Settings) | 15% /
20% | 99% /
132% | 3% /
17% | 4% /
14% | 9% /
13% |
* ... smaller is better
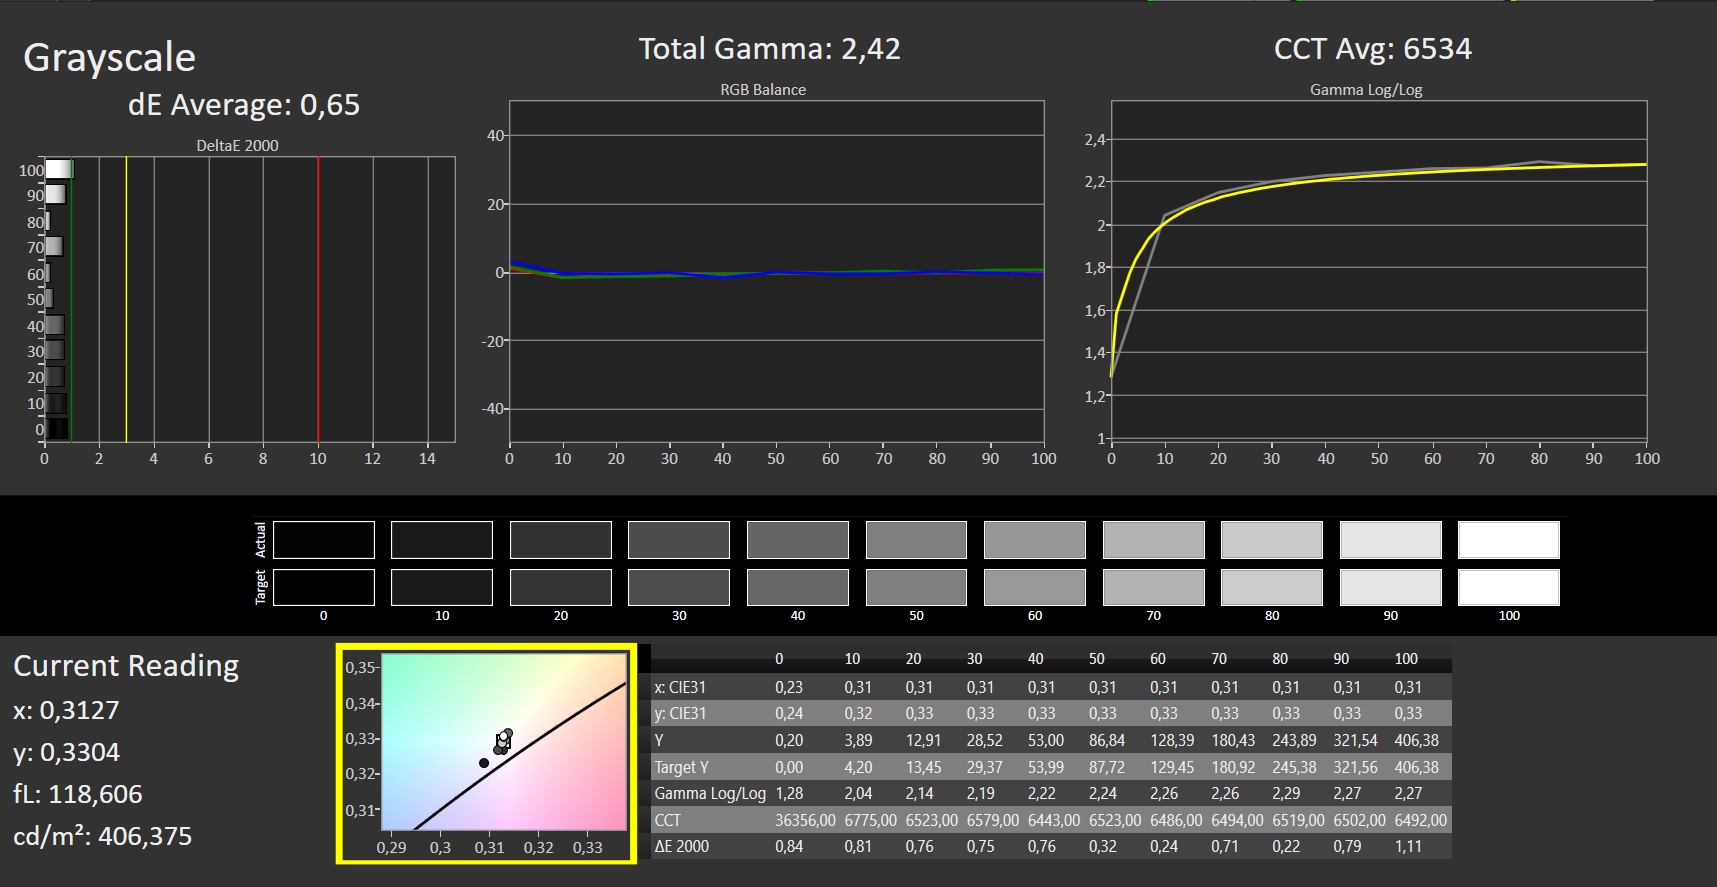
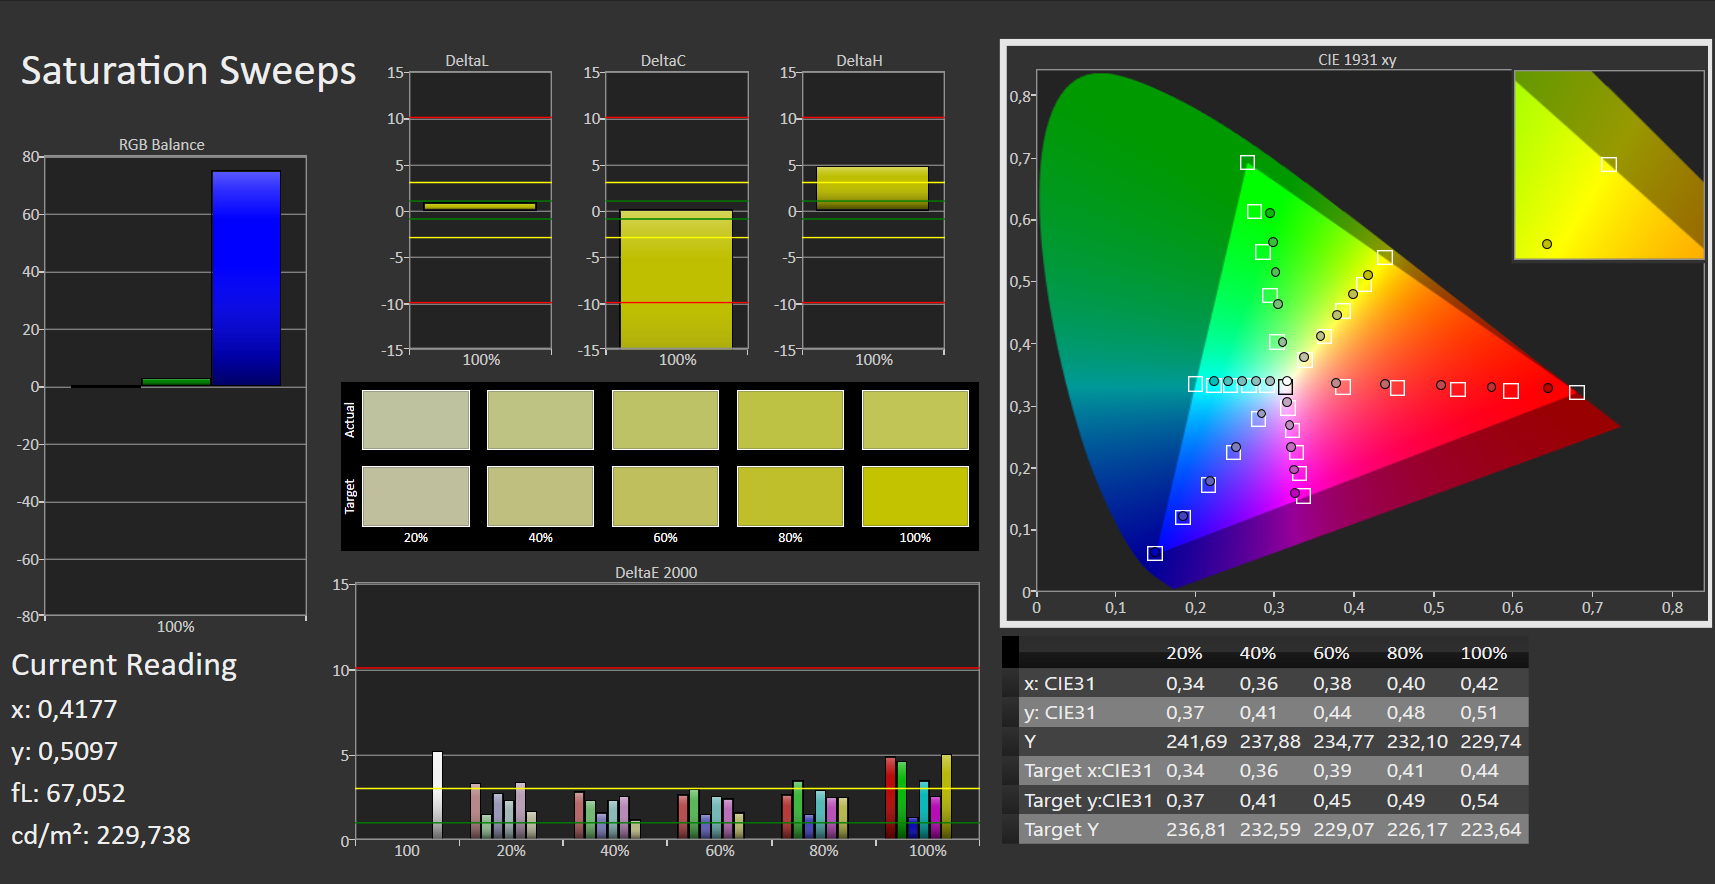
在使用专业的CalMAN软件(X-Rite i1 Pro 2)进行分析时,我们注意到两件事。虽然该面板覆盖了100%的sRGB色彩空间,但它并没有接近覆盖100%的P3色彩空间。此外,我们测量到颜色和灰度的deltaE约为3.0。这使得正常使用时没有必要进行校准。那些仍然选择这样做的用户会得到低于1.0的优秀deltaE的回报。如果你拥有一台具有相同显示选项的戴尔XPS 13,你的视觉体验可以通过应用我们校准的色彩配置文件(在上面的方框中链接)来改善。


Display Response Times
| ↔ Response Time Black to White | ||
|---|---|---|
| 22 ms ... rise ↗ and fall ↘ combined | ↗ 9 ms rise |  |
| ↘ 13 ms fall | ||
| The screen shows good response rates in our tests, but may be too slow for competitive gamers. In comparison, all tested devices range from 0.1 (minimum) to 240 (maximum) ms. » 48 % of all devices are better. This means that the measured response time is worse than the average of all tested devices (19.9 ms). | ||
| ↔ Response Time 50% Grey to 80% Grey | ||
| 40 ms ... rise ↗ and fall ↘ combined | ↗ 20 ms rise |  |
| ↘ 20 ms fall | ||
| The screen shows slow response rates in our tests and will be unsatisfactory for gamers. In comparison, all tested devices range from 0.165 (minimum) to 636 (maximum) ms. » 61 % of all devices are better. This means that the measured response time is worse than the average of all tested devices (31.1 ms). | ||
Screen Flickering / PWM (Pulse-Width Modulation)
| Screen flickering / PWM not detected | ≤ 100 % brightness setting |    | |
In comparison: 52 % of all tested devices do not use PWM to dim the display. If PWM was detected, an average of 7784 (minimum: 5 - maximum: 343500) Hz was measured. | |||
虽然哑光的FHD非触摸面板在户外以400尼特的亮度闪闪发光,但在阳光下,沉闷的反射几乎是不可避免的。

性能--XPS笔记本电脑的一半性能
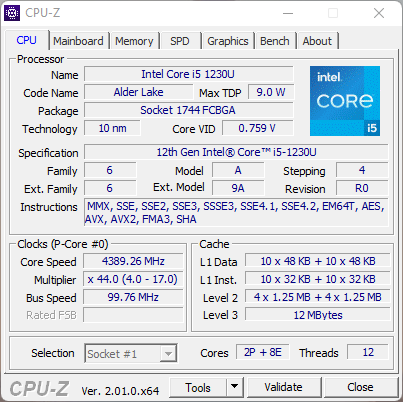
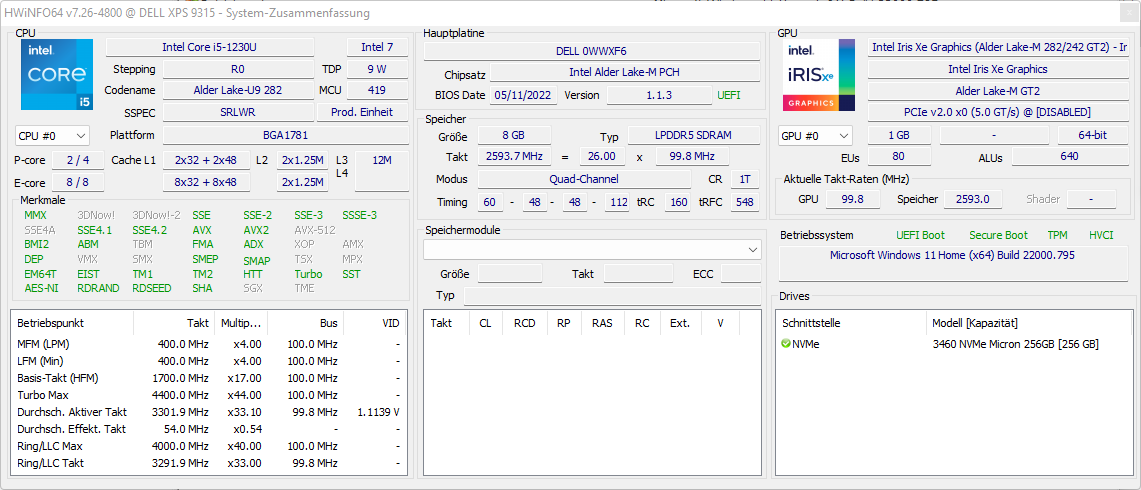
XPS 13内部的CPU是基于Alder Lake-M芯片(9W U系列),由2个性能核心(P核心)和8个效率核心(E核心)组成。由于只有P核心支持超线程,所以总共可以同时处理12个线程。P核的时钟频率为1至4.4GHz,E核的时钟频率为0.7至3.3GHz。虽然有i7-1250U(4.7 GHz)可用于非Plus XPS型号,但这并不改变其低性能的特点。如果你正在寻找性能尽可能高的新XPS,那么XPS 13 Plus是没有办法的,它只配备桤木湖-P处理器(酷睿i5-1240P,酷睿i7-1260P),各有4个性能和8个效率核心。
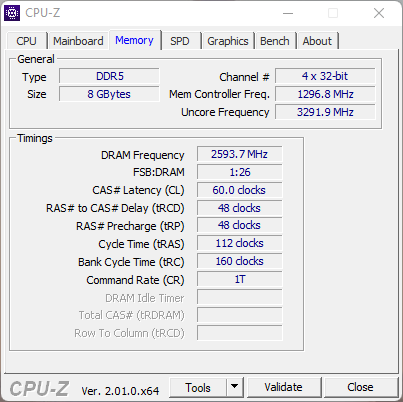
买家可以选择8、16或32GB的内存(LPDDR5-5200),其中32GB的选项只与i7处理器结合使用。这使得戴尔可以存储更少的零件,因为RAM是焊接的。
测试条件
由于不像 笔记本在我们的测试设备上没有预装电源管理器,Windows设置将不得不满足。我们使用性能配置文件进行测试,禁用节能模式。
处理器
我们在Cinebench R15循环的帮助下,检查CPU在实际连续负载下的行为。Alder Lake-U的CPU表现稳定,尽管它在测试开始时水平很低。所有竞争对手在这项测试中都更快。
通常10-15秒的性能峰值在这里完全没有。P系列CPU(XPS 13 Plus i7和i5)的情况并非如此,它们也能长期保持较高的分数。简而言之。 一台XPS 13 Plus比我们的基本型号快两倍多(i5)或三倍多(i7)。
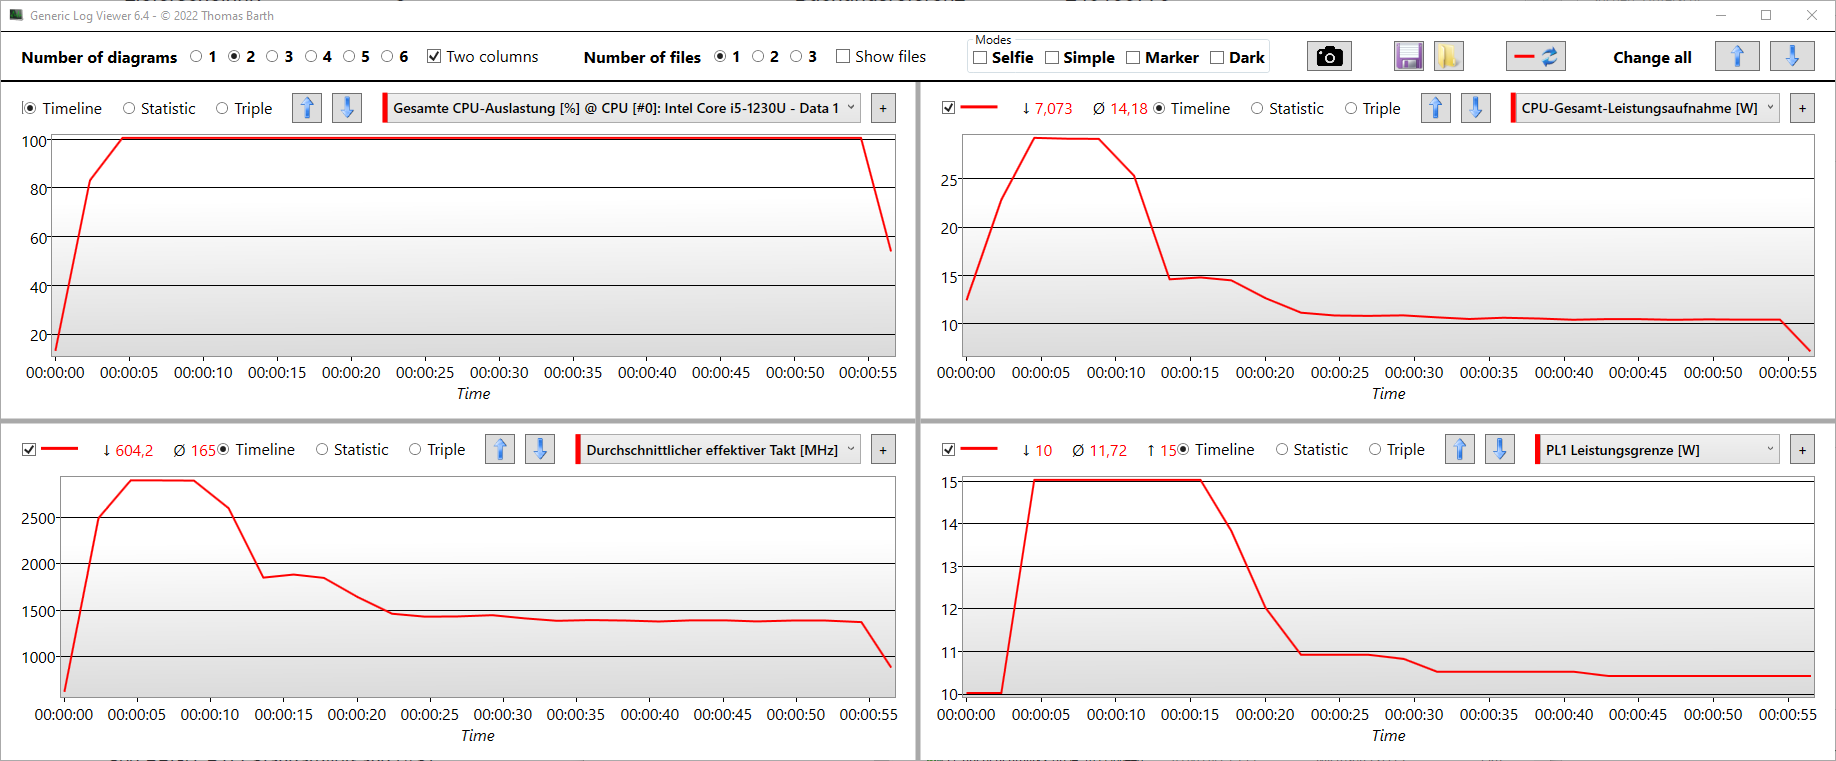
在第一个循环中,时钟速度和功耗在短短十秒钟后就会下降,PL1从15瓦下降到只有10瓦。这样的性能不会为我们的XPS赢得任何奖牌。虽然Alder Lake-U在我们的CPU性能评级中取得了平均成绩,但它在所有多线程测试和AIDA64中都排在最后。Alder Lake-P是性能爱好者的一个更好的选择,因为1240P和1260P领先,甚至能够与 AMD Ryzen 7 6800U(Zenbook S 13 OLED)的多线程基准测试。
Cinebench R15 Multi Loop
Cinebench R23: Multi Core | Single Core
Cinebench R20: CPU (Multi Core) | CPU (Single Core)
Cinebench R15: CPU Multi 64Bit | CPU Single 64Bit
7-Zip 18.03: 7z b 4 | 7z b 4 -mmt1
Geekbench 5.5: Multi-Core | Single-Core
| CPU Performance rating | |
| Average of class Subnotebook | |
| Dell XPS 13 Plus 9320 4K | |
| Asus Zenbook S 13 OLED | |
| Dell XPS 13 Plus 9320 i5-1240p | |
| Apple MacBook Air 2020 M1 Entry | |
| Huawei MateBook 13s i5 11300H | |
| Average Intel Core i5-1230U | |
| Lenovo ThinkPad X1 Nano-20UN002UGE -1! | |
| Dell XPS 13 9315, i5-1230U | |
| Cinebench R23 / Multi Core | |
| Average of class Subnotebook (1555 - 21812, n=59, last 2 years) | |
| Asus Zenbook S 13 OLED | |
| Dell XPS 13 Plus 9320 4K | |
| Dell XPS 13 Plus 9320 i5-1240p | |
| Apple MacBook Air 2020 M1 Entry | |
| Lenovo ThinkPad X1 Nano-20UN002UGE | |
| Huawei MateBook 13s i5 11300H | |
| Average Intel Core i5-1230U (3066 - 7264, n=3) | |
| Dell XPS 13 9315, i5-1230U | |
| Cinebench R23 / Single Core | |
| Average of class Subnotebook (358 - 2213, n=60, last 2 years) | |
| Dell XPS 13 Plus 9320 4K | |
| Dell XPS 13 Plus 9320 i5-1240p | |
| Apple MacBook Air 2020 M1 Entry | |
| Asus Zenbook S 13 OLED | |
| Average Intel Core i5-1230U (1135 - 1512, n=3) | |
| Dell XPS 13 9315, i5-1230U | |
| Huawei MateBook 13s i5 11300H | |
| Cinebench R20 / CPU (Multi Core) | |
| Average of class Subnotebook (579 - 8541, n=56, last 2 years) | |
| Asus Zenbook S 13 OLED | |
| Dell XPS 13 Plus 9320 4K | |
| Dell XPS 13 Plus 9320 i5-1240p | |
| Huawei MateBook 13s i5 11300H | |
| Average Intel Core i5-1230U (1175 - 2802, n=3) | |
| Apple MacBook Air 2020 M1 Entry | |
| Lenovo ThinkPad X1 Nano-20UN002UGE | |
| Dell XPS 13 9315, i5-1230U | |
| Cinebench R20 / CPU (Single Core) | |
| Average of class Subnotebook (128 - 832, n=56, last 2 years) | |
| Dell XPS 13 Plus 9320 4K | |
| Dell XPS 13 Plus 9320 i5-1240p | |
| Asus Zenbook S 13 OLED | |
| Lenovo ThinkPad X1 Nano-20UN002UGE | |
| Average Intel Core i5-1230U (441 - 580, n=3) | |
| Dell XPS 13 9315, i5-1230U | |
| Huawei MateBook 13s i5 11300H | |
| Apple MacBook Air 2020 M1 Entry | |
| Cinebench R15 / CPU Multi 64Bit | |
| Average of class Subnotebook (327 - 3345, n=56, last 2 years) | |
| Asus Zenbook S 13 OLED | |
| Dell XPS 13 Plus 9320 4K | |
| Dell XPS 13 Plus 9320 4K | |
| Dell XPS 13 Plus 9320 i5-1240p | |
| Apple MacBook Air 2020 M1 Entry | |
| Huawei MateBook 13s i5 11300H | |
| Huawei MateBook 13s i5 11300H | |
| Lenovo ThinkPad X1 Nano-20UN002UGE | |
| Average Intel Core i5-1230U (433 - 1254, n=3) | |
| Dell XPS 13 9315, i5-1230U | |
| Cinebench R15 / CPU Single 64Bit | |
| Average of class Subnotebook (72.4 - 322, n=56, last 2 years) | |
| Dell XPS 13 Plus 9320 4K | |
| Asus Zenbook S 13 OLED | |
| Dell XPS 13 Plus 9320 i5-1240p | |
| Apple MacBook Air 2020 M1 Entry | |
| Lenovo ThinkPad X1 Nano-20UN002UGE | |
| Huawei MateBook 13s i5 11300H | |
| Dell XPS 13 9315, i5-1230U | |
| Average Intel Core i5-1230U (120.1 - 221, n=3) | |
| 7-Zip 18.03 / 7z b 4 | |
| Asus Zenbook S 13 OLED | |
| Average of class Subnotebook (11668 - 77867, n=56, last 2 years) | |
| Dell XPS 13 Plus 9320 4K | |
| Dell XPS 13 Plus 9320 i5-1240p | |
| Apple MacBook Air 2020 M1 Entry | |
| Huawei MateBook 13s i5 11300H | |
| Average Intel Core i5-1230U (12470 - 34505, n=3) | |
| Lenovo ThinkPad X1 Nano-20UN002UGE | |
| Dell XPS 13 9315, i5-1230U | |
| 7-Zip 18.03 / 7z b 4 -mmt1 | |
| Average of class Subnotebook (2643 - 6699, n=58, last 2 years) | |
| Apple MacBook Air 2020 M1 Entry | |
| Asus Zenbook S 13 OLED | |
| Dell XPS 13 Plus 9320 4K | |
| Huawei MateBook 13s i5 11300H | |
| Dell XPS 13 Plus 9320 i5-1240p | |
| Lenovo ThinkPad X1 Nano-20UN002UGE | |
| Average Intel Core i5-1230U (3873 - 4870, n=3) | |
| Dell XPS 13 9315, i5-1230U | |
| Geekbench 5.5 / Multi-Core | |
| Average of class Subnotebook (2557 - 17218, n=48, last 2 years) | |
| Dell XPS 13 Plus 9320 4K | |
| Asus Zenbook S 13 OLED | |
| Apple MacBook Air 2020 M1 Entry | |
| Dell XPS 13 9315, i5-1230U | |
| Average Intel Core i5-1230U (4193 - 7309, n=3) | |
| Huawei MateBook 13s i5 11300H | |
| Lenovo ThinkPad X1 Nano-20UN002UGE | |
| Dell XPS 13 Plus 9320 i5-1240p | |
| Geekbench 5.5 / Single-Core | |
| Average of class Subnotebook (726 - 2224, n=48, last 2 years) | |
| Apple MacBook Air 2020 M1 Entry | |
| Dell XPS 13 Plus 9320 4K | |
| Dell XPS 13 9315, i5-1230U | |
| Dell XPS 13 Plus 9320 i5-1240p | |
| Average Intel Core i5-1230U (1454 - 1640, n=3) | |
| Asus Zenbook S 13 OLED | |
| Huawei MateBook 13s i5 11300H | |
| Lenovo ThinkPad X1 Nano-20UN002UGE | |
AIDA64: FP32 Ray-Trace | FPU Julia | CPU SHA3 | CPU Queen | FPU SinJulia | FPU Mandel | CPU AES | CPU ZLib | FP64 Ray-Trace | CPU PhotoWorxx
| Performance rating | |
| Asus Zenbook S 13 OLED | |
| Average of class Subnotebook | |
| Huawei MateBook 13s i5 11300H | |
| Dell XPS 13 Plus 9320 4K | |
| Dell XPS 13 Plus 9320 i5-1240p | |
| Lenovo ThinkPad X1 Nano-20UN002UGE | |
| Average Intel Core i5-1230U | |
| Dell XPS 13 9315, i5-1230U | |
| AIDA64 / FP32 Ray-Trace | |
| Average of class Subnotebook (1135 - 32888, n=57, last 2 years) | |
| Asus Zenbook S 13 OLED | |
| Huawei MateBook 13s i5 11300H | |
| Lenovo ThinkPad X1 Nano-20UN002UGE | |
| Dell XPS 13 Plus 9320 4K | |
| Dell XPS 13 Plus 9320 i5-1240p | |
| Average Intel Core i5-1230U (2344 - 6360, n=3) | |
| Dell XPS 13 9315, i5-1230U | |
| AIDA64 / FPU Julia | |
| Asus Zenbook S 13 OLED | |
| Average of class Subnotebook (5218 - 123315, n=57, last 2 years) | |
| Huawei MateBook 13s i5 11300H | |
| Lenovo ThinkPad X1 Nano-20UN002UGE | |
| Dell XPS 13 Plus 9320 4K | |
| Dell XPS 13 Plus 9320 i5-1240p | |
| Average Intel Core i5-1230U (11867 - 31714, n=3) | |
| Dell XPS 13 9315, i5-1230U | |
| AIDA64 / CPU SHA3 | |
| Average of class Subnotebook (444 - 5287, n=57, last 2 years) | |
| Asus Zenbook S 13 OLED | |
| Huawei MateBook 13s i5 11300H | |
| Lenovo ThinkPad X1 Nano-20UN002UGE | |
| Dell XPS 13 Plus 9320 4K | |
| Dell XPS 13 Plus 9320 i5-1240p | |
| Average Intel Core i5-1230U (772 - 1711, n=3) | |
| Dell XPS 13 9315, i5-1230U | |
| AIDA64 / CPU Queen | |
| Asus Zenbook S 13 OLED | |
| Dell XPS 13 Plus 9320 4K | |
| Dell XPS 13 Plus 9320 i5-1240p | |
| Average of class Subnotebook (10579 - 95002, n=50, last 2 years) | |
| Dell XPS 13 9315, i5-1230U | |
| Huawei MateBook 13s i5 11300H | |
| Average Intel Core i5-1230U (30824 - 52533, n=3) | |
| Lenovo ThinkPad X1 Nano-20UN002UGE | |
| AIDA64 / FPU SinJulia | |
| Asus Zenbook S 13 OLED | |
| Average of class Subnotebook (744 - 18418, n=57, last 2 years) | |
| Dell XPS 13 Plus 9320 4K | |
| Dell XPS 13 Plus 9320 i5-1240p | |
| Huawei MateBook 13s i5 11300H | |
| Lenovo ThinkPad X1 Nano-20UN002UGE | |
| Average Intel Core i5-1230U (2269 - 3947, n=3) | |
| Dell XPS 13 9315, i5-1230U | |
| AIDA64 / FPU Mandel | |
| Asus Zenbook S 13 OLED | |
| Average of class Subnotebook (3341 - 65433, n=57, last 2 years) | |
| Huawei MateBook 13s i5 11300H | |
| Lenovo ThinkPad X1 Nano-20UN002UGE | |
| Dell XPS 13 Plus 9320 i5-1240p | |
| Dell XPS 13 Plus 9320 4K | |
| Average Intel Core i5-1230U (6379 - 15896, n=3) | |
| Dell XPS 13 9315, i5-1230U | |
| AIDA64 / CPU AES | |
| Asus Zenbook S 13 OLED | |
| Huawei MateBook 13s i5 11300H | |
| Lenovo ThinkPad X1 Nano-20UN002UGE | |
| Average of class Subnotebook (638 - 96917, n=57, last 2 years) | |
| Dell XPS 13 Plus 9320 i5-1240p | |
| Dell XPS 13 Plus 9320 4K | |
| Average Intel Core i5-1230U (18011 - 31941, n=3) | |
| Dell XPS 13 9315, i5-1230U | |
| AIDA64 / CPU ZLib | |
| Average of class Subnotebook (164.9 - 1379, n=57, last 2 years) | |
| Dell XPS 13 Plus 9320 4K | |
| Dell XPS 13 Plus 9320 i5-1240p | |
| Asus Zenbook S 13 OLED | |
| Huawei MateBook 13s i5 11300H | |
| Average Intel Core i5-1230U (229 - 495, n=3) | |
| Lenovo ThinkPad X1 Nano-20UN002UGE | |
| Dell XPS 13 9315, i5-1230U | |
| AIDA64 / FP64 Ray-Trace | |
| Average of class Subnotebook (610 - 17495, n=57, last 2 years) | |
| Asus Zenbook S 13 OLED | |
| Huawei MateBook 13s i5 11300H | |
| Lenovo ThinkPad X1 Nano-20UN002UGE | |
| Dell XPS 13 Plus 9320 4K | |
| Dell XPS 13 Plus 9320 i5-1240p | |
| Average Intel Core i5-1230U (1328 - 3305, n=3) | |
| Dell XPS 13 9315, i5-1230U | |
| AIDA64 / CPU PhotoWorxx | |
| Average of class Subnotebook (6569 - 85600, n=57, last 2 years) | |
| Dell XPS 13 Plus 9320 4K | |
| Dell XPS 13 Plus 9320 i5-1240p | |
| Lenovo ThinkPad X1 Nano-20UN002UGE | |
| Huawei MateBook 13s i5 11300H | |
| Average Intel Core i5-1230U (17516 - 37042, n=3) | |
| Asus Zenbook S 13 OLED | |
| Dell XPS 13 9315, i5-1230U | |
系统性能
令人惊讶的是,应用性能并不像计算性能那样差,而且Alder-Lake-U相反,根据不同的类别,有时略低于平均水平,有时略高于平均水平。与XPS 13 Plus 9320 i5和i7变体相比,在大多数组件得分方面的赤字都比较明显。数字内容创作得分显示了SSD的影响。使用三星(1TB),XPS处于最顶端,美光(512GB)处于最底端。
CrossMark: Overall | Productivity | Creativity | Responsiveness
| PCMark 10 / Score | |
| Average of class Subnotebook (4920 - 9939, n=44, last 2 years) | |
| Asus Zenbook S 13 OLED | |
| Dell XPS 13 Plus 9320 4K | |
| Huawei MateBook 13s i5 11300H | |
| Dell XPS 13 Plus 9320 i5-1240p | |
| Dell XPS 13 9315, i5-1230U | |
| Lenovo ThinkPad X1 Nano-20UN002UGE | |
| Average Intel Core i5-1230U, Intel Iris Xe Graphics G7 80EUs (4001 - 4943, n=3) | |
| PCMark 10 / Essentials | |
| Asus Zenbook S 13 OLED | |
| Dell XPS 13 Plus 9320 4K | |
| Average of class Subnotebook (8552 - 11646, n=44, last 2 years) | |
| Dell XPS 13 9315, i5-1230U | |
| Huawei MateBook 13s i5 11300H | |
| Lenovo ThinkPad X1 Nano-20UN002UGE | |
| Average Intel Core i5-1230U, Intel Iris Xe Graphics G7 80EUs (8348 - 10139, n=3) | |
| Dell XPS 13 Plus 9320 i5-1240p | |
| PCMark 10 / Productivity | |
| Average of class Subnotebook (5435 - 16606, n=44, last 2 years) | |
| Asus Zenbook S 13 OLED | |
| Dell XPS 13 Plus 9320 4K | |
| Dell XPS 13 Plus 9320 i5-1240p | |
| Dell XPS 13 9315, i5-1230U | |
| Huawei MateBook 13s i5 11300H | |
| Average Intel Core i5-1230U, Intel Iris Xe Graphics G7 80EUs (5735 - 6692, n=3) | |
| Lenovo ThinkPad X1 Nano-20UN002UGE | |
| PCMark 10 / Digital Content Creation | |
| Average of class Subnotebook (5722 - 13779, n=44, last 2 years) | |
| Asus Zenbook S 13 OLED | |
| Dell XPS 13 Plus 9320 4K | |
| Dell XPS 13 Plus 9320 i5-1240p | |
| Huawei MateBook 13s i5 11300H | |
| Lenovo ThinkPad X1 Nano-20UN002UGE | |
| Dell XPS 13 9315, i5-1230U | |
| Average Intel Core i5-1230U, Intel Iris Xe Graphics G7 80EUs (3632 - 4833, n=3) | |
| CrossMark / Overall | |
| Dell XPS 13 Plus 9320 4K | |
| Average of class Subnotebook (365 - 2356, n=59, last 2 years) | |
| Asus Zenbook S 13 OLED | |
| Dell XPS 13 Plus 9320 i5-1240p | |
| Apple MacBook Air 2020 M1 Entry | |
| Huawei MateBook 13s i5 11300H | |
| Dell XPS 13 9315, i5-1230U | |
| Average Intel Core i5-1230U, Intel Iris Xe Graphics G7 80EUs (1117 - 1383, n=3) | |
| CrossMark / Productivity | |
| Dell XPS 13 Plus 9320 4K | |
| Average of class Subnotebook (364 - 2277, n=59, last 2 years) | |
| Asus Zenbook S 13 OLED | |
| Huawei MateBook 13s i5 11300H | |
| Dell XPS 13 Plus 9320 i5-1240p | |
| Dell XPS 13 9315, i5-1230U | |
| Average Intel Core i5-1230U, Intel Iris Xe Graphics G7 80EUs (1187 - 1356, n=3) | |
| Apple MacBook Air 2020 M1 Entry | |
| CrossMark / Creativity | |
| Dell XPS 13 Plus 9320 4K | |
| Average of class Subnotebook (372 - 2743, n=59, last 2 years) | |
| Dell XPS 13 Plus 9320 i5-1240p | |
| Apple MacBook Air 2020 M1 Entry | |
| Asus Zenbook S 13 OLED | |
| Dell XPS 13 9315, i5-1230U | |
| Average Intel Core i5-1230U, Intel Iris Xe Graphics G7 80EUs (1095 - 1469, n=3) | |
| Huawei MateBook 13s i5 11300H | |
| CrossMark / Responsiveness | |
| Huawei MateBook 13s i5 11300H | |
| Dell XPS 13 Plus 9320 4K | |
| Average of class Subnotebook (312 - 1854, n=59, last 2 years) | |
| Dell XPS 13 Plus 9320 i5-1240p | |
| Asus Zenbook S 13 OLED | |
| Dell XPS 13 9315, i5-1230U | |
| Average Intel Core i5-1230U, Intel Iris Xe Graphics G7 80EUs (990 - 1224, n=3) | |
| Apple MacBook Air 2020 M1 Entry | |
| PCMark 10 Score | 4633 points | |
Help | ||
| AIDA64 / Memory Copy | |
| Average of class Subnotebook (14554 - 131023, n=57, last 2 years) | |
| Dell XPS 13 Plus 9320 4K | |
| Dell XPS 13 Plus 9320 i5-1240p | |
| Huawei MateBook 13s i5 11300H | |
| Dell XPS 13 9315, i5-1230U | |
| Average Intel Core i5-1230U (32539 - 60944, n=3) | |
| Asus Zenbook S 13 OLED | |
| Lenovo ThinkPad X1 Nano-20UN002UGE | |
| AIDA64 / Memory Read | |
| Average of class Subnotebook (15948 - 127174, n=57, last 2 years) | |
| Dell XPS 13 Plus 9320 i5-1240p | |
| Dell XPS 13 Plus 9320 4K | |
| Dell XPS 13 9315, i5-1230U | |
| Huawei MateBook 13s i5 11300H | |
| Average Intel Core i5-1230U (31342 - 60435, n=3) | |
| Lenovo ThinkPad X1 Nano-20UN002UGE | |
| Asus Zenbook S 13 OLED | |
| AIDA64 / Memory Write | |
| Average of class Subnotebook (15709 - 135141, n=57, last 2 years) | |
| Dell XPS 13 Plus 9320 4K | |
| Dell XPS 13 9315, i5-1230U | |
| Dell XPS 13 Plus 9320 i5-1240p | |
| Huawei MateBook 13s i5 11300H | |
| Average Intel Core i5-1230U (33224 - 65665, n=3) | |
| Lenovo ThinkPad X1 Nano-20UN002UGE | |
| Asus Zenbook S 13 OLED | |
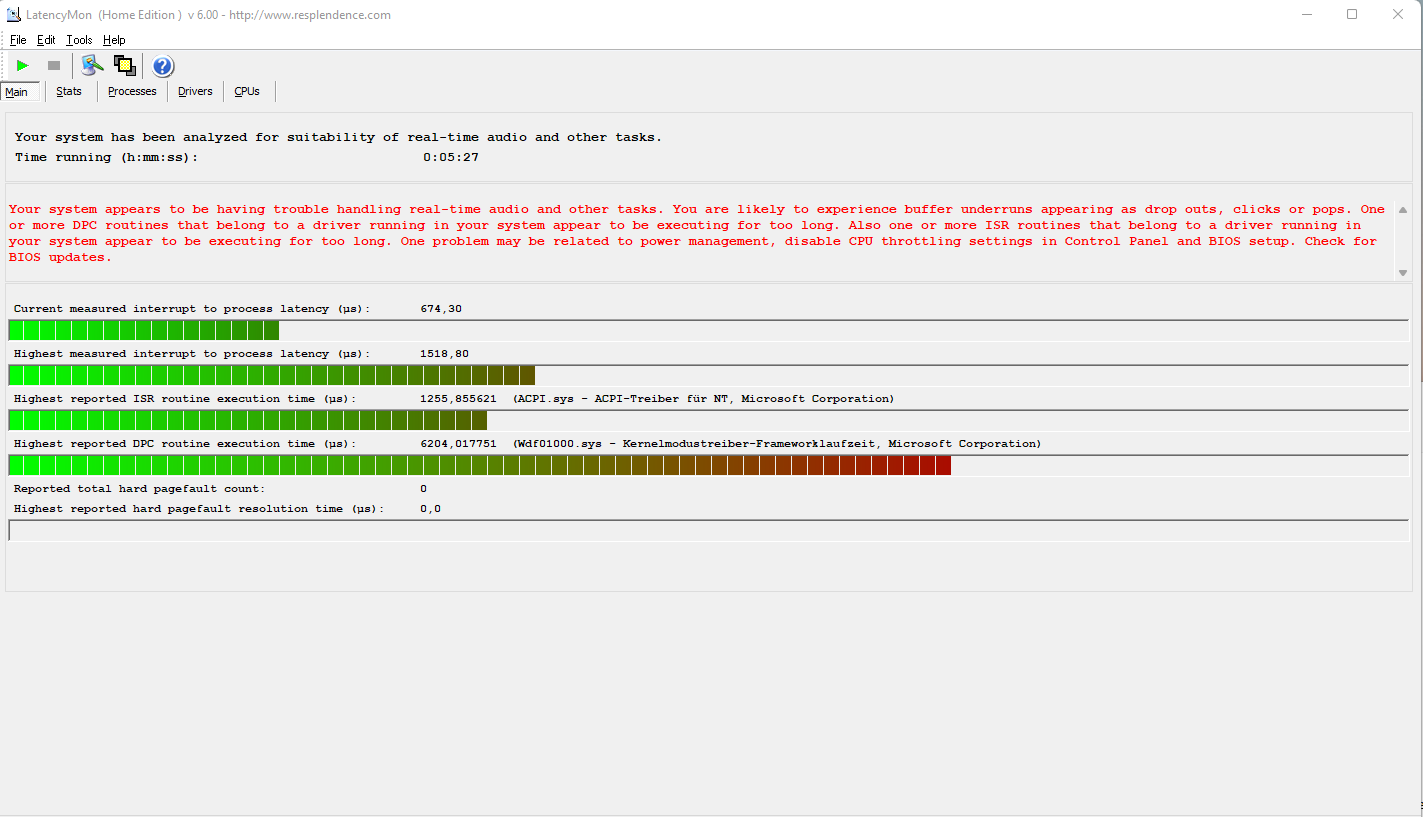
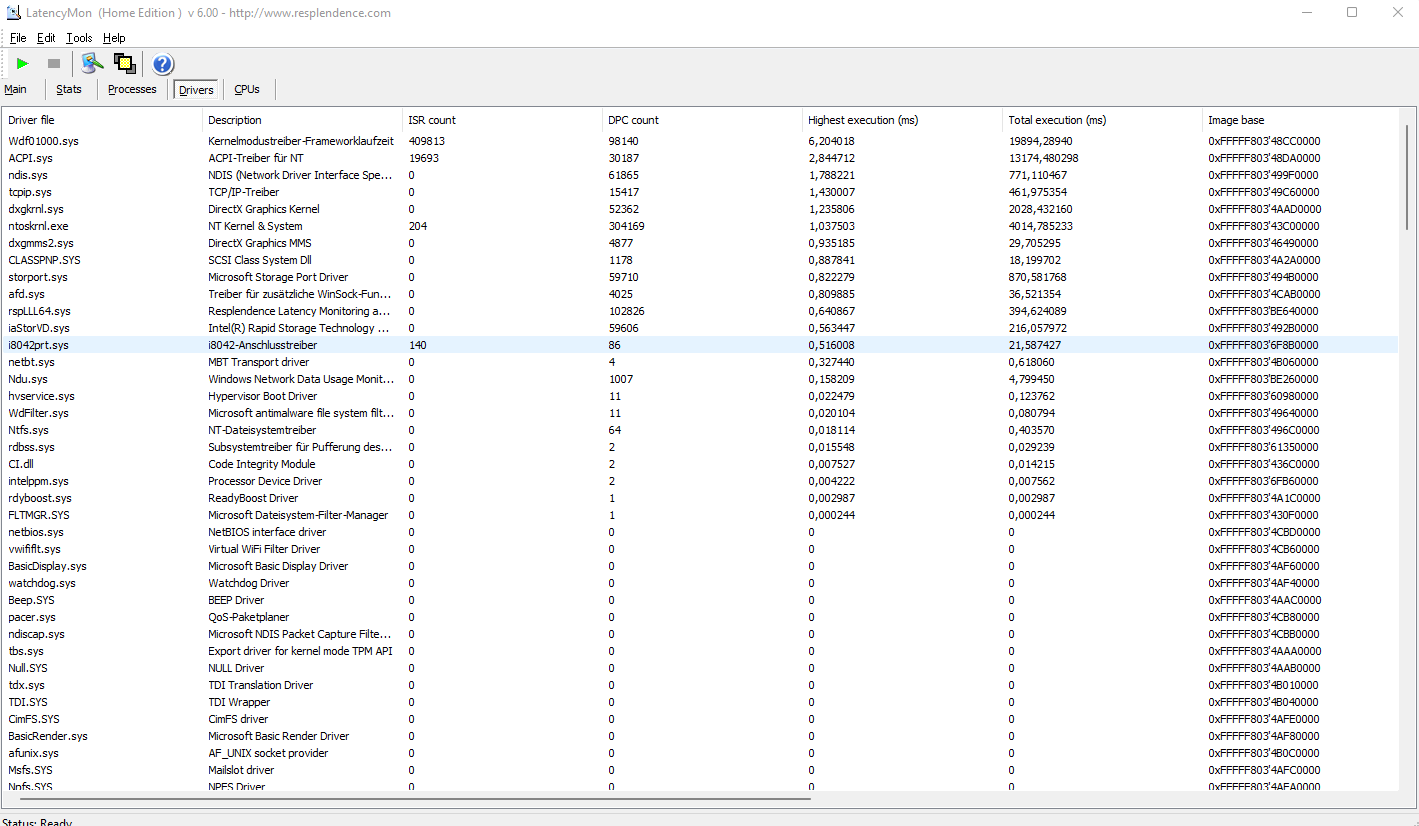
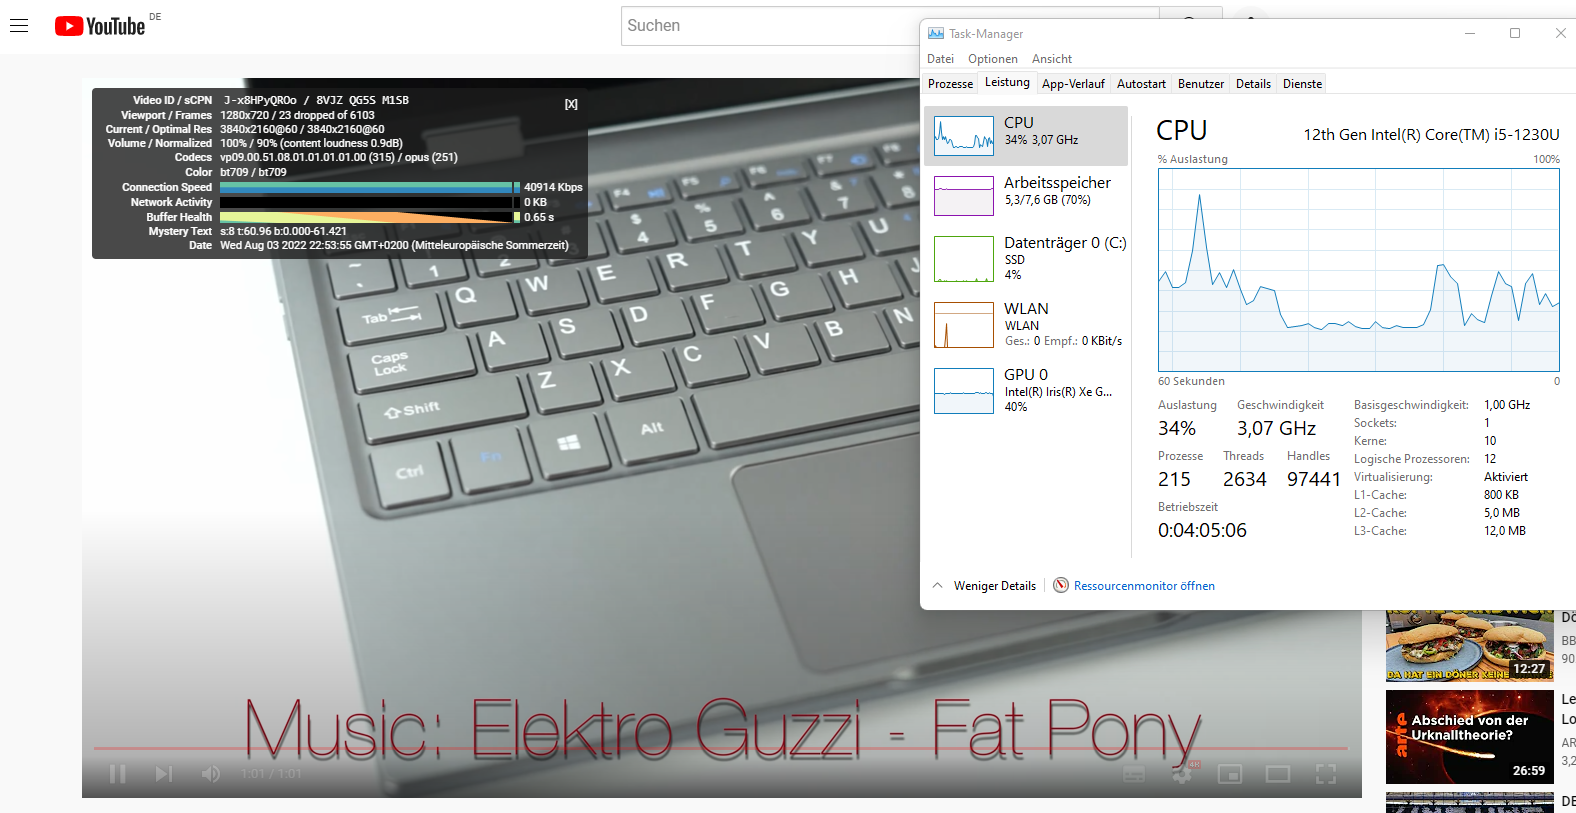
DPC延迟
XPS 13的DPC延迟没有得到控制,在其目前的驱动和硬件状态下,它们超过了所有的竞争对手。内核模式的驱动程序是最明显的,ACPI紧随其后。因此,实时音频和视频编辑不可能在 ALDER LAKE-UXPS。我们在播放4K YouTube视频时遇到了丢帧的问题。播放上述视频时,iGPU的负荷约为46%。
| DPC Latencies / LatencyMon - interrupt to process latency (max), Web, Youtube, Prime95 | |
| Dell XPS 13 9315, i5-1230U | |
| Dell XPS 13 Plus 9320 i5-1240p | |
| Lenovo ThinkPad X1 Nano-20UN002UGE | |
| Huawei MateBook 13s i5 11300H | |
| Dell XPS 13 Plus 9320 4K | |
| Asus Zenbook S 13 OLED | |
* ... smaller is better
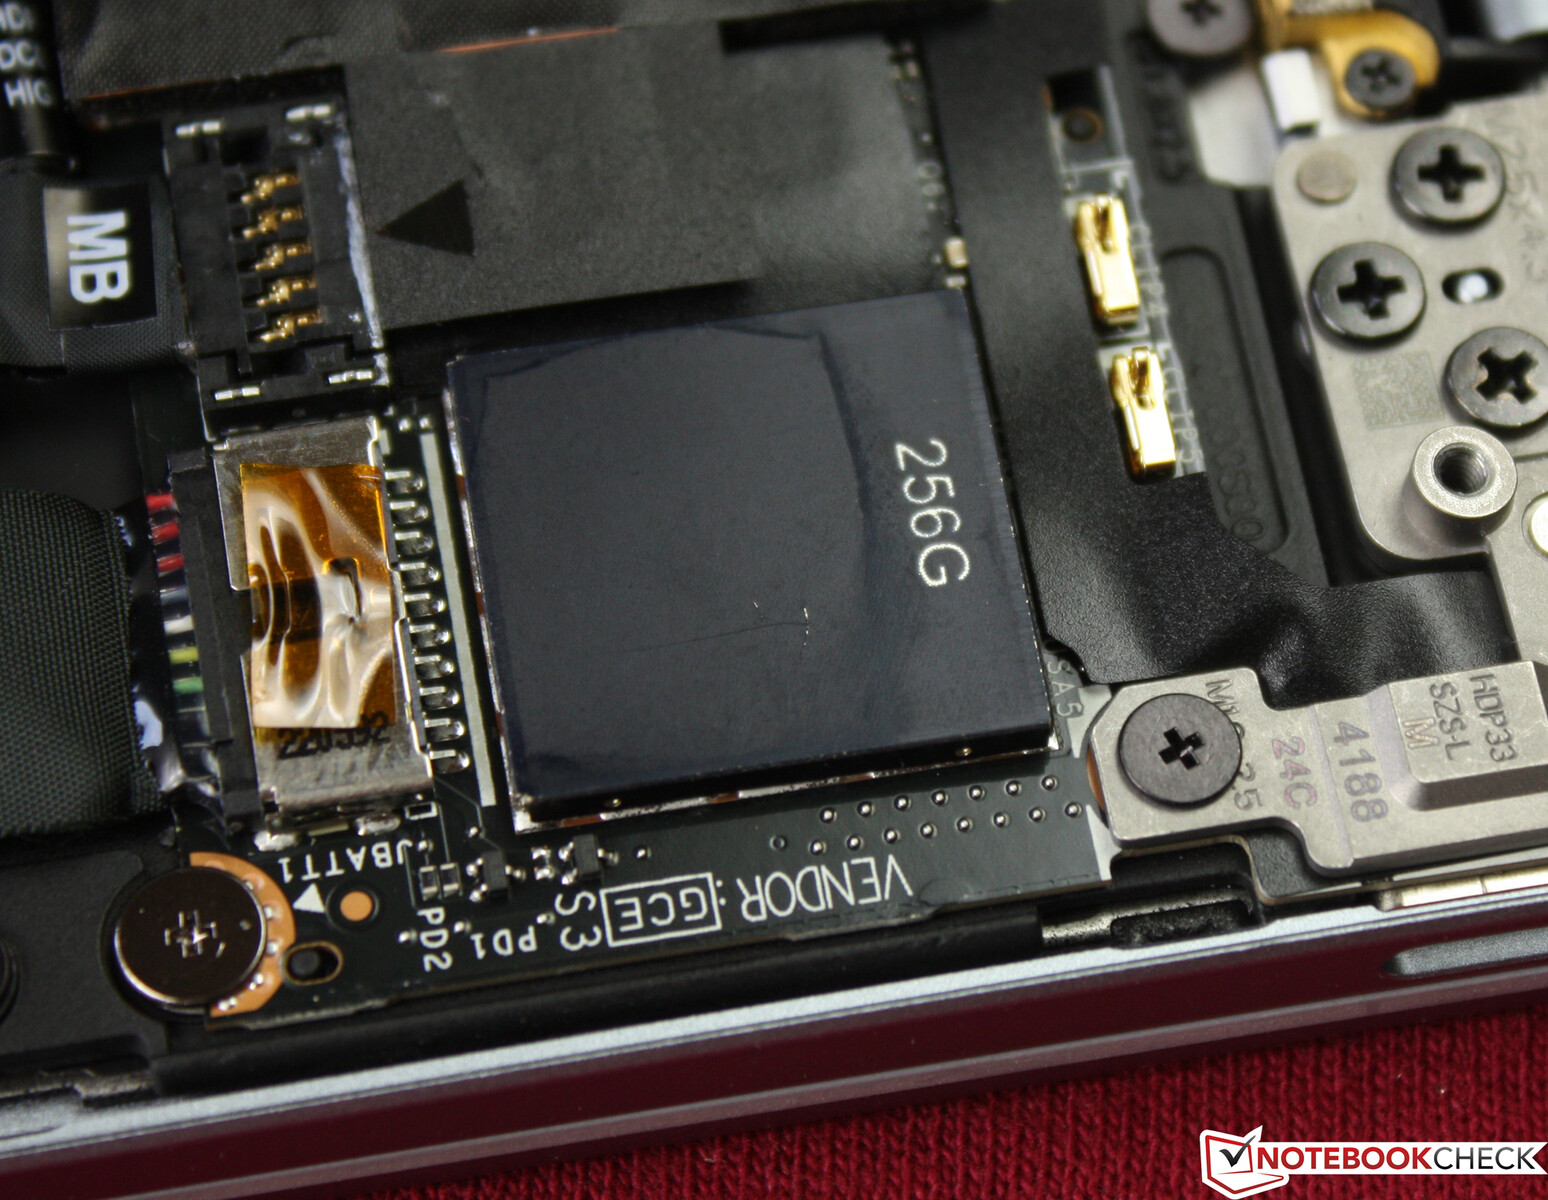
存储解决方案
戴尔使用的是美光公司的固态硬盘。这款固态硬盘没有采用开槽的M.2形式,而是采用固定的板载模式。根据美光的说法,该固态硬盘支持PCIe Gen4。XPS 13 Plus使用M.2-2280三星芯片。我们的测试设备的存储容量只有256GB,其中只有123GB在初始设置后可供用户使用。
在我们的存储基准测试中,美光的型号始终排在最后,远远落后于菲森电子和三星芯片在竞争对手的笔记本电脑和戴尔自己的XPS 13 Plus中能够达到的水平。区别再次被明确:如果性能是你所追求的,XPS 13 Plus才是你的选择。
更多的比较和基准可以在我们的 比较表.

* ... smaller is better
Disk Throttling: DiskSpd Read Loop, Queue Depth 8
GPU性能
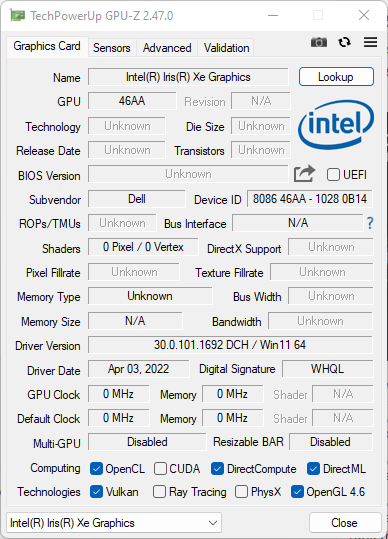
Alder Lake CPU仍然依赖著名的 Iris Xe Graphics G7首次与Tiger Lake 处理器一起推出。然而,这里的性能较慢,我们测试设备中的Iris Xe在所有基准测试中都排在最后。Iris Xe Graphics G7 80EUs是一个受欢迎的iGPU选择,在这种情况下性能不理想。与Iris Xe Graphics G7 96EUs相比,其不足之处在于 Iris Xe Graphics G7 96EUs(Alder Lake P, XPS 13 Plus)的差距在20%和80%之间。
| 3DMark 06 Standard Score | 15617 points | |
| 3DMark 11 Performance | 4260 points | |
| 3DMark Cloud Gate Standard Score | 14350 points | |
| 3DMark Fire Strike Score | 3048 points | |
| 3DMark Time Spy Score | 1053 points | |
Help | ||
游戏性能
XPS 13不适合用于游戏目的,我们甚至在2022年的《鬼丝东京》等游戏中遇到了视觉上的故障和崩溃。正如FPS图所示,FPS和iGPU时钟速度(100-800MHz)都波动很大。由于它对高分辨率视频来说绰绰有余,Iris Xe Graphics仍然适合于日常的多媒体使用。在电池模式下,GPU性能稍有限制。 更多GPU基准测试可以在这里找到.
| Ghostwire Tokyo - 1920x1080 Low Settings | |
| Dell XPS 13 9315, i5-1230U | |
| Average Intel Iris Xe Graphics G7 80EUs (13.5 - 25.8, n=2) | |
Witcher 3 FPS Graph
| low | med. | high | ultra | |
|---|---|---|---|---|
| GTA V (2015) | 31 | 10 | ||
| The Witcher 3 (2015) | 67 | 47 | 22 | 8 |
| Final Fantasy XV Benchmark (2018) | 18.9 | 10.8 | 5.24 | |
| Far Cry 5 (2018) | 22 | 14 | ||
| Strange Brigade (2018) | 47.5 | 6 | 17.8 | |
| Ghostwire Tokyo (2022) | 25 severe graphical problems (out of video memory) | 19 severe graphical problems (out of video memory) |
排放 - 最经济的桤木湖处理器
系统噪音
在要求不高的情况下,单个风扇经常空转,即使它处于活动状态,其浅浅的呼啸声也几乎无法察觉。在大多数日常任务中都是这种情况,如网页浏览、One Drive图片同步或视频播放。在要求更高的情况下,事情很快就会变得嘈杂。在我们的压力测试中和CPU利用率较高时,我们测得的最大噪音为39.5 dB(A)。至少,非常明显的风扇噪音并没有因为恼人的音调而恶化。
Noise level
| Idle |
| 26 / 26 / 27.5 dB(A) |
| Load |
| 39.5 / 39.6 dB(A) |
 | ||
30 dB silent 40 dB(A) audible 50 dB(A) loud |
||
min: | ||
| Dell XPS 13 9315, i5-1230U Iris Xe G7 80EUs, i5-1230U, Micron 3460 256 GB Soldered | Dell XPS 13 Plus 9320 4K Iris Xe G7 96EUs, i7-1260P, Samsung PM9A1 MZVL21T0HCLR | Dell XPS 13 Plus 9320 i5-1240p Iris Xe G7 80EUs, i5-1240P, Micron 3400 MTFDKBA512TFH 512GB | Asus Zenbook S 13 OLED Radeon 680M, R7 6800U, Samsung PM9A1 MZVL21T0HCLR | Lenovo ThinkPad X1 Nano-20UN002UGE Iris Xe G7 96EUs, i7-1160G7, WDC PC SN530 SDBPNPZ-512G | Huawei MateBook 13s i5 11300H Iris Xe G7 80EUs, i5-11300H, Phison Electronics PS5012 | |
|---|---|---|---|---|---|---|
| Noise | -1% | -2% | 7% | 3% | 5% | |
| off / environment * (dB) | 26 | 24.4 6% | 26 -0% | 24 8% | 24.9 4% | 24.5 6% |
| Idle Minimum * (dB) | 26 | 24.4 6% | 26.2 -1% | 24 8% | 24.9 4% | 24.5 6% |
| Idle Average * (dB) | 26 | 24.4 6% | 26.2 -1% | 24 8% | 26.3 -1% | 24.5 6% |
| Idle Maximum * (dB) | 27.5 | 25.5 7% | 26.2 5% | 24 13% | 31.8 -16% | 28 -2% |
| Load Average * (dB) | 39.5 | 40.4 -2% | 38.4 3% | 33.1 16% | 34.3 13% | 35.9 9% |
| Witcher 3 ultra * (dB) | 39.6 | 45.5 -15% | 40.2 -2% | 34.3 13% | 35.9 9% | |
| Load Maximum * (dB) | 39.6 | 45.5 -15% | 47.1 -19% | 41.7 -5% | 37.5 5% | 38.6 3% |
* ... smaller is better
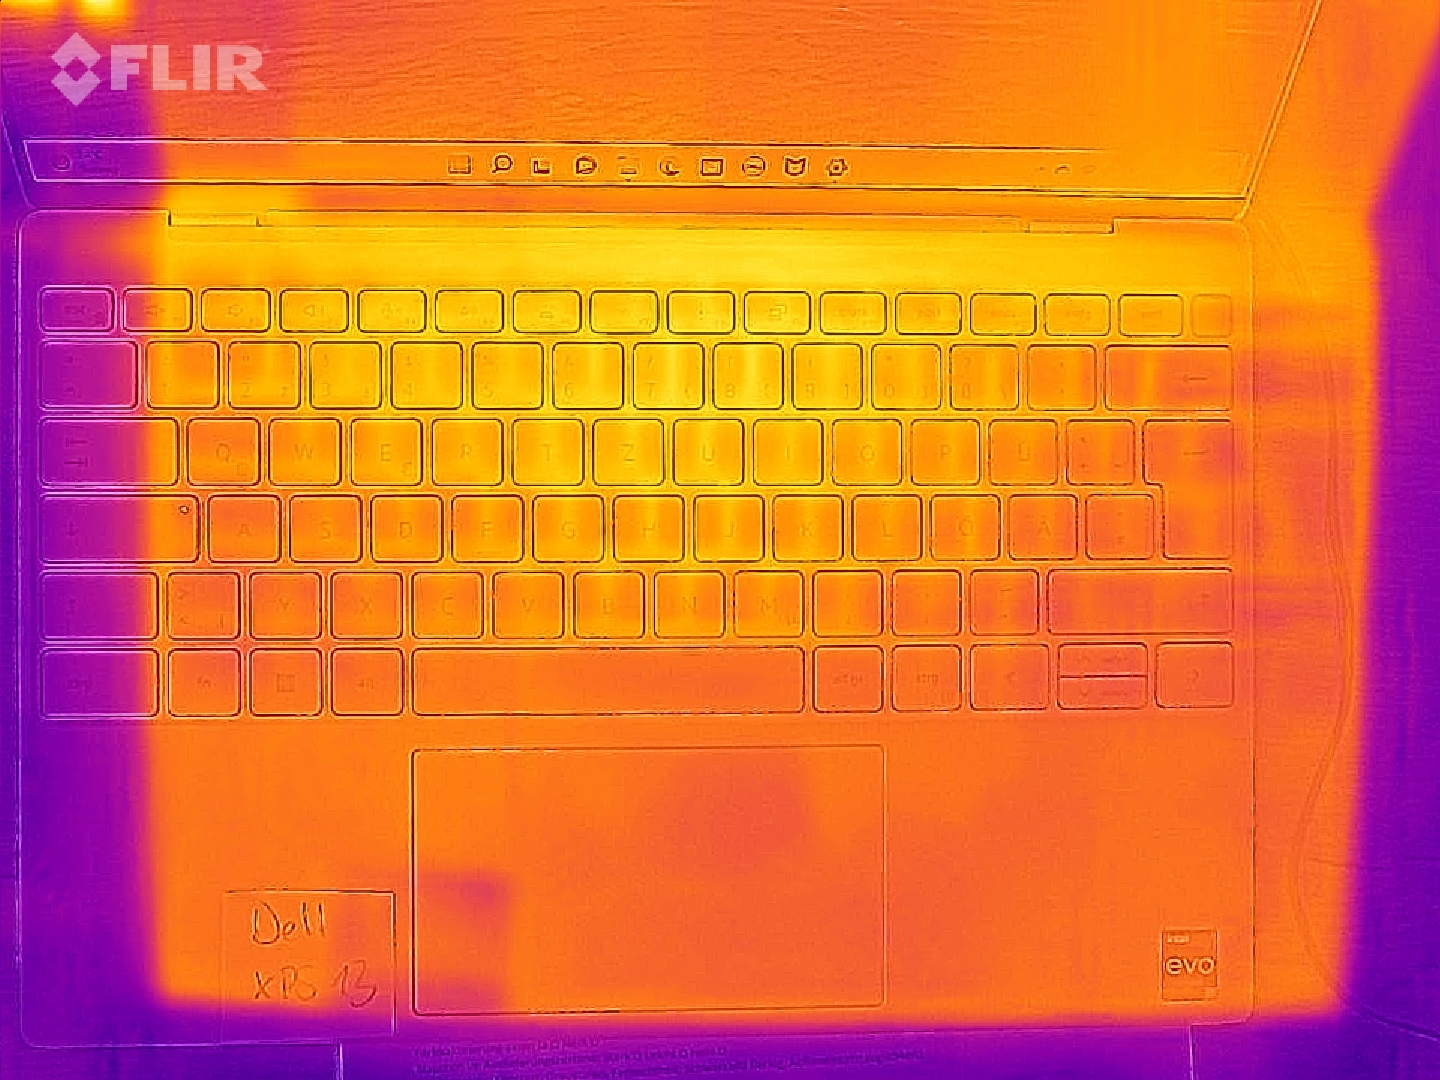
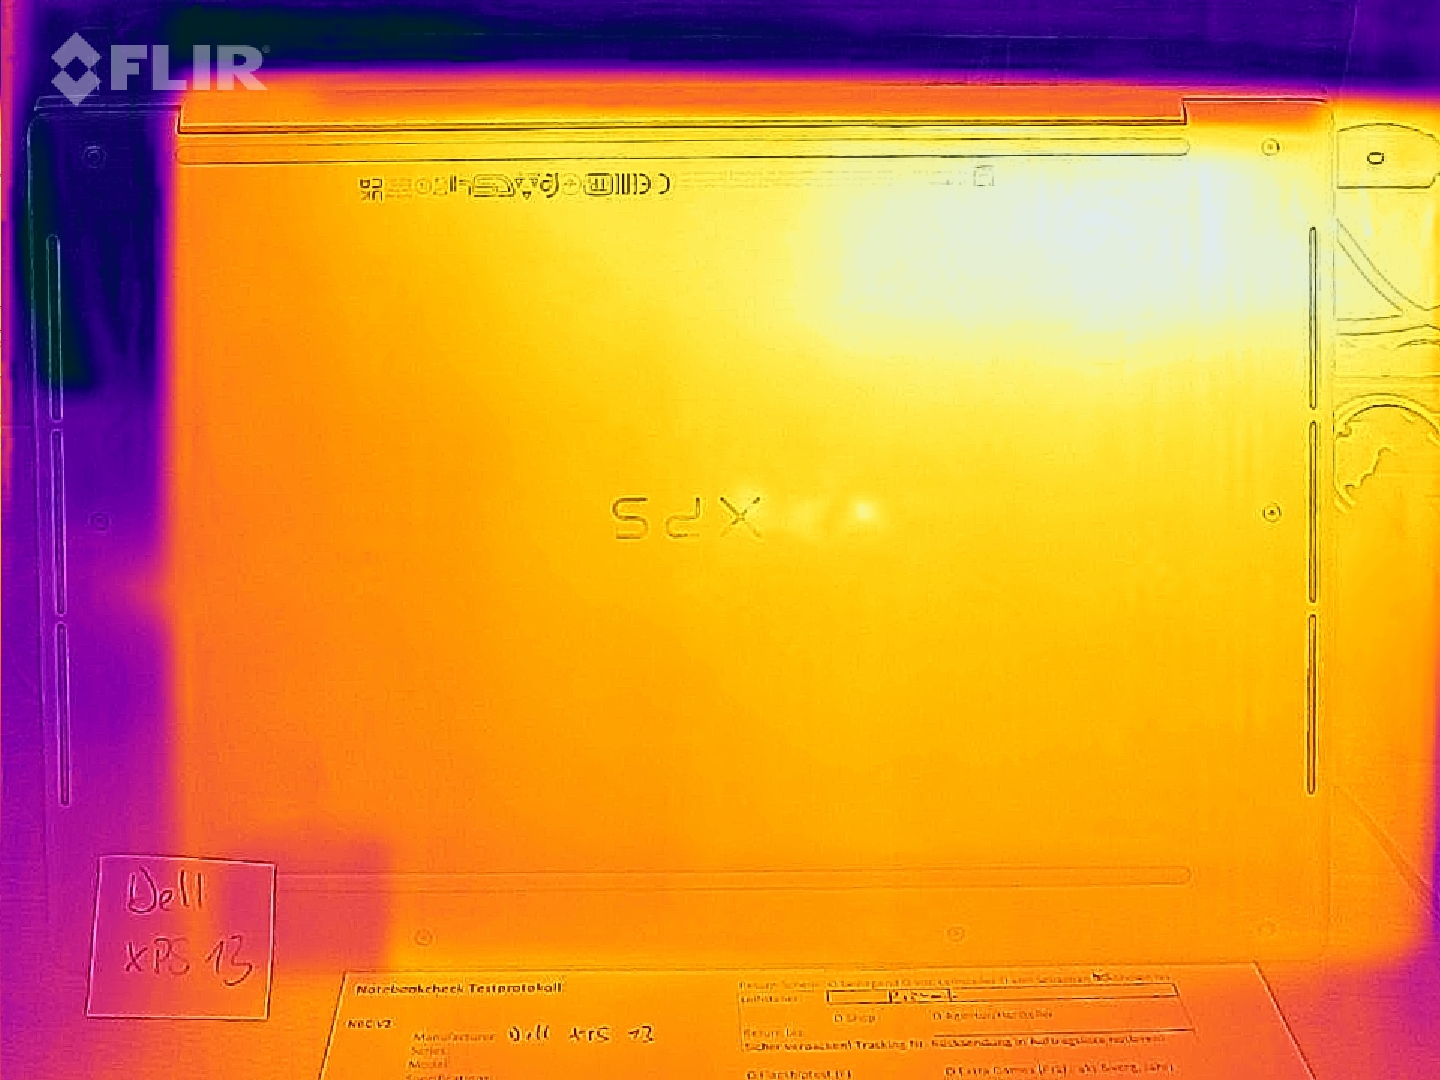
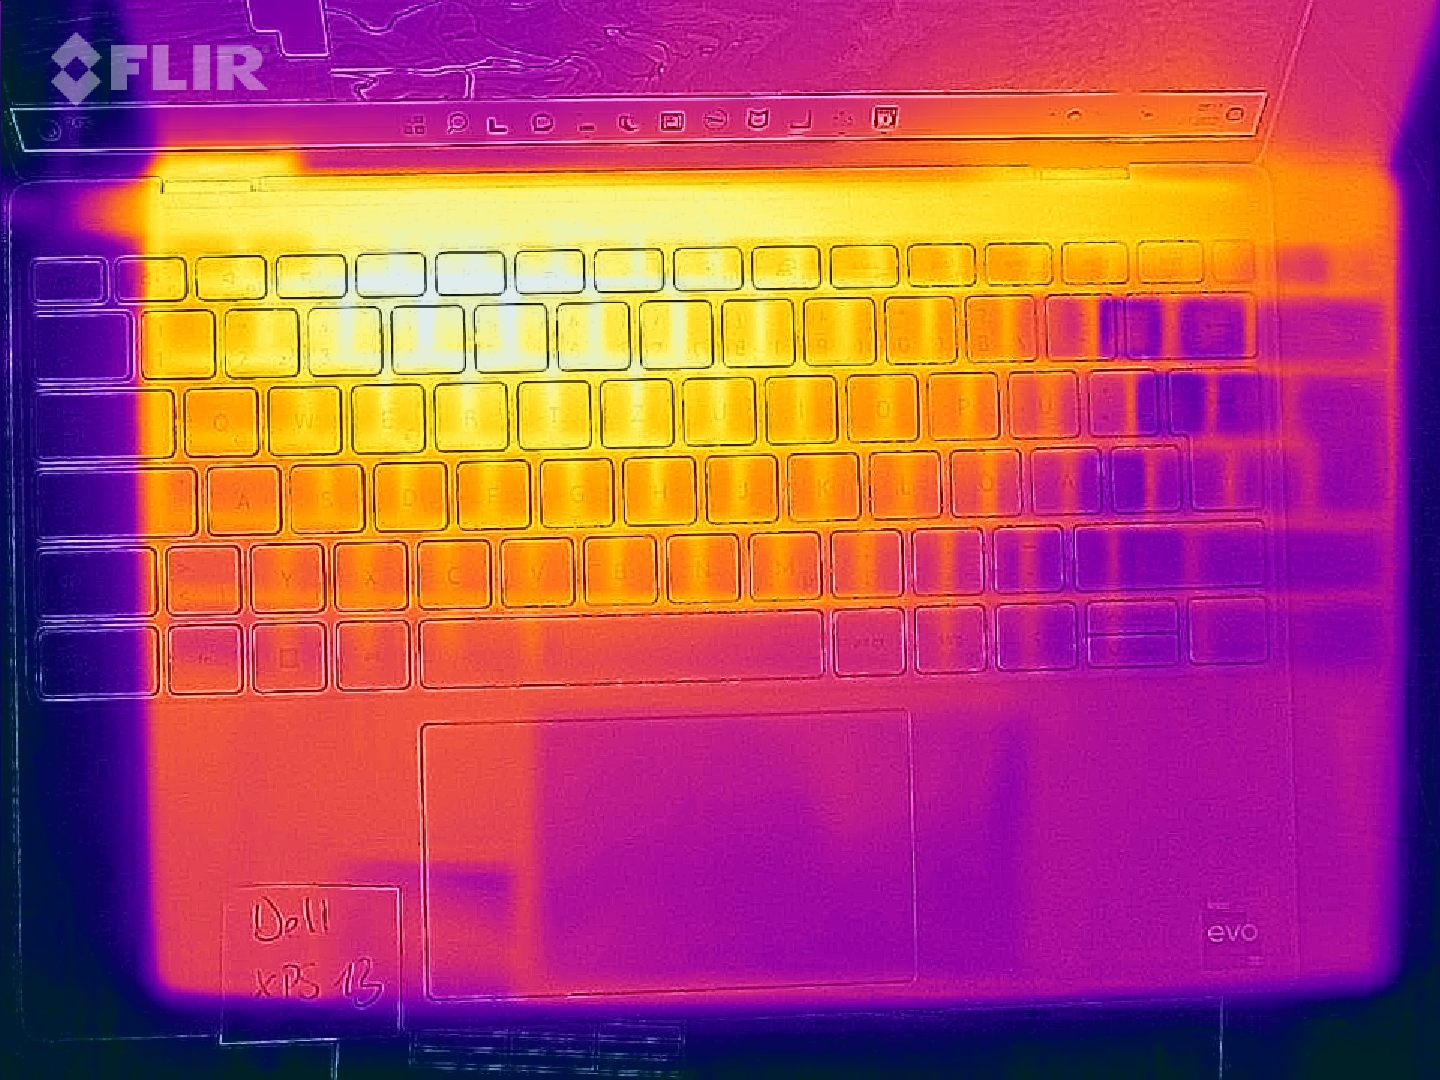
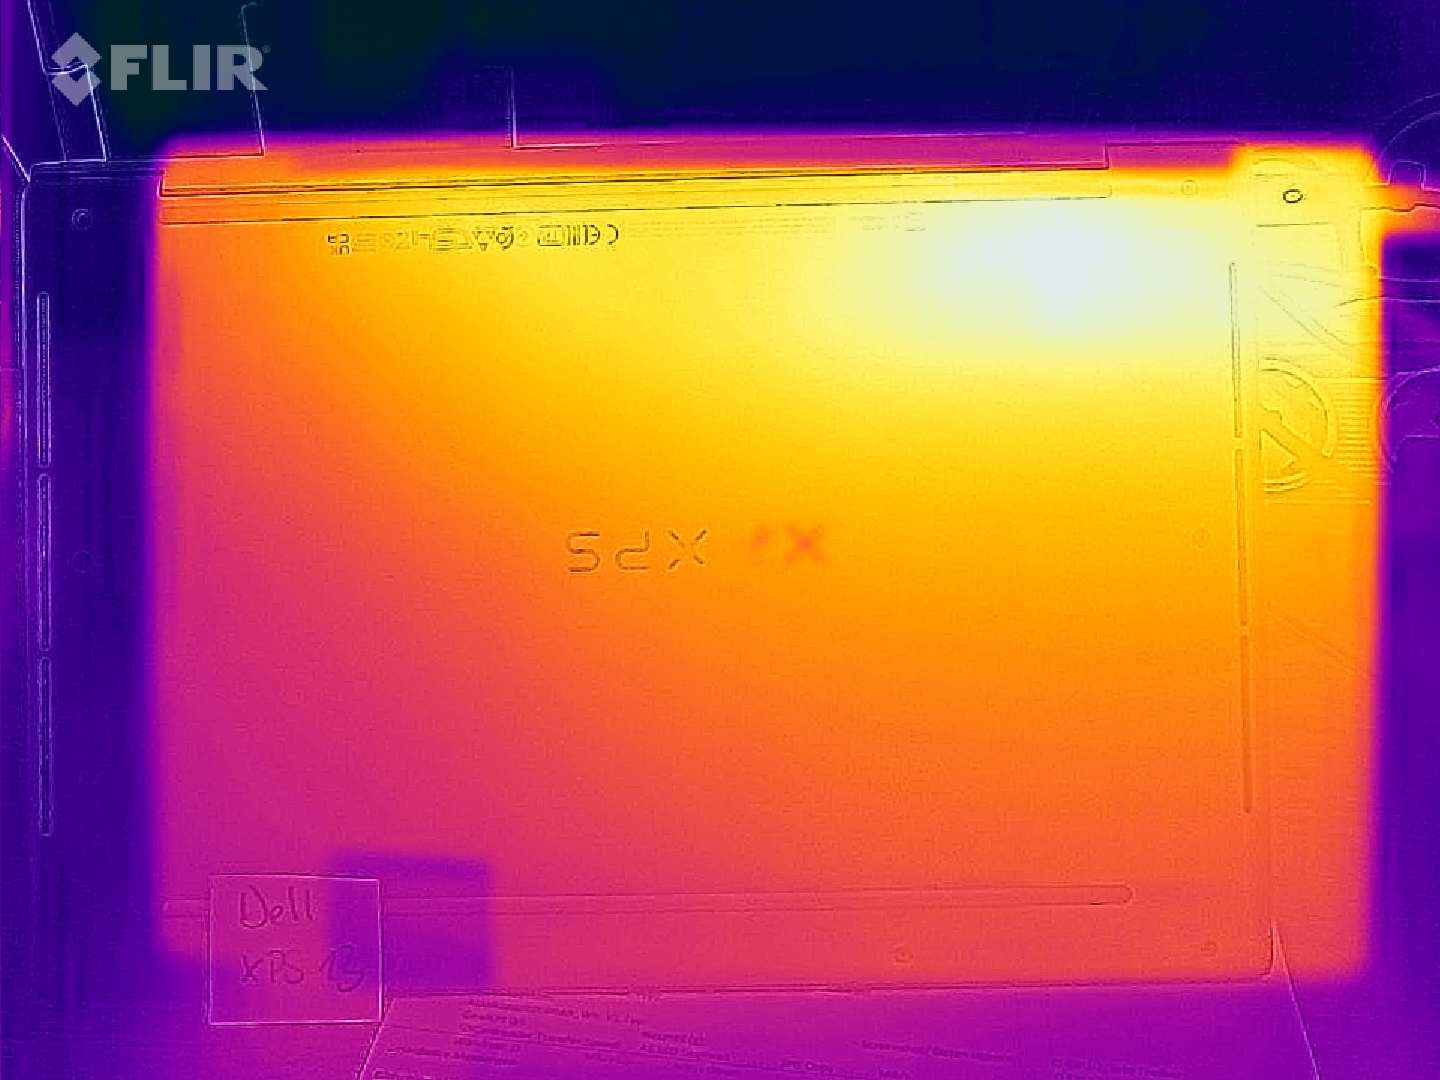
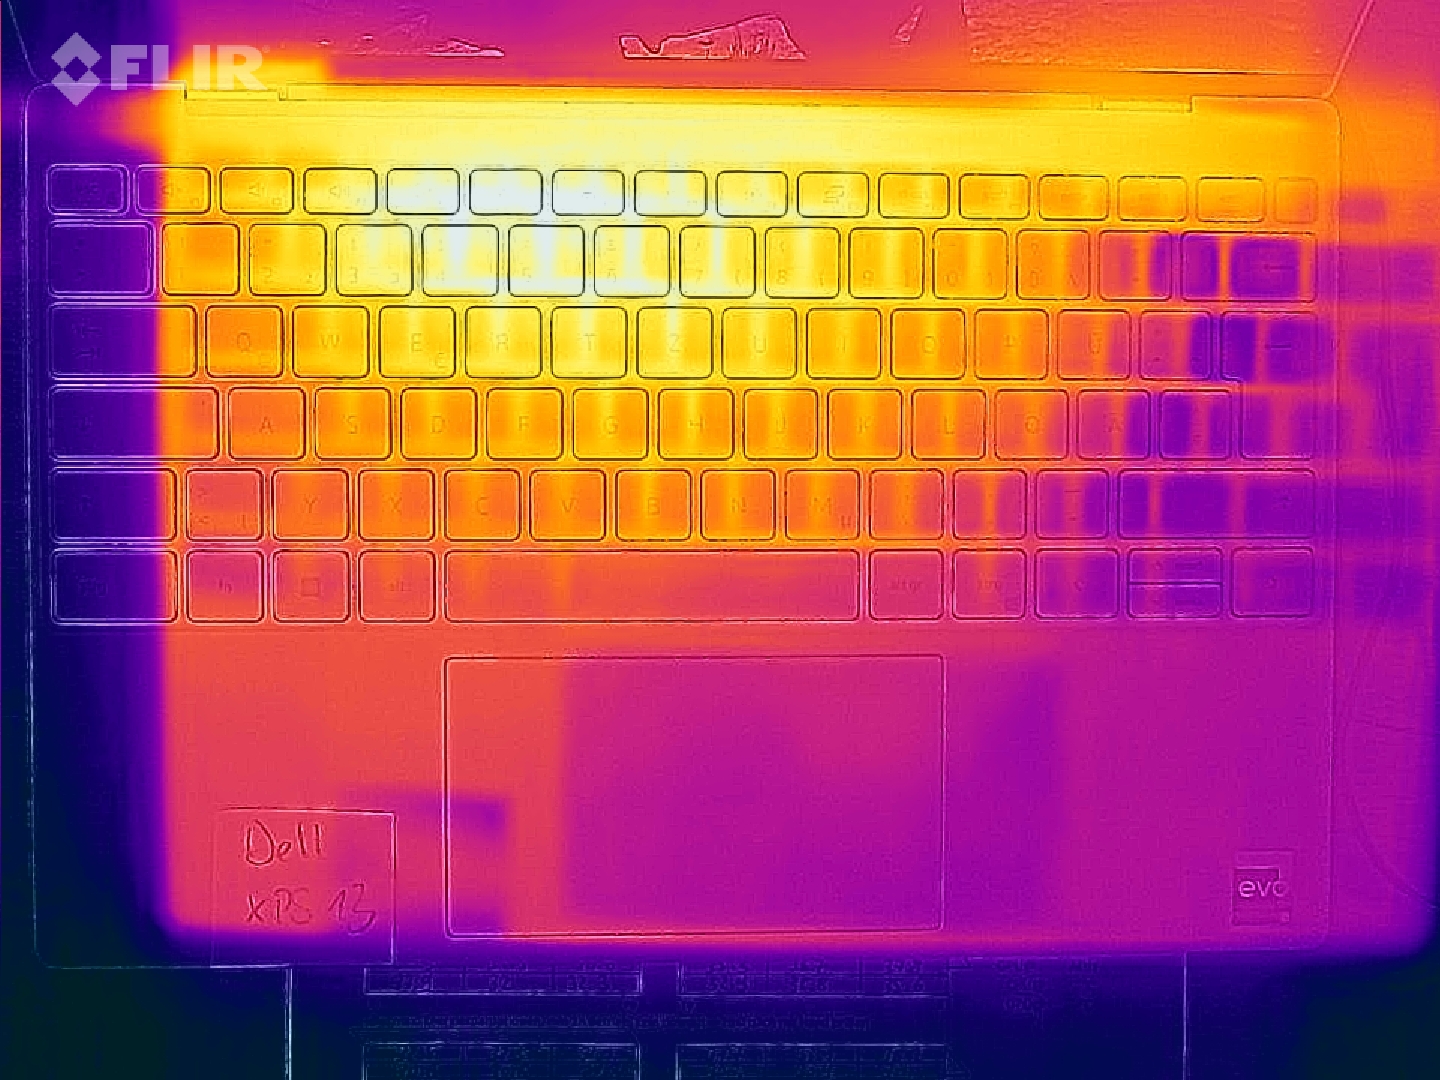
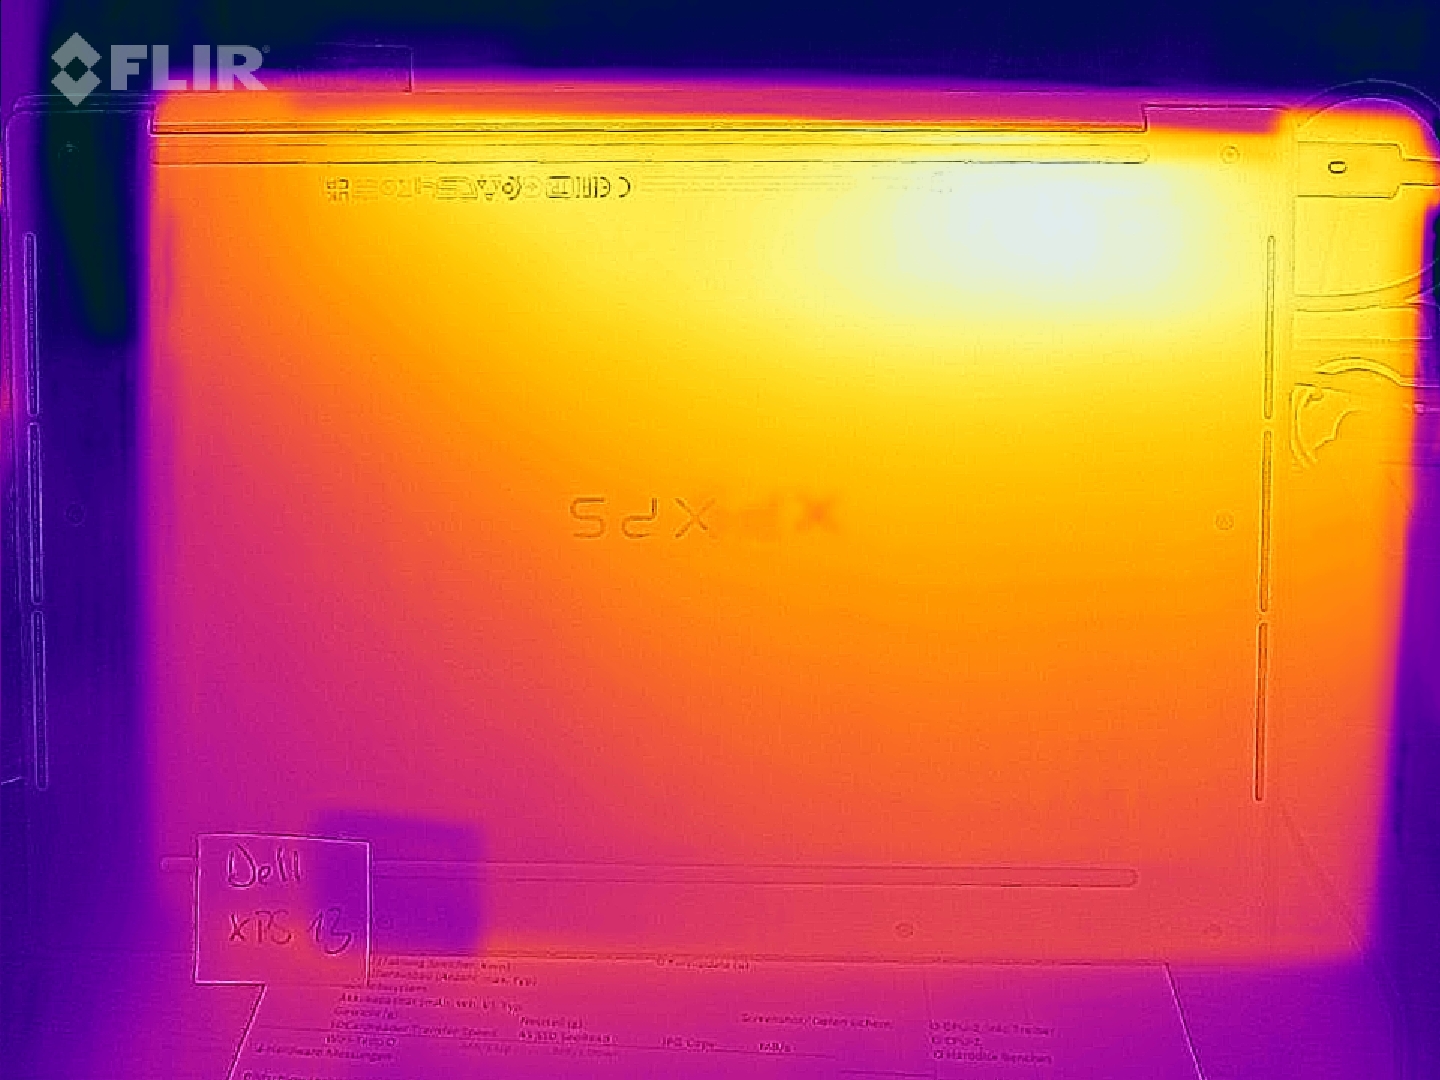
温度
在日常使用中,XPS 13的外壳保持令人愉快的凉爽,在旅行时可以放在腿上,没有任何问题。在长期的、非常高的负载下或在游戏时,设备的底部和键盘的上部变得特别热。顶部和底部的热点分别达到46℃(114.8°F)和44℃(111.2°F)。紧凑的45瓦交流适配器只达到42℃(107.6°F)。
(±) The maximum temperature on the upper side is 42.3 °C / 108 F, compared to the average of 35.9 °C / 97 F, ranging from 21.4 to 59 °C for the class Subnotebook.
(±) The bottom heats up to a maximum of 44.9 °C / 113 F, compared to the average of 39.2 °C / 103 F
(+) In idle usage, the average temperature for the upper side is 30.8 °C / 87 F, compared to the device average of 30.8 °C / 87 F.
(±) Playing The Witcher 3, the average temperature for the upper side is 36.5 °C / 98 F, compared to the device average of 30.8 °C / 87 F.
(+) The palmrests and touchpad are reaching skin temperature as a maximum (34.4 °C / 93.9 F) and are therefore not hot.
(-) The average temperature of the palmrest area of similar devices was 28.2 °C / 82.8 F (-6.2 °C / -11.1 F).
| Dell XPS 13 9315, i5-1230U Intel Core i5-1230U, Intel Iris Xe Graphics G7 80EUs | Dell XPS 13 Plus 9320 4K Intel Core i7-1260P, Intel Iris Xe Graphics G7 96EUs | Dell XPS 13 Plus 9320 i5-1240p Intel Core i5-1240P, Intel Iris Xe Graphics G7 80EUs | Apple MacBook Air 2020 M1 Entry Apple M1, Apple M1 7-Core GPU | Asus Zenbook S 13 OLED AMD Ryzen 7 6800U, AMD Radeon 680M | Lenovo ThinkPad X1 Nano-20UN002UGE Intel Core i7-1160G7, Intel Iris Xe Graphics G7 96EUs | Huawei MateBook 13s i5 11300H Intel Core i5-11300H, Intel Iris Xe Graphics G7 80EUs | |
|---|---|---|---|---|---|---|---|
| Heat | 8% | -17% | 11% | 2% | 13% | 12% | |
| Maximum Upper Side * (°C) | 42.3 | 41.1 3% | 47.6 -13% | 44 -4% | 47.9 -13% | 42.2 -0% | 42.8 -1% |
| Maximum Bottom * (°C) | 44.9 | 48.8 -9% | 57 -27% | 44 2% | 56.1 -25% | 47.5 -6% | 46.9 -4% |
| Idle Upper Side * (°C) | 32.5 | 28 14% | 38.8 -19% | 27 17% | 26.8 18% | 24.3 25% | 25.2 22% |
| Idle Bottom * (°C) | 38.2 | 29.3 23% | 41 -7% | 27 29% | 27.3 29% | 25.3 34% | 26 32% |
* ... smaller is better
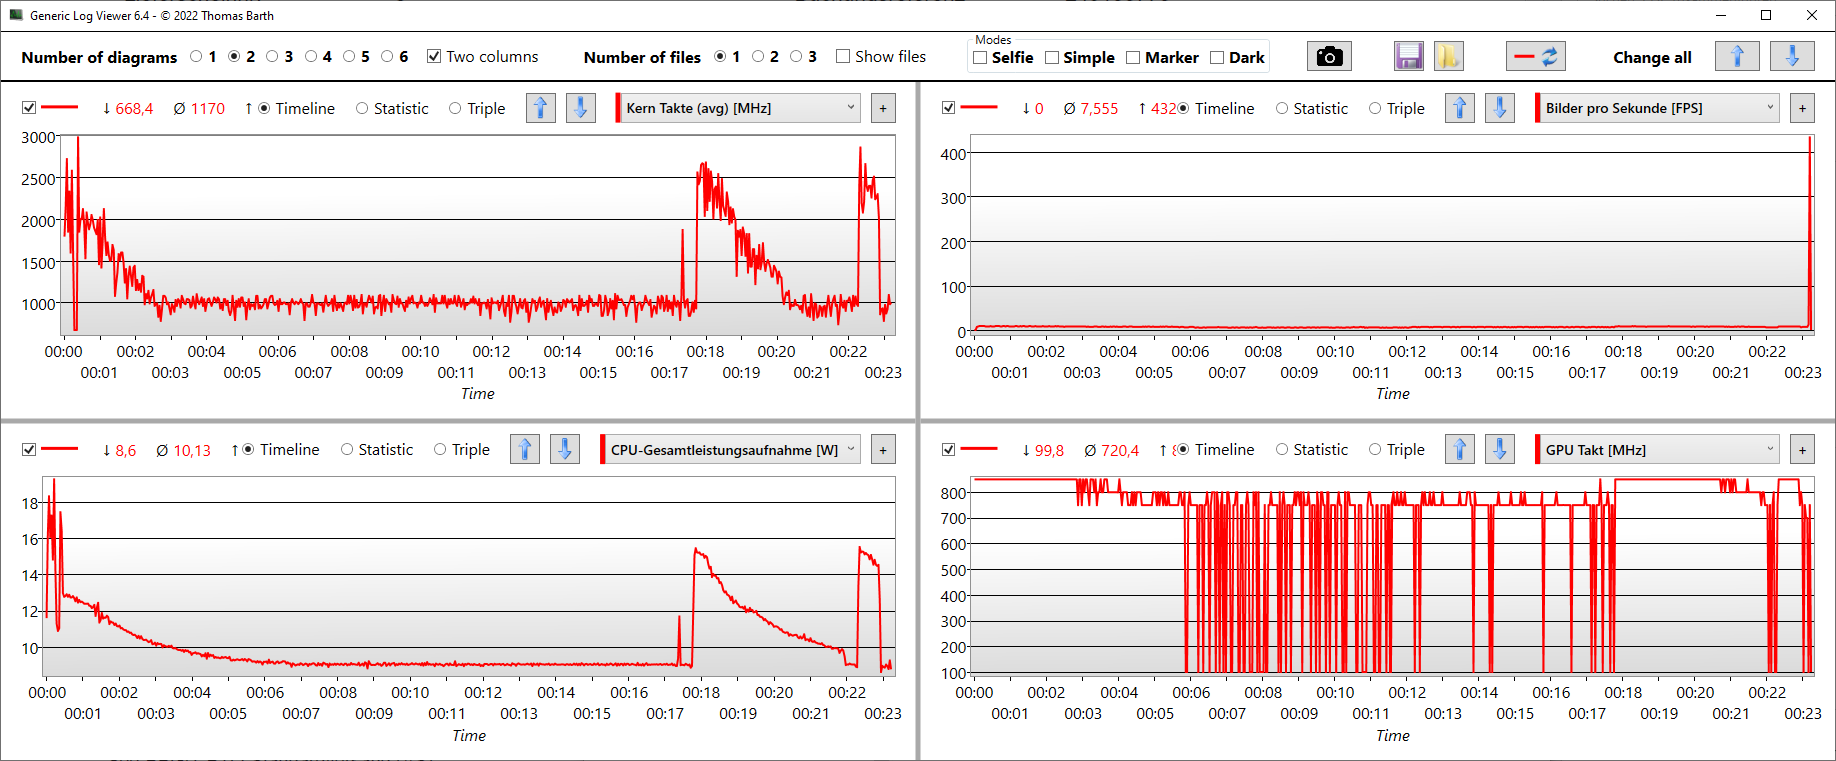
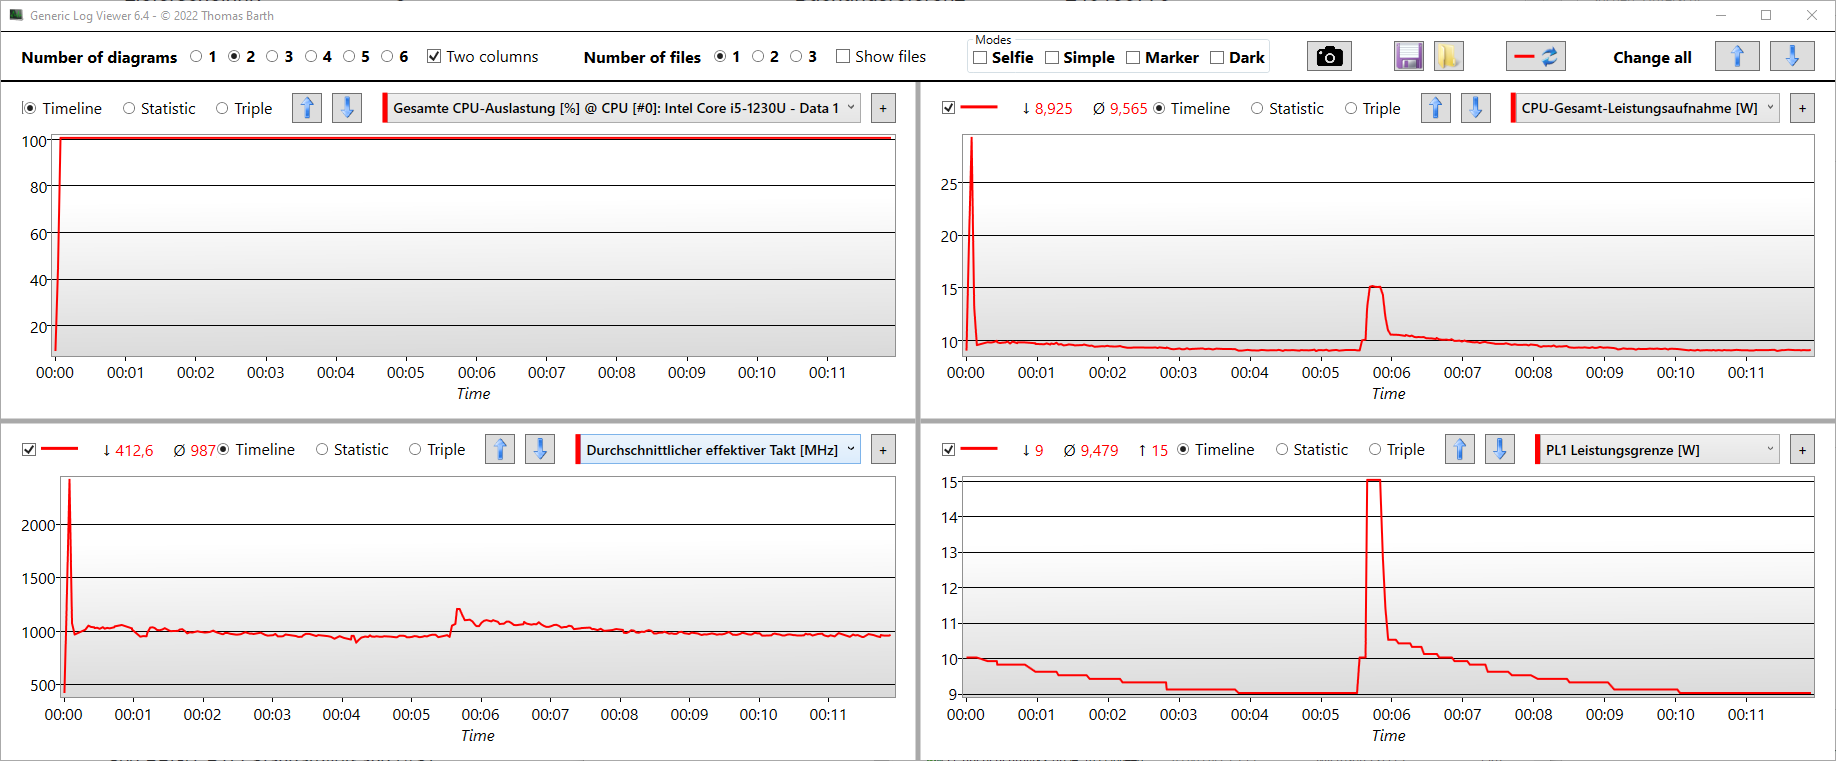
压力测试
时钟速度最初在几秒钟后跳到2.5GHz,临时峰值消耗为29瓦(CPU)。随后,由于时钟速度节流到1000兆赫左右,消费下降到10瓦以下。在我们的压力测试中,Prime95和FurMark并行运行,同时对CPU和GPU施加压力。每隔5分钟,CPU就会暂时达到15瓦的消耗峰值,尽管这只持续了几秒钟,而且时钟速度也没有明显增加。
发言人
扬声器产生出色的声音,与大型游戏笔记本的扬声器相比,甚至还能保持。低音扬声器和高音扬声器在内部结合,至少在左右两边。低音很适合游戏和电影。考虑到笔记本电脑的小尺寸,其最大音量是很高的。扬声器在最大音量下也不会失真。
由于我们的XPS 13不再配备耳机插孔,制造商包括一个C型到3.5毫米的加密狗。随着市场上蓝牙耳机的大量出现,省略组合音频端口可能是合理的。不过,这种解决方案还是占用了一个C型接口,而另一个接口有可能被用于充电。
网络摄像头上方的双向麦克风捕捉到的声音听起来几乎清澈见底,即使在改变用户和麦克风之间的距离时也能保持同质。这是视频通话的一个很好的解决方案。这个麦克风可以通过一个Fn快捷键进行静音。
Dell XPS 13 9315, i5-1230U audio analysis
(±) | speaker loudness is average but good (81.81 dB)
Bass 100 - 315 Hz
(±) | reduced bass - on average 11.6% lower than median
(±) | linearity of bass is average (10.7% delta to prev. frequency)
Mids 400 - 2000 Hz
(+) | balanced mids - only 1.6% away from median
(+) | mids are linear (5.8% delta to prev. frequency)
Highs 2 - 16 kHz
(+) | balanced highs - only 4.2% away from median
(±) | linearity of highs is average (7.1% delta to prev. frequency)
Overall 100 - 16.000 Hz
(+) | overall sound is linear (11.3% difference to median)
Compared to same class
» 11% of all tested devices in this class were better, 2% similar, 86% worse
» The best had a delta of 5%, average was 18%, worst was 53%
Compared to all devices tested
» 7% of all tested devices were better, 2% similar, 91% worse
» The best had a delta of 4%, average was 24%, worst was 134%
Asus Zenbook S 13 OLED audio analysis
(±) | speaker loudness is average but good (76.5 dB)
Bass 100 - 315 Hz
(±) | reduced bass - on average 12.6% lower than median
(±) | linearity of bass is average (11.1% delta to prev. frequency)
Mids 400 - 2000 Hz
(±) | higher mids - on average 5.8% higher than median
(+) | mids are linear (4.7% delta to prev. frequency)
Highs 2 - 16 kHz
(+) | balanced highs - only 2.6% away from median
(+) | highs are linear (5.3% delta to prev. frequency)
Overall 100 - 16.000 Hz
(+) | overall sound is linear (14.7% difference to median)
Compared to same class
» 30% of all tested devices in this class were better, 5% similar, 64% worse
» The best had a delta of 5%, average was 18%, worst was 53%
Compared to all devices tested
» 19% of all tested devices were better, 4% similar, 77% worse
» The best had a delta of 4%, average was 24%, worst was 134%
Dell XPS 13 9310 Core i7 FHD audio analysis
(+) | speakers can play relatively loud (84.6 dB)
Bass 100 - 315 Hz
(-) | nearly no bass - on average 16.1% lower than median
(±) | linearity of bass is average (13.1% delta to prev. frequency)
Mids 400 - 2000 Hz
(+) | balanced mids - only 2.6% away from median
(+) | mids are linear (4.6% delta to prev. frequency)
Highs 2 - 16 kHz
(+) | balanced highs - only 1.3% away from median
(+) | highs are linear (4% delta to prev. frequency)
Overall 100 - 16.000 Hz
(+) | overall sound is linear (10.7% difference to median)
Compared to same class
» 9% of all tested devices in this class were better, 3% similar, 88% worse
» The best had a delta of 5%, average was 18%, worst was 53%
Compared to all devices tested
» 6% of all tested devices were better, 2% similar, 93% worse
» The best had a delta of 4%, average was 24%, worst was 134%
能源管理 - 戴尔的便携式节能笔记本电脑
能源消耗
与Plus版本相比,缓慢的性能表明我们的XPS在能源效率方面是一个世界冠军。事实证明这是真的,我们在平均工作负荷下测得的消耗量为24瓦。在这种情况下,配备了Alder Lake-P 1240的Plus版本的 Alder Lake-P 1240P消耗43瓦,而 1260P几乎为49瓦。消耗量Witcher 3/压力测试 "显示了以下的明显差异 桤木湖-U和-P之间的明显差异,特别是当SoC处于持续负载状态时。
在压力测试期间,消耗量稳定在27瓦,并在这个水平上保持不变。在压力测试后直接进行的基准测试的分数没有受到不利影响。
| Off / Standby | |
| Idle | |
| Load |
|
Key:
min: | |
| Dell XPS 13 9315, i5-1230U i5-1230U, Iris Xe G7 80EUs, Micron 3460 256 GB Soldered, IPS, 1920x1200, 13.4" | Apple MacBook Air 2020 M1 Entry M1, M1 7-Core GPU, Apple SSD AP0256Q, IPS, 2560x1600, 13.3" | Asus Zenbook S 13 OLED R7 6800U, Radeon 680M, Samsung PM9A1 MZVL21T0HCLR, OLED, 2880x1800, 13.3" | Lenovo ThinkPad X1 Nano-20UN002UGE i7-1160G7, Iris Xe G7 96EUs, WDC PC SN530 SDBPNPZ-512G, IPS, 2160x1350, 13" | Huawei MateBook 13s i5 11300H i5-11300H, Iris Xe G7 80EUs, Phison Electronics PS5012, LTPS, 2520x1680, 13.4" | Dell XPS 13 Plus 9320 4K i7-1260P, Iris Xe G7 96EUs, Samsung PM9A1 MZVL21T0HCLR, IPS, 3840x2400, 13.4" | Dell XPS 13 Plus 9320 i5-1240p i5-1240P, Iris Xe G7 80EUs, Micron 3400 MTFDKBA512TFH 512GB, IPS, 1920x1200, 13.4" | Average Intel Iris Xe Graphics G7 80EUs | Average of class Subnotebook | |
|---|---|---|---|---|---|---|---|---|---|
| Power Consumption | 16% | -48% | -11% | -43% | -86% | -97% | -31% | -27% | |
| Idle Minimum * (Watt) | 3.6 | 1.9 47% | 4.8 -33% | 3.3 8% | 4.2 -17% | 7 -94% | 10 -178% | 4.49 ? -25% | 3.86 ? -7% |
| Idle Average * (Watt) | 6.8 | 6.4 6% | 8.7 -28% | 5.7 16% | 8.1 -19% | 11 -62% | 12.3 -81% | 7.4 ? -9% | 6.61 ? 3% |
| Idle Maximum * (Watt) | 6.8 | 7 -3% | 10.1 -49% | 9.1 -34% | 9 -32% | 11.4 -68% | 15.5 -128% | 9.26 ? -36% | 8 ? -18% |
| Load Average * (Watt) | 24 | 25 -4% | 45.6 -90% | 29.6 -23% | 41.7 -74% | 59.7 -149% | 43 -79% | 36.6 ? -53% | 42.2 ? -76% |
| Witcher 3 ultra * (Watt) | 23.6 | 42.4 -80% | 27.7 -17% | 40.1 -70% | 49.4 -109% | 43.1 -83% | |||
| Load Maximum * (Watt) | 47 | 30.3 36% | 49.5 -5% | 55.1 -17% | 68 -45% | 63 -34% | 62.8 -34% | 61.7 ? -31% | 64.5 ? -37% |
* ... smaller is better
Consumption Witcher 3/Stress Test
Consumption external Monitor
电池寿命
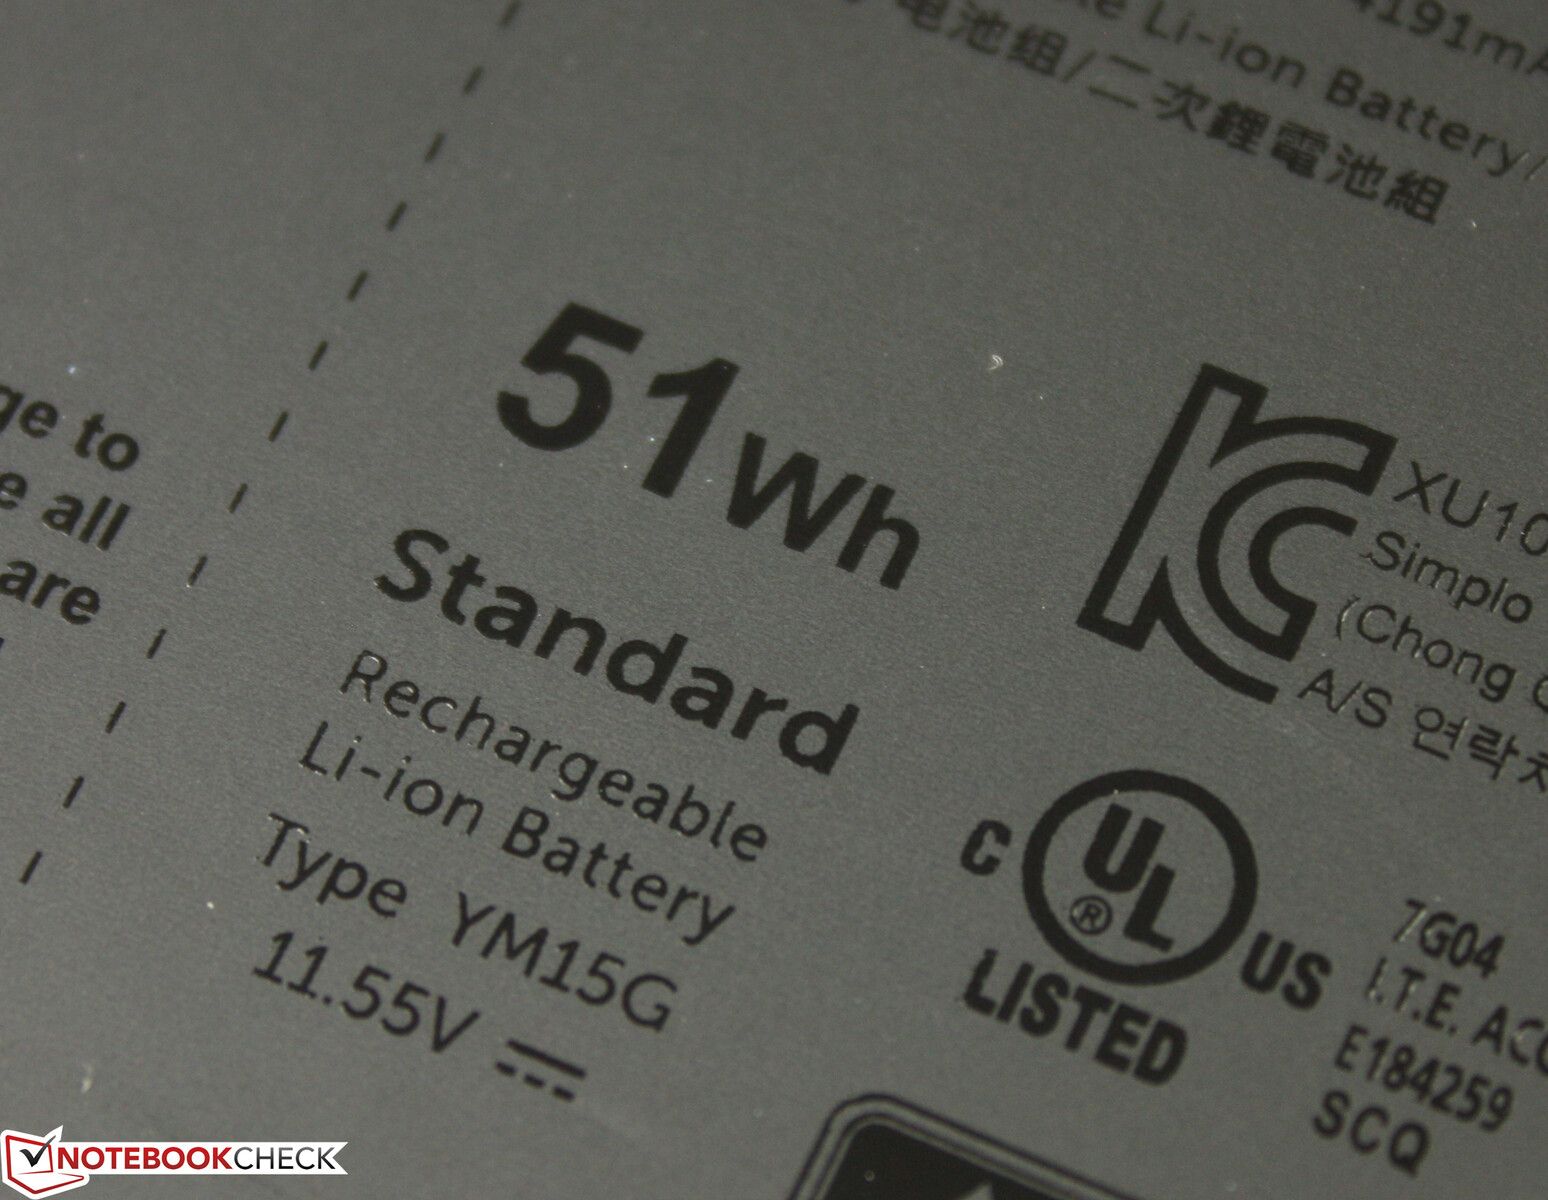
在我们的Wi-Fi测试中,在降低亮度(150尼特)的情况下,XPS 13的运行时间接近15小时。 桤木湖-U弯曲它的肌肉。即使在最大亮度下,它也能在测试中运行10:22小时,考虑到XPS非常高的最大亮度(406尼特,使用电池时略低),这更令人印象深刻。与Plus不同的是,基本版XPS笔记本电脑配备的是51瓦时的电池,而不是55瓦时。Battery Eater负载测试在最大亮度下运行了异常长的时间,考虑到SoC的缓慢性能,这不应该是一个惊喜。
| Dell XPS 13 9315, i5-1230U i5-1230U, Iris Xe G7 80EUs, 51 Wh | Apple MacBook Air 2020 M1 Entry M1, M1 7-Core GPU, 49.9 Wh | Asus Zenbook S 13 OLED R7 6800U, Radeon 680M, 67 Wh | Lenovo ThinkPad X1 Nano-20UN002UGE i7-1160G7, Iris Xe G7 96EUs, 48.2 Wh | Huawei MateBook 13s i5 11300H i5-11300H, Iris Xe G7 80EUs, 60 Wh | Dell XPS 13 Plus 9320 4K i7-1260P, Iris Xe G7 96EUs, 55 Wh | Dell XPS 13 Plus 9320 i5-1240p i5-1240P, Iris Xe G7 80EUs, 55 Wh | Average of class Subnotebook | |
|---|---|---|---|---|---|---|---|---|
| Battery runtime | 8% | -23% | -36% | -37% | -52% | -42% | -15% | |
| WiFi v1.3 (h) | 14.8 | 16 8% | 9.2 -38% | 9.9 -33% | 9.4 -36% | 6.9 -53% | 8 -46% | 14 ? -5% |
| Load (h) | 2.6 | 2.4 -8% | 1.6 -38% | 1.6 -38% | 1.3 -50% | 1.6 -38% | 1.969 ? -24% | |
| H.264 (h) | 15.2 | 15.4 | 11 | 11 | 15.4 ? |
Pros
Cons
结论--一半的性能,两倍的电池寿命
以有限的性能换取出色的便携性--低端的2022款XPS 13配备了 ALDER LAKE-UCPU和IPS FHD面板的低端XPS 13是一款引人注目的轻度办公设备。它的电池运行时间接近15小时,是其姐妹机型XPS 13 Plus的两倍。戴尔依靠适合日常使用的明亮显示屏,有两个Thunderbolt 4端口和带有一个低音炮和一个高音炮的扬声器。得益于此,使用集成的扬声器观看电影是一种愉快的体验。
也许这就是没有耳机插孔和读卡器的原因?还是因为简约的概念?在任何情况下,只要你准备好了,就有可能使只有两个Type-C端口的笔记本电脑设置工作,其中一个被AC适配器占据。然而,内部有一个无形的障碍,因为XPS 13不能以任何方式进行升级。内存、Wi-Fi模块和SSD都是固定的。在选择256GB存储的低端机型时,需要考虑到这一点。
长久的电池寿命,坚实的机箱,适合日常使用的输入设备,以及重低音增强的声音--即使是入门级的XPS 13也能带来快乐。
在性能方面是有取舍的,Alder Lake-U芯片与其他采用相同CPU的次笔记本相比并不占优势。与XPS 13 Plus内部的Alder Lake-P CPU相比,其性能差距非常大。至少戴尔划出了一条清晰的界限。如果你追求性能,Plus是唯一的选择。对于网络浏览、娱乐和邮件用途,基本的XPS版本已经足够。
新的XPS系列。分为两个性能等级。基本版的XPS侧重于便携性,而不是试图从其组件中榨取最后一点性能。
与配备AMD Ryzen 6000 CPU的Zenbook S 13相比,低端的XPS 13落伍了,甚至与MacBook Air M1相比也是如此。 Apple MacBook Air M1,XPS 13也很吃力。因此,与新的 MacBook Air M2我们目前也在对其进行评测,即使在关注XPS 13 Plus时,也不太可能将戴尔的情况描绘得很好。
作者目前正在审查 XPS 13 Plus基本型号配备FHD显示屏,512GB,以及Alder Lake-P Core i5。我们还评测了配备4K和i7的XPS 13 Plus。 Das XPS 13现在有一个触摸条.
价格和可用性
2022年的XPS 13 9315现在可以从戴尔的网上商店购买。起价为999美元。Plus型号的起价为1299美元。
Dell XPS 13 9315, i5-1230U
- 08/05/2022 v7 (old)
Sebastian Jentsch
Price comparison

