戴尔Latitude 5495 (Ryzen 7 Pro, FHD) 笔记本电脑评测
| SD Card Reader | |
| average JPG Copy Test (av. of 3 runs) | |
| Dell Latitude 5490-TD70X (Toshiba Exceria Pro SDXC 64 GB UHS-II) | |
| Dell Latitude 14 5495 (Toshiba Exceria Pro SDXC 64 GB UHS-II) | |
| Lenovo ThinkPad A485-20MU000CGE (Toshiba Exceria Pro SDXC 64 GB UHS-II) | |
| Average of class Office (19.8 - 198.5, n=22, last 2 years) | |
| maximum AS SSD Seq Read Test (1GB) | |
| Dell Latitude 5490-TD70X (Toshiba Exceria Pro SDXC 64 GB UHS-II) | |
| Dell Latitude 14 5495 (Toshiba Exceria Pro SDXC 64 GB UHS-II) | |
| Lenovo ThinkPad A485-20MU000CGE (Toshiba Exceria Pro SDXC 64 GB UHS-II) | |
| Average of class Office (27.4 - 249, n=21, last 2 years) | |
| Networking | |
| iperf3 transmit AX12 | |
| HP EliteBook 745 G5 3UN74EA | |
| Lenovo ThinkPad A485-20MU000CGE | |
| Dell Latitude 14 5495 | |
| Dell Latitude 5490-TD70X | |
| iperf3 receive AX12 | |
| Dell Latitude 5490-TD70X | |
| Lenovo ThinkPad A485-20MU000CGE | |
| Dell Latitude 14 5495 | |
| HP EliteBook 745 G5 3UN74EA | |
| |||||||||||||||||||||||||
Brightness Distribution: 89 %
Center on Battery: 210 cd/m²
Contrast: 922:1 (Black: 0.23 cd/m²)
ΔE ColorChecker Calman: 4.34 | ∀{0.5-29.43 Ø4.71}
ΔE Greyscale Calman: 2.81 | ∀{0.09-98 Ø4.96}
61% sRGB (Argyll 1.6.3 3D)
39% AdobeRGB 1998 (Argyll 1.6.3 3D)
42.32% AdobeRGB 1998 (Argyll 3D)
61.4% sRGB (Argyll 3D)
40.94% Display P3 (Argyll 3D)
Gamma: 2.22
CCT: 6286 K
| Dell Latitude 14 5495 CMN14C9, , 1920x1080, 14" | Dell Latitude 5490-TD70X AU Optronics AUO263D, , 1920x1080, 14" | Lenovo ThinkPad A485-20MU000CGE NV140FHM-N46, , 1920x1080, 14" | HP EliteBook 745 G5 3UN74EA AUO383D, , 1920x1080, 14" | |
|---|---|---|---|---|
| Display | -11% | -2% | 47% | |
| Display P3 Coverage (%) | 40.94 | 36.28 -11% | 40.24 -2% | 61.3 50% |
| sRGB Coverage (%) | 61.4 | 54.6 -11% | 60 -2% | 87.6 43% |
| AdobeRGB 1998 Coverage (%) | 42.32 | 37.48 -11% | 41.57 -2% | 62.3 47% |
| Response Times | -9% | -13% | 16% | |
| Response Time Grey 50% / Grey 80% * (ms) | 41 ? | 46.9 ? -14% | 44.8 ? -9% | 35 ? 15% |
| Response Time Black / White * (ms) | 30 ? | 31.2 ? -4% | 35.2 ? -17% | 25 ? 17% |
| PWM Frequency (Hz) | 25000 ? | 1000 ? | ||
| Screen | -13% | -13% | 36% | |
| Brightness middle (cd/m²) | 212 | 227 7% | 275 30% | 421 99% |
| Brightness (cd/m²) | 200 | 211 6% | 272 36% | 398 99% |
| Brightness Distribution (%) | 89 | 88 -1% | 85 -4% | 86 -3% |
| Black Level * (cd/m²) | 0.23 | 0.19 17% | 0.26 -13% | 0.27 -17% |
| Contrast (:1) | 922 | 1195 30% | 1058 15% | 1559 69% |
| Colorchecker dE 2000 * | 4.34 | 5.6 -29% | 5.9 -36% | 4.08 6% |
| Colorchecker dE 2000 max. * | 9.01 | 22.4 -149% | 20 -122% | 7.48 17% |
| Greyscale dE 2000 * | 2.81 | 2.4 15% | 3.6 -28% | 2.92 -4% |
| Gamma | 2.22 99% | 2.44 90% | 2.36 93% | 2.32 95% |
| CCT | 6286 103% | 6506 100% | 6798 96% | 7043 92% |
| Color Space (Percent of AdobeRGB 1998) (%) | 39 | 34.5 -12% | 38.1 -2% | 57 46% |
| Color Space (Percent of sRGB) (%) | 61 | 54.4 -11% | 59.6 -2% | 87 43% |
| Colorchecker dE 2000 calibrated * | 4.9 | |||
| Total Average (Program / Settings) | -11% /
-12% | -9% /
-11% | 33% /
35% |
* ... smaller is better
Display Response Times
| ↔ Response Time Black to White | ||
|---|---|---|
| 30 ms ... rise ↗ and fall ↘ combined | ↗ 19 ms rise | 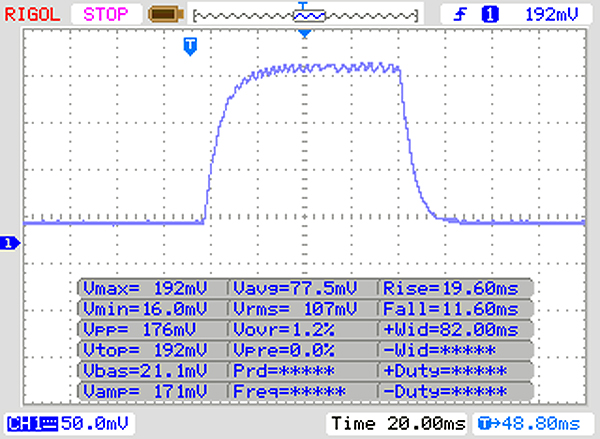 |
| ↘ 11 ms fall | ||
| The screen shows slow response rates in our tests and will be unsatisfactory for gamers. In comparison, all tested devices range from 0.1 (minimum) to 240 (maximum) ms. » 80 % of all devices are better. This means that the measured response time is worse than the average of all tested devices (19.8 ms). | ||
| ↔ Response Time 50% Grey to 80% Grey | ||
| 41 ms ... rise ↗ and fall ↘ combined | ↗ 24 ms rise | 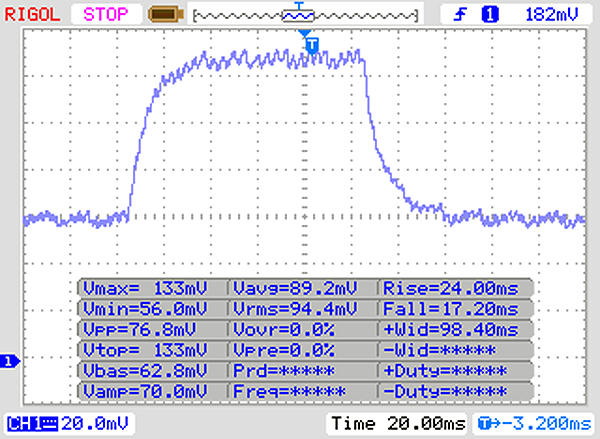 |
| ↘ 17 ms fall | ||
| The screen shows slow response rates in our tests and will be unsatisfactory for gamers. In comparison, all tested devices range from 0.165 (minimum) to 636 (maximum) ms. » 65 % of all devices are better. This means that the measured response time is worse than the average of all tested devices (30.9 ms). | ||
Screen Flickering / PWM (Pulse-Width Modulation)
| Screen flickering / PWM detected | 25000 Hz | ≤ 30 % brightness setting | 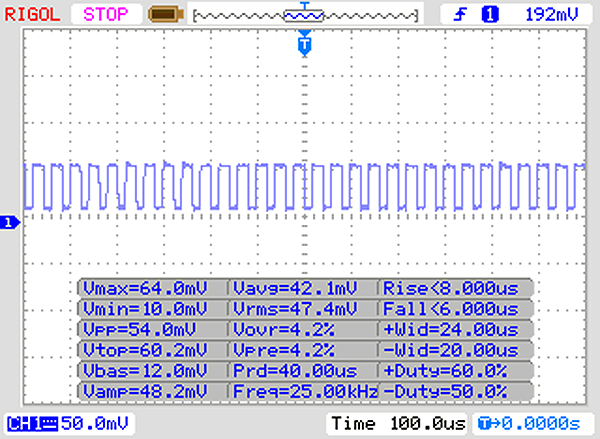 |
The display backlight flickers at 25000 Hz (worst case, e.g., utilizing PWM) Flickering detected at a brightness setting of 30 % and below. There should be no flickering or PWM above this brightness setting. The frequency of 25000 Hz is quite high, so most users sensitive to PWM should not notice any flickering. In comparison: 52 % of all tested devices do not use PWM to dim the display. If PWM was detected, an average of 7744 (minimum: 5 - maximum: 343500) Hz was measured. | |||
| Cinebench R15 | |
| CPU Single 64Bit | |
| Average of class Office (99.5 - 316, n=77, last 2 years) | |
| Dell Latitude 14 5495 | |
| HP EliteBook 745 G5 3UN74EA | |
| Dell Latitude 5490-TD70X | |
| Average AMD Ryzen 7 2700U (134 - 150, n=12) | |
| Lenovo ThinkPad A485-20MU000CGE | |
| CPU Multi 64Bit | |
| Average of class Office (250 - 3380, n=77, last 2 years) | |
| Dell Latitude 14 5495 | |
| Average AMD Ryzen 7 2700U (546 - 719, n=12) | |
| HP EliteBook 745 G5 3UN74EA | |
| Dell Latitude 5490-TD70X | |
| Lenovo ThinkPad A485-20MU000CGE | |
| PCMark 10 | |
| Score | |
| Average of class Office (2601 - 9298, n=68, last 2 years) | |
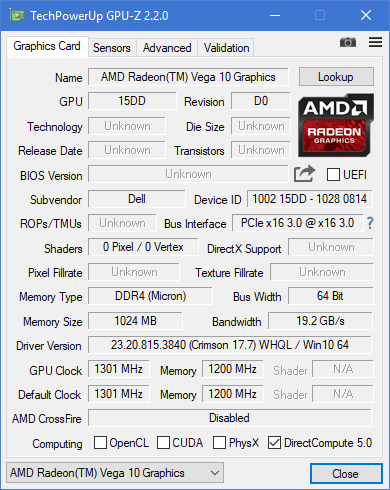
| Average AMD Ryzen 7 2700U, AMD Radeon RX Vega 10 (2584 - 3402, n=7) | |
| HP EliteBook 745 G5 3UN74EA | |
| Lenovo ThinkPad A485-20MU000CGE | |
| Dell Latitude 14 5495 | |
| Essentials | |
| Average of class Office (3245 - 11594, n=68, last 2 years) | |
| Average AMD Ryzen 7 2700U, AMD Radeon RX Vega 10 (5395 - 7320, n=7) | |
| Dell Latitude 14 5495 | |
| Lenovo ThinkPad A485-20MU000CGE | |
| HP EliteBook 745 G5 3UN74EA | |
| Productivity | |
| Average of class Office (5336 - 17243, n=68, last 2 years) | |
| Average AMD Ryzen 7 2700U, AMD Radeon RX Vega 10 (3408 - 5146, n=7) | |
| Lenovo ThinkPad A485-20MU000CGE | |
| Dell Latitude 14 5495 | |
| HP EliteBook 745 G5 3UN74EA | |
| Digital Content Creation | |
| Average of class Office (2049 - 13541, n=68, last 2 years) | |
| Average AMD Ryzen 7 2700U, AMD Radeon RX Vega 10 (2206 - 3251, n=7) | |
| HP EliteBook 745 G5 3UN74EA | |
| Lenovo ThinkPad A485-20MU000CGE | |
| Dell Latitude 14 5495 | |
| PCMark 8 | |
| Home Score Accelerated v2 | |
| Average of class Office (n=1last 2 years) | |
| Dell Latitude 5490-TD70X | |
| Average AMD Ryzen 7 2700U, AMD Radeon RX Vega 10 (3155 - 3640, n=7) | |
| Dell Latitude 14 5495 | |
| HP EliteBook 745 G5 3UN74EA | |
| Lenovo ThinkPad A485-20MU000CGE | |
| Work Score Accelerated v2 | |
| Average of class Office (n=1last 2 years) | |
| Dell Latitude 5490-TD70X | |
| HP EliteBook 745 G5 3UN74EA | |
| Average AMD Ryzen 7 2700U, AMD Radeon RX Vega 10 (2438 - 4774, n=7) | |
| Lenovo ThinkPad A485-20MU000CGE | |
| Dell Latitude 14 5495 | |
| PCMark 8 Home Score Accelerated v2 | 3256 points | |
| PCMark 8 Work Score Accelerated v2 | 2438 points | |
| PCMark 10 Score | 2585 points | |
Help | ||
| Dell Latitude 14 5495 Intel SSDSCKKF256G8 | Dell Latitude 5490-TD70X Toshiba KSG60ZMV512G | Lenovo ThinkPad A485-20MU000CGE Samsung SSD PM981 MZVLB256HAHQ | HP EliteBook 745 G5 3UN74EA Toshiba XG5 KXG50ZNV256G | Average Intel SSDSCKKF256G8 | |
|---|---|---|---|---|---|
| CrystalDiskMark 5.2 / 6 | 31% | 146% | 108% | 0% | |
| Write 4K (MB/s) | 48.45 | 90.4 87% | 114.8 137% | 119.5 147% | 48.5 ? 0% |
| Read 4K (MB/s) | 25.11 | 28.24 12% | 41.33 65% | 31.9 27% | 25.1 ? 0% |
| Write Seq (MB/s) | 341.2 | 433.7 27% | 1271 273% | 351.1 3% | 341 ? 0% |
| Read Seq (MB/s) | 521 | 469.3 -10% | 1171 125% | 1665 220% | 521 ? 0% |
| Write 4K Q32T1 (MB/s) | 202 | 297.6 47% | 218.4 8% | 268.4 33% | 202 ? 0% |
| Read 4K Q32T1 (MB/s) | 243.5 | 293.9 21% | 308.5 27% | 333.1 37% | 244 ? 0% |
| Write Seq Q32T1 (MB/s) | 320.8 | 534 66% | 1460 355% | 351.8 10% | 321 ? 0% |
| Read Seq Q32T1 (MB/s) | 555 | 531 -4% | 1529 175% | 2705 387% | 555 ? 0% |

| 3DMark 11 - 1280x720 Performance GPU | |
| Average of class Office (2551 - 18313, n=72, last 2 years) | |
| Acer Swift 3 SF315-41-R6J9 | |
| Lenovo ThinkPad T480s-20L8S02E00 | |
| Average AMD Radeon RX Vega 10 (2688 - 4165, n=17) | |
| Dell Latitude 14 5495 | |
| HP EliteBook 745 G5 3UN74EA | |
| Lenovo ThinkPad A485-20MU000CGE | |
| Dell Latitude 5490-TD70X | |
| 3DMark | |
| 1280x720 Cloud Gate Standard Graphics | |
| Average of class Office (11640 - 118515, n=38, last 2 years) | |
| Lenovo ThinkPad T480s-20L8S02E00 | |
| Acer Swift 3 SF315-41-R6J9 | |
| Average AMD Radeon RX Vega 10 (9364 - 20784, n=16) | |
| Dell Latitude 14 5495 | |
| HP EliteBook 745 G5 3UN74EA | |
| Lenovo ThinkPad A485-20MU000CGE | |
| Dell Latitude 5490-TD70X | |
| 1920x1080 Fire Strike Graphics | |
| Average of class Office (736 - 21871, n=75, last 2 years) | |
| Lenovo ThinkPad T480s-20L8S02E00 | |
| Acer Swift 3 SF315-41-R6J9 | |
| Average AMD Radeon RX Vega 10 (1567 - 2999, n=17) | |
| Dell Latitude 14 5495 | |
| Lenovo ThinkPad A485-20MU000CGE | |
| HP EliteBook 745 G5 3UN74EA | |
| Dell Latitude 5490-TD70X | |
| 3DMark 11 Performance | 3129 points | |
| 3DMark Cloud Gate Standard Score | 8942 points | |
| 3DMark Fire Strike Score | 1659 points | |
Help | ||
| low | med. | high | ultra | |
|---|---|---|---|---|
| BioShock Infinite (2013) | 85.7 | 14.4 | ||
| The Witcher 3 (2015) | 33 | 10.7 | ||
| Rise of the Tomb Raider (2016) | 37.6 | 12.3 |
Noise level
| Idle |
| 30.7 / 30.7 / 30.7 dB(A) |
| Load |
| 35.4 / 43 dB(A) |
 | ||
30 dB silent 40 dB(A) audible 50 dB(A) loud |
||
min: | ||
(+) The maximum temperature on the upper side is 37.1 °C / 99 F, compared to the average of 34.3 °C / 94 F, ranging from 21.2 to 62.5 °C for the class Office.
(-) The bottom heats up to a maximum of 45.6 °C / 114 F, compared to the average of 36.8 °C / 98 F
(+) In idle usage, the average temperature for the upper side is 23.1 °C / 74 F, compared to the device average of 29.5 °C / 85 F.
(+) The palmrests and touchpad are cooler than skin temperature with a maximum of 27.2 °C / 81 F and are therefore cool to the touch.
(±) The average temperature of the palmrest area of similar devices was 27.6 °C / 81.7 F (+0.4 °C / 0.7 F).
Dell Latitude 14 5495 audio analysis
(±) | speaker loudness is average but good (76.1 dB)
Bass 100 - 315 Hz
(-) | nearly no bass - on average 17.1% lower than median
(±) | linearity of bass is average (9.7% delta to prev. frequency)
Mids 400 - 2000 Hz
(±) | higher mids - on average 5.5% higher than median
(±) | linearity of mids is average (8.6% delta to prev. frequency)
Highs 2 - 16 kHz
(+) | balanced highs - only 2.1% away from median
(+) | highs are linear (5.3% delta to prev. frequency)
Overall 100 - 16.000 Hz
(±) | linearity of overall sound is average (17.5% difference to median)
Compared to same class
» 28% of all tested devices in this class were better, 7% similar, 66% worse
» The best had a delta of 7%, average was 21%, worst was 53%
Compared to all devices tested
» 34% of all tested devices were better, 8% similar, 58% worse
» The best had a delta of 4%, average was 23%, worst was 134%
HP EliteBook 745 G5 3UN74EA audio analysis
(-) | not very loud speakers (71.2 dB)
Bass 100 - 315 Hz
(-) | nearly no bass - on average 27.1% lower than median
(±) | linearity of bass is average (10.7% delta to prev. frequency)
Mids 400 - 2000 Hz
(+) | balanced mids - only 2.4% away from median
(±) | linearity of mids is average (8.6% delta to prev. frequency)
Highs 2 - 16 kHz
(+) | balanced highs - only 2.7% away from median
(+) | highs are linear (5.6% delta to prev. frequency)
Overall 100 - 16.000 Hz
(±) | linearity of overall sound is average (20.2% difference to median)
Compared to same class
» 44% of all tested devices in this class were better, 10% similar, 46% worse
» The best had a delta of 7%, average was 21%, worst was 53%
Compared to all devices tested
» 53% of all tested devices were better, 8% similar, 39% worse
» The best had a delta of 4%, average was 23%, worst was 134%
| Off / Standby | |
| Idle | |
| Load |
|
Key:
min: | |
| Dell Latitude 14 5495 R7 2700U, Vega 10, Intel SSDSCKKF256G8, IPS LED, 1920x1080, 14" | Dell Latitude 5490-TD70X i5-8350U, UHD Graphics 620, Toshiba KSG60ZMV512G, IPS, 1920x1080, 14" | Lenovo ThinkPad A485-20MU000CGE R5 PRO 2500U, Vega 8, Samsung SSD PM981 MZVLB256HAHQ, IPS LED, 1920x1080, 14" | HP EliteBook 745 G5 3UN74EA R7 2700U, Vega 10, Toshiba XG5 KXG50ZNV256G, IPS LED, 1920x1080, 14" | Average AMD Radeon RX Vega 10 | Average of class Office | |
|---|---|---|---|---|---|---|
| Power Consumption | -10% | -30% | -16% | -13% | -24% | |
| Idle Minimum * (Watt) | 4.3 | 3.3 23% | 5.3 -23% | 4.9 -14% | 4.73 ? -10% | 4.25 ? 1% |
| Idle Average * (Watt) | 6.6 | 5.54 16% | 8.3 -26% | 8.1 -23% | 7.61 ? -15% | 7.3 ? -11% |
| Idle Maximum * (Watt) | 7.7 | 6.59 14% | 11.4 -48% | 10.6 -38% | 9.63 ? -25% | 8.57 ? -11% |
| Load Average * (Watt) | 32 | 42.4 -33% | 42 -31% | 32.2 -1% | 33.3 ? -4% | 43.8 ? -37% |
| Load Maximum * (Watt) | 40 | 67.6 -69% | 48.8 -22% | 42.3 -6% | 45.1 ? -13% | 64.5 ? -61% |
* ... smaller is better
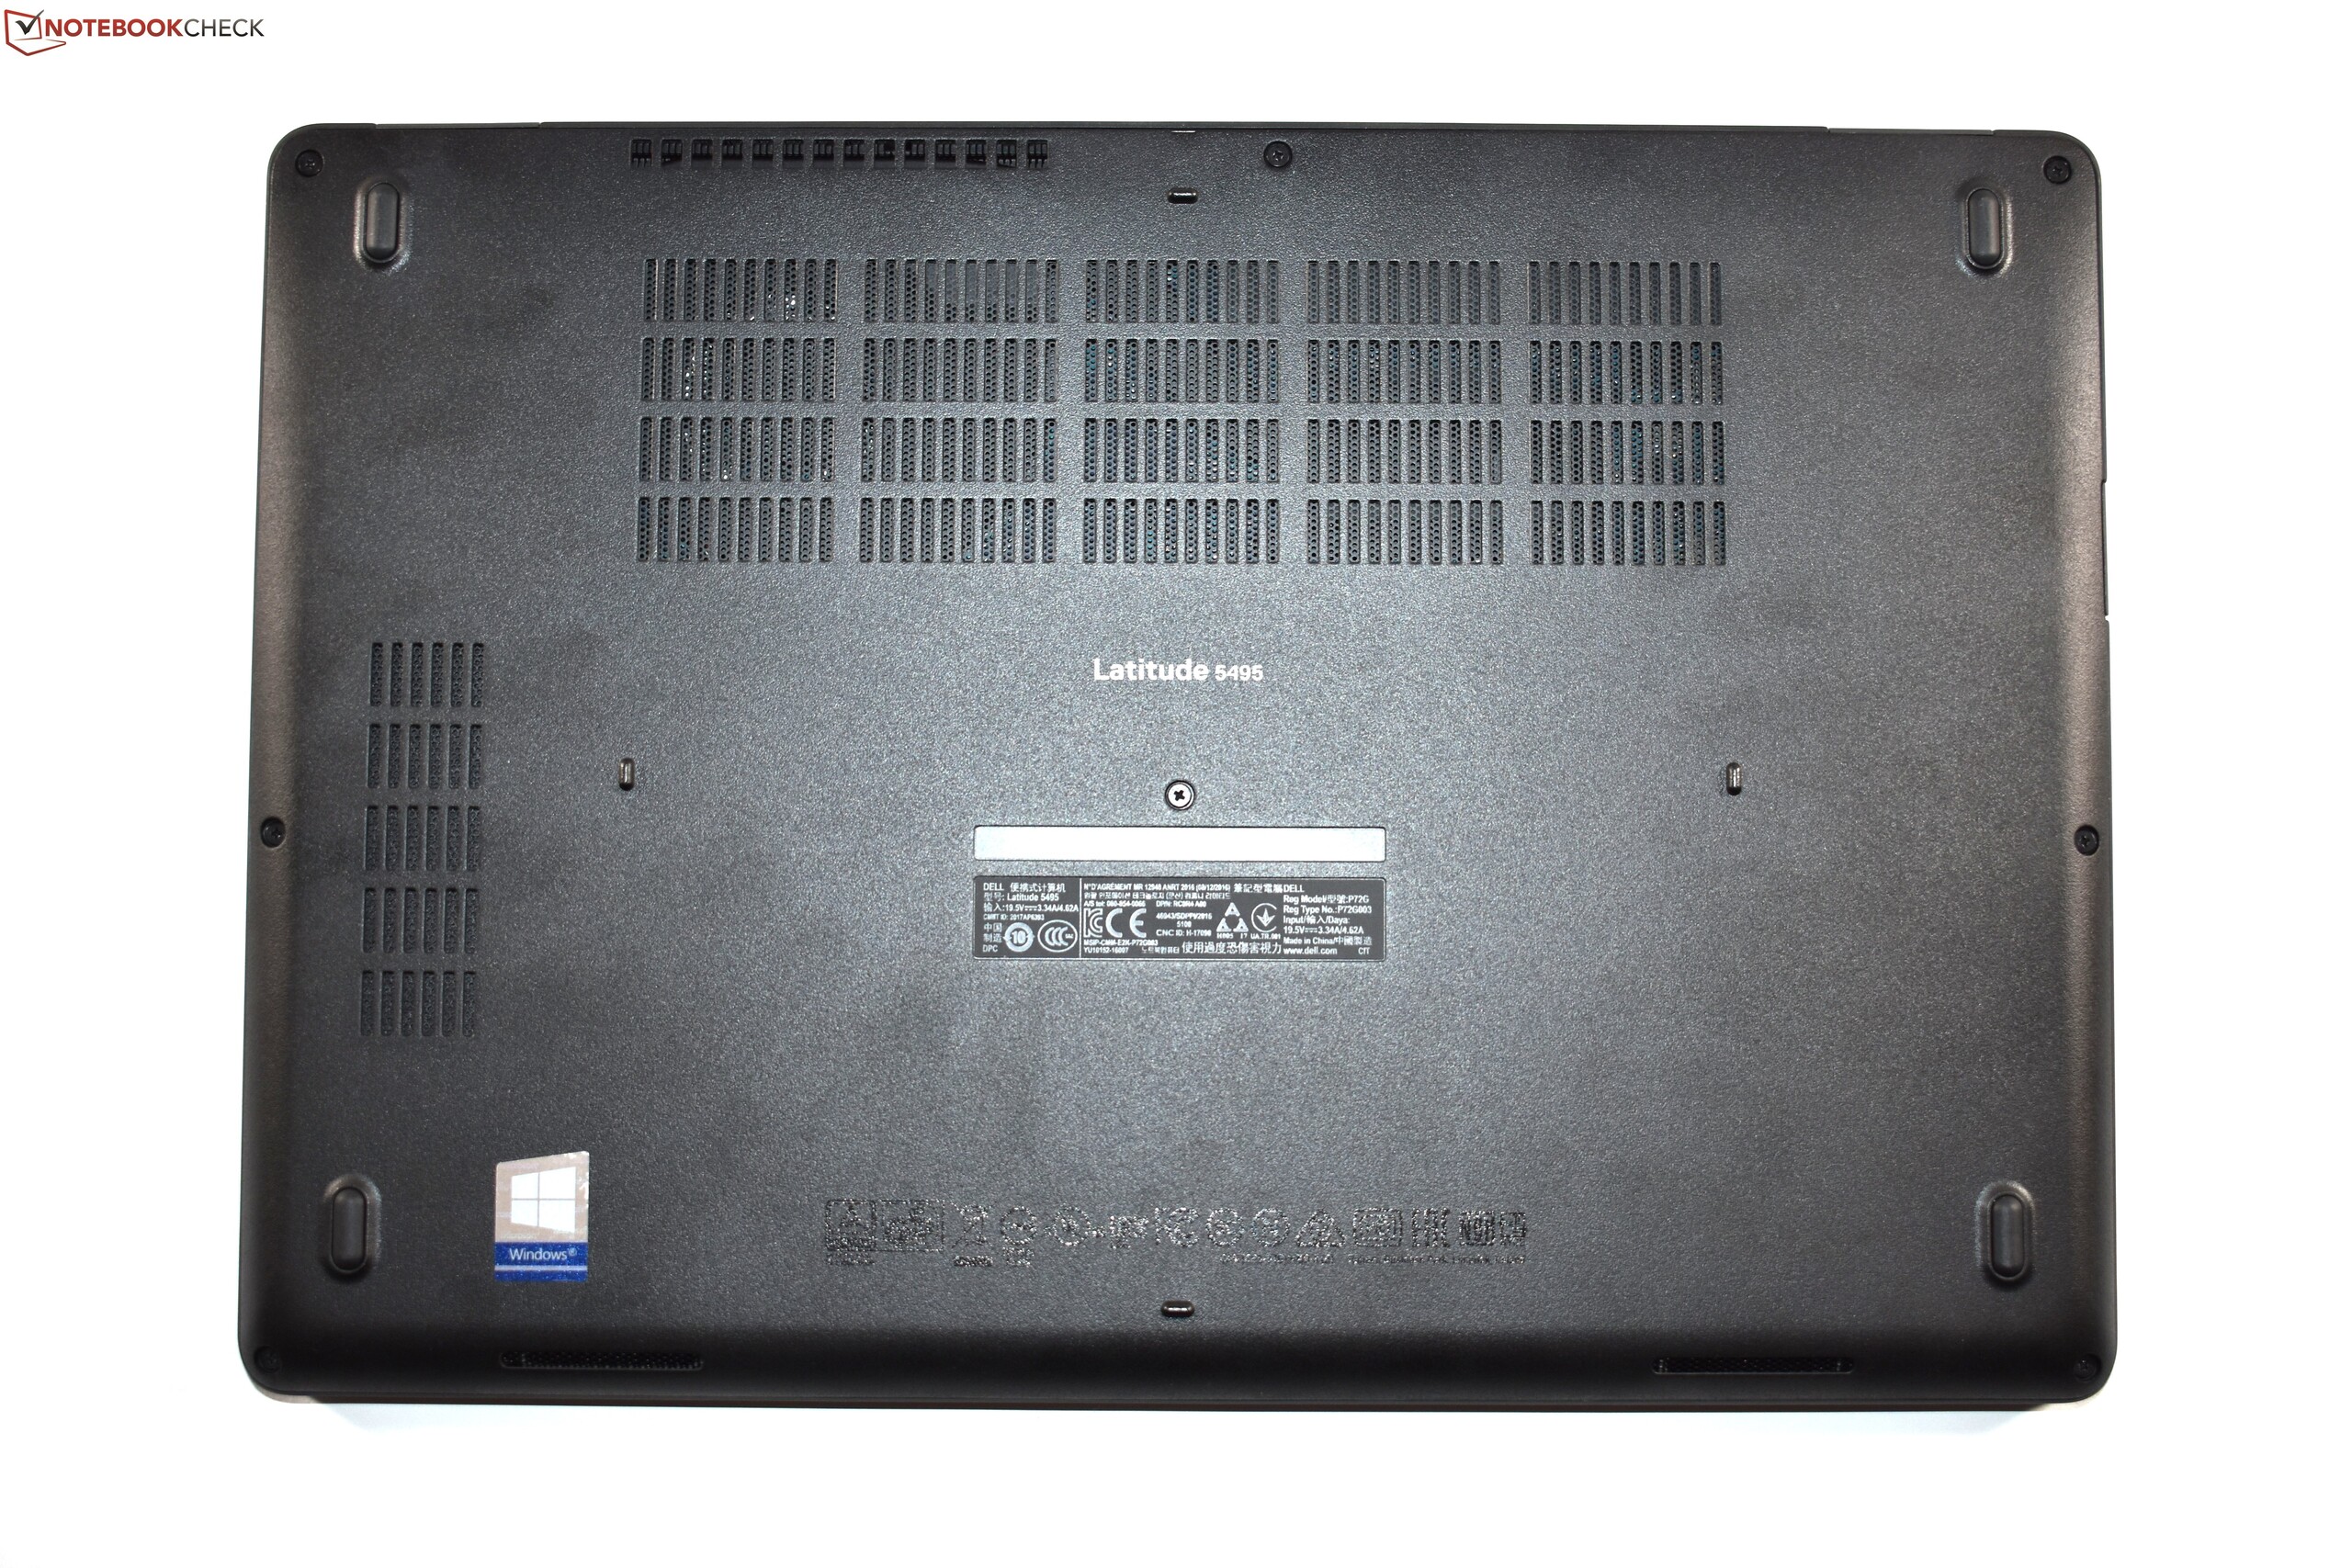
| Dell Latitude 14 5495 R7 2700U, Vega 10, 61 Wh | Dell Latitude 5490-TD70X i5-8350U, UHD Graphics 620, 68 Wh | Lenovo ThinkPad A485-20MU000CGE R5 PRO 2500U, Vega 8, 48 Wh | HP EliteBook 745 G5 3UN74EA R7 2700U, Vega 10, 50 Wh | Average of class Office | |
|---|---|---|---|---|---|
| Battery runtime | 21% | -45% | -35% | 18% | |
| Reader / Idle (h) | 18.2 | 25.9 42% | 11.2 -38% | 10.7 -41% | 22.2 ? 22% |
| H.264 (h) | 11.8 | 13.2 12% | 6.1 -48% | 7.1 -40% | 15.4 ? 31% |
| WiFi v1.3 (h) | 9.4 | 15 60% | 5.5 -41% | 6.6 -30% | 13.2 ? 40% |
| Load (h) | 2.3 | 1.6 -30% | 1.1 -52% | 1.6 -30% | 1.808 ? -21% |
Pros
Cons
戴尔Latitude 5495可以是AMD Ryzen移动端中非常好的一款产品。这里的重点是“可能”,因为戴尔也在很多地方做错了。
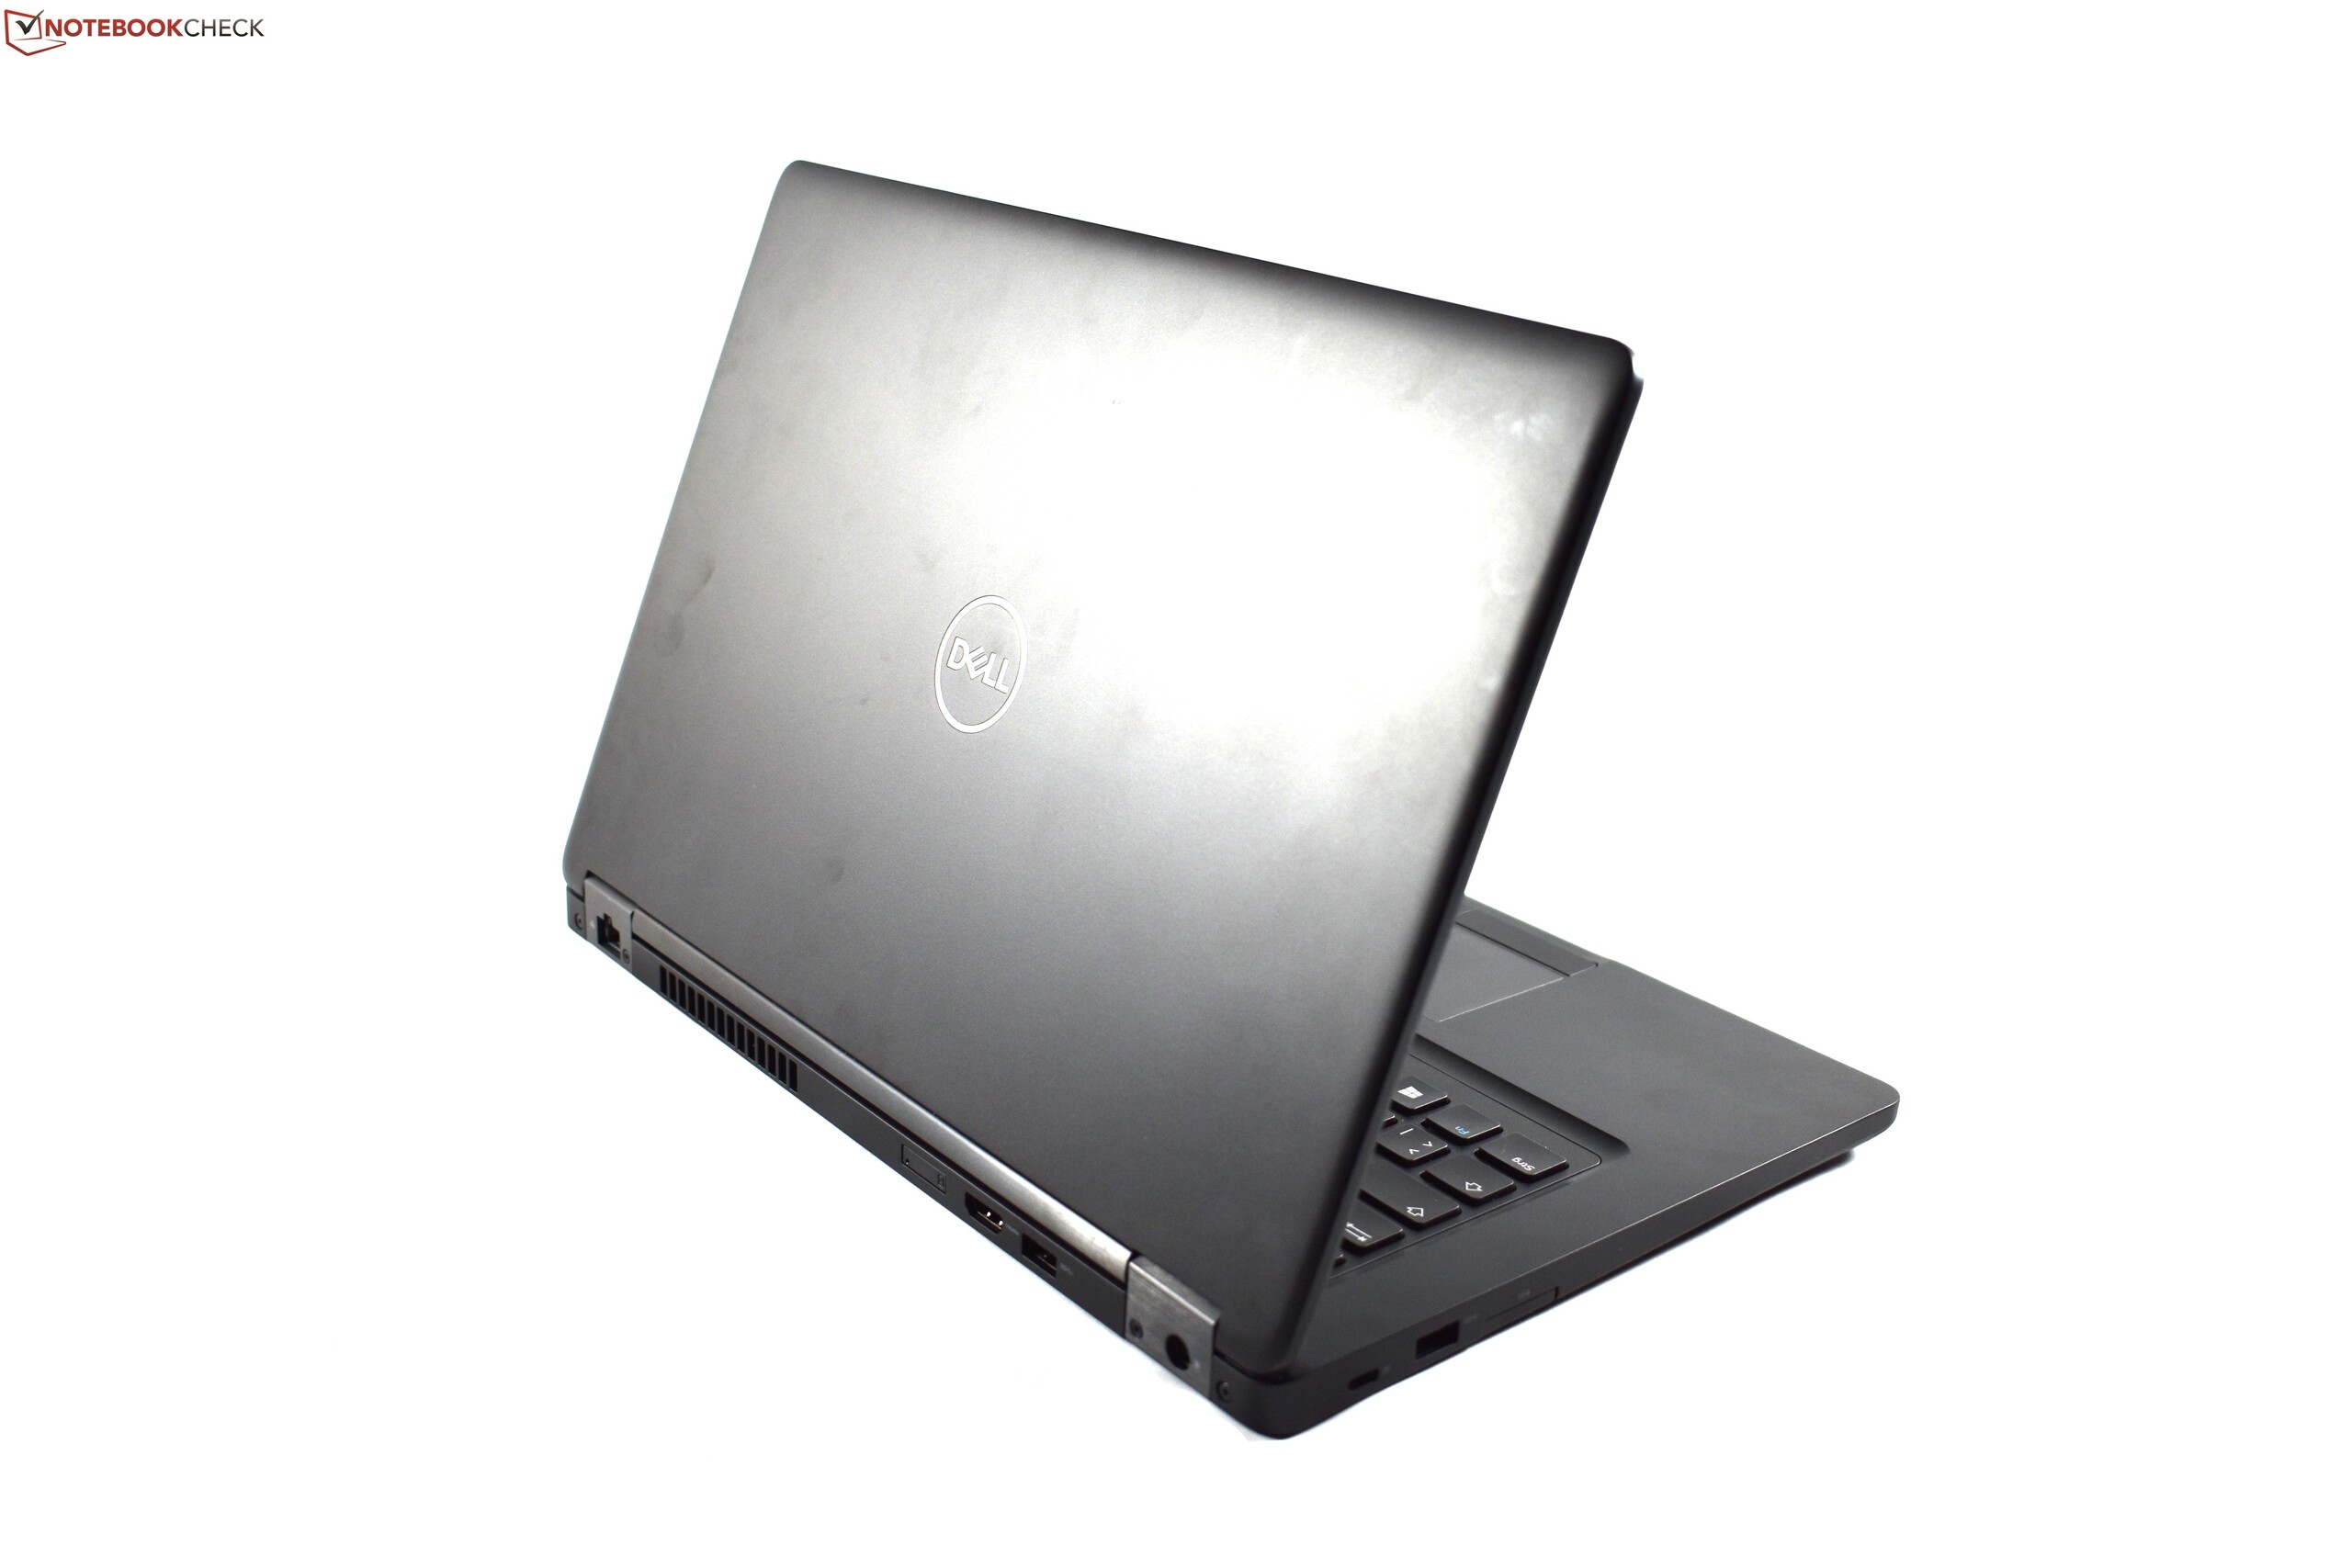
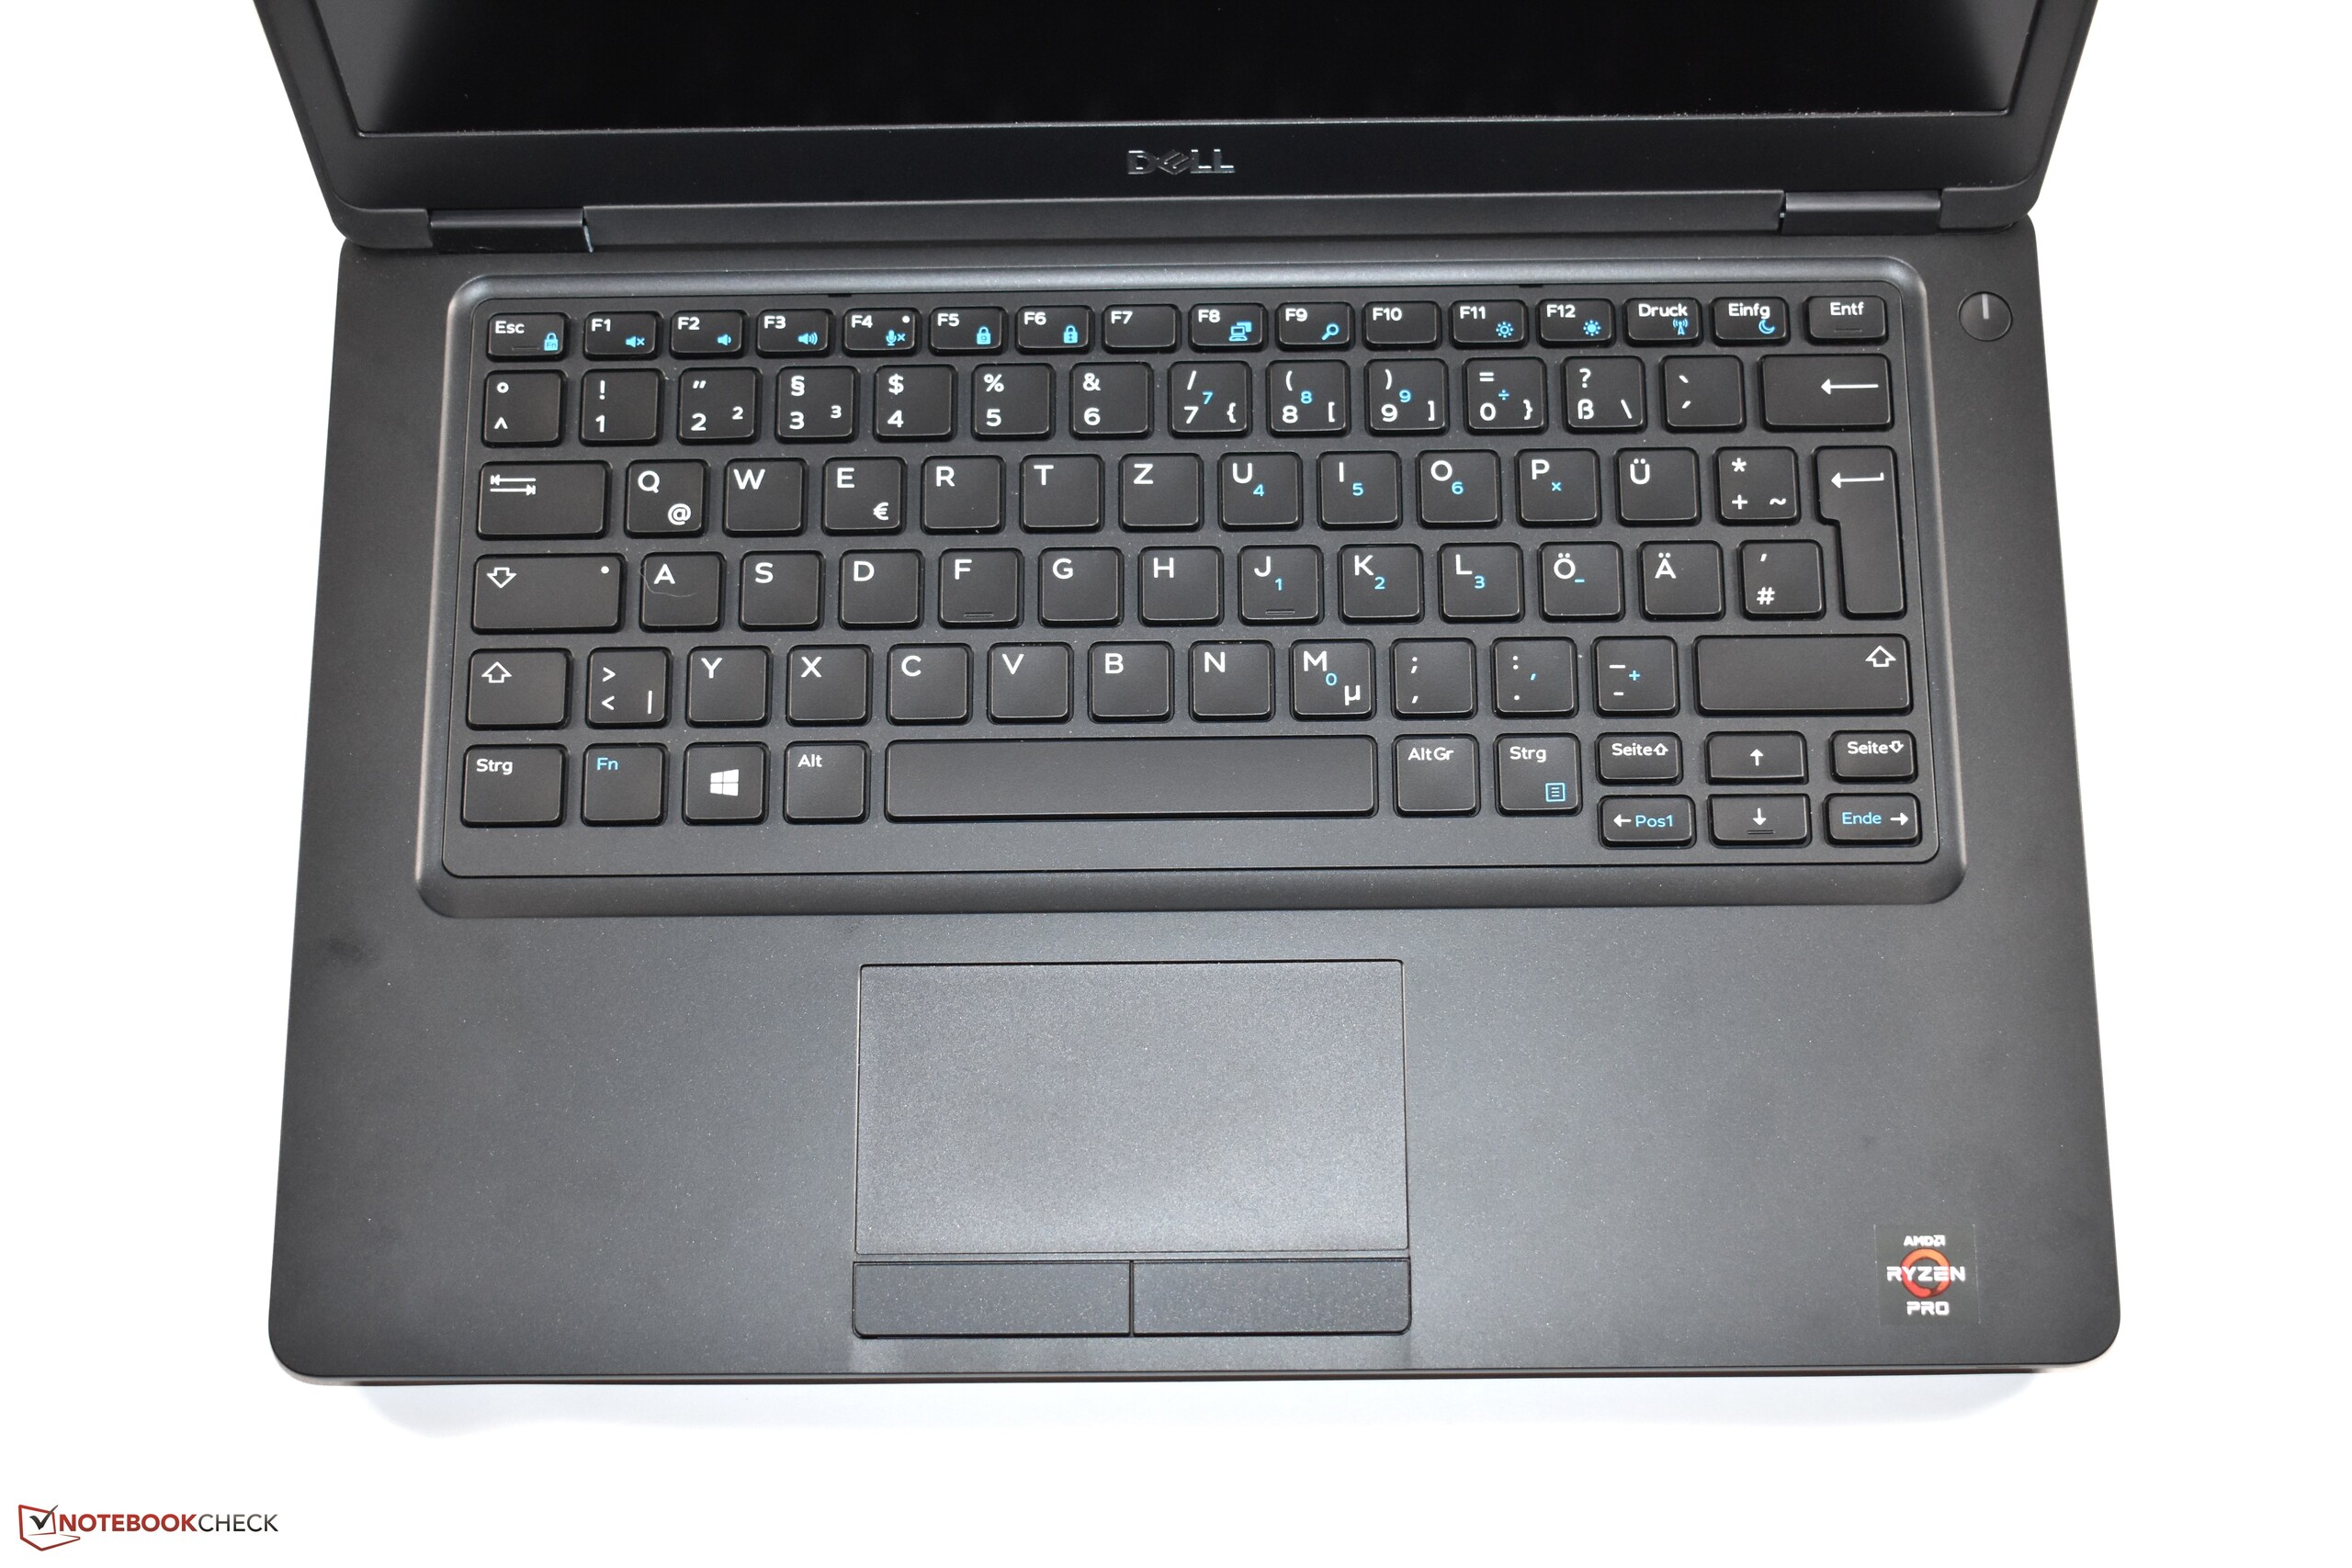
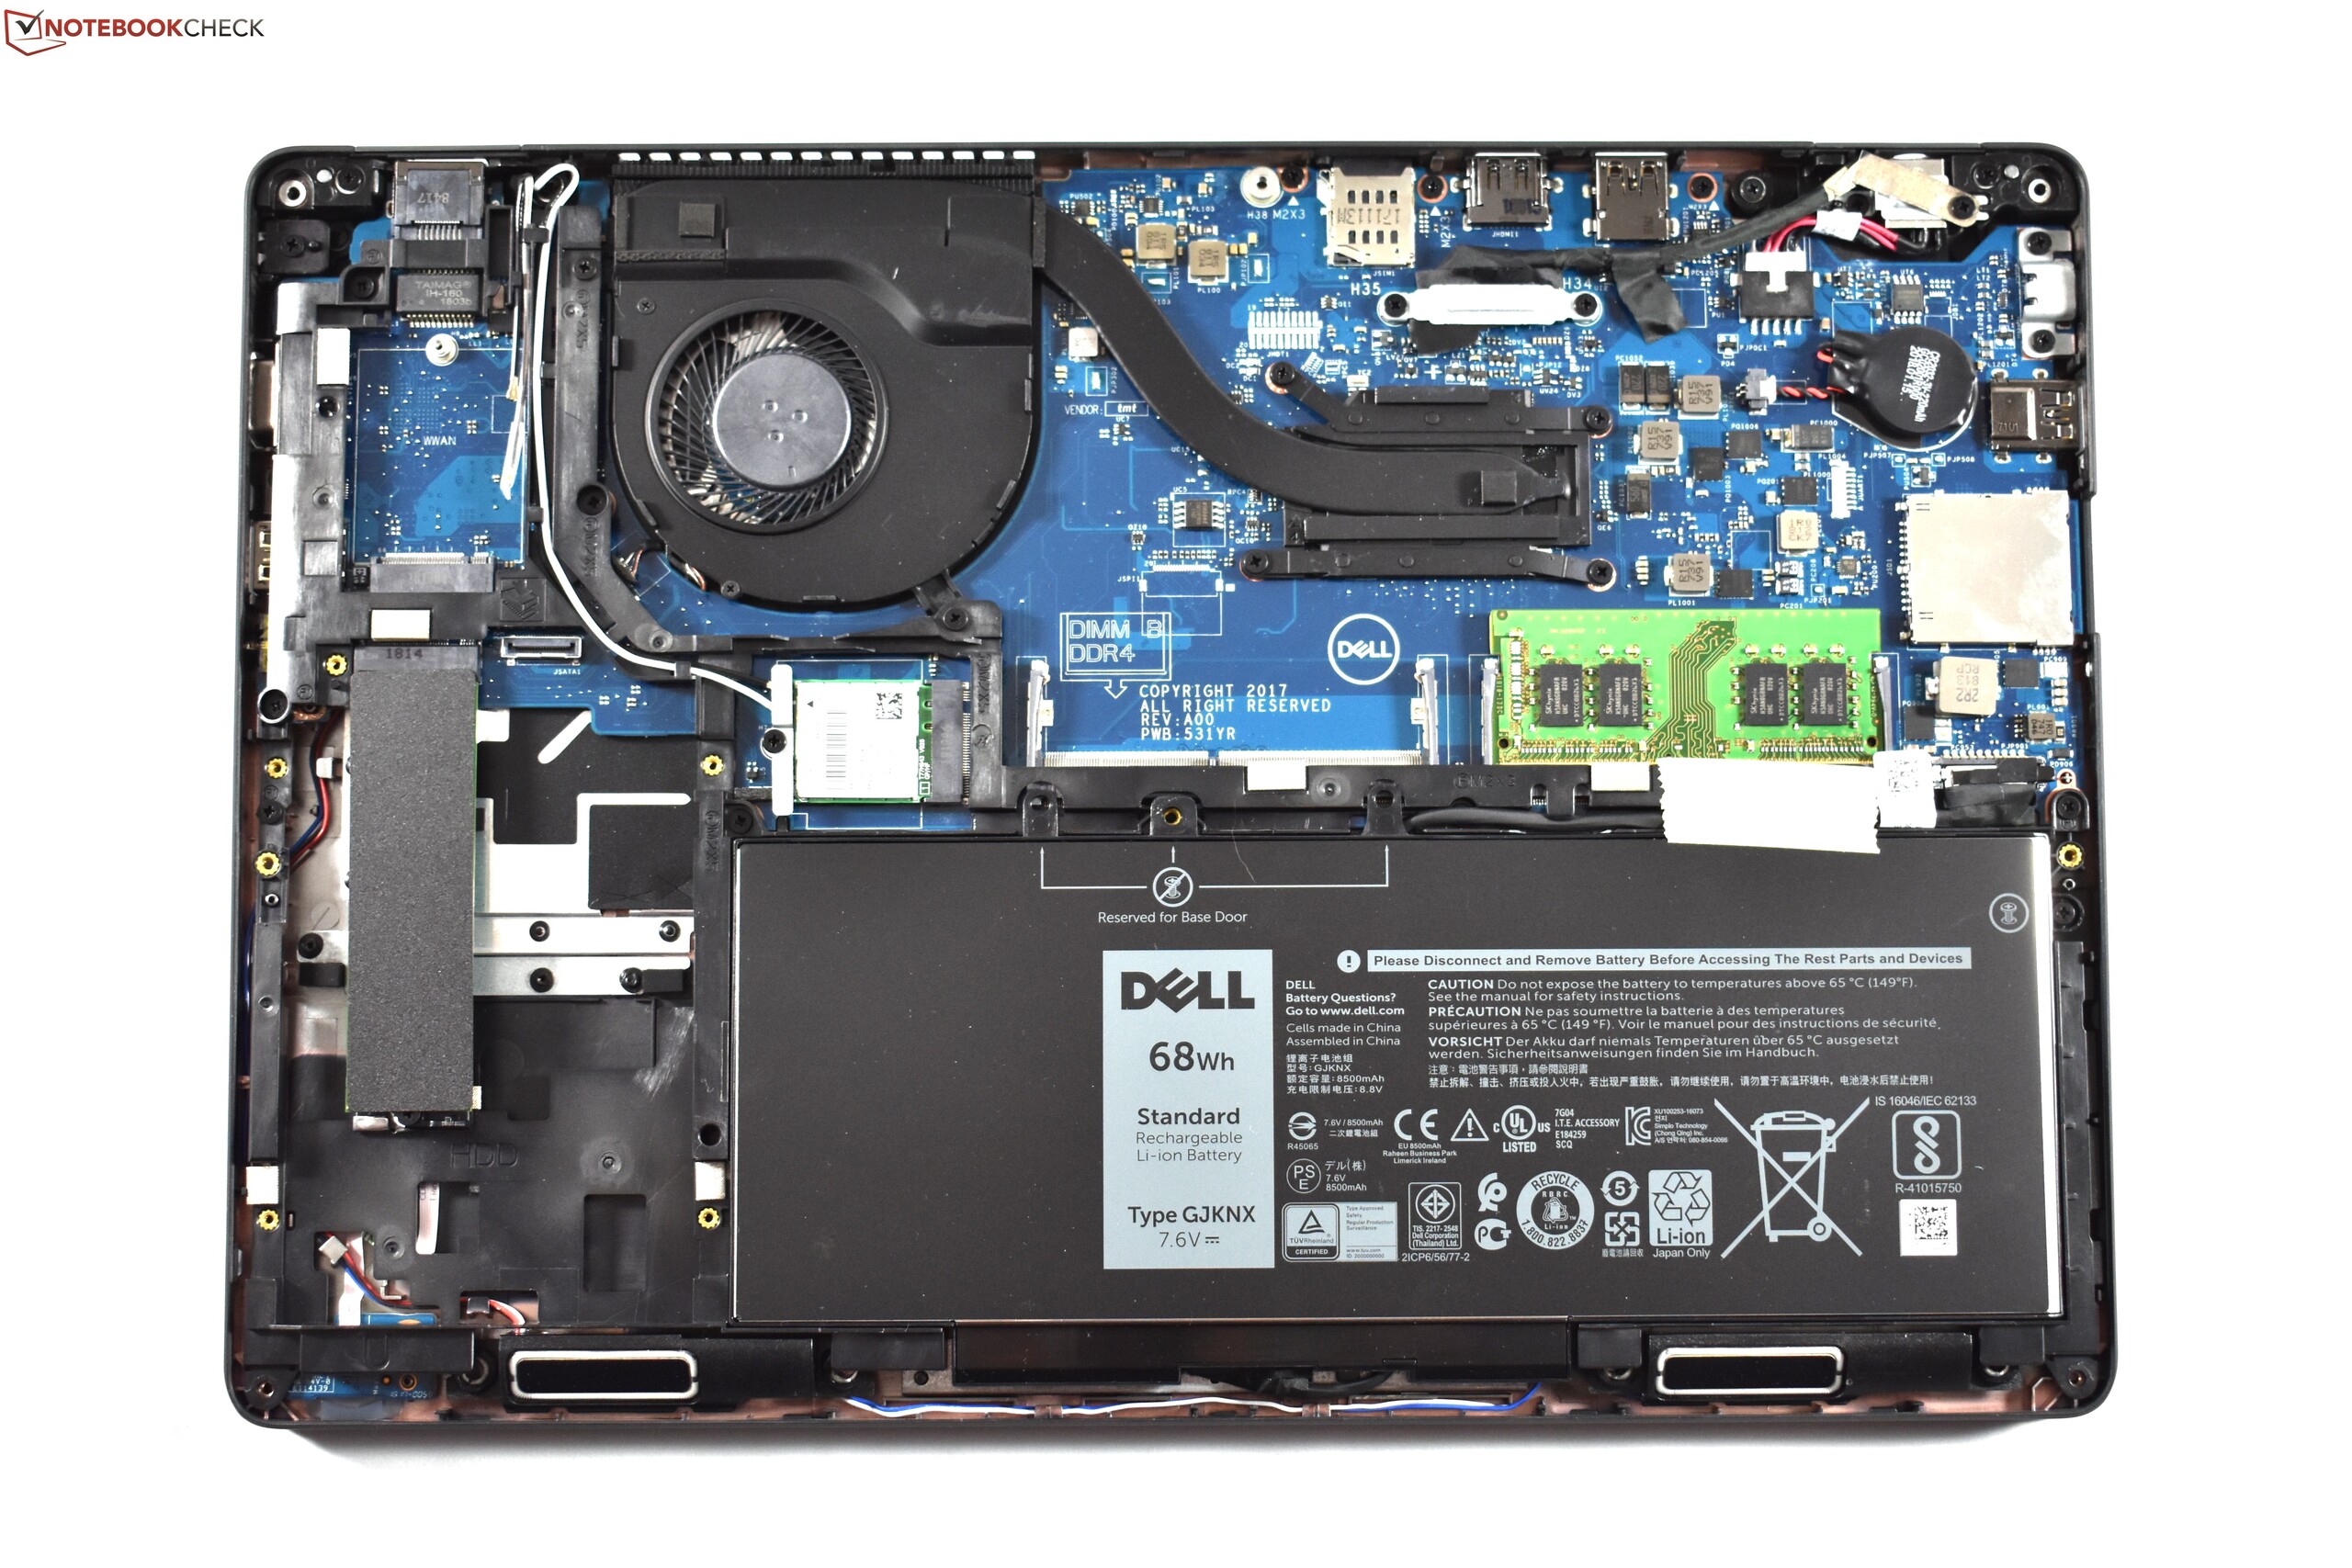
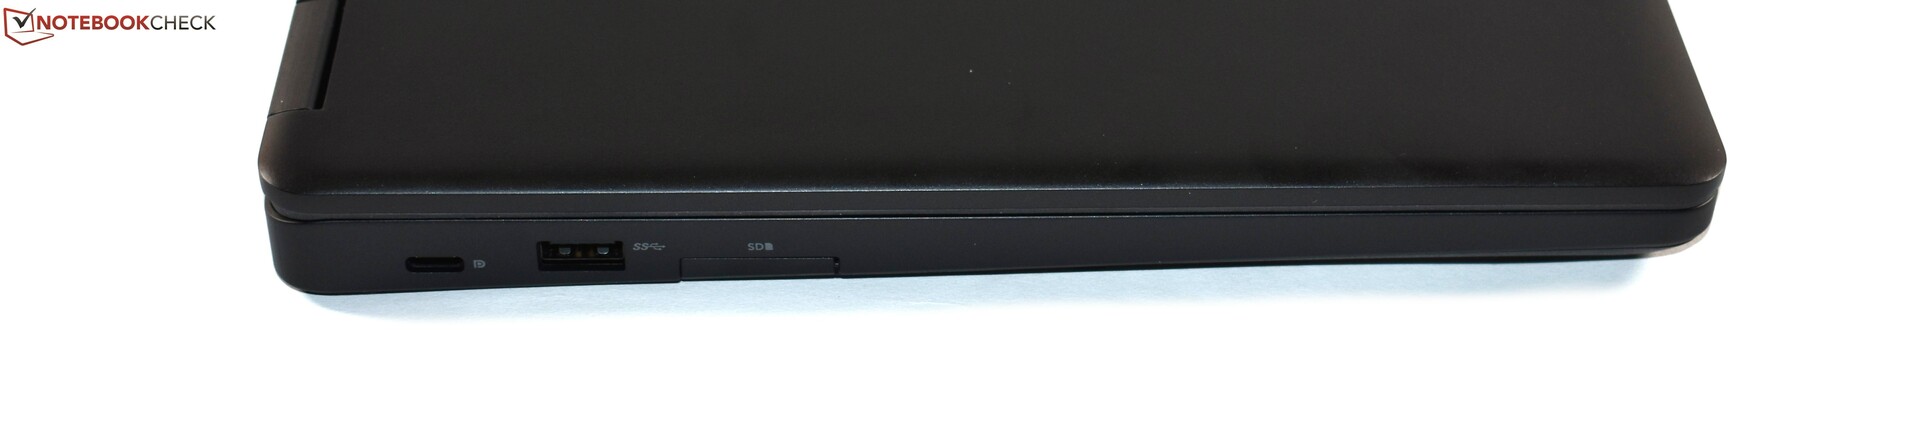
首先要说的是:我们非常感兴趣的是Latitude如何利用Ryzen的性能潜力 - 这方面我们给出的评价是“非常好的”。 Latitude 5495能够击败其英特尔型号的Latitude 5490以及联想ThinkPad A485和HP EliteBook 745 G5等知名竞争对手。尽管Latitude的电池容量小于宣传的容量,但两者在电池续航方面也要差得多。除了这些优势,Latitude 5495还提供了一个非常快速的SD卡读卡器,一个强大的机身,具有良好的可升级性和不错的输入设备。此外,风扇在闲置时保持静音,而机身即使在负载下也不会变得很热。
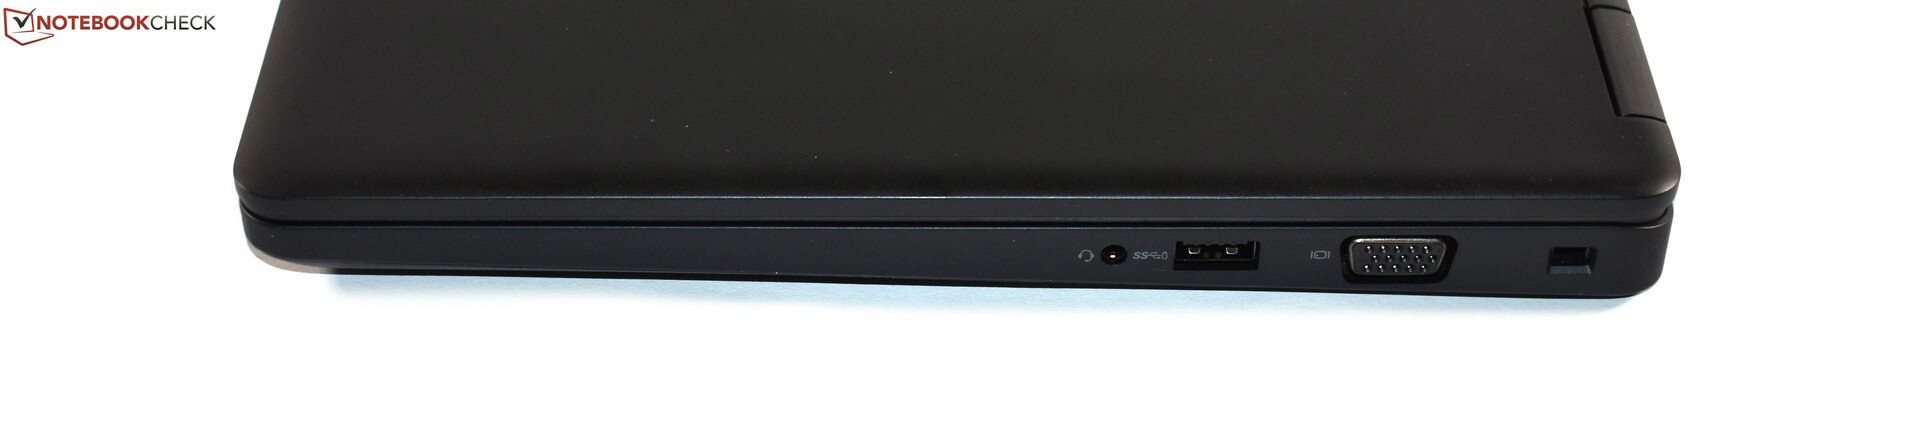
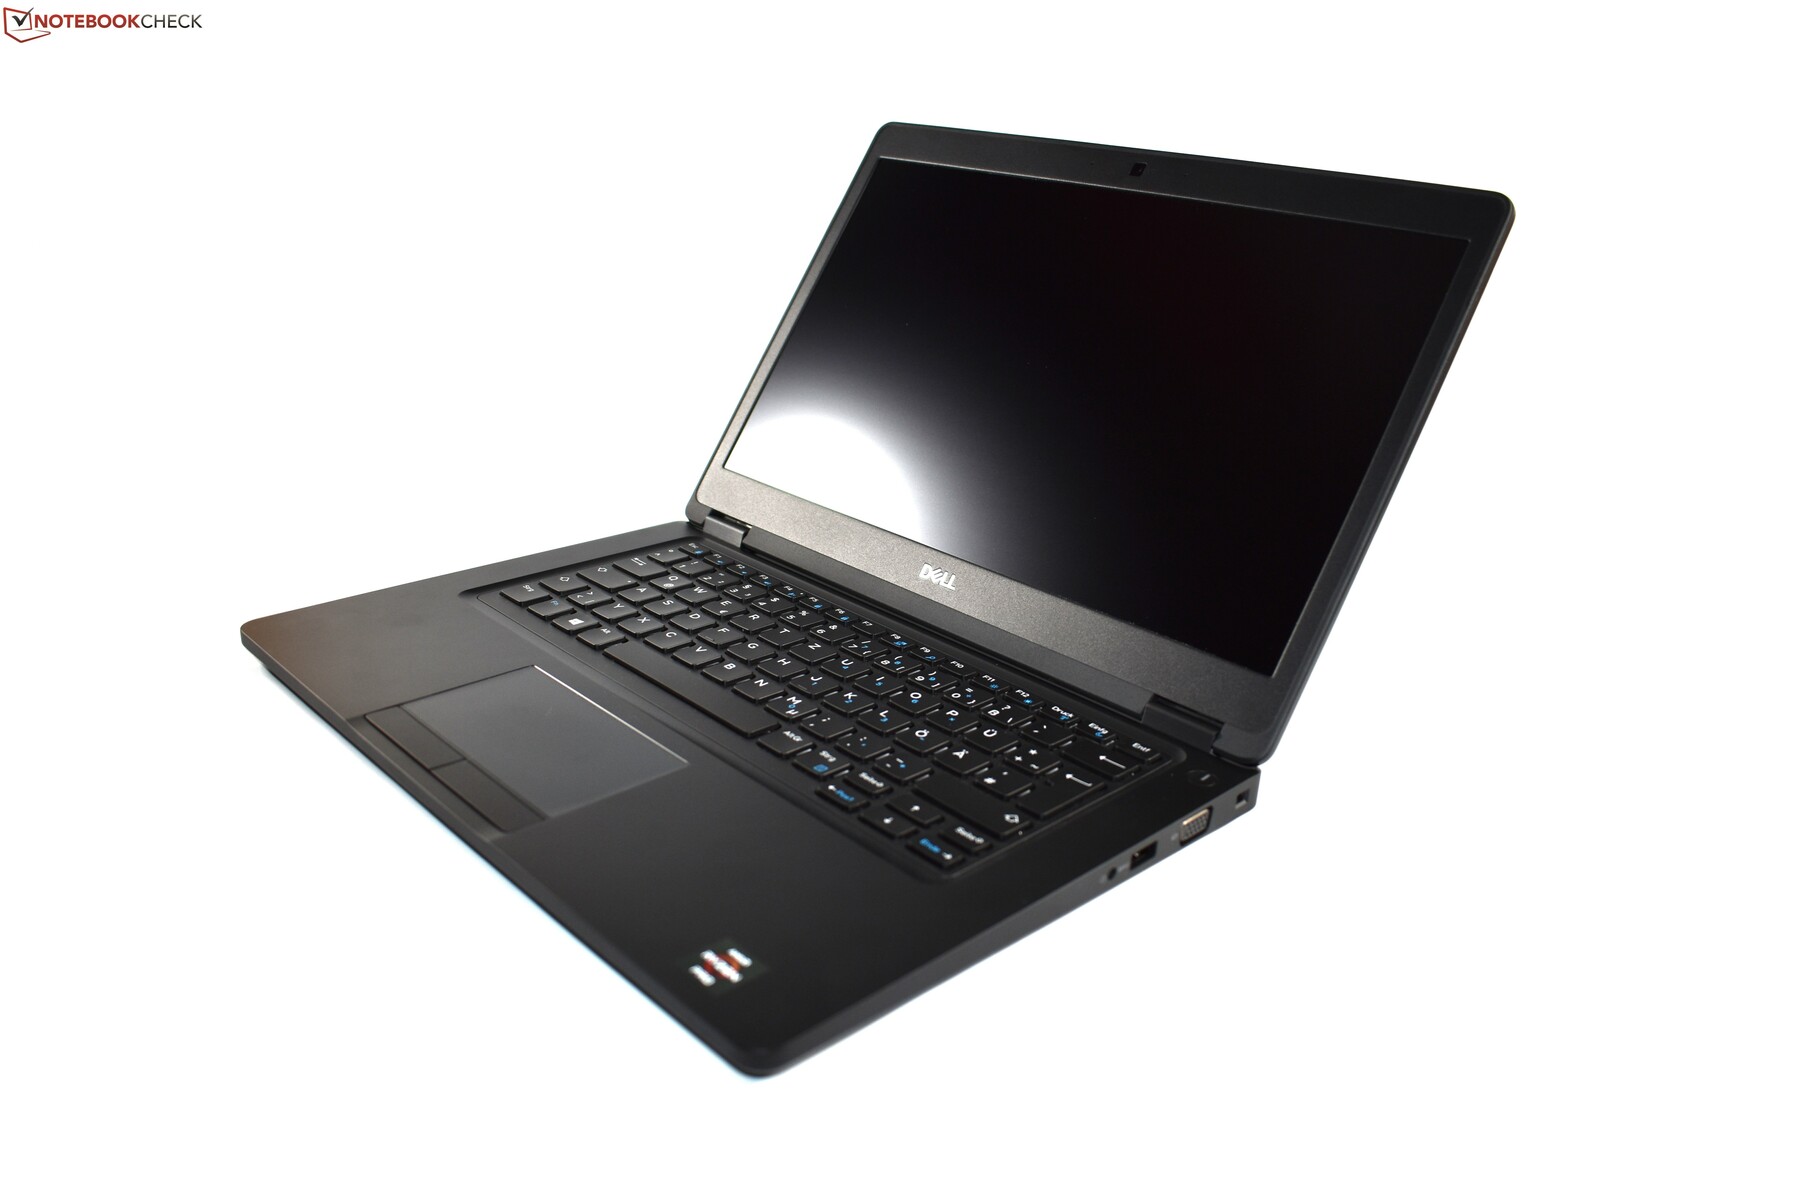
有闪光点,也有阴暗面。这里的问题主要表现在屏幕上。屏幕模糊不清,平均亮度只有200 cd /m²。因为在明亮的室内环境中200 cd /m²甚至可能都存在问题。此外,屏幕表现出漏光并且其色彩空间覆盖不足。屏幕是最明显的问题,但不是唯一的问题。其机身比竞争对手更重,更厚,这可能解释了戴尔如何能够装入这么大的电池。戴尔Latitude 5495还缺少了我们期望在这个价格范围的商务笔记本电脑中找到的功能。例如指纹读取器,指点杆或背光键盘——这些功能仅作为昂贵的选项提供。雷电3也不可用,但在这种情况下甚至不作为选项(主要是AMD不支持雷电3)。此外,戴尔在SSD上偷工减料。对于短短12个月的标准保修,情况也是如此。
评价不好做:戴尔Latitude 5495有许多积极的方面,但也有许多缺点。
在这种情况下,我们很难推荐一种设备或建议购买它。戴尔Latitude 5495当然有其优势,但对于我们来说,屏幕只是一个缺点——但我们也知道许多商业客户往往有不同的优先级而不是屏幕质量。考虑到所有因素,我们可能更喜欢竞争对手联想ThinkPad A485和HP EliteBook 745 G5,尽管它们的电池续航时间不如戴尔。无论如何,AMD Ryzen的完美笔记本电脑尚未出现。
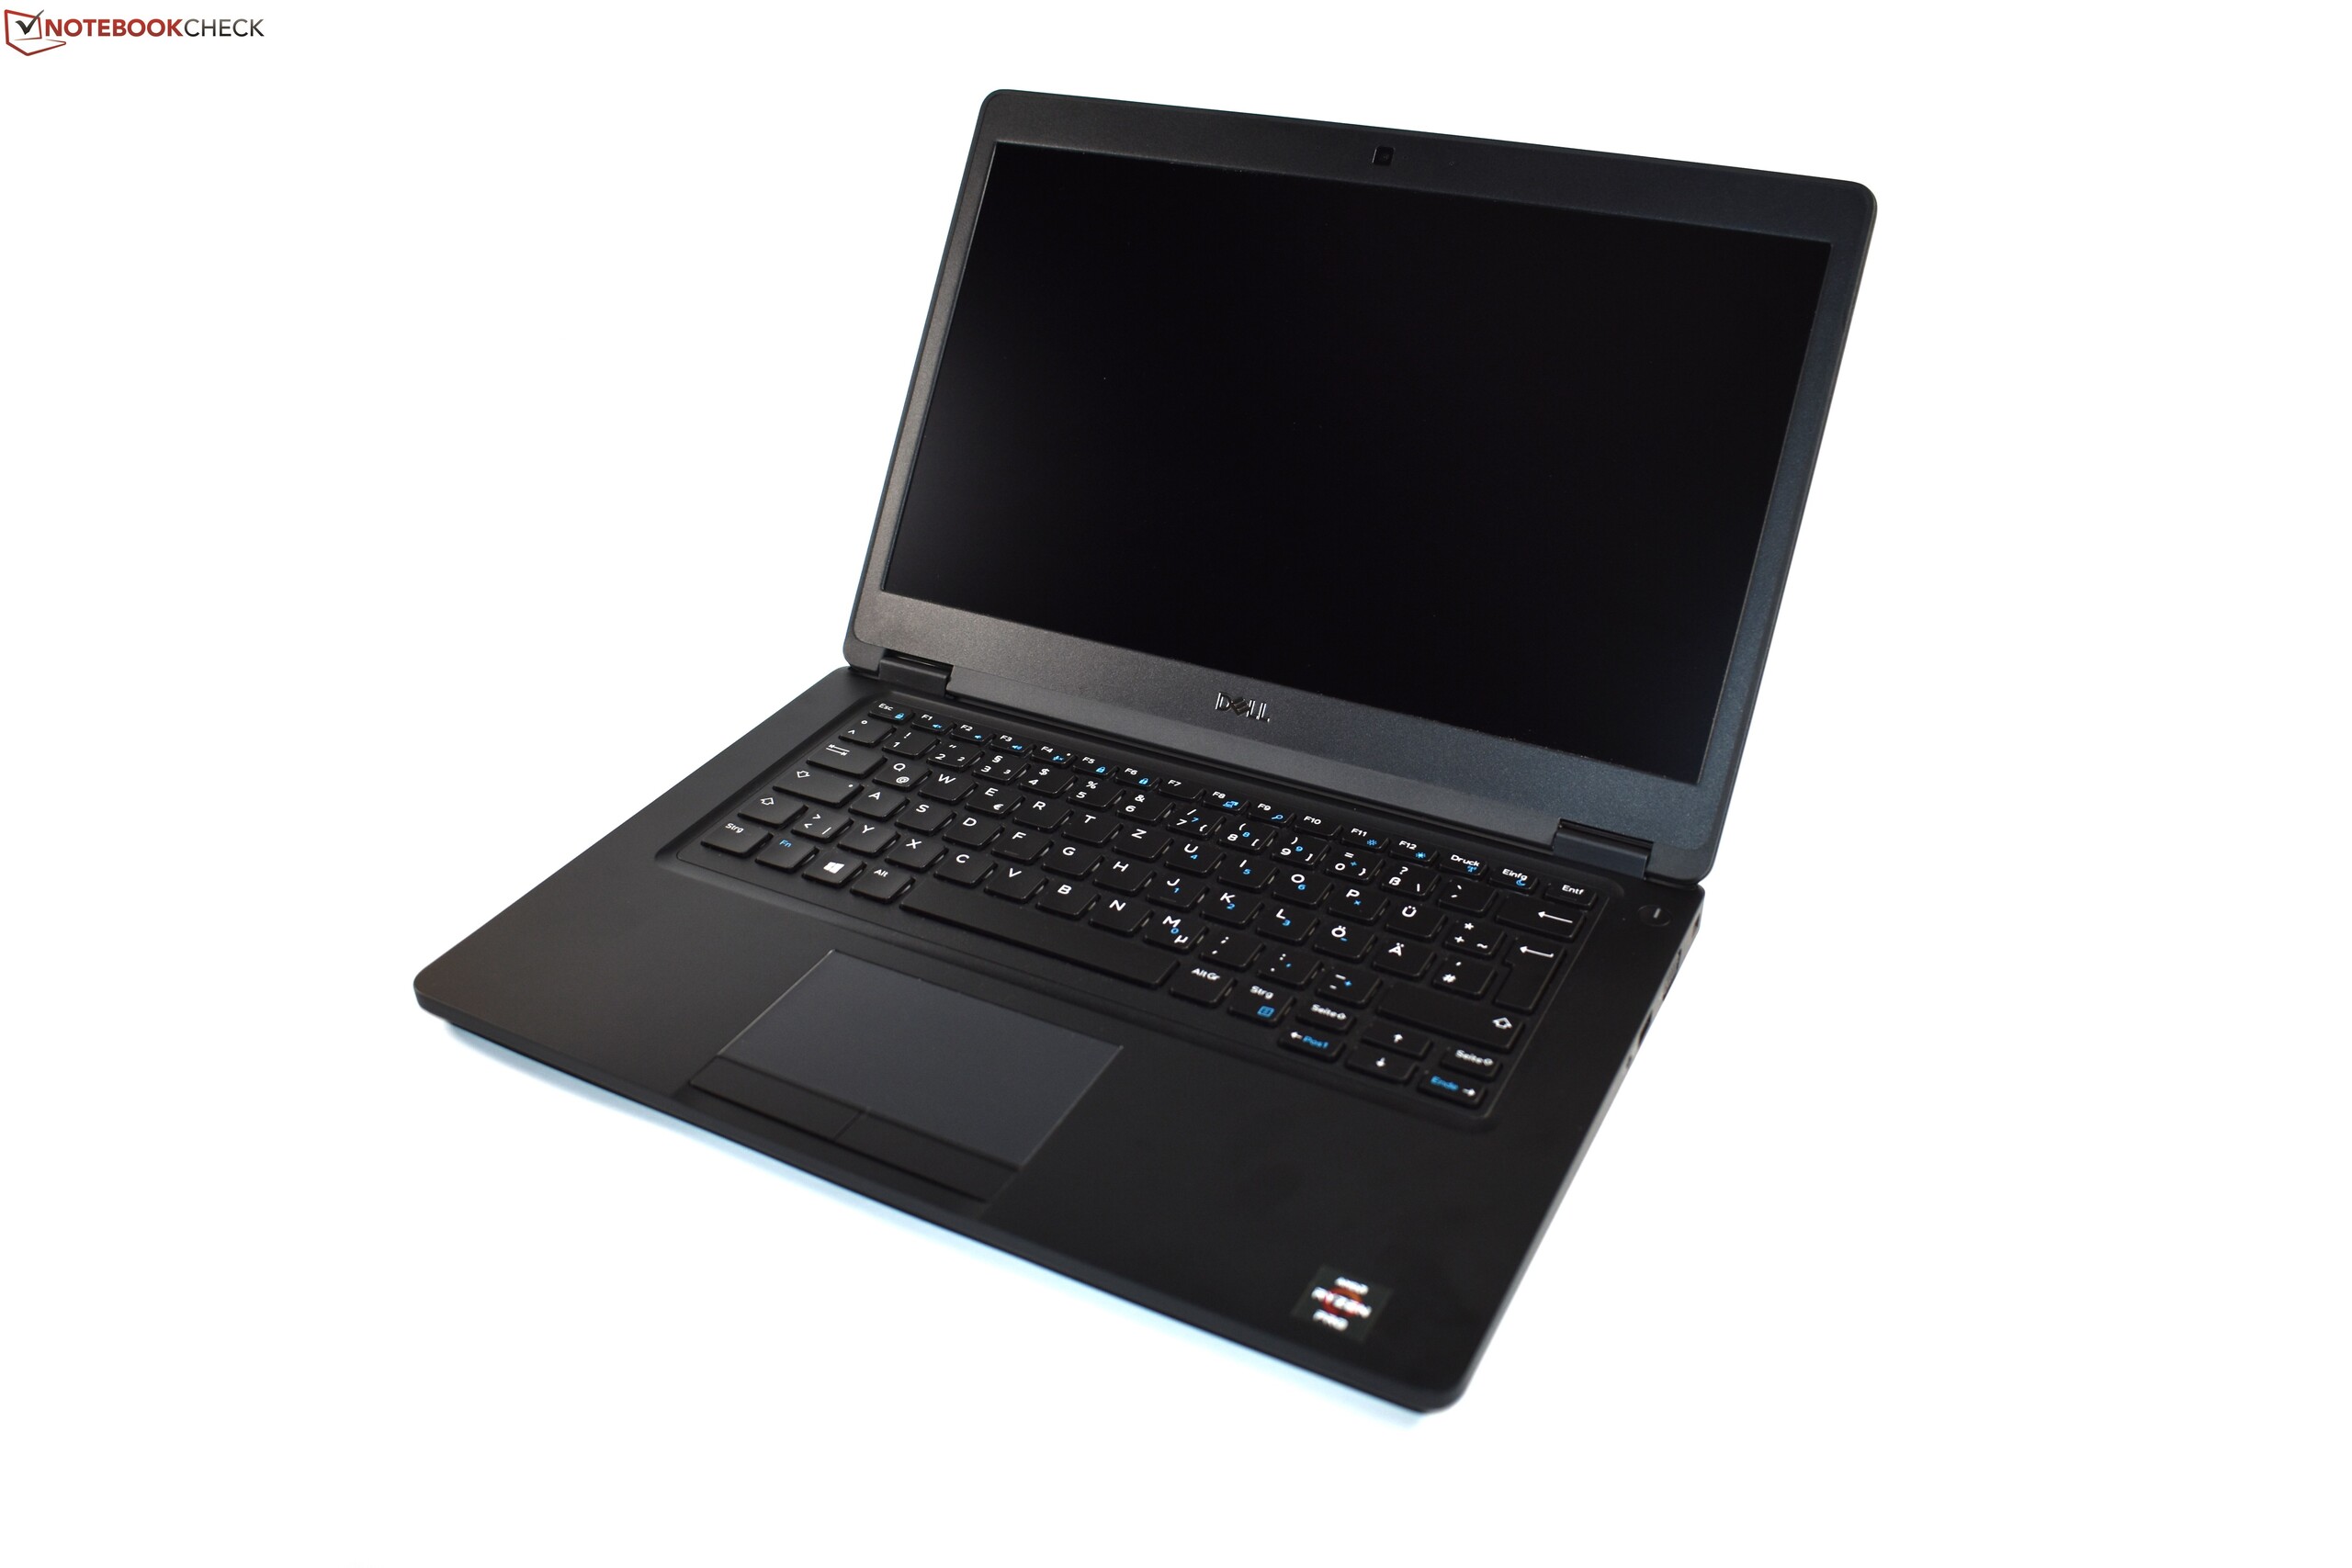
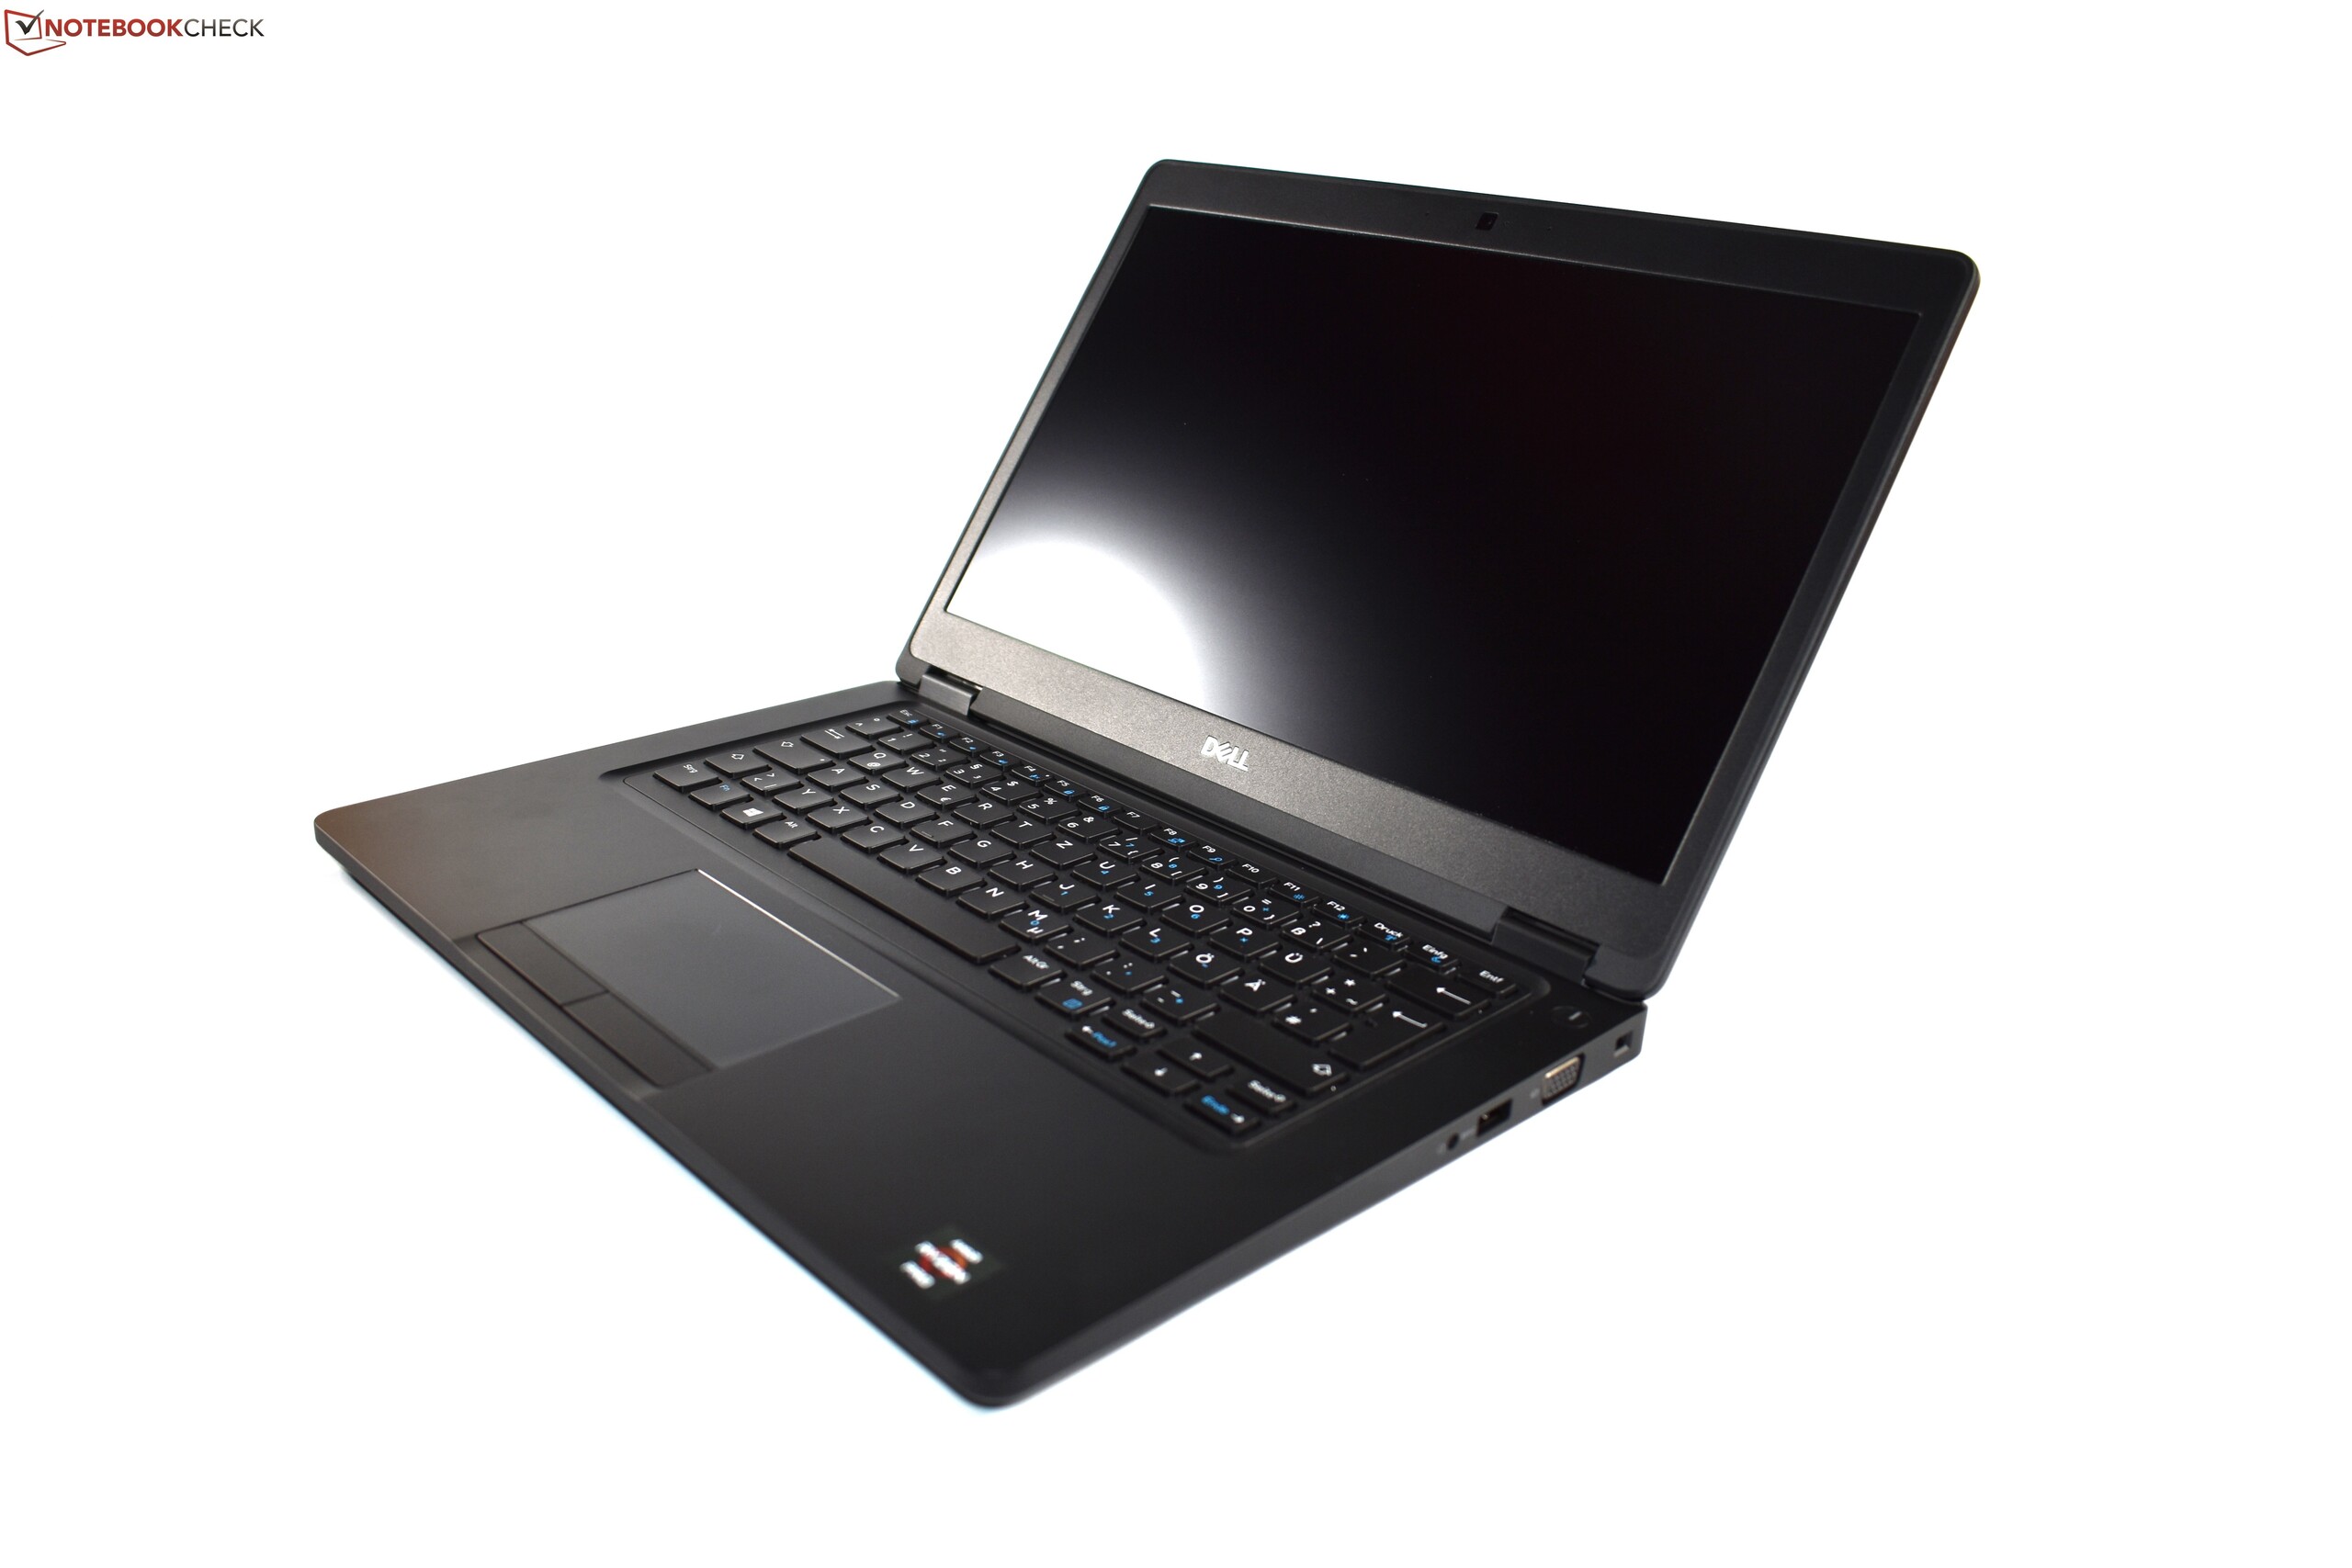
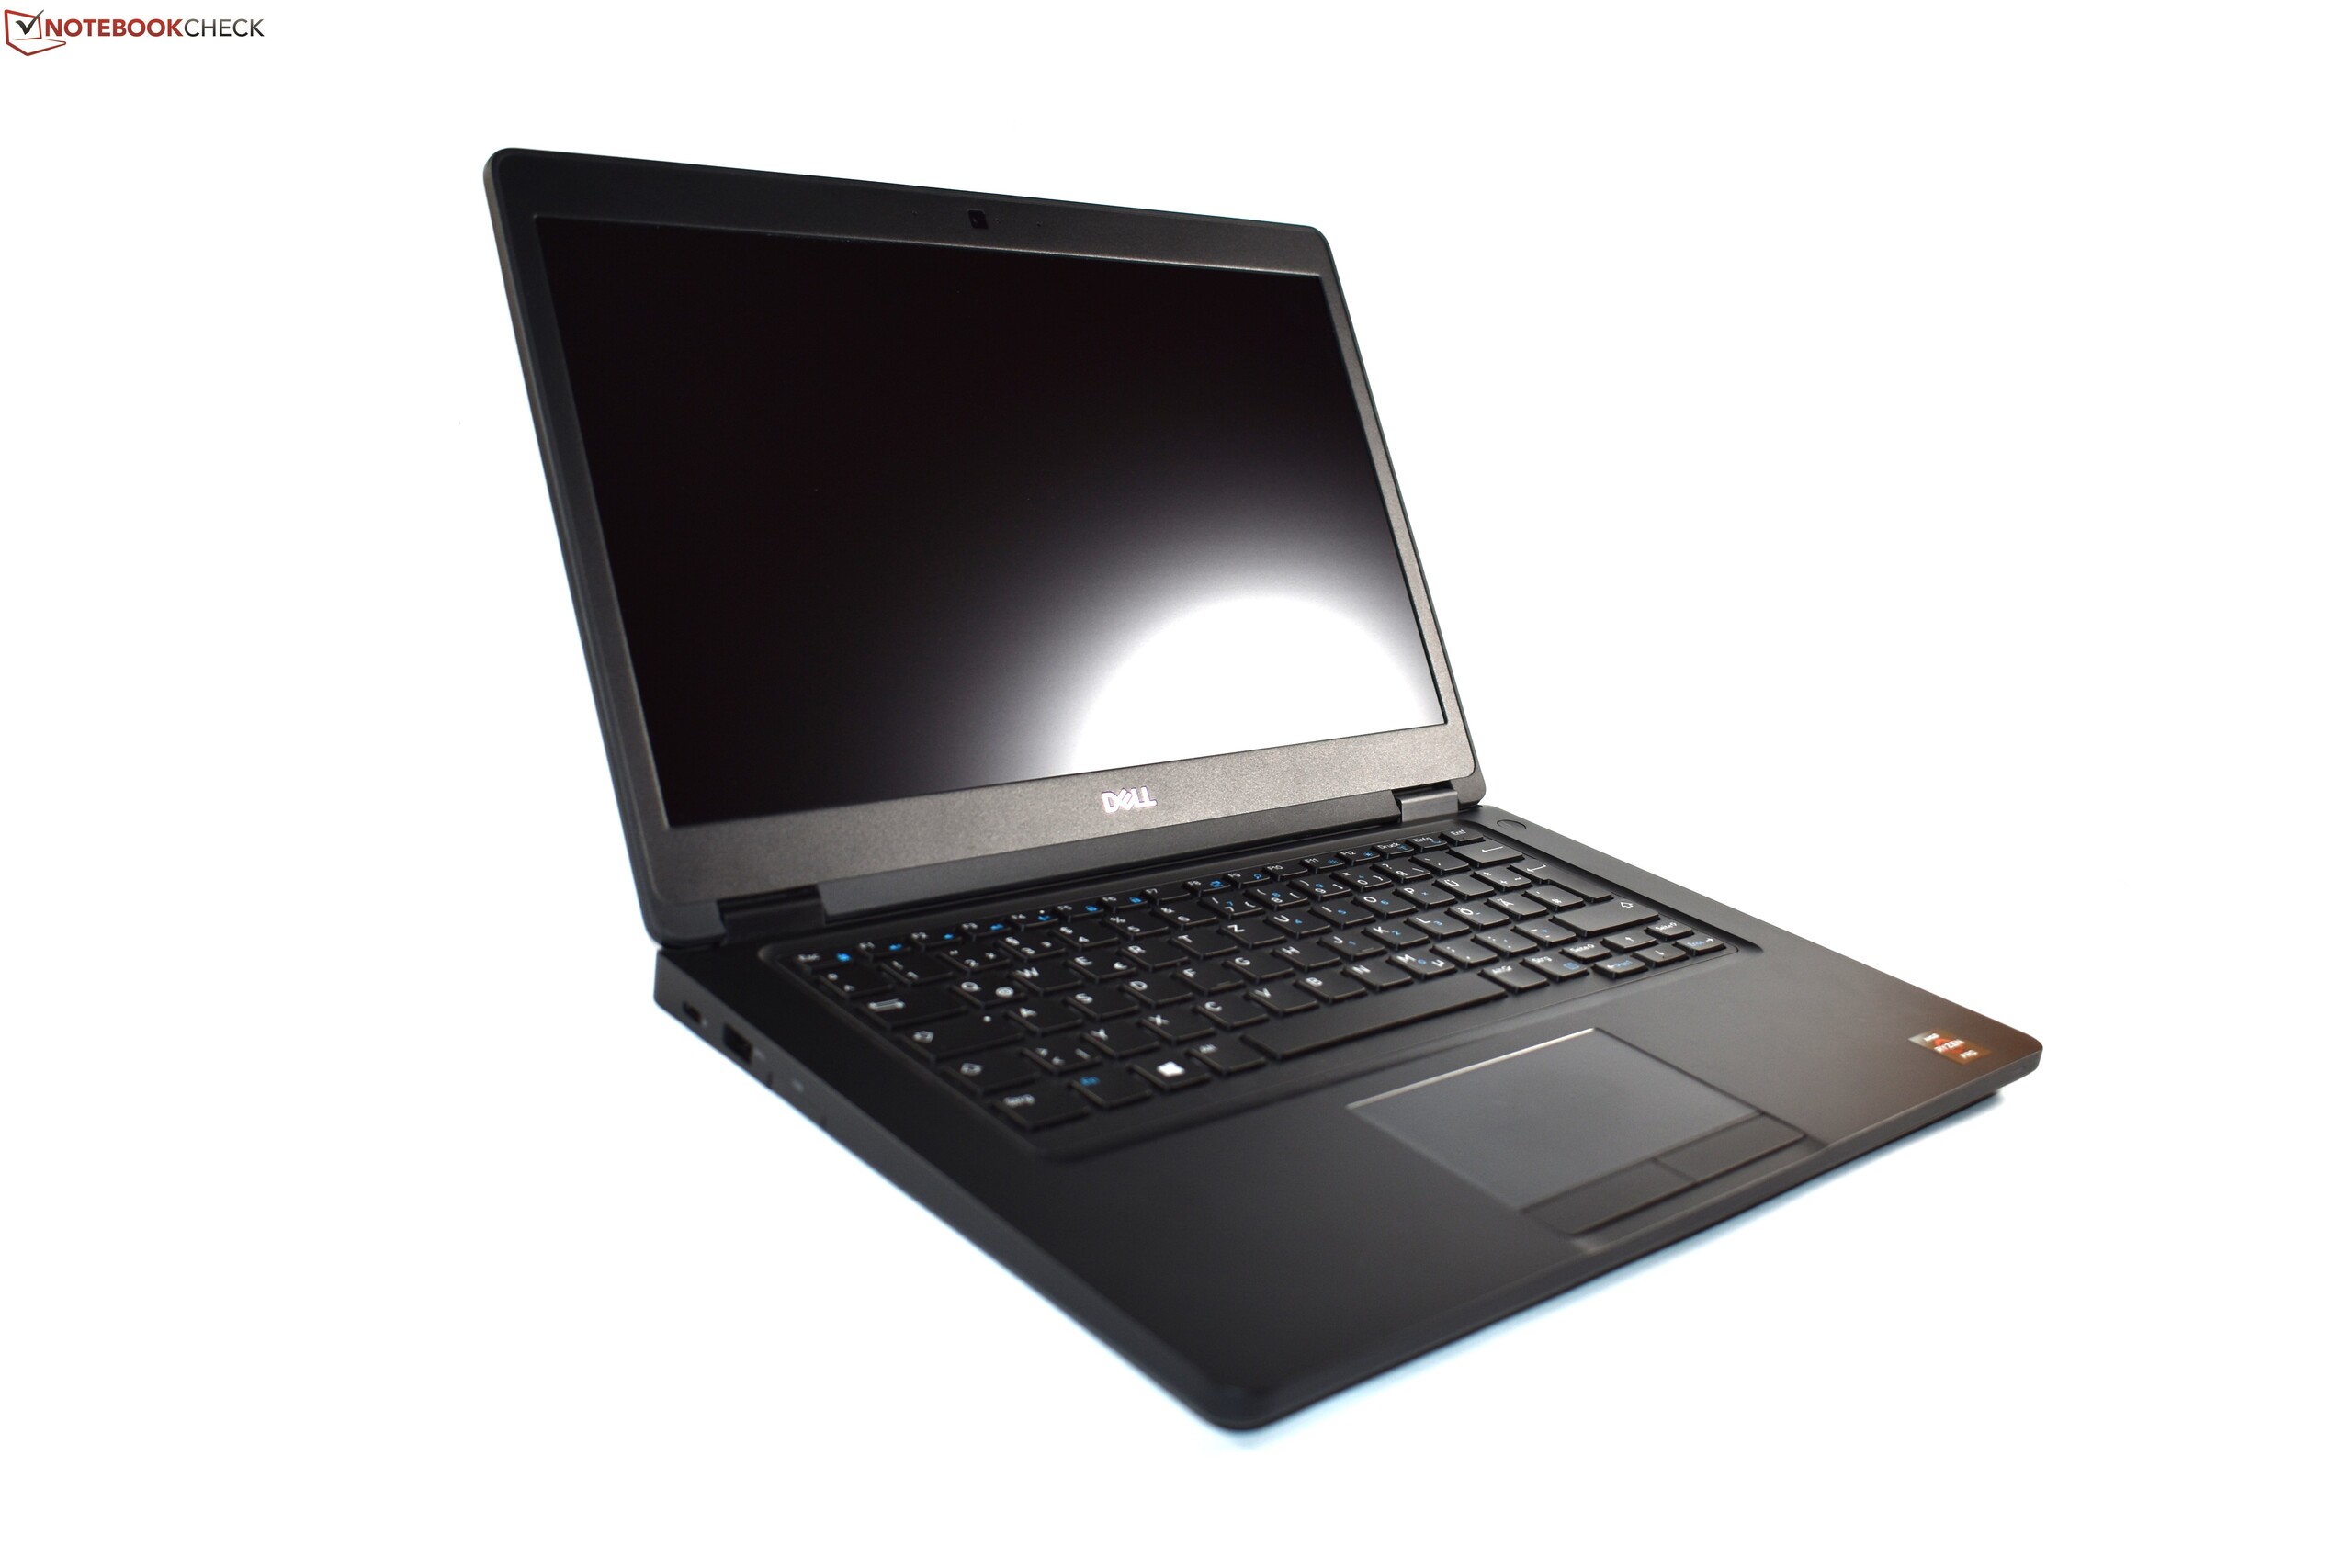
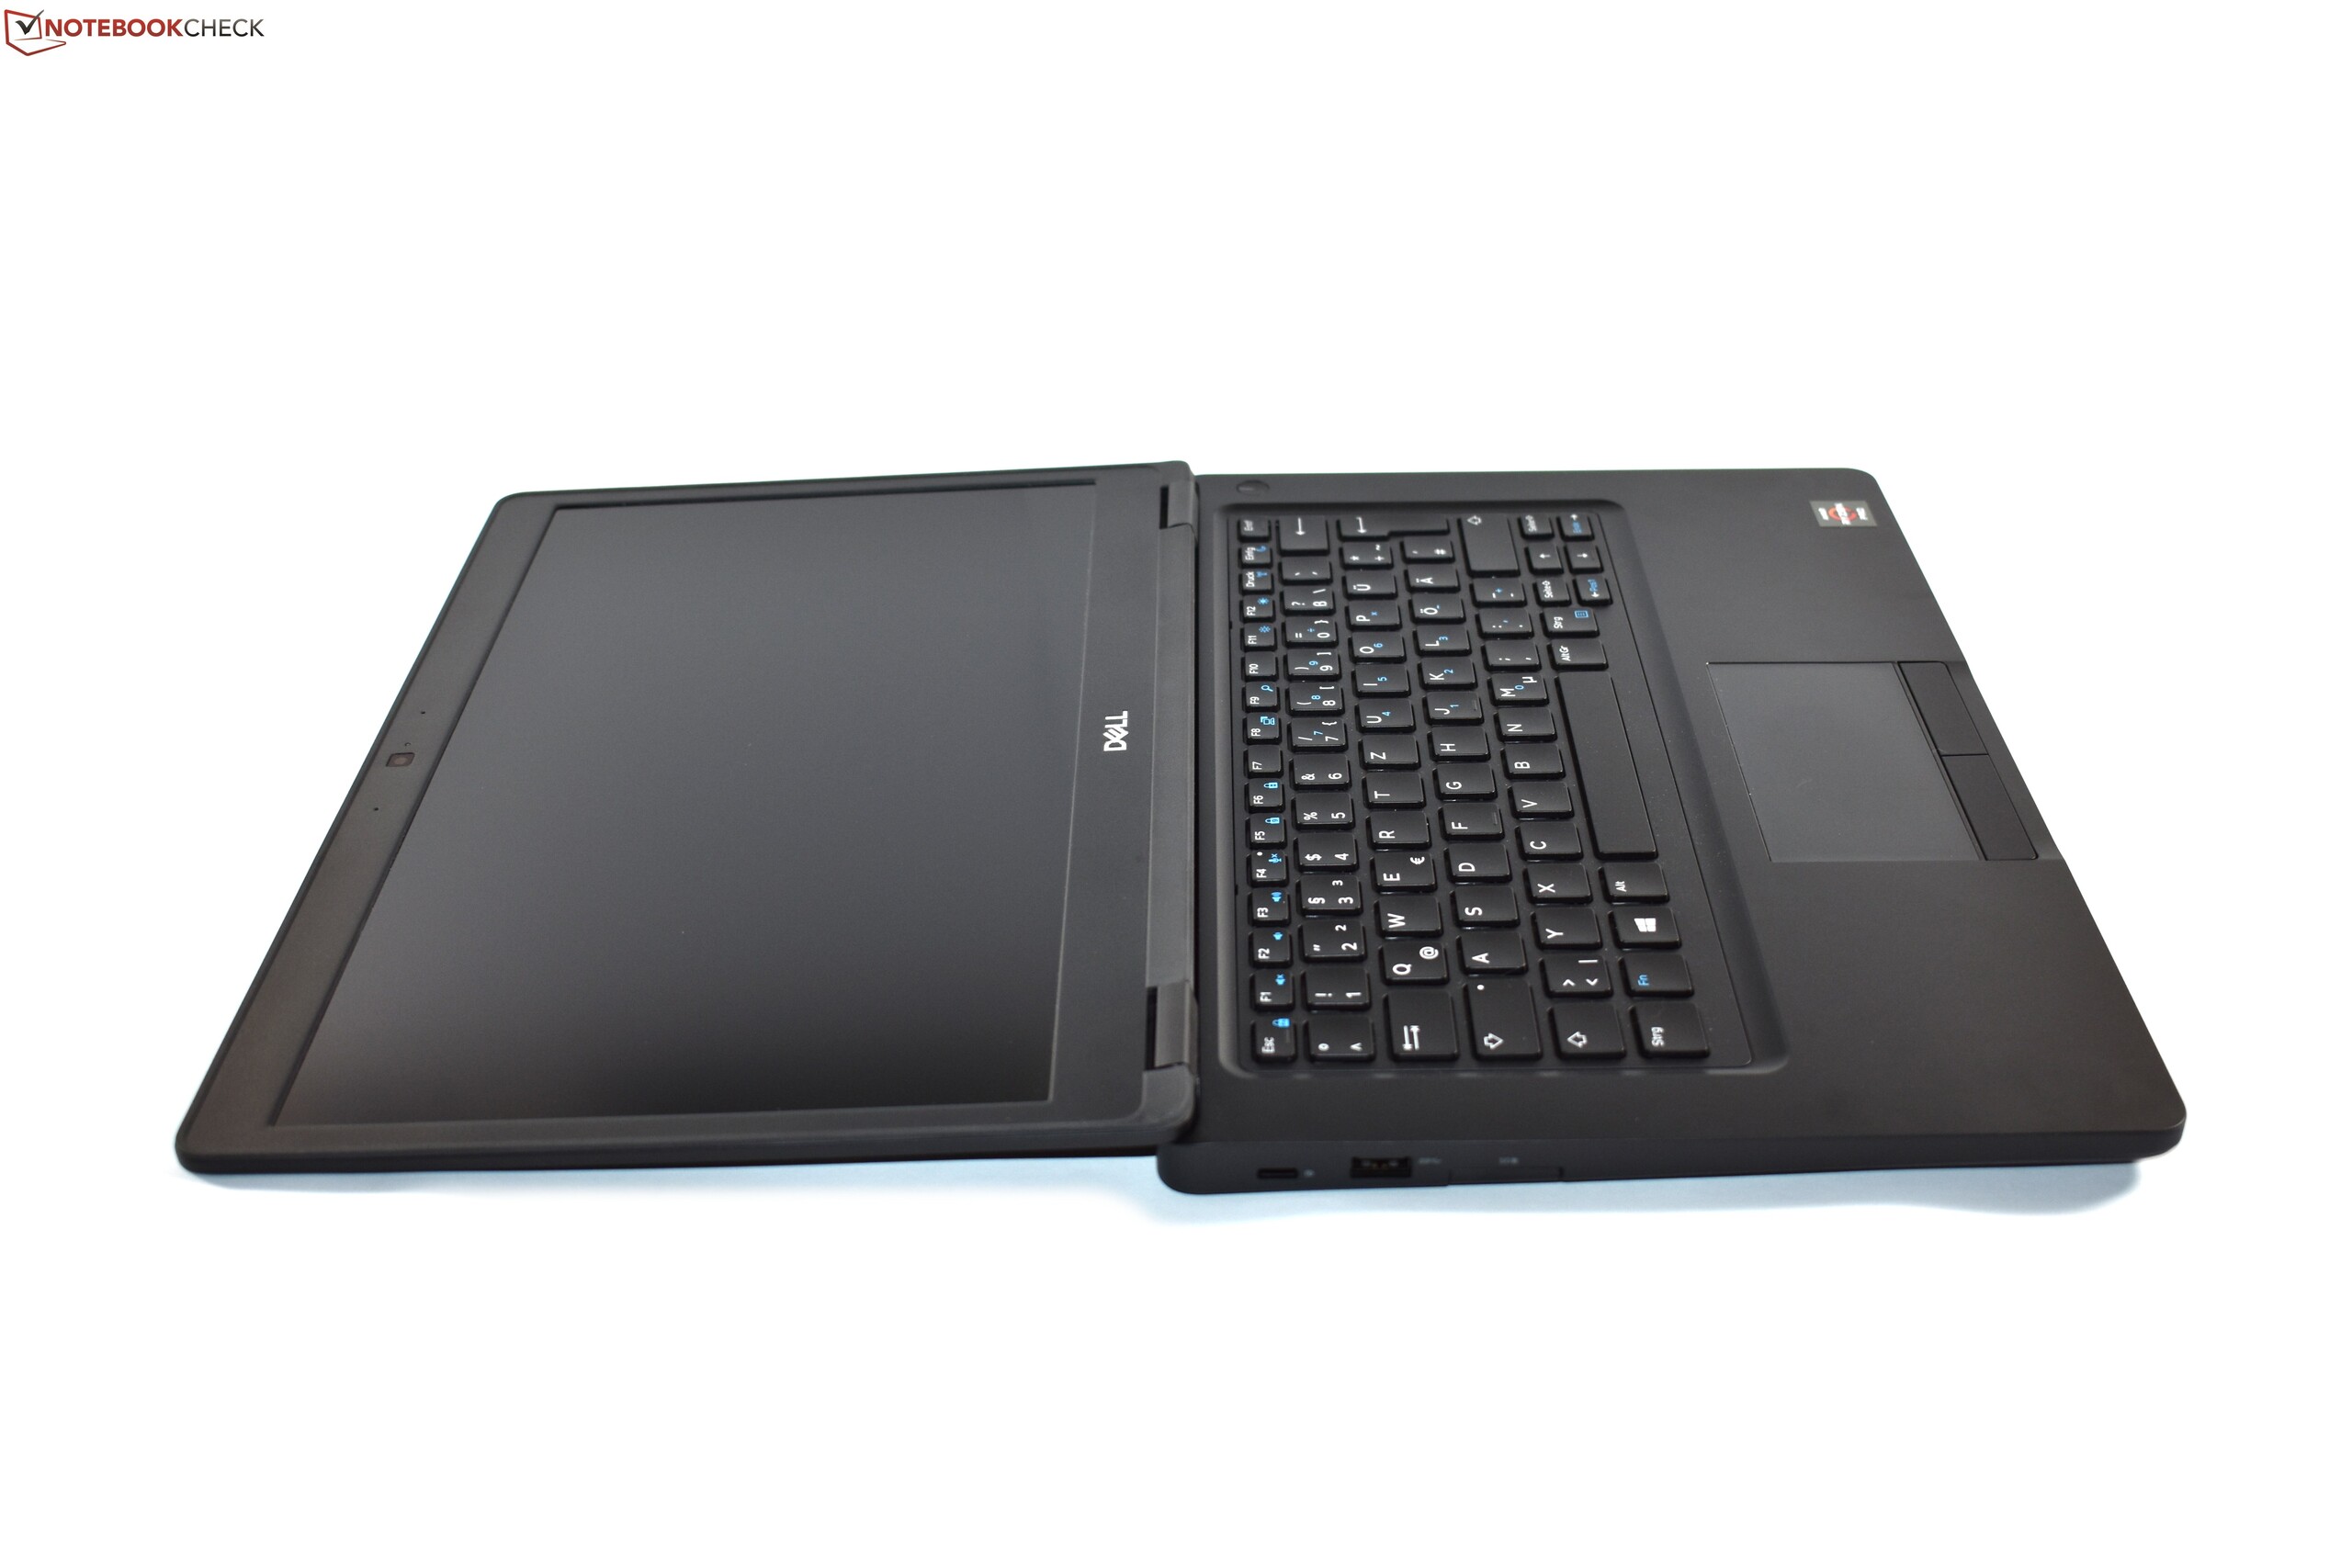
Dell Latitude 14 5495
- 04/06/2019 v6 (old)
Benjamin Herzig
Price comparison

