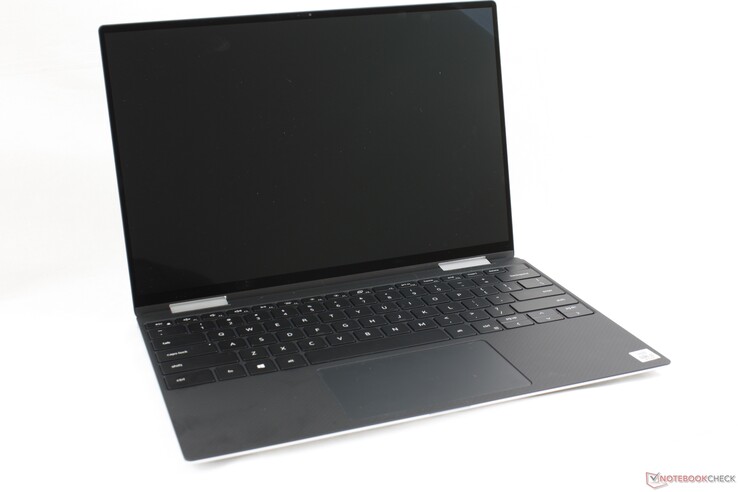
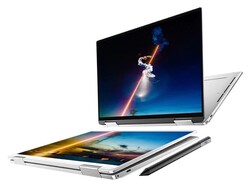
热冰: 戴尔 XPS 13 7390 2-in-1 Core i3笔记本电脑评测
» Notebookcheck多媒体笔记本电脑Top 10排名
» Notebookcheck游戏笔记本电脑Top 10排名
» Notebookcheck低价办公/商务笔记本电脑Top 10排名
» Notebookcheck高端办公/商务笔记本电脑Top 10排名
» Notebookcheck工作站笔记本电脑Top 10排名
» Notebookcheck亚笔记本电脑Top 10排名
» Notebookcheck超级本产品Top 10排名
» Notebookcheck变形本产品Top 10排名
» Notebookcheck平板电脑Top 10排名
» Notebookcheck智能手机Top 10排名
» Notebookcheck评测过最出色的笔记本电脑屏幕
» Notebookcheck售价500欧元以下笔记本电脑Top 10排名
» Notebookcheck售价300欧元以下笔记本电脑Top 10排名
| SD Card Reader | |
| average JPG Copy Test (av. of 3 runs) | |
| Dell XPS 13 9380 2019 (Toshiba Exceria Pro SDXC 64 GB UHS-II) | |
| Dell XPS 13 7390 2-in-1 Core i3 (Toshiba Exceria Pro M501 64 GB UHS-II) | |
| HP Spectre x360 13-ap0312ng (Toshiba Exceria Pro M501 64 GB UHS-II) | |
| Dell XPS 13-9365 2-in-1 (Toshiba THN-M401S0640E2) | |
| maximum AS SSD Seq Read Test (1GB) | |
| Dell XPS 13 7390 2-in-1 Core i3 (Toshiba Exceria Pro M501 64 GB UHS-II) | |
| HP Spectre x360 13-ap0312ng (Toshiba Exceria Pro M501 64 GB UHS-II) | |
| Dell XPS 13 9380 2019 (Toshiba Exceria Pro SDXC 64 GB UHS-II) | |
| Dell XPS 13-9365 2-in-1 (Toshiba THN-M401S0640E2) | |
| Networking | |
| iperf3 transmit AX12 | |
| HP Spectre x360 13-ap0312ng | |
| Dell XPS 13 9380 2019 | |
| Dell XPS 13 7390 2-in-1 Core i3 | |
| Dell XPS 13-9365 2-in-1 | |
| iperf3 receive AX12 | |
| Dell XPS 13 7390 2-in-1 Core i3 | |
| HP Spectre x360 13-ap0312ng | |
| Dell XPS 13 9380 2019 | |
| Dell XPS 13-9365 2-in-1 | |
| |||||||||||||||||||||||||
Brightness Distribution: 88 %
Center on Battery: 576.3 cd/m²
Contrast: 1746:1 (Black: 0.33 cd/m²)
ΔE ColorChecker Calman: 1.45 | ∀{0.5-29.43 Ø4.76}
calibrated: 1.19
ΔE Greyscale Calman: 3.1 | ∀{0.09-98 Ø5}
98.5% sRGB (Argyll 1.6.3 3D)
64.2% AdobeRGB 1998 (Argyll 1.6.3 3D)
70.4% AdobeRGB 1998 (Argyll 3D)
98.2% sRGB (Argyll 3D)
68.6% Display P3 (Argyll 3D)
Gamma: 2.27
CCT: 6931 K
| Dell XPS 13 7390 2-in-1 Core i3 Sharp LQ134N1, IPS, 13.4", 1920x1200 | Dell XPS 13 9380 2019 ID: AUO 282B B133ZAN Dell: 90NTH, IPS, 13.3", 3840x2160 | Dell XPS 13-9365 2-in-1 IPS, 13.3", 1920x1080 | HP Spectre x360 13-ap0312ng M133NVF3, IPS, 13.3", 1920x1080 | Lenovo Yoga C930-13IKB 81C4 AUO B139HAN03_0, IPS, 13.9", 1920x1080 | Asus ZenBook S13 UX392FN Tianma XM, IPS, 13.9", 1920x1080 | |
|---|---|---|---|---|---|---|
| Display | -6% | -30% | -9% | -8% | -2% | |
| Display P3 Coverage (%) | 68.6 | 64.7 -6% | 47.32 -31% | 63 -8% | 62.7 -9% | 67.5 -2% |
| sRGB Coverage (%) | 98.2 | 93.1 -5% | 71.1 -28% | 89.8 -9% | 92.6 -6% | 95.8 -2% |
| AdobeRGB 1998 Coverage (%) | 70.4 | 65.3 -7% | 48.83 -31% | 64.1 -9% | 64.7 -8% | 69 -2% |
| Response Times | -17% | -1% | 39% | 25% | 12% | |
| Response Time Grey 50% / Grey 80% * (ms) | 46 ? | 58 ? -26% | 48 ? -4% | 29.2 ? 37% | 34.4 ? 25% | 47.2 ? -3% |
| Response Time Black / White * (ms) | 33.6 ? | 36 ? -7% | 32.8 ? 2% | 20 ? 40% | 25.6 ? 24% | 24.8 ? 26% |
| PWM Frequency (Hz) | 2525 ? | 1042 ? | 1000 ? | |||
| Screen | -43% | -86% | -60% | -103% | -11% | |
| Brightness middle (cd/m²) | 576.3 | 404 -30% | 322.6 -44% | 272 -53% | 312 -46% | 466 -19% |
| Brightness (cd/m²) | 555 | 389 -30% | 306 -45% | 298 -46% | 295 -47% | 462 -17% |
| Brightness Distribution (%) | 88 | 85 -3% | 91 3% | 84 -5% | 87 -1% | 90 2% |
| Black Level * (cd/m²) | 0.33 | 0.37 -12% | 0.19 42% | 0.39 -18% | 0.43 -30% | 0.33 -0% |
| Contrast (:1) | 1746 | 1092 -37% | 1698 -3% | 697 -60% | 726 -58% | 1412 -19% |
| Colorchecker dE 2000 * | 1.45 | 3.72 -157% | 7.7 -431% | 4.3 -197% | 7.6 -424% | 1.93 -33% |
| Colorchecker dE 2000 max. * | 4.12 | 7.38 -79% | 11.1 -169% | 9 -118% | 15.06 -266% | 4.26 -3% |
| Colorchecker dE 2000 calibrated * | 1.19 | 2.06 -73% | 2.4 -102% | 1.96 -65% | 1.99 -67% | |
| Greyscale dE 2000 * | 3.1 | 4.44 -43% | 7.9 -155% | 4.4 -42% | 8.8 -184% | 1.7 45% |
| Gamma | 2.27 97% | 2.34 94% | 2.88 76% | 1.97 112% | 2.01 109% | 2.15 102% |
| CCT | 6931 94% | 7095 92% | 7044 92% | 5825 112% | 6874 95% | 6382 102% |
| Color Space (Percent of AdobeRGB 1998) (%) | 64.2 | 60 -7% | 44.1 -31% | 58.9 -8% | 59.1 -8% | 62.2 -3% |
| Color Space (Percent of sRGB) (%) | 98.5 | 93 -6% | 69.9 -29% | 89.8 -9% | 92.3 -6% | 95.7 -3% |
| Total Average (Program / Settings) | -22% /
-33% | -39% /
-64% | -10% /
-38% | -29% /
-69% | -0% /
-6% |
* ... smaller is better
Display Response Times
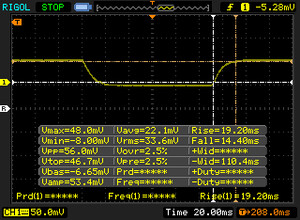
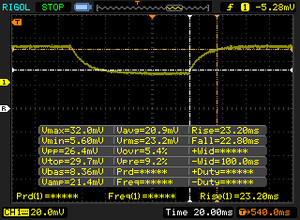
| ↔ Response Time Black to White | ||
|---|---|---|
| 33.6 ms ... rise ↗ and fall ↘ combined | ↗ 19.2 ms rise | |
| ↘ 14.4 ms fall | ||
| The screen shows slow response rates in our tests and will be unsatisfactory for gamers. In comparison, all tested devices range from 0.1 (minimum) to 240 (maximum) ms. » 90 % of all devices are better. This means that the measured response time is worse than the average of all tested devices (20.1 ms). | ||
| ↔ Response Time 50% Grey to 80% Grey | ||
| 46 ms ... rise ↗ and fall ↘ combined | ↗ 23.2 ms rise | |
| ↘ 22.8 ms fall | ||
| The screen shows slow response rates in our tests and will be unsatisfactory for gamers. In comparison, all tested devices range from 0.165 (minimum) to 636 (maximum) ms. » 78 % of all devices are better. This means that the measured response time is worse than the average of all tested devices (31.5 ms). | ||
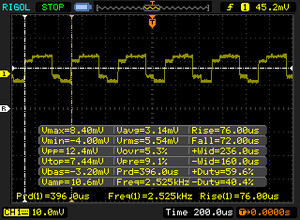
Screen Flickering / PWM (Pulse-Width Modulation)
| Screen flickering / PWM detected | 2525 Hz | ≤ 25 % brightness setting | |
The display backlight flickers at 2525 Hz (worst case, e.g., utilizing PWM) Flickering detected at a brightness setting of 25 % and below. There should be no flickering or PWM above this brightness setting. The frequency of 2525 Hz is quite high, so most users sensitive to PWM should not notice any flickering. In comparison: 53 % of all tested devices do not use PWM to dim the display. If PWM was detected, an average of 8039 (minimum: 5 - maximum: 343500) Hz was measured. | |||
| Cinebench R15 | |
| CPU Single 64Bit | |
| Lenovo Yoga C930-13IKB 81C4 | |
| HP Spectre x360 13-ap0312ng | |
| Microsoft Surface Pro 6, Core i7, 512 GB | |
| Dell XPS 13 7390 2-in-1 Core i3 | |
| Acer Swift 3 SF314-55-31N8 | |
| Dell XPS 13 9380 2019 | |
| HP EliteBook 735 G5 3UN62EA | |
| Asus VivoBook Flip 14 TP412UA-EC969T | |
| Dell XPS 13-9365 2-in-1 | |
| Lenovo V330-15IKB | |
| Lenovo Thinkpad 13-20J1001BUS | |
| Dell Inspiron 15 3585 (2300U, Vega 6) | |
| CPU Multi 64Bit | |
| Dell XPS 13 9380 2019 | |
| Lenovo Yoga C930-13IKB 81C4 | |
| HP EliteBook 735 G5 3UN62EA | |
| Microsoft Surface Pro 6, Core i7, 512 GB | |
| HP Spectre x360 13-ap0312ng | |
| Dell Inspiron 15 3585 (2300U, Vega 6) | |
| Dell XPS 13 7390 2-in-1 Core i3 | |
| Acer Swift 3 SF314-55-31N8 | |
| Asus VivoBook Flip 14 TP412UA-EC969T | |
| Lenovo V330-15IKB | |
| Dell XPS 13-9365 2-in-1 | |
| Lenovo Thinkpad 13-20J1001BUS | |
| Cinebench R11.5 | |
| CPU Single 64Bit | |
| Dell XPS 13 7390 2-in-1 Core i3 | |
| Acer Swift 3 SF314-55-31N8 | |
| Dell XPS 13-9365 2-in-1 | |
| Lenovo V330-15IKB | |
| Lenovo Thinkpad 13-20J1001BUS | |
| Dell Inspiron 15 3585 (2300U, Vega 6) | |
| CPU Multi 64Bit | |
| Dell XPS 13 7390 2-in-1 Core i3 | |
| Dell Inspiron 15 3585 (2300U, Vega 6) | |
| Acer Swift 3 SF314-55-31N8 | |
| Lenovo V330-15IKB | |
| Dell XPS 13-9365 2-in-1 | |
| Lenovo Thinkpad 13-20J1001BUS | |
| Cinebench R10 | |
| Rendering Multiple CPUs 32Bit | |
| Dell XPS 13 7390 2-in-1 Core i3 | |
| Acer Swift 3 SF314-55-31N8 | |
| Asus VivoBook Flip 14 TP412UA-EC969T | |
| Lenovo V330-15IKB | |
| Dell XPS 13-9365 2-in-1 | |
| Lenovo Thinkpad 13-20J1001BUS | |
| Rendering Single 32Bit | |
| Dell XPS 13 7390 2-in-1 Core i3 | |
| Acer Swift 3 SF314-55-31N8 | |
| Dell XPS 13-9365 2-in-1 | |
| Asus VivoBook Flip 14 TP412UA-EC969T | |
| Lenovo V330-15IKB | |
| Lenovo Thinkpad 13-20J1001BUS | |
| wPrime 2.10 - 1024m | |
| Lenovo Thinkpad 13-20J1001BUS | |
| Dell XPS 13-9365 2-in-1 | |
| Lenovo V330-15IKB | |
| Acer Swift 3 SF314-55-31N8 | |
| Dell XPS 13 7390 2-in-1 Core i3 | |
* ... smaller is better
| PCMark 8 Home Score Accelerated v2 | 3240 points | |
| PCMark 8 Work Score Accelerated v2 | 4519 points | |
| PCMark 10 Score | 3562 points | |
Help | ||
| Dell XPS 13 7390 2-in-1 Core i3 Toshiba BG4 KBG40ZPZ256G | Dell XPS 13 9380 2019 SK hynix PC401 HFS256GD9TNG | Asus ZenBook S13 UX392FN WDC PC SN520 SDAPNUW-512G | Microsoft Surface Pro 6, Core i7, 512 GB Toshiba KBG30ZPZ512G | Dell XPS 13-9365 2-in-1 Toshiba NVMe THNSN5256GPUK | Dell Latitude 7300-P99G Samsung SSD PM981 MZVLB512HAJQ | |
|---|---|---|---|---|---|---|
| AS SSD | 11% | 86% | -25% | 5% | 144% | |
| Seq Read (MB/s) | 1558 | 2035 31% | 1224 -21% | 1154 -26% | 1283 -18% | 2749 76% |
| Seq Write (MB/s) | 1103 | 658 -40% | 907 -18% | 393.6 -64% | 735 -33% | 1367 24% |
| 4K Read (MB/s) | 37.52 | 39.74 6% | 41.46 11% | 34.42 -8% | 37.69 0% | 49.94 33% |
| 4K Write (MB/s) | 59 | 105.7 79% | 126.2 114% | 68.9 17% | 96.9 64% | 137.6 133% |
| 4K-64 Read (MB/s) | 1684 | 461 -73% | 1021 -39% | 494.1 -71% | 586 -65% | 987 -41% |
| 4K-64 Write (MB/s) | 198.9 | 300.1 51% | 1251 529% | 171.3 -14% | 204.7 3% | 1465 637% |
| Access Time Read * (ms) | 0.099 | 0.061 38% | 0.053 46% | 0.213 -115% | 0.045 55% | 0.042 58% |
| Access Time Write * (ms) | 0.722 | 0.051 93% | 0.027 96% | 0.3 58% | 0.037 95% | 0.029 96% |
| Score Read (Points) | 1877 | 704 -62% | 1185 -37% | 644 -66% | 752 -60% | 1312 -30% |
| Score Write (Points) | 368 | 471 28% | 1468 299% | 280 -24% | 375 2% | 1739 373% |
| Score Total (Points) | 3180 | 1479 -53% | 3250 2% | 1225 -61% | 1495 -53% | 3662 15% |
| Copy ISO MB/s (MB/s) | 677 | 893 32% | 1404 107% | 985 45% | 950 40% | 2761 308% |
| Copy Program MB/s (MB/s) | 298.4 | 287.9 -4% | 402.4 35% | 143.1 -52% | 263.8 -12% | 622 108% |
| Copy Game MB/s (MB/s) | 496.1 | 618 25% | 902 82% | 676 36% | 726 46% | 1584 219% |
* ... smaller is better
| 3DMark 11 | |
| 1280x720 Performance GPU | |
| Asus ZenBook S13 UX392FN | |
| Dell Inspiron 15 3585 (2300U, Vega 6) | |
| HP EliteBook 735 G5 3UN62EA | |
| Dell Vostro 15-5581 | |
| Dell XPS 13 7390 2-in-1 Core i3 | |
| Microsoft Surface Pro 6, Core i7, 512 GB | |
| HP Spectre x360 13-ap0312ng | |
| Lenovo Yoga C930-13IKB 81C4 | |
| Dell XPS 13 9380 2019 | |
| Dell Latitude 13 3390 | |
| Asus VivoBook Flip 14 TP412UA-EC969T | |
| Lenovo V330-15IKB | |
| Acer Swift 3 SF314-55-31N8 | |
| Dell XPS 13-9365 2-in-1 | |
| Apple MacBook 12 (Early 2016) 1.1 GHz | |
| 1280x720 Performance Combined | |
| Asus ZenBook S13 UX392FN | |
| Dell Inspiron 15 3585 (2300U, Vega 6) | |
| Dell XPS 13 7390 2-in-1 Core i3 | |
| Dell Vostro 15-5581 | |
| HP Spectre x360 13-ap0312ng | |
| HP EliteBook 735 G5 3UN62EA | |
| Lenovo Yoga C930-13IKB 81C4 | |
| Microsoft Surface Pro 6, Core i7, 512 GB | |
| Dell XPS 13 9380 2019 | |
| Lenovo V330-15IKB | |
| Dell Latitude 13 3390 | |
| Asus VivoBook Flip 14 TP412UA-EC969T | |
| Dell XPS 13-9365 2-in-1 | |
| Acer Swift 3 SF314-55-31N8 | |
| Apple MacBook 12 (Early 2016) 1.1 GHz | |
| 3DMark 06 Standard Score | 11753 points | |
| 3DMark 11 Performance | 2374 points | |
| 3DMark Ice Storm Standard Score | 56698 points | |
| 3DMark Cloud Gate Standard Score | 8145 points | |
| 3DMark Fire Strike Score | 1443 points | |
Help | ||
| Rocket League | |
| 1920x1080 High Quality AA:High FX | |
| Huawei MateBook 13 i7 | |
| Lenovo IdeaPad 320s-14IKB | |
| Acer Swift 3 SF313-51-59SZ | |
| Lenovo Flex 14IWL | |
| Dell XPS 13 7390 2-in-1 Core i3 | |
| Samsung Notebook 9 NP930QAA | |
| Acer Switch 5 SW512-52-5819 | |
| Dell Inspiron 15 3585 (2300U, Vega 6) | |
| Dell Inspiron 14 5000 5482 2-in-1 | |
| Fujitsu LifeBook U937 | |
| 1920x1080 Quality AA:Medium FX | |
| Huawei MateBook 13 i7 | |
| Lenovo IdeaPad 320s-14IKB | |
| Dell XPS 13 7390 2-in-1 Core i3 | |
| Acer Swift 3 SF313-51-59SZ | |
| Samsung Notebook 9 NP930QAA | |
| Lenovo Flex 14IWL | |
| Acer Switch 5 SW512-52-5819 | |
| Dell Inspiron 15 3585 (2300U, Vega 6) | |
| Fujitsu LifeBook U937 | |
| Dell Inspiron 14 5000 5482 2-in-1 | |
| 1920x1080 Performance | |
| Lenovo IdeaPad 320s-14IKB | |
| Acer Swift 3 SF313-51-59SZ | |
| Dell XPS 13 7390 2-in-1 Core i3 | |
| Acer Switch 5 SW512-52-5819 | |
| Dell Inspiron 15 3585 (2300U, Vega 6) | |
| Samsung Notebook 9 NP930QAA | |
| Lenovo Flex 14IWL | |
| Fujitsu LifeBook U937 | |
| low | med. | high | ultra | |
|---|---|---|---|---|
| StarCraft II: Heart of the Swarm (2013) | 60.5 | 40.5 | 18.9 | |
| BioShock Infinite (2013) | 82.6 | 40 | 34.8 | 11.7 |
| The Witcher 3 (2015) | 29.7 | 19.1 | 10.4 | 5.4 |
| Overwatch (2016) | 71.4 | 52.3 | 23.5 | |
| Rocket League (2017) | 69.5 | 42.2 | 22.8 |
| Dell XPS 13 7390 2-in-1 Core i3 UHD Graphics G1 (Ice Lake 32 EU), i3-1005G1, Toshiba BG4 KBG40ZPZ256G | Dell XPS 13 9380 2019 UHD Graphics 620, i5-8265U, SK hynix PC401 HFS256GD9TNG | Dell XPS 13-9365 2-in-1 HD Graphics 615, i7-7Y75, Toshiba NVMe THNSN5256GPUK | HP Spectre x360 13-ap0312ng UHD Graphics 620, i7-8565U, Toshiba XG5 KXG50ZNV512G | Lenovo Yoga C930-13IKB 81C4 UHD Graphics 620, i5-8550U, SK hynix PC401 HFS256GD9TNG | Asus ZenBook S13 UX392FN GeForce MX150, i7-8565U, WDC PC SN520 SDAPNUW-512G | |
|---|---|---|---|---|---|---|
| Noise | -4% | 1% | 1% | -5% | ||
| off / environment * (dB) | 28 | 30.4 -9% | 29.2 -4% | 27.9 -0% | 28.1 -0% | |
| Idle Minimum * (dB) | 28 | 30.4 -9% | 29.2 -4% | 27.9 -0% | 28.1 -0% | |
| Idle Average * (dB) | 28 | 30.4 -9% | 29.2 -4% | 27.9 -0% | 28.1 -0% | |
| Idle Maximum * (dB) | 28 | 30.4 -9% | 30.4 -9% | 29.3 -5% | 29 -4% | |
| Load Average * (dB) | 31.7 | 31.7 -0% | 31 2% | 32 -1% | 41.1 -30% | |
| Load Maximum * (dB) | 43.5 | 38.1 12% | 32.1 26% | 39.3 10% | 41.1 6% | |
| Witcher 3 ultra * (dB) | 41.1 |
* ... smaller is better
Noise level
| Idle |
| 28 / 28 / 28 dB(A) |
| Load |
| 31.7 / 43.5 dB(A) |
 | ||
30 dB silent 40 dB(A) audible 50 dB(A) loud |
||
min: | ||
(-) The maximum temperature on the upper side is 50 °C / 122 F, compared to the average of 35.3 °C / 96 F, ranging from 19.6 to 60 °C for the class Convertible.
(-) The bottom heats up to a maximum of 47 °C / 117 F, compared to the average of 36.8 °C / 98 F
(+) In idle usage, the average temperature for the upper side is 28.8 °C / 84 F, compared to the device average of 30.3 °C / 87 F.
(+) The palmrests and touchpad are cooler than skin temperature with a maximum of 31 °C / 87.8 F and are therefore cool to the touch.
(-) The average temperature of the palmrest area of similar devices was 27.9 °C / 82.2 F (-3.1 °C / -5.6 F).
| Off / Standby | |
| Idle | |
| Load |
|
Key:
min: | |
| Dell XPS 13 7390 2-in-1 Core i3 i3-1005G1, UHD Graphics G1 (Ice Lake 32 EU), Toshiba BG4 KBG40ZPZ256G, IPS, 1920x1200, 13.4" | Dell XPS 13 9380 2019 i5-8265U, UHD Graphics 620, SK hynix PC401 HFS256GD9TNG, IPS, 3840x2160, 13.3" | Dell XPS 13-9365 2-in-1 i7-7Y75, HD Graphics 615, Toshiba NVMe THNSN5256GPUK, IPS, 1920x1080, 13.3" | HP Spectre x360 13-ap0312ng i7-8565U, UHD Graphics 620, Toshiba XG5 KXG50ZNV512G, IPS, 1920x1080, 13.3" | Lenovo Yoga C930-13IKB 81C4 i5-8550U, UHD Graphics 620, SK hynix PC401 HFS256GD9TNG, IPS, 1920x1080, 13.9" | Asus ZenBook S13 UX392FN i7-8565U, GeForce MX150, WDC PC SN520 SDAPNUW-512G, IPS, 1920x1080, 13.9" | |
|---|---|---|---|---|---|---|
| Power Consumption | -35% | 26% | -19% | -38% | -31% | |
| Idle Minimum * (Watt) | 3 | 4.8 -60% | 3.1 -3% | 4.32 -44% | 3.4 -13% | 3.4 -13% |
| Idle Average * (Watt) | 5.4 | 8.6 -59% | 4.3 20% | 6.84 -27% | 7.5 -39% | 6.3 -17% |
| Idle Maximum * (Watt) | 7.3 | 10.4 -42% | 4.9 33% | 8.64 -18% | 11.8 -62% | 10.4 -42% |
| Load Average * (Watt) | 33.4 | 37.9 -13% | 24.3 27% | 31.8 5% | 47.7 -43% | 51 -53% |
| Load Maximum * (Watt) | 48.3 | 48.5 -0% | 22.8 53% | 53 -10% | 63.2 -31% | 62.7 -30% |
| Witcher 3 ultra * (Watt) | 39 |
* ... smaller is better
| Dell XPS 13 7390 2-in-1 Core i3 i3-1005G1, UHD Graphics G1 (Ice Lake 32 EU), 51 Wh | Dell XPS 13 9380 2019 i5-8265U, UHD Graphics 620, 52 Wh | Dell XPS 13-9365 2-in-1 i7-7Y75, HD Graphics 615, 46 Wh | HP Spectre x360 13-ap0312ng i7-8565U, UHD Graphics 620, 61 Wh | Lenovo Yoga C930-13IKB 81C4 i5-8550U, UHD Graphics 620, 60 Wh | Asus ZenBook S13 UX392FN i7-8565U, GeForce MX150, 50 Wh | |
|---|---|---|---|---|---|---|
| Battery runtime | -17% | 2% | 3% | 25% | -16% | |
| Reader / Idle (h) | 35.7 | 17.2 -52% | 16.2 -55% | 28.5 -20% | ||
| WiFi v1.3 (h) | 8.9 | 8.3 -7% | 11.4 28% | 8.9 0% | 11.1 25% | 8.4 -6% |
| Load (h) | 2.2 | 2.4 9% | 2.9 32% | 2.3 5% | 1.7 -23% |
Pros
Cons
发烧友不可避免地会对XPS 13 7390 2合1的板载组件产生鄙视情感。尽管RAM,WLAN,甚至存储之类的关键规格不可升级很不可取,但Dell的目标受众对这些功能并不感兴趣。 这台XPS 13的目标是占领二合一笔记本市场,在该市场中,诸如Surface Pro之类的可拆卸产品在可升级性方面已经非常有限。
戴尔二合一最好的一点是其显示屏,而不是花哨的新英特尔Ice Lake-U CPU。从客观上讲,即使是最便宜的Core i3 SKU上的屏幕,也比价格昂贵数百美元的许多其他旗舰超极本的显示屏要好。它更亮,调色也是开箱即用,由于具有更高的16:10宽高比,甚至看起来更宽敞。如果您曾经想将13英寸二合一笔记本电脑用于旅行和户外使用,那么这将是您最好的选择,因为与竞争对手相比,显示屏的亮度更高。
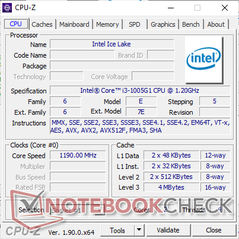
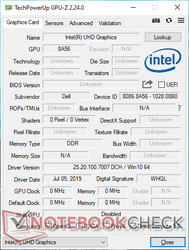
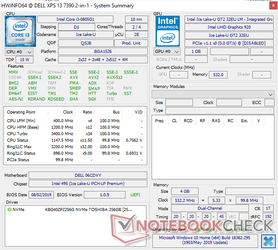
至于酷睿i3-1005G1,其CPU性能仅比酷睿i3-8145U略强,同时在更高效的10 nm设计中提供相当于酷睿i7-8565U的集成图形性能。在这方面,两代间的升级是微不足道的,但是它仍然比旧的XPS 13 9365系列所提供的Core 7Y54或Core 7Y75更好。
我们的大多数抱怨都微不足道,但加在一起还是很恼人。局促的方向键,沾指纹的表面,缓慢的白黑响应时间,DPC延迟问题以及缺乏更高的刷新率和WWAN选项,这些都阻碍了Dell将其打造为终极二合一笔记本。 2017年型号的一些功能(如Noble Lock,红外摄像头和可移动存储)已全部删除。此外,在满负载下运行CPU将达到99°C的核心温度,这已经让我们担心Core i7配置的性能。用户可能想考虑的最接近的替代产品是14英寸HP EliteBook x360 1040 G5,这是我们所知的唯一提供WWAN的同类型笔记本,它具有超亮的120 Hz显示屏,可升级的存储空间以及更多接口选项,但却没比戴尔大多少。
由于我们在此零售设备上遇到了几个与硬件相关的问题,因此我们强烈建议买家在购买后立即检查是否有任何异常情况。失真的扬声器和USB C型电源问题是严重的问题,我们只能希望是由于运气不好而不是更多的原因。
13.4英寸XPS 13 7390 2合1是相对于2017 XPS 13 9365几乎在所有意义上的重大升级。它最大的惊喜不是新处理器,而是经过良好校准的显示屏,它比大多数其他超极本所提供的显示屏更明亮。但是,如果您愿意再多花一点,那么14英寸HP EliteBook x360 1040 G5几乎可以满足了XPS 2合1的所有功能,但具有更好的可升级性和更多的连接性。
Dell XPS 13 7390 2-in-1 Core i3
- 09/10/2019 v7 (old)
Allen Ngo


