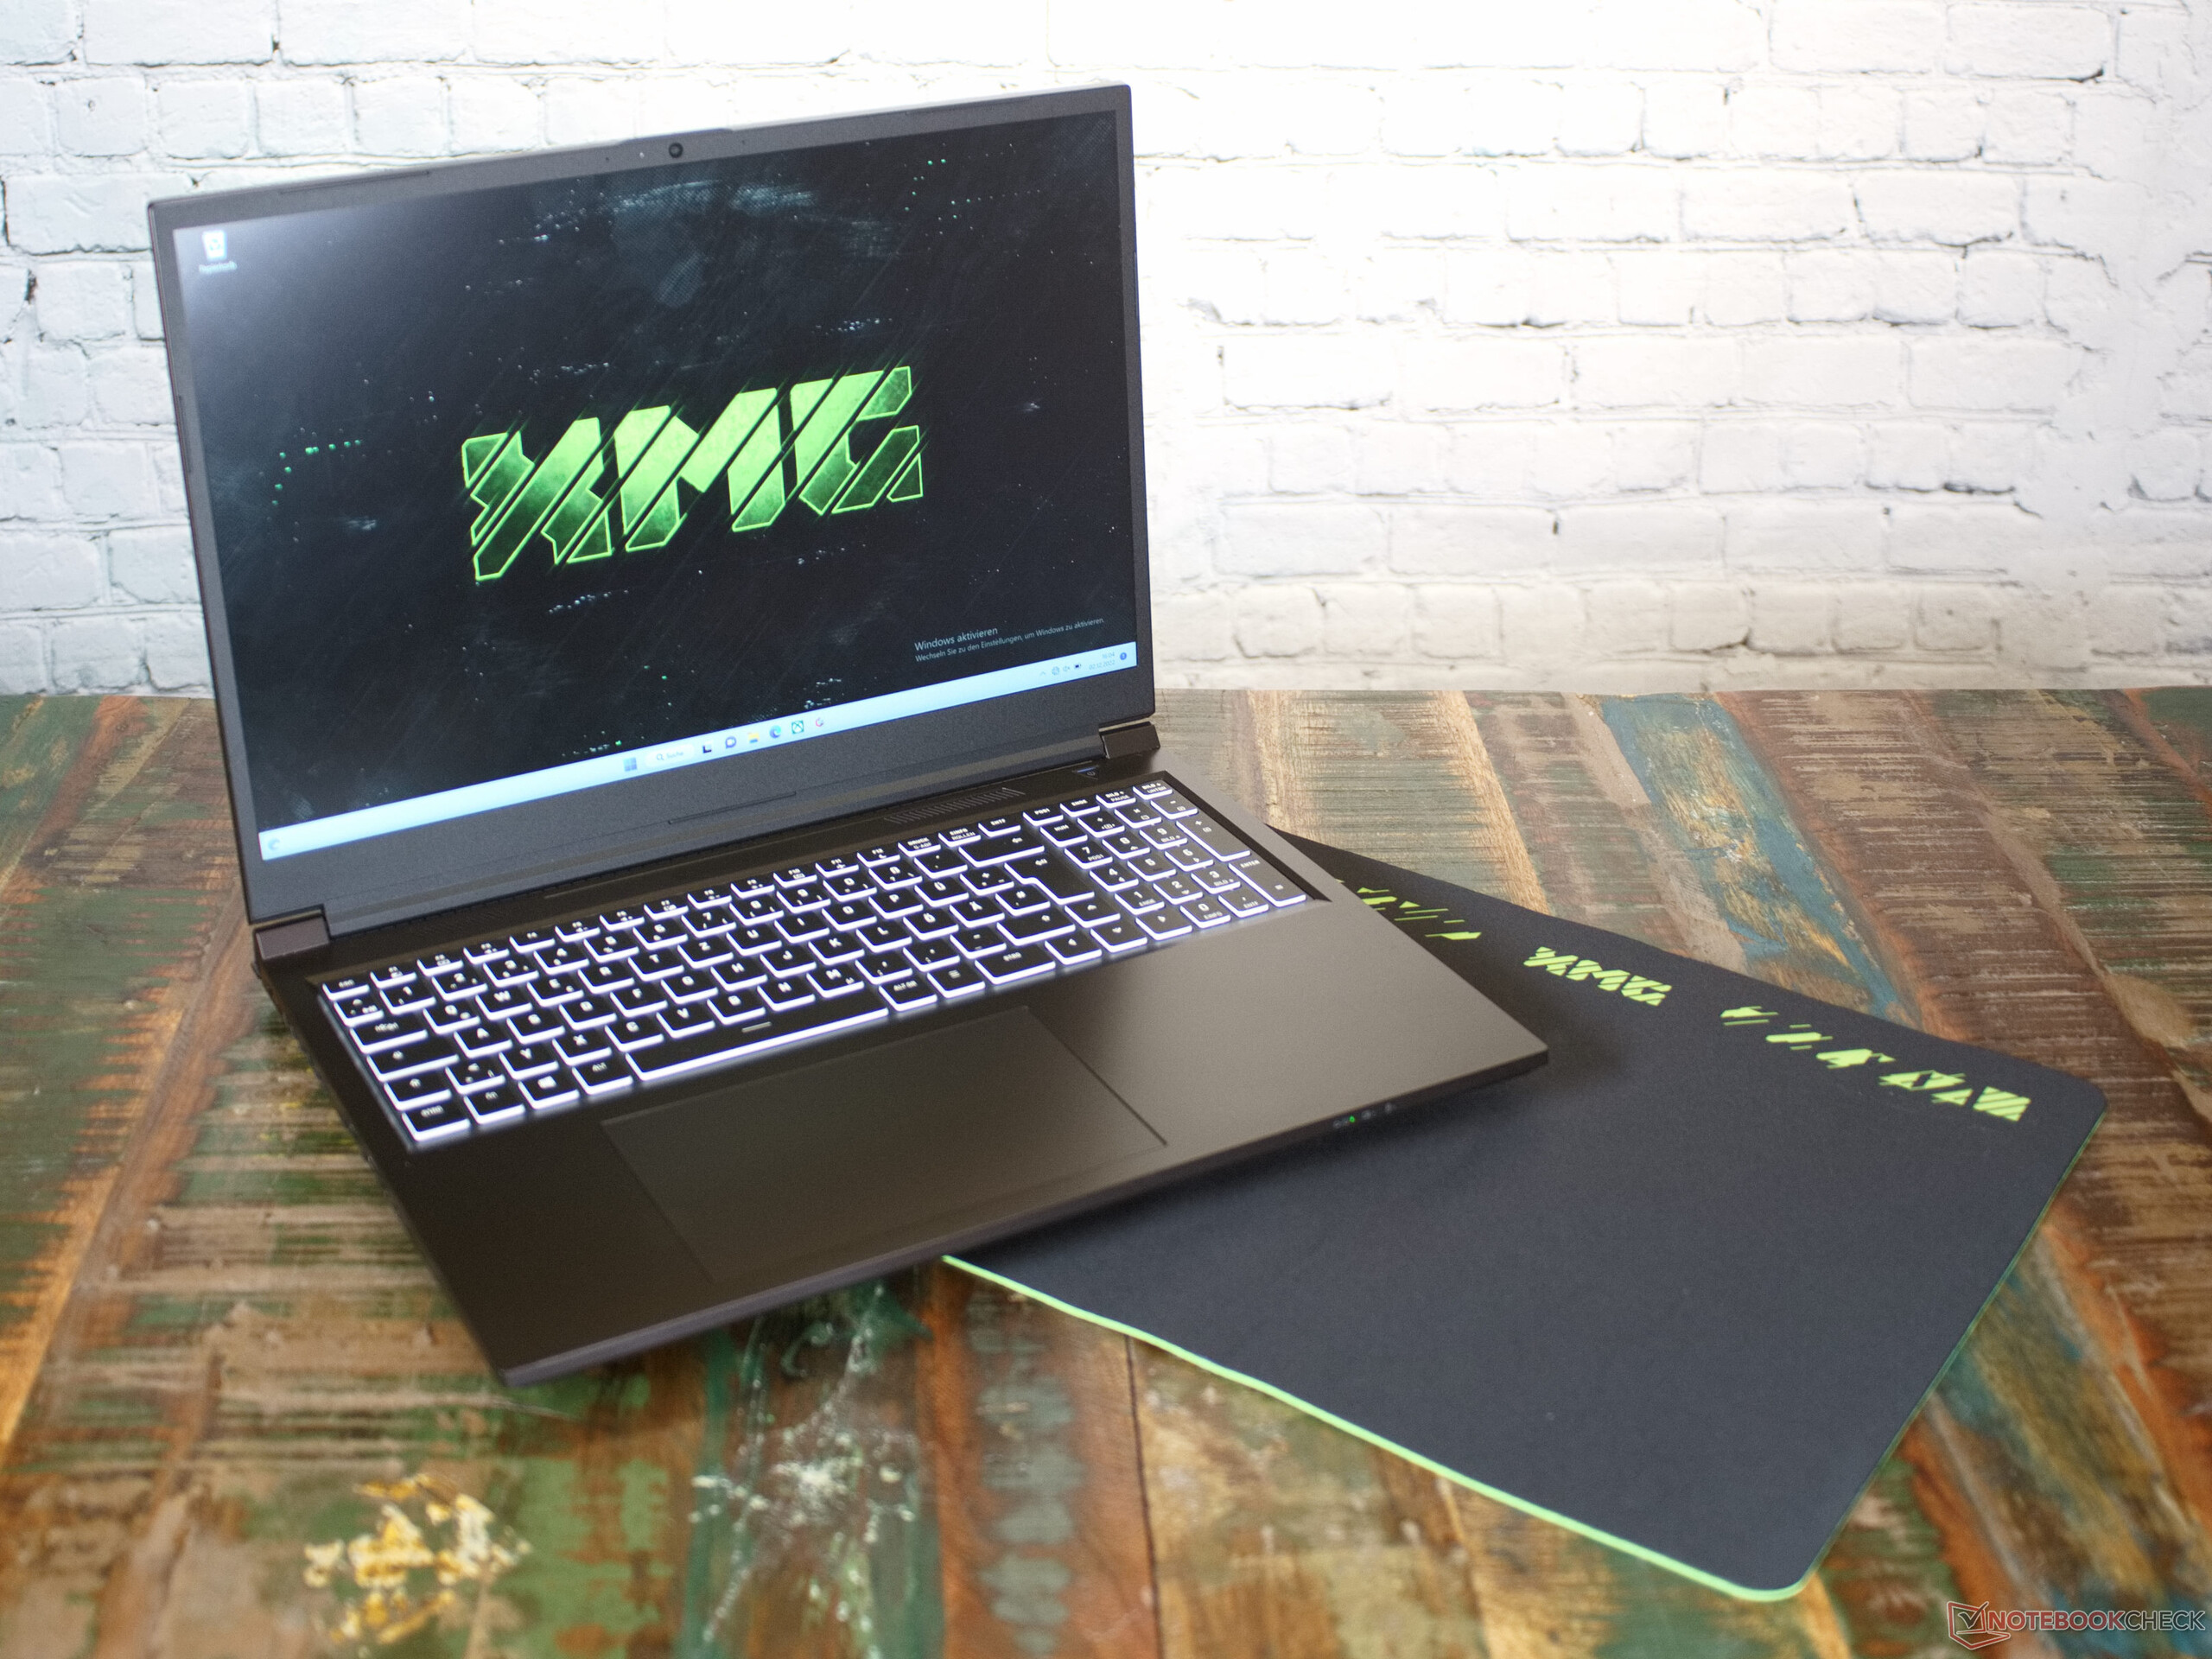
申科XMG Focus 16笔记本电脑评测。一台在德国组装的游戏机
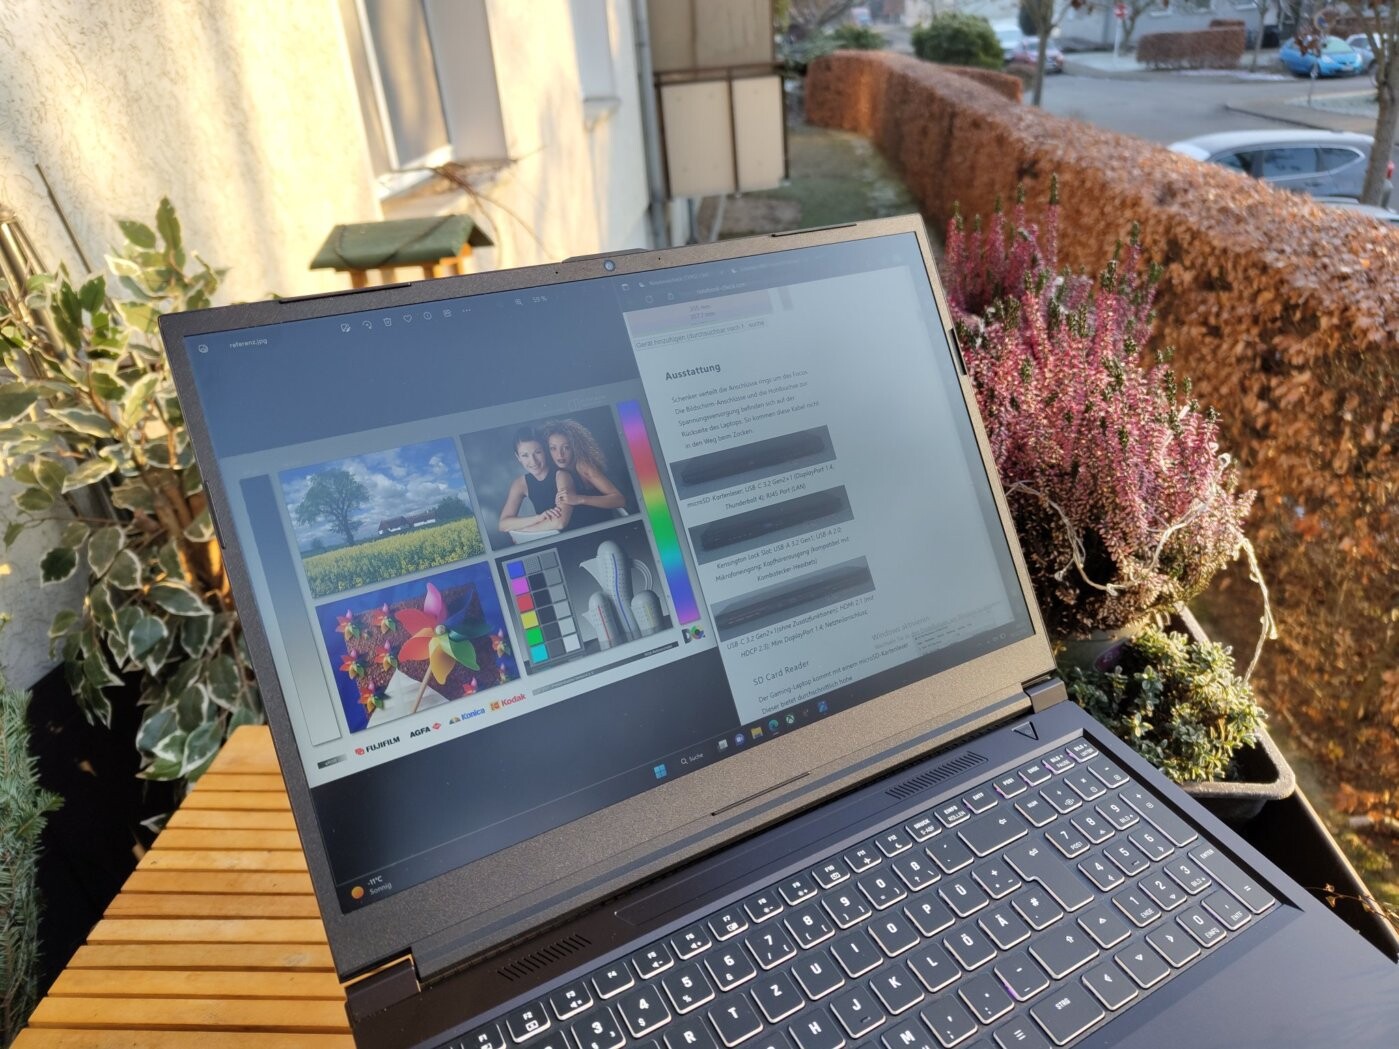
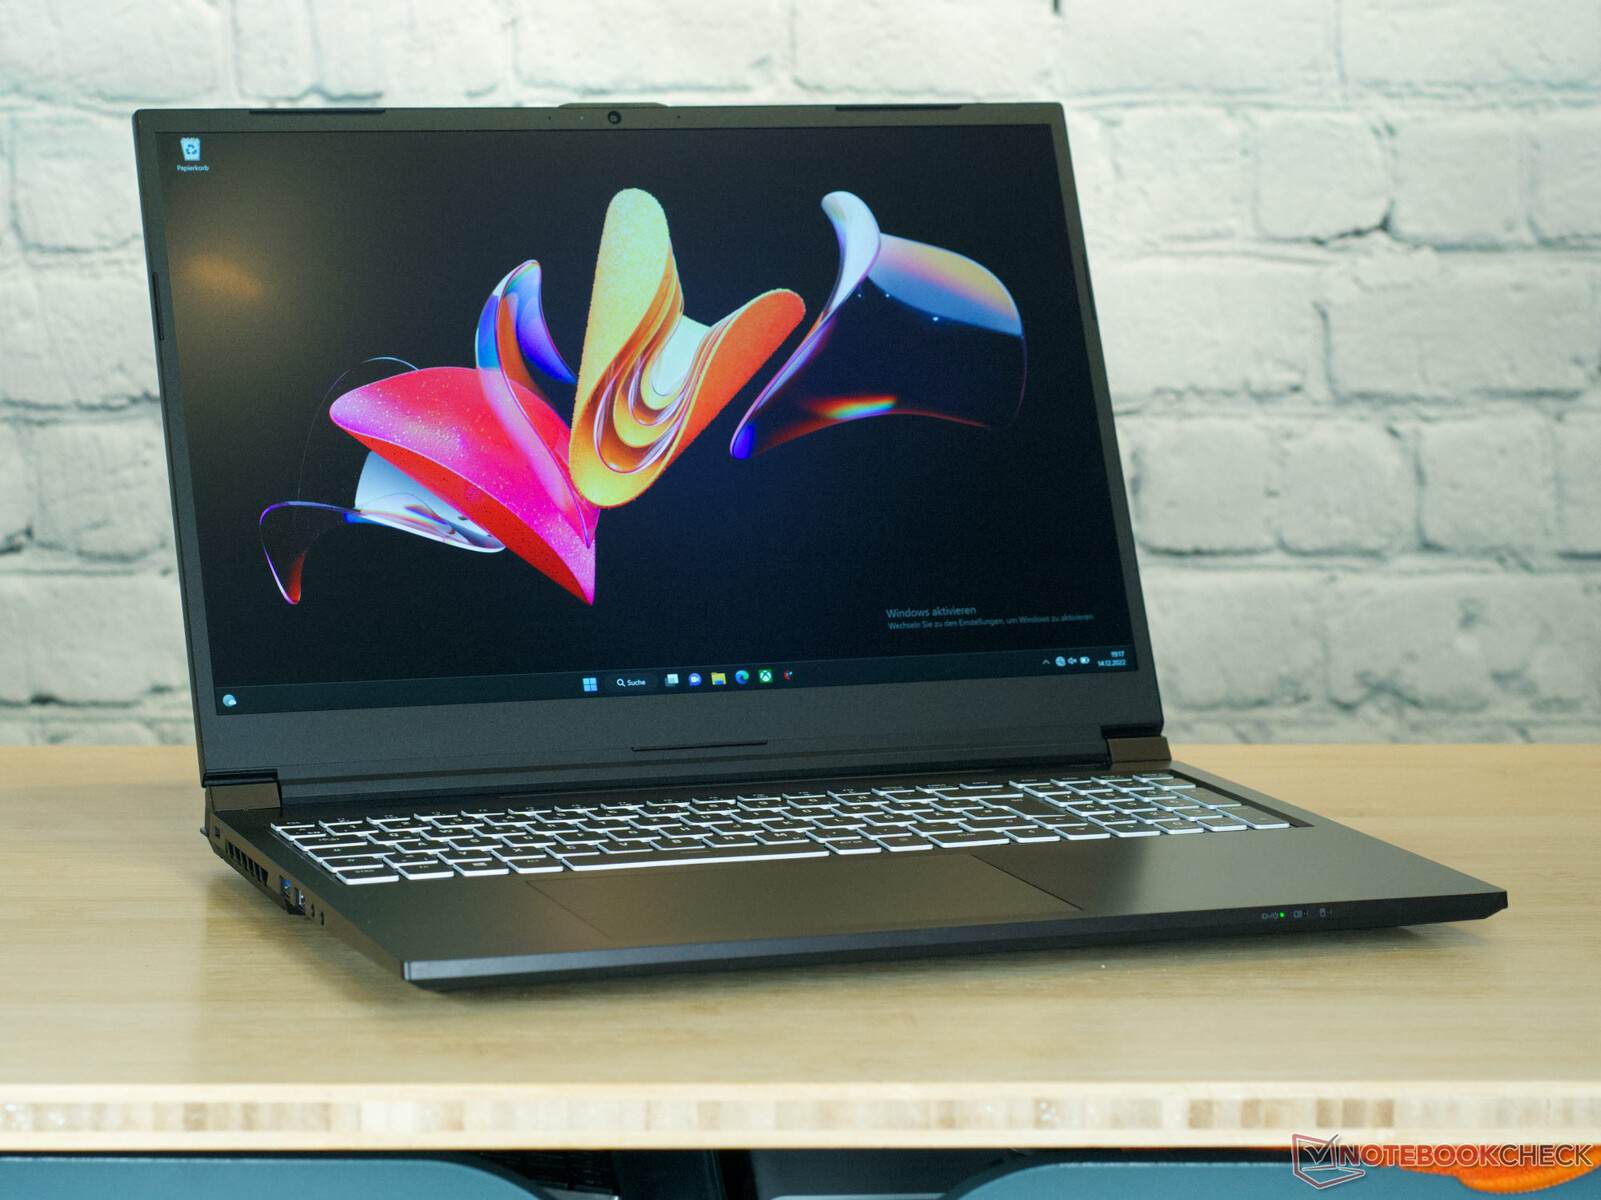
莱比锡的笔记本电脑是由德国电脑制造商申克公司提供的。在XMG Focus 16中,我们有一台16英寸屏幕的中档游戏笔记本电脑。这款笔记本电脑很可靠,坚如磐石,并拥有申克公司的标志性设计。该设备看起来有点方方正正,不落俗套,不会过于显眼。Schenker为XMG Focus 16配备了强大的硬件和一个16:10的长宽比屏幕。
我们的竞争对手主要是从中端游戏笔记本价格类别中挑选出来的,比如说 戴尔G16 7620或联想Legion 5 Pro.然而,一个具有类似规格的薄型多媒体笔记本电脑,即华硕Zenbook Pro 16X,比典型的游戏笔记本电脑要薄得多,但提供类似的高水平性能。
潜在的竞争对手比较
Rating | Date | Model | Weight | Height | Size | Resolution | Price |
|---|---|---|---|---|---|---|---|
| 87 % v7 (old) | 01 / 2023 | Schenker XMG Focus 16 (i7-12700H, RTX 3060) i7-12700H, GeForce RTX 3060 Laptop GPU | 2.2 kg | 24.3 mm | 16.00" | 2560x1600 | |
| 88.4 % v7 (old) | 12 / 2022 | Asus ZenBook Pro 16X OLED UX7602ZM-ME115W i9-12900H, GeForce RTX 3060 Laptop GPU | 2.4 kg | 19.5 mm | 16.00" | 3840x2400 | |
| 86.1 % v7 (old) | 10 / 2022 | Dell G16 7620 i7-12700H, GeForce RTX 3060 Laptop GPU | 2.6 kg | 26.9 mm | 16.00" | 2560x1600 | |
| 89.5 % v7 (old) | 08 / 2022 | Asus ROG Flow X16 GV601RW-M5082W R9 6900HS, GeForce RTX 3070 Ti Laptop GPU | 2.1 kg | 19.4 mm | 16.10" | 2560x1600 | |
| 88.7 % v7 (old) | 12 / 2022 | Lenovo ThinkPad X1 Extreme G5-21DE003RGE i7-12700H, GeForce RTX 3060 Laptop GPU | 2.1 kg | 17.9 mm | 16.00" | 3840x2400 | |
| 87.9 % v7 (old) | 11 / 2022 | Lenovo Legion Slim 7-16IAH 82TF004YGE i7-12700H, GeForce RTX 3060 Laptop GPU | 2.2 kg | 16.9 mm | 16.00" | 2560x1600 | |
| 86.6 % v7 (old) | 07 / 2022 | Lenovo Legion 5 Pro 16IAH7H i7-12700H, GeForce RTX 3060 Laptop GPU | 2.6 kg | 27 mm | 16.00" | 2560x1600 |
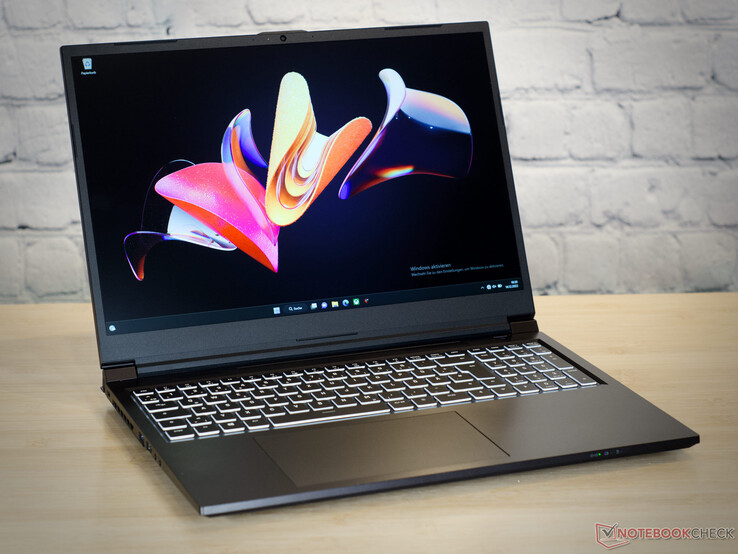
外壳 - 黑色、方块状、大量铝制
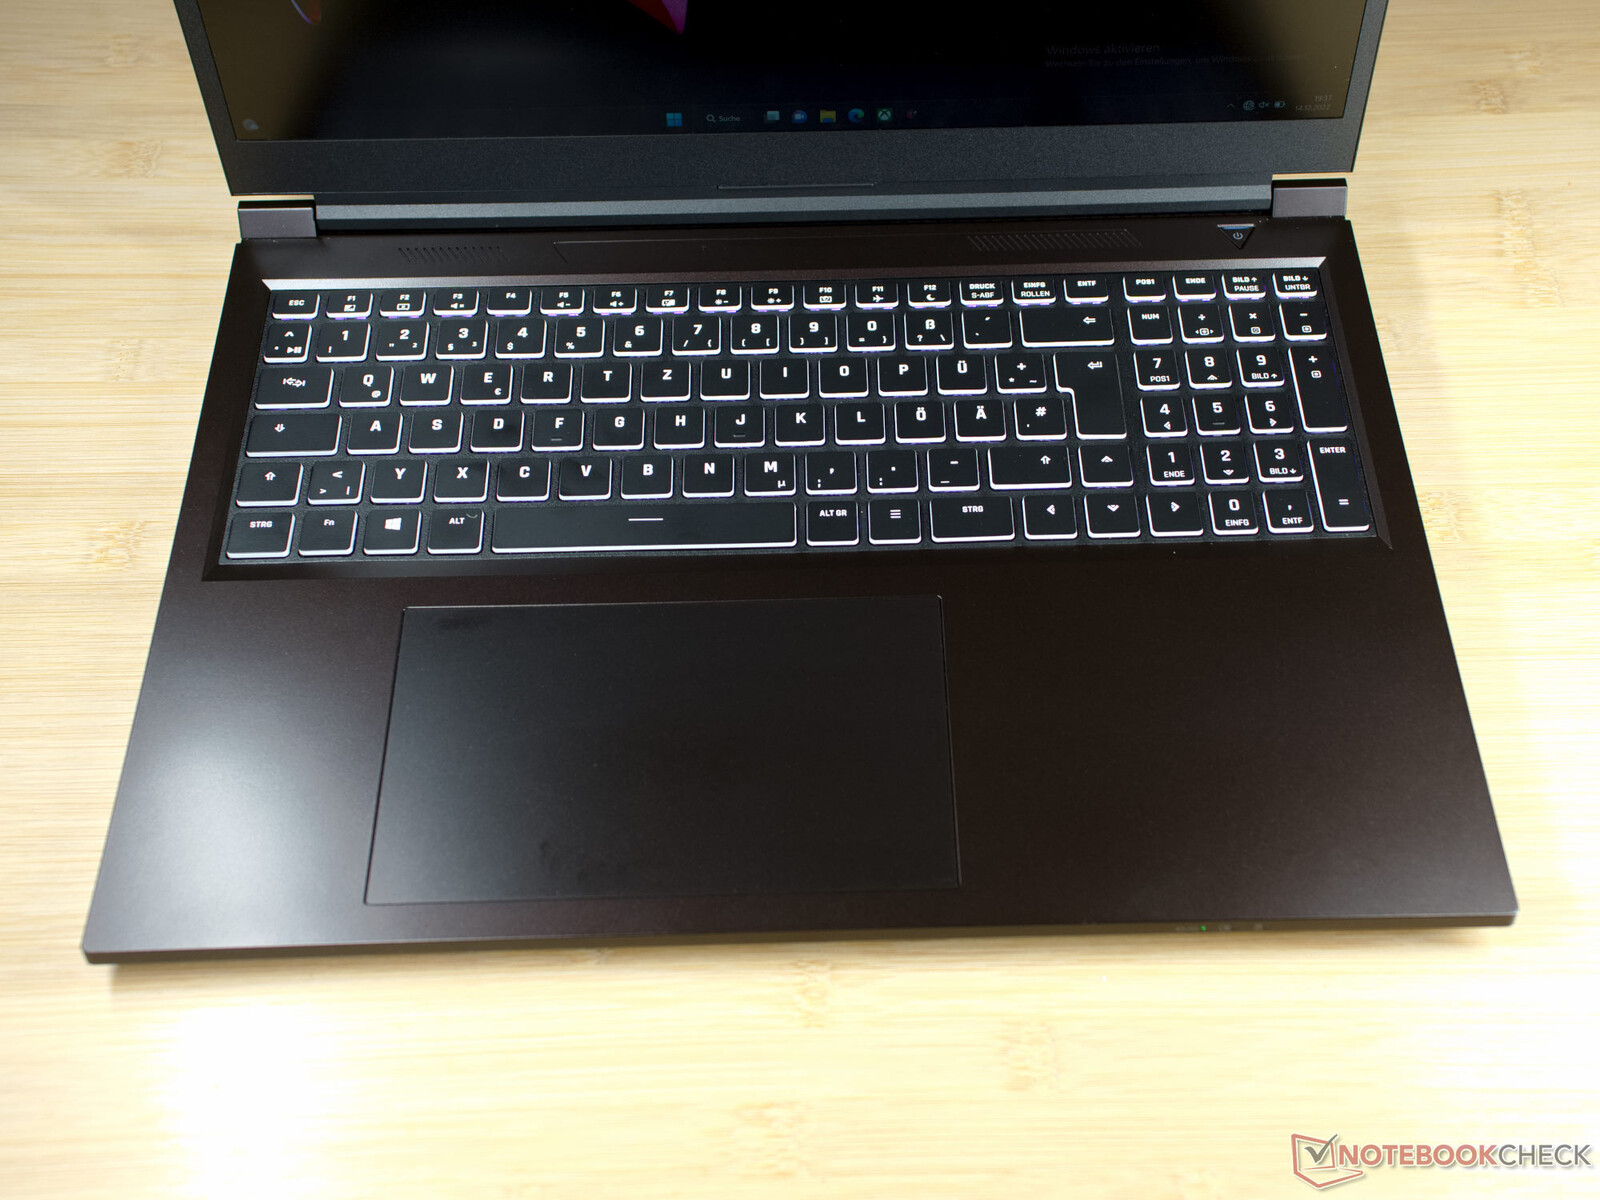
XMG Schenker Focus 16是黑色和白色的,是基于Clevo的裸机NP60PNP。显示屏盖--可以打开到130°的角度--和底座的顶部都是由黑色涂层铝组成,与底座盖不同的是,底座盖是由黑色塑料制成的。打开设备,你会发现许多Schenker和Clevo笔记本电脑中通常都有这种键盘。每个键都有白色的边框和黑色的打字表面。与几乎所有的Schenker笔记本电脑一样,XMG Focus 16在设计上相当方正和基本,但具有良好的制造质量。我们手中的设备很舒适,没有吱吱作响的迹象,并拥有一个稳定的铰链。
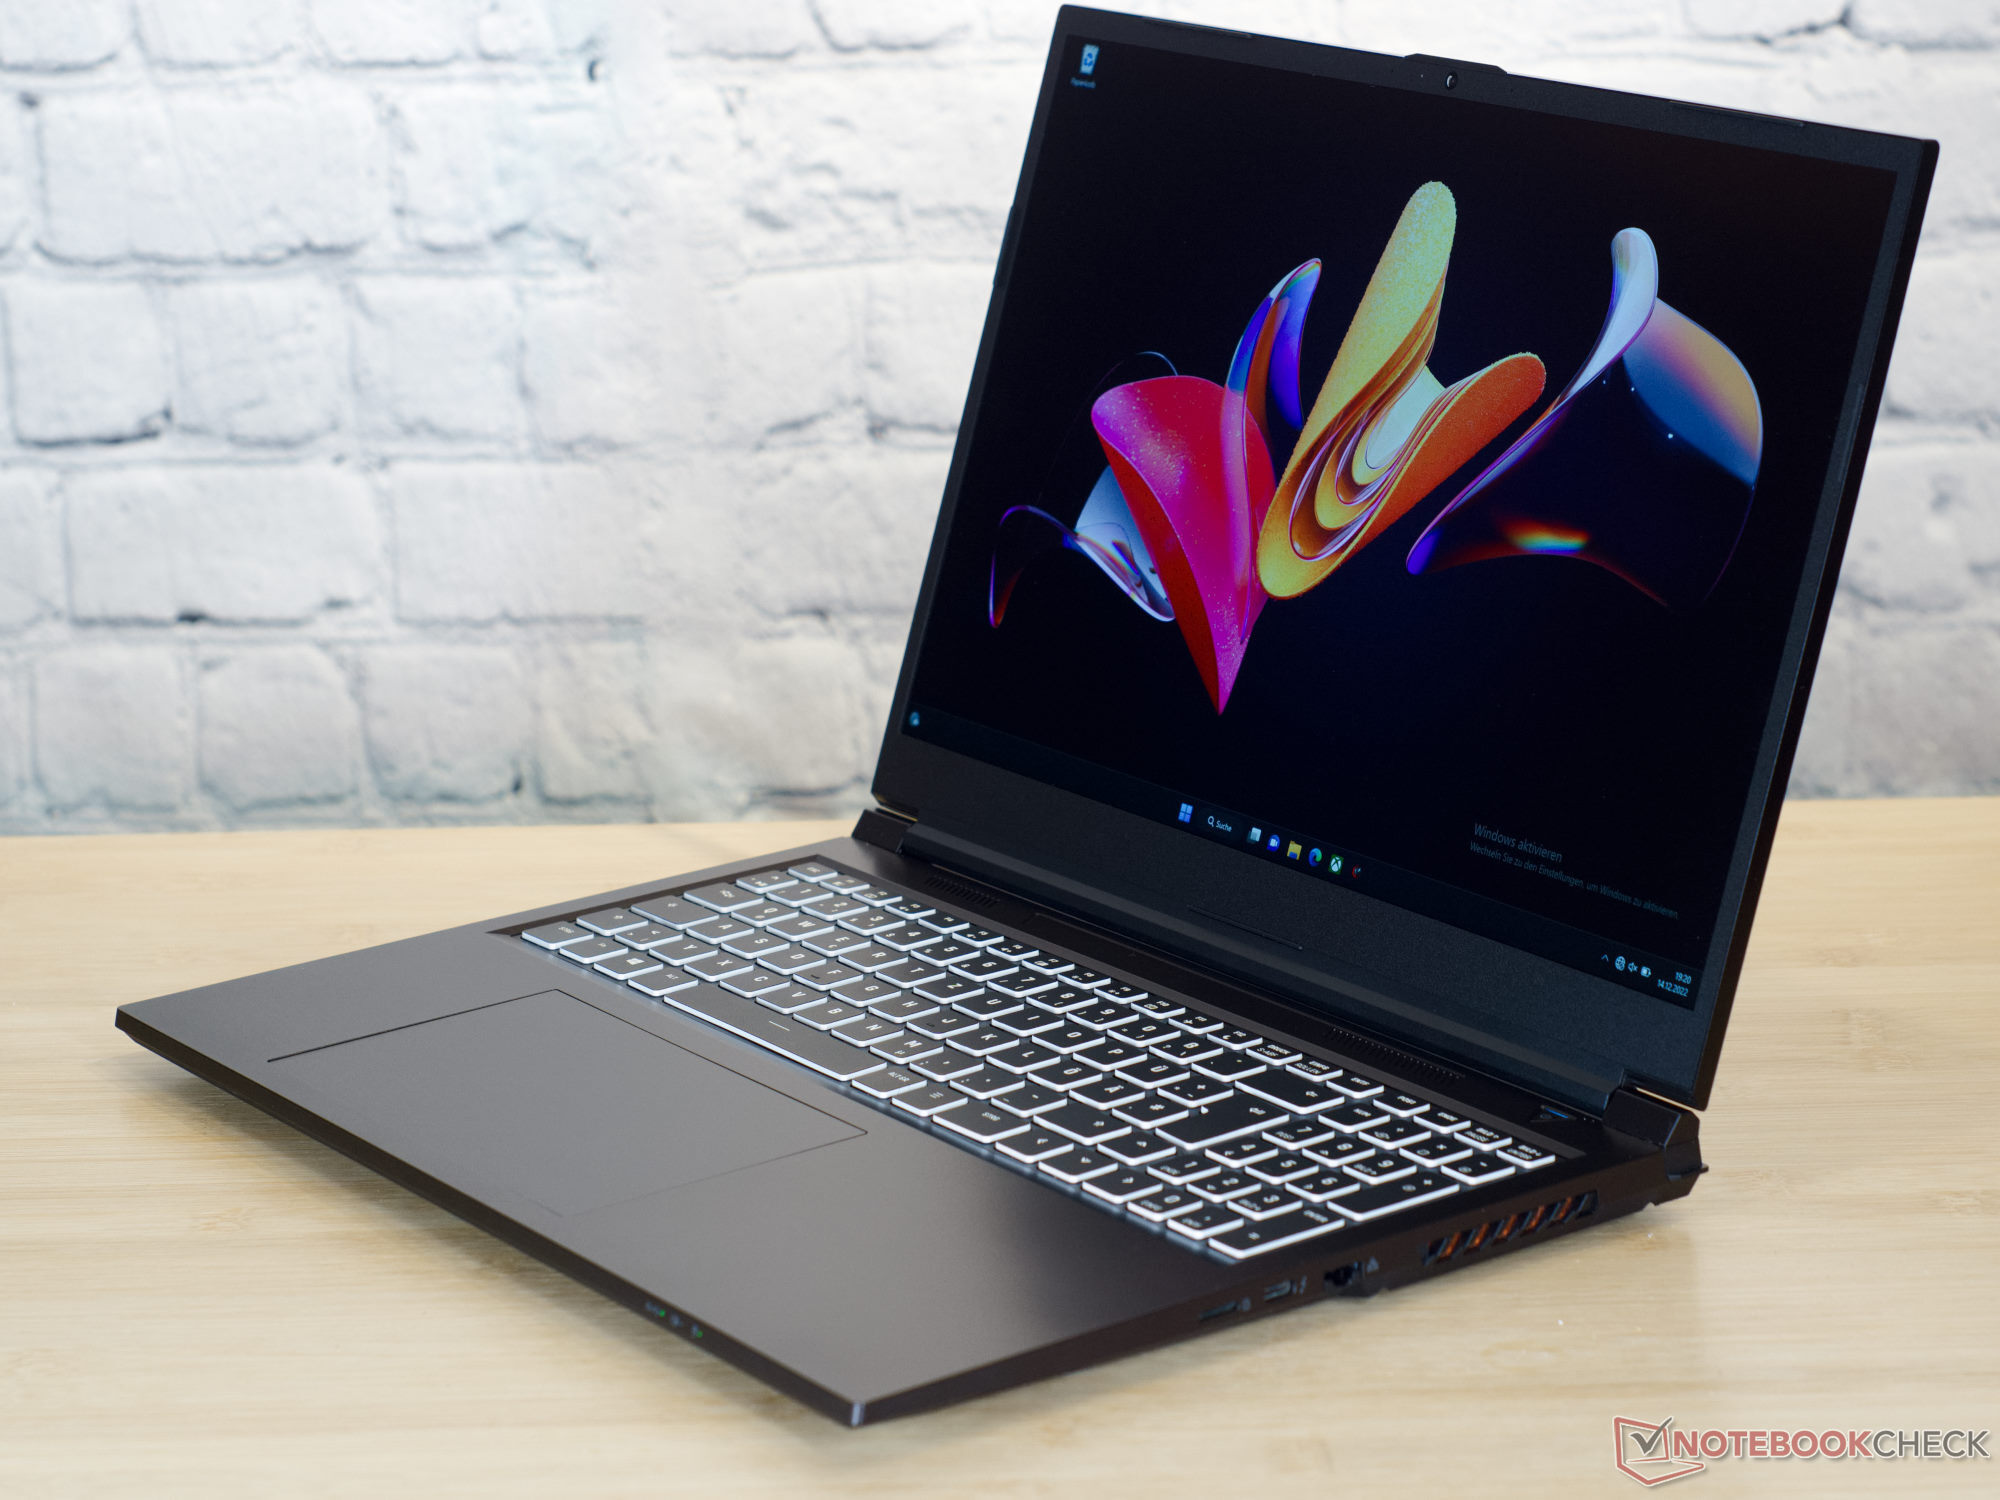

这款游戏笔记本电脑的重量为2.3公斤,厚度为2.4厘米,在其直接竞争对手中并不突出。
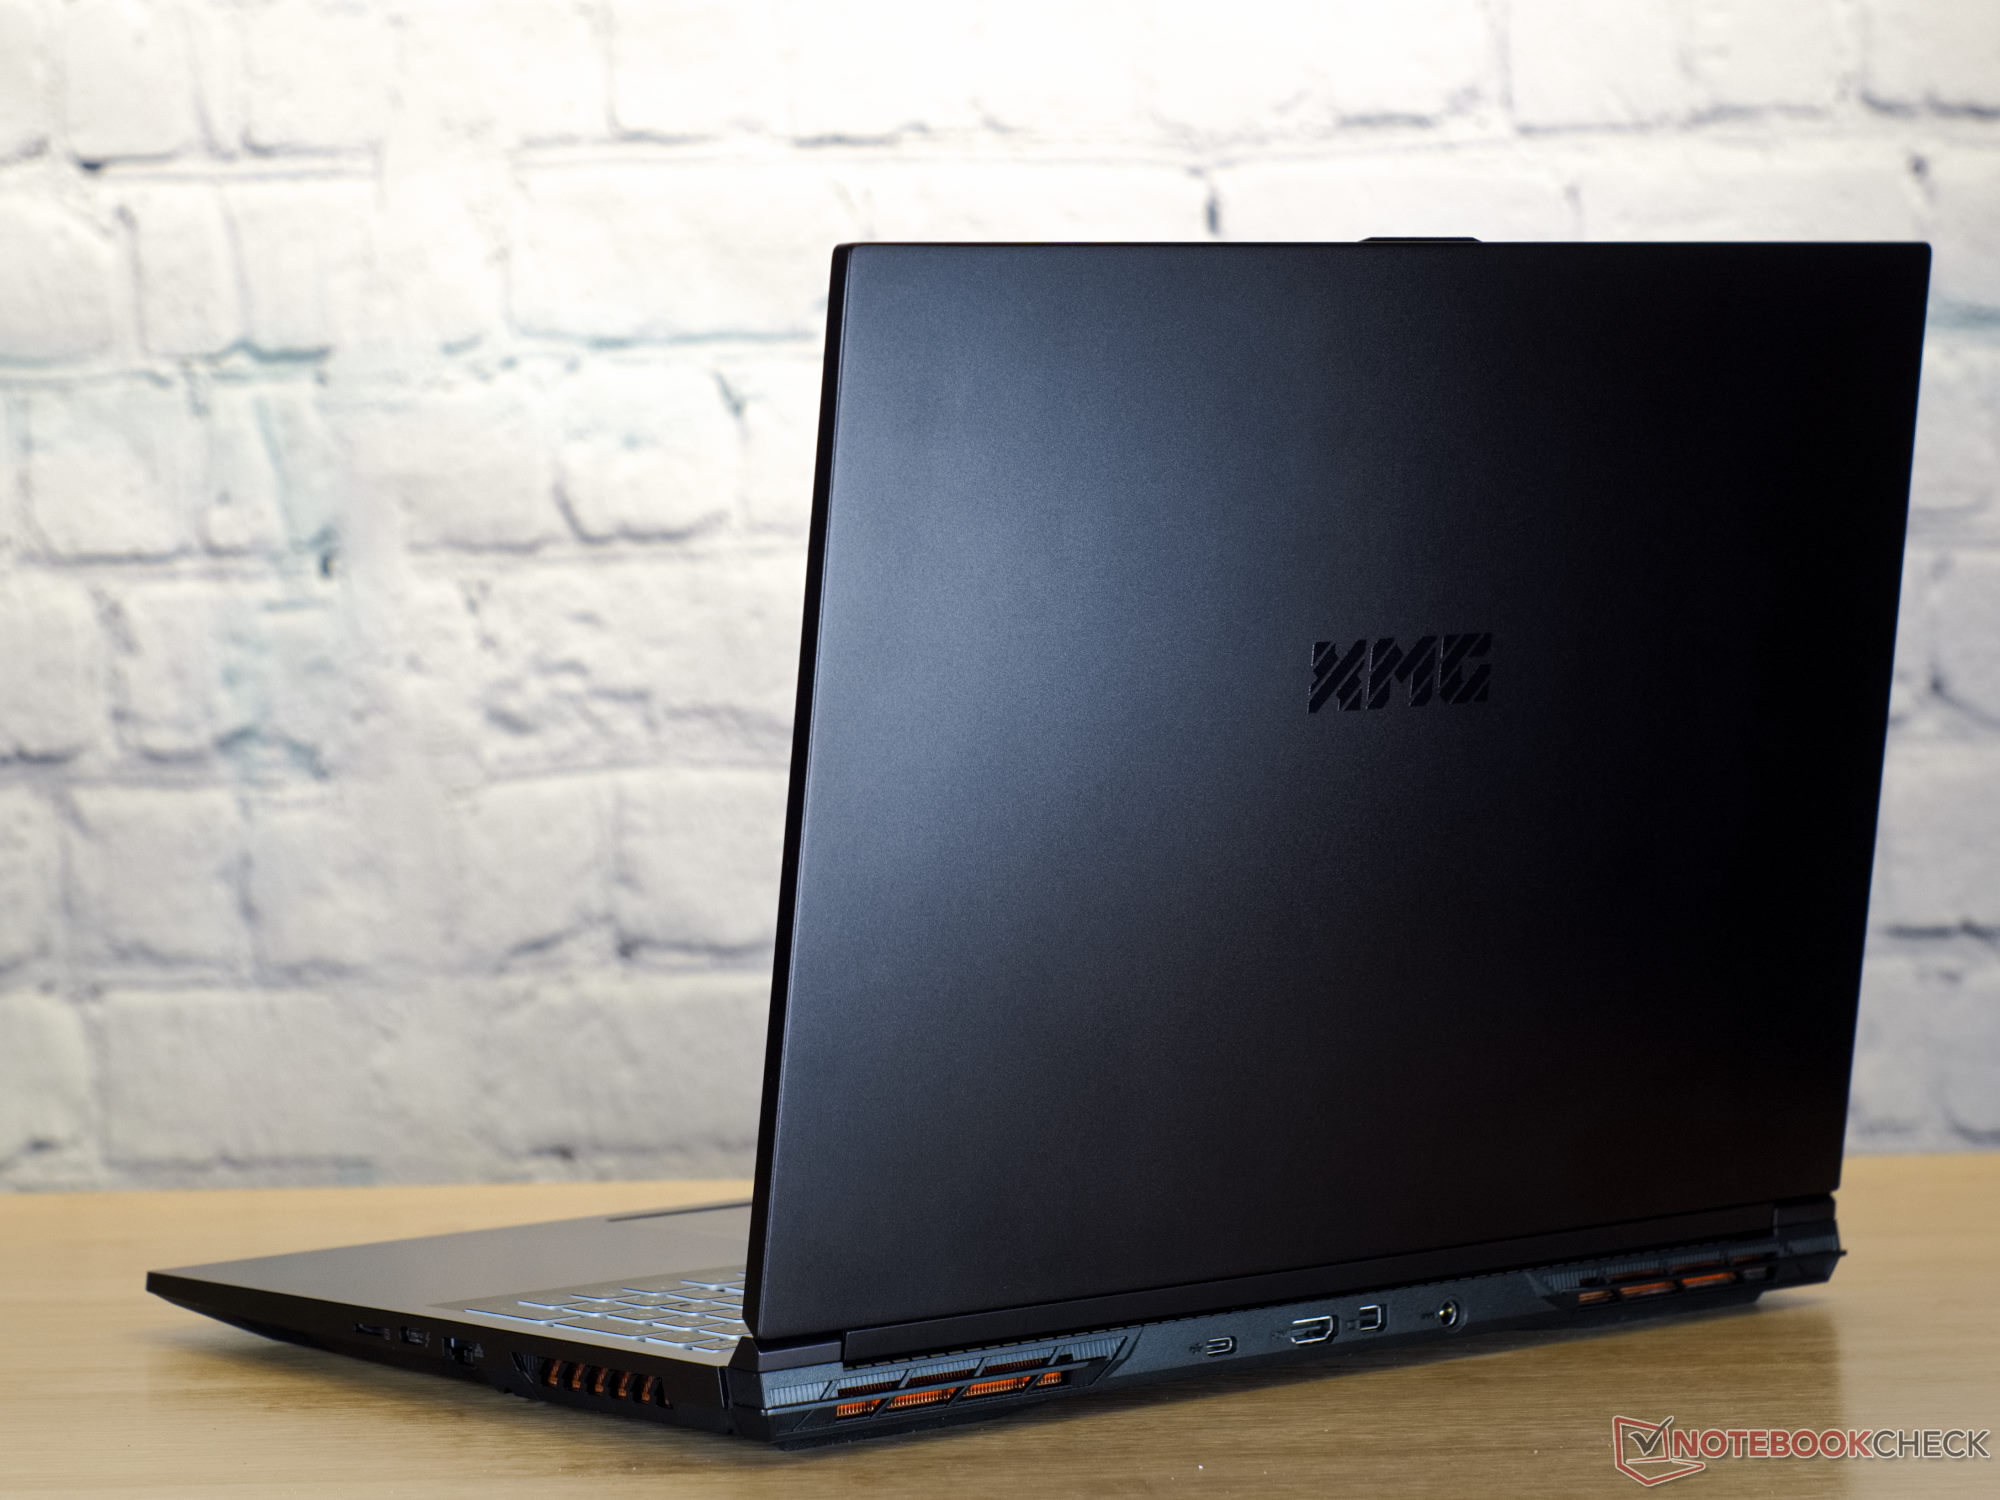
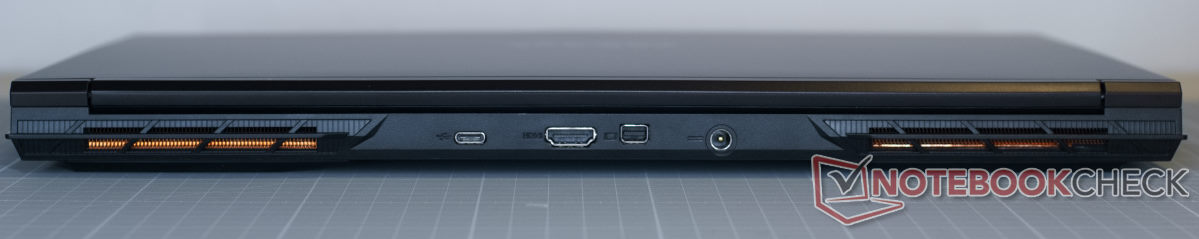
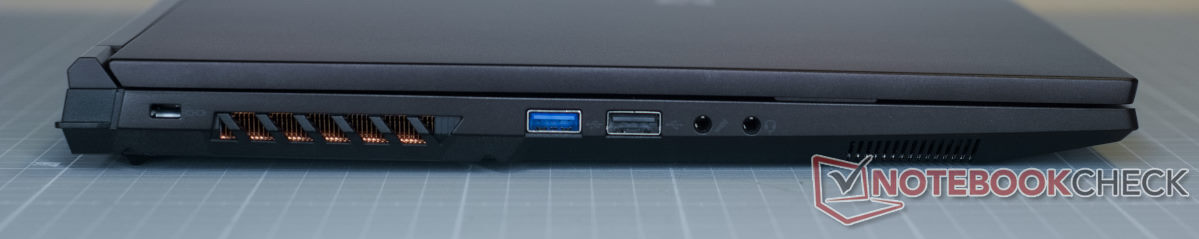
特点 - 许多端口,高传输速度和WiFi 6E
申克公司将这些端口放置在Focus周围的不同位置。显示端口、电源插座以及一个USB-C端口都可以在笔记本电脑的后面找到。这确保了电缆在游戏时不受影响。
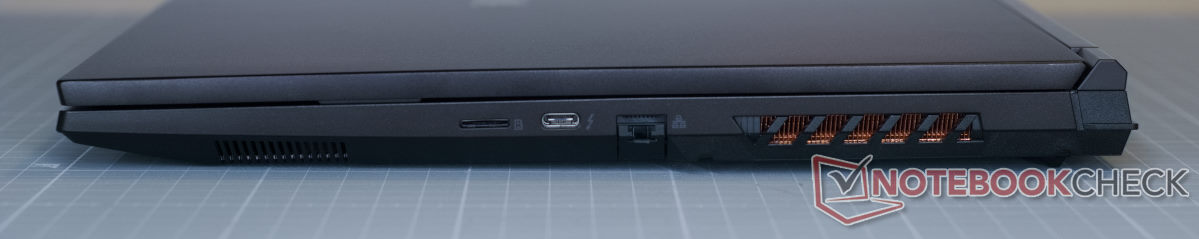
SD卡阅读器
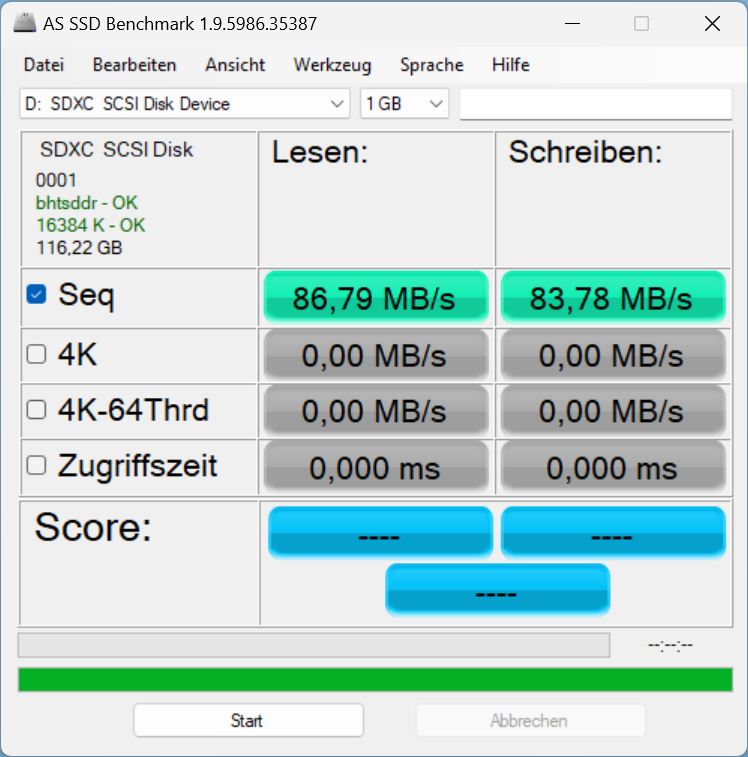
这款游戏笔记本电脑配备了一个微型SD读卡器。
平均来说,这为USB-3.0连接的硬件提供了高传输速度。连接到我们的AV PRO microSD 128 GB V60可能会更快--这一点是由华硕Rog Flow.
| SD Card Reader | |
| average JPG Copy Test (av. of 3 runs) | |
| Asus ROG Flow X16 GV601RW-M5082W (AV Pro SD microSD 128 GB V60) | |
| Average of class Gaming (20.9 - 210, n=54, last 2 years) | |
| Schenker XMG Focus 16 (i7-12700H, RTX 3060) (AV Pro SD microSD 128 GB V60) | |
| Asus ZenBook Pro 16X OLED UX7602ZM-ME115W (AV Pro SD microSD 128 GB V60) | |
| Lenovo ThinkPad X1 Extreme G5-21DE003RGE (AV Pro V60) | |
| Lenovo Legion Slim 7-16IAH 82TF004YGE | |
| maximum AS SSD Seq Read Test (1GB) | |
| Asus ROG Flow X16 GV601RW-M5082W (AV Pro SD microSD 128 GB V60) | |
| Average of class Gaming (25.5 - 261, n=51, last 2 years) | |
| Lenovo Legion Slim 7-16IAH 82TF004YGE | |
| Schenker XMG Focus 16 (i7-12700H, RTX 3060) (AV Pro SD microSD 128 GB V60) | |
| Asus ZenBook Pro 16X OLED UX7602ZM-ME115W (AV Pro SD microSD 128 GB V60) | |
| Lenovo ThinkPad X1 Extreme G5-21DE003RGE (AV Pro V60) | |
沟通
WiFi连接在速度和稳定性方面都高于平均水平。英特尔X211局域网模块在这里充分显示了其潜力。
网络摄像头
在Schenker笔记本电脑内可以找到一个典型的720p网络摄像头。最多,我们只能确定相对较小的颜色偏差。否则,该网络摄像头的图像质量处于典型水平。


 GeForce RTX 3060 Laptop GPU, i7-12700H, Samsung SSD 980 Pro 1TB MZ-V8P1T0BW")
 GeForce RTX 3060 Laptop GPU, i7-12700H, Samsung SSD 980 Pro 1TB MZ-V8P1T0BW")
安全问题
Schenker XMG Focus 16有一个Kensington安全插槽。除此之外,所有的标准都符合。TPM 2.0(通过英特尔PTT)已在板上。
锦上添花
申克公司为其所有的笔记本电脑提供了大量的文件。在盒子里,我们发现了一张包含驱动程序的光盘,一个预先配置了Windows的U盘,以及一个带有XMG标志的大鼠标垫。
服务
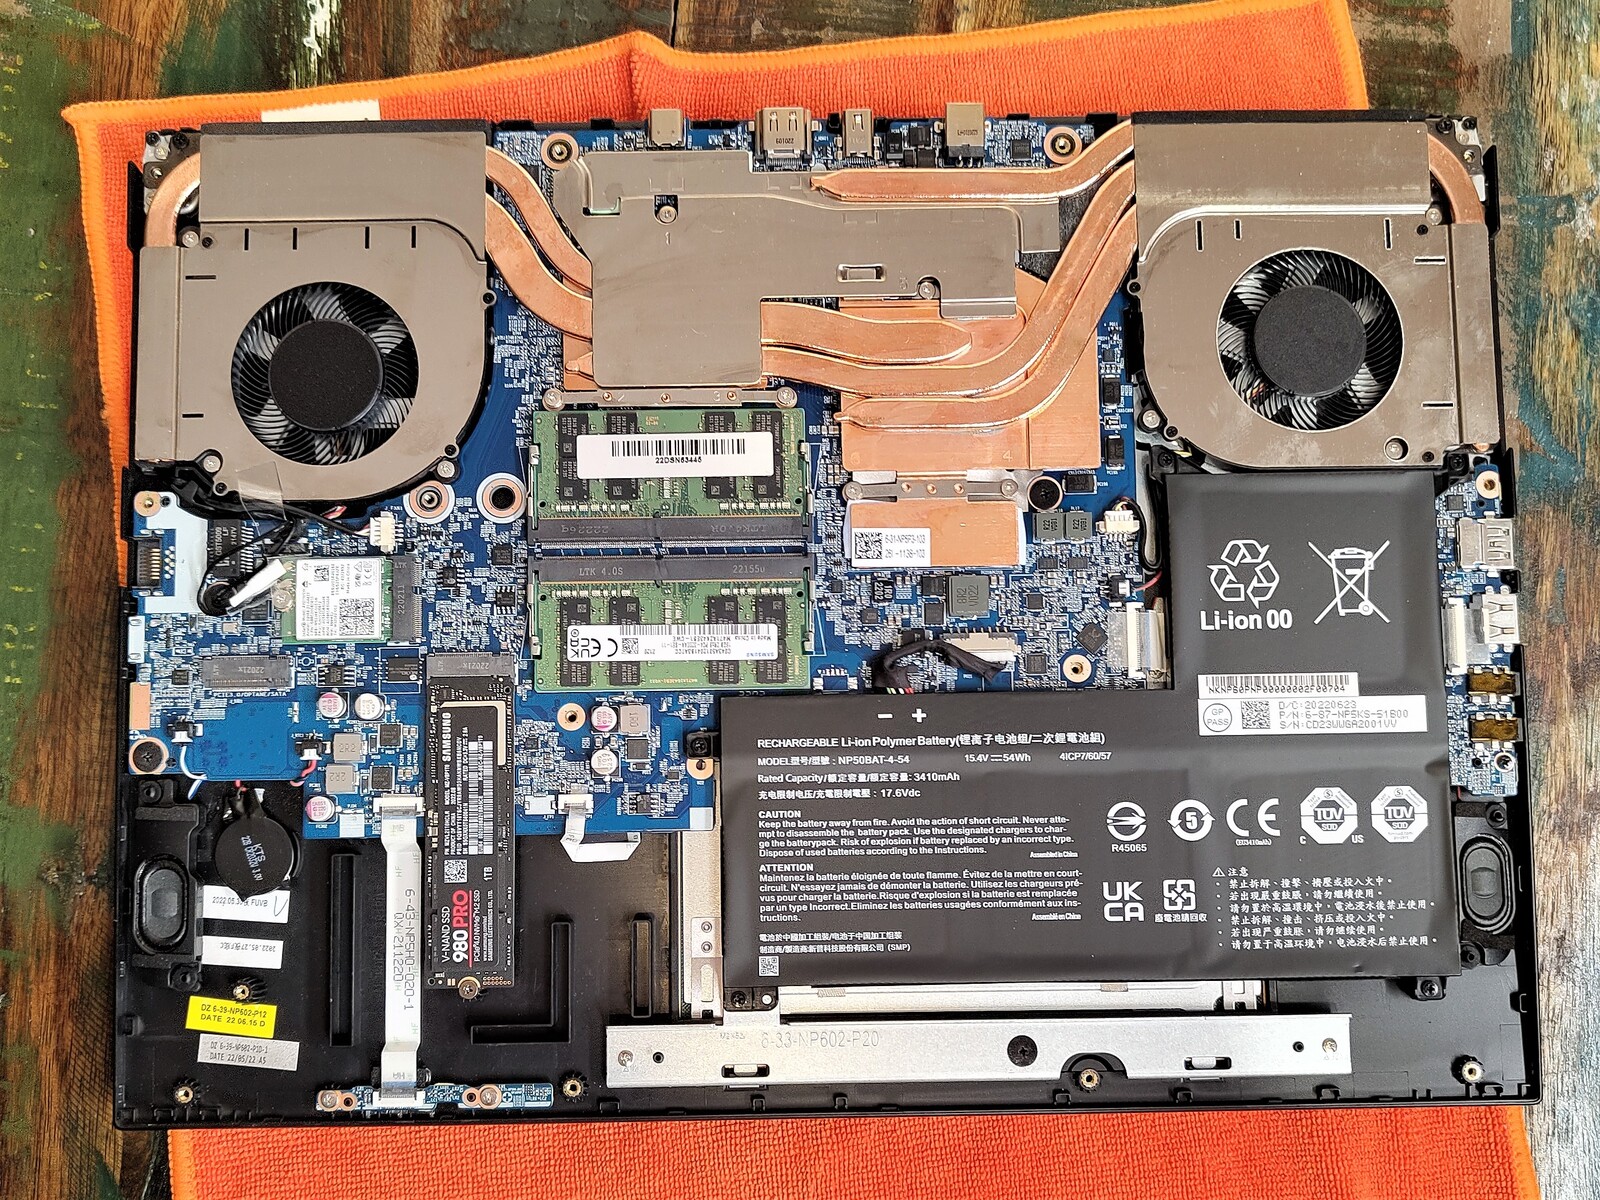
十三颗十字头螺钉将底盖牢牢固定住。当这些被移除后,盖板可以很容易地被掀开。在笔记本内部,我们发现两个(已经被占用的)内存插槽和两个M.2插槽(一个被占用)。所有其他部件都是用螺丝固定的,但没有用胶水粘合。
担保
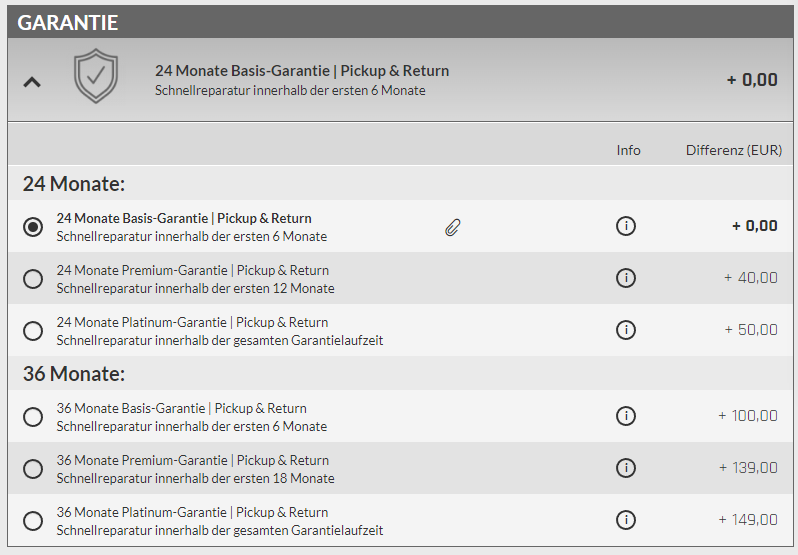
全球国际货运代理公司提供哪些保修服务取决于购买设备时的个人选择。基本保证期为24个月,包括提货、退货和前6个月的快速维修服务。
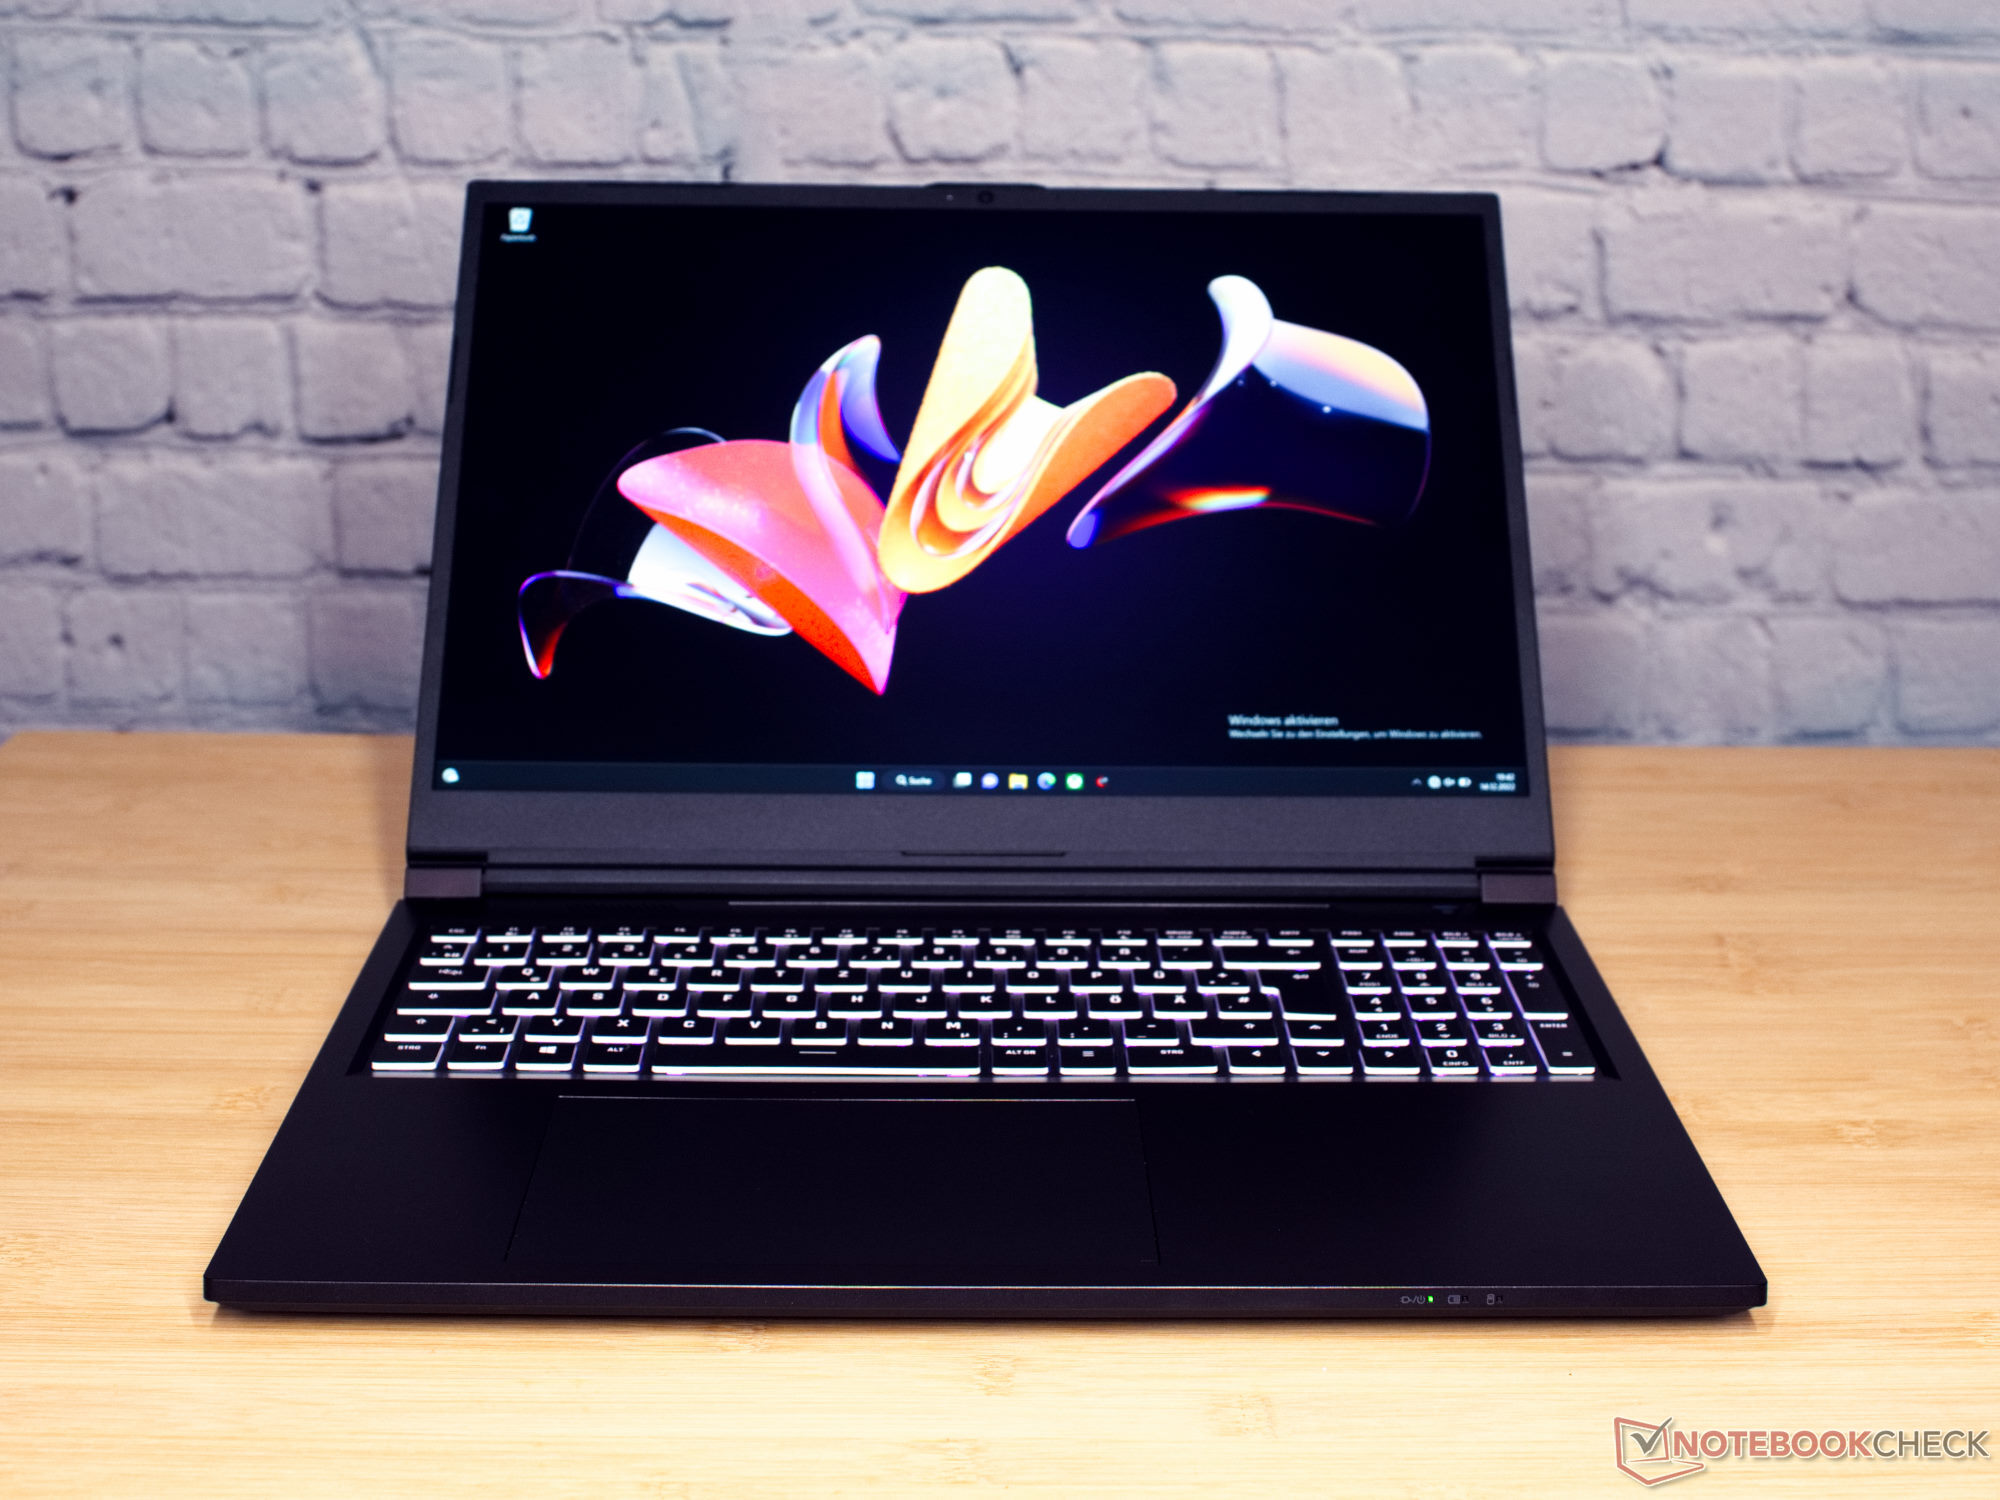
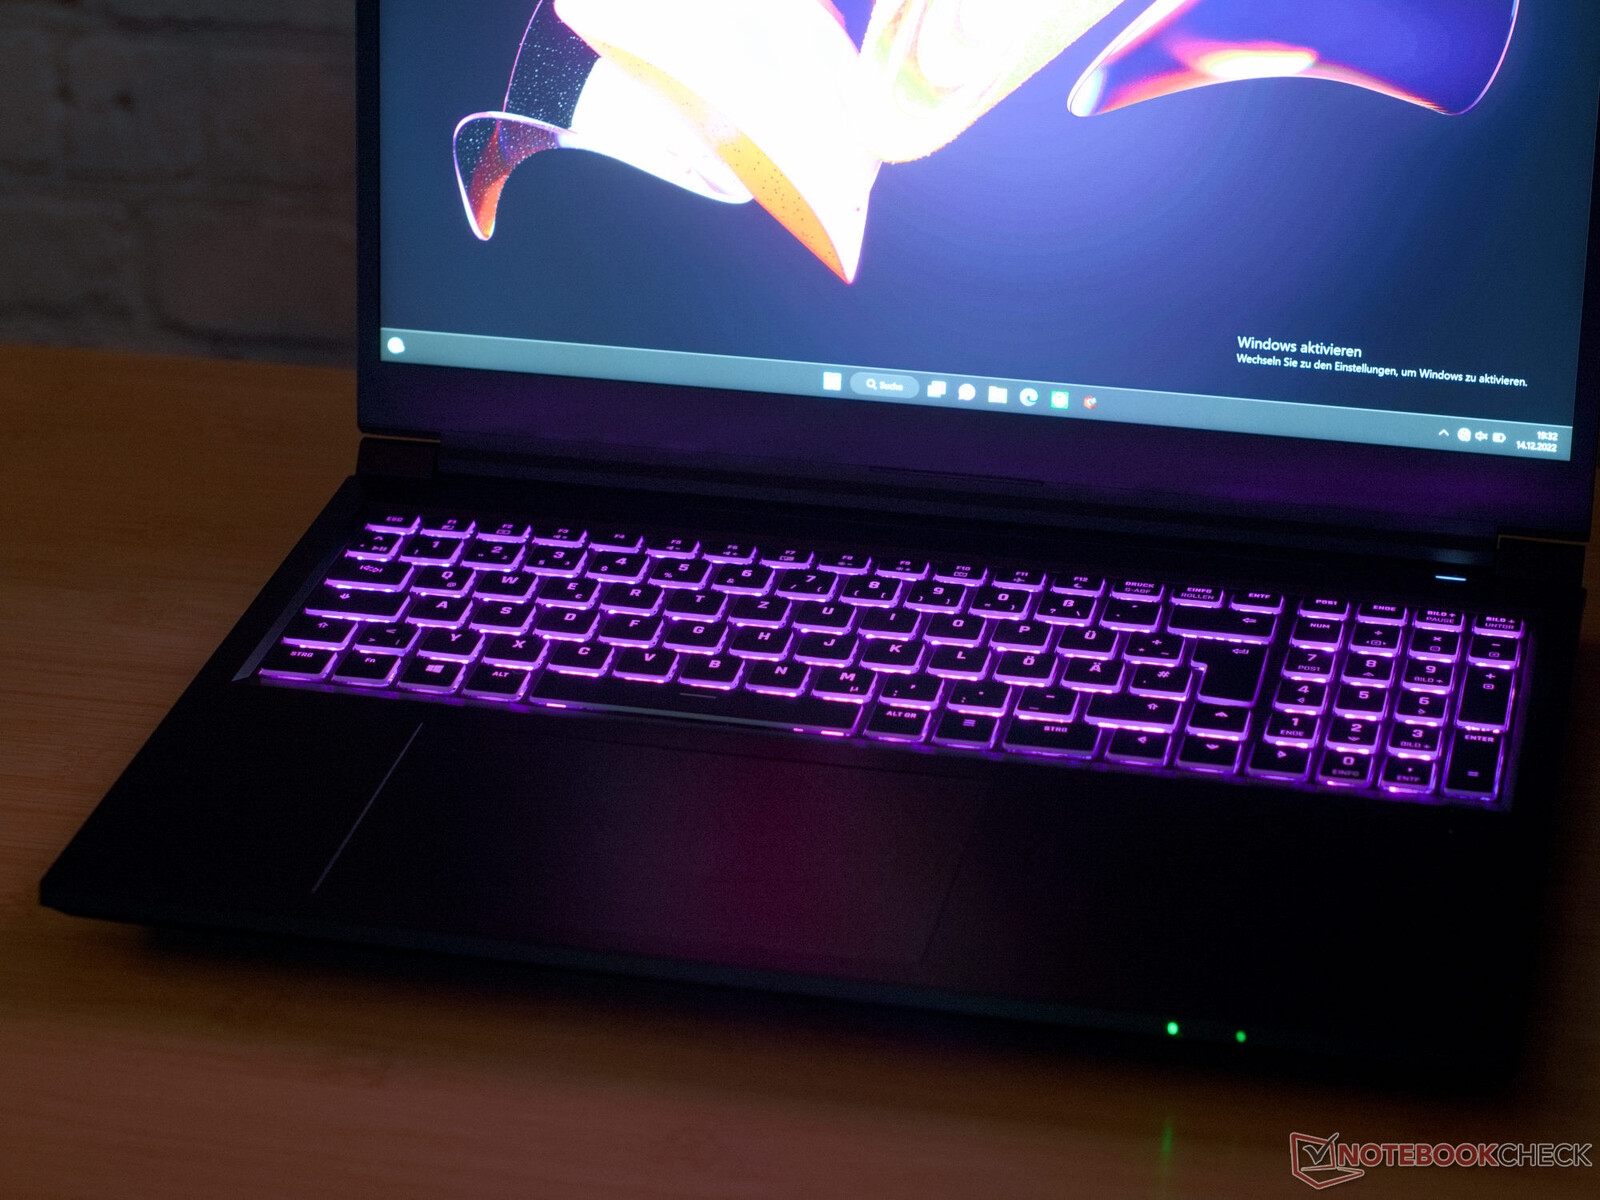
输入设备--长键程
键盘上的激光打印字母很容易阅读,键程几乎为2毫米,还有全尺寸的方向键、RGB照明和数字键盘。根据要求,申克公司将激光打印所有可以想象的键盘布局。
这台笔记本电脑的触控板为15×9厘米,非常大。让申克公司感到尴尬的是:在交货时,触控板的带状电缆没有正确连接,这意味着我们一开始要与没有反应的触控板作斗争。一旦我们解决了这个问题,这个输入设备就能发挥出最高水平。
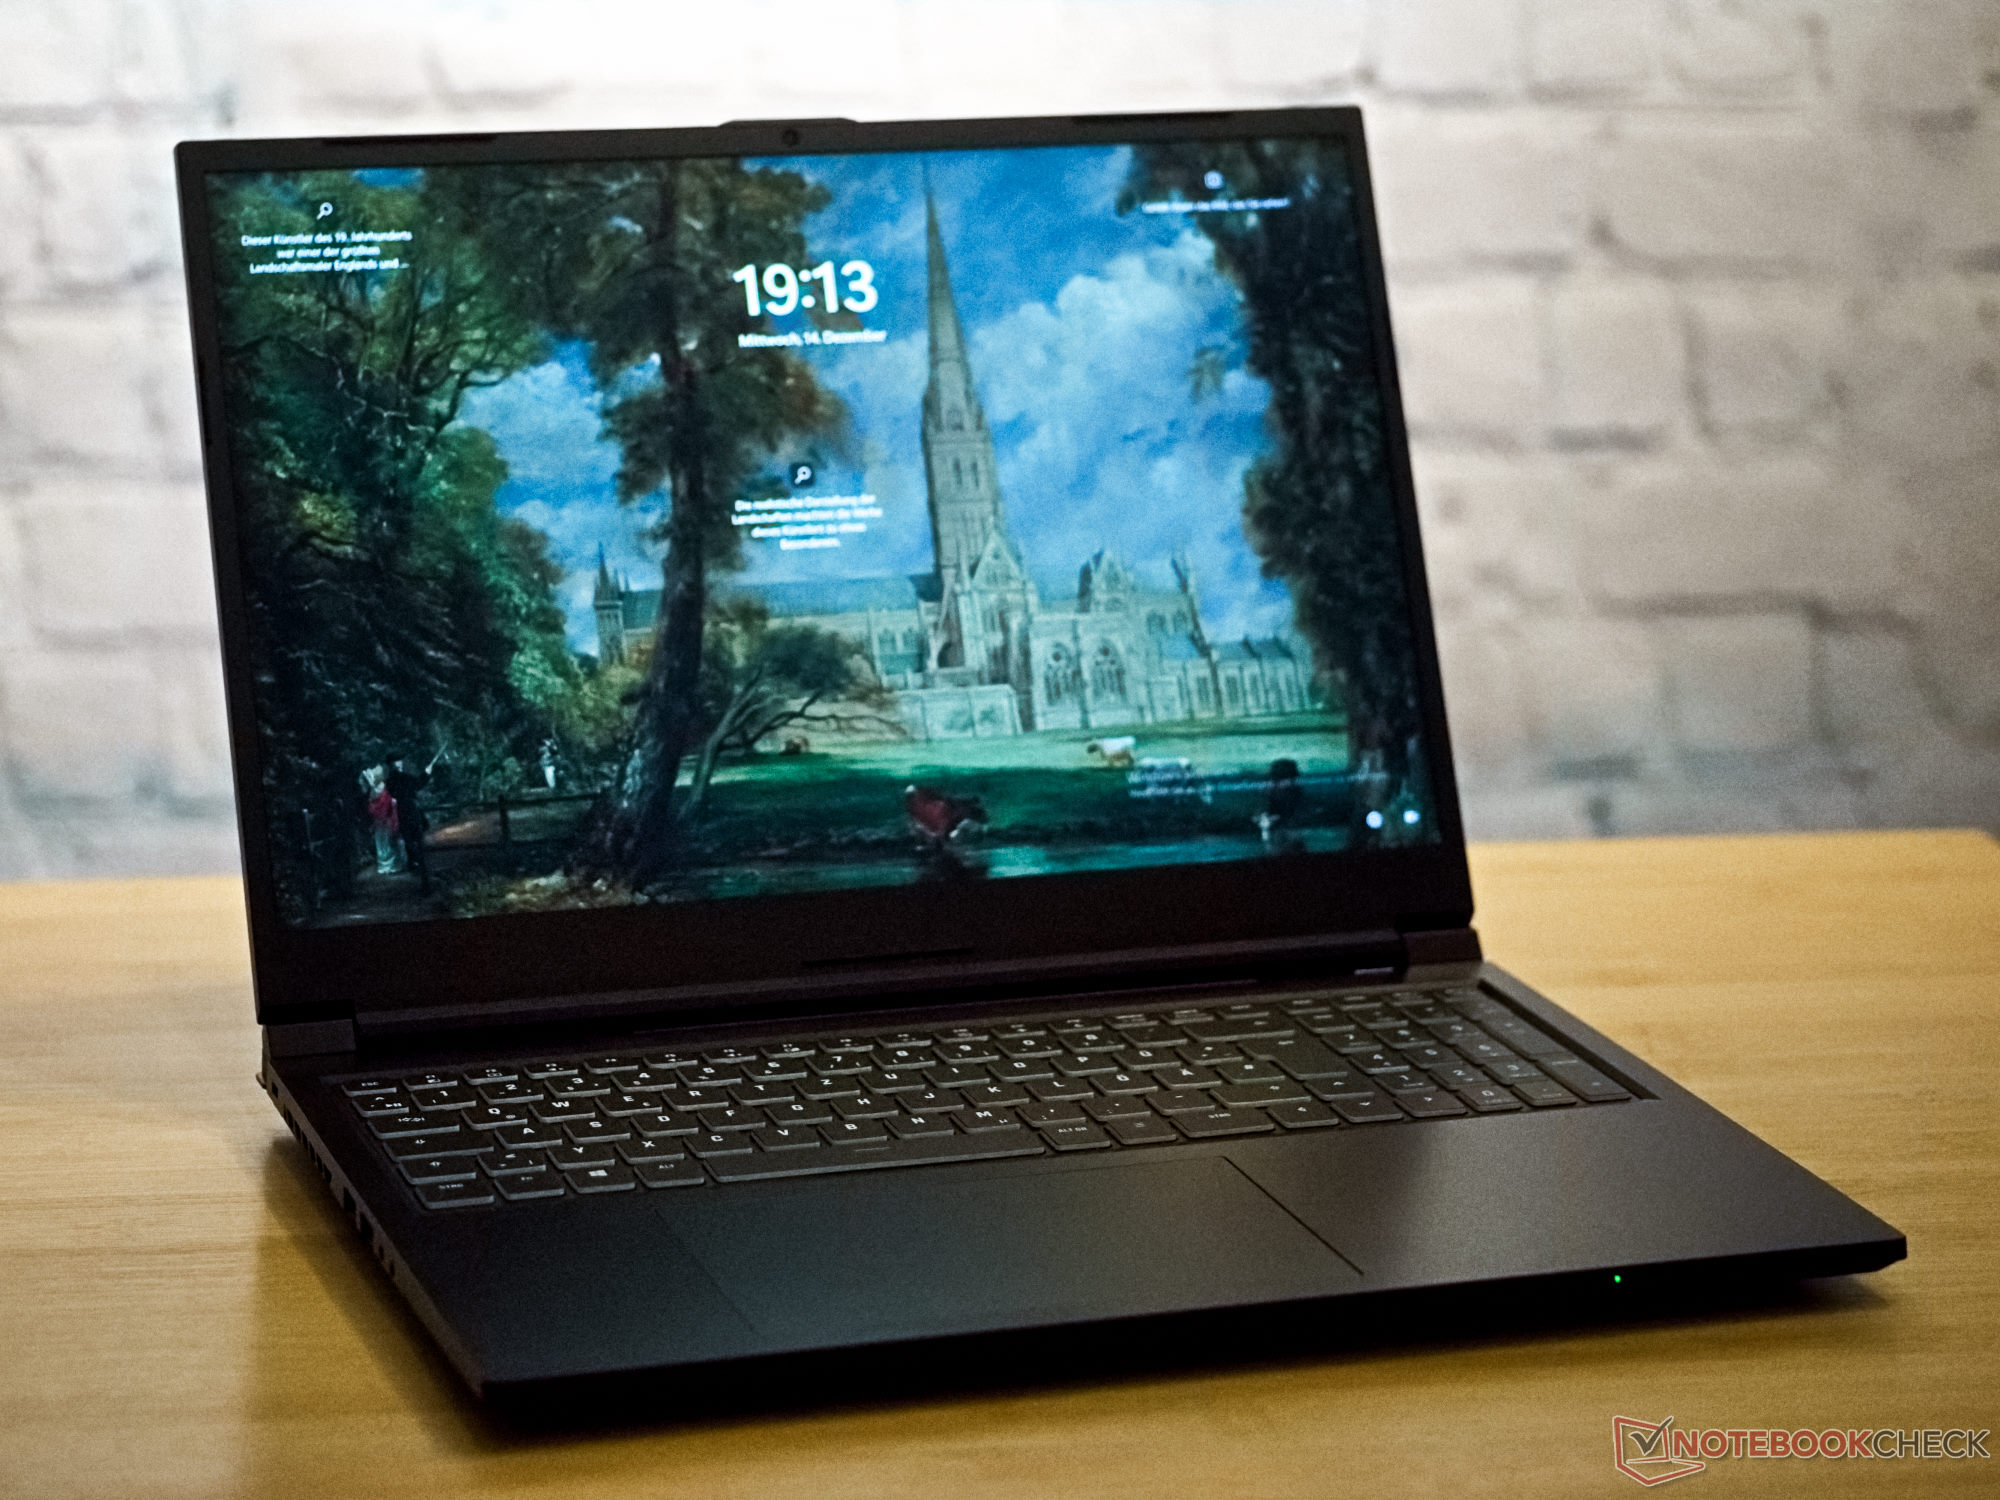
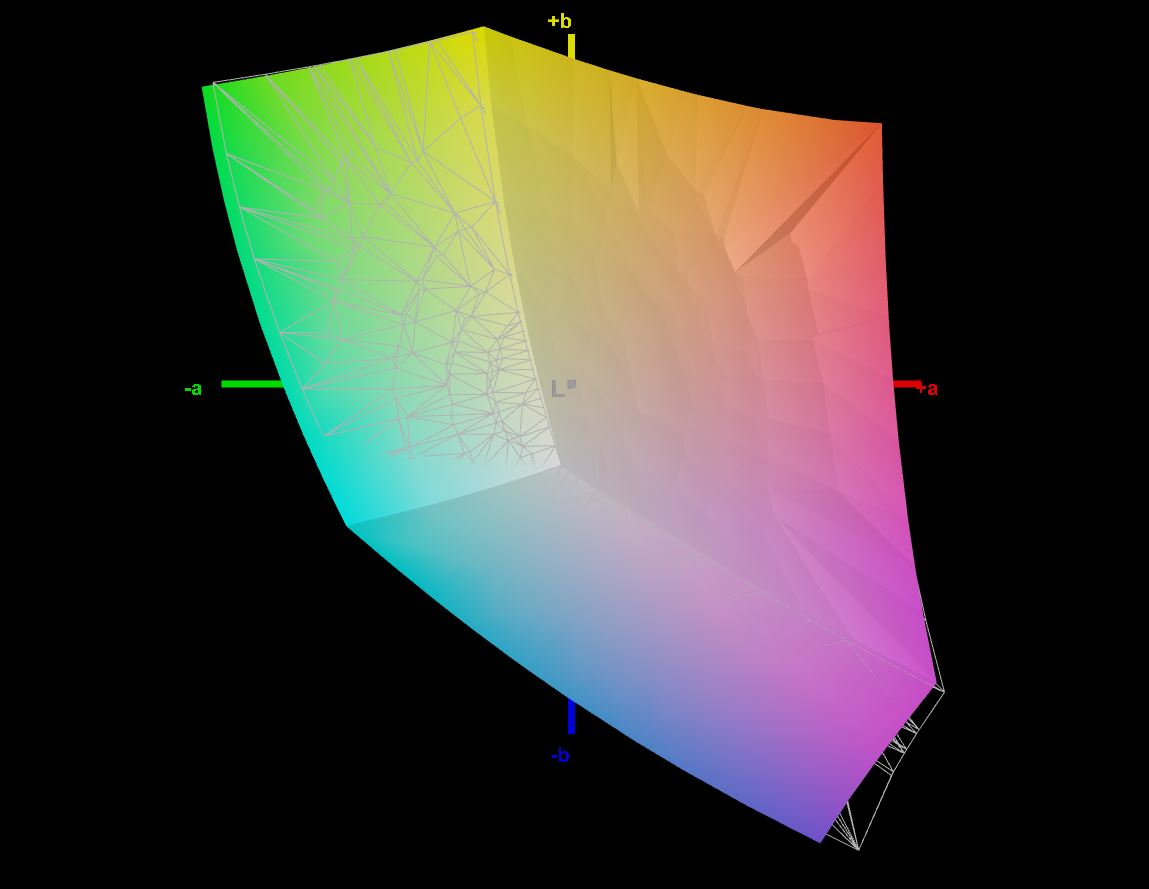
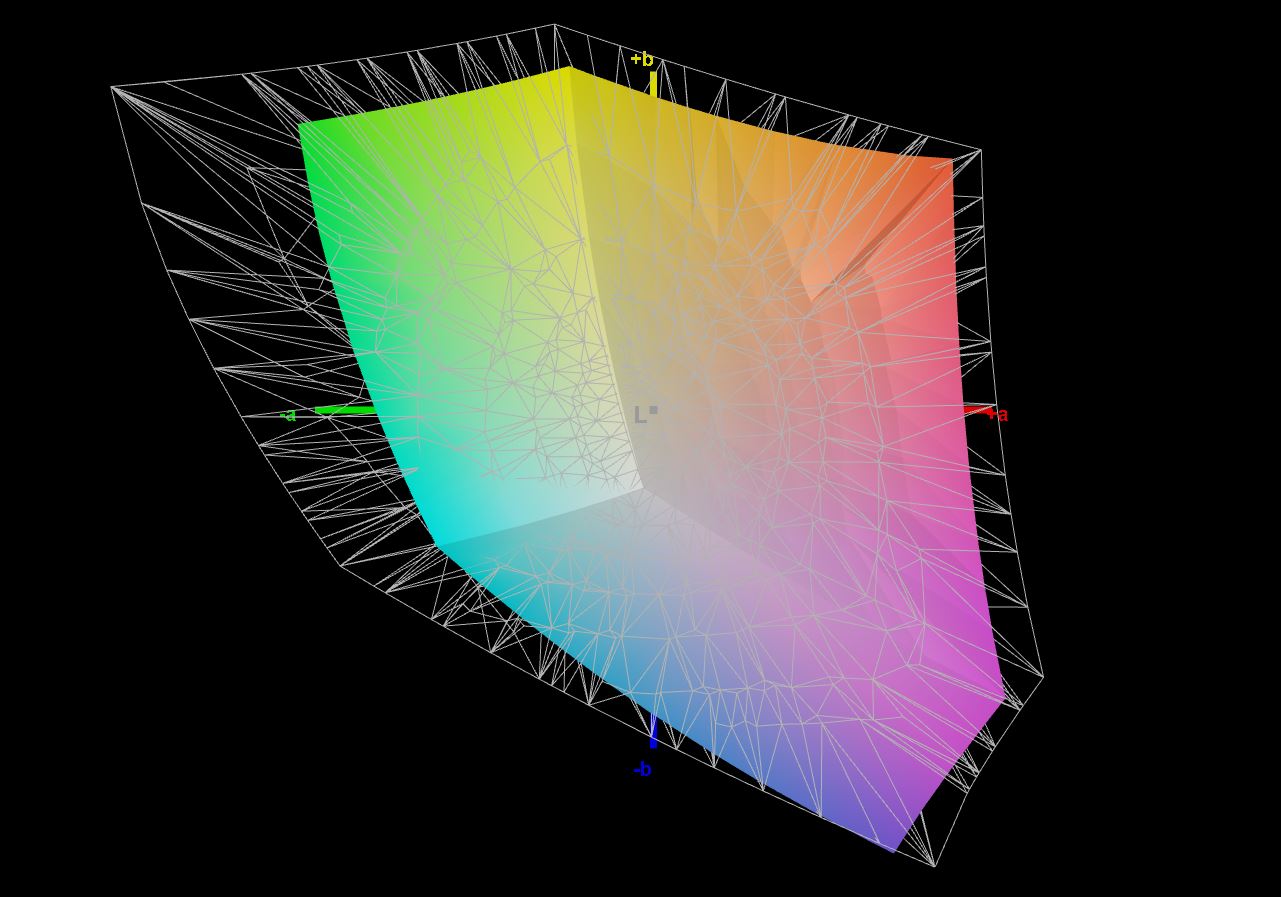
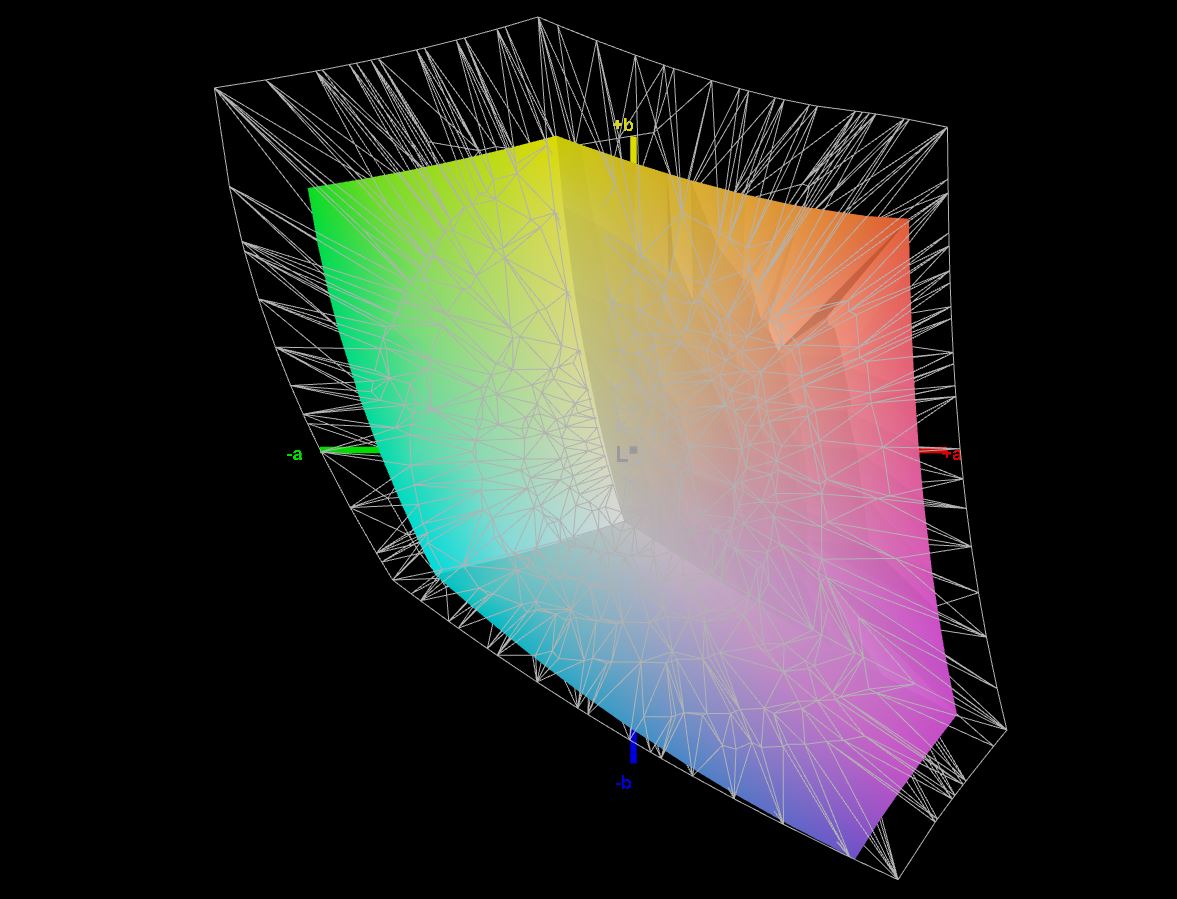
显示屏 - 16:10的QHD+显示屏
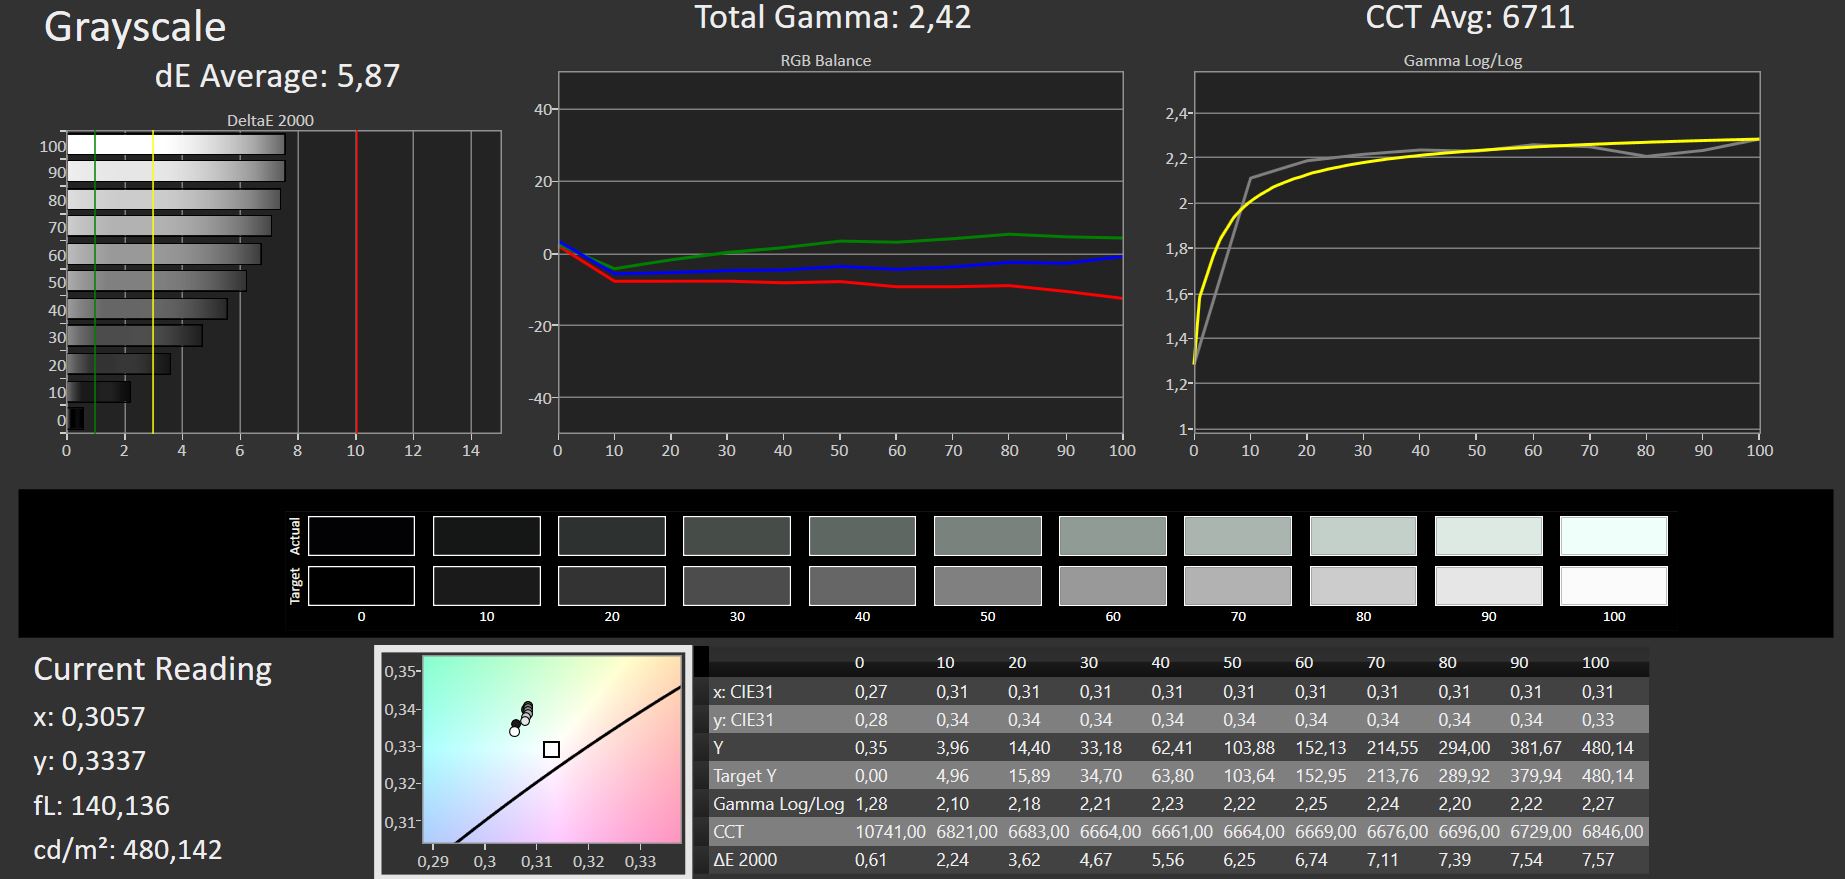
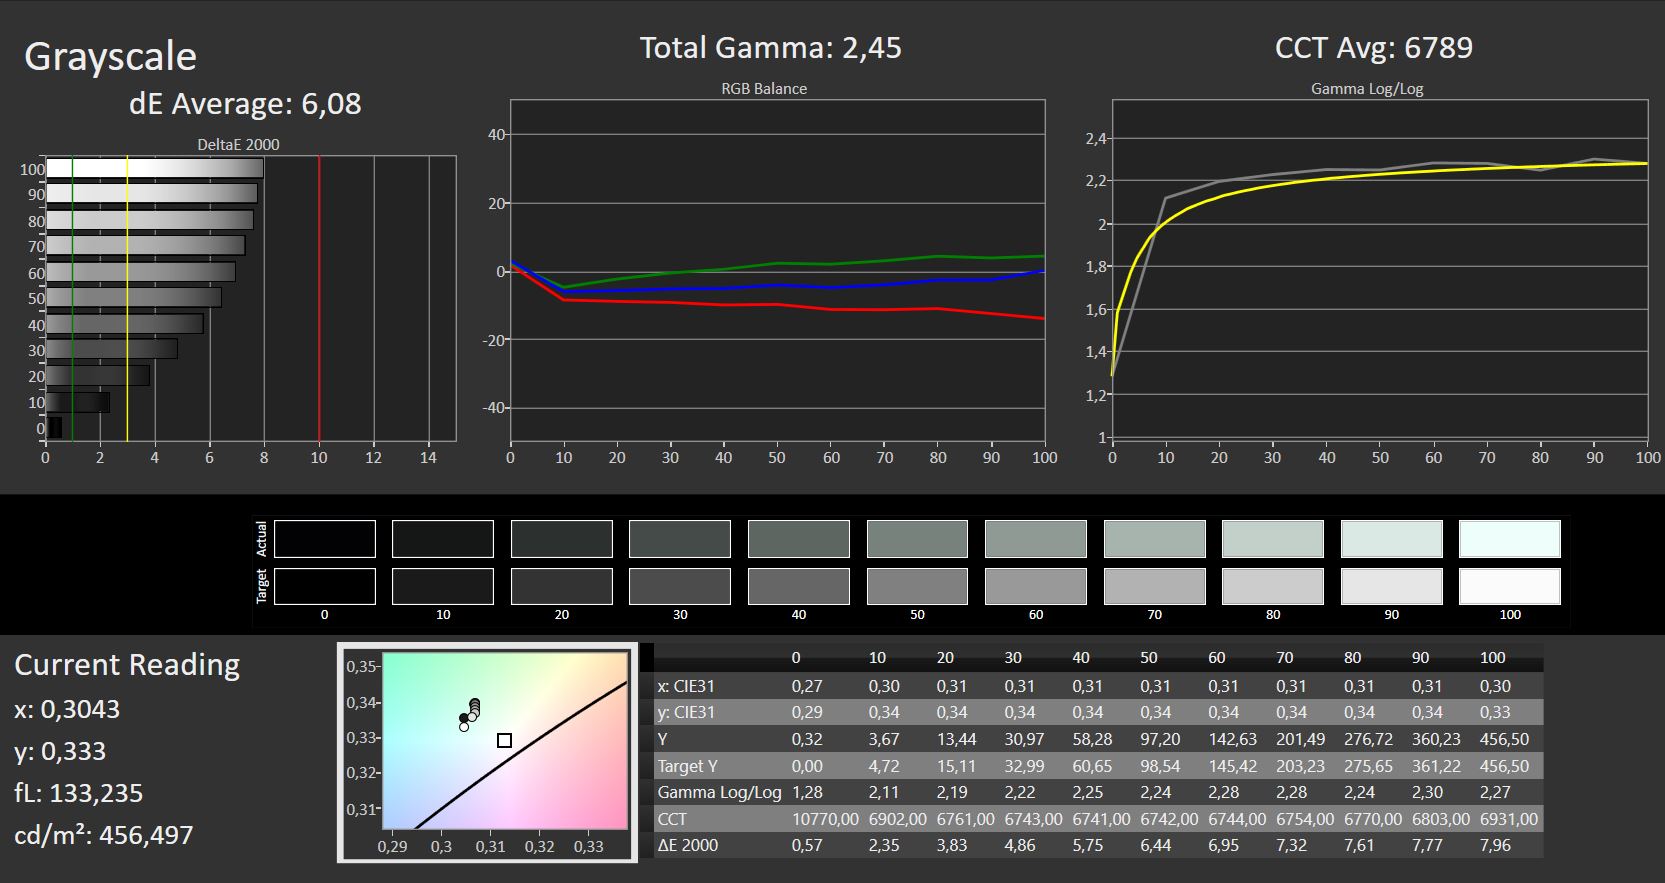
XMG Focus 16显示屏的长宽比为16:10,并不完全是典型的。虽然它提供了2560×1600像素的高分辨率和165Hz的刷新率,但这个450cd/m²的明亮屏幕的响应时间并不像你所期望的那样,是一个游戏笔记本电脑。对比度、色彩覆盖率、黑度和照明度都可以说是不错的。我们无法检测到任何光渗漏。
| |||||||||||||||||||||||||
Brightness Distribution: 89 %
Center on Battery: 455 cd/m²
Contrast: 1438:1 (Black: 0.32 cd/m²)
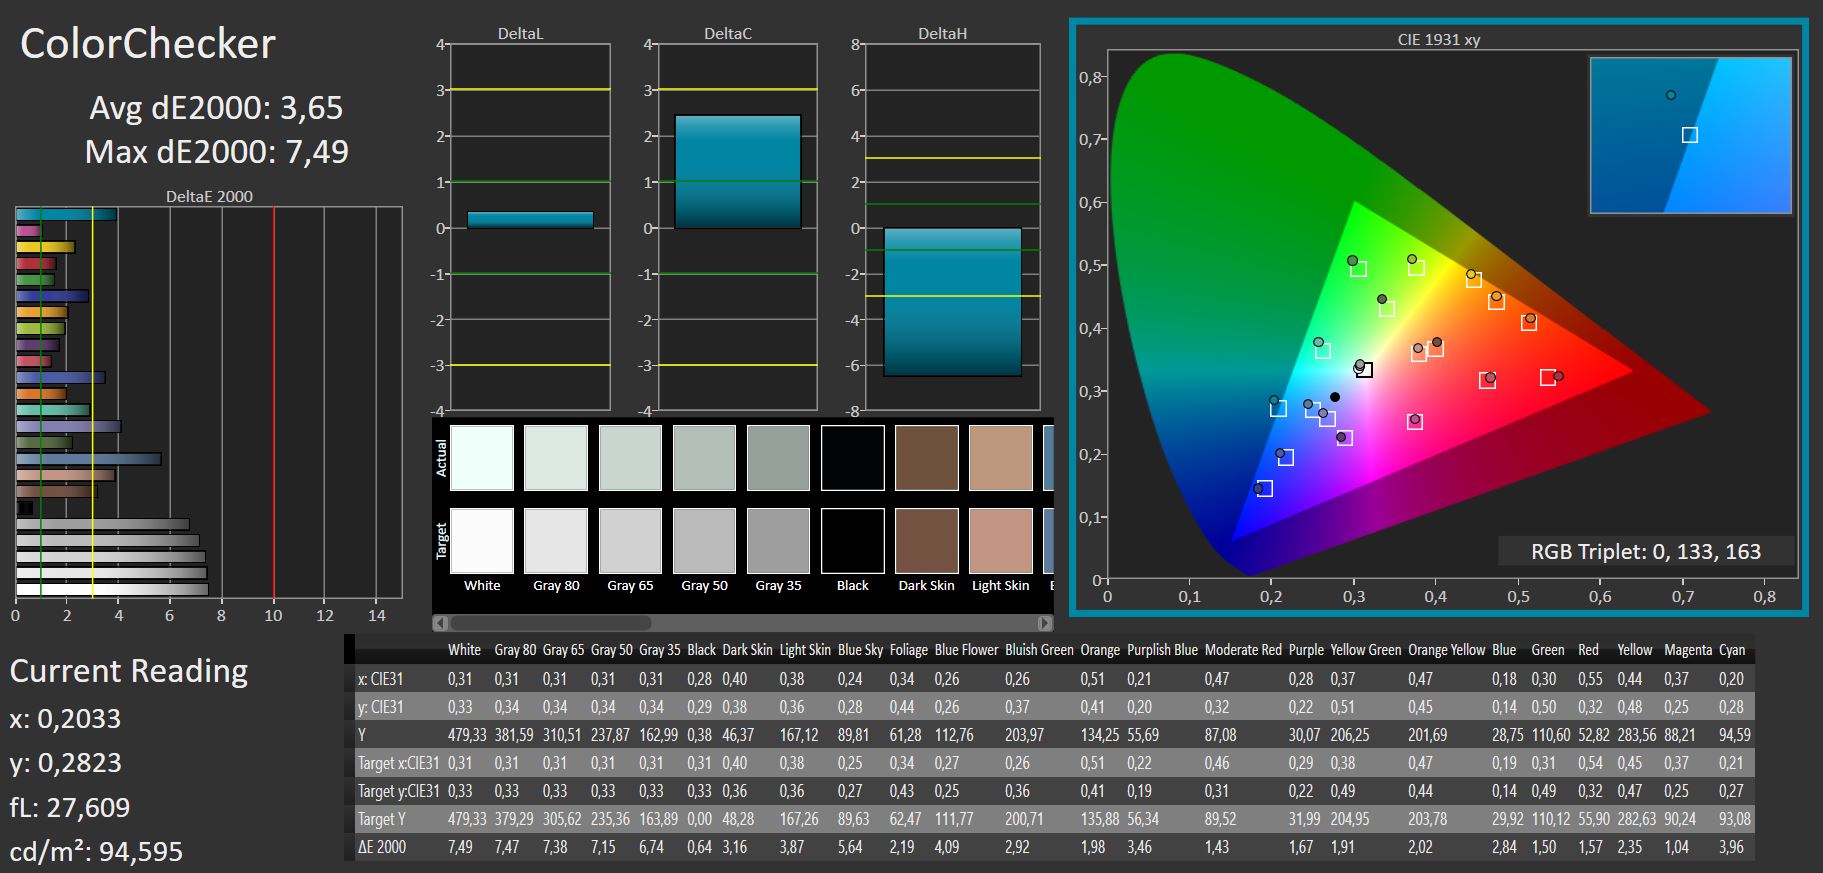
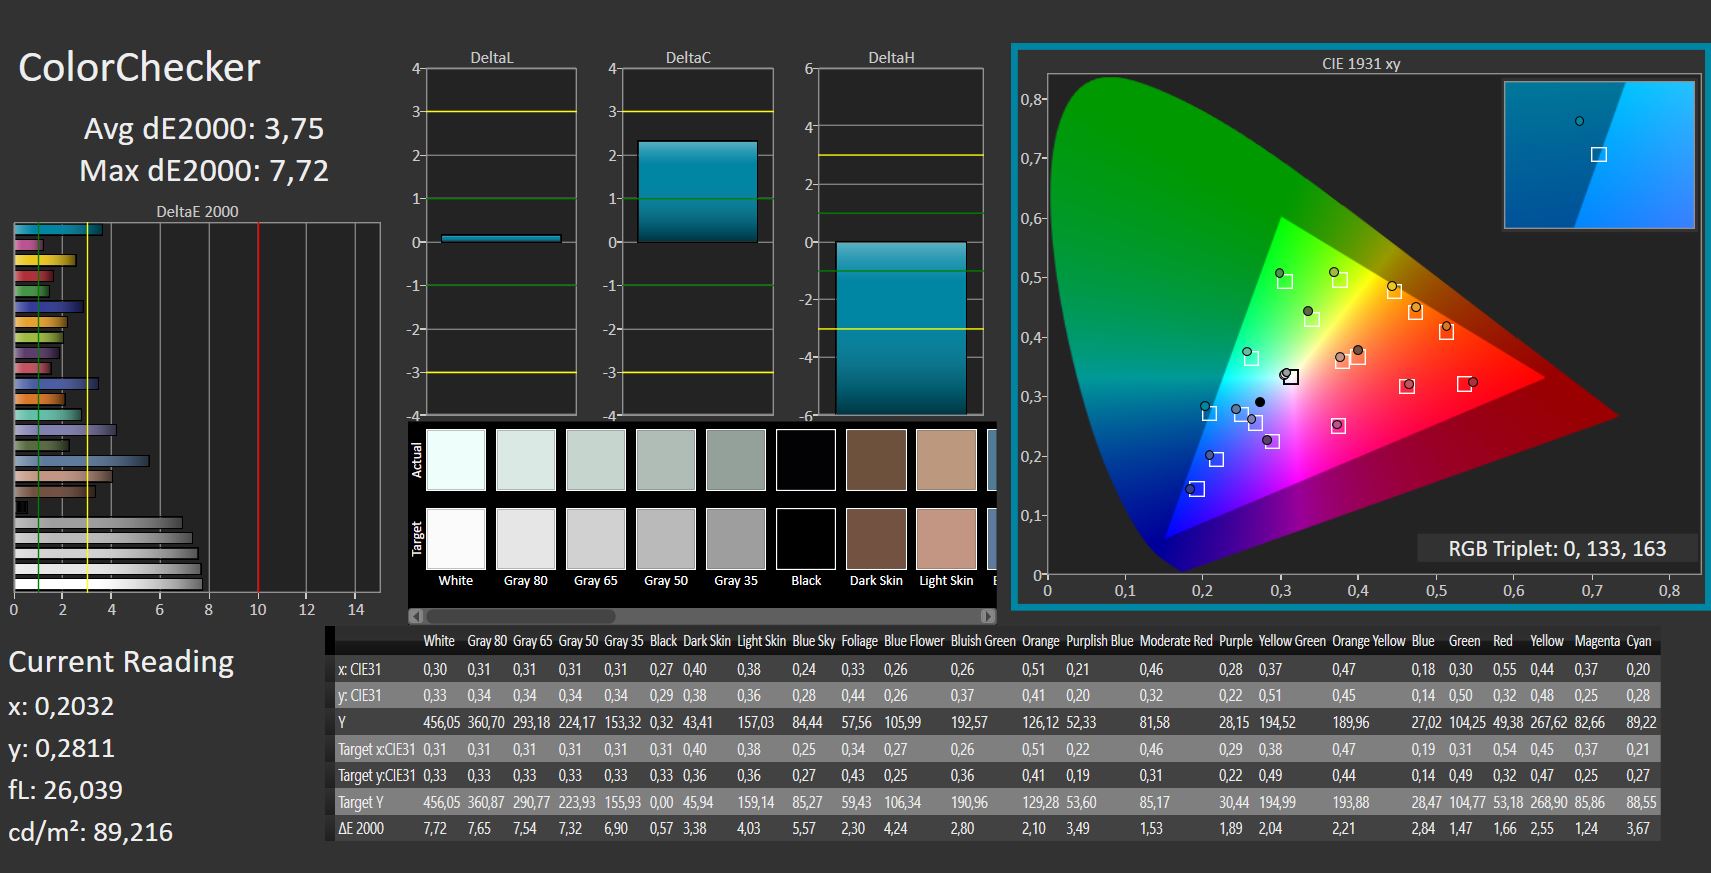
ΔE ColorChecker Calman: 3.65 | ∀{0.5-29.43 Ø4.71}
calibrated: 3.65
ΔE Greyscale Calman: 5.87 | ∀{0.09-98 Ø4.96}
70.6% AdobeRGB 1998 (Argyll 3D)
96.6% sRGB (Argyll 3D)
68.3% Display P3 (Argyll 3D)
Gamma: 2.42
CCT: 6711 K
| Schenker XMG Focus 16 (i7-12700H, RTX 3060) BOE NE16oQDM-NY1, IPS, 2560x1600, 16" | Dell G16 7620 BOE NE16QDM, IPS, 2560x1600, 16" | Asus ZenBook Pro 16X OLED UX7602ZM-ME115W Samsung SDC415D, OLED, 3840x2400, 16" | Asus ROG Flow X16 GV601RW-M5082W AUO B160QAN02.S, Mini LED, 2560x1600, 16.1" | Lenovo ThinkPad X1 Extreme G5-21DE003RGE LP160UQ1-SPB1, IPS, 3840x2400, 16" | Lenovo Legion Slim 7-16IAH 82TF004YGE MNG007DA1-G , IPS LED, 2560x1600, 16" | Lenovo Legion 5 Pro 16IAH7H BOE CCQ_NE160QDM_NY1, IPS, 2560x1600, 16" | |
|---|---|---|---|---|---|---|---|
| Display | 0% | 25% | 26% | 22% | 3% | 1% | |
| Display P3 Coverage (%) | 68.3 | 68.3 0% | 99.84 46% | 99.82 46% | 84.6 24% | 70.5 3% | 68.53 0% |
| sRGB Coverage (%) | 96.6 | 98 1% | 99.99 4% | 99.99 4% | 99.2 3% | 99.1 3% | 98.38 2% |
| AdobeRGB 1998 Coverage (%) | 70.6 | 70.5 0% | 88.9 26% | 90.21 28% | 97.7 38% | 72.8 3% | 70.45 0% |
| Response Times | 26% | 85% | 16% | -129% | 31% | 30% | |
| Response Time Grey 50% / Grey 80% * (ms) | 16.4 ? | 8.6 ? 48% | 2 ? 88% | 11 ? 33% | 46 ? -180% | 12 ? 27% | 14 ? 15% |
| Response Time Black / White * (ms) | 10.8 ? | 10.4 ? 4% | 2 ? 81% | 11 ? -2% | 19.2 ? -78% | 7 ? 35% | 6 ? 44% |
| PWM Frequency (Hz) | 59 ? | 7400 ? | |||||
| Screen | 15% | 21% | 52% | 23% | 19% | 17% | |
| Brightness middle (cd/m²) | 460 | 369.4 -20% | 346 -25% | 498 8% | 476 3% | 523 14% | 515 12% |
| Brightness (cd/m²) | 442 | 348 -21% | 354 -20% | 502 14% | 470 6% | 494 12% | 475 7% |
| Brightness Distribution (%) | 89 | 83 -7% | 96 8% | 94 6% | 90 1% | 90 1% | 85 -4% |
| Black Level * (cd/m²) | 0.32 | 0.32 -0% | 0.11 66% | 0.35 -9% | 0.4 -25% | 0.45 -41% | |
| Contrast (:1) | 1438 | 1154 -20% | 4527 215% | 1360 -5% | 1308 -9% | 1144 -20% | |
| Colorchecker dE 2000 * | 3.65 | 1.78 51% | 2.28 38% | 1.87 49% | 1.9 48% | 2.6 29% | 2.38 35% |
| Colorchecker dE 2000 max. * | 7.49 | 4.41 41% | 4.94 34% | 6.15 18% | 4.7 37% | 5 33% | 4.37 42% |
| Colorchecker dE 2000 calibrated * | 3.65 | 1.22 67% | 2.16 41% | 1.94 47% | 1.3 64% | 1 73% | 1.1 70% |
| Greyscale dE 2000 * | 5.87 | 3.2 45% | 1.64 72% | 3.15 46% | 2.4 59% | 3.3 44% | 2.71 54% |
| Gamma | 2.42 91% | 2.2 100% | 2.37 93% | 330.95 1% | 2.24 98% | 2.17 101% | 2.49 88% |
| CCT | 6711 97% | 6750 96% | 6384 102% | 7294 89% | 6377 102% | 6013 108% | 6117 106% |
| Total Average (Program / Settings) | 14% /
14% | 44% /
33% | 31% /
41% | -28% /
1% | 18% /
17% | 16% /
15% |
* ... smaller is better
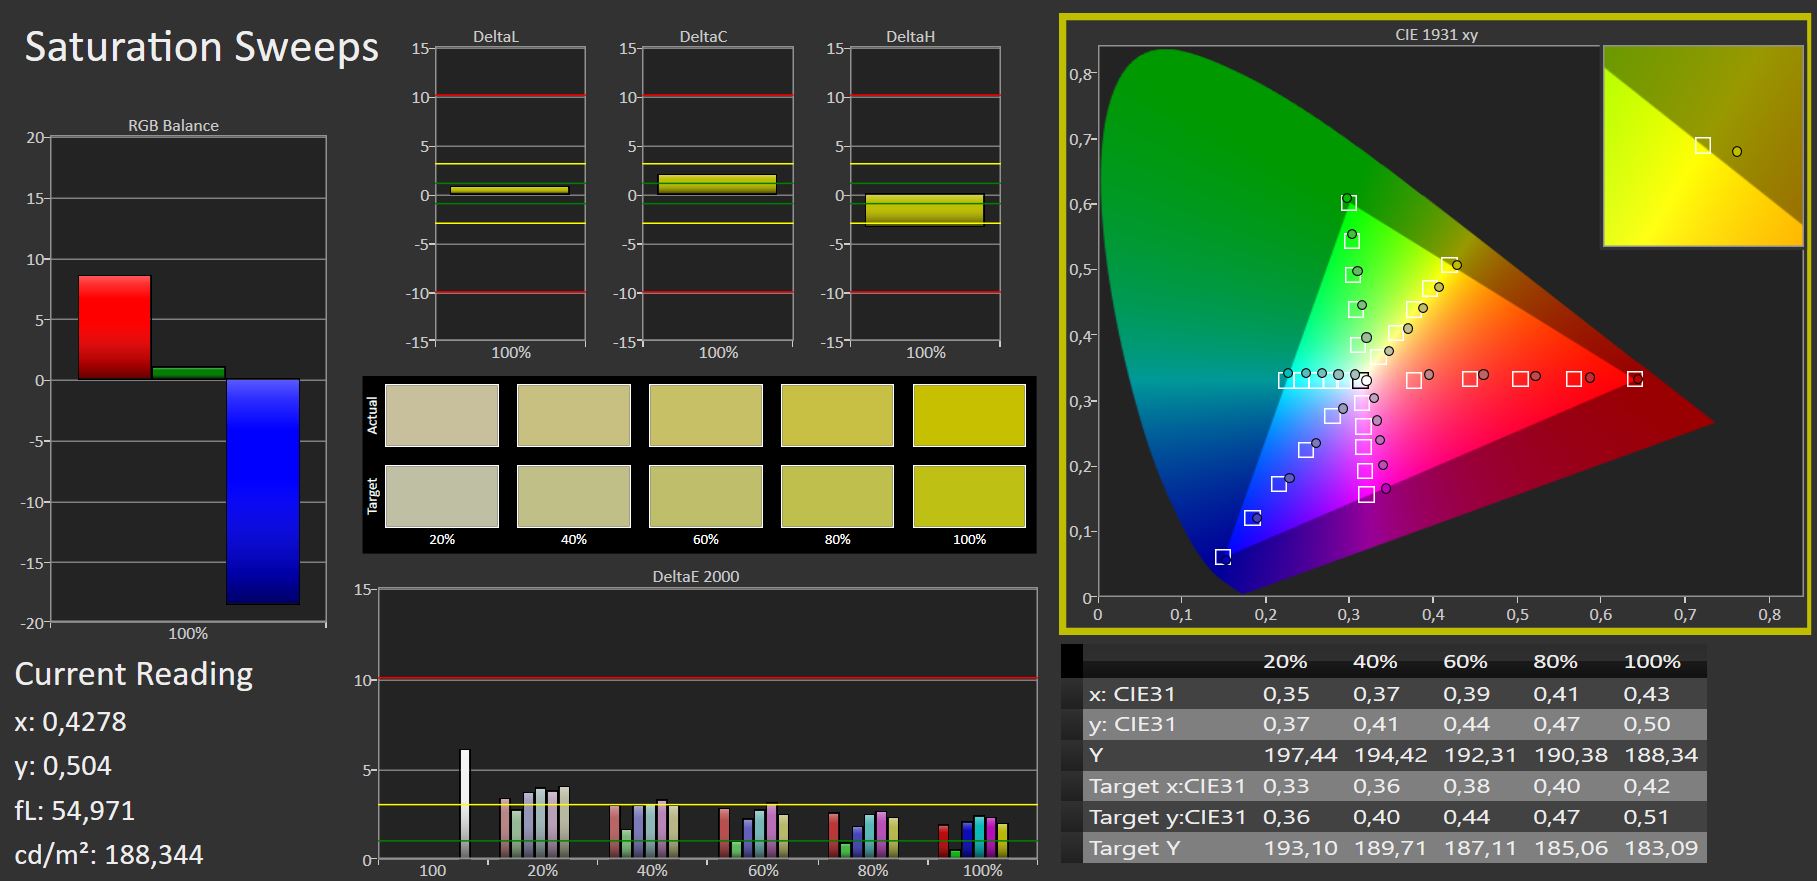
Schenker游戏笔记本的显示屏覆盖了95%的sRGB,而AdobeRGB和DisplayP3则位于70%左右。色彩再现是好的,如果不是完全完美的话。ΔΕ低于3将是可取的,Focus 16的ΔΕ平均为3.65。因此,作品前的色彩奉献是可以接受的。我们的ICC配置文件并没有在色彩再现方面带来任何改进。

Display Response Times
| ↔ Response Time Black to White | ||
|---|---|---|
| 10.8 ms ... rise ↗ and fall ↘ combined | ↗ 5 ms rise | 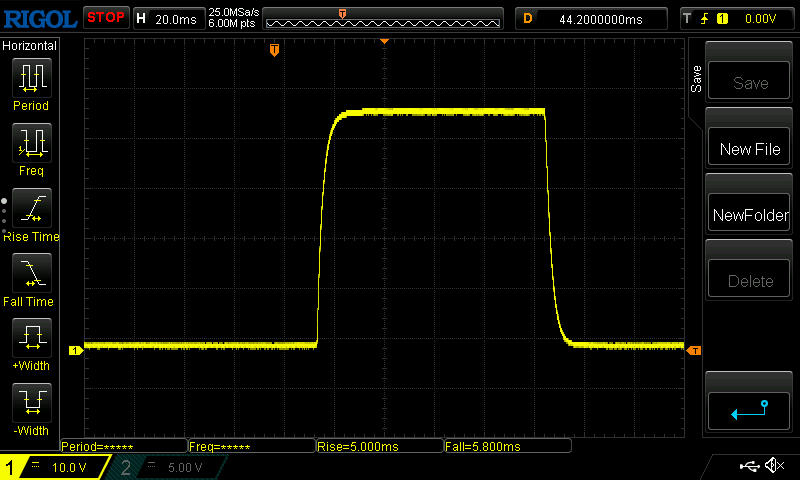 |
| ↘ 5.8 ms fall | ||
| The screen shows good response rates in our tests, but may be too slow for competitive gamers. In comparison, all tested devices range from 0.1 (minimum) to 240 (maximum) ms. » 29 % of all devices are better. This means that the measured response time is better than the average of all tested devices (19.8 ms). | ||
| ↔ Response Time 50% Grey to 80% Grey | ||
| 16.4 ms ... rise ↗ and fall ↘ combined | ↗ 7.4 ms rise | 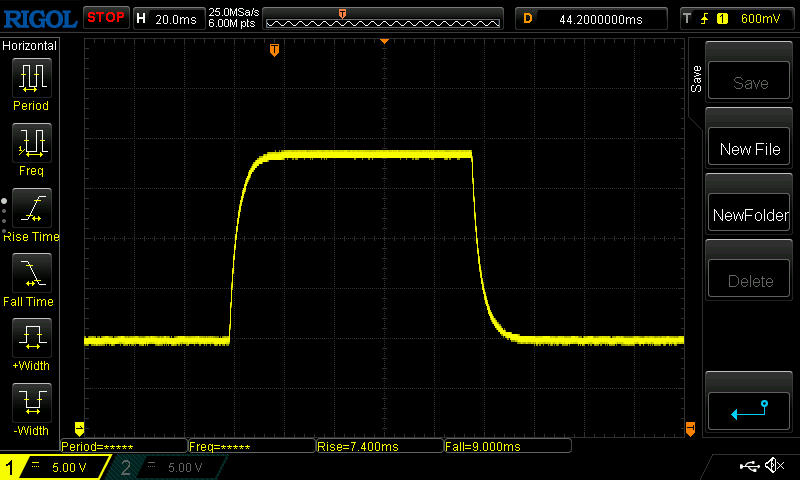 |
| ↘ 9 ms fall | ||
| The screen shows good response rates in our tests, but may be too slow for competitive gamers. In comparison, all tested devices range from 0.165 (minimum) to 636 (maximum) ms. » 31 % of all devices are better. This means that the measured response time is better than the average of all tested devices (30.9 ms). | ||
Screen Flickering / PWM (Pulse-Width Modulation)
| Screen flickering / PWM not detected | 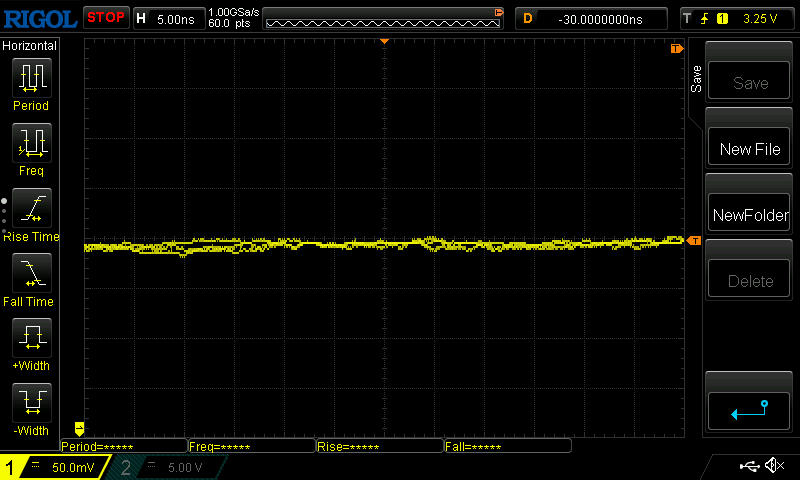 | ||
In comparison: 52 % of all tested devices do not use PWM to dim the display. If PWM was detected, an average of 7741 (minimum: 5 - maximum: 343500) Hz was measured. | |||
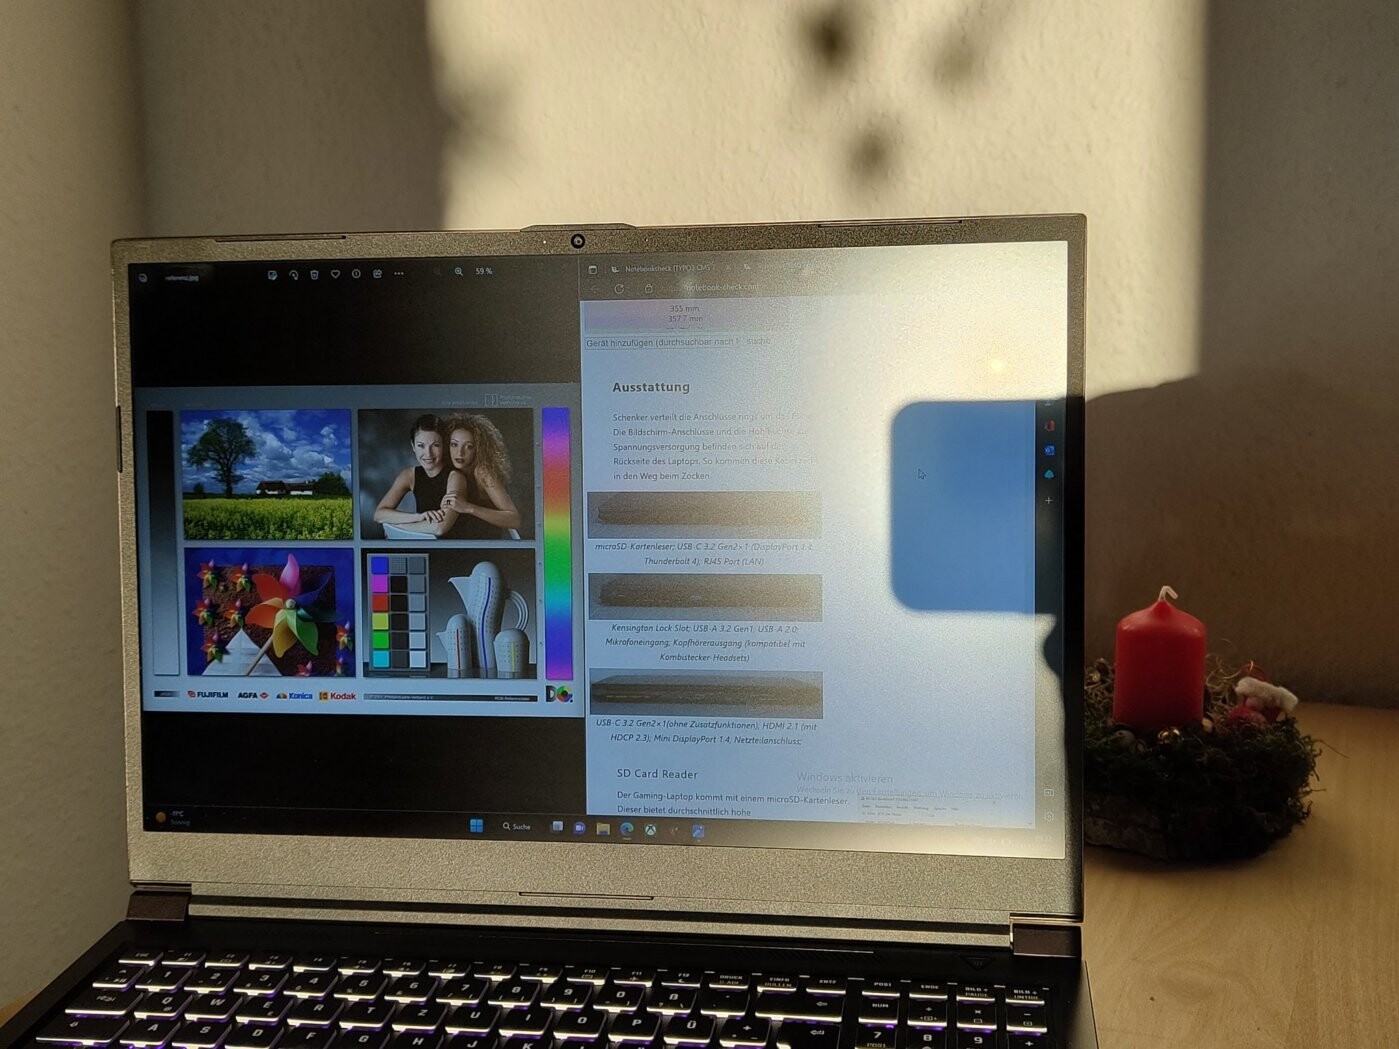
无闪烁的IPS面板在户外使用以及从不同角度观看时都给人留下了良好印象。只有当阳光以不利的角度照射在哑光显示器上时,我们才遇到了可读性方面的困难。

性能 - 略高于平均水平
与所有Schenker笔记本电脑一样,XMG Focus 16也是高度可定制的。因此,可以在XMG Focus 16中选择内存、各种硬盘和其他选项。配置器中选择。目前还不能选择不同的CPU和GPU。所有XMG Focus 16设备都配备了一个英特尔酷睿i7-12700H和一个NvidiaGeForce RTX 3060.此外,我们的评测设备配备了2×16GB DDR4内存和1TB三星NVMe SSD。
所有这些都意味着我们有一台笔记本电脑,应该能够处理大多数现代游戏。然而,RTX 3060并不总是能够在最高图形设置和设备的原始分辨率下达到60fps以上。
性能控制和测试条件
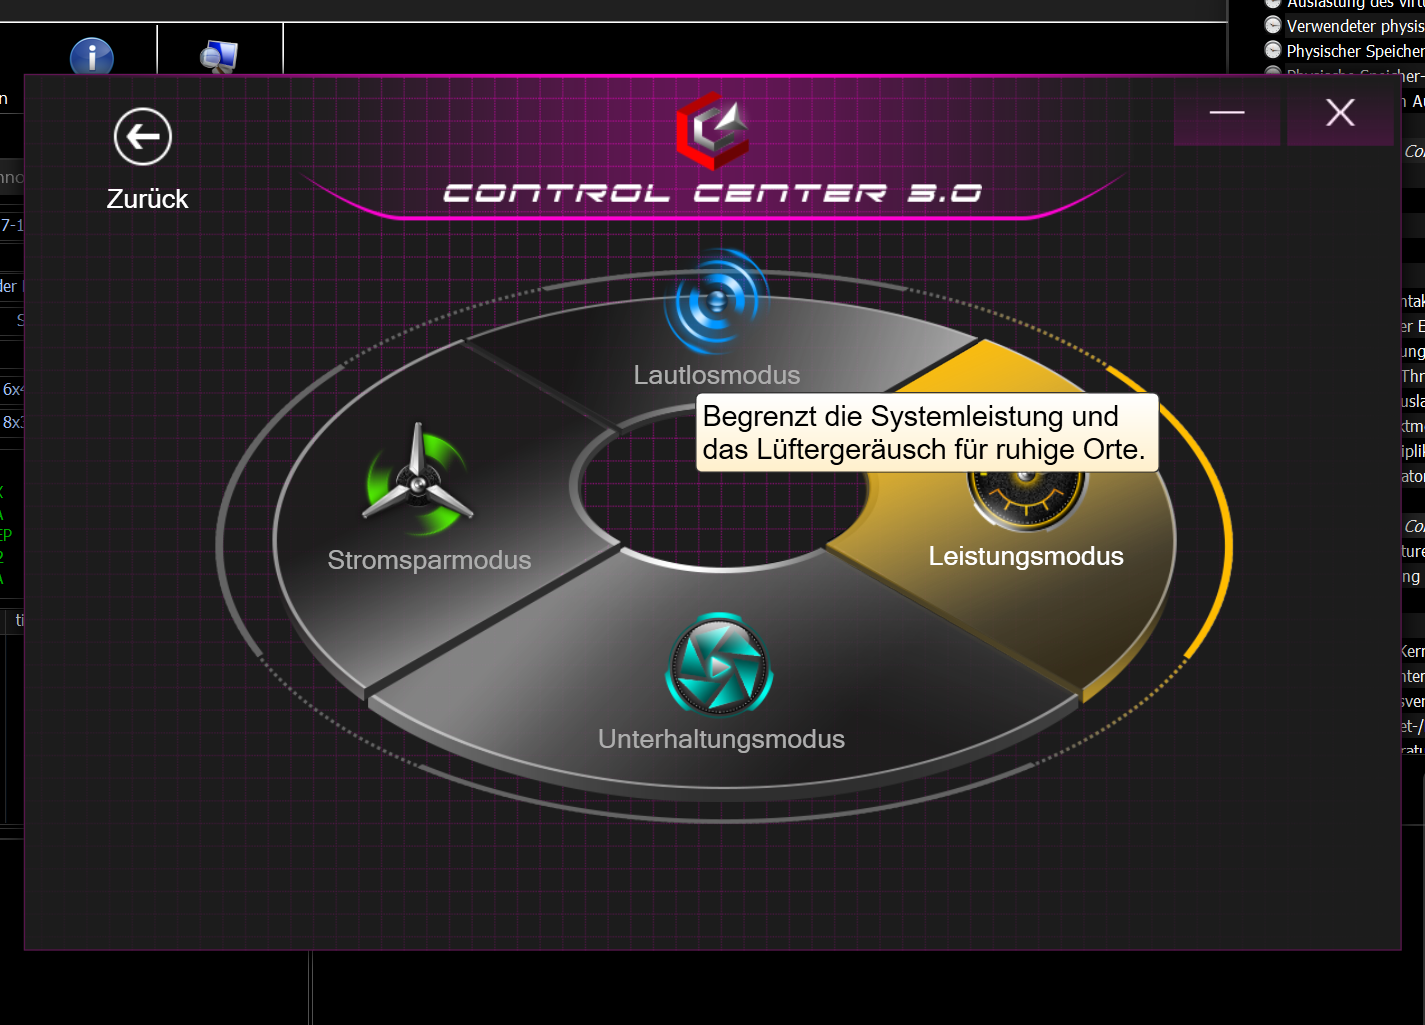
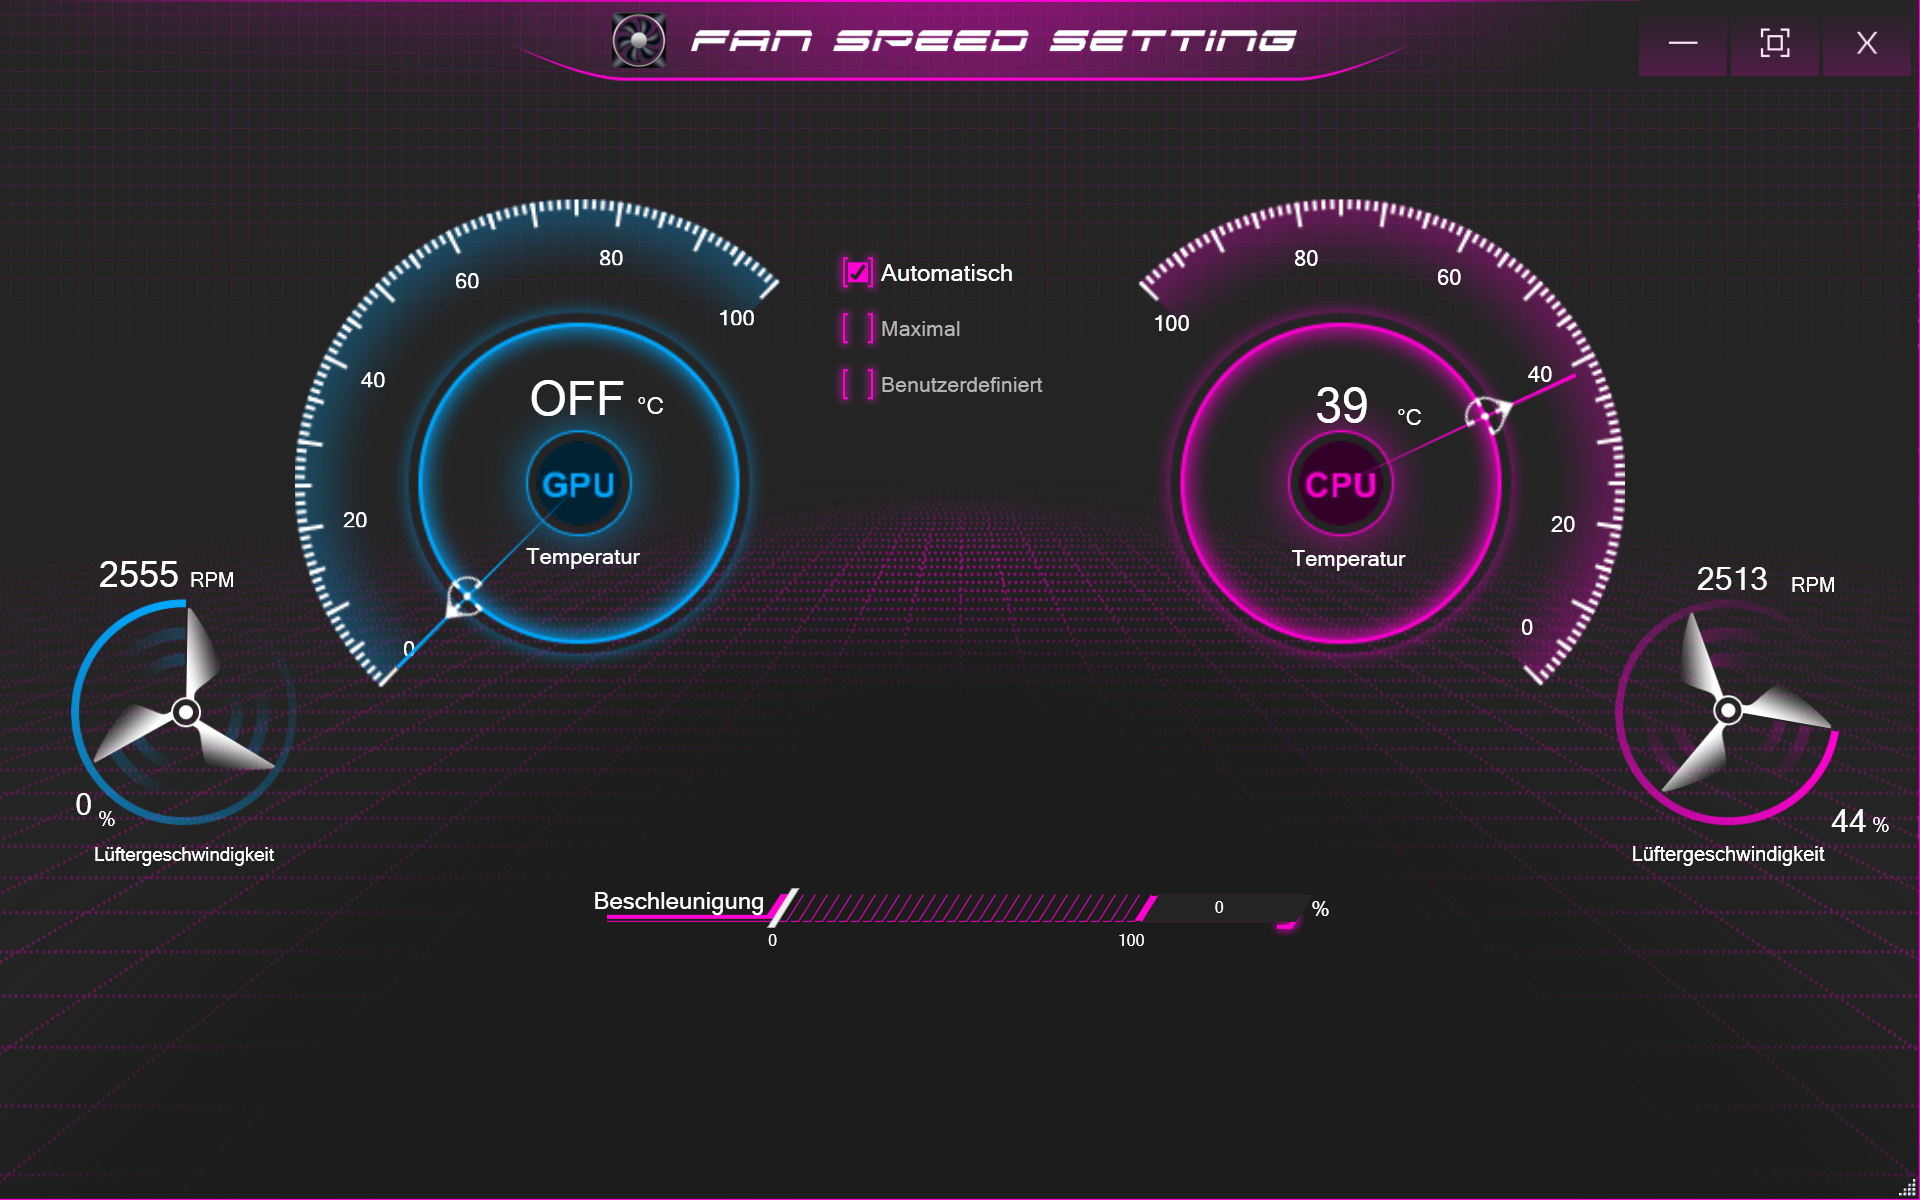
目前Schenker笔记本电脑的性能水平是通过控制中心3.0设置的。在这里你可以找到性能的四个选择:从低声模式到性能模式。风扇速度、性能限制和目标温度都在这里指定。对于喜欢掌握这些设置的人来说,控制中心还提供各种选项来调整和监测风扇速度。
这在很大程度上影响了笔记本电脑的性能。在性能模式下,CPU和GPU可获得140瓦的功率。在测试中,我们观察到大约25瓦的动态提升。单独的处理器可以在65瓦的条件下工作。在低声模式或节能模式下运行时,英特尔酷睿i7和英伟达RTX 3060的综合能耗徘徊在45瓦左右。由于各种风扇设置选项,在节能模式下,硬件的温度上升速度要慢得多。同样,在电池模式下,我们测得的综合能耗约为25瓦。
日志分析
处理器
的英特尔酷睿i7-12700H属于英特尔桤木湖一代的最强大的处理器。在Schenker XMG Focus 16中,该处理器表现相对较好,但没有达到最佳水平。 长期以来,由于Cinbench循环中的性能随着时间的推移下降了100多分,该笔记本电脑无法承受被推动。
此外,CPU得分显示,与竞争对手相比,该游戏笔记本的i7位于中间位置。然而,它的性能高于英特尔酷睿i7-12700H的平均性能。英特尔酷睿i7-12700H.然而,12700H的最佳性能是在 联想Legion 5 Pro.在我们的数据库中,没有任何一台笔记本电脑的i7性能比在Legion 。 我们在申克笔记本电脑中确定的PL2的功率相对较高,为105瓦,但PL1的功率只有65瓦。
Cinebench R15 Multi sustained load
Cinebench R23: Multi Core | Single Core
Cinebench R20: CPU (Multi Core) | CPU (Single Core)
Cinebench R15: CPU Multi 64Bit | CPU Single 64Bit
Blender: v2.79 BMW27 CPU
7-Zip 18.03: 7z b 4 | 7z b 4 -mmt1
Geekbench 5.5: Multi-Core | Single-Core
HWBOT x265 Benchmark v2.2: 4k Preset
LibreOffice : 20 Documents To PDF
R Benchmark 2.5: Overall mean
| CPU Performance rating | |
| Average of class Gaming | |
| Lenovo Legion 5 Pro 16IAH7H | |
| Asus ZenBook Pro 16X OLED UX7602ZM-ME115W | |
| Lenovo ThinkPad X1 Extreme G5-21DE003RGE | |
| Lenovo Legion Slim 7-16IAH 82TF004YGE | |
| Schenker XMG Focus 16 (i7-12700H, RTX 3060) | |
| Dell G16 7620 | |
| Average Intel Core i7-12700H | |
| Asus ROG Flow X16 GV601RW-M5082W | |
| Cinebench R23 / Multi Core | |
| Average of class Gaming (10488 - 42661, n=104, last 2 years) | |
| Lenovo Legion 5 Pro 16IAH7H | |
| Lenovo Legion Slim 7-16IAH 82TF004YGE | |
| Lenovo ThinkPad X1 Extreme G5-21DE003RGE | |
| Schenker XMG Focus 16 (i7-12700H, RTX 3060) | |
| Dell G16 7620 | |
| Asus ZenBook Pro 16X OLED UX7602ZM-ME115W | |
| Average Intel Core i7-12700H (4032 - 19330, n=64) | |
| Asus ROG Flow X16 GV601RW-M5082W | |
| Cinebench R23 / Single Core | |
| Average of class Gaming (1601 - 2415, n=104, last 2 years) | |
| Lenovo ThinkPad X1 Extreme G5-21DE003RGE | |
| Schenker XMG Focus 16 (i7-12700H, RTX 3060) | |
| Average Intel Core i7-12700H (778 - 1826, n=63) | |
| Lenovo Legion Slim 7-16IAH 82TF004YGE | |
| Lenovo Legion 5 Pro 16IAH7H | |
| Dell G16 7620 | |
| Asus ZenBook Pro 16X OLED UX7602ZM-ME115W | |
| Asus ROG Flow X16 GV601RW-M5082W | |
| Cinebench R20 / CPU (Multi Core) | |
| Average of class Gaming (4029 - 16433, n=103, last 2 years) | |
| Lenovo Legion 5 Pro 16IAH7H | |
| Lenovo ThinkPad X1 Extreme G5-21DE003RGE | |
| Lenovo Legion Slim 7-16IAH 82TF004YGE | |
| Dell G16 7620 | |
| Schenker XMG Focus 16 (i7-12700H, RTX 3060) | |
| Asus ZenBook Pro 16X OLED UX7602ZM-ME115W | |
| Average Intel Core i7-12700H (1576 - 7407, n=64) | |
| Asus ROG Flow X16 GV601RW-M5082W | |
| Cinebench R20 / CPU (Single Core) | |
| Average of class Gaming (622 - 913, n=103, last 2 years) | |
| Lenovo ThinkPad X1 Extreme G5-21DE003RGE | |
| Schenker XMG Focus 16 (i7-12700H, RTX 3060) | |
| Asus ZenBook Pro 16X OLED UX7602ZM-ME115W | |
| Average Intel Core i7-12700H (300 - 704, n=64) | |
| Lenovo Legion Slim 7-16IAH 82TF004YGE | |
| Lenovo Legion 5 Pro 16IAH7H | |
| Dell G16 7620 | |
| Asus ROG Flow X16 GV601RW-M5082W | |
| Cinebench R15 / CPU Multi 64Bit | |
| Average of class Gaming (1578 - 6330, n=102, last 2 years) | |
| Lenovo Legion 5 Pro 16IAH7H | |
| Lenovo Legion Slim 7-16IAH 82TF004YGE | |
| Lenovo ThinkPad X1 Extreme G5-21DE003RGE | |
| Schenker XMG Focus 16 (i7-12700H, RTX 3060) | |
| Dell G16 7620 | |
| Asus ZenBook Pro 16X OLED UX7602ZM-ME115W | |
| Average Intel Core i7-12700H (1379 - 2916, n=70) | |
| Asus ROG Flow X16 GV601RW-M5082W | |
| Cinebench R15 / CPU Single 64Bit | |
| Average of class Gaming (188.8 - 350, n=103, last 2 years) | |
| Asus ZenBook Pro 16X OLED UX7602ZM-ME115W | |
| Asus ZenBook Pro 16X OLED UX7602ZM-ME115W | |
| Lenovo ThinkPad X1 Extreme G5-21DE003RGE | |
| Schenker XMG Focus 16 (i7-12700H, RTX 3060) | |
| Lenovo Legion Slim 7-16IAH 82TF004YGE | |
| Average Intel Core i7-12700H (113 - 263, n=65) | |
| Lenovo Legion 5 Pro 16IAH7H | |
| Dell G16 7620 | |
| Asus ROG Flow X16 GV601RW-M5082W | |
| Blender / v2.79 BMW27 CPU | |
| Average Intel Core i7-12700H (168 - 732, n=63) | |
| Asus ROG Flow X16 GV601RW-M5082W | |
| Schenker XMG Focus 16 (i7-12700H, RTX 3060) | |
| Lenovo ThinkPad X1 Extreme G5-21DE003RGE | |
| Asus ZenBook Pro 16X OLED UX7602ZM-ME115W | |
| Dell G16 7620 | |
| Lenovo Legion Slim 7-16IAH 82TF004YGE | |
| Lenovo Legion 5 Pro 16IAH7H | |
| Average of class Gaming (79 - 330, n=101, last 2 years) | |
| 7-Zip 18.03 / 7z b 4 | |
| Average of class Gaming (33491 - 148086, n=102, last 2 years) | |
| Asus ZenBook Pro 16X OLED UX7602ZM-ME115W | |
| Lenovo Legion 5 Pro 16IAH7H | |
| Lenovo ThinkPad X1 Extreme G5-21DE003RGE | |
| Lenovo Legion Slim 7-16IAH 82TF004YGE | |
| Dell G16 7620 | |
| Schenker XMG Focus 16 (i7-12700H, RTX 3060) | |
| Asus ROG Flow X16 GV601RW-M5082W | |
| Average Intel Core i7-12700H (22844 - 73067, n=63) | |
| 7-Zip 18.03 / 7z b 4 -mmt1 | |
| Average of class Gaming (4824 - 7436, n=102, last 2 years) | |
| Lenovo ThinkPad X1 Extreme G5-21DE003RGE | |
| Asus ZenBook Pro 16X OLED UX7602ZM-ME115W | |
| Schenker XMG Focus 16 (i7-12700H, RTX 3060) | |
| Asus ROG Flow X16 GV601RW-M5082W | |
| Average Intel Core i7-12700H (2743 - 5972, n=63) | |
| Lenovo Legion 5 Pro 16IAH7H | |
| Lenovo Legion Slim 7-16IAH 82TF004YGE | |
| Dell G16 7620 | |
| Geekbench 5.5 / Multi-Core | |
| Average of class Gaming (6460 - 28263, n=102, last 2 years) | |
| Asus ZenBook Pro 16X OLED UX7602ZM-ME115W | |
| Lenovo Legion 5 Pro 16IAH7H | |
| Lenovo Legion Slim 7-16IAH 82TF004YGE | |
| Schenker XMG Focus 16 (i7-12700H, RTX 3060) | |
| Dell G16 7620 | |
| Lenovo ThinkPad X1 Extreme G5-21DE003RGE | |
| Average Intel Core i7-12700H (5144 - 13745, n=64) | |
| Asus ROG Flow X16 GV601RW-M5082W | |
| Geekbench 5.5 / Single-Core | |
| Average of class Gaming (1403 - 2474, n=102, last 2 years) | |
| Asus ZenBook Pro 16X OLED UX7602ZM-ME115W | |
| Lenovo ThinkPad X1 Extreme G5-21DE003RGE | |
| Schenker XMG Focus 16 (i7-12700H, RTX 3060) | |
| Average Intel Core i7-12700H (803 - 1851, n=64) | |
| Lenovo Legion Slim 7-16IAH 82TF004YGE | |
| Lenovo Legion 5 Pro 16IAH7H | |
| Dell G16 7620 | |
| Asus ROG Flow X16 GV601RW-M5082W | |
| HWBOT x265 Benchmark v2.2 / 4k Preset | |
| Average of class Gaming (11.5 - 44.4, n=102, last 2 years) | |
| Lenovo Legion 5 Pro 16IAH7H | |
| Asus ZenBook Pro 16X OLED UX7602ZM-ME115W | |
| Dell G16 7620 | |
| Lenovo Legion Slim 7-16IAH 82TF004YGE | |
| Schenker XMG Focus 16 (i7-12700H, RTX 3060) | |
| Lenovo ThinkPad X1 Extreme G5-21DE003RGE | |
| Average Intel Core i7-12700H (4.67 - 21.8, n=64) | |
| Asus ROG Flow X16 GV601RW-M5082W | |
| LibreOffice / 20 Documents To PDF | |
| Asus ROG Flow X16 GV601RW-M5082W | |
| Dell G16 7620 | |
| Average of class Gaming (33.2 - 88.8, n=102, last 2 years) | |
| Average Intel Core i7-12700H (34.2 - 95.3, n=63) | |
| Schenker XMG Focus 16 (i7-12700H, RTX 3060) | |
| Lenovo ThinkPad X1 Extreme G5-21DE003RGE | |
| Lenovo Legion 5 Pro 16IAH7H | |
| Lenovo Legion Slim 7-16IAH 82TF004YGE | |
| Asus ZenBook Pro 16X OLED UX7602ZM-ME115W | |
| R Benchmark 2.5 / Overall mean | |
| Dell G16 7620 | |
| Asus ROG Flow X16 GV601RW-M5082W | |
| Lenovo Legion 5 Pro 16IAH7H | |
| Average Intel Core i7-12700H (0.4441 - 1.052, n=63) | |
| Lenovo Legion Slim 7-16IAH 82TF004YGE | |
| Schenker XMG Focus 16 (i7-12700H, RTX 3060) | |
| Lenovo ThinkPad X1 Extreme G5-21DE003RGE | |
| Asus ZenBook Pro 16X OLED UX7602ZM-ME115W | |
| Average of class Gaming (0.3439 - 0.59, n=102, last 2 years) | |
* ... smaller is better
AIDA64: FP32 Ray-Trace | FPU Julia | CPU SHA3 | CPU Queen | FPU SinJulia | FPU Mandel | CPU AES | CPU ZLib | FP64 Ray-Trace | CPU PhotoWorxx
| Performance rating | |
| Average of class Gaming | |
| Asus ROG Flow X16 GV601RW-M5082W | |
| Lenovo Legion Slim 7-16IAH 82TF004YGE | |
| Asus ZenBook Pro 16X OLED UX7602ZM-ME115W | |
| Schenker XMG Focus 16 (i7-12700H, RTX 3060) | |
| Dell G16 7620 | |
| Lenovo ThinkPad X1 Extreme G5-21DE003RGE | |
| Lenovo Legion 5 Pro 16IAH7H | |
| Average Intel Core i7-12700H | |
| AIDA64 / FP32 Ray-Trace | |
| Average of class Gaming (10227 - 85542, n=102, last 2 years) | |
| Lenovo Legion Slim 7-16IAH 82TF004YGE | |
| Lenovo ThinkPad X1 Extreme G5-21DE003RGE | |
| Asus ROG Flow X16 GV601RW-M5082W | |
| Schenker XMG Focus 16 (i7-12700H, RTX 3060) | |
| Dell G16 7620 | |
| Lenovo Legion 5 Pro 16IAH7H | |
| Lenovo Legion 5 Pro 16IAH7H | |
| Asus ZenBook Pro 16X OLED UX7602ZM-ME115W | |
| Average Intel Core i7-12700H (2585 - 17957, n=64) | |
| AIDA64 / CPU Queen | |
| Average of class Gaming (49785 - 173351, n=86, last 2 years) | |
| Asus ZenBook Pro 16X OLED UX7602ZM-ME115W | |
| Asus ROG Flow X16 GV601RW-M5082W | |
| Lenovo Legion Slim 7-16IAH 82TF004YGE | |
| Schenker XMG Focus 16 (i7-12700H, RTX 3060) | |
| Lenovo ThinkPad X1 Extreme G5-21DE003RGE | |
| Dell G16 7620 | |
| Lenovo Legion 5 Pro 16IAH7H | |
| Average Intel Core i7-12700H (57923 - 103202, n=63) | |
| AIDA64 / FPU SinJulia | |
| Average of class Gaming (4424 - 33636, n=102, last 2 years) | |
| Asus ROG Flow X16 GV601RW-M5082W | |
| Lenovo Legion 5 Pro 16IAH7H | |
| Lenovo Legion 5 Pro 16IAH7H | |
| Dell G16 7620 | |
| Lenovo ThinkPad X1 Extreme G5-21DE003RGE | |
| Lenovo Legion Slim 7-16IAH 82TF004YGE | |
| Schenker XMG Focus 16 (i7-12700H, RTX 3060) | |
| Asus ZenBook Pro 16X OLED UX7602ZM-ME115W | |
| Average Intel Core i7-12700H (3249 - 9939, n=64) | |
| AIDA64 / FP64 Ray-Trace | |
| Average of class Gaming (5509 - 45446, n=102, last 2 years) | |
| Asus ROG Flow X16 GV601RW-M5082W | |
| Lenovo ThinkPad X1 Extreme G5-21DE003RGE | |
| Lenovo Legion Slim 7-16IAH 82TF004YGE | |
| Schenker XMG Focus 16 (i7-12700H, RTX 3060) | |
| Asus ZenBook Pro 16X OLED UX7602ZM-ME115W | |
| Dell G16 7620 | |
| Lenovo Legion 5 Pro 16IAH7H | |
| Lenovo Legion 5 Pro 16IAH7H | |
| Average Intel Core i7-12700H (1437 - 9692, n=64) | |
| AIDA64 / CPU PhotoWorxx | |
| Asus ZenBook Pro 16X OLED UX7602ZM-ME115W | |
| Average of class Gaming (12271 - 89891, n=102, last 2 years) | |
| Lenovo Legion Slim 7-16IAH 82TF004YGE | |
| Dell G16 7620 | |
| Lenovo Legion 5 Pro 16IAH7H | |
| Lenovo Legion 5 Pro 16IAH7H | |
| Average Intel Core i7-12700H (12863 - 52207, n=64) | |
| Schenker XMG Focus 16 (i7-12700H, RTX 3060) | |
| Asus ROG Flow X16 GV601RW-M5082W | |
| Lenovo ThinkPad X1 Extreme G5-21DE003RGE | |
系统性能
虽然不能指责申克笔记本电脑在正常使用中的弱点,但与其他强大的游戏笔记本电脑的比较表明,更多的可能性。PCMark10和Crossmark基准测试的结果略低于平均水平。由于这两个基准测试程序在任何子测试中都没有将固态硬盘置于长期压力之下,稍慢的DDR4内存和相当低的处理器性能更可能是罪魁祸首。
CrossMark: Overall | Productivity | Creativity | Responsiveness
| PCMark 10 / Score | |
| Average of class Gaming (5828 - 12414, n=93, last 2 years) | |
| Lenovo Legion 5 Pro 16IAH7H | |
| Asus ZenBook Pro 16X OLED UX7602ZM-ME115W | |
| Lenovo Legion Slim 7-16IAH 82TF004YGE | |
| Lenovo ThinkPad X1 Extreme G5-21DE003RGE | |
| Average Intel Core i7-12700H, NVIDIA GeForce RTX 3060 Laptop GPU (5986 - 8156, n=12) | |
| Dell G16 7620 | |
| Schenker XMG Focus 16 (i7-12700H, RTX 3060) | |
| Asus ROG Flow X16 GV601RW-M5082W | |
| PCMark 10 / Essentials | |
| Lenovo Legion 5 Pro 16IAH7H | |
| Asus ZenBook Pro 16X OLED UX7602ZM-ME115W | |
| Lenovo Legion Slim 7-16IAH 82TF004YGE | |
| Average of class Gaming (8810 - 11935, n=97, last 2 years) | |
| Average Intel Core i7-12700H, NVIDIA GeForce RTX 3060 Laptop GPU (9289 - 12144, n=12) | |
| Lenovo ThinkPad X1 Extreme G5-21DE003RGE | |
| Dell G16 7620 | |
| Schenker XMG Focus 16 (i7-12700H, RTX 3060) | |
| Asus ROG Flow X16 GV601RW-M5082W | |
| PCMark 10 / Productivity | |
| Average of class Gaming (6845 - 25323, n=95, last 2 years) | |
| Asus ZenBook Pro 16X OLED UX7602ZM-ME115W | |
| Schenker XMG Focus 16 (i7-12700H, RTX 3060) | |
| Asus ROG Flow X16 GV601RW-M5082W | |
| Lenovo Legion Slim 7-16IAH 82TF004YGE | |
| Lenovo Legion 5 Pro 16IAH7H | |
| Lenovo ThinkPad X1 Extreme G5-21DE003RGE | |
| Average Intel Core i7-12700H, NVIDIA GeForce RTX 3060 Laptop GPU (6161 - 10362, n=12) | |
| Dell G16 7620 | |
| PCMark 10 / Digital Content Creation | |
| Average of class Gaming (7602 - 19954, n=95, last 2 years) | |
| Lenovo Legion 5 Pro 16IAH7H | |
| Dell G16 7620 | |
| Lenovo Legion Slim 7-16IAH 82TF004YGE | |
| Average Intel Core i7-12700H, NVIDIA GeForce RTX 3060 Laptop GPU (8950 - 12554, n=12) | |
| Lenovo ThinkPad X1 Extreme G5-21DE003RGE | |
| Asus ZenBook Pro 16X OLED UX7602ZM-ME115W | |
| Schenker XMG Focus 16 (i7-12700H, RTX 3060) | |
| Asus ROG Flow X16 GV601RW-M5082W | |
| CrossMark / Overall | |
| Average of class Gaming (1366 - 2409, n=94, last 2 years) | |
| Lenovo Legion Slim 7-16IAH 82TF004YGE | |
| Average Intel Core i7-12700H, NVIDIA GeForce RTX 3060 Laptop GPU (1649 - 2017, n=11) | |
| Asus ZenBook Pro 16X OLED UX7602ZM-ME115W | |
| Dell G16 7620 | |
| Lenovo Legion 5 Pro 16IAH7H | |
| Lenovo ThinkPad X1 Extreme G5-21DE003RGE | |
| Asus ROG Flow X16 GV601RW-M5082W | |
| Schenker XMG Focus 16 (i7-12700H, RTX 3060) | |
| CrossMark / Productivity | |
| Average of class Gaming (1386 - 2254, n=94, last 2 years) | |
| Lenovo Legion Slim 7-16IAH 82TF004YGE | |
| Average Intel Core i7-12700H, NVIDIA GeForce RTX 3060 Laptop GPU (1536 - 1958, n=11) | |
| Lenovo Legion 5 Pro 16IAH7H | |
| Dell G16 7620 | |
| Asus ZenBook Pro 16X OLED UX7602ZM-ME115W | |
| Lenovo ThinkPad X1 Extreme G5-21DE003RGE | |
| Asus ROG Flow X16 GV601RW-M5082W | |
| Schenker XMG Focus 16 (i7-12700H, RTX 3060) | |
| CrossMark / Creativity | |
| Average of class Gaming (1343 - 2786, n=94, last 2 years) | |
| Asus ZenBook Pro 16X OLED UX7602ZM-ME115W | |
| Lenovo Legion Slim 7-16IAH 82TF004YGE | |
| Average Intel Core i7-12700H, NVIDIA GeForce RTX 3060 Laptop GPU (1816 - 2084, n=11) | |
| Dell G16 7620 | |
| Lenovo ThinkPad X1 Extreme G5-21DE003RGE | |
| Lenovo Legion 5 Pro 16IAH7H | |
| Schenker XMG Focus 16 (i7-12700H, RTX 3060) | |
| Asus ROG Flow X16 GV601RW-M5082W | |
| CrossMark / Responsiveness | |
| Lenovo Legion Slim 7-16IAH 82TF004YGE | |
| Lenovo Legion 5 Pro 16IAH7H | |
| Average of class Gaming (1226 - 2334, n=94, last 2 years) | |
| Average Intel Core i7-12700H, NVIDIA GeForce RTX 3060 Laptop GPU (1210 - 2207, n=11) | |
| Dell G16 7620 | |
| Asus ZenBook Pro 16X OLED UX7602ZM-ME115W | |
| Lenovo ThinkPad X1 Extreme G5-21DE003RGE | |
| Asus ROG Flow X16 GV601RW-M5082W | |
| Schenker XMG Focus 16 (i7-12700H, RTX 3060) | |
| PCMark 10 Score | 7134 points | |
Help | ||
| AIDA64 / Memory Write | |
| Average of class Gaming (22297 - 135096, n=102, last 2 years) | |
| Asus ZenBook Pro 16X OLED UX7602ZM-ME115W | |
| Lenovo Legion 5 Pro 16IAH7H | |
| Lenovo Legion 5 Pro 16IAH7H | |
| Lenovo Legion Slim 7-16IAH 82TF004YGE | |
| Dell G16 7620 | |
| Asus ROG Flow X16 GV601RW-M5082W | |
| Average Intel Core i7-12700H (23679 - 88660, n=64) | |
| Schenker XMG Focus 16 (i7-12700H, RTX 3060) | |
| Lenovo ThinkPad X1 Extreme G5-21DE003RGE | |
| AIDA64 / Memory Latency | |
| Lenovo Legion 5 Pro 16IAH7H | |
| Lenovo Legion 5 Pro 16IAH7H | |
| Asus ZenBook Pro 16X OLED UX7602ZM-ME115W | |
| Average of class Gaming (75.3 - 165.4, n=102, last 2 years) | |
| Dell G16 7620 | |
| Lenovo Legion Slim 7-16IAH 82TF004YGE | |
| Asus ROG Flow X16 GV601RW-M5082W | |
| Schenker XMG Focus 16 (i7-12700H, RTX 3060) | |
| Lenovo ThinkPad X1 Extreme G5-21DE003RGE | |
| Average Intel Core i7-12700H (76.2 - 133.9, n=62) | |
* ... smaller is better
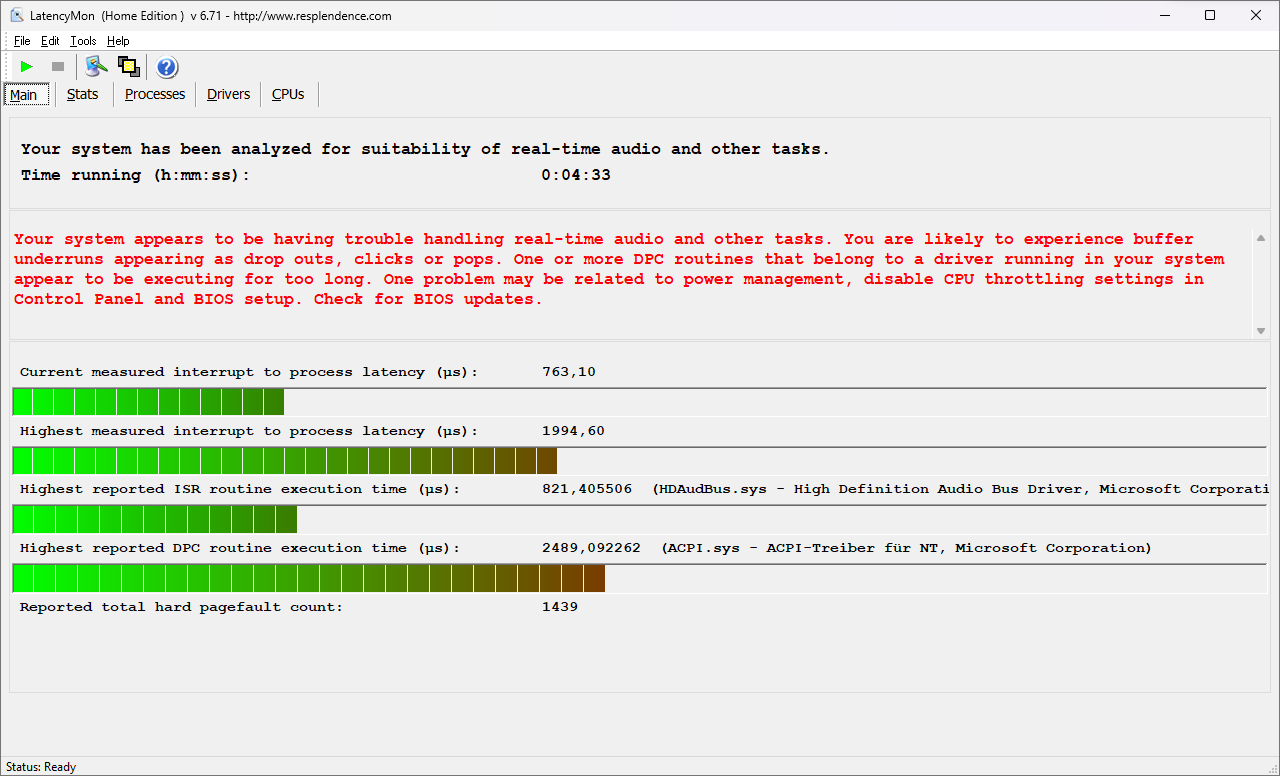
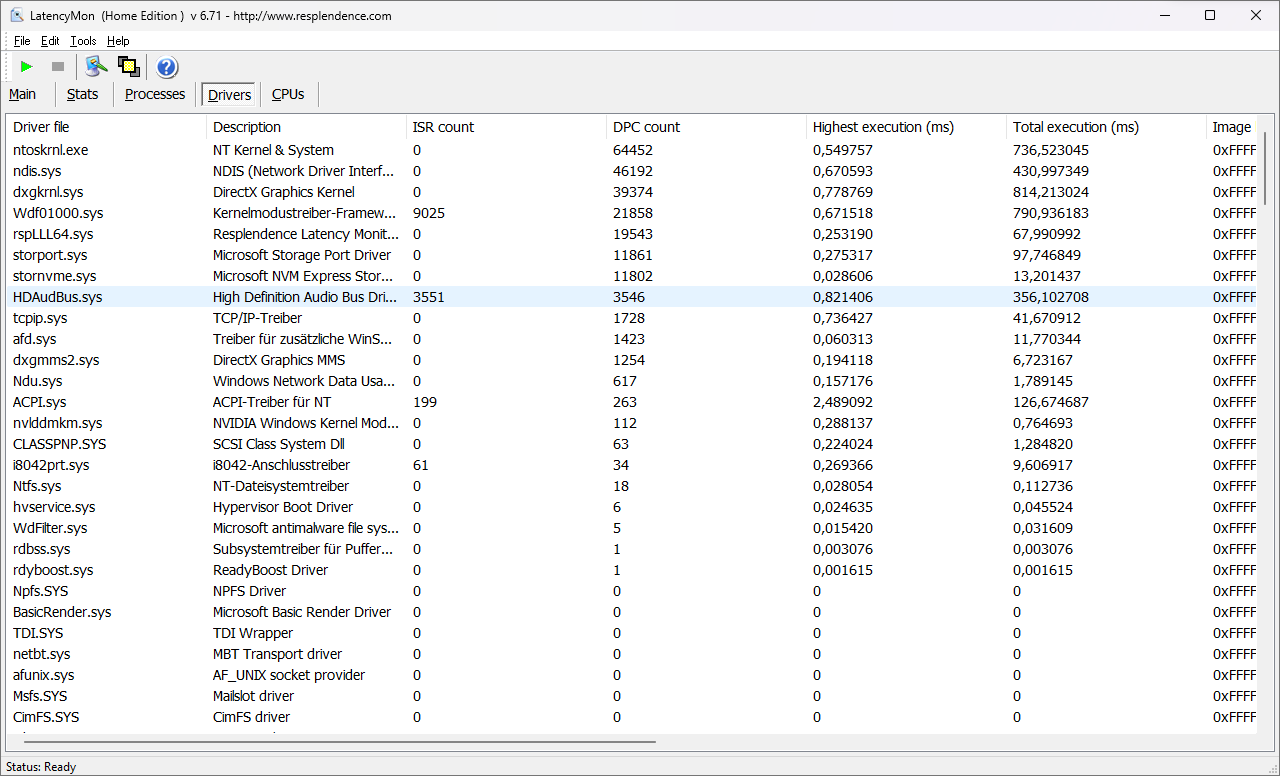
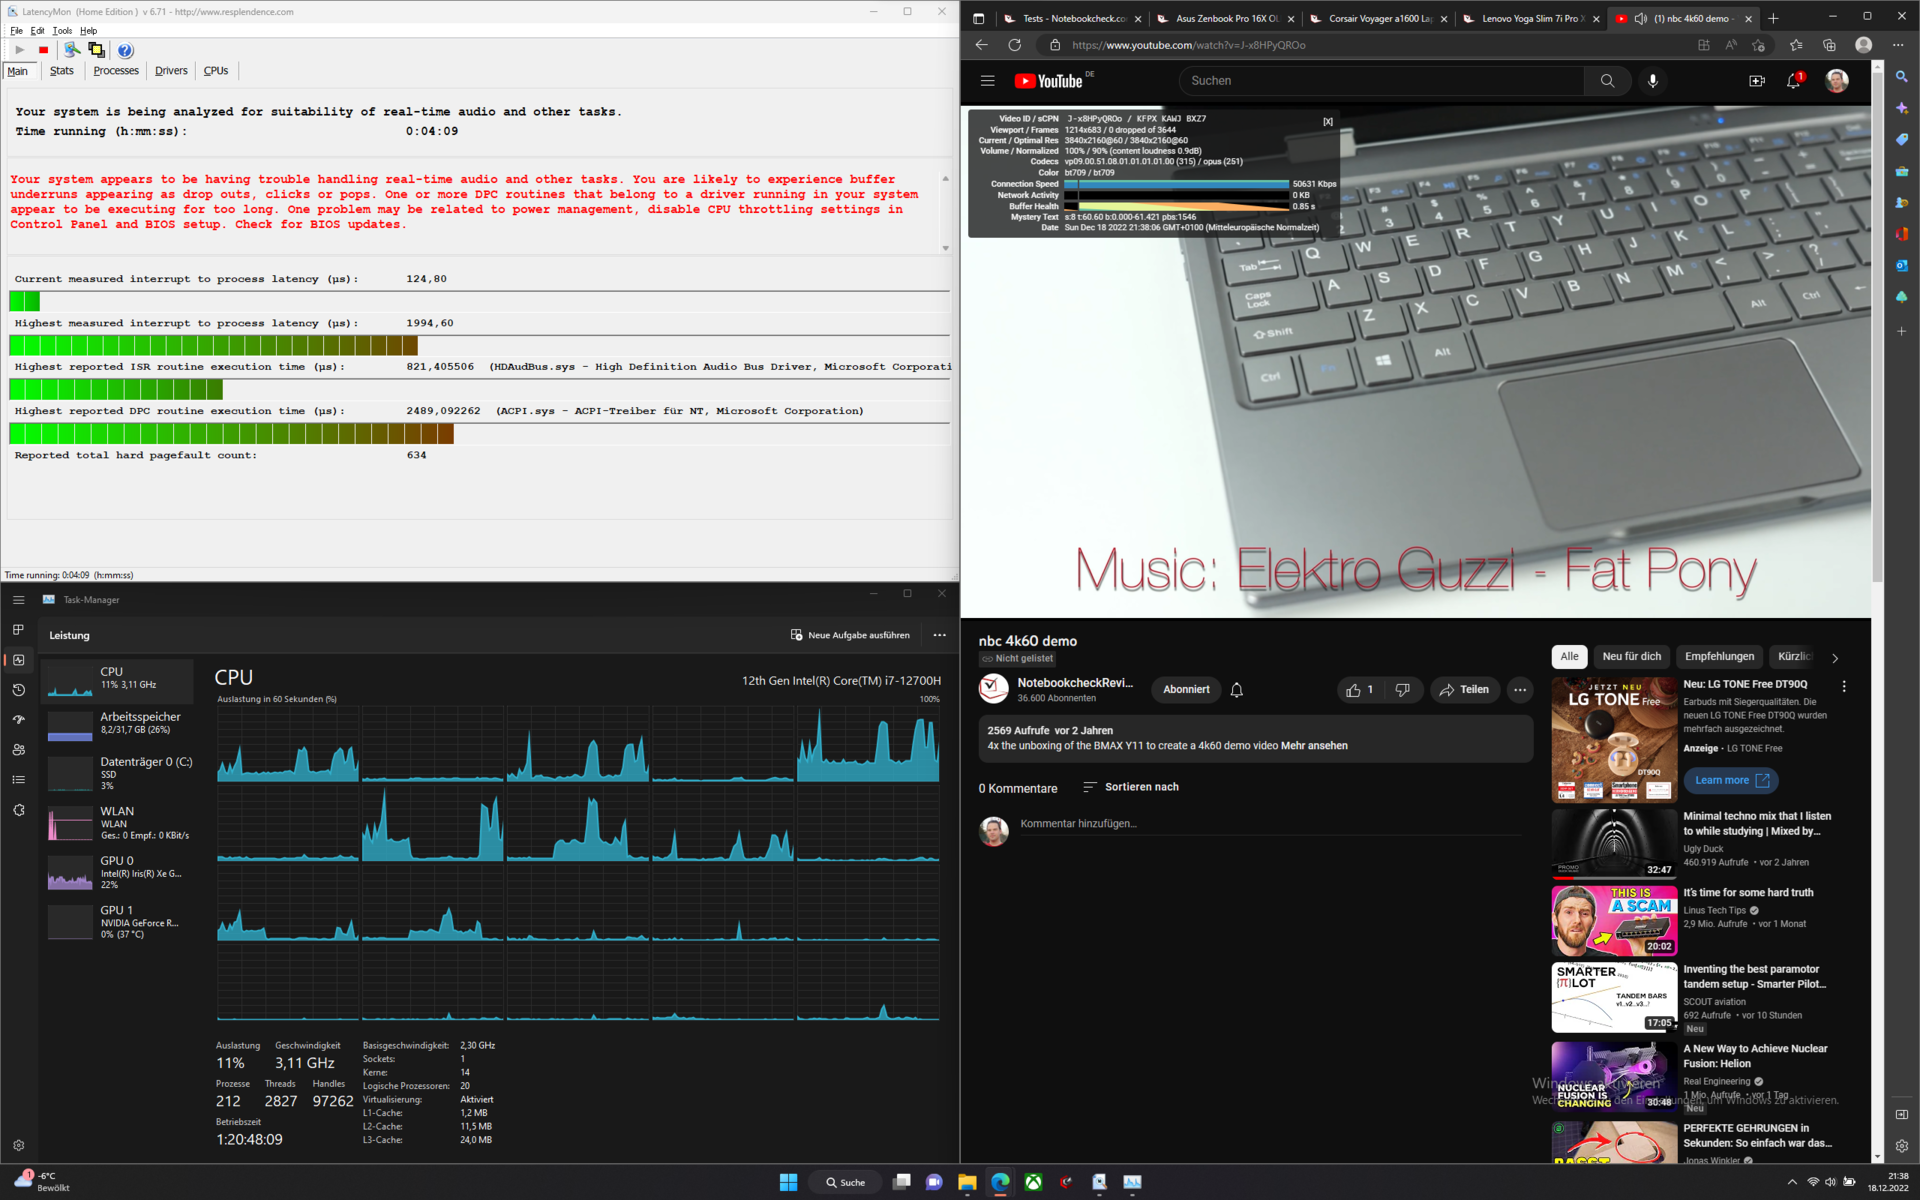
DPC延迟
XMG Focus 16在高DPC延迟方面并不孤单。在目前的驱动组合下,这台游戏笔记本记录的水平很高,因此不适合实时应用。在YouTube 4K 60Hz的测试中没有跳帧。
| DPC Latencies / LatencyMon - interrupt to process latency (max), Web, Youtube, Prime95 | |
| Schenker XMG Focus 16 (i7-12700H, RTX 3060) | |
| Asus ROG Flow X16 GV601RW-M5082W | |
| Lenovo ThinkPad X1 Extreme G5-21DE003RGE | |
| Dell G16 7620 | |
| Lenovo Legion 5 Pro 16IAH7H | |
| Lenovo Legion Slim 7-16IAH 82TF004YGE | |
| Asus ZenBook Pro 16X OLED UX7602ZM-ME115W | |
* ... smaller is better
大容量存储
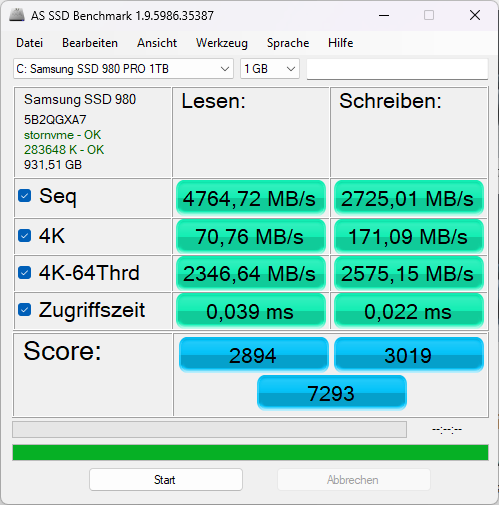
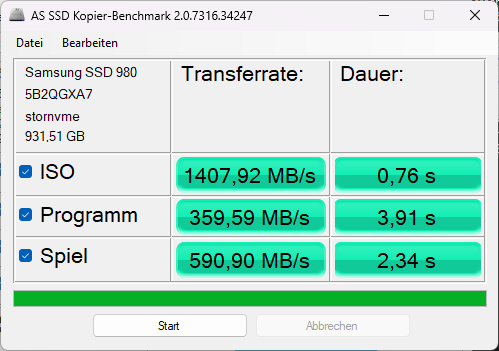
Schenker游戏笔记本拥有一个1TB的三星SSD 980 Pro。这种强大的SSD在我们的SSD和HDD的基准表中接近顶端。这台游戏笔记本的NVMe存储也是一个高性能的产品。然而,在DiskSpd循环中运行了几次后,NVMe SSD被明显地节流了。这种行为表明散热不佳。虽然许多其他制造商已经开始在固态硬盘的顶部或下方实施散热垫,以散去运行时的热量,但这是申克的笔记本电脑无法做到的。

* ... smaller is better
Continuous performance read: DiskSpd Read Loop, Queue Depth 8
图形卡
一个NvidiaGeForce RTX 3060在XMG Focus 16中发挥其作用。根据质量要求,该显卡适用于全高清或QHD游戏。Schenker笔记本电脑中的3060应该能够在屏幕的全分辨率下以超过60fps的速度运行当前的大多数游戏。只有少数游戏需要更多动力。
在相当不令人鼓舞的系统性能结果之后,Schenker设备的显卡以出色的性能让我们感到惊讶。在大多数基准测试中,Schenker的3060取得了高分。在3DMarkCloud Gate 基准测试中,非常高的分数表明对显存的快速访问。
| 3DMark 11 Performance | 26508 points | |
| 3DMark Ice Storm Standard Score | 147494 points | |
| 3DMark Cloud Gate Standard Score | 57261 points | |
| 3DMark Fire Strike Score | 19951 points | |
| 3DMark Time Spy Score | 8675 points | |
Help | ||
* ... smaller is better
游戏性能
NvidiaGeForce RTX 3060应该足够强大,可以使用显示器的QHD分辨率在最高设置下以60fps的速度玩目前大多数游戏。然而,这款显示器提供的刷新率为165Hz。基准测试结果显示,在中等质量设置下可以实现全高清165fps。
与其他游戏笔记本电脑相比,XMG Focus 16取得了适度的好成绩。然而,在联想Legion 5 Pro和戴尔G16要更强大一些。
Witcher 3 帧率显示了游戏的典型日/夜行为。在游戏过程中,帧率会发生变化,取决于增加或减少的拉动距离。
Witcher 3 fps-diagram
| low | med. | high | ultra | QHD | 4K | |
|---|---|---|---|---|---|---|
| GTA V (2015) | 183.8 | 179.1 | 167.9 | 94.7 | 80.9 | |
| The Witcher 3 (2015) | 80 | |||||
| Dota 2 Reborn (2015) | 165.8 | 151.7 | 143.4 | 135.7 | 103.4 | |
| Final Fantasy XV Benchmark (2018) | 111.4 | 84.5 | 64.3 | 37.8 | ||
| X-Plane 11.11 (2018) | 137.6 | 123.9 | 99.5 | 89 | ||
| Strange Brigade (2018) | 340 | 210 | 171.2 | 150.1 | ||
| F1 22 (2022) | 168 | 166.1 | 141.8 | 53.5 | 34.8 |
排放--由于控制中心的存在,风扇可以被调整。
噪声排放
直接比较,负载下的54 dB(A)并不完全安静。如果笔记本电脑真的需要像鼠标一样安静,控制中心3.0提供了一个静音模式。
Noise level
| Idle |
| 23 / 23 / 32.07 dB(A) |
| Load |
| 53.7 / 54.58 dB(A) |
 | ||
30 dB silent 40 dB(A) audible 50 dB(A) loud |
||
min: | ||
| Schenker XMG Focus 16 (i7-12700H, RTX 3060) GeForce RTX 3060 Laptop GPU, i7-12700H, Samsung SSD 980 Pro 1TB MZ-V8P1T0BW | Asus ZenBook Pro 16X OLED UX7602ZM-ME115W GeForce RTX 3060 Laptop GPU, i9-12900H, Samsung PM9A1 MZVL21T0HCLR | Dell G16 7620 GeForce RTX 3060 Laptop GPU, i7-12700H, WDC PC SN810 512GB | Asus ROG Flow X16 GV601RW-M5082W GeForce RTX 3070 Ti Laptop GPU, R9 6900HS, Micron 3400 1TB MTFDKBA1T0TFH | Lenovo ThinkPad X1 Extreme G5-21DE003RGE GeForce RTX 3060 Laptop GPU, i7-12700H, Micron 3400 1TB MTFDKBA1T0TFH | Lenovo Legion Slim 7-16IAH 82TF004YGE GeForce RTX 3060 Laptop GPU, i7-12700H, SK Hynix HFS001TEJ9X115N | Lenovo Legion 5 Pro 16IAH7H GeForce RTX 3060 Laptop GPU, i7-12700H, 2x Samsung PM9A1 MZVL21T0HCLR (RAID 0) | |
|---|---|---|---|---|---|---|---|
| Noise | -2% | 4% | -2% | 11% | 8% | -9% | |
| off / environment * (dB) | 23 | 26 -13% | 23.2 -1% | 25.5 -11% | 23.2 -1% | 23 -0% | 24.6 -7% |
| Idle Minimum * (dB) | 23 | 26 -13% | 28.3 -23% | 25.5 -11% | 23.2 -1% | 23 -0% | 28.7 -25% |
| Idle Average * (dB) | 23 | 26 -13% | 28.8 -25% | 25.5 -11% | 23.2 -1% | 23 -0% | 32 -39% |
| Idle Maximum * (dB) | 32.07 | 26 19% | 28.9 10% | 27.4 15% | 23.2 28% | 23 28% | 32 -0% |
| Load Average * (dB) | 53.7 | 48 11% | 32.4 40% | 49.9 7% | 45.5 15% | 43.7 19% | 45.2 16% |
| Witcher 3 ultra * (dB) | 54.58 | 48.3 12% | 45.5 17% | 51.7 5% | |||
| Load Maximum * (dB) | 54.58 | 54.6 -0% | 48.1 12% | 55 -1% | 45.5 17% | 52 5% | 54.4 -0% |
* ... smaller is better
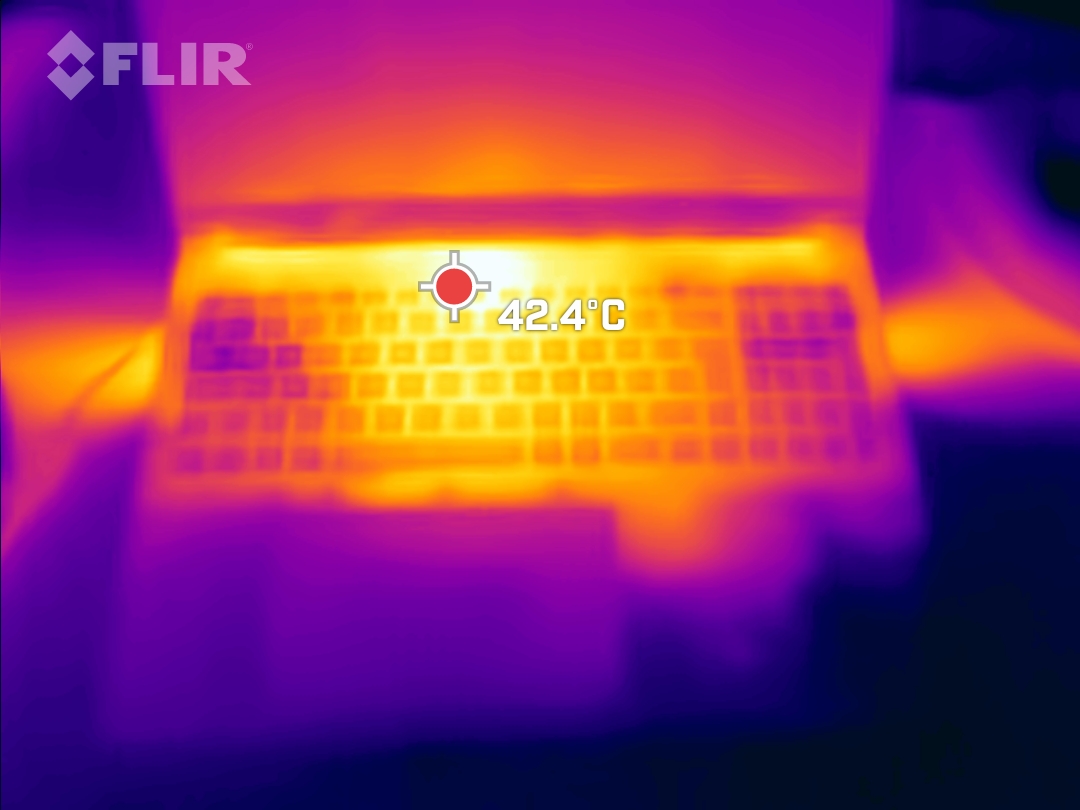
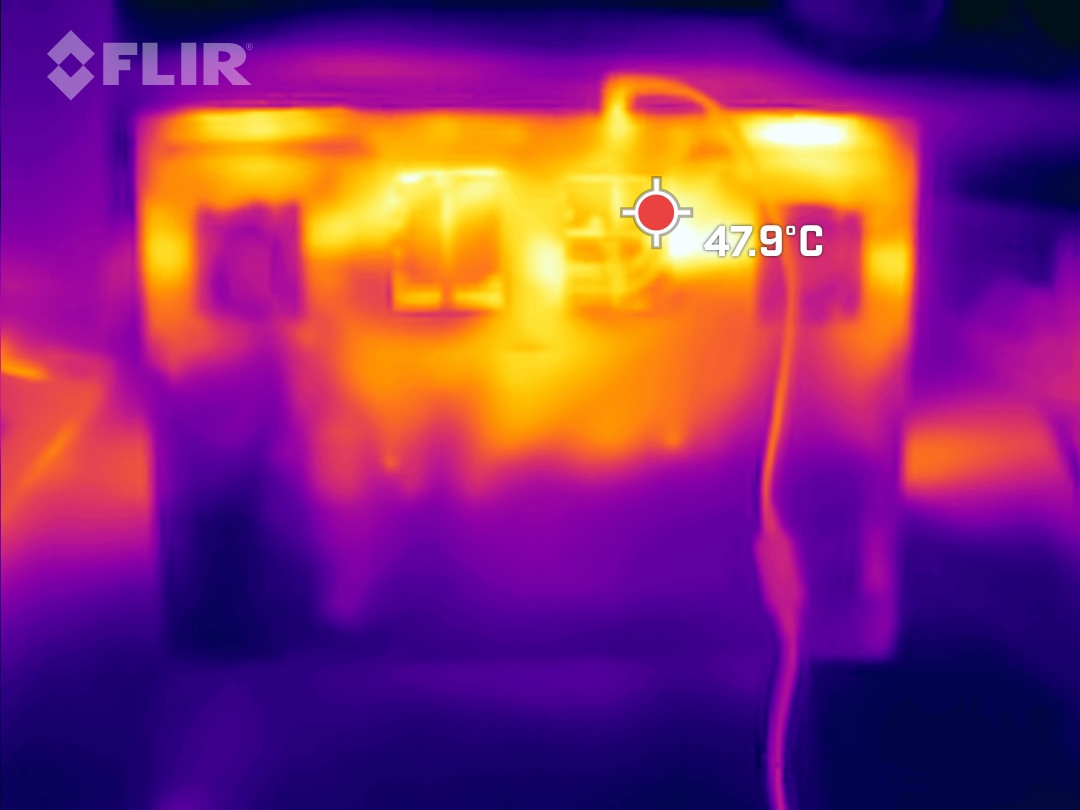
温度
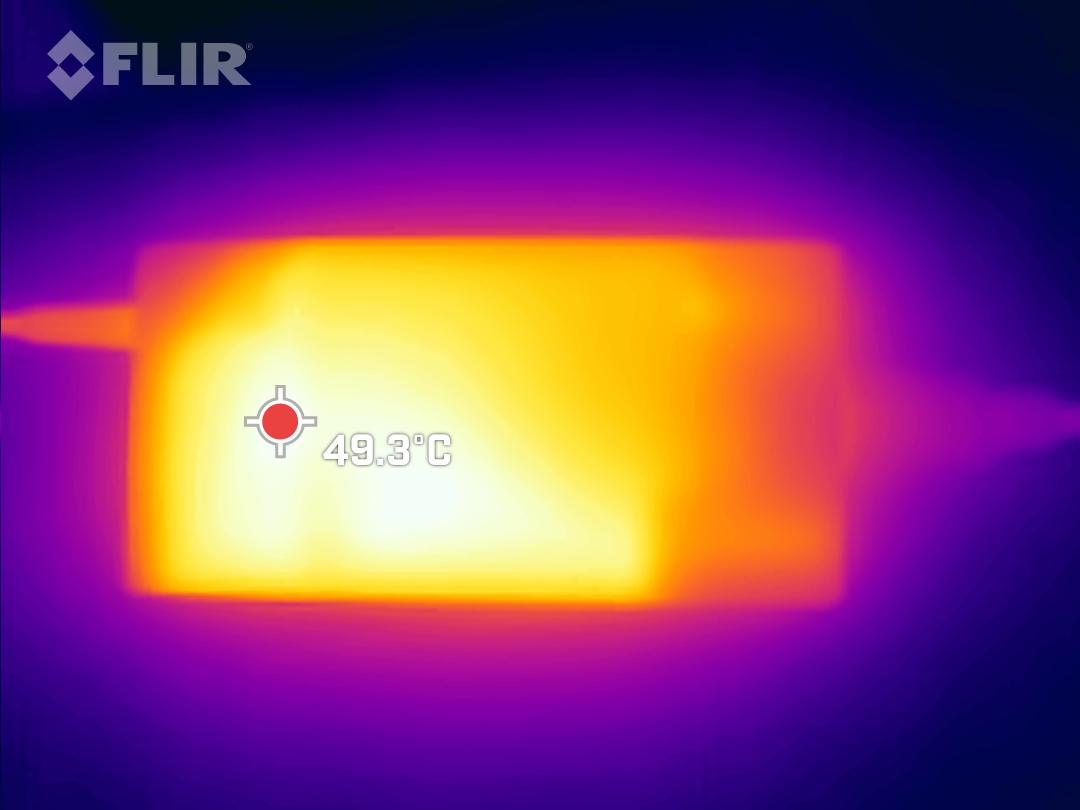
归根结底,游戏笔记本的高性能水平总是与大量的热量相伴而行。Focus 16也会相对发热,但不会灼伤你在键盘上的手指。除了笔记本本身,电源装置在运行过程中也会变热。这有时可以达到50℃以上的温度。
(-) The maximum temperature on the upper side is 50 °C / 122 F, compared to the average of 40.4 °C / 105 F, ranging from 21.2 to 68.8 °C for the class Gaming.
(-) The bottom heats up to a maximum of 48 °C / 118 F, compared to the average of 43.2 °C / 110 F
(+) In idle usage, the average temperature for the upper side is 25.3 °C / 78 F, compared to the device average of 33.9 °C / 93 F.
(±) Playing The Witcher 3, the average temperature for the upper side is 37.1 °C / 99 F, compared to the device average of 33.9 °C / 93 F.
(+) The palmrests and touchpad are cooler than skin temperature with a maximum of 30 °C / 86 F and are therefore cool to the touch.
(±) The average temperature of the palmrest area of similar devices was 28.8 °C / 83.8 F (-1.2 °C / -2.2 F).
| Schenker XMG Focus 16 (i7-12700H, RTX 3060) Intel Core i7-12700H, NVIDIA GeForce RTX 3060 Laptop GPU | Asus ZenBook Pro 16X OLED UX7602ZM-ME115W Intel Core i9-12900H, NVIDIA GeForce RTX 3060 Laptop GPU | Dell G16 7620 Intel Core i7-12700H, NVIDIA GeForce RTX 3060 Laptop GPU | Asus ROG Flow X16 GV601RW-M5082W AMD Ryzen 9 6900HS, NVIDIA GeForce RTX 3070 Ti Laptop GPU | Lenovo ThinkPad X1 Extreme G5-21DE003RGE Intel Core i7-12700H, NVIDIA GeForce RTX 3060 Laptop GPU | Lenovo Legion Slim 7-16IAH 82TF004YGE Intel Core i7-12700H, NVIDIA GeForce RTX 3060 Laptop GPU | Lenovo Legion 5 Pro 16IAH7H Intel Core i7-12700H, NVIDIA GeForce RTX 3060 Laptop GPU | |
|---|---|---|---|---|---|---|---|
| Heat | 5% | 8% | -14% | -0% | -15% | -9% | |
| Maximum Upper Side * (°C) | 50 | 32 36% | 47.6 5% | 55.1 -10% | 52 -4% | 48.3 3% | 45.8 8% |
| Maximum Bottom * (°C) | 48 | 41.6 13% | 54 -13% | 50.3 -5% | 56.4 -18% | 55.3 -15% | 66.3 -38% |
| Idle Upper Side * (°C) | 28 | 32.6 -16% | 23 18% | 35.5 -27% | 26.4 6% | 35.7 -28% | 30.4 -9% |
| Idle Bottom * (°C) | 32 | 36 -13% | 24.6 23% | 36.1 -13% | 27.2 15% | 37.6 -18% | 30.4 5% |
* ... smaller is better
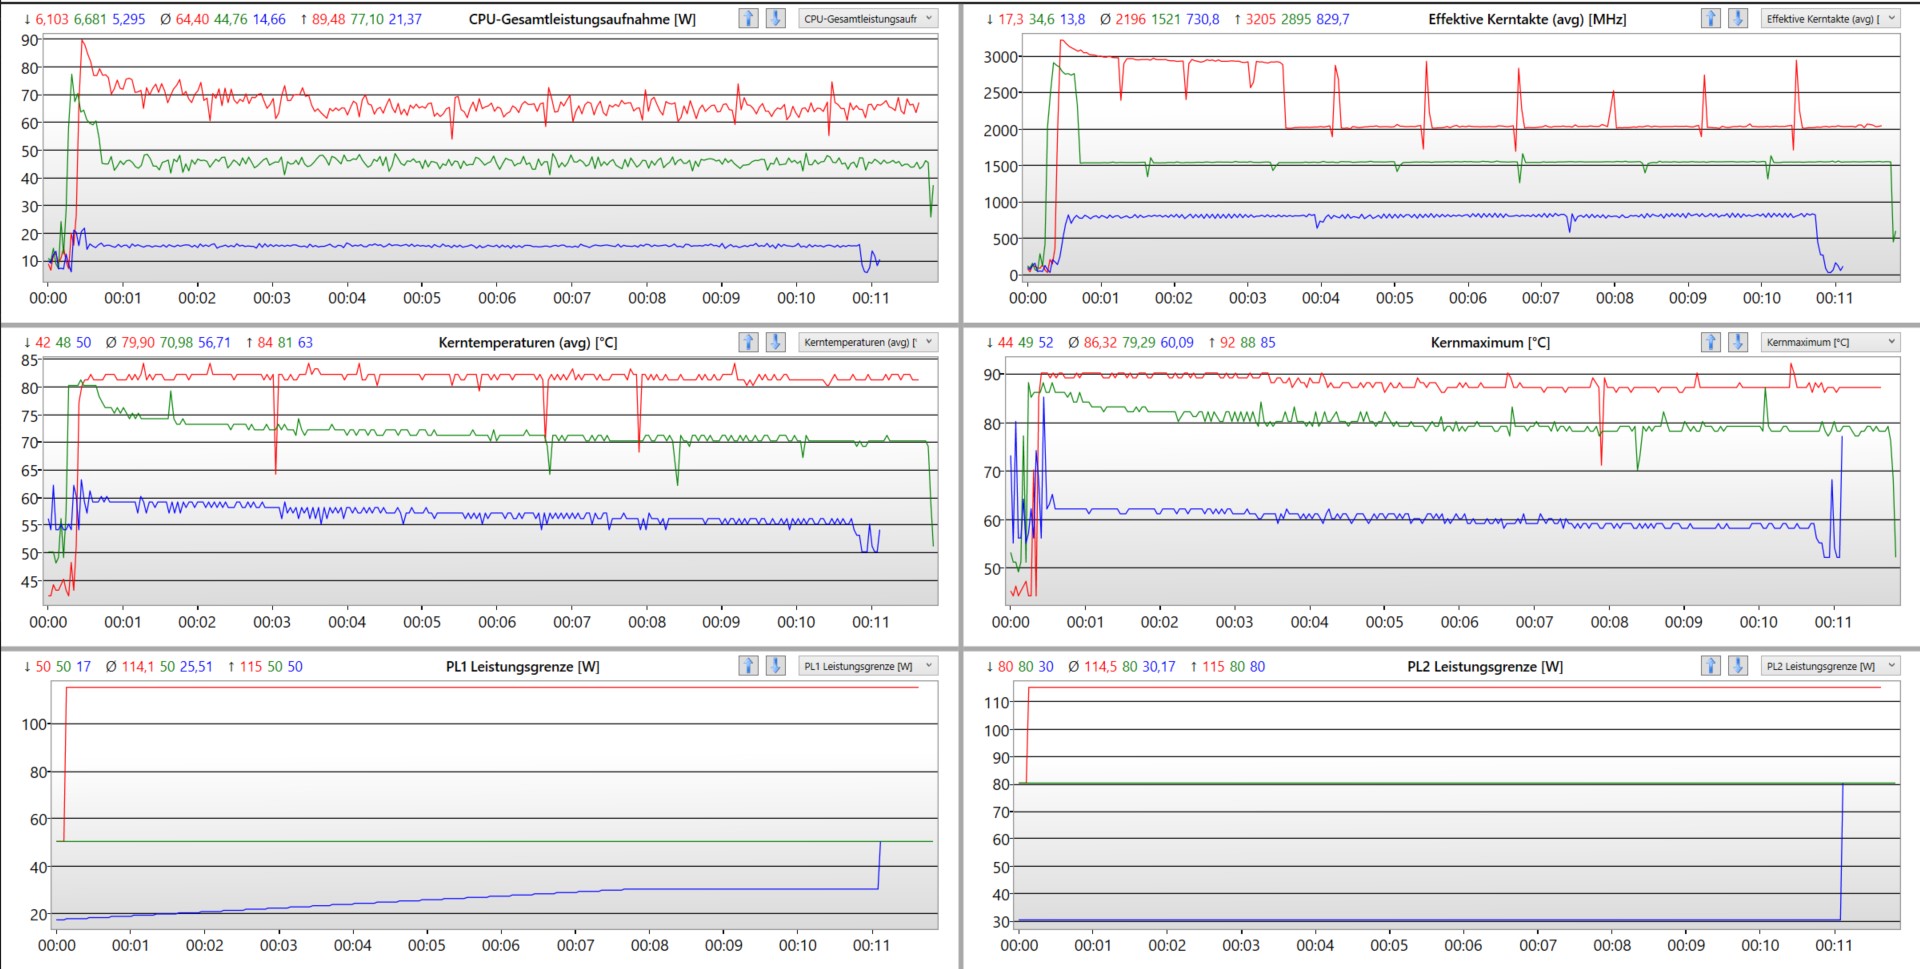
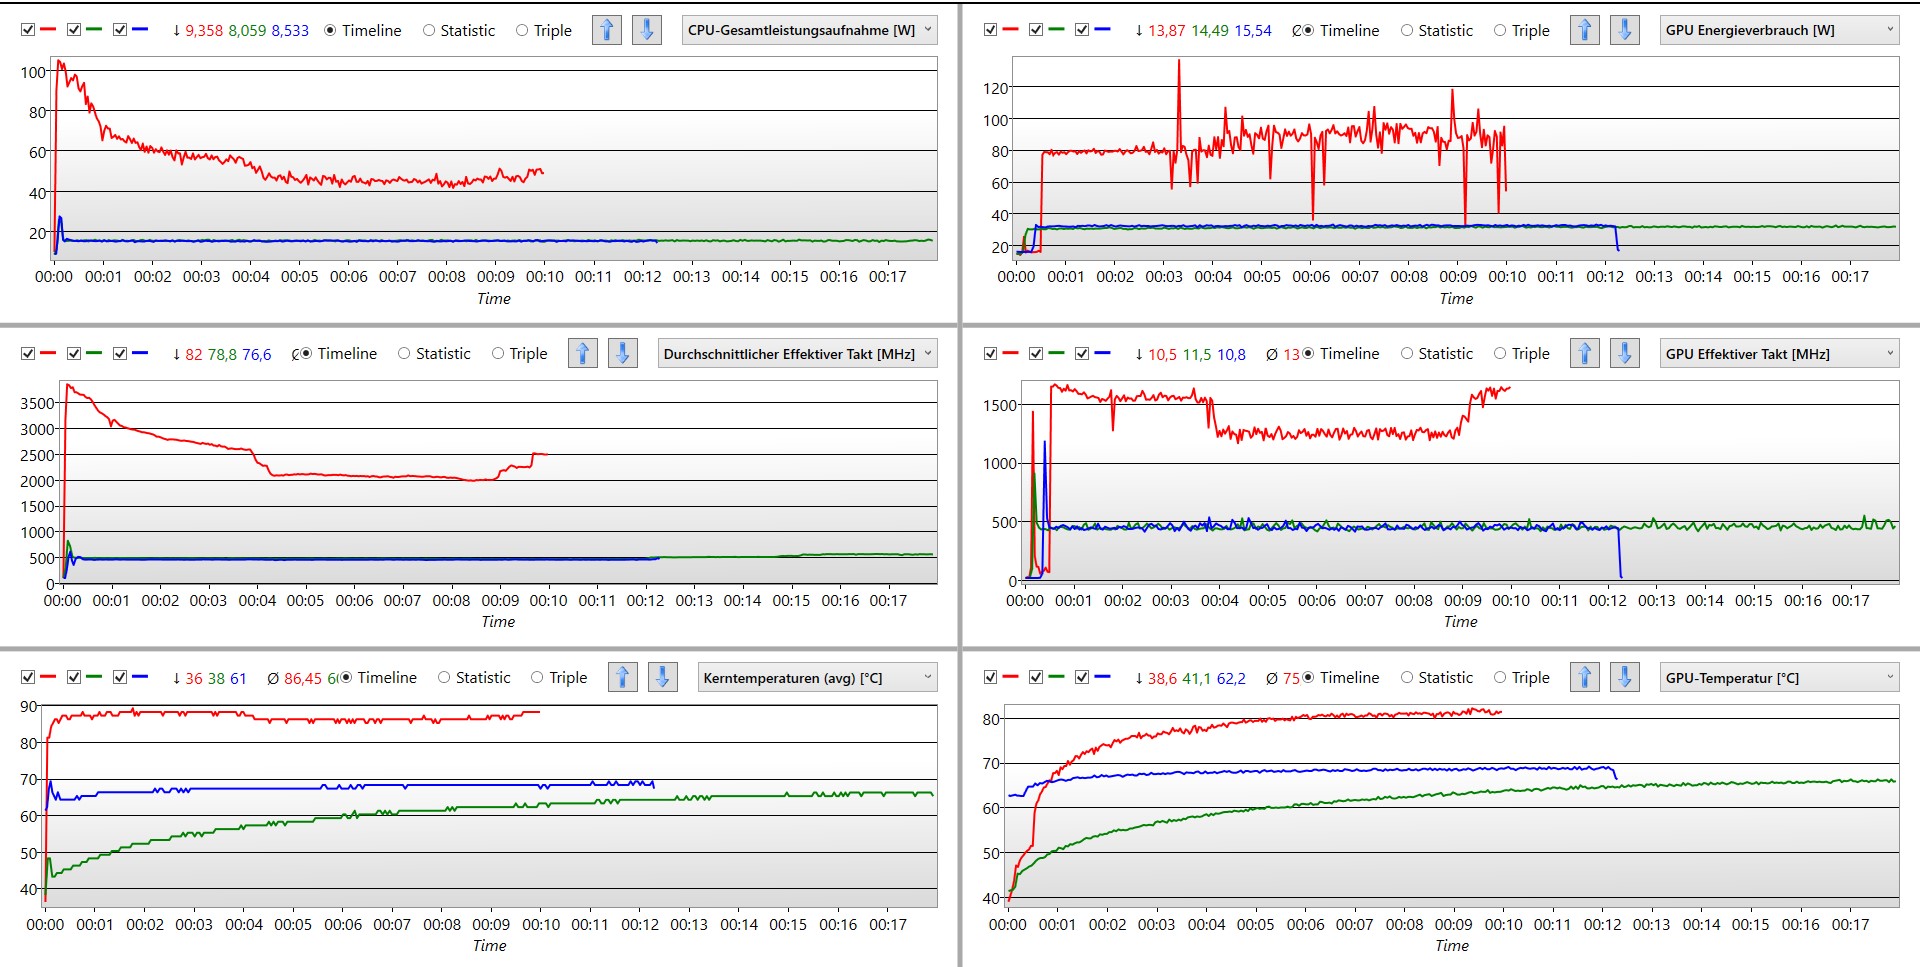
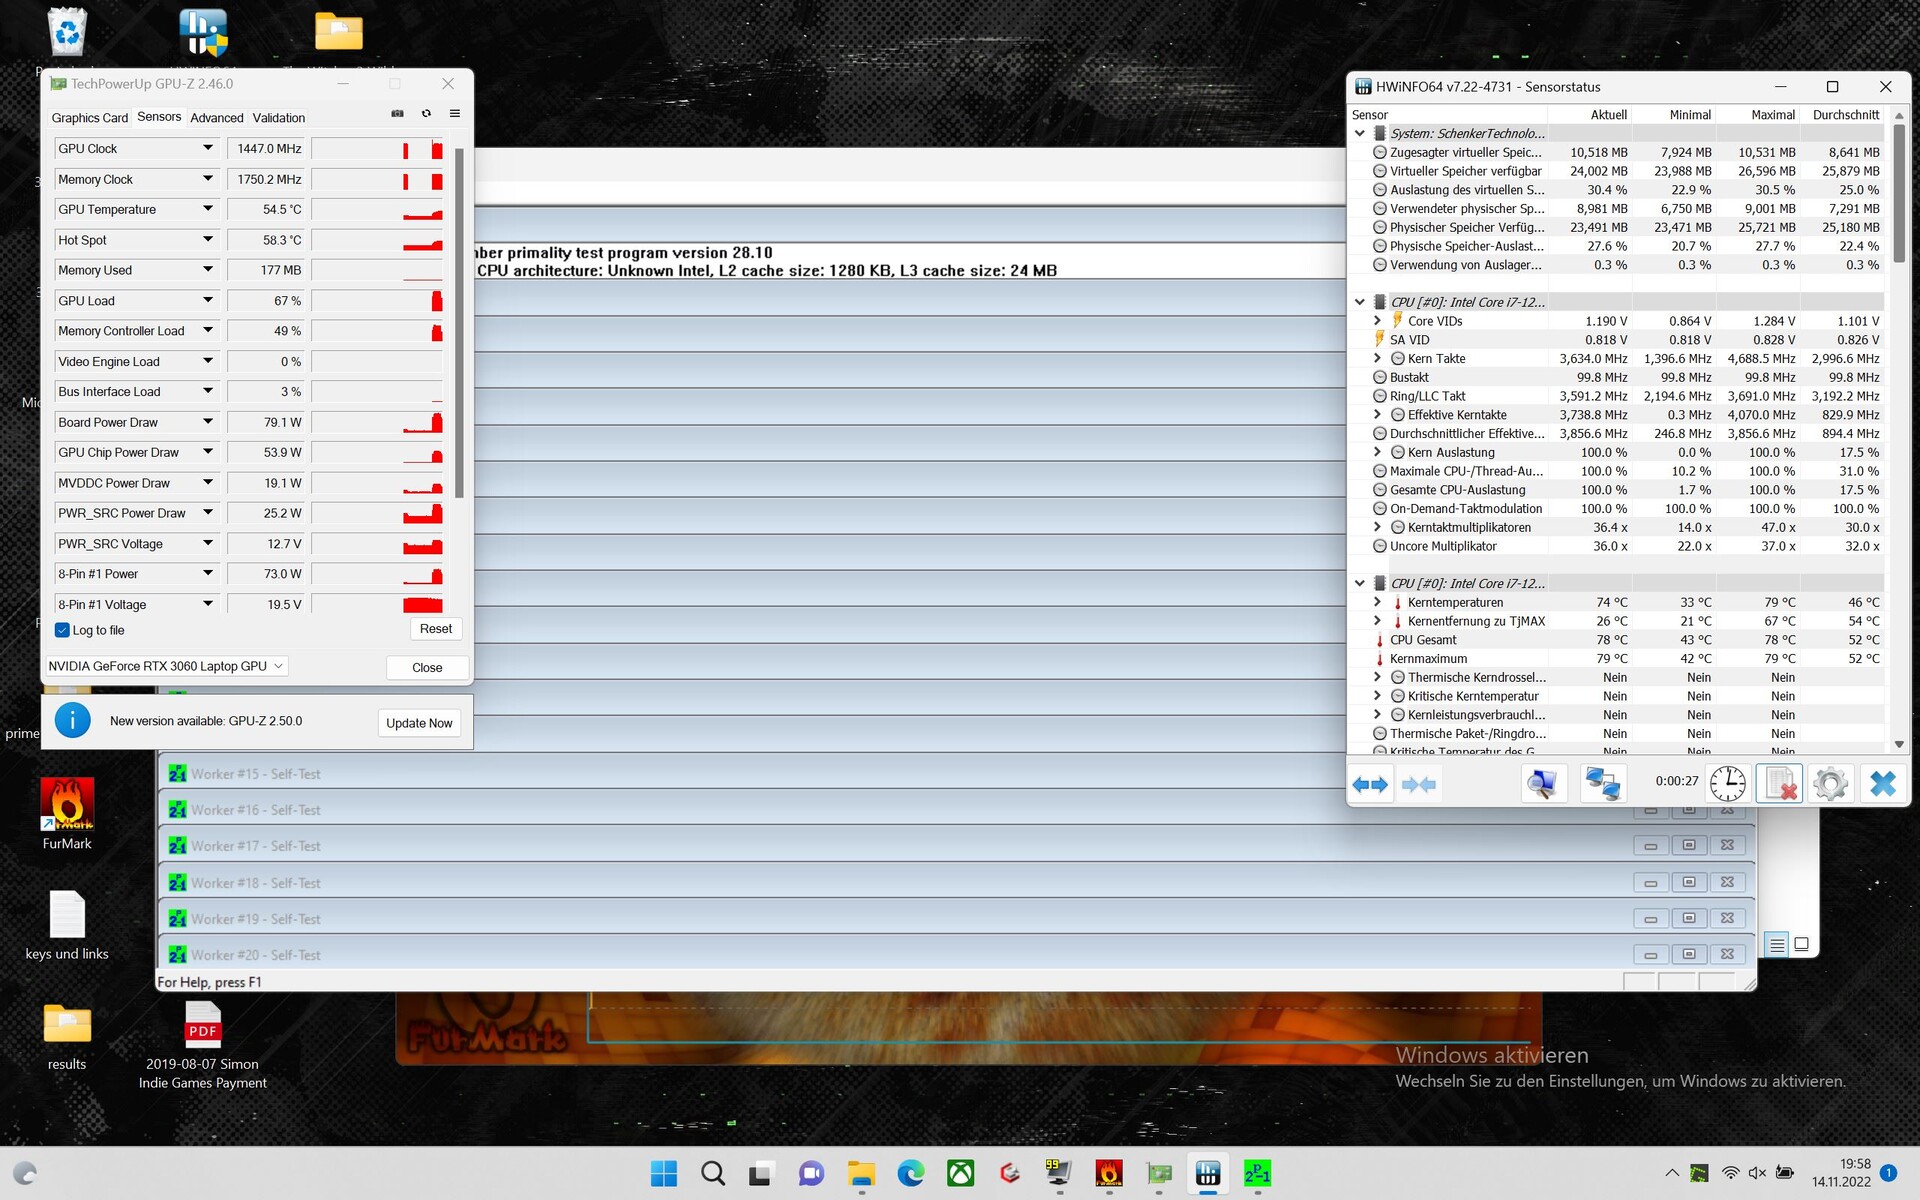
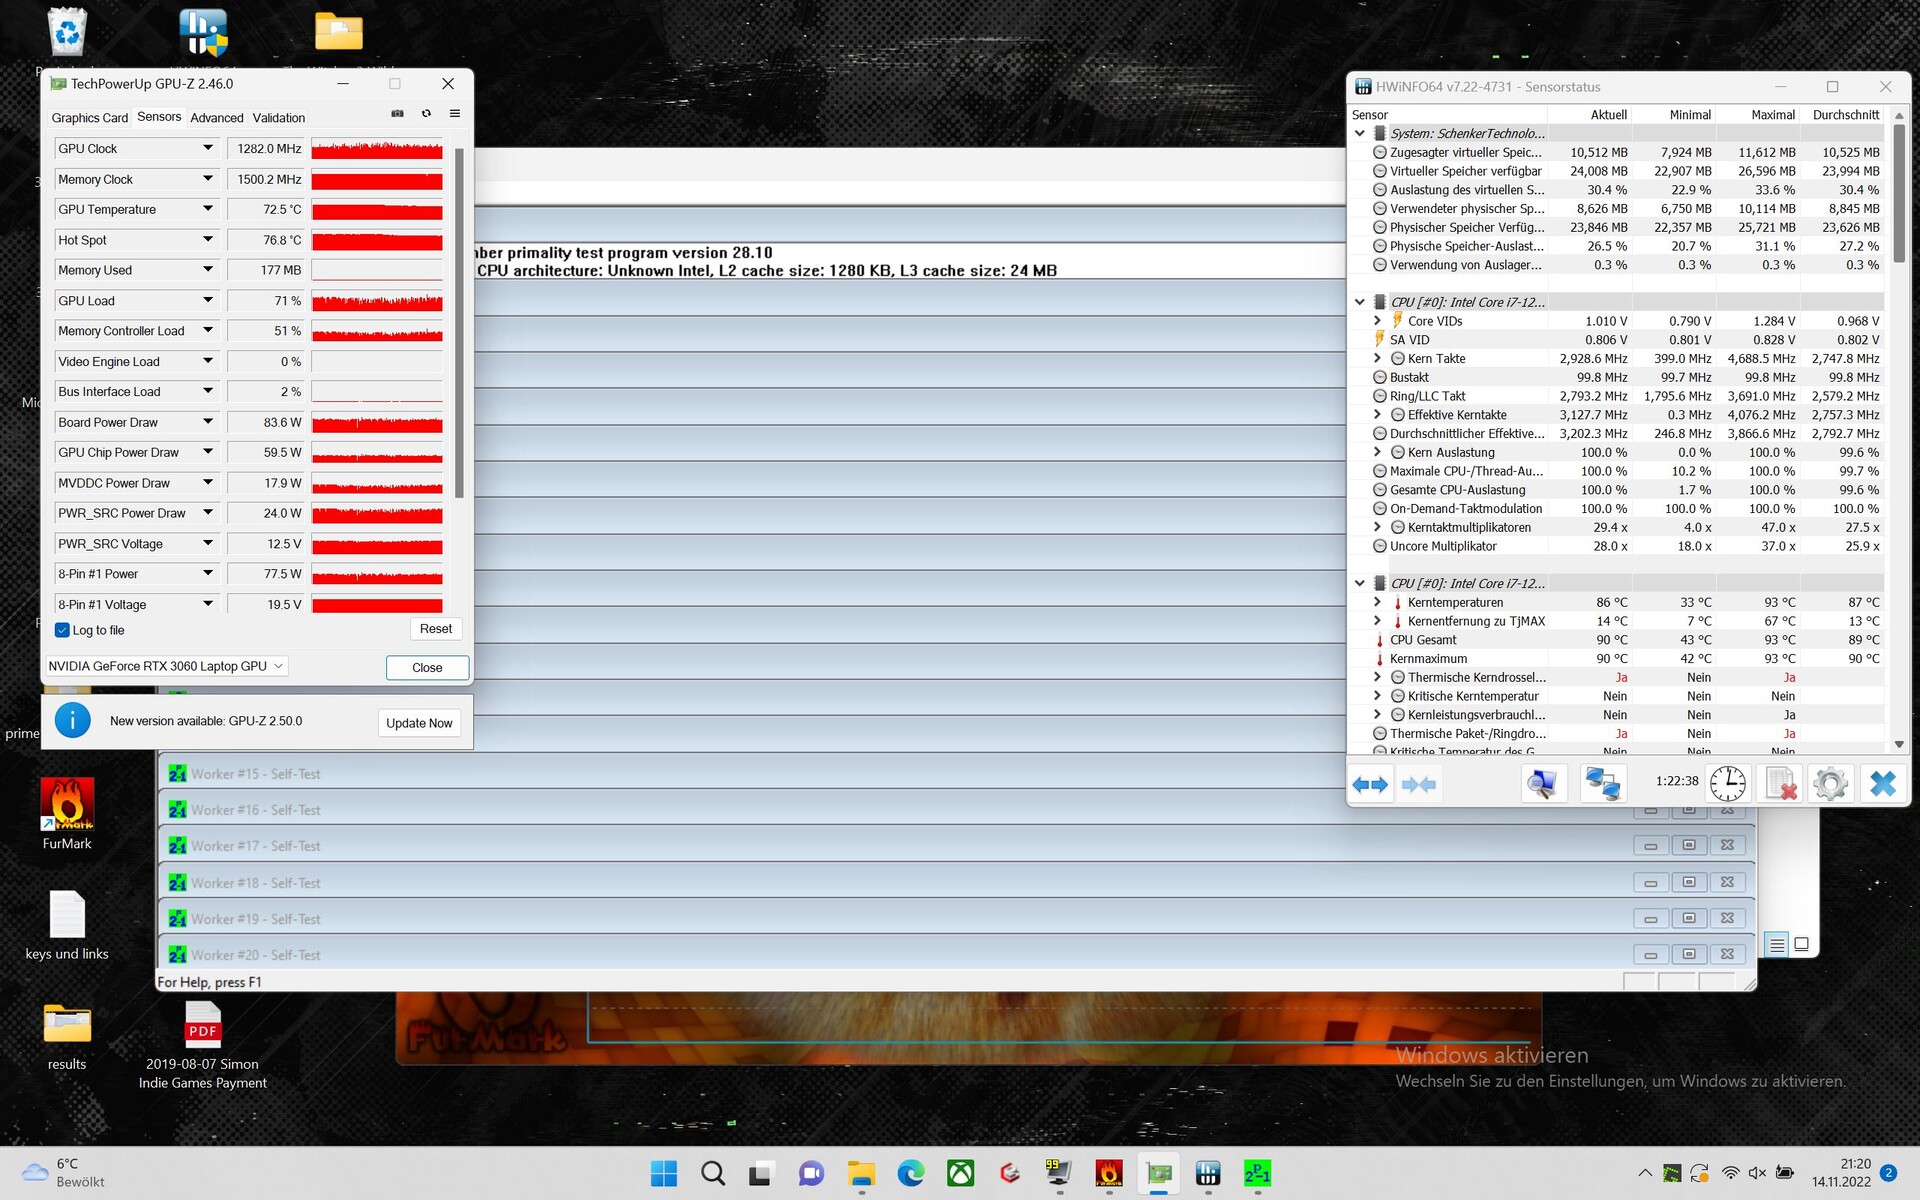
压力测试
在压力测试中,Schenker XMG Focus 16的CPU和GPU速度在温度分别达到80°和90°C时就会下降。
发言人
Schenker XMG Focus 16有两个小扬声器,动态范围很小。通过3.5毫米音频插孔或蓝牙连接外部扬声器几乎是必须的。Schenker笔记本电脑配备了Sound Blaster Cinema 6+应用程序。这保证了出色的耳机音质。
Schenker XMG Focus 16 (i7-12700H, RTX 3060) audio analysis
(±) | speaker loudness is average but good (79.2 dB)
Bass 100 - 315 Hz
(-) | nearly no bass - on average 24.4% lower than median
(±) | linearity of bass is average (8.1% delta to prev. frequency)
Mids 400 - 2000 Hz
(±) | higher mids - on average 10.6% higher than median
(±) | linearity of mids is average (13.1% delta to prev. frequency)
Highs 2 - 16 kHz
(+) | balanced highs - only 4.7% away from median
(±) | linearity of highs is average (10.4% delta to prev. frequency)
Overall 100 - 16.000 Hz
(-) | overall sound is not linear (30.1% difference to median)
Compared to same class
» 96% of all tested devices in this class were better, 2% similar, 3% worse
» The best had a delta of 6%, average was 18%, worst was 132%
Compared to all devices tested
» 88% of all tested devices were better, 3% similar, 9% worse
» The best had a delta of 4%, average was 23%, worst was 134%
Asus ROG Flow X16 GV601RW-M5082W audio analysis
(±) | speaker loudness is average but good (80.7 dB)
Bass 100 - 315 Hz
(±) | reduced bass - on average 12.7% lower than median
(±) | linearity of bass is average (13.8% delta to prev. frequency)
Mids 400 - 2000 Hz
(+) | balanced mids - only 1.3% away from median
(+) | mids are linear (4.7% delta to prev. frequency)
Highs 2 - 16 kHz
(±) | higher highs - on average 6.4% higher than median
(+) | highs are linear (6.8% delta to prev. frequency)
Overall 100 - 16.000 Hz
(+) | overall sound is linear (12.9% difference to median)
Compared to same class
» 17% of all tested devices in this class were better, 4% similar, 79% worse
» The best had a delta of 6%, average was 18%, worst was 132%
Compared to all devices tested
» 12% of all tested devices were better, 3% similar, 85% worse
» The best had a delta of 4%, average was 23%, worst was 134%
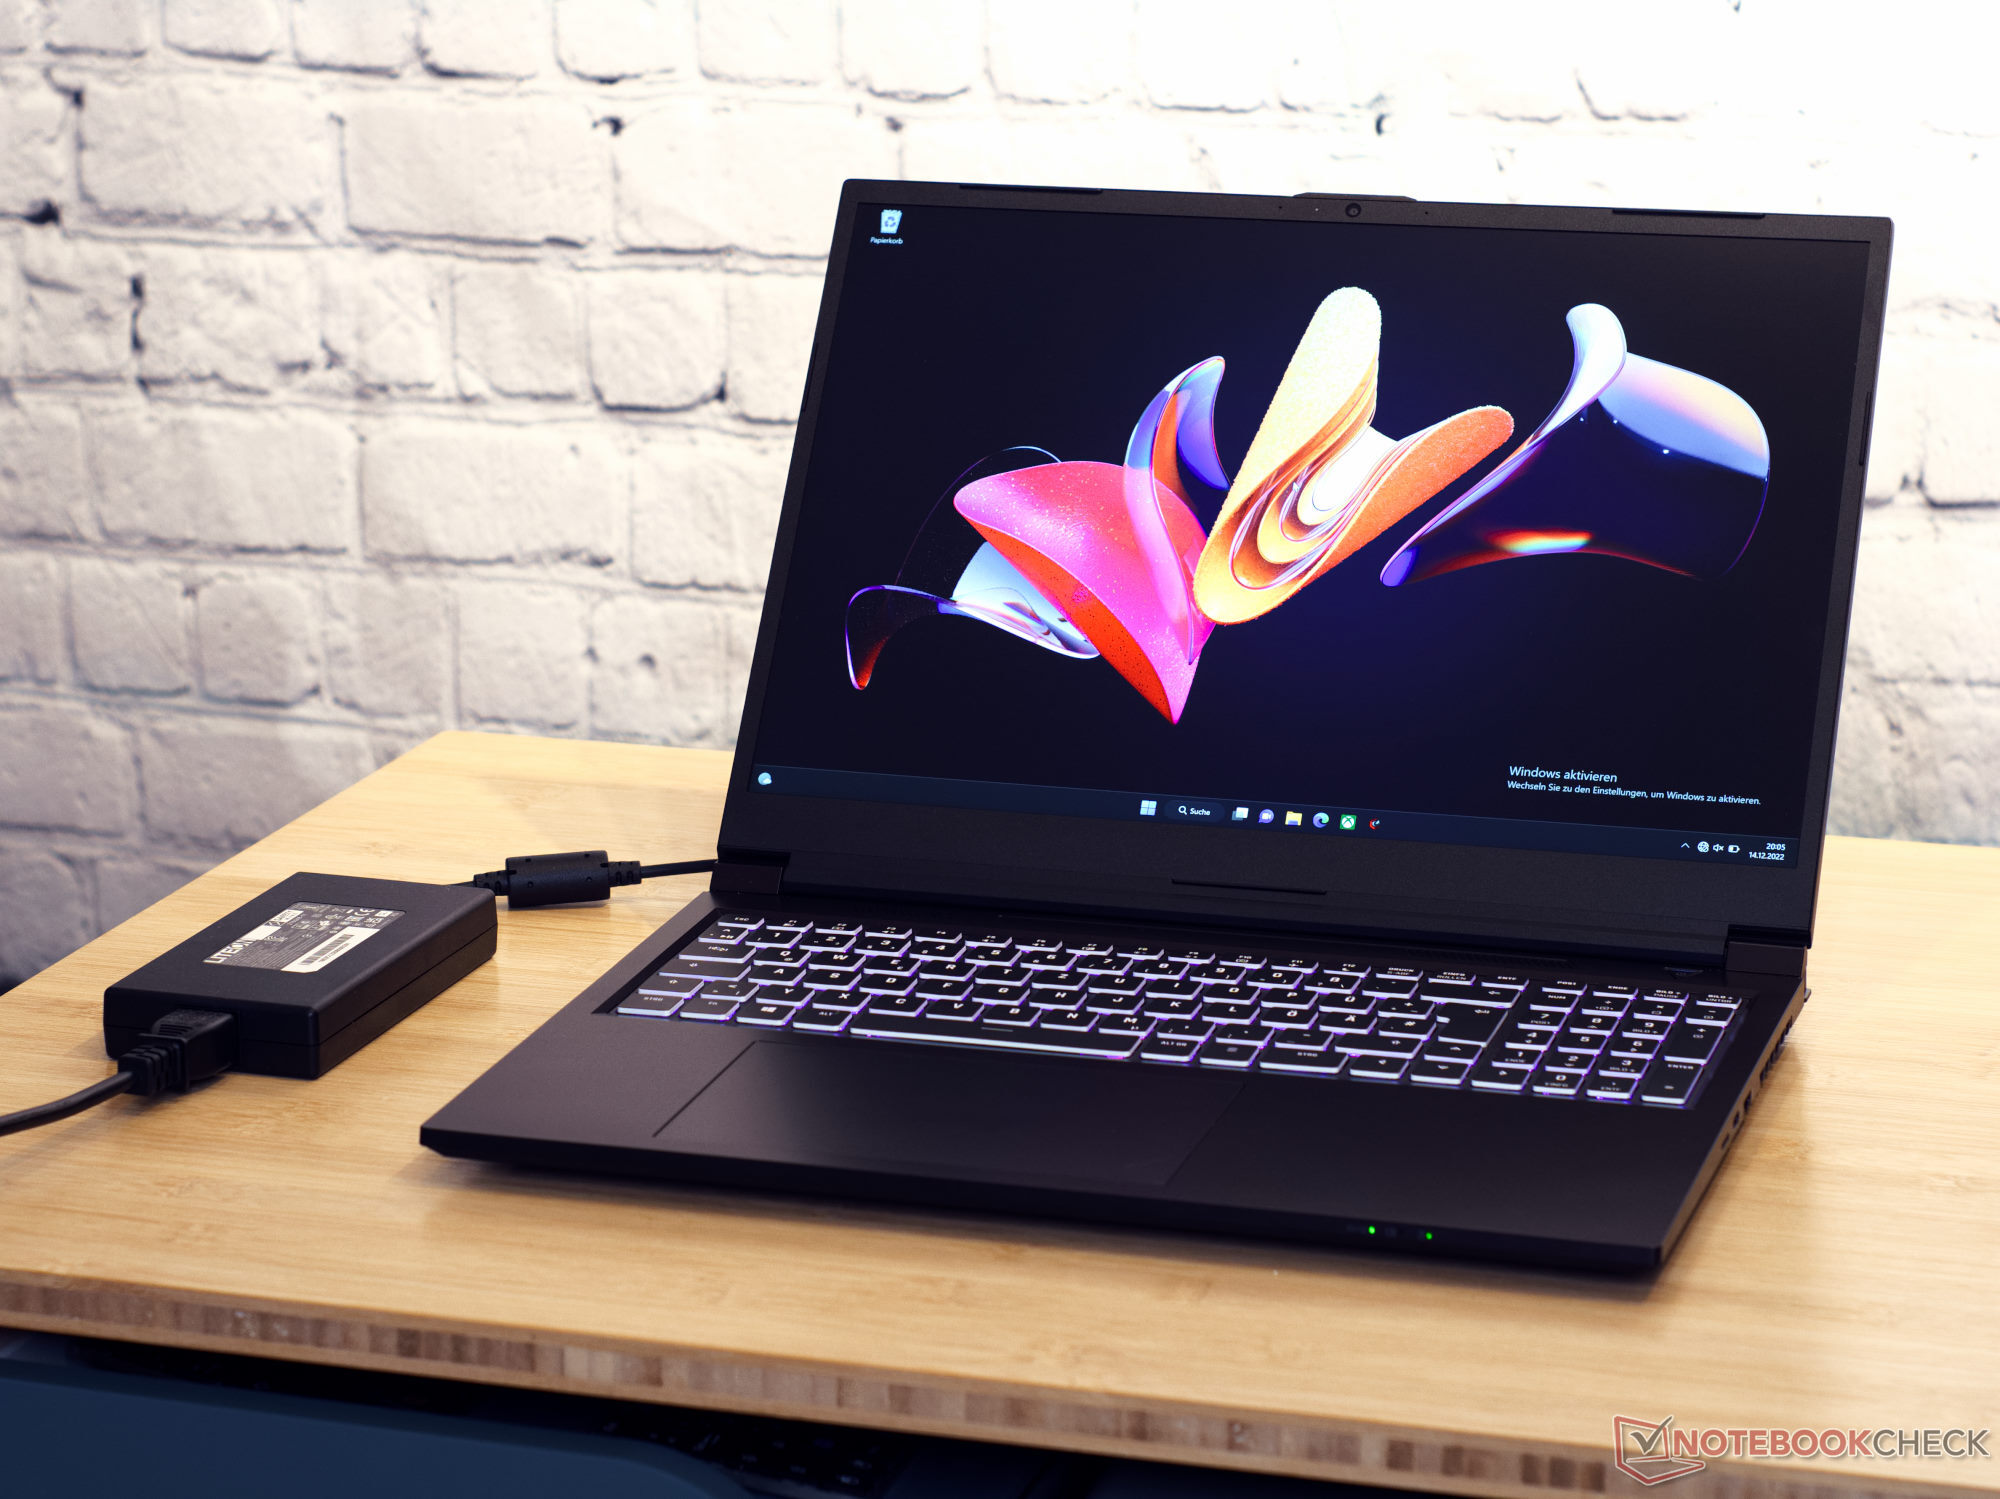
电源管理--典型的游戏笔记本功耗
消耗功率
这台笔记本电脑配备了Lite-ON公司的180瓦电源装置(PA-1181-76)。在压力测试中,我们测得的长期功耗为190瓦。总的来说,考虑到笔记本电脑的配置,该电源显得很弱。戴尔和联想的对比设备,其配置与申克笔记本电脑类似,至少配备了230瓦的电源装置。而这些笔记本电脑就利用了这一点。
当闲置时,这台笔记本电脑比对比设备多用3瓦,因此在电源要求方面与其他游戏笔记本电脑并驾齐驱。总而言之,尽管电源装置很小,但Schenker XMG Focus 16并不是一个真正的节能奇迹。
| Off / Standby | |
| Idle | |
| Load |
|
Key:
min: | |
| Schenker XMG Focus 16 (i7-12700H, RTX 3060) i7-12700H, GeForce RTX 3060 Laptop GPU, Samsung SSD 980 Pro 1TB MZ-V8P1T0BW, IPS, 2560x1600, 16" | Asus ZenBook Pro 16X OLED UX7602ZM-ME115W i9-12900H, GeForce RTX 3060 Laptop GPU, Samsung PM9A1 MZVL21T0HCLR, OLED, 3840x2400, 16" | Dell G16 7620 i7-12700H, GeForce RTX 3060 Laptop GPU, WDC PC SN810 512GB, IPS, 2560x1600, 16" | Asus ROG Flow X16 GV601RW-M5082W R9 6900HS, GeForce RTX 3070 Ti Laptop GPU, Micron 3400 1TB MTFDKBA1T0TFH, Mini LED, 2560x1600, 16.1" | Lenovo ThinkPad X1 Extreme G5-21DE003RGE i7-12700H, GeForce RTX 3060 Laptop GPU, Micron 3400 1TB MTFDKBA1T0TFH, IPS, 3840x2400, 16" | Lenovo Legion Slim 7-16IAH 82TF004YGE i7-12700H, GeForce RTX 3060 Laptop GPU, SK Hynix HFS001TEJ9X115N, IPS LED, 2560x1600, 16" | Lenovo Legion 5 Pro 16IAH7H i7-12700H, GeForce RTX 3060 Laptop GPU, 2x Samsung PM9A1 MZVL21T0HCLR (RAID 0), IPS, 2560x1600, 16" | Average NVIDIA GeForce RTX 3060 Laptop GPU | Average of class Gaming | |
|---|---|---|---|---|---|---|---|---|---|
| Power Consumption | 20% | -5% | -21% | 1% | 7% | -44% | 14% | -2% | |
| Idle Minimum * (Watt) | 14.7 | 11.1 24% | 14.4 2% | 12.2 17% | 11.8 20% | 13.3 10% | 22.8 -55% | 10.4 ? 29% | 13.1 ? 11% |
| Idle Average * (Watt) | 18.6 | 11.4 39% | 17.8 4% | 25.5 -37% | 22.4 -20% | 17.5 6% | 26.5 -42% | 14.5 ? 22% | 19 ? -2% |
| Idle Maximum * (Watt) | 21.2 | 14.4 32% | 31.5 -49% | 29.8 -41% | 23.1 -9% | 18.4 13% | 41 -93% | 21.4 ? -1% | 24.6 ? -16% |
| Load Average * (Watt) | 121 | 137.4 -14% | 101.2 16% | 183 -51% | 138 -14% | 122.8 -1% | 191 -58% | 109.3 ? 10% | 111.3 ? 8% |
| Witcher 3 ultra * (Watt) | 174 | 136 22% | 176.9 -2% | 183.6 -6% | 129.9 25% | 154.7 11% | 194.7 -12% | ||
| Load Maximum * (Watt) | 235 | 197 16% | 242.9 -3% | 253 -8% | 225.6 4% | 232.6 1% | 238 -1% | 206 ? 12% | 260 ? -11% |
* ... smaller is better
Power consumption Witcher 3 / stress test
Power consumption with an external monitor
电池寿命
Focus 16装了一个54Wh的小电池。由于这个原因,电池寿命不到对比设备的一半,这应该不足为奇。尽管如此,控制中心的节能模式还是非常有效。全屏亮度下的WiFi上网测试是使用娱乐模式设置进行的,150cd/m²的测试是使用节能设置和60Hz的刷新率进行的。设置为这种模式,电池的持续时间大大延长。
| Schenker XMG Focus 16 (i7-12700H, RTX 3060) i7-12700H, GeForce RTX 3060 Laptop GPU, 54 Wh | Asus ZenBook Pro 16X OLED UX7602ZM-ME115W i9-12900H, GeForce RTX 3060 Laptop GPU, 96 Wh | Dell G16 7620 i7-12700H, GeForce RTX 3060 Laptop GPU, 84 Wh | Asus ROG Flow X16 GV601RW-M5082W R9 6900HS, GeForce RTX 3070 Ti Laptop GPU, 90 Wh | Lenovo ThinkPad X1 Extreme G5-21DE003RGE i7-12700H, GeForce RTX 3060 Laptop GPU, 90 Wh | Lenovo Legion Slim 7-16IAH 82TF004YGE i7-12700H, GeForce RTX 3060 Laptop GPU, 99.99 Wh | Lenovo Legion 5 Pro 16IAH7H i7-12700H, GeForce RTX 3060 Laptop GPU, 80 Wh | Average of class Gaming | |
|---|---|---|---|---|---|---|---|---|
| Battery runtime | 86% | -23% | -9% | 31% | 1% | -41% | 28% | |
| WiFi v1.3 (h) | 4.8 | 8.9 85% | 5 4% | 5.7 19% | 6.7 40% | 5.2 8% | 3.6 -25% | 7.08 ? 48% |
| Load (h) | 1.4 | 2.6 86% | 0.7 -50% | 0.9 -36% | 1.7 21% | 1.3 -7% | 0.6 -57% | 1.496 ? 7% |
| Reader / Idle (h) | 12.7 | 7.1 | 7.84 ? | |||||
| Witcher 3 ultra (h) | 0.9 | 1.5 | 2.1 | |||||
| H.264 (h) | 7.3 | 9.5 | 4.1 | 8.27 ? |
Pros
Cons
结论--一个普通的游戏笔记本电脑,拥有高于平均水平的服务
在测试的游戏中,Schenker XMG Focus 16提供了持续的高fps计数。总体而言,Nvidia RTX 3060游戏笔记本电脑提供了高于平均水平的性能。然而,以戴尔G16 或联想Legion 5 Pro 的形式进行竞争,以几乎相同的价格提供了更多的原始动力。尽管如此,性能的提高还是相当微不足道的。
然而,Schenker笔记本电脑拥有比戴尔和联想的竞争对手更强的软技能。Schenker笔记本电脑的键盘以其高键程和良好的触觉反馈而令人印象深刻。XMG Focus 16还享有一个位置良好的端口选择。此外,Schenker的客户支持也令人印象深刻。如同以前一样,询问得到了迅速和有效的回应,经常是在几个小时之内。这有助于全球国际货运代理公司连续第三次在我们的 笔记本电脑和智能手机的客户服务和支持调查中连续第三次获得第一名.XMG Focus 16的设计是一个品味的问题。对于一台游戏笔记本电脑来说,该设备是不起眼的,黑色的,方方正正的。
XMG Focus 16从硬件中汲取了大量的能量,却没有达到其潜力的极限。
总的来说,申克笔记本电脑坚如磐石,但无法达到顶级的性能。在我们的基准测试和分析中,没有任何一个领域的游戏笔记本电脑能够在竞争中占据优势。最好的显卡性能可以在华硕ROG Flow X16 ,而联想Legion 5 Pro取得了最好的CPU性能。此外,华硕Zenbook Pro 16X OLED 的屏幕反应最灵敏。在这些领域中,申克笔记本电脑都提供了足够或高于平均水平的性能。
价格和可用性
淘宝网上的Bestware.com是Schenker的网上商店,在那里可以配置和订购游戏笔记本电脑。在审查的时候,我们的测试规格XMG Focus 16可以以大约1800美元的价格买到。只有8GB内存,没有NVMe SSD,笔记本电脑的基本价格在1600美元左右。
Schenker XMG Focus 16 (i7-12700H, RTX 3060)
- 12/21/2022 v7 (old)
Marc Herter
Price comparison

