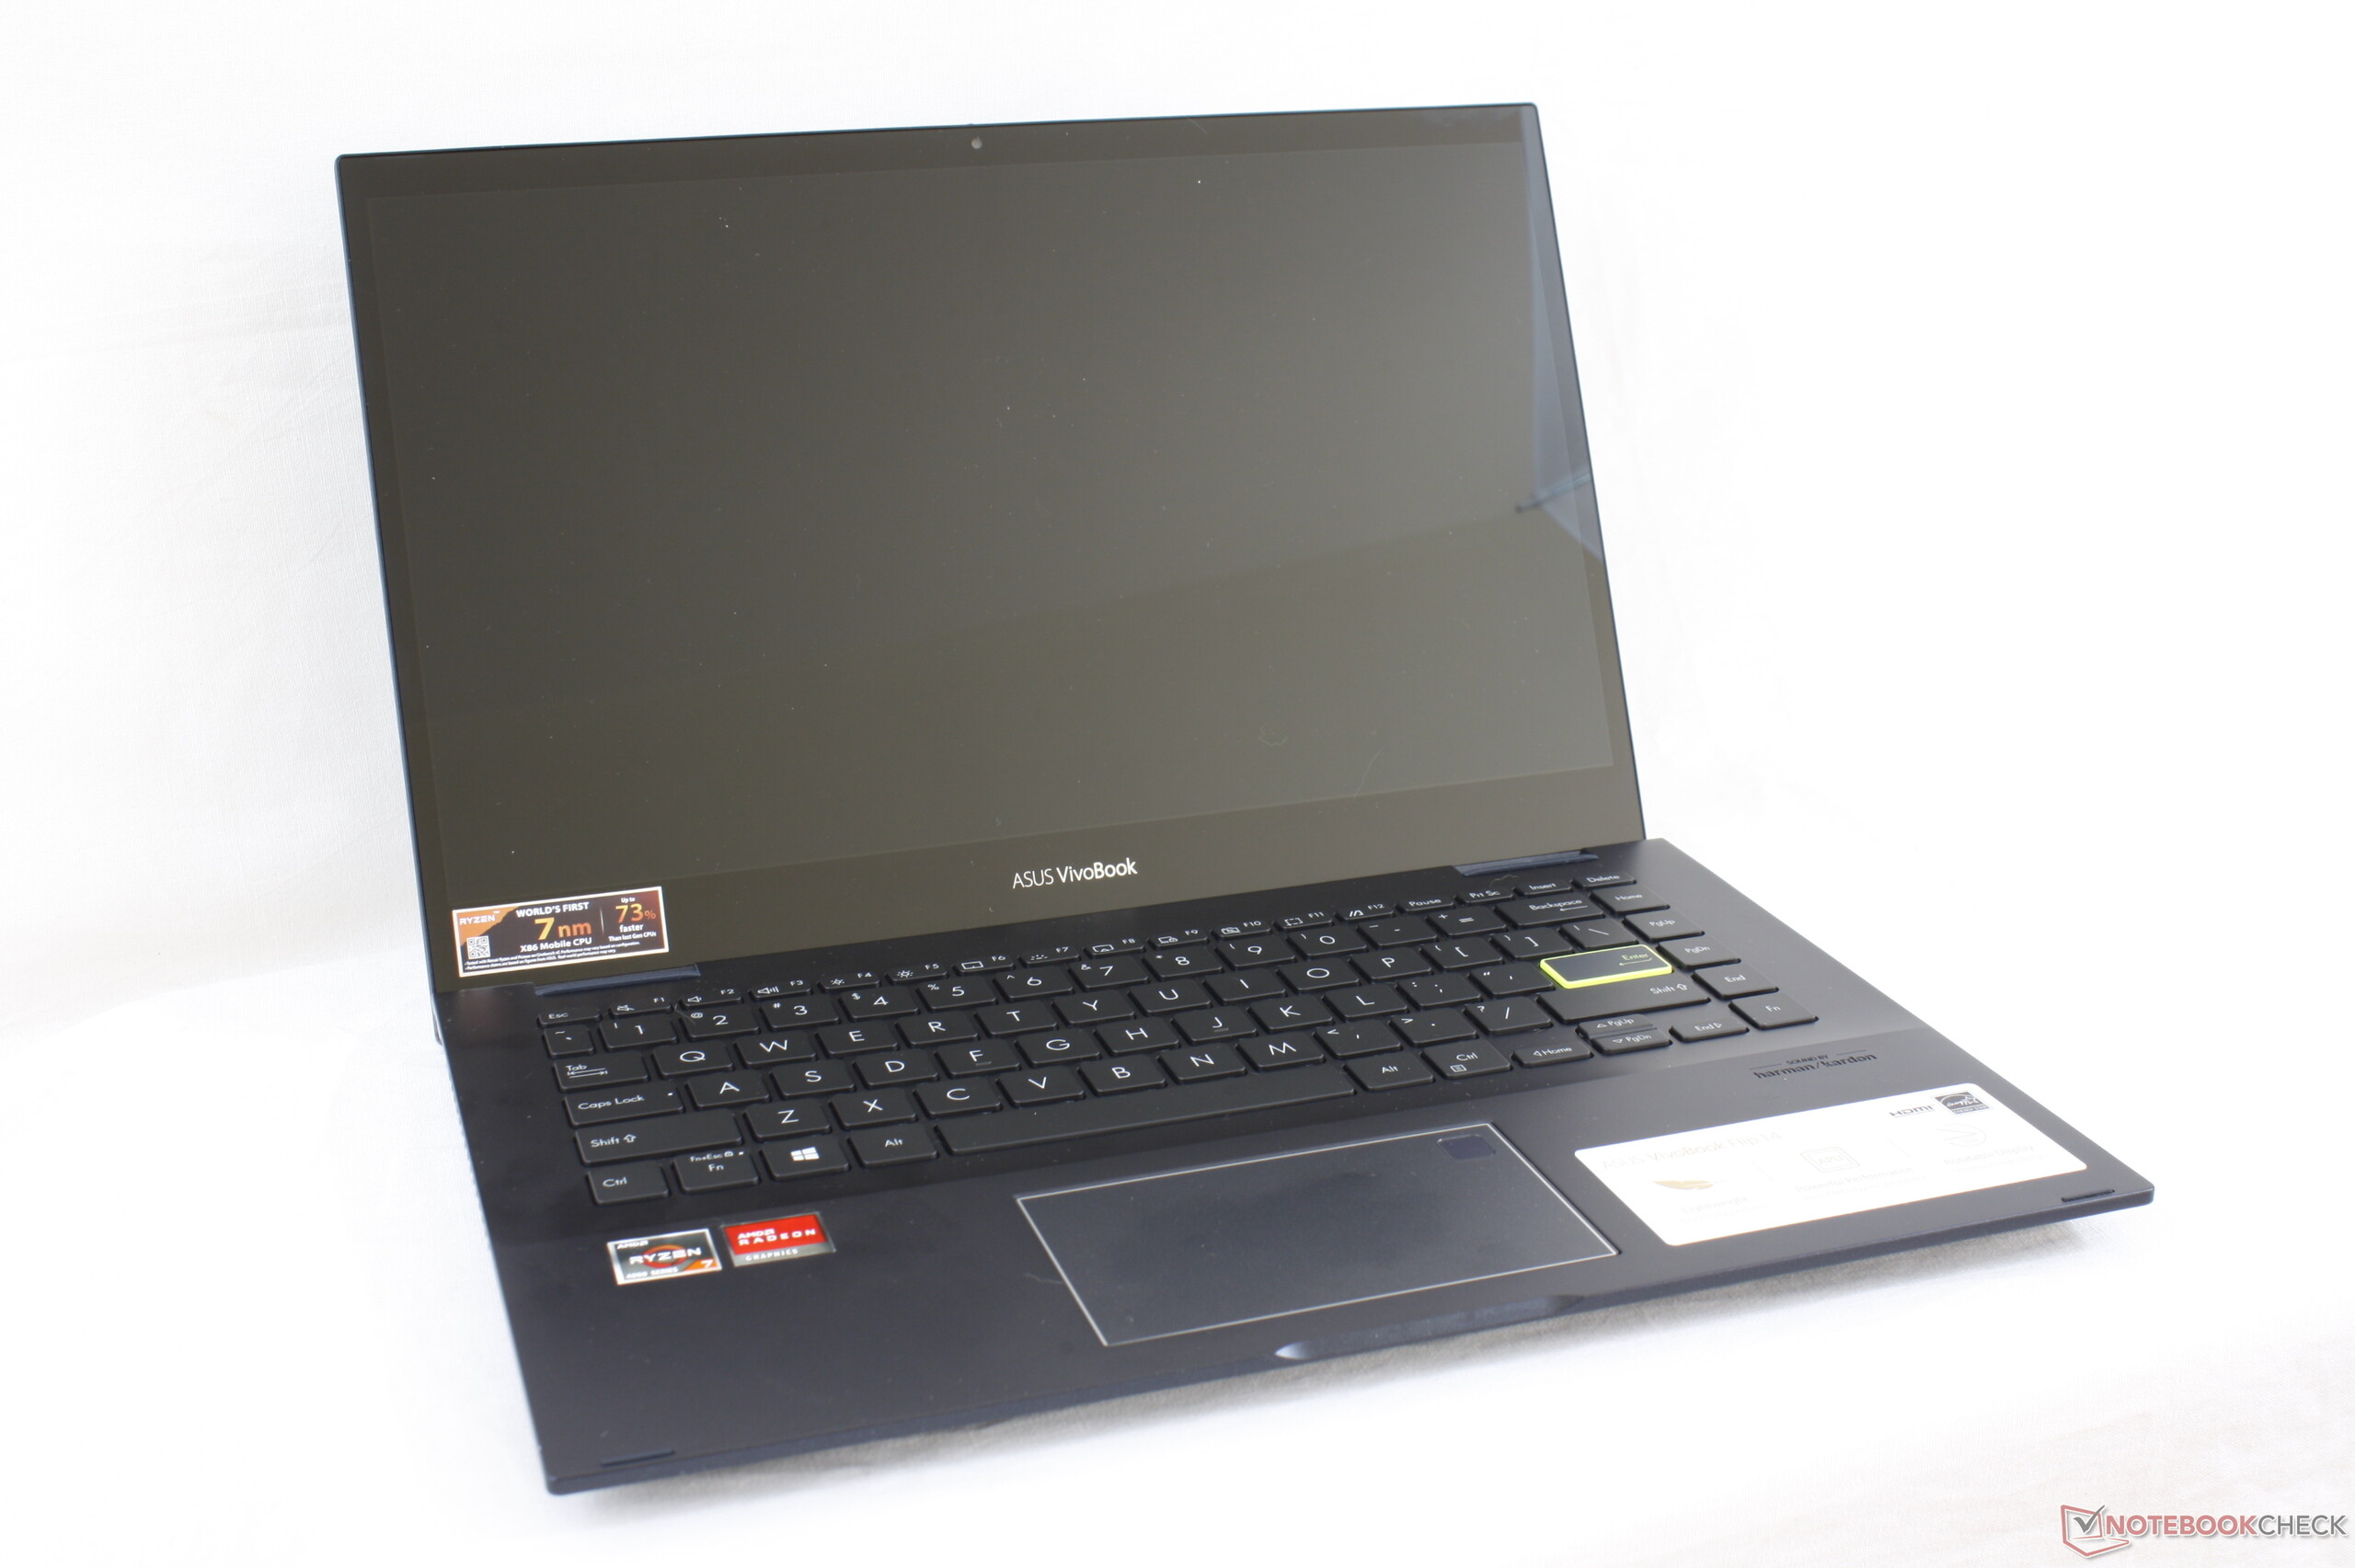
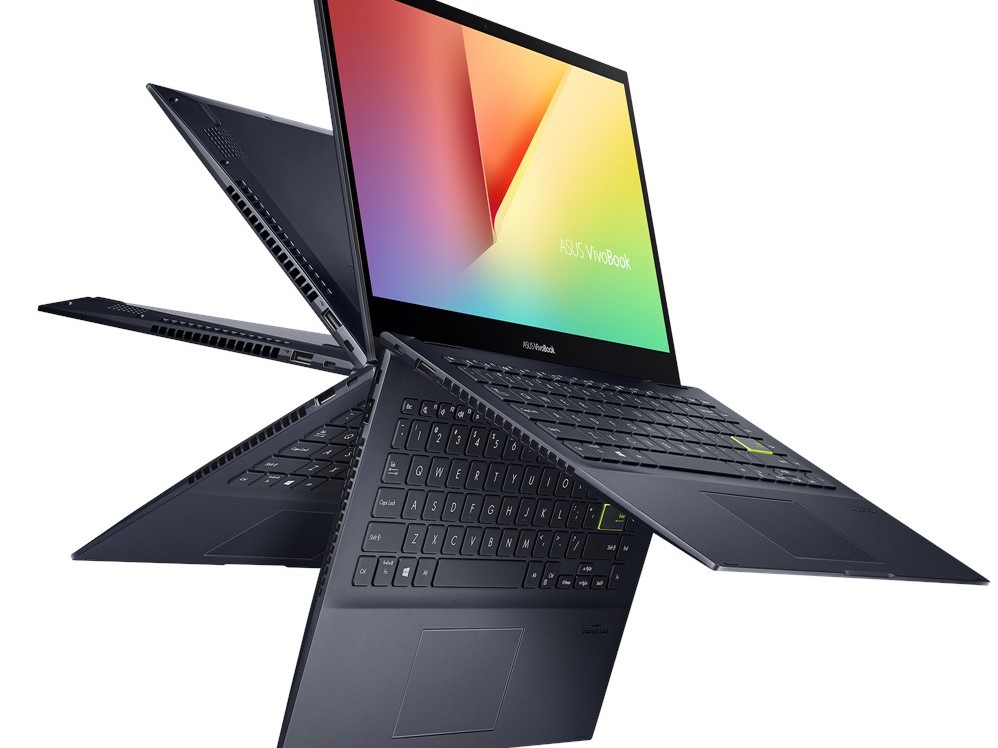
华硕VivoBook Flip 14 TM420IA笔记本电脑评测:不需要i7
Rating | Date | Model | Weight | Height | Size | Resolution | Price |
|---|---|---|---|---|---|---|---|
| 80.7 % v7 (old) | 11 / 2020 | Asus VivoBook Flip 14 TM420IA R7 4700U, Vega 7 | 1.6 kg | 18.2 mm | 14.00" | 1920x1080 | |
| 84.3 % v7 (old) | 04 / 2020 | Lenovo Yoga C740-14IML i5-10210U, UHD Graphics 620 | 1.4 kg | 16.9 mm | 14.00" | 1920x1080 | |
| 86.5 % v7 (old) | 03 / 2020 | Honor Magicbook 14 R5 3500U, Vega 8 | 1.4 kg | 16 mm | 14.00" | 1920x1080 | |
| 85 % v7 (old) | 09 / 2020 | Acer Swift 3 SF314-42-R27B R3 4300U, Vega 5 | 1.2 kg | 16.55 mm | 14.00" | 1920x1080 | |
| 83 % v7 (old) | 09 / 2020 | Lenovo IdeaPad 5 15IIL05 i5-1035G1, GeForce MX350 | 1.7 kg | 17.9 mm | 15.60" | 1920x1080 | |
| 81.2 % v7 (old) | LG Gram 14T90N i7-10510U, UHD Graphics 620 | 1.2 kg | 18 mm | 14.00" | 1920x1080 |
SD Card Reader
| SD Card Reader | |
| average JPG Copy Test (av. of 3 runs) | |
| Asus VivoBook Flip 14 TM420IA (Toshiba Exceria Pro M501 microSDXC 64GB) | |
| Asus ZenBook Flip 14 UX463FA-AI039T (Toshiba Exceria Pro M501 microSDXC 64GB) | |
| Lenovo IdeaPad 3 14IIL05 (Toshiba Exceria Pro SDXC 64 GB UHS-II) | |
| maximum AS SSD Seq Read Test (1GB) | |
| Asus VivoBook Flip 14 TM420IA (Toshiba Exceria Pro M501 microSDXC 64GB) | |
| Lenovo IdeaPad 3 14IIL05 (Toshiba Exceria Pro SDXC 64 GB UHS-II) | |
| Asus ZenBook Flip 14 UX463FA-AI039T (Toshiba Exceria Pro M501 microSDXC 64GB) | |
| Networking | |
| iperf3 transmit AX12 | |
| Lenovo Yoga C740-14IML | |
| Honor Magicbook 14 | |
| Acer Swift 3 SF314-42-R27B | |
| Asus VivoBook Flip 14 TM420IA | |
| iperf3 receive AX12 | |
| Lenovo Yoga C740-14IML | |
| Acer Swift 3 SF314-42-R27B | |
| Honor Magicbook 14 | |
| Asus VivoBook Flip 14 TM420IA | |


| |||||||||||||||||||||||||
Brightness Distribution: 88 %
Center on Battery: 272.5 cd/m²
Contrast: 649:1 (Black: 0.42 cd/m²)
ΔE ColorChecker Calman: 4.65 | ∀{0.5-29.43 Ø4.72}
calibrated: 4.34
ΔE Greyscale Calman: 4.4 | ∀{0.09-98 Ø4.97}
59.8% sRGB (Argyll 1.6.3 3D)
38.4% AdobeRGB 1998 (Argyll 1.6.3 3D)
41.81% AdobeRGB 1998 (Argyll 3D)
60% sRGB (Argyll 3D)
40.47% Display P3 (Argyll 3D)
Gamma: 2.2
CCT: 6984 K
| Asus VivoBook Flip 14 TM420IA BOE NV140FHM-N49, IPS, 14", 1920x1080 | Lenovo ThinkPad X1 Yoga 2020-20UCS03S00 LP140WF9-SPE1, IPS LED, 14", 1920x1080 | Lenovo IdeaPad 3 14IIL05 LG Philips LP140WFA-SPD1, IPS, 14", 1920x1080 | Acer Swift 3 SF314-42-R27B AU Optronics B140HAN04.0, IPS, 14", 1920x1080 | Asus ZenBook Flip 14 UX463FA-AI039T AU AUO323D, IPS, 14", 1920x1080 | Honor Magicbook 14 BOE CQ TV140FHM-NH1, IPS, 14", 1920x1080 | |
|---|---|---|---|---|---|---|
| Display | 58% | -7% | -6% | 46% | 11% | |
| Display P3 Coverage (%) | 40.47 | 64.3 59% | 37.76 -7% | 37.78 -7% | 60.1 49% | 44.93 11% |
| sRGB Coverage (%) | 60 | 95.5 59% | 56.6 -6% | 56.8 -5% | 85.5 43% | 66.2 10% |
| AdobeRGB 1998 Coverage (%) | 41.81 | 65.6 57% | 39.05 -7% | 39.03 -7% | 61.1 46% | 46.42 11% |
| Response Times | -14% | 7% | -4% | 5% | -18% | |
| Response Time Grey 50% / Grey 80% * (ms) | 36.4 ? | 52 ? -43% | 39 ? -7% | 42 ? -15% | 36 ? 1% | 44.8 ? -23% |
| Response Time Black / White * (ms) | 30.4 ? | 25.6 ? 16% | 24 ? 21% | 28 ? 8% | 28 ? 8% | 34 ? -12% |
| PWM Frequency (Hz) | 5952 ? | |||||
| Screen | 52% | -4% | 13% | 34% | 26% | |
| Brightness middle (cd/m²) | 272.5 | 409 50% | 292 7% | 256 -6% | 280 3% | 311 14% |
| Brightness (cd/m²) | 260 | 405 56% | 260 0% | 237 -9% | 286 10% | 296 14% |
| Brightness Distribution (%) | 88 | 95 8% | 80 -9% | 81 -8% | 78 -11% | 92 5% |
| Black Level * (cd/m²) | 0.42 | 0.21 50% | 0.36 14% | 0.17 60% | 0.208 50% | 0.18 57% |
| Contrast (:1) | 649 | 1948 200% | 811 25% | 1506 132% | 1346 107% | 1728 166% |
| Colorchecker dE 2000 * | 4.65 | 4.9 -5% | 6.92 -49% | 5.43 -17% | 3.97 15% | 5.3 -14% |
| Colorchecker dE 2000 max. * | 17.78 | 8.4 53% | 19.36 -9% | 19.73 -11% | 8.29 53% | 18.5 -4% |
| Colorchecker dE 2000 calibrated * | 4.34 | 1.3 70% | 5.13 -18% | 4.8 -11% | 3.42 21% | 4.2 3% |
| Greyscale dE 2000 * | 4.4 | 5.8 -32% | 3.94 10% | 3.29 25% | 2.83 36% | 3.5 20% |
| Gamma | 2.2 100% | 2.53 87% | 2.83 78% | 2.52 87% | 2.34 94% | 2.1 105% |
| CCT | 6984 93% | 7009 93% | 6737 96% | 6840 95% | 6556 99% | 7078 92% |
| Color Space (Percent of AdobeRGB 1998) (%) | 38.4 | 60.7 58% | 36 -6% | 36 -6% | 56 46% | 42.5 11% |
| Color Space (Percent of sRGB) (%) | 59.8 | 95.3 59% | 56 -6% | 57 -5% | 85 42% | 65.8 10% |
| Total Average (Program / Settings) | 32% /
45% | -1% /
-3% | 1% /
7% | 28% /
32% | 6% /
17% |
* ... smaller is better
Display Response Times
| ↔ Response Time Black to White | ||
|---|---|---|
| 30.4 ms ... rise ↗ and fall ↘ combined | ↗ 18.8 ms rise | 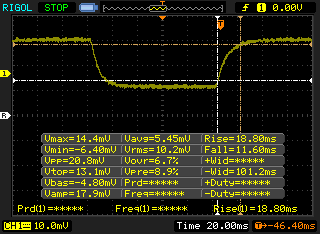 |
| ↘ 11.6 ms fall | ||
| The screen shows slow response rates in our tests and will be unsatisfactory for gamers. In comparison, all tested devices range from 0.1 (minimum) to 240 (maximum) ms. » 82 % of all devices are better. This means that the measured response time is worse than the average of all tested devices (19.8 ms). | ||
| ↔ Response Time 50% Grey to 80% Grey | ||
| 36.4 ms ... rise ↗ and fall ↘ combined | ↗ 18.8 ms rise | 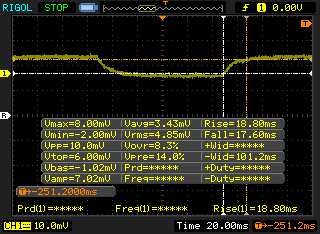 |
| ↘ 17.6 ms fall | ||
| The screen shows slow response rates in our tests and will be unsatisfactory for gamers. In comparison, all tested devices range from 0.165 (minimum) to 636 (maximum) ms. » 52 % of all devices are better. This means that the measured response time is worse than the average of all tested devices (31 ms). | ||
Screen Flickering / PWM (Pulse-Width Modulation)
| Screen flickering / PWM not detected | 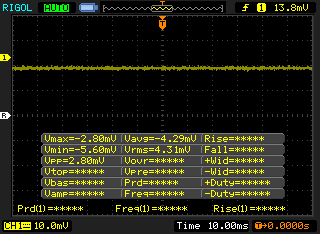 | ||
In comparison: 52 % of all tested devices do not use PWM to dim the display. If PWM was detected, an average of 7763 (minimum: 5 - maximum: 343500) Hz was measured. | |||
Performance
Cinebench R15: CPU Multi 64Bit | CPU Single 64Bit
Blender: v2.79 BMW27 CPU
7-Zip 18.03: 7z b 4 -mmt1 | 7z b 4
Geekbench 5.5: Single-Core | Multi-Core
HWBOT x265 Benchmark v2.2: 4k Preset
LibreOffice : 20 Documents To PDF
R Benchmark 2.5: Overall mean
| Blender / v2.79 BMW27 CPU | |
| Acer Swift 3 SF314-42-R27B | |
| Asus VivoBook 14 X403FA | |
| Asus VivoBook S14 S433FL | |
| Honor Magicbook 14 | |
| Lenovo IdeaPad 5 14ARE05 | |
| Dell XPS 13 7390 Core i7-10710U | |
| Average AMD Ryzen 7 4700U (407 - 537, n=8) | |
| Asus VivoBook Flip 14 TM420IA | |
| 7-Zip 18.03 / 7z b 4 -mmt1 | |
| Asus VivoBook S14 S433FL | |
| Dell XPS 13 7390 Core i7-10710U | |
| Asus VivoBook Flip 14 TM420IA | |
| Average AMD Ryzen 7 4700U (4208 - 4470, n=8) | |
| Lenovo IdeaPad 5 14ARE05 | |
| Asus VivoBook 14 X403FA | |
| Acer Swift 3 SF314-42-R27B | |
| Honor Magicbook 14 | |
| 7-Zip 18.03 / 7z b 4 | |
| Asus VivoBook Flip 14 TM420IA | |
| Average AMD Ryzen 7 4700U (26652 - 33890, n=8) | |
| Dell XPS 13 7390 Core i7-10710U | |
| Lenovo IdeaPad 5 14ARE05 | |
| Honor Magicbook 14 | |
| Asus VivoBook 14 X403FA | |
| Asus VivoBook S14 S433FL | |
| Acer Swift 3 SF314-42-R27B | |
| Geekbench 5.5 / Single-Core | |
| Asus VivoBook S14 S433FL | |
| Asus VivoBook Flip 14 TM420IA | |
| Average AMD Ryzen 7 4700U (1101 - 1168, n=8) | |
| Lenovo IdeaPad 5 14ARE05 | |
| Acer Swift 3 SF314-42-R27B | |
| Honor Magicbook 14 | |
| Geekbench 5.5 / Multi-Core | |
| Average AMD Ryzen 7 4700U (4792 - 6502, n=8) | |
| Asus VivoBook Flip 14 TM420IA | |
| Lenovo IdeaPad 5 14ARE05 | |
| Asus VivoBook S14 S433FL | |
| Acer Swift 3 SF314-42-R27B | |
| Honor Magicbook 14 | |
| HWBOT x265 Benchmark v2.2 / 4k Preset | |
| Asus VivoBook Flip 14 TM420IA | |
| Average AMD Ryzen 7 4700U (6.79 - 10.1, n=8) | |
| Lenovo IdeaPad 5 14ARE05 | |
| Dell XPS 13 7390 Core i7-10710U | |
| Asus VivoBook 14 X403FA | |
| Asus VivoBook S14 S433FL | |
| Acer Swift 3 SF314-42-R27B | |
| Honor Magicbook 14 | |
| LibreOffice / 20 Documents To PDF | |
| Average AMD Ryzen 7 4700U (55.5 - 115.7, n=8) | |
| Acer Swift 3 SF314-42-R27B | |
| Lenovo IdeaPad 5 14ARE05 | |
| Asus VivoBook Flip 14 TM420IA | |
| Asus VivoBook S14 S433FL | |
| R Benchmark 2.5 / Overall mean | |
| Honor Magicbook 14 | |
| Acer Swift 3 SF314-42-R27B | |
| Lenovo IdeaPad 5 14ARE05 | |
| Asus VivoBook S14 S433FL | |
| Average AMD Ryzen 7 4700U (0.598 - 0.651, n=8) | |
| Asus VivoBook Flip 14 TM420IA | |
* ... smaller is better
| PCMark 8 Home Score Accelerated v2 | 4208 points | |
| PCMark 8 Work Score Accelerated v2 | 5260 points | |
| PCMark 10 Score | 5214 points | |
Help | ||
| DPC Latencies / LatencyMon - interrupt to process latency (max), Web, Youtube, Prime95 | |
| Honor Magicbook 14 | |
| Acer Swift 3 SF314-42-R27B | |
| Lenovo IdeaPad 3 14IIL05 | |
| Asus VivoBook Flip 14 TM420IA | |
| Lenovo ThinkPad X1 Yoga 2020-20UCS03S00 | |
| Asus VivoBook S14 S433FL | |
| Asus ZenBook Flip 14 UX463FA-AI039T | |
* ... smaller is better
| Asus VivoBook Flip 14 TM420IA Samsung PM991 MZVLQ512HALU | Lenovo IdeaPad 3 14IIL05 WDC PC SN520 SDAPMUW-256G | Acer Swift 3 SF314-42-R27B SK hynix BC511 HFM256GDJTNI-82A0 | Asus ZenBook Flip 14 UX463FA-AI039T Kingston RBUSNS8154P3512GJ1 | Honor Magicbook 14 Samsung SSD PM981a MZVLB256HBHQ | |
|---|---|---|---|---|---|
| AS SSD | -15% | -11% | -22% | 18% | |
| Seq Read (MB/s) | 1397 | 1535 10% | 1682 20% | 1336 -4% | 2591 85% |
| Seq Write (MB/s) | 783 | 1215 55% | 931 19% | 653 -17% | 2133 172% |
| 4K Read (MB/s) | 48.08 | 35.93 -25% | 41.53 -14% | 26.65 -45% | 50 4% |
| 4K Write (MB/s) | 134.6 | 138.3 3% | 109.1 -19% | 52.7 -61% | 95.7 -29% |
| 4K-64 Read (MB/s) | 835 | 467.7 -44% | 603 -28% | 644 -23% | 607 -27% |
| 4K-64 Write (MB/s) | 734 | 399.6 -46% | 713 -3% | 482.9 -34% | 482.6 -34% |
| Access Time Read * (ms) | 0.081 | 0.104 -28% | 0.074 9% | 0.075 7% | |
| Access Time Write * (ms) | 0.084 | 0.029 65% | 0.035 58% | 0.072 14% | 0.034 60% |
| Score Read (Points) | 1022 | 657 -36% | 813 -20% | 804 -21% | 916 -10% |
| Score Write (Points) | 947 | 659 -30% | 915 -3% | 601 -37% | 792 -16% |
| Score Total (Points) | 2474 | 1647 -33% | 2118 -14% | 1786 -28% | 2168 -12% |
| Copy ISO MB/s (MB/s) | 1212 | 754 -38% | 692 -43% | ||
| Copy Program MB/s (MB/s) | 374.3 | 253.1 -32% | 226.5 -39% | ||
| Copy Game MB/s (MB/s) | 829 | 546 -34% | 391.5 -53% | ||
| CrystalDiskMark 5.2 / 6 | 7% | -12% | -29% | 34% | |
| Write 4K (MB/s) | 121.2 | 173.1 43% | 96.3 -21% | 54.6 -55% | 137.7 14% |
| Read 4K (MB/s) | 49.91 | 49.32 -1% | 35.06 -30% | 28.19 -44% | 42.49 -15% |
| Write Seq (MB/s) | 1090 | 1188 9% | 1001 -8% | 840 -23% | 2341 115% |
| Read Seq (MB/s) | 1533 | 1278 -17% | 1072 -30% | 905 -41% | 2436 59% |
| Write 4K Q32T1 (MB/s) | 393.3 | 457.4 16% | 423.9 8% | 409.5 4% | 261 -34% |
| Read 4K Q32T1 (MB/s) | 406 | 505 24% | 464.7 14% | 292.4 -28% | 335.4 -17% |
| Write Seq Q32T1 (MB/s) | 1225 | 1258 3% | 967 -21% | 1038 -15% | 2343 91% |
| Read Seq Q32T1 (MB/s) | 2277 | 1742 -23% | 2179 -4% | 1607 -29% | 3569 57% |
| Total Average (Program / Settings) | -4% /
-7% | -12% /
-11% | -26% /
-25% | 26% /
25% |
* ... smaller is better

Disk Throttling: DiskSpd Read Loop, Queue Depth 8
| 3DMark 11 Performance | 5105 points | |
| 3DMark Cloud Gate Standard Score | 17487 points | |
| 3DMark Fire Strike Score | 2760 points | |
| 3DMark Time Spy Score | 1028 points | |
Help | ||
| Final Fantasy XV Benchmark - 1280x720 Lite Quality | |
| Asus VivoBook Flip 14 TM420IA | |
| Beelink GTR35 II-G-16512D00W64PRO-1T | |
| Xiaomi RedmiBook 16 R5 | |
| Huawei MateBook D 15-53010TUY | |
| Asus ZenBook 14 UM431DA-AM020T | |
| HP 14s-dq1431ng | |
| Lenovo ThinkPad X13-20T20033GE | |
| low | med. | high | ultra | |
|---|---|---|---|---|
| The Witcher 3 (2015) | 61.4 | 38.6 | 20.2 | 13.2 |
| Dota 2 Reborn (2015) | 93.9 | 70.3 | 44.5 | 41.5 |
| Final Fantasy XV Benchmark (2018) | 30.2 | 15.2 | 9.86 | |
| X-Plane 11.11 (2018) | 40.6 | 32.5 | 28.6 |
| Asus VivoBook Flip 14 TM420IA Vega 7, R7 4700U, Samsung PM991 MZVLQ512HALU | Lenovo IdeaPad 3 14IIL05 UHD Graphics G1 (Ice Lake 32 EU), i3-1005G1, WDC PC SN520 SDAPMUW-256G | Acer Swift 3 SF314-42-R27B Vega 5, R3 4300U, SK hynix BC511 HFM256GDJTNI-82A0 | Asus ZenBook Flip 14 UX463FA-AI039T UHD Graphics 620, i5-10210U, Kingston RBUSNS8154P3512GJ1 | Honor Magicbook 14 Vega 8, R5 3500U, Samsung SSD PM981a MZVLB256HBHQ | Asus VivoBook S14 S433FL GeForce MX250, i7-10510U, Intel Optane Memory H10 with Solid State Storage 32GB + 512GB HBRPEKNX0202A(L/H) | |
|---|---|---|---|---|---|---|
| Noise | -4% | -5% | -1% | -2% | -12% | |
| off / environment * (dB) | 27.1 | 30.7 -13% | 30.3 -12% | 30.1 -11% | 29.6 -9% | 30.7 -13% |
| Idle Minimum * (dB) | 27.1 | 30.7 -13% | 30.3 -12% | 30.1 -11% | 29.6 -9% | 31 -14% |
| Idle Average * (dB) | 27.1 | 30.7 -13% | 30.3 -12% | 30.1 -11% | 29.6 -9% | 31 -14% |
| Idle Maximum * (dB) | 27.1 | 30.7 -13% | 30.3 -12% | 30.1 -11% | 29.6 -9% | 31.3 -15% |
| Load Average * (dB) | 35 | 31.6 10% | 32.6 7% | 30.1 14% | 30.8 12% | 43.4 -24% |
| Witcher 3 ultra * (dB) | 41.3 | 42.8 -4% | ||||
| Load Maximum * (dB) | 41.3 | 33.6 19% | 35.6 14% | 32.02 22% | 35.3 15% | 41.5 -0% |
* ... smaller is better
Noise level
| Idle |
| 27.1 / 27.1 / 27.1 dB(A) |
| Load |
| 35 / 41.3 dB(A) |
 | ||
30 dB silent 40 dB(A) audible 50 dB(A) loud |
||
min: | ||
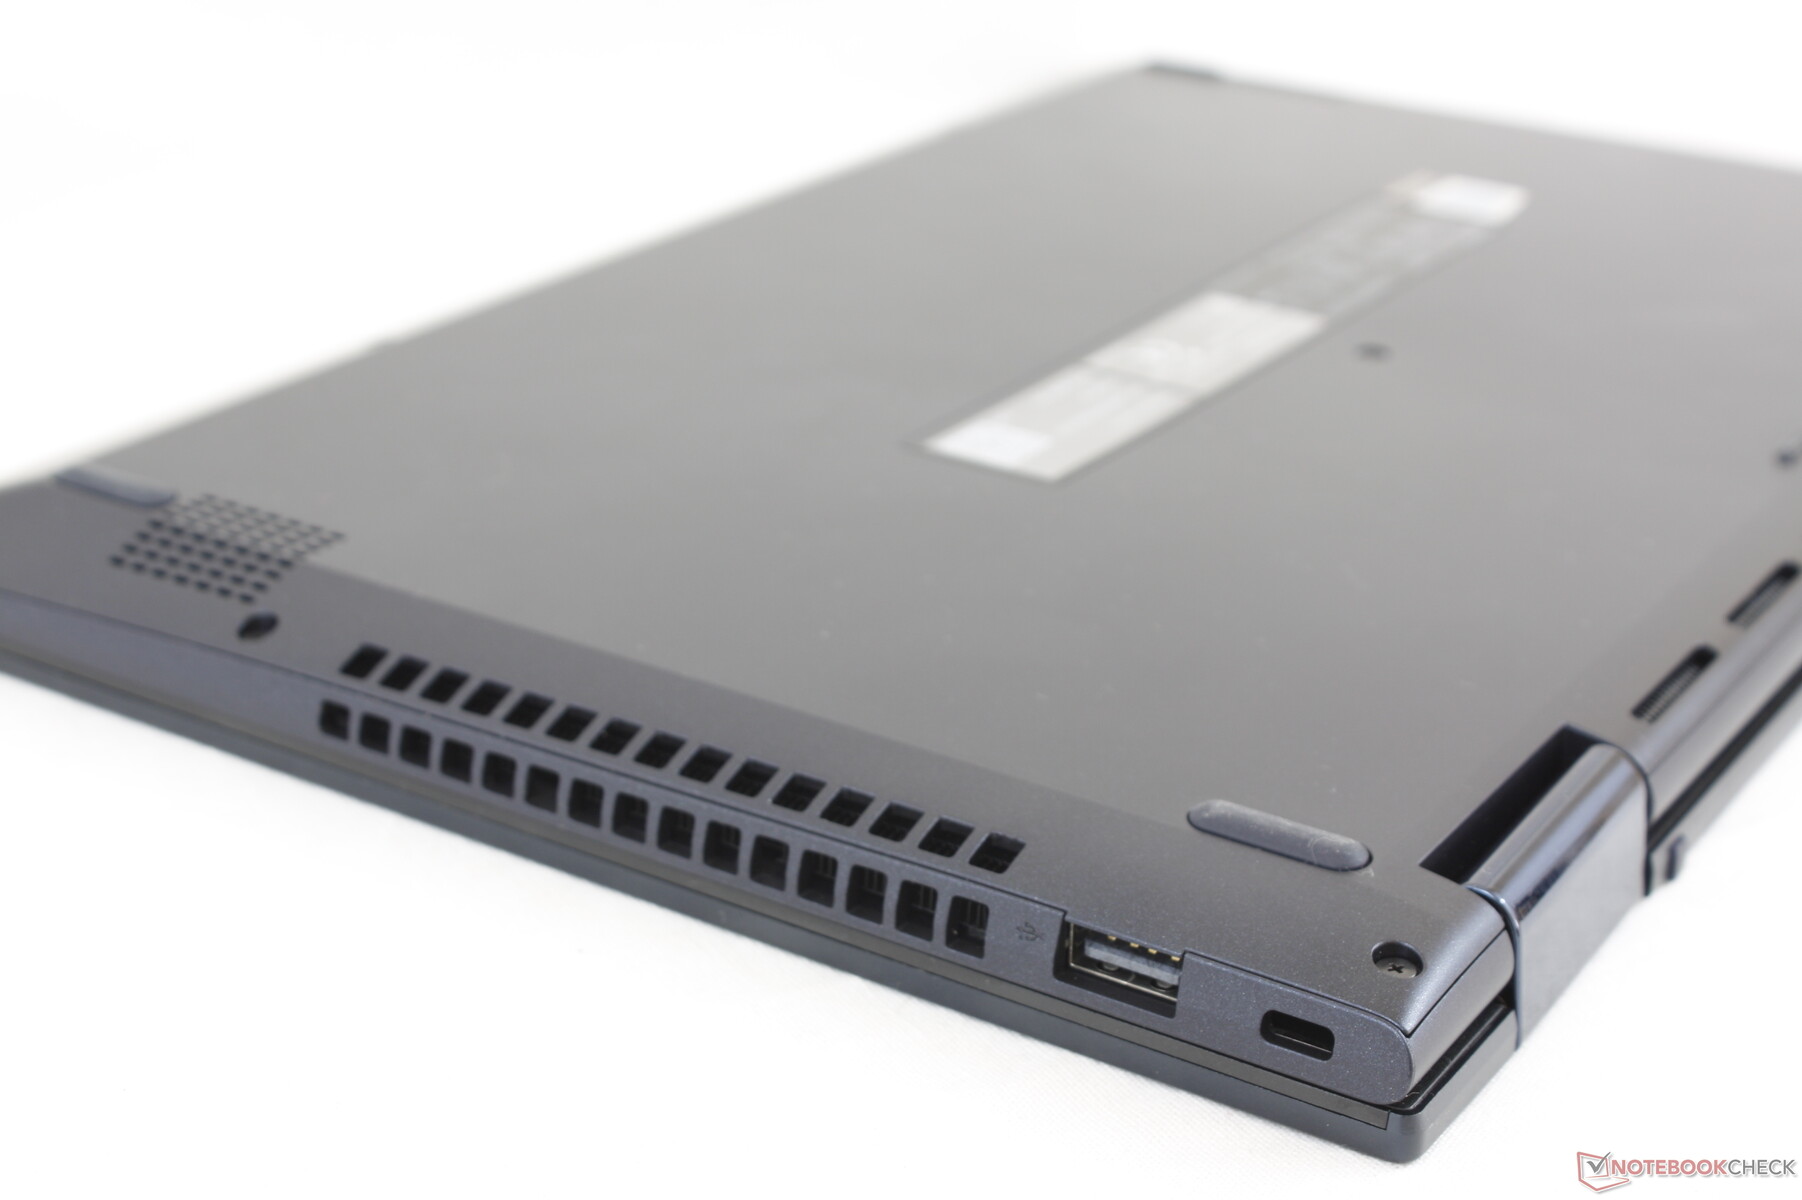
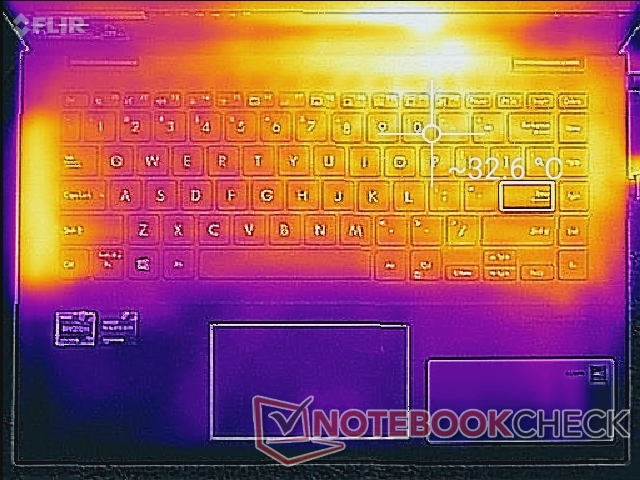
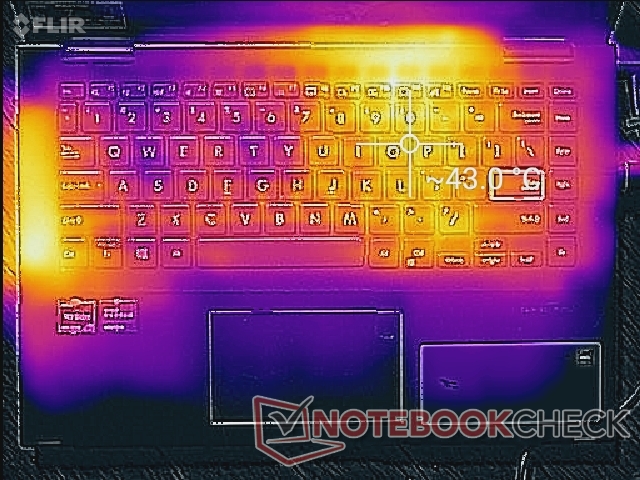
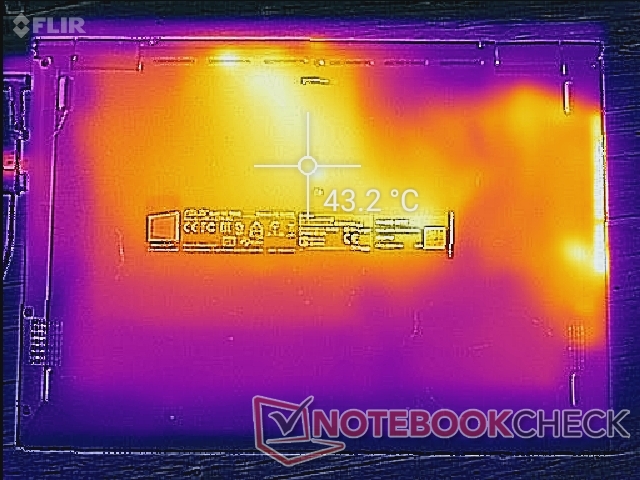
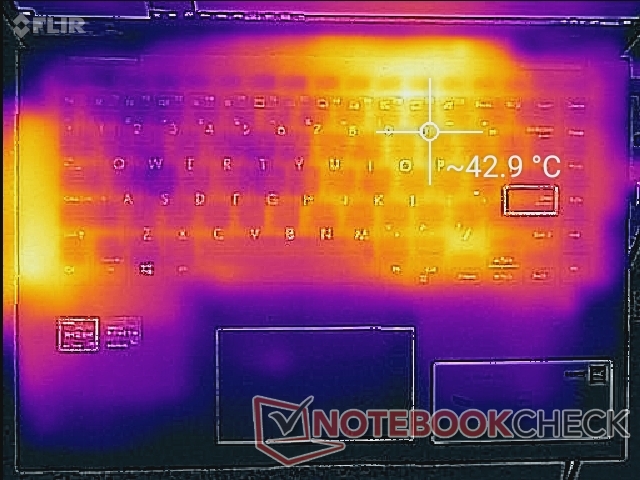
(±) The maximum temperature on the upper side is 44.6 °C / 112 F, compared to the average of 35.4 °C / 96 F, ranging from 19.6 to 60 °C for the class Convertible.
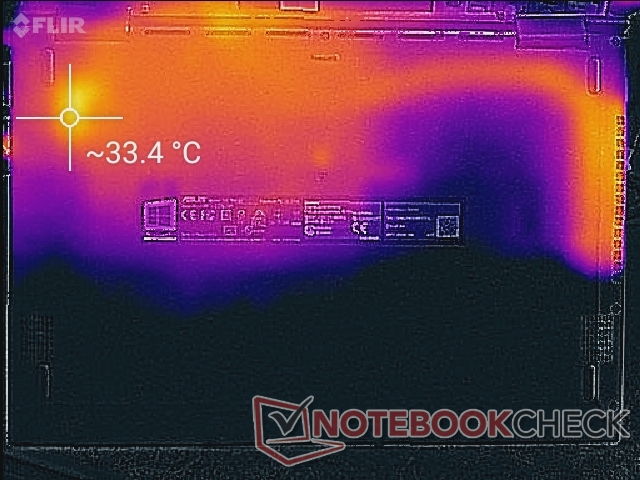
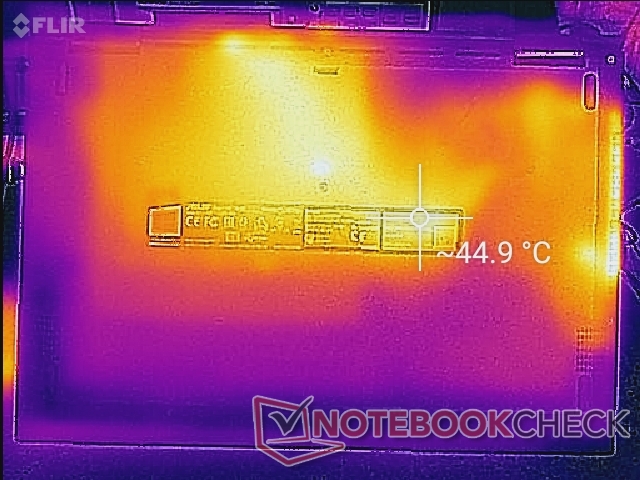
(-) The bottom heats up to a maximum of 46 °C / 115 F, compared to the average of 36.9 °C / 98 F
(+) In idle usage, the average temperature for the upper side is 31 °C / 88 F, compared to the device average of 30.3 °C / 87 F.
(±) Playing The Witcher 3, the average temperature for the upper side is 36.3 °C / 97 F, compared to the device average of 30.3 °C / 87 F.
(+) The palmrests and touchpad are cooler than skin temperature with a maximum of 30.6 °C / 87.1 F and are therefore cool to the touch.
(-) The average temperature of the palmrest area of similar devices was 28 °C / 82.4 F (-2.6 °C / -4.7 F).
| CPU Clock (GHz) | GPU Clock (MHz) | Average CPU Temperature (°C) | |
| System Idle | -- | -- | 37 |
| Prime95 Stress | 2.9 | -- | 69 |
| Prime95 + FurMark Stress | 2.0 - 2.8 | 550 - 860 | 65 |
| Witcher 3 Stress | 1.4 | 1462 | 61 |
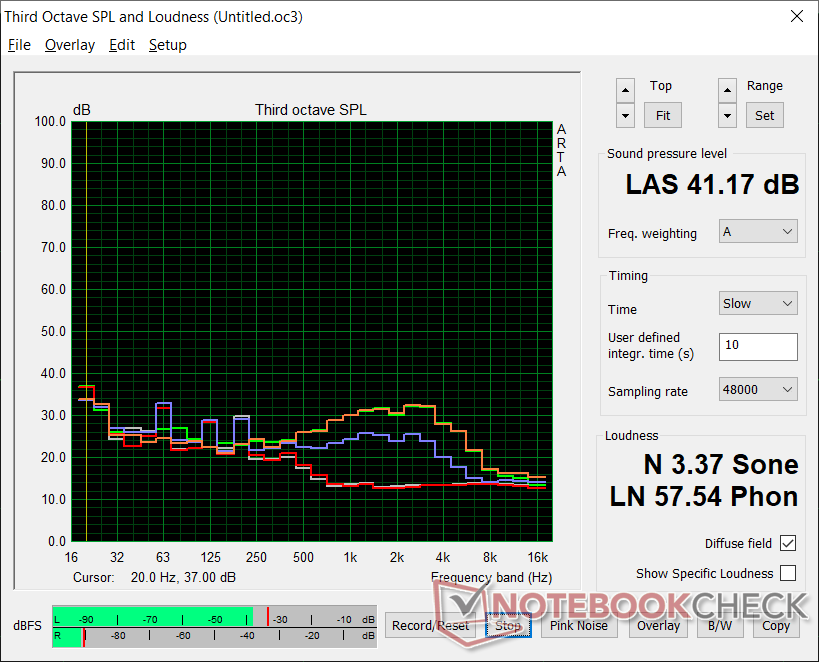
Asus VivoBook Flip 14 TM420IA audio analysis
(±) | speaker loudness is average but good (79.2 dB)
Bass 100 - 315 Hz
(±) | reduced bass - on average 13.1% lower than median
(±) | linearity of bass is average (9.8% delta to prev. frequency)
Mids 400 - 2000 Hz
(+) | balanced mids - only 1.8% away from median
(+) | mids are linear (4.5% delta to prev. frequency)
Highs 2 - 16 kHz
(+) | balanced highs - only 3% away from median
(+) | highs are linear (2.9% delta to prev. frequency)
Overall 100 - 16.000 Hz
(+) | overall sound is linear (11.5% difference to median)
Compared to same class
» 9% of all tested devices in this class were better, 3% similar, 88% worse
» The best had a delta of 6%, average was 20%, worst was 57%
Compared to all devices tested
» 8% of all tested devices were better, 2% similar, 90% worse
» The best had a delta of 4%, average was 24%, worst was 134%
Apple MacBook 12 (Early 2016) 1.1 GHz audio analysis
(+) | speakers can play relatively loud (83.6 dB)
Bass 100 - 315 Hz
(±) | reduced bass - on average 11.3% lower than median
(±) | linearity of bass is average (14.2% delta to prev. frequency)
Mids 400 - 2000 Hz
(+) | balanced mids - only 2.4% away from median
(+) | mids are linear (5.5% delta to prev. frequency)
Highs 2 - 16 kHz
(+) | balanced highs - only 2% away from median
(+) | highs are linear (4.5% delta to prev. frequency)
Overall 100 - 16.000 Hz
(+) | overall sound is linear (10.2% difference to median)
Compared to same class
» 7% of all tested devices in this class were better, 2% similar, 91% worse
» The best had a delta of 5%, average was 18%, worst was 53%
Compared to all devices tested
» 5% of all tested devices were better, 1% similar, 94% worse
» The best had a delta of 4%, average was 24%, worst was 134%
| Off / Standby | |
| Idle | |
| Load |
|
Key:
min: | |
| Asus VivoBook Flip 14 TM420IA R7 4700U, Vega 7, Samsung PM991 MZVLQ512HALU, IPS, 1920x1080, 14" | Lenovo IdeaPad 3 14IIL05 i3-1005G1, UHD Graphics G1 (Ice Lake 32 EU), WDC PC SN520 SDAPMUW-256G, IPS, 1920x1080, 14" | Acer Swift 3 SF314-42-R27B R3 4300U, Vega 5, SK hynix BC511 HFM256GDJTNI-82A0, IPS, 1920x1080, 14" | Asus ZenBook Flip 14 UX463FA-AI039T i5-10210U, UHD Graphics 620, Kingston RBUSNS8154P3512GJ1, IPS, 1920x1080, 14" | Honor Magicbook 14 R5 3500U, Vega 8, Samsung SSD PM981a MZVLB256HBHQ, IPS, 1920x1080, 14" | Asus VivoBook S14 S433FL i7-10510U, GeForce MX250, Intel Optane Memory H10 with Solid State Storage 32GB + 512GB HBRPEKNX0202A(L/H), IPS, 1920x1080, 14" | |
|---|---|---|---|---|---|---|
| Power Consumption | 4% | 13% | -15% | -21% | -16% | |
| Idle Minimum * (Watt) | 4 | 3.2 20% | 3.7 7% | 3.6 10% | 5.2 -30% | 2.4 40% |
| Idle Average * (Watt) | 6.4 | 6.2 3% | 5.6 13% | 7.5 -17% | 7.7 -20% | 4.2 34% |
| Idle Maximum * (Watt) | 7 | 7.2 -3% | 7.8 -11% | 9.4 -34% | 9.3 -33% | 7.8 -11% |
| Load Average * (Watt) | 34.6 | 30 13% | 26.4 24% | 42 -21% | 40.3 -16% | 57 -65% |
| Witcher 3 ultra * (Watt) | 35 | 52 -49% | ||||
| Load Maximum * (Watt) | 45.1 | 50 -11% | 31.4 30% | 51 -13% | 48 -6% | 64 -42% |
* ... smaller is better
| Asus VivoBook Flip 14 TM420IA R7 4700U, Vega 7, 42 Wh | Lenovo IdeaPad 3 14IIL05 i3-1005G1, UHD Graphics G1 (Ice Lake 32 EU), 35 Wh | Acer Swift 3 SF314-42-R27B R3 4300U, Vega 5, 48.85 Wh | Asus ZenBook Flip 14 UX463FA-AI039T i5-10210U, UHD Graphics 620, 50 Wh | Honor Magicbook 14 R5 3500U, Vega 8, 56 Wh | Asus VivoBook S14 S433FL i7-10510U, GeForce MX250, 50 Wh | |
|---|---|---|---|---|---|---|
| Battery runtime | -25% | 51% | -4% | 19% | 8% | |
| WiFi v1.3 (h) | 8 | 6 -25% | 12.1 51% | 7.7 -4% | 9.5 19% | 8.6 8% |
| Load (h) | 1.7 |
Pros
Cons
总结
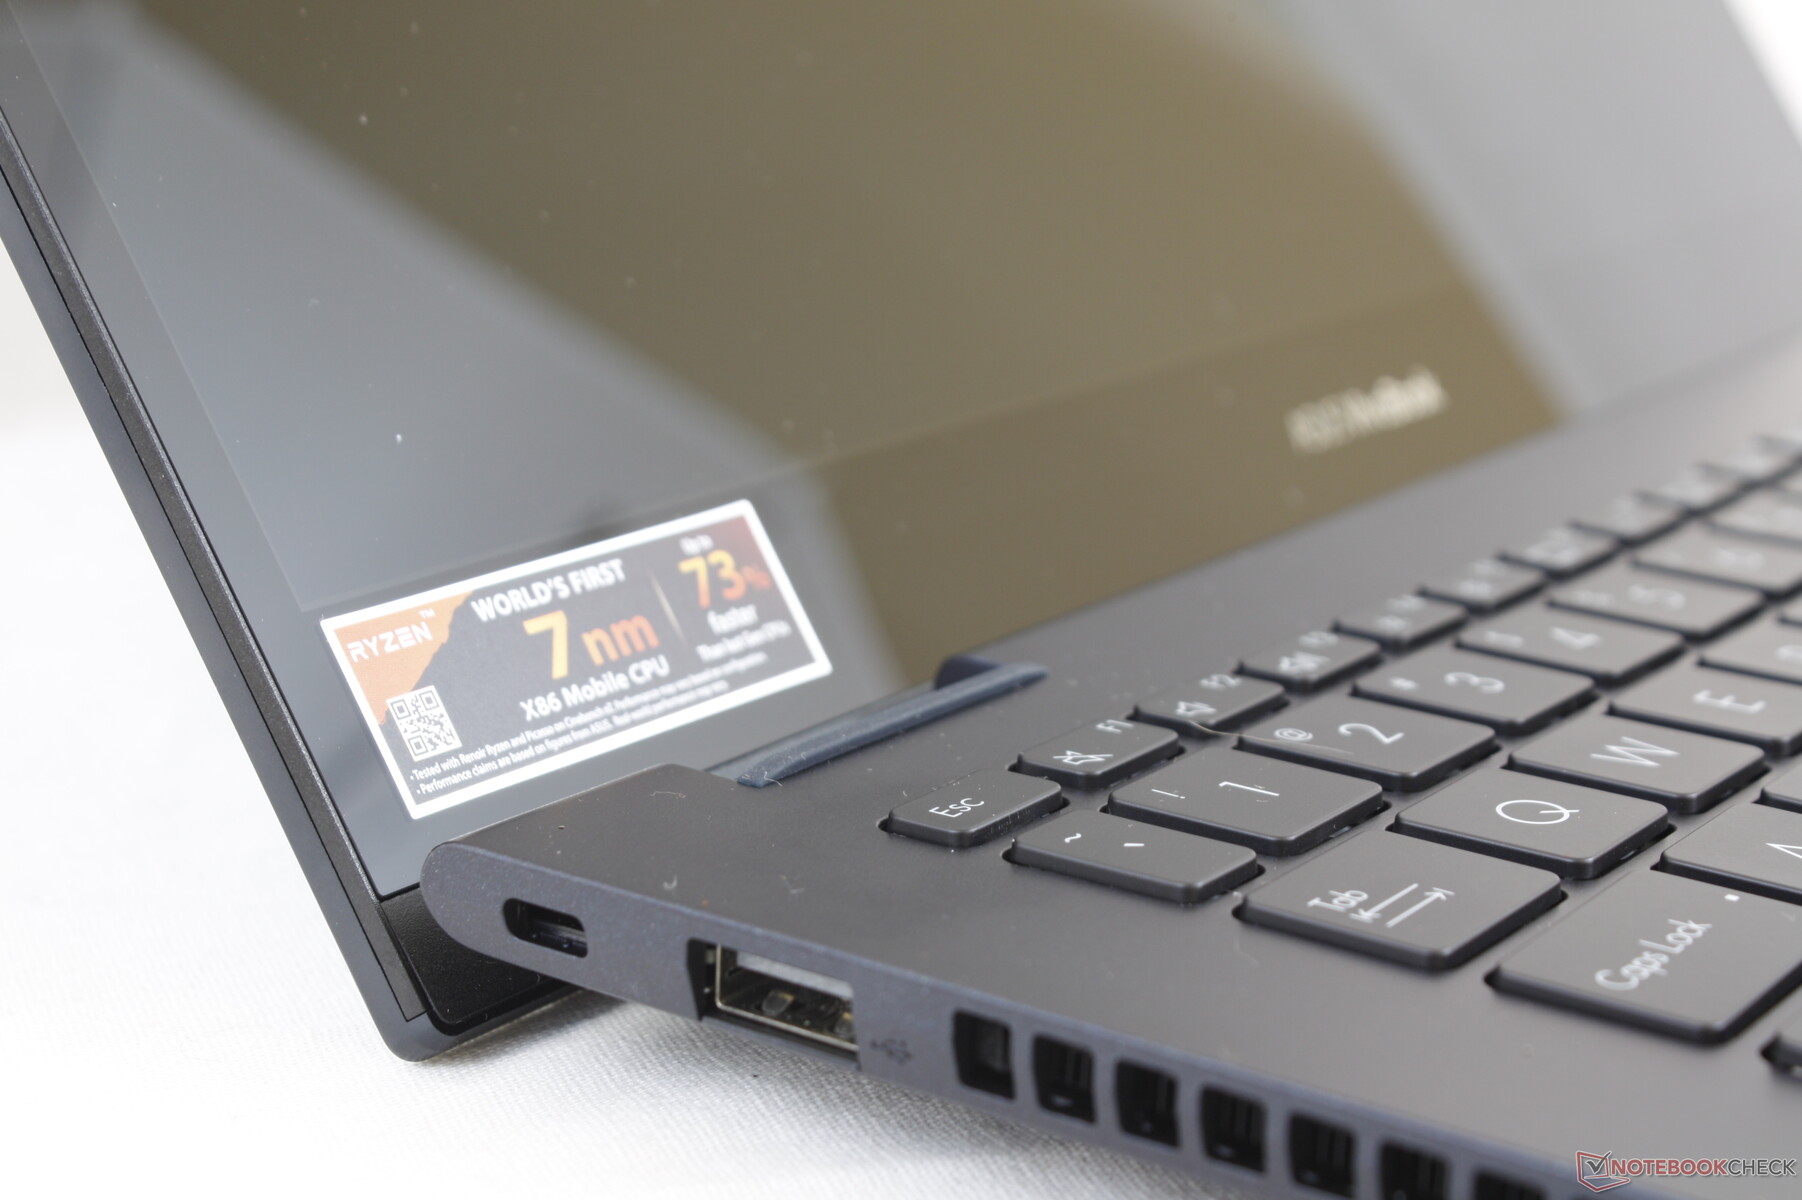
配备AMD处理器的2020 VivoBook Flip发布在了一个很好的时间点。就性能而言,英特尔的第10代Ice Lake和Comet Lake-U平台已经与Zen 2系列相比已经过时,而AMD笔记本电脑的起步价普遍较低,这使得Core i7替代产品目前吸引力不大。英特尔计划在今年晚些时候Tiger Lake上市时恢复一些失去的势头,但是AMD笔记本电脑(如我们的VivoBook)将在此之前统治。
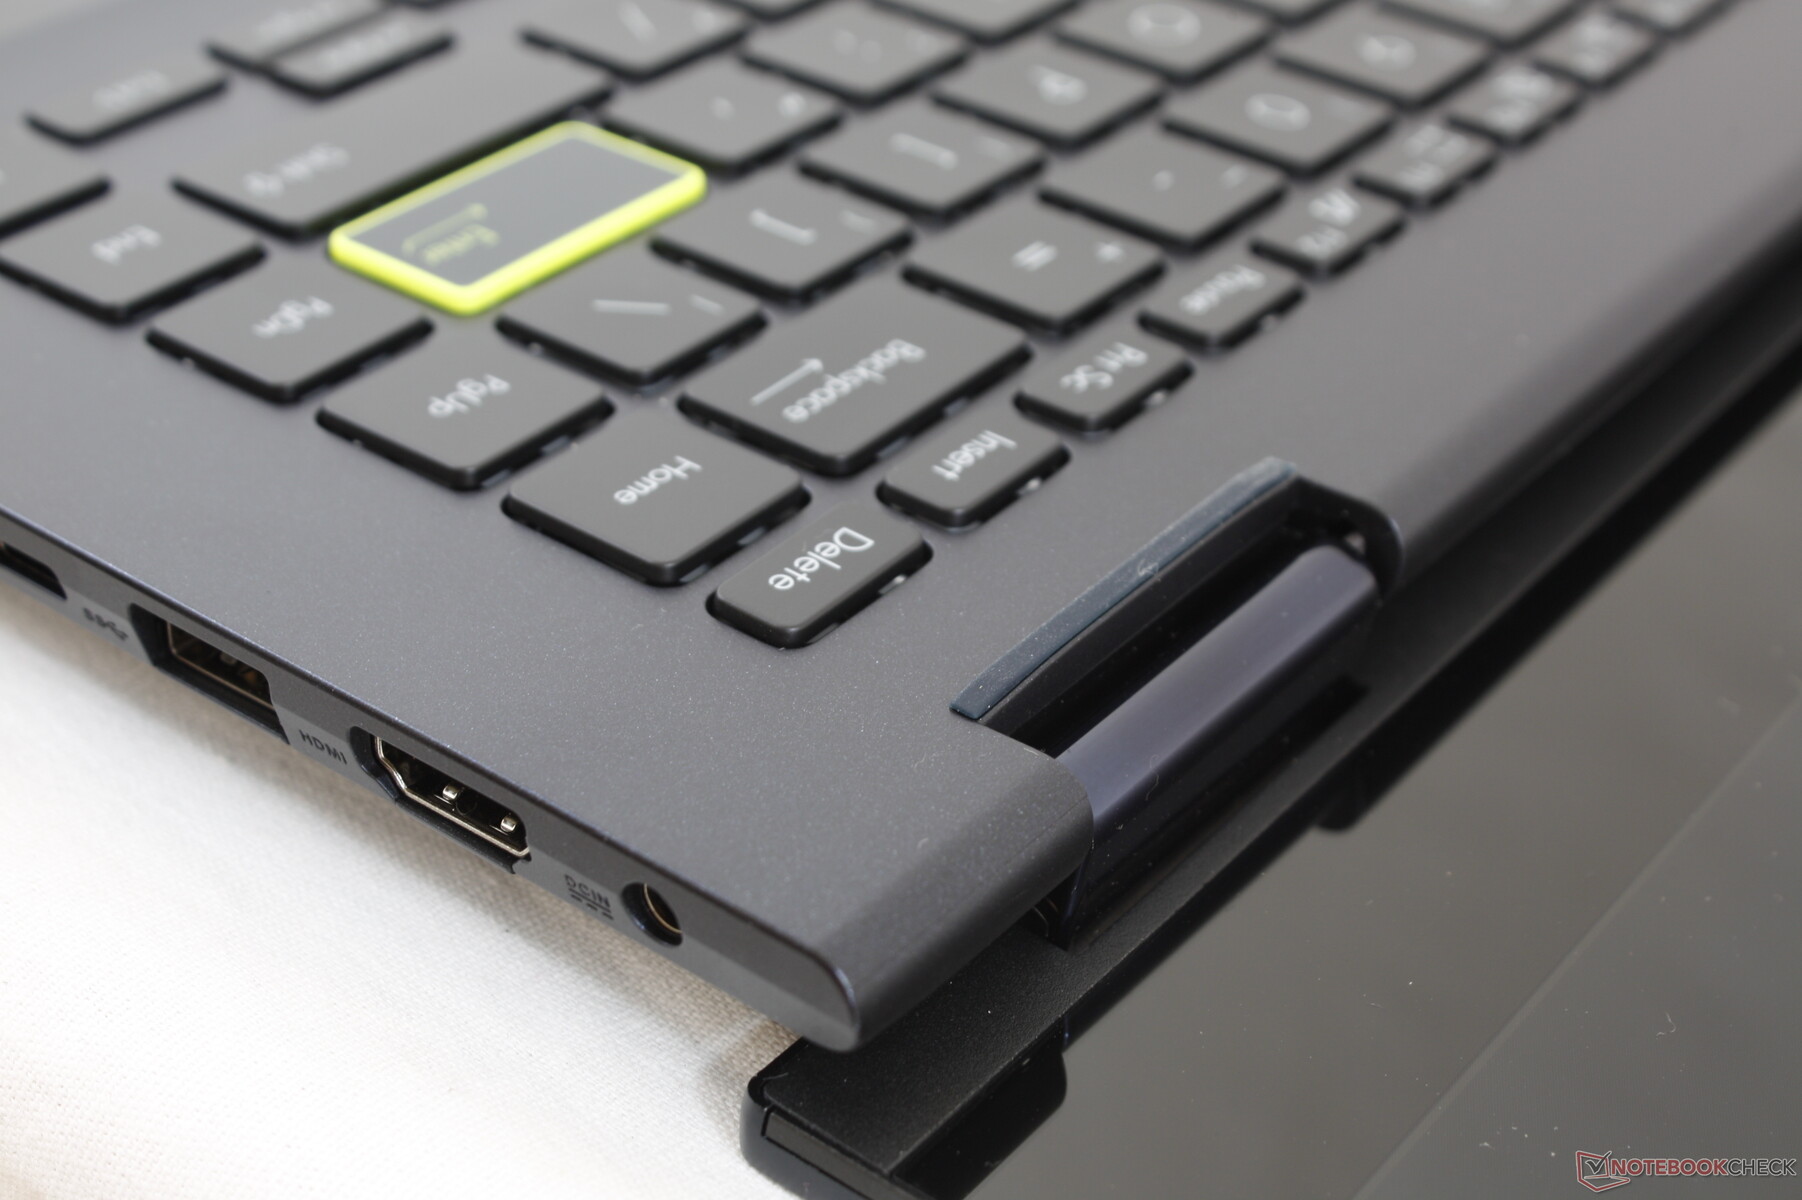
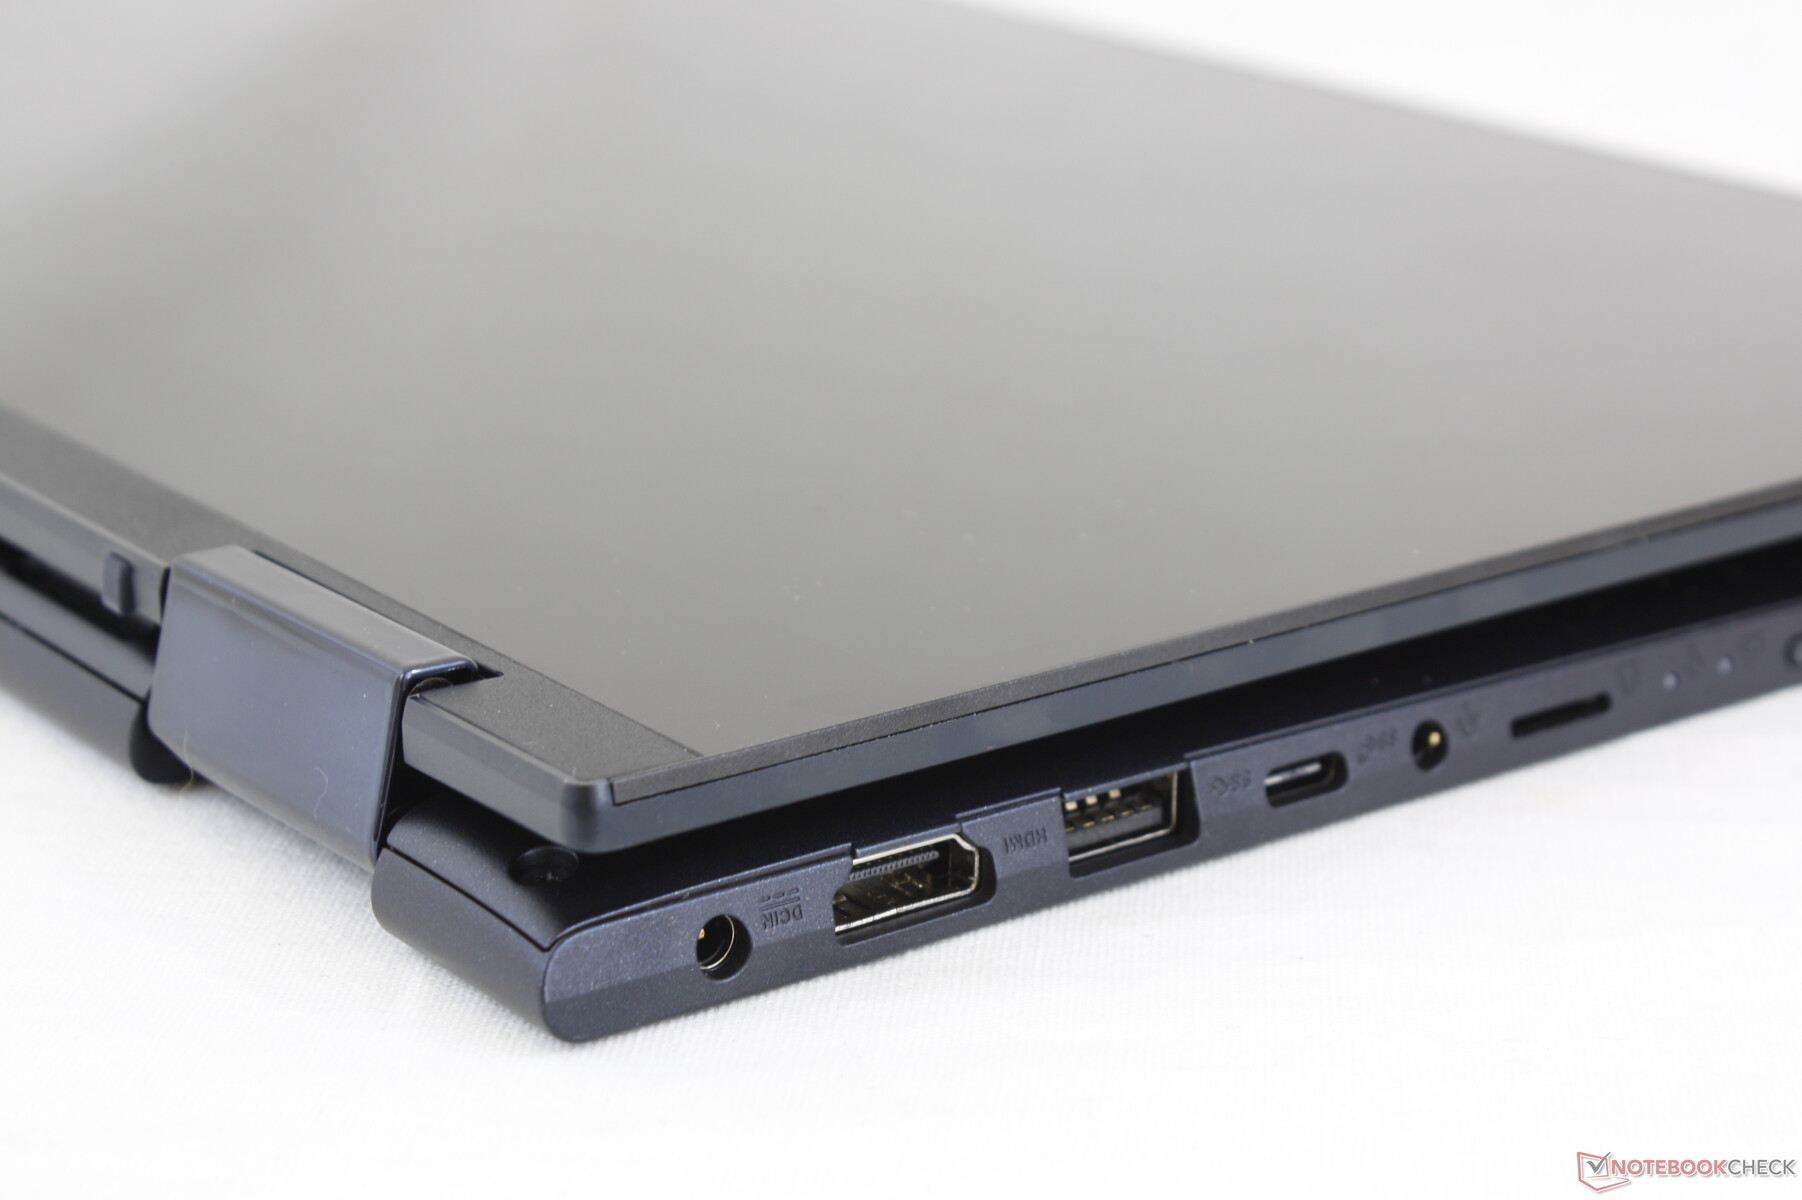
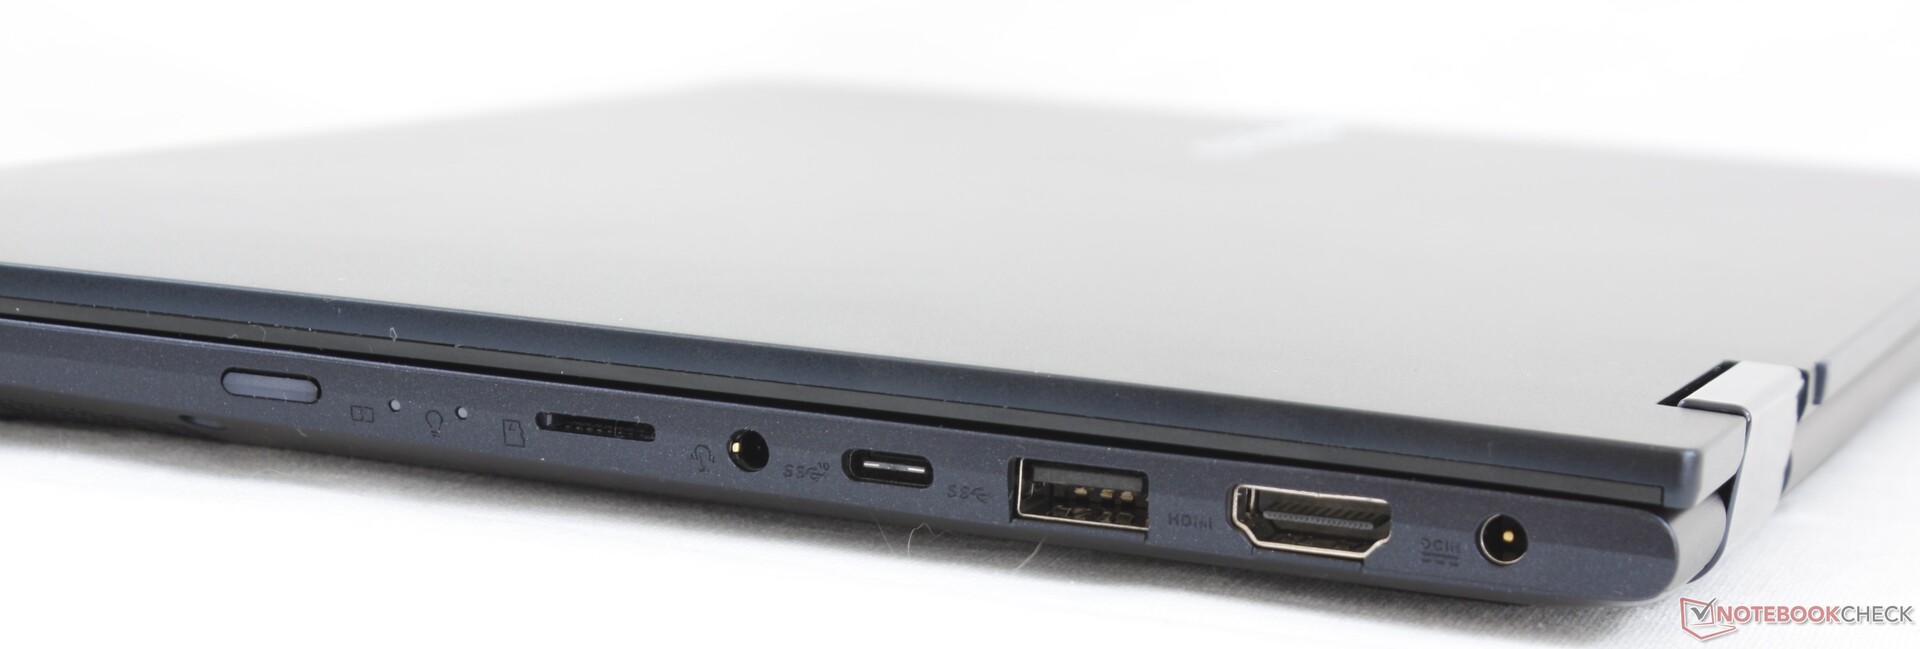
至于笔记本电脑本身,尽管价格不贵,但根本没有性能上的减少。相反,只是硬件将缺少一些高级功能,例如Thunderbolt 3,USB-C充电,Wi-Fi 6和红外摄像头。与ZenBook系列产品相比,它最大的偷工减料是屏幕较窄的色域。否则,这是一款高性能的廉价笔记本电脑,适合学生,家庭多媒体使用和偶尔旅行。
一款便宜的翻转本,在其尺寸类别中比大多数其他竞品性能更强,但价格却便宜不少。除了中等水平的显示效果外,几乎所有方面都高于平均水平。
Asus VivoBook Flip 14 TM420IA
- 08/20/2020 v7 (old)
Allen Ngo
Price comparison

