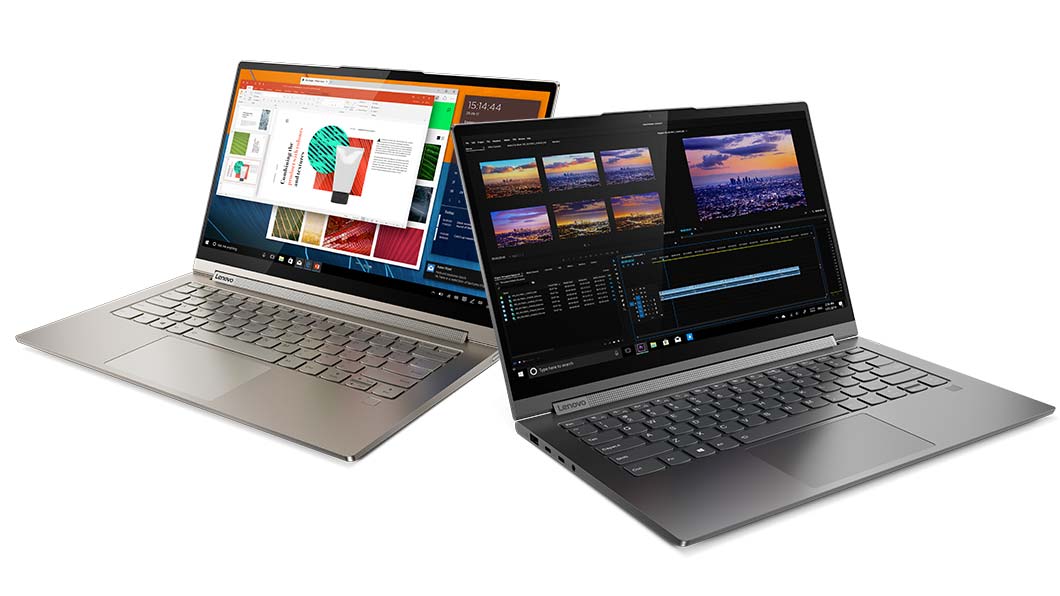
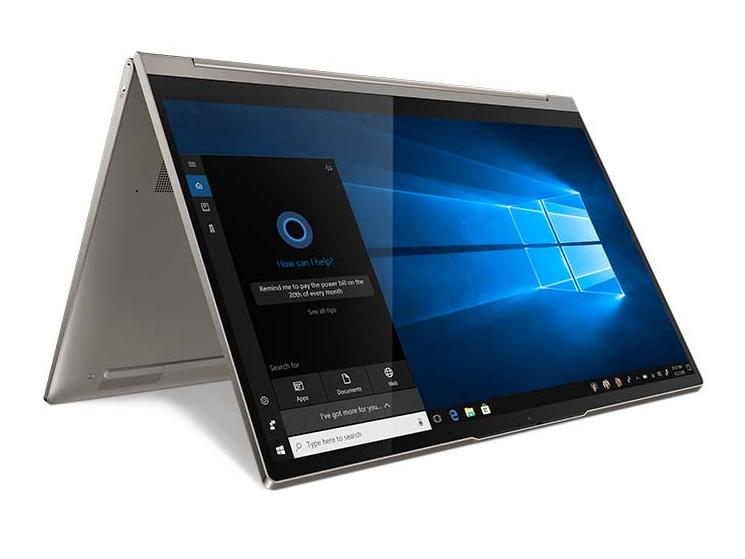
联想Yoga C940-14IIL笔记本电脑评测:有力的14英寸翻转本竞争者
Rating | Date | Model | Weight | Height | Size | Resolution | Price |
|---|---|---|---|---|---|---|---|
| 87 % v7 (old) | 02 / 2020 | Lenovo Yoga C940-14IIL 81Q9 i7-1065G7, Iris Plus Graphics G7 (Ice Lake 64 EU) | 1.4 kg | 15.7 mm | 14.00" | 3840x2160 | |
| 86.3 % v7 (old) | 01 / 2020 | Dell XPS 13 7390 2-in-1 Core i7 i7-1065G7, Iris Plus Graphics G7 (Ice Lake 64 EU) | 1.3 kg | 13 mm | 13.40" | 1920x1200 | |
| 87.6 % v6 (old) | 03 / 2018 | Huawei Matebook X Pro i5 i5-8250U, GeForce MX150 | 1.3 kg | 14.6 mm | 13.90" | 3000x2000 | |
| 85.2 % v7 (old) | 11 / 2019 | MSI Prestige 15 A10SC i7-10710U, GeForce GTX 1650 Max-Q | 1.7 kg | 16 mm | 15.60" | 3840x2160 | |
| 86.3 % v7 (old) | 02 / 2020 | Razer Blade Stealth i7-1065G7 Iris Plus i7-1065G7, Iris Plus Graphics G7 (Ice Lake 64 EU) | 1.4 kg | 15.3 mm | 13.30" | 1920x1080 |
| Networking | |
| iperf3 transmit AX12 | |
| MSI Prestige 15 A10SC | |
| Lenovo Yoga C930-13IKB 81C4 | |
| Asus ZenBook S13 UX392FN | |
| iperf3 receive AX12 | |
| MSI Prestige 15 A10SC | |
| Asus ZenBook S13 UX392FN | |
| Lenovo Yoga C930-13IKB 81C4 | |
| |||||||||||||||||||||||||
Brightness Distribution: 82 %
Center on Battery: 501.7 cd/m²
Contrast: 1568:1 (Black: 0.32 cd/m²)
ΔE ColorChecker Calman: 5.48 | ∀{0.5-29.43 Ø4.73}
calibrated: 2.22
ΔE Greyscale Calman: 8.1 | ∀{0.09-98 Ø4.97}
100% sRGB (Argyll 1.6.3 3D)
74.1% AdobeRGB 1998 (Argyll 1.6.3 3D)
83.3% AdobeRGB 1998 (Argyll 3D)
99.9% sRGB (Argyll 3D)
83.8% Display P3 (Argyll 3D)
Gamma: 2.07
CCT: 6730 K
| Lenovo Yoga C940-14IIL 81Q9 BOE HF NV140QUM-N54, IPS, 14", 3840x2160 | Lenovo Yoga C930-13IKB 81C4 AUO B139HAN03_0, IPS, 13.9", 1920x1080 | Lenovo Yoga C940-14IIL LP140WF9-SPE2, IPS LED, 14", 1920x1080 | Dell XPS 13 7390 2-in-1 Core i7 Sharp LQ134N1, IPS, 13.4", 1920x1200 | Razer Blade Stealth i7-1065G7 Iris Plus Sharp LQ133M1JW41, IPS, 13.3", 1920x1080 | Asus ZenBook S13 UX392FN Tianma XM, IPS, 13.9", 1920x1080 | |
|---|---|---|---|---|---|---|
| Display | -18% | -14% | -11% | -14% | -13% | |
| Display P3 Coverage (%) | 83.8 | 62.7 -25% | 66 -21% | 69.9 -17% | 66.2 -21% | 67.5 -19% |
| sRGB Coverage (%) | 99.9 | 92.6 -7% | 97.9 -2% | 99.2 -1% | 97.2 -3% | 95.8 -4% |
| AdobeRGB 1998 Coverage (%) | 83.3 | 64.7 -22% | 67.3 -19% | 71.5 -14% | 67.1 -19% | 69 -17% |
| Response Times | 15% | -11% | -7% | -12% | 2% | |
| Response Time Grey 50% / Grey 80% * (ms) | 44.4 ? | 34.4 ? 23% | 49.6 ? -12% | 47.6 ? -7% | 45.2 ? -2% | 47.2 ? -6% |
| Response Time Black / White * (ms) | 27.2 ? | 25.6 ? 6% | 30 ? -10% | 29.2 ? -7% | 33.2 ? -22% | 24.8 ? 9% |
| PWM Frequency (Hz) | 2500 ? | 22730 ? | ||||
| Screen | -25% | 19% | 19% | 20% | 16% | |
| Brightness middle (cd/m²) | 501.7 | 312 -38% | 384 -23% | 549.8 10% | 422.6 -16% | 466 -7% |
| Brightness (cd/m²) | 501 | 295 -41% | 363 -28% | 520 4% | 404 -19% | 462 -8% |
| Brightness Distribution (%) | 82 | 87 6% | 90 10% | 86 5% | 87 6% | 90 10% |
| Black Level * (cd/m²) | 0.32 | 0.43 -34% | 0.17 47% | 0.39 -22% | 0.35 -9% | 0.33 -3% |
| Contrast (:1) | 1568 | 726 -54% | 2259 44% | 1410 -10% | 1207 -23% | 1412 -10% |
| Colorchecker dE 2000 * | 5.48 | 7.6 -39% | 3.5 36% | 2.12 61% | 1.02 81% | 1.93 65% |
| Colorchecker dE 2000 max. * | 10.03 | 15.06 -50% | 5.5 45% | 3.66 64% | 3.06 69% | 4.26 58% |
| Colorchecker dE 2000 calibrated * | 2.22 | 1.96 12% | 1 55% | 1.37 38% | 0.95 57% | 1.99 10% |
| Greyscale dE 2000 * | 8.1 | 8.8 -9% | 4.6 43% | 2.6 68% | 1 88% | 1.7 79% |
| Gamma | 2.07 106% | 2.01 109% | 2.32 95% | 2.3 96% | 2.21 100% | 2.15 102% |
| CCT | 6730 97% | 6874 95% | 6884 94% | 6884 94% | 6502 100% | 6382 102% |
| Color Space (Percent of AdobeRGB 1998) (%) | 74.1 | 59.1 -20% | 62 -16% | 65.4 -12% | 62.1 -16% | 62.2 -16% |
| Color Space (Percent of sRGB) (%) | 100 | 92.3 -8% | 97.7 -2% | 99.7 0% | 97.1 -3% | 95.7 -4% |
| Total Average (Program / Settings) | -9% /
-19% | -2% /
9% | 0% /
10% | -2% /
9% | 2% /
9% |
* ... smaller is better
Display Response Times
| ↔ Response Time Black to White | ||
|---|---|---|
| 27.2 ms ... rise ↗ and fall ↘ combined | ↗ 15.6 ms rise | 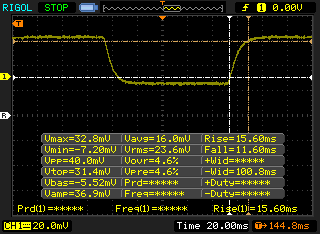 |
| ↘ 11.6 ms fall | ||
| The screen shows relatively slow response rates in our tests and may be too slow for gamers. In comparison, all tested devices range from 0.1 (minimum) to 240 (maximum) ms. » 69 % of all devices are better. This means that the measured response time is worse than the average of all tested devices (19.9 ms). | ||
| ↔ Response Time 50% Grey to 80% Grey | ||
| 44.4 ms ... rise ↗ and fall ↘ combined | ↗ 22.4 ms rise | 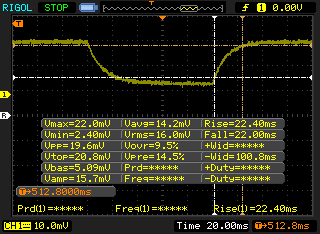 |
| ↘ 22 ms fall | ||
| The screen shows slow response rates in our tests and will be unsatisfactory for gamers. In comparison, all tested devices range from 0.165 (minimum) to 636 (maximum) ms. » 76 % of all devices are better. This means that the measured response time is worse than the average of all tested devices (31.1 ms). | ||
Screen Flickering / PWM (Pulse-Width Modulation)
| Screen flickering / PWM not detected | 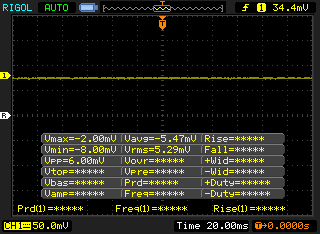 | ||
In comparison: 52 % of all tested devices do not use PWM to dim the display. If PWM was detected, an average of 7798 (minimum: 5 - maximum: 343500) Hz was measured. | |||
| Cinebench R20 | |
| CPU (Single Core) | |
| MSI Prestige 15 A10SC | |
| Lenovo Yoga C940-14IIL 81Q9 | |
| Average Intel Core i7-1065G7 (358 - 474, n=31) | |
| MSI PS63 Modern 8SC | |
| Lenovo Yoga C940-15IRH | |
| Lenovo Legion Y540-17IRH | |
| Dell G5 15 5590 | |
| Dell XPS 13 7390 2-in-1 Core i3 | |
| Lenovo ThinkPad L590-20Q70019GE | |
| Dynabook Portege A30-E-174 | |
| Dell Latitude 14 5495 | |
| Dell Latitude 13 3390 | |
| Dell Inspiron 15 5000 5585 | |
| CPU (Multi Core) | |
| Dell G5 15 5590 | |
| Lenovo Yoga C940-15IRH | |
| MSI Prestige 15 A10SC | |
| Lenovo Legion Y540-17IRH | |
| Lenovo Yoga C940-14IIL 81Q9 | |
| MSI PS63 Modern 8SC | |
| Average Intel Core i7-1065G7 (1081 - 2024, n=31) | |
| Dell Inspiron 15 5000 5585 | |
| Dell Latitude 14 5495 | |
| Lenovo ThinkPad L590-20Q70019GE | |
| Dynabook Portege A30-E-174 | |
| Dell Latitude 13 3390 | |
| Dell XPS 13 7390 2-in-1 Core i3 | |
| Cinebench R15 | |
| CPU Single 64Bit | |
| MSI Prestige 15 A10SC | |
| Lenovo Yoga C940-15IRH | |
| MSI PS63 Modern 8SC | |
| Lenovo Yoga C940-14IIL 81Q9 | |
| Average Intel Core i7-1065G7 (141 - 190, n=35) | |
| Lenovo Legion Y540-17IRH | |
| Dell G5 15 5590 | |
| Lenovo ThinkPad L590-20Q70019GE | |
| Dell XPS 13 7390 2-in-1 Core i3 | |
| Dynabook Portege A30-E-174 | |
| Dell Latitude 14 5495 | |
| Dell Latitude 13 3390 | |
| Dell Inspiron 15 5000 5585 | |
| CPU Multi 64Bit | |
| Lenovo Yoga C940-15IRH | |
| Dell G5 15 5590 | |
| MSI Prestige 15 A10SC | |
| Lenovo Legion Y540-17IRH | |
| Lenovo Yoga C940-14IIL 81Q9 | |
| MSI PS63 Modern 8SC | |
| Dell Inspiron 15 5000 5585 | |
| Dell Latitude 14 5495 | |
| Average Intel Core i7-1065G7 (288 - 836, n=36) | |
| Dell Latitude 13 3390 | |
| Lenovo ThinkPad L590-20Q70019GE | |
| Dynabook Portege A30-E-174 | |
| Dell XPS 13 7390 2-in-1 Core i3 | |
| Cinebench R11.5 | |
| CPU Single 64Bit | |
| Average Intel Core i7-1065G7 (2.09 - 2.17, n=4) | |
| Dell XPS 13 7390 2-in-1 Core i3 | |
| Dell Latitude 13 3390 | |
| Dell Inspiron 15 5000 5585 | |
| CPU Multi 64Bit | |
| Dell Inspiron 15 5000 5585 | |
| Average Intel Core i7-1065G7 (5.69 - 9.37, n=4) | |
| Dell Latitude 13 3390 | |
| Dell XPS 13 7390 2-in-1 Core i3 | |
| Cinebench R10 | |
| Rendering Multiple CPUs 32Bit | |
| Dell G5 15 5590 | |
| Lenovo Legion Y540-17IRH | |
| Average Intel Core i7-1065G7 (16551 - 26481, n=4) | |
| Dynabook Portege A30-E-174 | |
| Dell XPS 13 7390 2-in-1 Core i3 | |
| Rendering Single 32Bit | |
| Average Intel Core i7-1065G7 (7083 - 7390, n=4) | |
| Dell XPS 13 7390 2-in-1 Core i3 | |
| Lenovo Legion Y540-17IRH | |
| Dell G5 15 5590 | |
| Dynabook Portege A30-E-174 | |
| wPrime 2.10 - 1024m | |
| Dell XPS 13 7390 2-in-1 Core i3 | |
| Average Intel Core i7-1065G7 (233 - 354, n=3) | |
* ... smaller is better
| PCMark 8 Home Score Accelerated v2 | 3448 points | |
| PCMark 8 Work Score Accelerated v2 | 4382 points | |
| PCMark 10 Score | 4633 points | |
Help | ||
| Lenovo Yoga C940-14IIL 81Q9 Samsung PM981a MZVLB1T0HBLR | Lenovo Yoga C930-13IKB 81C4 SK hynix PC401 HFS256GD9TNG | Lenovo Yoga C940-14IIL Samsung SSD PM981 MZVLB512HAJQ | Dell XPS 13 7390 2-in-1 Core i7 Toshiba BG4 KBG40ZPZ512G | Razer Blade Stealth i7-1065G7 Iris Plus Samsung SSD PM981 MZVLB256HAHQ | Asus ZenBook S13 UX392FN WDC PC SN520 SDAPNUW-512G | |
|---|---|---|---|---|---|---|
| AS SSD | -162% | 3% | -74% | -45% | -15% | |
| Seq Read (MB/s) | 2213 | 1228 -45% | 2525 14% | 1801 -19% | 1989 -10% | 1224 -45% |
| Seq Write (MB/s) | 1401 | 544 -61% | 1253 -11% | 1125 -20% | 827 -41% | 907 -35% |
| 4K Read (MB/s) | 55.2 | 39.16 -29% | 59.1 7% | 39.7 -28% | 40.12 -27% | 41.46 -25% |
| 4K Write (MB/s) | 130.3 | 106.5 -18% | 134.1 3% | 67 -49% | 135.1 4% | 126.2 -3% |
| 4K-64 Read (MB/s) | 878 | 466.4 -47% | 1010 15% | 1253 43% | 531 -40% | 1021 16% |
| 4K-64 Write (MB/s) | 1478 | 305.1 -79% | 1461 -1% | 209 -86% | 309.9 -79% | 1251 -15% |
| Access Time Read * (ms) | 0.036 | 0.46 -1178% | 0.052 -44% | 0.069 -92% | 0.085 -136% | 0.053 -47% |
| Access Time Write * (ms) | 0.086 | 0.51 -493% | 0.029 66% | 0.625 -627% | 0.09 -5% | 0.027 69% |
| Score Read (Points) | 1154 | 628 -46% | 1322 15% | 1472 28% | 770 -33% | 1185 3% |
| Score Write (Points) | 1748 | 466 -73% | 1721 -2% | 388 -78% | 528 -70% | 1468 -16% |
| Score Total (Points) | 3467 | 1394 -60% | 3670 6% | 2583 -25% | 1644 -53% | 3250 -6% |
| Copy ISO MB/s (MB/s) | 2161 | 628 -71% | 2016 -7% | 1293 -40% | 1418 -34% | 1404 -35% |
| Copy Program MB/s (MB/s) | 572 | 540 -6% | 542 -5% | 560 -2% | 382.7 -33% | 402.4 -30% |
| Copy Game MB/s (MB/s) | 1433 | 533 -63% | 1278 -11% | 927 -35% | 334.2 -77% | 902 -37% |
* ... smaller is better

| 3DMark 11 Performance | 4950 points | |
| 3DMark Ice Storm Standard Score | 58009 points | |
| 3DMark Cloud Gate Standard Score | 12842 points | |
| 3DMark Fire Strike Score | 2792 points | |
| 3DMark Time Spy Score | 934 points | |
Help | ||
| Rocket League | |
| 1280x720 Performance | |
| Acer Nitro 5 AN515-42-R6V0 | |
| Acer Aspire 5 A515-52G-723L | |
| Xiaomi Mi Notebook Air 13.3 2018 | |
| Huawei MateBook 13 i7 | |
| Dell Inspiron 15 5000 5585 | |
| Lenovo Yoga C940-14IIL 81Q9 | |
| Average Intel Iris Plus Graphics G7 (Ice Lake 64 EU) (22.1 - 123, n=16) | |
| Dell XPS 13 7390 Core i7-10710U | |
| HP ProBook 440 G6-5TK01EA | |
| 1920x1080 Quality AA:Medium FX | |
| Acer Nitro 5 AN515-42-R6V0 | |
| Acer Aspire 5 A515-52G-723L | |
| Huawei MateBook 13 i7 | |
| Lenovo Yoga C940-14IIL 81Q9 | |
| Dell Inspiron 15 5000 5585 | |
| Xiaomi Mi Notebook Air 13.3 2018 | |
| Average Intel Iris Plus Graphics G7 (Ice Lake 64 EU) (24.9 - 71.3, n=16) | |
| Dell XPS 13 7390 Core i7-10710U | |
| HP ProBook 440 G6-5TK01EA | |
| 1920x1080 High Quality AA:High FX | |
| Acer Nitro 5 AN515-42-R6V0 | |
| Acer Aspire 5 A515-52G-723L | |
| Huawei MateBook 13 i7 | |
| Lenovo Yoga C940-14IIL 81Q9 | |
| Xiaomi Mi Notebook Air 13.3 2018 | |
| Dell Inspiron 15 5000 5585 | |
| Average Intel Iris Plus Graphics G7 (Ice Lake 64 EU) (21.1 - 48.5, n=15) | |
| Dell XPS 13 7390 Core i7-10710U | |
| Shadow of the Tomb Raider - 1280x720 Lowest Preset | |
| Acer Nitro 5 AN515-42-R6V0 | |
| Acer Aspire 5 A515-52G-723L | |
| Dell Inspiron 15 5000 5585 | |
| Average Intel Iris Plus Graphics G7 (Ice Lake 64 EU) (15.6 - 33, n=13) | |
| Lenovo Yoga C940-14IIL 81Q9 | |
| Dell XPS 13 7390 Core i7-10710U | |
| low | med. | high | ultra | |
|---|---|---|---|---|
| BioShock Infinite (2013) | 104.2 | 68.3 | 59.9 | 22.1 |
| The Witcher 3 (2015) | 52.7 | 36.3 | 19.6 | 9.9 |
| Rocket League (2017) | 119 | 68.5 | 44.3 | |
| Shadow of the Tomb Raider (2018) | 26 |
| Lenovo Yoga C940-14IIL 81Q9 Iris Plus Graphics G7 (Ice Lake 64 EU), i7-1065G7, Samsung PM981a MZVLB1T0HBLR | MSI Prestige 15 A10SC GeForce GTX 1650 Max-Q, i7-10710U, Samsung SSD PM981 MZVLB1T0HALR | Asus ZenBook S13 UX392FN GeForce MX150, i7-8565U, WDC PC SN520 SDAPNUW-512G | Lenovo Yoga C930-13IKB 81C4 UHD Graphics 620, i5-8550U, SK hynix PC401 HFS256GD9TNG | Razer Blade Stealth i7-1065G7 Iris Plus Iris Plus Graphics G7 (Ice Lake 64 EU), i7-1065G7, Samsung SSD PM981 MZVLB256HAHQ | Dell XPS 13 7390 2-in-1 Core i7 Iris Plus Graphics G7 (Ice Lake 64 EU), i7-1065G7, Toshiba BG4 KBG40ZPZ512G | |
|---|---|---|---|---|---|---|
| Noise | -3% | -4% | 2% | -1% | -1% | |
| off / environment * (dB) | 28.5 | 29.3 -3% | 28.1 1% | 27.9 2% | 28.3 1% | 28.1 1% |
| Idle Minimum * (dB) | 28.5 | 30.1 -6% | 28.1 1% | 27.9 2% | 28.3 1% | 28.1 1% |
| Idle Average * (dB) | 28.5 | 30.2 -6% | 28.1 1% | 27.9 2% | 28.3 1% | 28.1 1% |
| Idle Maximum * (dB) | 29 | 30.2 -4% | 29 -0% | 29.3 -1% | 28.3 2% | 28.1 3% |
| Load Average * (dB) | 33 | 31.5 5% | 41.1 -25% | 32 3% | 33.5 -2% | 31.7 4% |
| Witcher 3 ultra * (dB) | 40.7 | 37 9% | 41.1 -1% | 34.5 15% | 43.4 -7% | |
| Load Maximum * (dB) | 39.5 | 47 -19% | 41.1 -4% | 39.3 1% | 49.4 -25% | 43.4 -10% |
* ... smaller is better
Noise level
| Idle |
| 28.5 / 28.5 / 29 dB(A) |
| Load |
| 33 / 39.5 dB(A) |
 | ||
30 dB silent 40 dB(A) audible 50 dB(A) loud |
||
min: | ||
(±) The maximum temperature on the upper side is 42.6 °C / 109 F, compared to the average of 35.4 °C / 96 F, ranging from 19.6 to 60 °C for the class Convertible.
(±) The bottom heats up to a maximum of 43.8 °C / 111 F, compared to the average of 36.9 °C / 98 F
(+) In idle usage, the average temperature for the upper side is 23.7 °C / 75 F, compared to the device average of 30.3 °C / 87 F.
(±) Playing The Witcher 3, the average temperature for the upper side is 34.2 °C / 94 F, compared to the device average of 30.3 °C / 87 F.
(+) The palmrests and touchpad are cooler than skin temperature with a maximum of 29.6 °C / 85.3 F and are therefore cool to the touch.
(±) The average temperature of the palmrest area of similar devices was 28 °C / 82.4 F (-1.6 °C / -2.9 F).
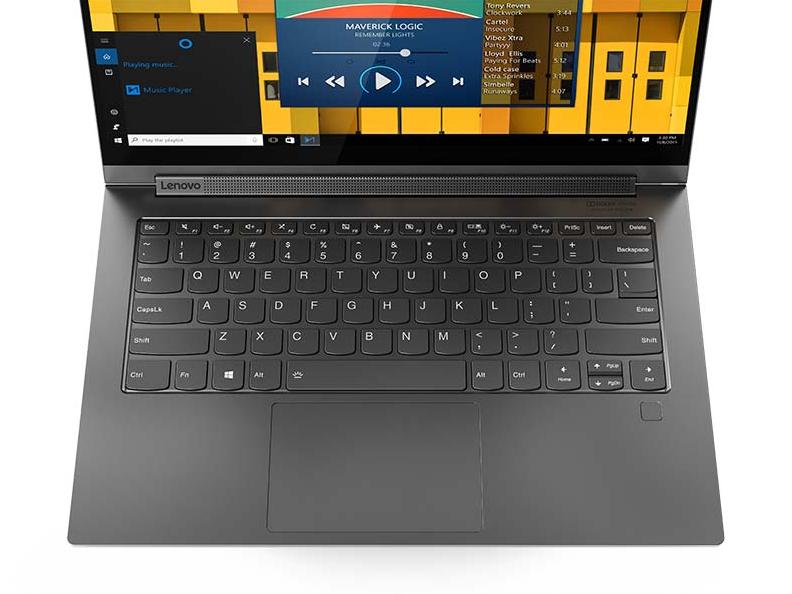
Lenovo Yoga C940-14IIL 81Q9 audio analysis
(+) | speakers can play relatively loud (90.3 dB)
Bass 100 - 315 Hz
(±) | reduced bass - on average 11.2% lower than median
(±) | linearity of bass is average (10.9% delta to prev. frequency)
Mids 400 - 2000 Hz
(+) | balanced mids - only 2.2% away from median
(+) | mids are linear (3.2% delta to prev. frequency)
Highs 2 - 16 kHz
(±) | reduced highs - on average 6% lower than median
(±) | linearity of highs is average (8.9% delta to prev. frequency)
Overall 100 - 16.000 Hz
(+) | overall sound is linear (14.9% difference to median)
Compared to same class
» 23% of all tested devices in this class were better, 5% similar, 72% worse
» The best had a delta of 6%, average was 20%, worst was 57%
Compared to all devices tested
» 20% of all tested devices were better, 4% similar, 76% worse
» The best had a delta of 4%, average was 24%, worst was 134%
Apple MacBook 12 (Early 2016) 1.1 GHz audio analysis
(+) | speakers can play relatively loud (83.6 dB)
Bass 100 - 315 Hz
(±) | reduced bass - on average 11.3% lower than median
(±) | linearity of bass is average (14.2% delta to prev. frequency)
Mids 400 - 2000 Hz
(+) | balanced mids - only 2.4% away from median
(+) | mids are linear (5.5% delta to prev. frequency)
Highs 2 - 16 kHz
(+) | balanced highs - only 2% away from median
(+) | highs are linear (4.5% delta to prev. frequency)
Overall 100 - 16.000 Hz
(+) | overall sound is linear (10.2% difference to median)
Compared to same class
» 7% of all tested devices in this class were better, 2% similar, 91% worse
» The best had a delta of 5%, average was 18%, worst was 53%
Compared to all devices tested
» 5% of all tested devices were better, 1% similar, 94% worse
» The best had a delta of 4%, average was 24%, worst was 134%
| Off / Standby | |
| Idle | |
| Load |
|
Key:
min: | |
| Lenovo Yoga C940-14IIL 81Q9 i7-1065G7, Iris Plus Graphics G7 (Ice Lake 64 EU), Samsung PM981a MZVLB1T0HBLR, IPS, 3840x2160, 14" | Asus ZenBook S13 UX392FN i7-8565U, GeForce MX150, WDC PC SN520 SDAPNUW-512G, IPS, 1920x1080, 13.9" | Lenovo Yoga C930-13IKB 81C4 i5-8550U, UHD Graphics 620, SK hynix PC401 HFS256GD9TNG, IPS, 1920x1080, 13.9" | Lenovo Yoga C940-14IIL i7-1065G7, Iris Plus Graphics G7 (Ice Lake 64 EU), Samsung SSD PM981 MZVLB512HAJQ, IPS LED, 1920x1080, 14" | Razer Blade Stealth 13, Core i7-1065G7 i7-1065G7, GeForce GTX 1650 Max-Q, Lite-On CA3-8D512, IPS LED, 3840x2160, 13.3" | Dell XPS 13 7390 2-in-1 Core i7 i7-1065G7, Iris Plus Graphics G7 (Ice Lake 64 EU), Toshiba BG4 KBG40ZPZ512G, IPS, 1920x1200, 13.4" | Huawei MateBook 14 KLV-W29 i7-8565U, GeForce MX250, Samsung SSD PM981 MZVLB512HAJQ, IPS, 2160x1440, 14" | |
|---|---|---|---|---|---|---|---|
| Power Consumption | 19% | 17% | 23% | -35% | 33% | 1% | |
| Idle Minimum * (Watt) | 5.6 | 3.4 39% | 3.4 39% | 3.2 43% | 10.7 -91% | 2.6 54% | 3.7 34% |
| Idle Average * (Watt) | 10.5 | 6.3 40% | 7.5 29% | 7 33% | 13.6 -30% | 5.3 50% | 9.3 11% |
| Idle Maximum * (Watt) | 12 | 10.4 13% | 11.8 2% | 8.9 26% | 15.7 -31% | 7 42% | 12.8 -7% |
| Load Average * (Watt) | 53.3 | 51 4% | 47.7 11% | 47.6 11% | 60 -13% | 43.1 19% | 58.8 -10% |
| Witcher 3 ultra * (Watt) | 46.9 | 39 17% | 64 -36% | 43.1 8% | 55.8 -19% | ||
| Load Maximum * (Watt) | 64.6 | 62.7 3% | 63.2 2% | 63.1 2% | 71 -10% | 49 24% | 65 -1% |
* ... smaller is better
| Lenovo Yoga C940-14IIL 81Q9 i7-1065G7, Iris Plus Graphics G7 (Ice Lake 64 EU), 60 Wh | Asus ZenBook S13 UX392FN i7-8565U, GeForce MX150, 50 Wh | Lenovo Yoga C930-13IKB 81C4 i5-8550U, UHD Graphics 620, 60 Wh | Lenovo Yoga C940-14IIL i7-1065G7, Iris Plus Graphics G7 (Ice Lake 64 EU), 60 Wh | Razer Blade Stealth i7-1065G7 Iris Plus i7-1065G7, Iris Plus Graphics G7 (Ice Lake 64 EU), 53.1 Wh | Dell XPS 13 7390 2-in-1 Core i7 i7-1065G7, Iris Plus Graphics G7 (Ice Lake 64 EU), 51 Wh | |
|---|---|---|---|---|---|---|
| Battery runtime | 15% | 52% | 45% | 33% | 23% | |
| WiFi v1.3 (h) | 7.3 | 8.4 15% | 11.1 52% | 10.6 45% | 9.7 33% | 9 23% |
| Reader / Idle (h) | 28.5 | |||||
| Load (h) | 1.7 | 1.1 |
Pros
Cons
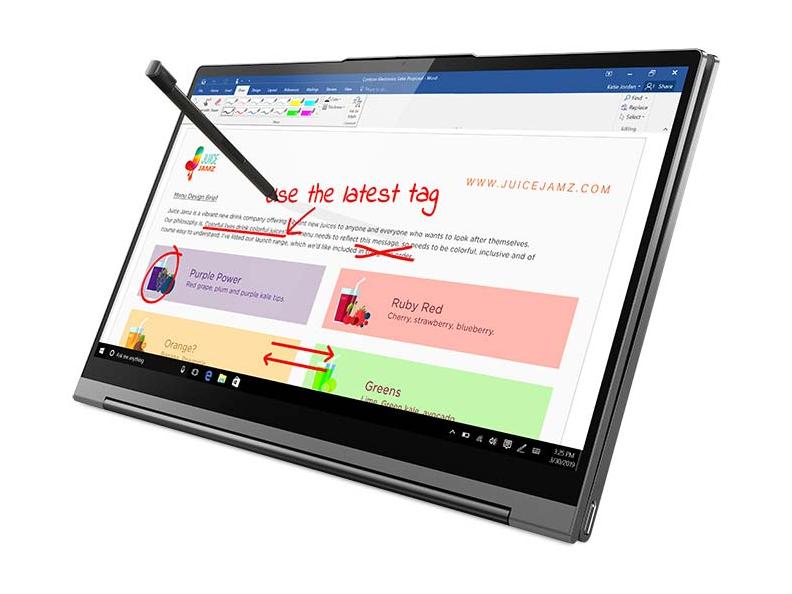
选择4K UHD版本Yoga C940而非较便宜的FHD SKU将带来一些优点和缺点。好消息是,与FHD SKU相比,更高的分辨率可实现更精细的笔输入,更深的色彩以及更亮的背光,而不会极大地影响响应时间或对比度。奇怪的是,颜色和灰度并不能开箱即用,但是最终校准可以解决这个问题。
4K主要缺点是续航时间,根据我们的测量,它的续航时间缩短了约3小时,而功耗水平则略高。即使这样,对于大多数用户来说,实际使用WLAN的7个小时仍绰绰有余。所有的Yoga C940-14 SKU都具有相同的缺点,即难于维护,在游戏时风扇不太正常,并且Ice Lake架构的游戏性能不太稳定。
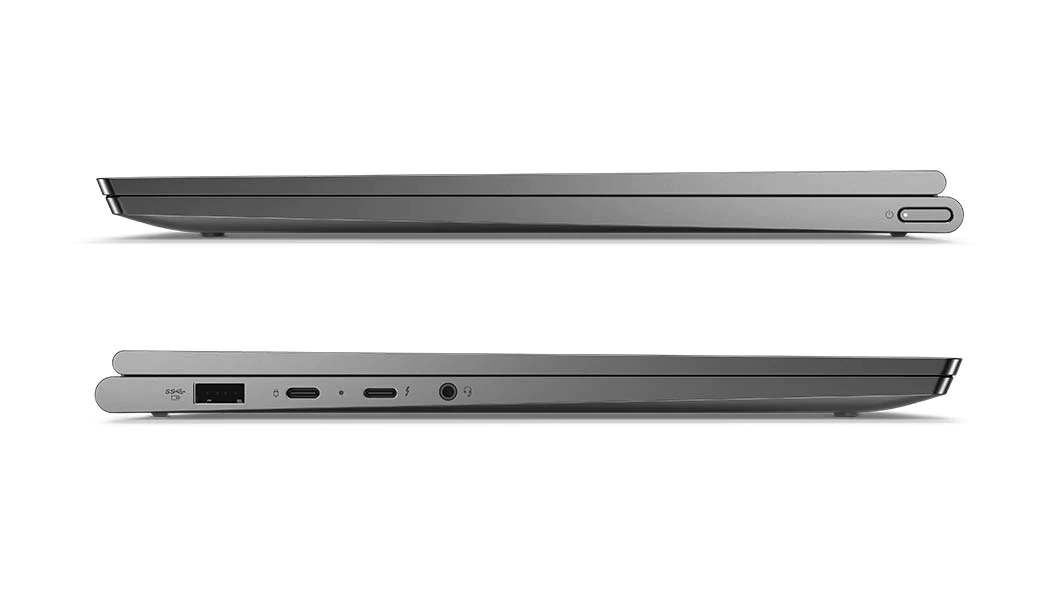
与联想Yoga C940-14相比,以商务用途为中心的HP EliteBook x360 1040系列具有更多的连接选项,更亮的显示屏和更纤薄的设计,且起价更高。如果您想要一款更加平衡的14英寸消费级翻转本,而又不打算购买较小的13.3英寸Spectre x360或13.4英寸Dell XPS 2合1, Yoga C940应该是您的首选。your list.
Lenovo Yoga C940-14IIL 81Q9
- 12/19/2019 v7 (old)
Allen Ngo
Price comparison

