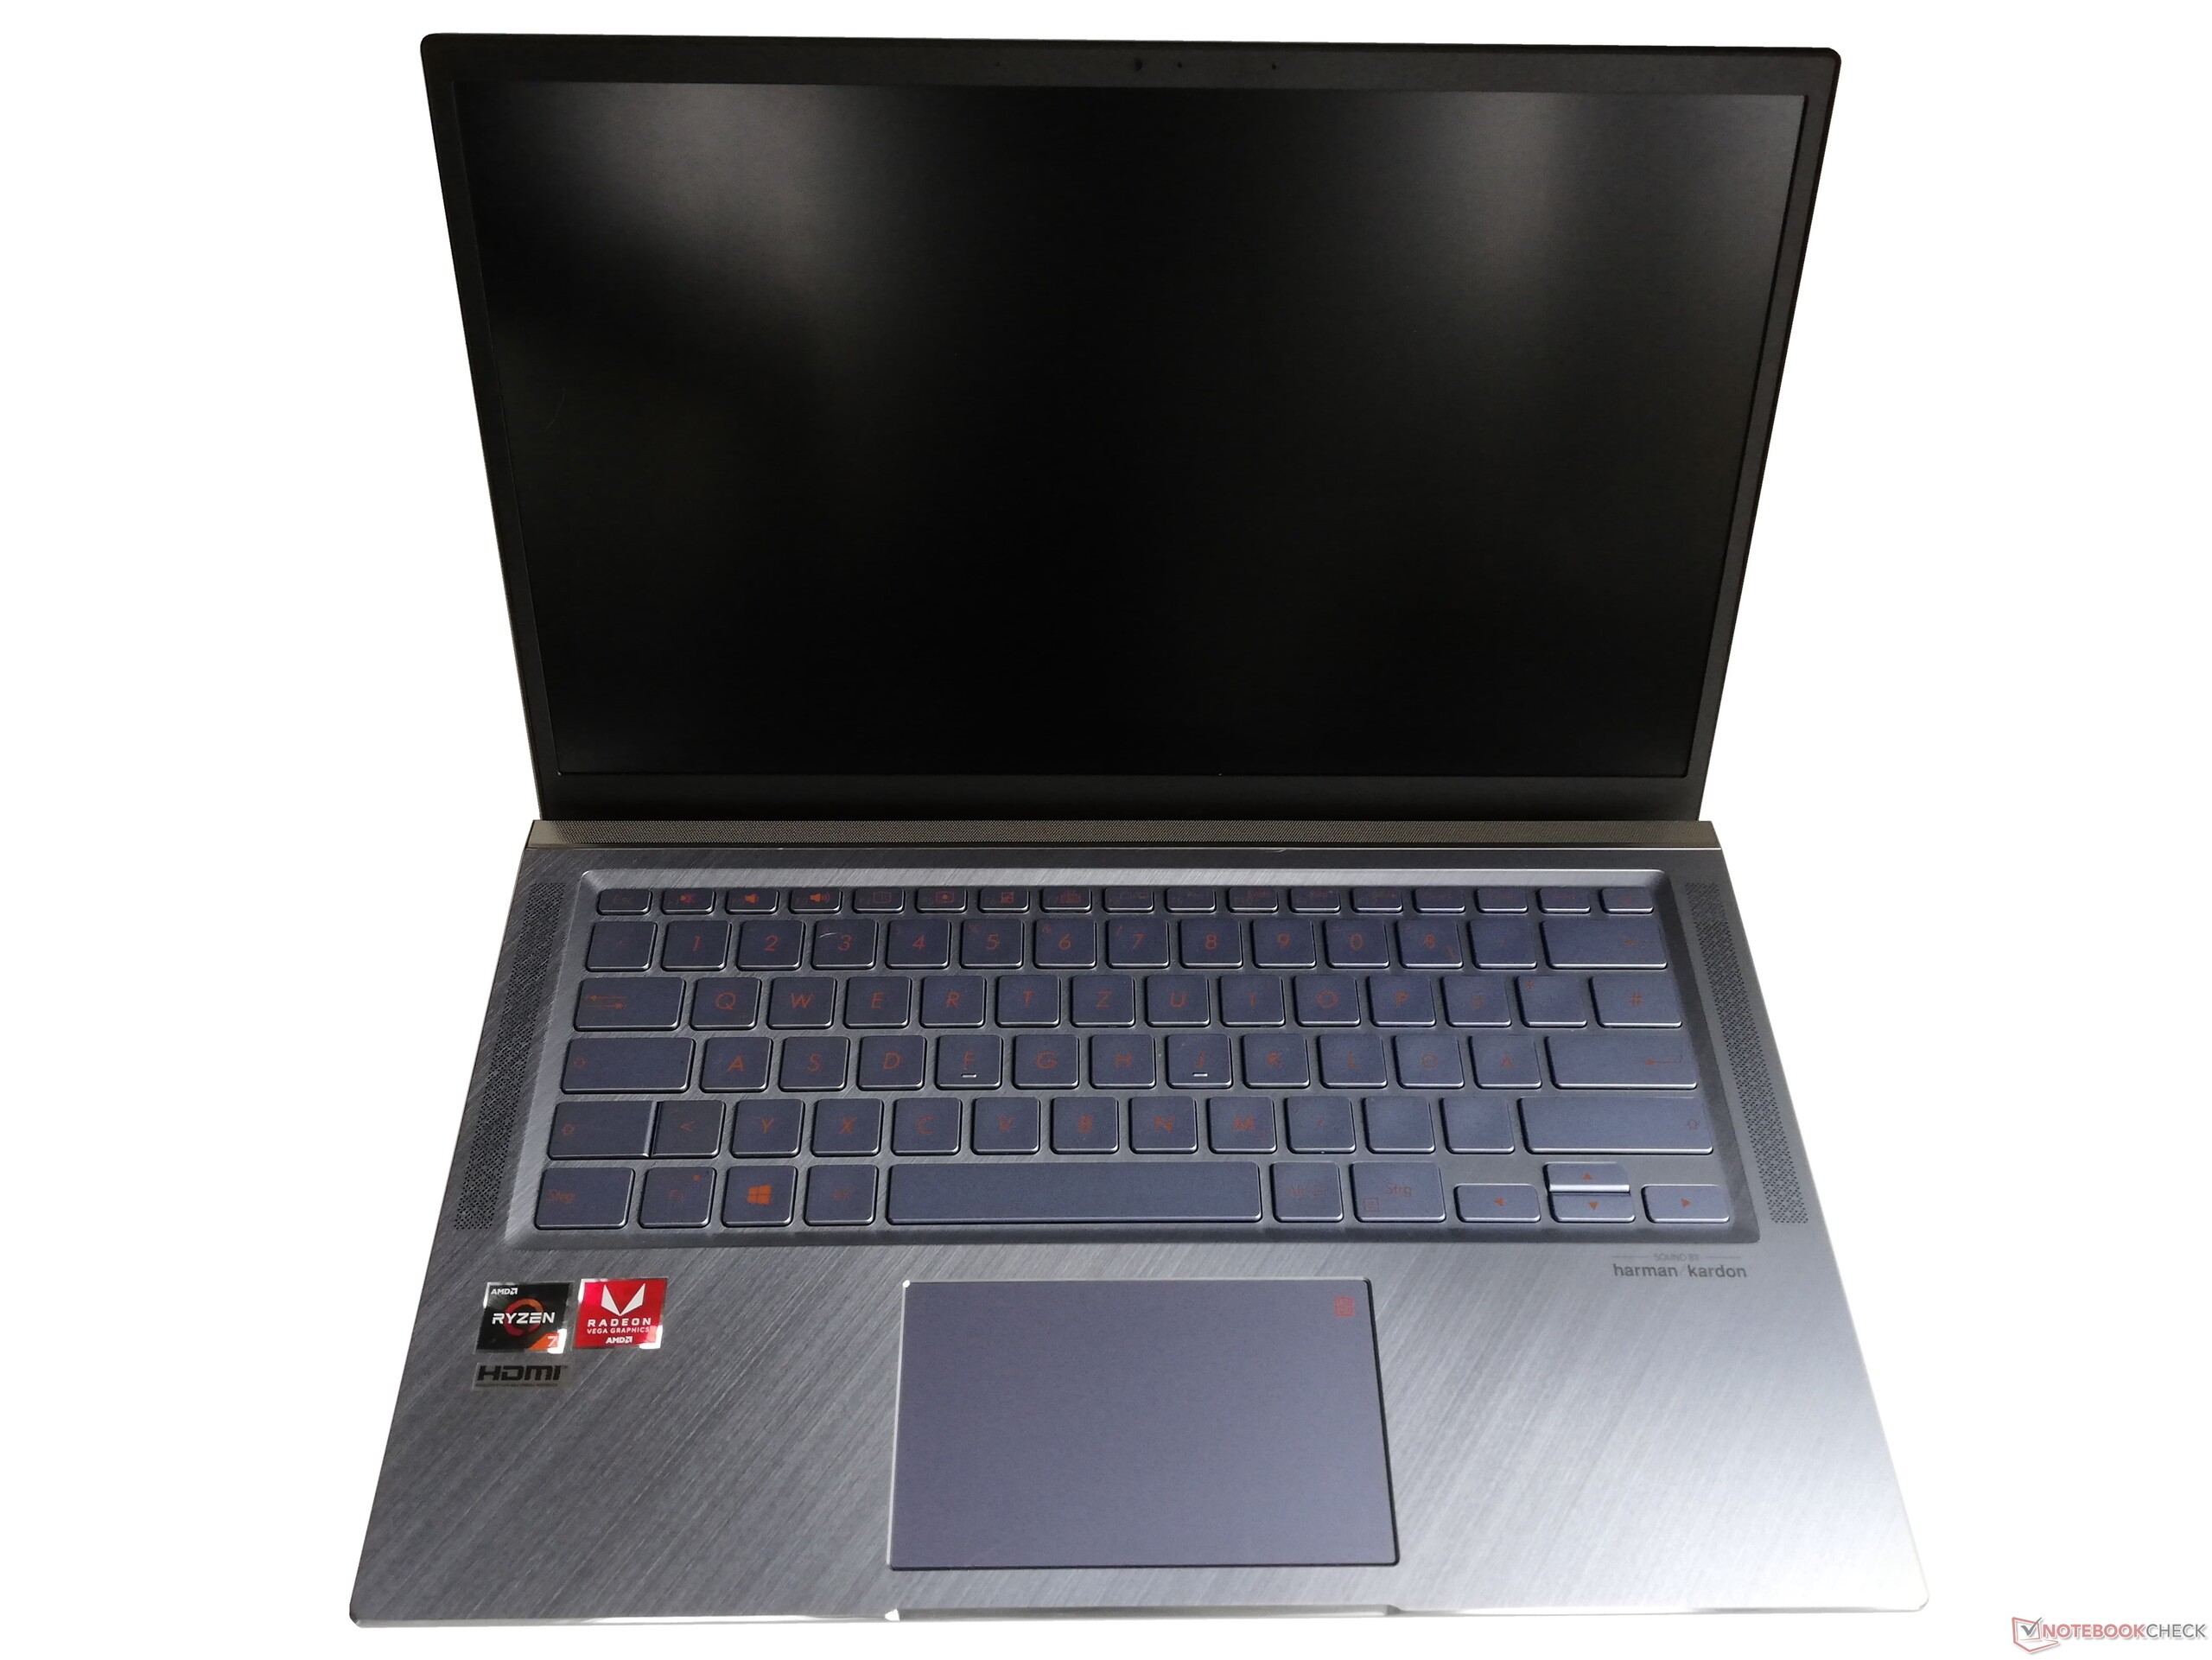
华硕ZenBook 14 UM431DA笔记本电脑评测:用Ryzen留下的好印象
Rating | Date | Model | Weight | Height | Size | Resolution | Price |
|---|---|---|---|---|---|---|---|
| 81.2 % v7 (old) | 03 / 2020 | Asus ZenBook 14 UM431DA-AM020T R7 3700U, Vega 10 | 1.4 kg | 16 mm | 14.00" | 1920x1080 | |
| 88.4 % v6 (old) | 10 / 2024 | Lenovo ThinkPad E595-20NF0000GE R7 3700U, Vega 10 | 1.9 kg | 19.9 mm | 15.60" | 1920x1080 | |
| 79.7 % v6 (old) | Dell Inspiron 15 5000 5585 R7 3700U, Vega 10 | 1.8 kg | 19.5 mm | 15.60" | 1920x1080 | ||
| 80.9 % v7 (old) | 03 / 2020 | MSI Modern 14 A10RB-459US i5-10210U, GeForce MX250 | 1.2 kg | 16 mm | 14.00" | 1920x1080 | |
| 77.8 % v7 (old) | 03 / 2020 | HP Pavilion 14-ce3040ng i7-1065G7, GeForce MX250 | 1.6 kg | 18 mm | 14.00" | 1920x1080 |
| SD Card Reader | |
| average JPG Copy Test (av. of 3 runs) | |
| Lenovo ThinkPad E595-20NF0000GE (Toshiba Exceria Pro M501 64 GB UHS-II) | |
| Average of class Subnotebook (23.7 - 188, n=9, last 2 years) | |
| Dell Inspiron 15 5000 5585 (Toshiba Exceria Pro SDXC 64 GB UHS-II) | |
| HP Pavilion 14-ce3040ng (Toshiba Exceria Pro SDXC 64 GB UHS-II) | |
| MSI Modern 14 A10RB-459US (Toshiba Exceria Pro SDXC 64 GB UHS-II) | |
| Asus ZenBook 14 UM431DA-AM020T (Toshiba Exceria Pro SDXC 64 GB UHS-II) | |
| maximum AS SSD Seq Read Test (1GB) | |
| Average of class Subnotebook (24.9 - 195, n=8, last 2 years) | |
| Lenovo ThinkPad E595-20NF0000GE (Toshiba Exceria Pro M501 64 GB UHS-II) | |
| Dell Inspiron 15 5000 5585 (Toshiba Exceria Pro SDXC 64 GB UHS-II) | |
| Asus ZenBook 14 UM431DA-AM020T (Toshiba Exceria Pro SDXC 64 GB UHS-II) | |
| HP Pavilion 14-ce3040ng (Toshiba Exceria Pro SDXC 64 GB UHS-II) | |
| MSI Modern 14 A10RB-459US (Toshiba Exceria Pro SDXC 64 GB UHS-II) | |
| Networking | |
| iperf3 transmit AX12 | |
| HP Pavilion 14-ce3040ng | |
| Lenovo ThinkPad E595-20NF0000GE | |
| Asus ZenBook 14 UM431DA-AM020T | |
| Dell Inspiron 15 5000 5585 | |
| iperf3 receive AX12 | |
| HP Pavilion 14-ce3040ng | |
| Lenovo ThinkPad E595-20NF0000GE | |
| Asus ZenBook 14 UM431DA-AM020T | |
| Dell Inspiron 15 5000 5585 | |
| |||||||||||||||||||||||||
Brightness Distribution: 78 %
Center on Battery: 263 cd/m²
Contrast: 1124:1 (Black: 0.225 cd/m²)
ΔE ColorChecker Calman: 8.89 | ∀{0.5-29.43 Ø4.71}
calibrated: 4.9
ΔE Greyscale Calman: 6.33 | ∀{0.09-98 Ø4.96}
91% sRGB (Argyll 1.6.3 3D)
60% AdobeRGB 1998 (Argyll 1.6.3 3D)
67.5% AdobeRGB 1998 (Argyll 3D)
92.3% sRGB (Argyll 3D)
66.7% Display P3 (Argyll 3D)
Gamma: 2.52
CCT: 6745 K
| Asus ZenBook 14 UM431DA-AM020T CEC PA LM140LF-3L03, IPS, 1920x1080, 14" | Lenovo ThinkPad E595-20NF0000GE NV156FHM-N49, IPS, 1920x1080, 15.6" | Dell Inspiron 15 5000 5585 LG Philips 156WFC, IPS, 1920x1080, 15.6" | MSI Modern 14 A10RB-459US Chi Mei N140HCE-EN2, IPS, 1920x1080, 14" | HP Pavilion 14-ce3040ng AUO543D, IPS, 1920x1080, 14" | |
|---|---|---|---|---|---|
| Display | -39% | -42% | -1% | 3% | |
| Display P3 Coverage (%) | 66.7 | 39.88 -40% | 37.31 -44% | 64.2 -4% | 66.5 0% |
| sRGB Coverage (%) | 92.3 | 58.6 -37% | 56.2 -39% | 94.8 3% | 98.4 7% |
| AdobeRGB 1998 Coverage (%) | 67.5 | 41.2 -39% | 38.55 -43% | 65.4 -3% | 68.2 1% |
| Response Times | -20% | 8% | -23% | -42% | |
| Response Time Grey 50% / Grey 80% * (ms) | 36 ? | 41.2 ? -14% | 28.4 ? 21% | 39.2 ? -9% | 60.8 ? -69% |
| Response Time Black / White * (ms) | 26 ? | 32.8 ? -26% | 27.2 ? -5% | 35.6 ? -37% | 29.6 ? -14% |
| PWM Frequency (Hz) | 44 ? | 1220 ? | 25000 ? | ||
| Screen | -16% | -22% | 30% | 14% | |
| Brightness middle (cd/m²) | 253 | 318 26% | 253.6 0% | 324.1 28% | 395 56% |
| Brightness (cd/m²) | 245 | 297 21% | 227 -7% | 301 23% | 375 53% |
| Brightness Distribution (%) | 78 | 89 14% | 84 8% | 87 12% | 91 17% |
| Black Level * (cd/m²) | 0.225 | 0.17 24% | 0.27 -20% | 0.22 2% | 0.26 -16% |
| Contrast (:1) | 1124 | 1871 66% | 939 -16% | 1473 31% | 1519 35% |
| Colorchecker dE 2000 * | 8.89 | 5.5 38% | 6.05 32% | 1.63 82% | 5.92 33% |
| Colorchecker dE 2000 max. * | 4.56 | 21 -361% | 14.03 -208% | 4.25 7% | 9.79 -115% |
| Colorchecker dE 2000 calibrated * | 4.9 | 5.1 -4% | 4.97 -1% | 1.42 71% | 0.91 81% |
| Greyscale dE 2000 * | 6.33 | 1.8 72% | 3.2 49% | 2.2 65% | 6.69 -6% |
| Gamma | 2.52 87% | 2.12 104% | 2 110% | 2.26 97% | 2.78 79% |
| CCT | 6745 96% | 6257 104% | 6820 95% | 6887 94% | 7596 86% |
| Color Space (Percent of AdobeRGB 1998) (%) | 60 | 37.6 -37% | 35.5 -41% | 60.2 0% | 63 5% |
| Color Space (Percent of sRGB) (%) | 91 | 58.2 -36% | 55.6 -39% | 95 4% | 98 8% |
| Total Average (Program / Settings) | -25% /
-21% | -19% /
-22% | 2% /
17% | -8% /
5% |
* ... smaller is better
Display Response Times
| ↔ Response Time Black to White | ||
|---|---|---|
| 26 ms ... rise ↗ and fall ↘ combined | ↗ 15 ms rise | 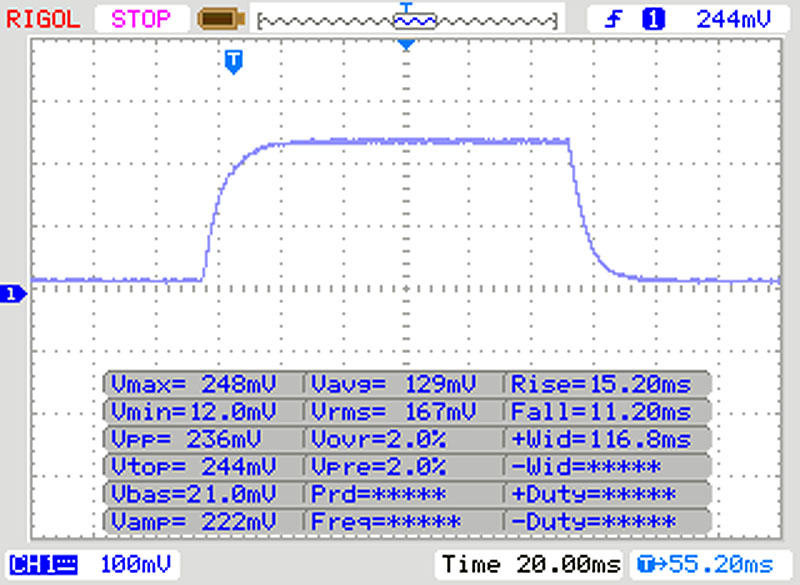 |
| ↘ 11 ms fall | ||
| The screen shows relatively slow response rates in our tests and may be too slow for gamers. In comparison, all tested devices range from 0.1 (minimum) to 240 (maximum) ms. » 63 % of all devices are better. This means that the measured response time is worse than the average of all tested devices (19.8 ms). | ||
| ↔ Response Time 50% Grey to 80% Grey | ||
| 36 ms ... rise ↗ and fall ↘ combined | ↗ 19 ms rise | 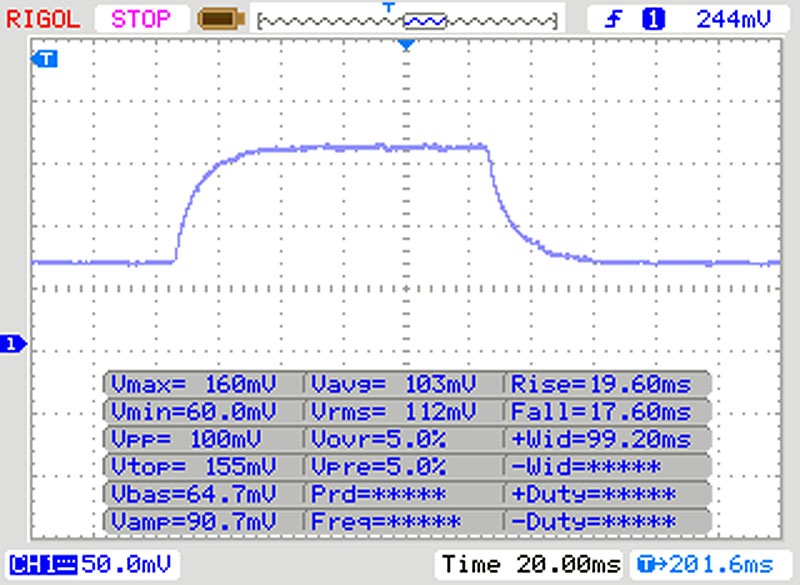 |
| ↘ 17 ms fall | ||
| The screen shows slow response rates in our tests and will be unsatisfactory for gamers. In comparison, all tested devices range from 0.165 (minimum) to 636 (maximum) ms. » 51 % of all devices are better. This means that the measured response time is worse than the average of all tested devices (31 ms). | ||
Screen Flickering / PWM (Pulse-Width Modulation)
| Screen flickering / PWM detected | 44 Hz | ≤ 20 % brightness setting | 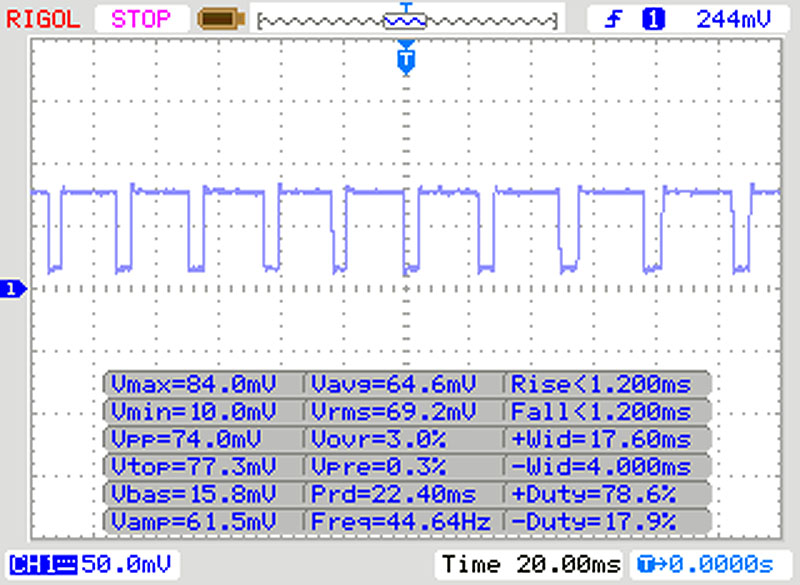 |
The display backlight flickers at 44 Hz (worst case, e.g., utilizing PWM) Flickering detected at a brightness setting of 20 % and below. There should be no flickering or PWM above this brightness setting. The frequency of 44 Hz is very low, so the flickering may cause eyestrain and headaches after extended use. In comparison: 52 % of all tested devices do not use PWM to dim the display. If PWM was detected, an average of 7757 (minimum: 5 - maximum: 343500) Hz was measured. | |||
| Cinebench R15 | |
| CPU Single 64Bit | |
| Average of class Subnotebook (72.4 - 322, n=57, last 2 years) | |
| HP Pavilion 14-ce3040ng | |
| MSI Modern 14 A10RB-459US | |
| Lenovo ThinkPad E595-20NF0000GE | |
| Average AMD Ryzen 7 3700U (127 - 146, n=7) | |
| Dell Inspiron 15 5000 5585 | |
| Asus ZenBook 14 UM431DA-AM020T | |
| CPU Multi 64Bit | |
| Average of class Subnotebook (327 - 3345, n=57, last 2 years) | |
| HP Pavilion 14-ce3040ng | |
| Lenovo ThinkPad E595-20NF0000GE | |
| Dell Inspiron 15 5000 5585 | |
| Average AMD Ryzen 7 3700U (537 - 683, n=7) | |
| Asus ZenBook 14 UM431DA-AM020T | |
| MSI Modern 14 A10RB-459US | |
| PCMark 8 | |
| Home Score Accelerated v2 | |
| Average AMD Ryzen 7 3700U, AMD Radeon RX Vega 10 (3325 - 3993, n=7) | |
| Asus ZenBook 14 UM431DA-AM020T | |
| Dell Inspiron 15 5000 5585 | |
| MSI Modern 14 A10RB-459US | |
| Lenovo ThinkPad E595-20NF0000GE | |
| Average of class Subnotebook (1739 - 1828, n=2, last 2 years) | |
| Work Score Accelerated v2 | |
| MSI Modern 14 A10RB-459US | |
| Asus ZenBook 14 UM431DA-AM020T | |
| Average AMD Ryzen 7 3700U, AMD Radeon RX Vega 10 (4418 - 4869, n=6) | |
| Lenovo ThinkPad E595-20NF0000GE | |
| Dell Inspiron 15 5000 5585 | |
| Average of class Subnotebook (1609 - 1656, n=2, last 2 years) | |
| PCMark 8 Home Score Accelerated v2 | 3604 points | |
| PCMark 8 Work Score Accelerated v2 | 4842 points | |
| PCMark 10 Score | 3851 points | |
Help | ||
| Asus ZenBook 14 UM431DA-AM020T SK hynix BC501 HFM512GDHTNG-8310A | Lenovo ThinkPad E595-20NF0000GE SK Hynix BC501 HFM512GDJTNG | Dell Inspiron 15 5000 5585 WDC PC SN520 SDAPNUW-512G | MSI Modern 14 A10RB-459US Kingston RBUSNS8154P3512GJ | HP Pavilion 14-ce3040ng Toshiba XG6 KXG60ZNV1T02 | Average SK hynix BC501 HFM512GDHTNG-8310A | |
|---|---|---|---|---|---|---|
| CrystalDiskMark 5.2 / 6 | 11% | -3% | 15% | 108% | 10% | |
| Write 4K (MB/s) | 118.8 | 129.5 9% | 105.9 -11% | 107.7 -9% | 181.6 53% | 110 ? -7% |
| Read 4K (MB/s) | 41.62 | 41.23 -1% | 36.56 -12% | 39.73 -5% | 57.4 38% | 40.6 ? -2% |
| Write Seq (MB/s) | 796 | 811 2% | 1165 46% | 926 16% | 1982 149% | 677 ? -15% |
| Read Seq (MB/s) | 1101 | 1145 4% | 423.2 -62% | 1014 -8% | 1899 72% | 1104 ? 0% |
| Write 4K Q32T1 (MB/s) | 234.7 | 314.1 34% | 332.1 41% | 343.6 46% | 509 117% | 438 ? 87% |
| Read 4K Q32T1 (MB/s) | 313.8 | 356.2 14% | 229.3 -27% | 499.1 59% | 545 74% | 338 ? 8% |
| Write Seq Q32T1 (MB/s) | 842 | 839 0% | 1460 73% | 1033 23% | 3072 265% | 860 ? 2% |
| Read Seq Q32T1 (MB/s) | 1645 | 2042 24% | 472.5 -71% | 1604 -2% | 3281 99% | 1786 ? 9% |
| AS SSD | 5% | -9% | -25% | 79% | 6% | |
| Seq Read (MB/s) | 1417 | 1698 20% | 398.9 -72% | 1061 -25% | 2762 95% | 1471 ? 4% |
| Seq Write (MB/s) | 781 | 740 -5% | 884 13% | 953 22% | 2493 219% | 612 ? -22% |
| 4K Read (MB/s) | 37.03 | 39.18 6% | 34.54 -7% | 35.59 -4% | 52.1 41% | 40.2 ? 9% |
| 4K Write (MB/s) | 80.1 | 87.7 9% | 82.1 2% | 87 9% | 147.5 84% | 108.8 ? 36% |
| 4K-64 Read (MB/s) | 740 | 764 3% | 647 -13% | 769 4% | 1473 99% | 794 ? 7% |
| 4K-64 Write (MB/s) | 748 | 669 -11% | 985 32% | 733 -2% | 1456 95% | 764 ? 2% |
| Access Time Read * (ms) | 0.047 | 0.04 15% | 0.072 -53% | 0.084 -79% | 0.094 -100% | 0.046 ? 2% |
| Access Time Write * (ms) | 0.045 | 0.036 20% | 0.047 -4% | 0.136 -202% | 0.03 33% | 0.03533 ? 21% |
| Score Read (Points) | 918 | 973 6% | 721 -21% | 911 -1% | 1801 96% | 981 ? 7% |
| Score Write (Points) | 906 | 831 -8% | 1155 27% | 916 1% | 1853 105% | 867 ? -4% |
| Score Total (Points) | 2270 | 2261 0% | 2279 0% | 2294 1% | 4568 101% | 2315 ? 2% |
| Total Average (Program / Settings) | 8% /
7% | -6% /
-6% | -5% /
-8% | 94% /
91% | 8% /
8% |
* ... smaller is better

| 3DMark 11 - 1280x720 Performance GPU | |
| Average of class Subnotebook (995 - 18489, n=55, last 2 years) | |
| MSI Modern 14 A10RB-459US | |
| HP Pavilion 14-ce3040ng | |
| Dell Inspiron 15 5000 5585 | |
| Average AMD Radeon RX Vega 10 (2688 - 4165, n=17) | |
| Asus ZenBook 14 UM431DA-AM020T | |
| Lenovo ThinkPad E595-20NF0000GE | |
| 3DMark | |
| 1280x720 Cloud Gate Standard Graphics | |
| Average of class Subnotebook (5577 - 61591, n=28, last 2 years) | |
| MSI Modern 14 A10RB-459US | |
| Dell Inspiron 15 5000 5585 | |
| Asus ZenBook 14 UM431DA-AM020T | |
| Average AMD Radeon RX Vega 10 (9364 - 20784, n=16) | |
| Lenovo ThinkPad E595-20NF0000GE | |
| 1920x1080 Fire Strike Graphics | |
| Average of class Subnotebook (832 - 16347, n=56, last 2 years) | |
| MSI Modern 14 A10RB-459US | |
| HP Pavilion 14-ce3040ng | |
| Dell Inspiron 15 5000 5585 | |
| Asus ZenBook 14 UM431DA-AM020T | |
| Average AMD Radeon RX Vega 10 (1567 - 2999, n=17) | |
| Lenovo ThinkPad E595-20NF0000GE | |
| 3DMark 11 Performance | 3449 points | |
| 3DMark Cloud Gate Standard Score | 11126 points | |
| 3DMark Fire Strike Score | 2028 points | |
Help | ||
| low | med. | high | ultra | |
|---|---|---|---|---|
| BioShock Infinite (2013) | 93.8 | 60.7 | 49.72 | 17.4 |
| Dota 2 Reborn (2015) | 68.7 | 58.6 | 36 | 30.2 |
| Final Fantasy XV Benchmark (2018) | 16.1 | 8.1 |
Noise level
| Idle |
| 28 / 28 / 28 dB(A) |
| Load |
| 36.8 / 39 dB(A) |
 | ||
30 dB silent 40 dB(A) audible 50 dB(A) loud |
||
min: | ||
(+) The maximum temperature on the upper side is 37 °C / 99 F, compared to the average of 35.9 °C / 97 F, ranging from 21.4 to 59 °C for the class Subnotebook.
(+) The bottom heats up to a maximum of 36.3 °C / 97 F, compared to the average of 39.2 °C / 103 F
(+) In idle usage, the average temperature for the upper side is 23.4 °C / 74 F, compared to the device average of 30.8 °C / 87 F.
(+) The palmrests and touchpad are cooler than skin temperature with a maximum of 29.4 °C / 84.9 F and are therefore cool to the touch.
(±) The average temperature of the palmrest area of similar devices was 28.2 °C / 82.8 F (-1.2 °C / -2.1 F).
Asus ZenBook 14 UM431DA-AM020T audio analysis
(-) | not very loud speakers (69.4 dB)
Bass 100 - 315 Hz
(±) | reduced bass - on average 11% lower than median
(±) | linearity of bass is average (14% delta to prev. frequency)
Mids 400 - 2000 Hz
(±) | higher mids - on average 6.4% higher than median
(+) | mids are linear (3.7% delta to prev. frequency)
Highs 2 - 16 kHz
(+) | balanced highs - only 3.3% away from median
(+) | highs are linear (6% delta to prev. frequency)
Overall 100 - 16.000 Hz
(±) | linearity of overall sound is average (18.4% difference to median)
Compared to same class
» 54% of all tested devices in this class were better, 7% similar, 39% worse
» The best had a delta of 5%, average was 18%, worst was 53%
Compared to all devices tested
» 41% of all tested devices were better, 8% similar, 51% worse
» The best had a delta of 4%, average was 23%, worst was 134%
Apple MacBook 12 (Early 2016) 1.1 GHz audio analysis
(+) | speakers can play relatively loud (83.6 dB)
Bass 100 - 315 Hz
(±) | reduced bass - on average 11.3% lower than median
(±) | linearity of bass is average (14.2% delta to prev. frequency)
Mids 400 - 2000 Hz
(+) | balanced mids - only 2.4% away from median
(+) | mids are linear (5.5% delta to prev. frequency)
Highs 2 - 16 kHz
(+) | balanced highs - only 2% away from median
(+) | highs are linear (4.5% delta to prev. frequency)
Overall 100 - 16.000 Hz
(+) | overall sound is linear (10.2% difference to median)
Compared to same class
» 7% of all tested devices in this class were better, 2% similar, 90% worse
» The best had a delta of 5%, average was 18%, worst was 53%
Compared to all devices tested
» 5% of all tested devices were better, 1% similar, 94% worse
» The best had a delta of 4%, average was 23%, worst was 134%
| Off / Standby | |
| Idle | |
| Load |
|
Key:
min: | |
| Asus ZenBook 14 UM431DA-AM020T R7 3700U, Vega 10, SK hynix BC501 HFM512GDHTNG-8310A, IPS, 1920x1080, 14" | Lenovo ThinkPad E595-20NF0000GE R7 3700U, Vega 10, SK Hynix BC501 HFM512GDJTNG, IPS, 1920x1080, 15.6" | Dell Inspiron 15 5000 5585 R7 3700U, Vega 10, WDC PC SN520 SDAPNUW-512G, IPS, 1920x1080, 15.6" | MSI Modern 14 A10RB-459US i5-10210U, GeForce MX250, Kingston RBUSNS8154P3512GJ, IPS, 1920x1080, 14" | HP Pavilion 14-ce3040ng i7-1065G7, GeForce MX250, Toshiba XG6 KXG60ZNV1T02, IPS, 1920x1080, 14" | Average AMD Radeon RX Vega 10 | Average of class Subnotebook | |
|---|---|---|---|---|---|---|---|
| Power Consumption | 6% | 6% | -16% | -21% | -3% | -4% | |
| Idle Minimum * (Watt) | 3.6 | 4.2 -17% | 4.2 -17% | 4.2 -17% | 4 -11% | 4.73 ? -31% | 3.76 ? -4% |
| Idle Average * (Watt) | 7.2 | 7.92 -10% | 6.8 6% | 5.9 18% | 7 3% | 7.61 ? -6% | 6.54 ? 9% |
| Idle Maximum * (Watt) | 10.8 | 8.16 24% | 7 35% | 7.2 33% | 10 7% | 9.63 ? 11% | 7.89 ? 27% |
| Load Average * (Watt) | 38 | 29 24% | 36.5 4% | 63.4 -67% | 62 -63% | 33.3 ? 12% | 42 ? -11% |
| Load Maximum * (Watt) | 45.2 | 42.2 7% | 44 3% | 67.4 -49% | 64 -42% | 45.1 ? -0% | 64.8 ? -43% |
| Witcher 3 ultra * (Watt) | 37.9 | 53.5 | 58 |
* ... smaller is better
| Asus ZenBook 14 UM431DA-AM020T R7 3700U, Vega 10, 47 Wh | Lenovo ThinkPad E595-20NF0000GE R7 3700U, Vega 10, 45 Wh | Dell Inspiron 15 5000 5585 R7 3700U, Vega 10, 42 Wh | MSI Modern 14 A10RB-459US i5-10210U, GeForce MX250, 50 Wh | HP Pavilion 14-ce3040ng i7-1065G7, GeForce MX250, 41 Wh | Average of class Subnotebook | |
|---|---|---|---|---|---|---|
| Battery runtime | -9% | -16% | 2% | -29% | 55% | |
| Reader / Idle (h) | 17.8 | 15.7 -12% | 14.3 -20% | 16.4 -8% | 11.6 -35% | 28.6 ? 61% |
| WiFi v1.3 (h) | 6.7 | 7.7 15% | 7 4% | 8.6 28% | 6.1 -9% | 14 ? 109% |
| Load (h) | 2.1 | 1.5 -29% | 1.4 -33% | 1.8 -14% | 1.2 -43% | 1.969 ? -6% |
Pros
Cons
Verdict - Pretty design with slowed-down CPU
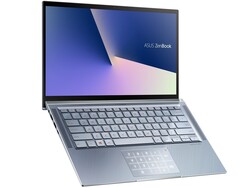
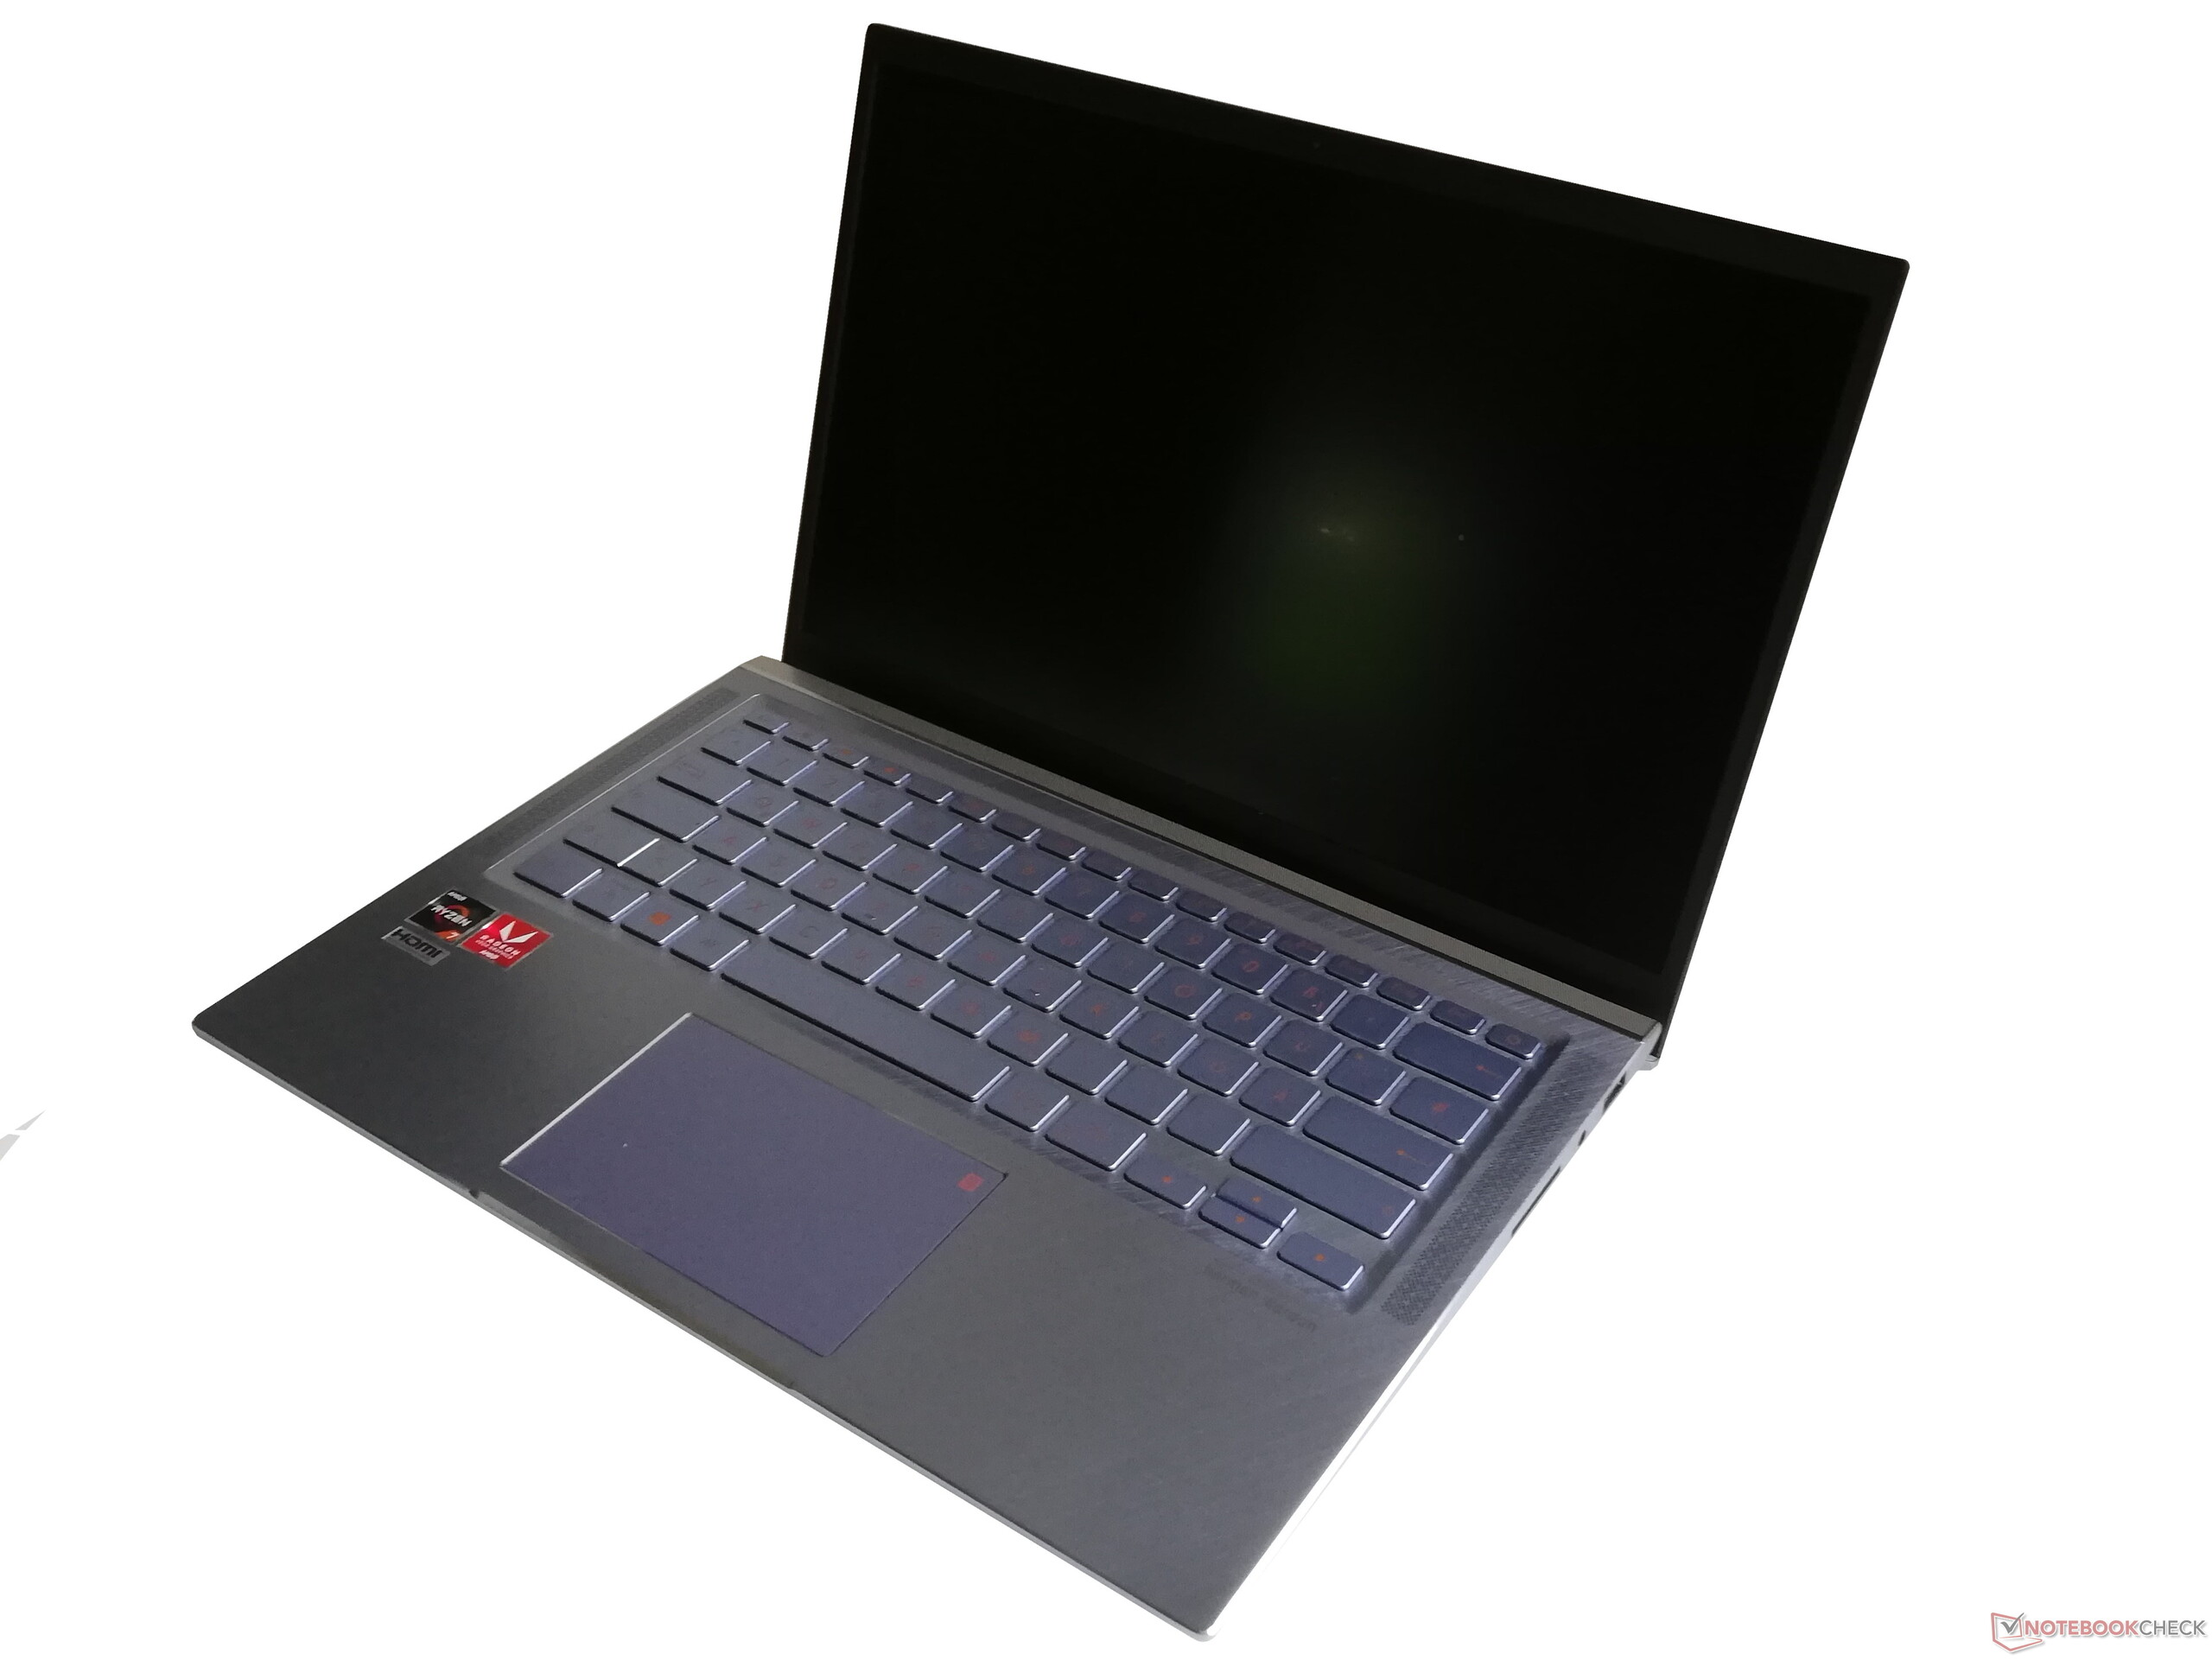
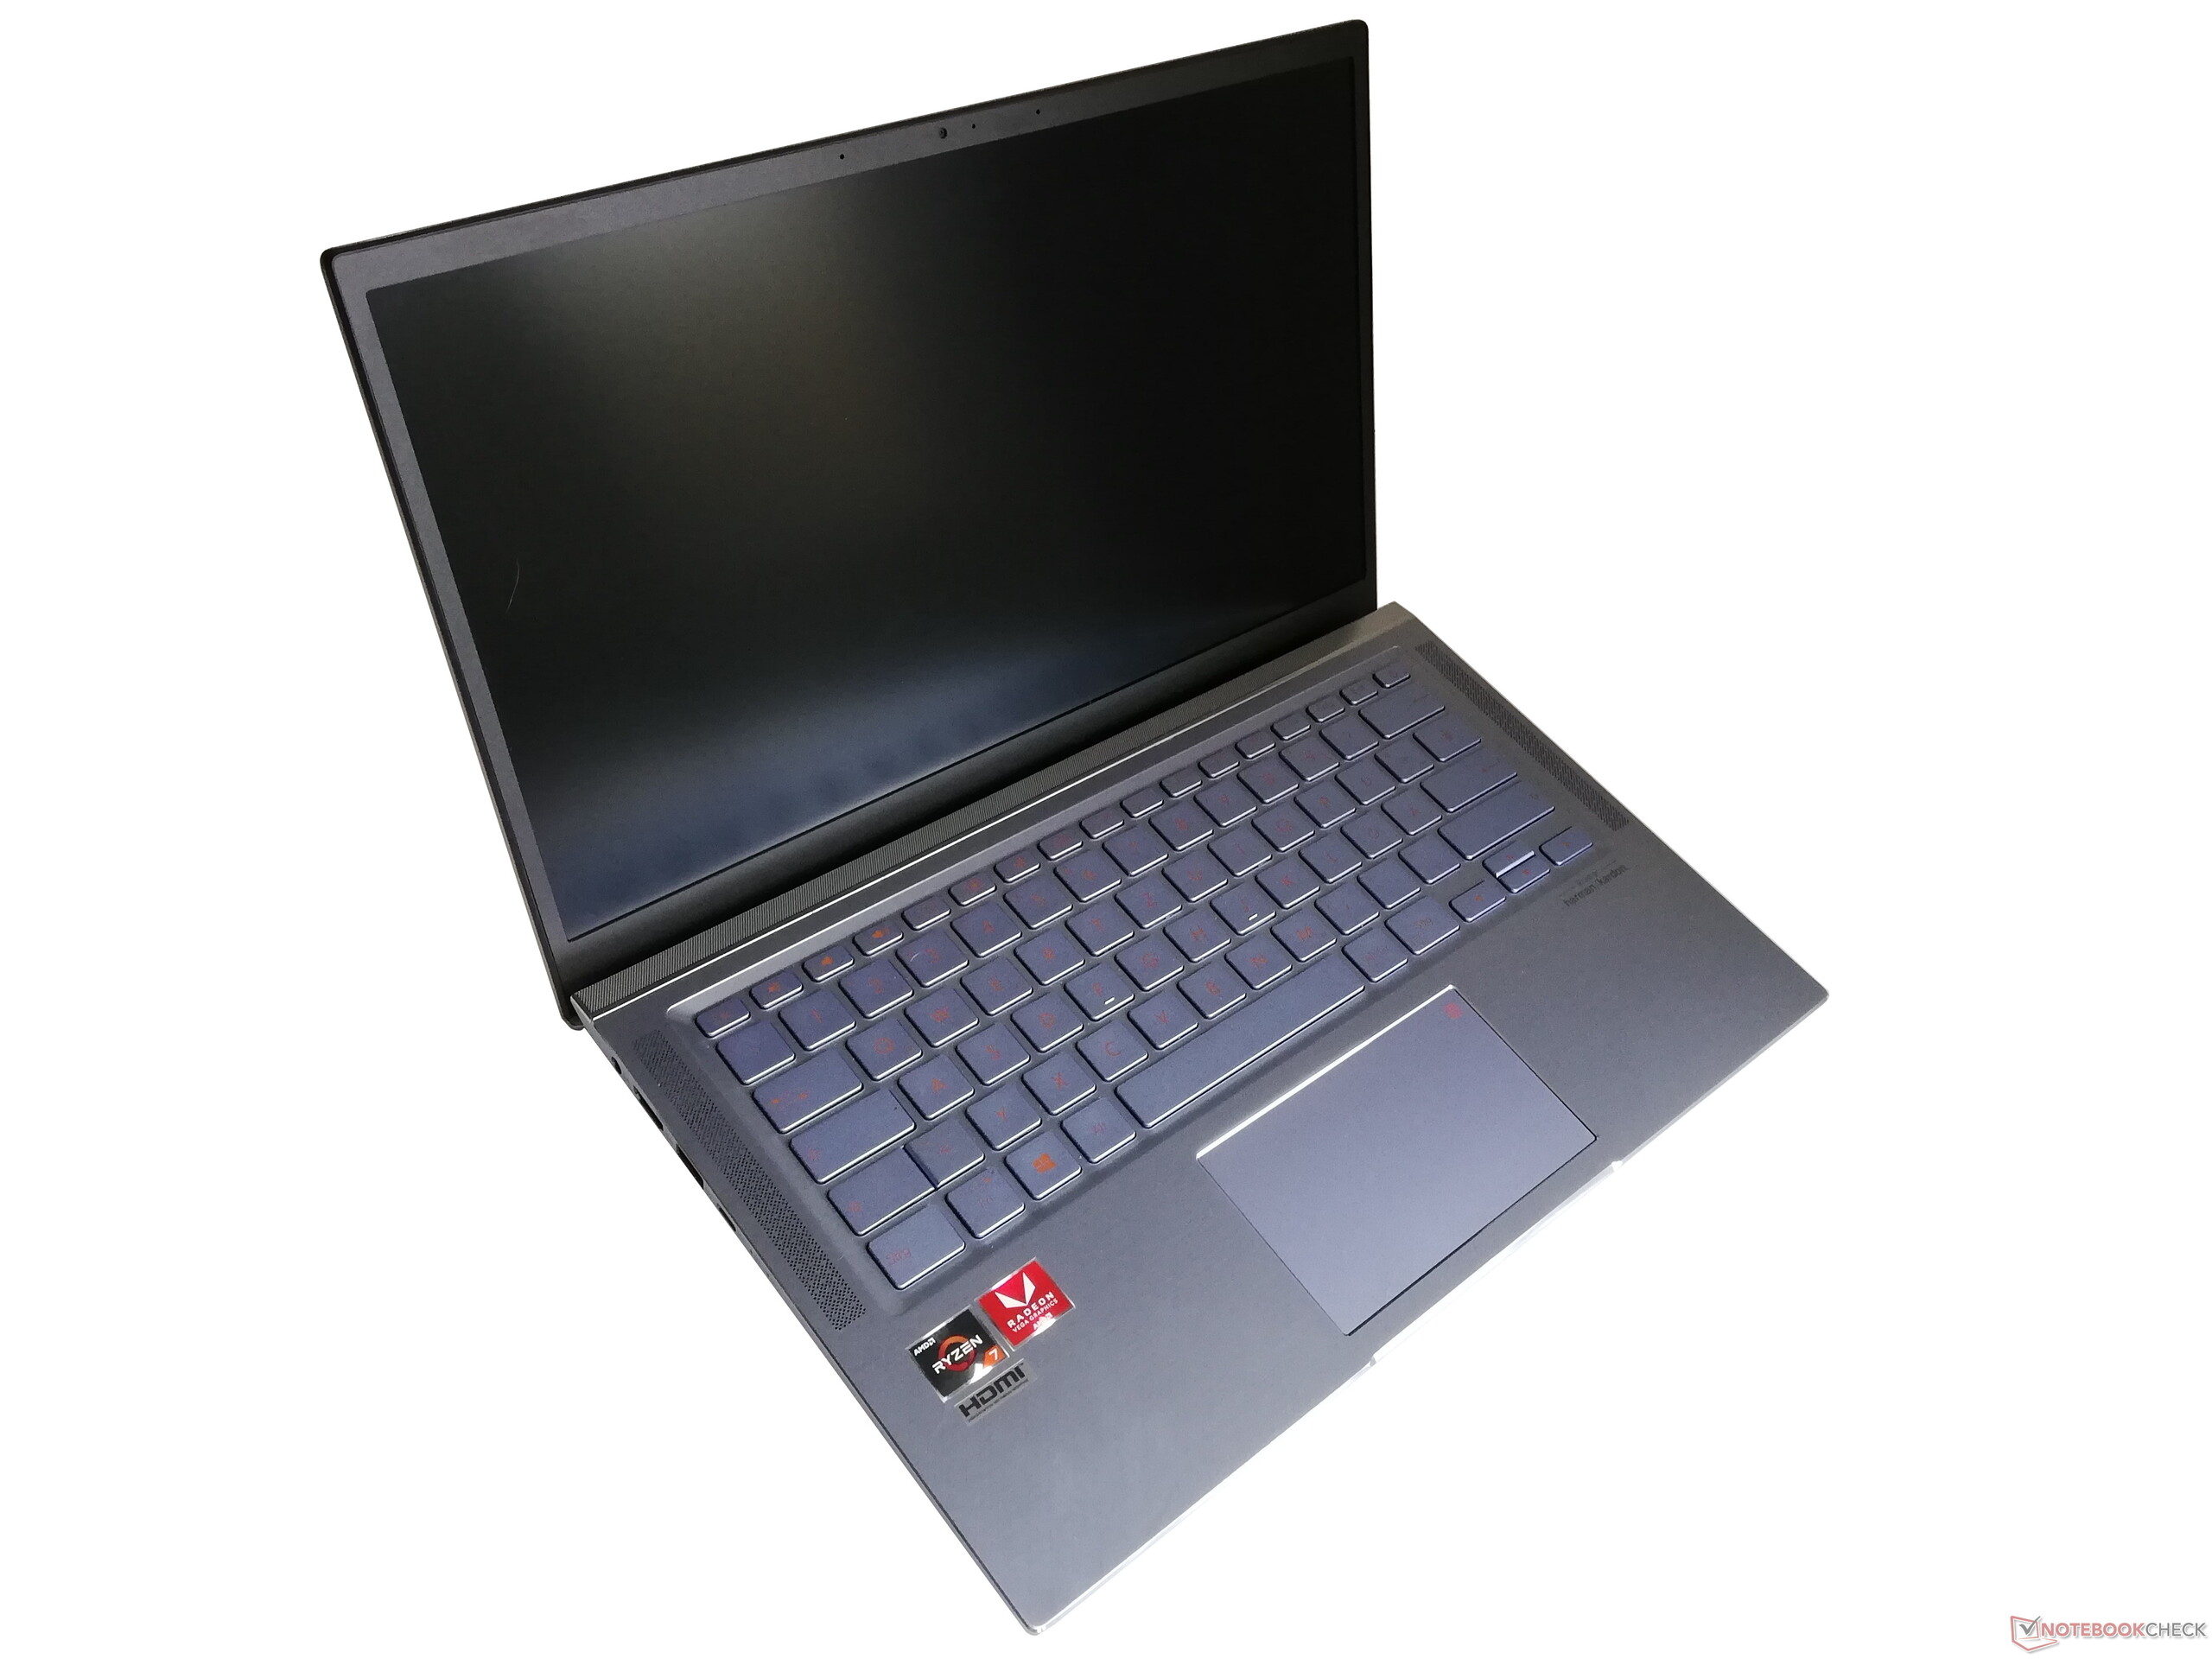
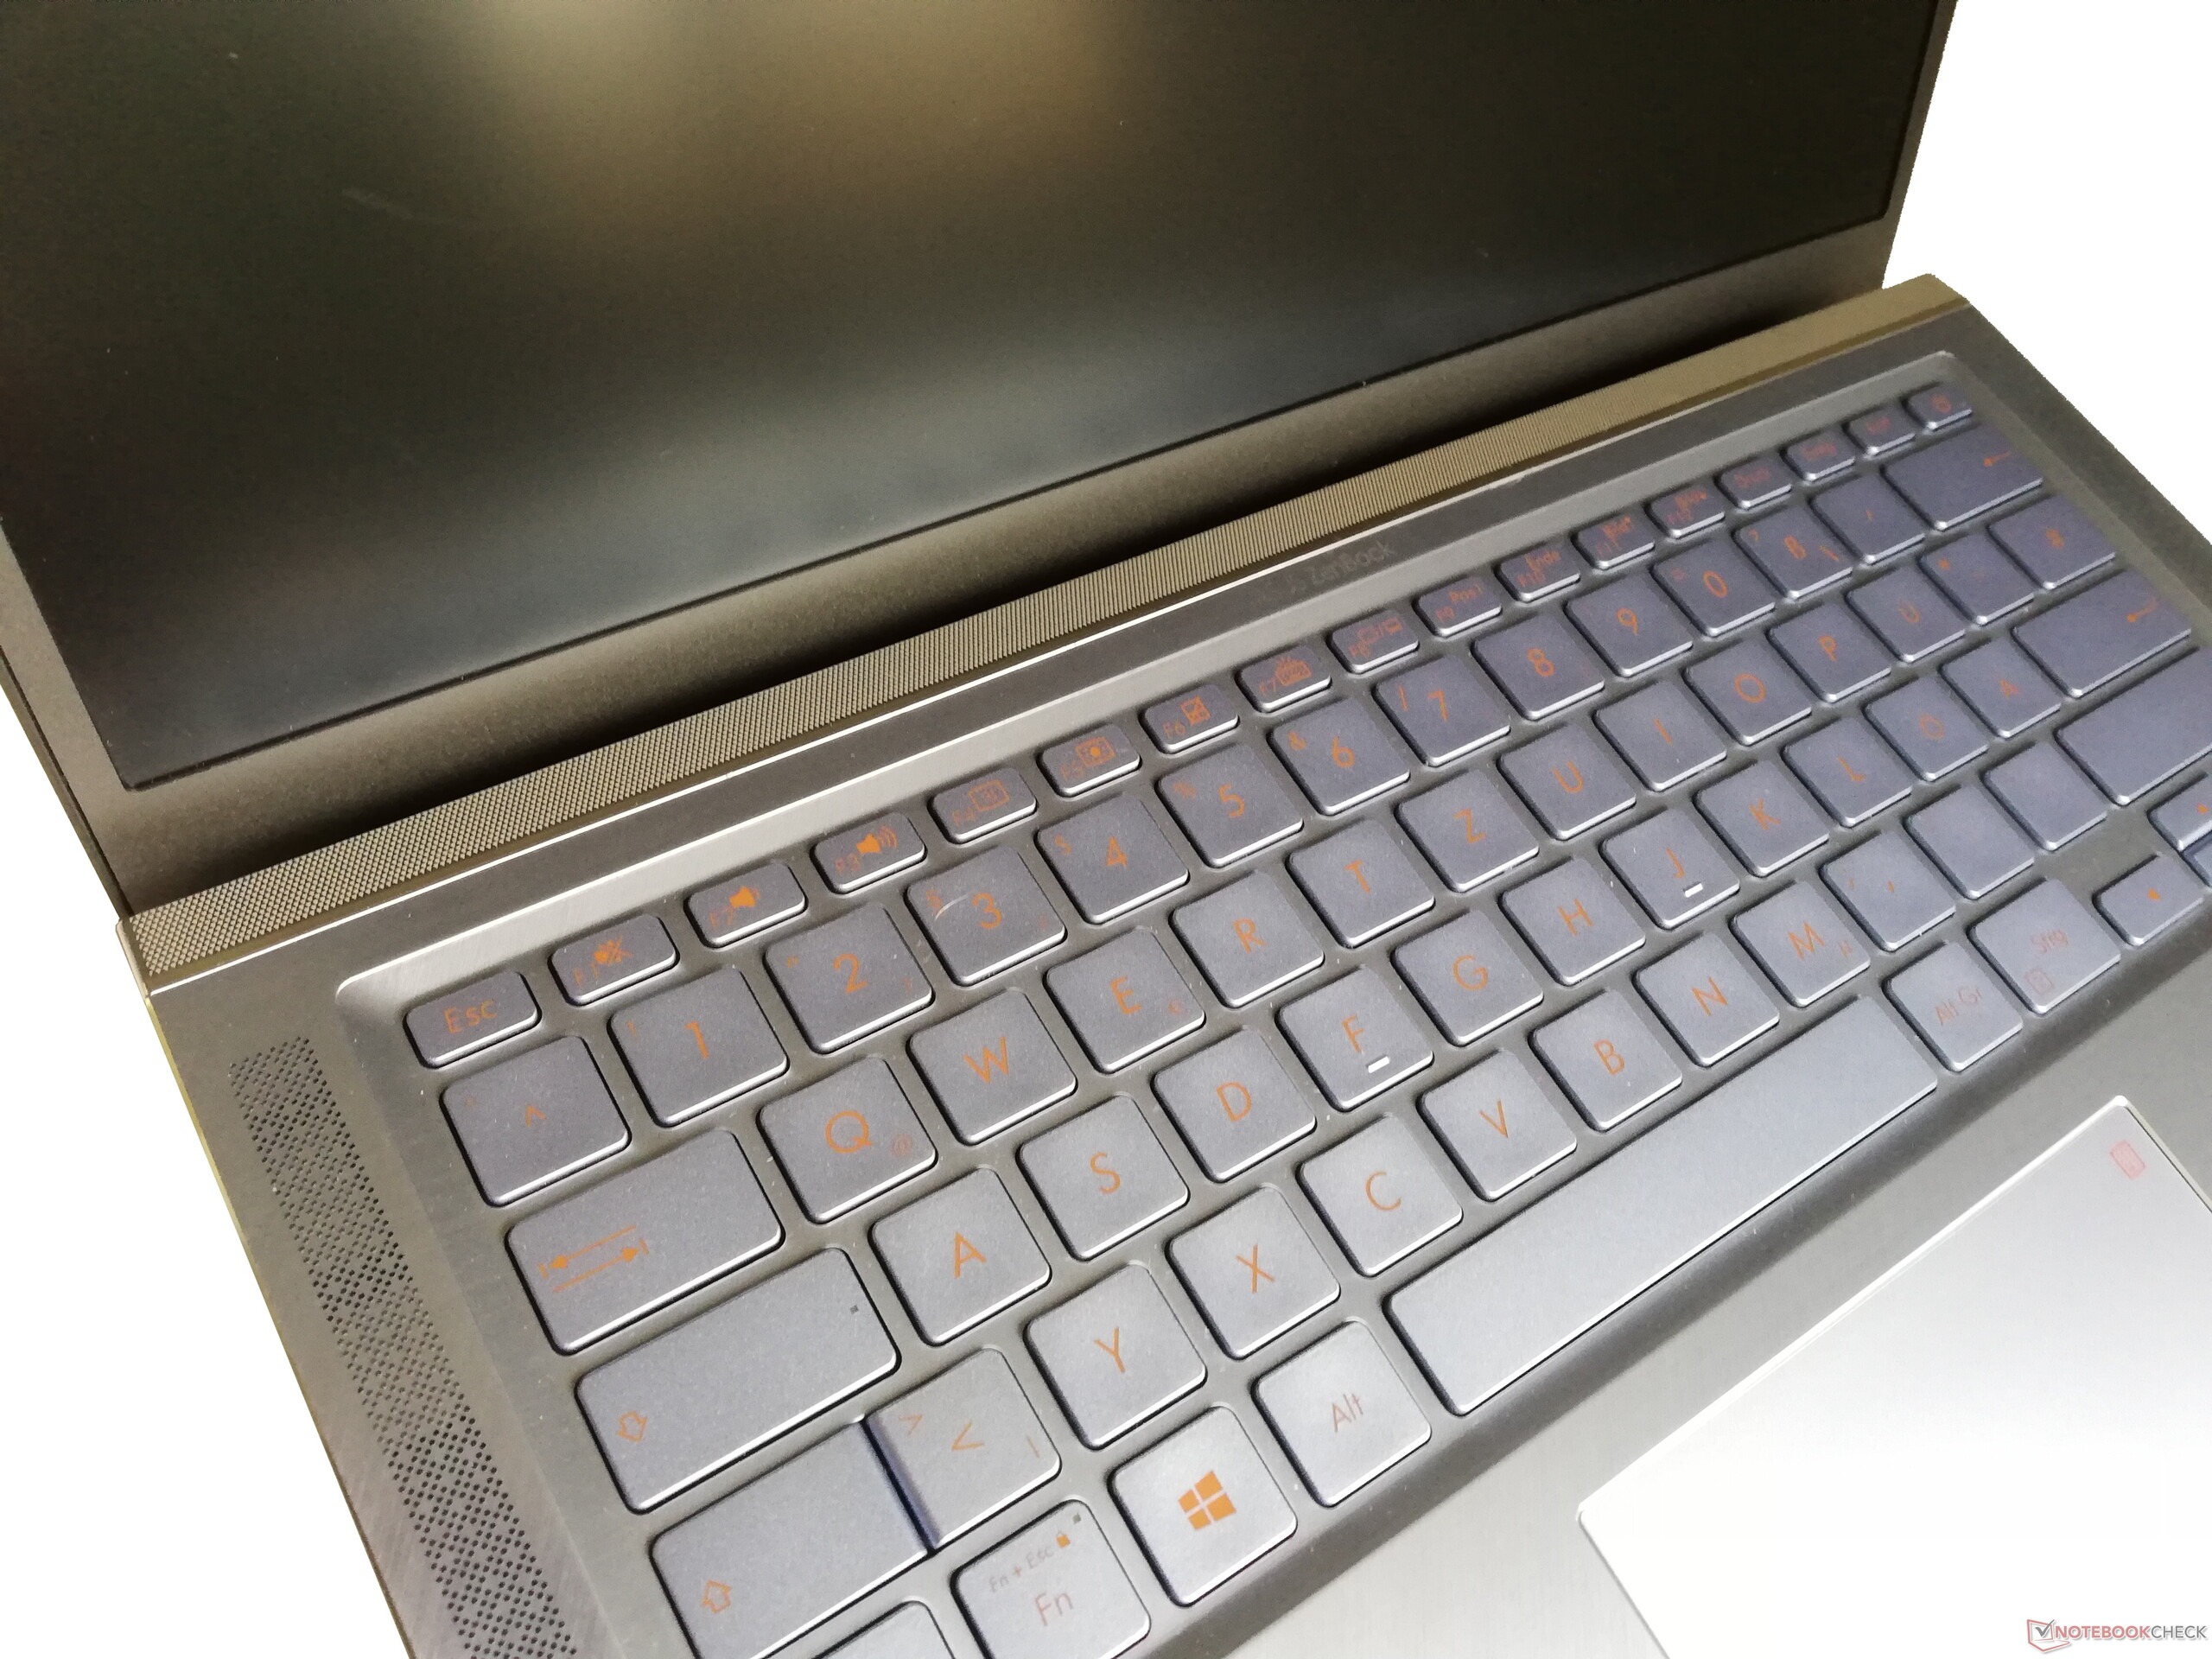
有了Asus ZenBook 14 UM431DA,购买它的人将获得设计出色的笔记本电脑,并且价格相对较低,且轻便。该外壳看起来非常高品质,各种装饰元素给人以更贵的感觉。除此之外,还具有集成数字键盘的功能,事实证明这是对键盘的有效补充。接口稳定可靠,尽管Wi-Fi 5并不是一个很大的卖点,但无线连接速度仍然是快速的。
ZenBook 14是一款外观精美的坚固笔记本电脑。不幸的是,它不能完全利用其CPU的性能。
但是,潜在的购买者不应将自己的选择局限于Ryzen 7 3700U型号,而可以自信地购买性能较弱的CPU型号。由于散热系统不能支持全部性能,因此长期性能远远低于我们为该处理器的期望。由于无法升级内存,因此在购买之前确定合适的型号时还需要考虑其内存大小。如果您最感兴趣的是设计和机身,而不一定是实际性能,那么您仍然可以毫不犹豫地购买这款笔记本电脑。
Asus ZenBook 14 UM431DA-AM020T
- 02/11/2020 v7 (old)
Mike Wobker
Price comparison
