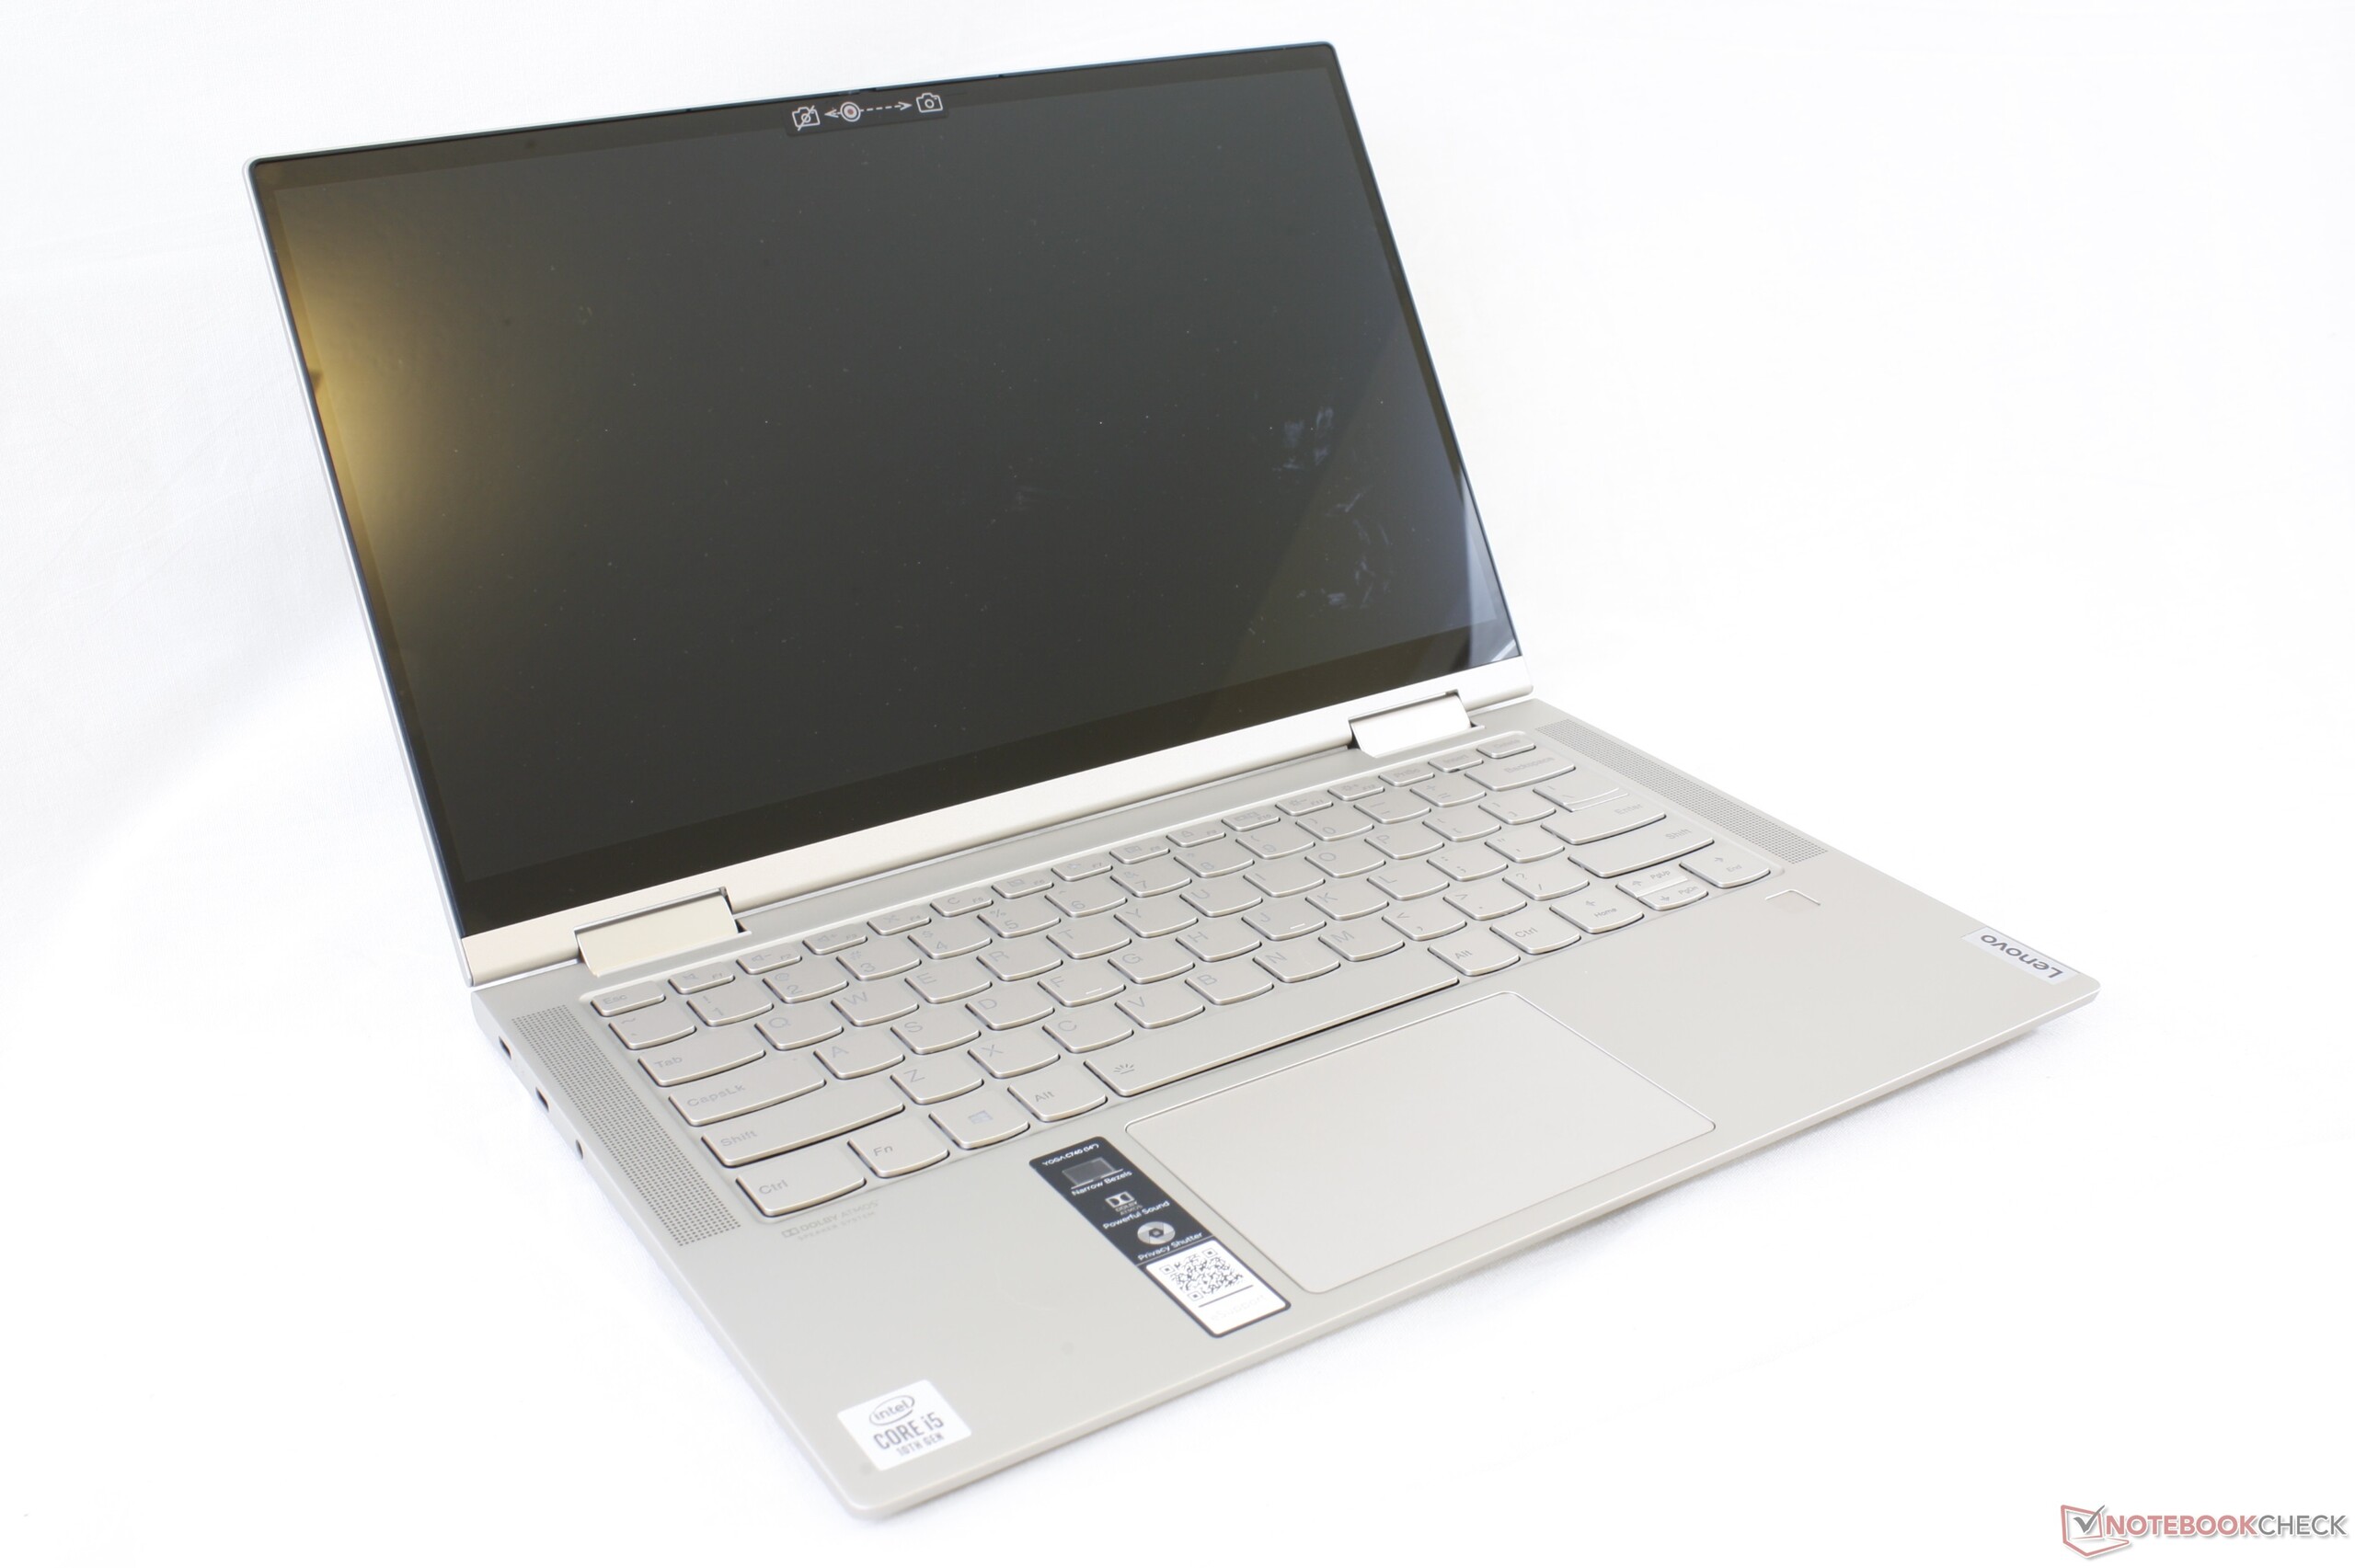
联想Yoga C740-14IML笔记本电脑评测:旗舰外观,中端价格
Rating | Date | Model | Weight | Height | Size | Resolution | Price |
|---|---|---|---|---|---|---|---|
| 84.3 % v7 (old) | 04 / 2020 | Lenovo Yoga C740-14IML i5-10210U, UHD Graphics 620 | 1.4 kg | 16.9 mm | 14.00" | 1920x1080 | |
| 85.9 % v7 (old) | 11 / 2019 | Dell XPS 13 7390 2-in-1 Core i3 i3-1005G1, UHD Graphics G1 (Ice Lake 32 EU) | 1.3 kg | 13 mm | 13.40" | 1920x1200 | |
| 81.2 % v7 (old) | 03 / 2020 | Asus ZenBook Flip 14 UM462DA-AI023T R7 3700U, Vega 10 | 1.6 kg | 18.9 mm | 14.00" | 1920x1080 | |
| 88.1 % v7 (old) | 03 / 2020 | Microsoft Surface Pro 7 i7-1065G7, Iris Plus Graphics G7 (Ice Lake 64 EU) | 790 g | 8.5 mm | 12.30" | 2736x1824 | |
| 88.4 % v7 (old) | 07 / 2020 | HP Spectre x360 13-aw0013dx i7-1065G7, Iris Plus Graphics G7 (Ice Lake 64 EU) | 1.2 kg | 16.9 mm | 13.30" | 1920x1080 |
| Networking | |
| iperf3 transmit AX12 | |
| Acer Aspire 5 A514-52 | |
| MSI Prestige 15 A10SC | |
| Lenovo Yoga C740-14IML | |
| Alienware m17 R2 P41E | |
| iperf3 receive AX12 | |
| MSI Prestige 15 A10SC | |
| Acer Aspire 5 A514-52 | |
| Lenovo Yoga C740-14IML | |
| Alienware m17 R2 P41E | |

| |||||||||||||||||||||||||
Brightness Distribution: 90 %
Center on Battery: 329.9 cd/m²
Contrast: 1138:1 (Black: 0.29 cd/m²)
ΔE ColorChecker Calman: 3.68 | ∀{0.5-29.43 Ø4.73}
calibrated: 1.03
ΔE Greyscale Calman: 6.4 | ∀{0.09-98 Ø4.97}
98.4% sRGB (Argyll 1.6.3 3D)
63.6% AdobeRGB 1998 (Argyll 1.6.3 3D)
70.1% AdobeRGB 1998 (Argyll 3D)
98.3% sRGB (Argyll 3D)
67.9% Display P3 (Argyll 3D)
Gamma: 2.17
CCT: 6195 K
| Lenovo Yoga C740-14IML CMN N140HCE-ET2, IPS, 14", 1920x1080 | Lenovo Yoga C940-14IIL 81Q9 BOE HF NV140QUM-N54, IPS, 14", 3840x2160 | Dell XPS 13 7390 2-in-1 Core i3 Sharp LQ134N1, IPS, 13.4", 1920x1200 | Asus ZenBook Flip 14 UM462DA-AI023T IPS, 14", 1920x1080 | Microsoft Surface Laptop 3 13 Core i5-1035G7 Sharp LQ135P1JX51, IPS, 13.5", 2256x1504 | HP Spectre x360 13-aw0013dx AU Optronics AUO5E2D, IPS, 13.3", 1920x1080 | |
|---|---|---|---|---|---|---|
| Display | 15% | 0% | -9% | -2% | 2% | |
| Display P3 Coverage (%) | 67.9 | 83.8 23% | 68.6 1% | 65.5 -4% | 65.7 -3% | 69.6 3% |
| sRGB Coverage (%) | 98.3 | 99.9 2% | 98.2 0% | 85.2 -13% | 98.6 0% | 98.9 1% |
| AdobeRGB 1998 Coverage (%) | 70.1 | 83.3 19% | 70.4 0% | 62.2 -11% | 67.8 -3% | 71.5 2% |
| Response Times | 1% | -10% | -5% | -40% | -36% | |
| Response Time Grey 50% / Grey 80% * (ms) | 35.6 ? | 44.4 ? -25% | 46 ? -29% | 42 ? -18% | 59.2 ? -66% | 60.8 ? -71% |
| Response Time Black / White * (ms) | 36.8 ? | 27.2 ? 26% | 33.6 ? 9% | 34 ? 8% | 41.6 ? -13% | 36.8 ? -0% |
| PWM Frequency (Hz) | 27030 ? | 2525 ? | 21740 ? | |||
| Screen | -5% | 31% | -33% | 24% | 4% | |
| Brightness middle (cd/m²) | 329.9 | 501.7 52% | 576.3 75% | 306 -7% | 403.4 22% | 447.4 36% |
| Brightness (cd/m²) | 315 | 501 59% | 555 76% | 294 -7% | 397 26% | 420 33% |
| Brightness Distribution (%) | 90 | 82 -9% | 88 -2% | 81 -10% | 89 -1% | 85 -6% |
| Black Level * (cd/m²) | 0.29 | 0.32 -10% | 0.33 -14% | 0.39 -34% | 0.34 -17% | 0.31 -7% |
| Contrast (:1) | 1138 | 1568 38% | 1746 53% | 785 -31% | 1186 4% | 1443 27% |
| Colorchecker dE 2000 * | 3.68 | 5.48 -49% | 1.45 61% | 5.16 -40% | 0.94 74% | 4.23 -15% |
| Colorchecker dE 2000 max. * | 8.64 | 10.03 -16% | 4.12 52% | 9.9 -15% | 2.92 66% | 9.34 -8% |
| Colorchecker dE 2000 calibrated * | 1.03 | 2.22 -116% | 1.19 -16% | 3.07 -198% | 0.99 4% | 1.32 -28% |
| Greyscale dE 2000 * | 6.4 | 8.1 -27% | 3.1 52% | 5.86 8% | 0.9 86% | 6.1 5% |
| Gamma | 2.17 101% | 2.07 106% | 2.27 97% | 2.31 95% | 2.13 103% | 2.11 104% |
| CCT | 6195 105% | 6730 97% | 6931 94% | 6349 102% | 6620 98% | 6136 106% |
| Color Space (Percent of AdobeRGB 1998) (%) | 63.6 | 74.1 17% | 64.2 1% | 56 -12% | 62.3 -2% | 64.8 2% |
| Color Space (Percent of sRGB) (%) | 98.4 | 100 2% | 98.5 0% | 85 -14% | 98.7 0% | 98.9 1% |
| Total Average (Program / Settings) | 4% /
-1% | 7% /
20% | -16% /
-25% | -6% /
11% | -10% /
-2% |
* ... smaller is better
Display Response Times
| ↔ Response Time Black to White | ||
|---|---|---|
| 36.8 ms ... rise ↗ and fall ↘ combined | ↗ 17.2 ms rise | 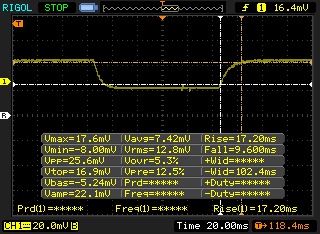 |
| ↘ 9.6 ms fall | ||
| The screen shows slow response rates in our tests and will be unsatisfactory for gamers. In comparison, all tested devices range from 0.1 (minimum) to 240 (maximum) ms. » 95 % of all devices are better. This means that the measured response time is worse than the average of all tested devices (19.9 ms). | ||
| ↔ Response Time 50% Grey to 80% Grey | ||
| 35.6 ms ... rise ↗ and fall ↘ combined | ↗ 19.2 ms rise | 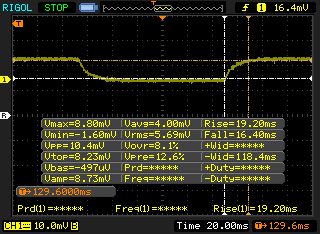 |
| ↘ 16.4 ms fall | ||
| The screen shows slow response rates in our tests and will be unsatisfactory for gamers. In comparison, all tested devices range from 0.165 (minimum) to 636 (maximum) ms. » 50 % of all devices are better. This means that the measured response time is worse than the average of all tested devices (31.1 ms). | ||
Screen Flickering / PWM (Pulse-Width Modulation)
| Screen flickering / PWM detected | 27030 Hz | ≤ 67 % brightness setting | 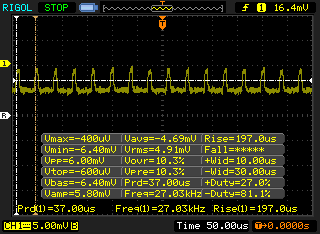 |
The display backlight flickers at 27030 Hz (worst case, e.g., utilizing PWM) Flickering detected at a brightness setting of 67 % and below. There should be no flickering or PWM above this brightness setting. The frequency of 27030 Hz is quite high, so most users sensitive to PWM should not notice any flickering. In comparison: 52 % of all tested devices do not use PWM to dim the display. If PWM was detected, an average of 7801 (minimum: 5 - maximum: 343500) Hz was measured. | |||
| Cinebench R20 | |
| CPU (Single Core) | |
| MSI Modern 15 A10RB | |
| Dell XPS 13 7390 Core i7-10710U | |
| Microsoft Surface Laptop 3 15 i7-1065G7 | |
| Lenovo Yoga C740-14IML | |
| MSI GF63 Thin 9SC | |
| Average Intel Core i5-10210U (322 - 428, n=30) | |
| Dynabook Portege A30-E-174 | |
| Lenovo ThinkPad P43s-20RH001FGE | |
| Walmart Motile M142 | |
| Dell Latitude 13 3390 | |
| Dell Inspiron 15 5000 5585 | |
| CPU (Multi Core) | |
| Dell XPS 13 7390 Core i7-10710U | |
| MSI Modern 15 A10RB | |
| Microsoft Surface Laptop 3 15 i7-1065G7 | |
| MSI GF63 Thin 9SC | |
| Dell Inspiron 15 5000 5585 | |
| Walmart Motile M142 | |
| Lenovo Yoga C740-14IML | |
| Average Intel Core i5-10210U (722 - 1820, n=30) | |
| Dynabook Portege A30-E-174 | |
| Dell Latitude 13 3390 | |
| Lenovo ThinkPad P43s-20RH001FGE | |
| Cinebench R15 | |
| CPU Single 64Bit | |
| MSI Modern 15 A10RB | |
| Microsoft Surface Laptop 3 15 i7-1065G7 | |
| Dell XPS 13 7390 Core i7-10710U | |
| MSI GF63 Thin 9SC | |
| Lenovo Yoga C740-14IML | |
| Average Intel Core i5-10210U (134 - 174, n=35) | |
| Dynabook Portege A30-E-174 | |
| Lenovo ThinkPad P43s-20RH001FGE | |
| Walmart Motile M142 | |
| Dell Latitude 13 3390 | |
| Dell Inspiron 15 5000 5585 | |
| CPU Multi 64Bit | |
| Dell XPS 13 7390 Core i7-10710U | |
| MSI Modern 15 A10RB | |
| MSI GF63 Thin 9SC | |
| Microsoft Surface Laptop 3 15 i7-1065G7 | |
| Lenovo Yoga C740-14IML | |
| Dell Inspiron 15 5000 5585 | |
| Walmart Motile M142 | |
| Average Intel Core i5-10210U (320 - 790, n=35) | |
| Dell Latitude 13 3390 | |
| Dynabook Portege A30-E-174 | |
| Lenovo ThinkPad P43s-20RH001FGE | |
| Cinebench R11.5 | |
| CPU Single 64Bit | |
| Dell XPS 13 7390 Core i7-10710U | |
| Average Intel Core i5-10210U (1.71 - 1.91, n=4) | |
| Dell Latitude 13 3390 | |
| Dell Inspiron 15 5000 5585 | |
| CPU Multi 64Bit | |
| Dell XPS 13 7390 Core i7-10710U | |
| Dell Inspiron 15 5000 5585 | |
| Average Intel Core i5-10210U (5.69 - 8.66, n=4) | |
| Dell Latitude 13 3390 | |
| Cinebench R10 | |
| Rendering Multiple CPUs 32Bit | |
| Dell XPS 13 7390 Core i7-10710U | |
| Average Intel Core i5-10210U (15037 - 22164, n=3) | |
| Dynabook Portege A30-E-174 | |
| Lenovo ThinkPad P43s-20RH001FGE | |
| Rendering Single 32Bit | |
| Dell XPS 13 7390 Core i7-10710U | |
| Average Intel Core i5-10210U (6410 - 6613, n=3) | |
| Dynabook Portege A30-E-174 | |
| Lenovo ThinkPad P43s-20RH001FGE | |
| wPrime 2.10 - 1024m | |
| Average Intel Core i5-10210U (n=1) | |
| Dell XPS 13 7390 Core i7-10710U | |
* ... smaller is better
| PCMark 8 Home Score Accelerated v2 | 3695 points | |
| PCMark 8 Work Score Accelerated v2 | 5098 points | |
| PCMark 10 Score | 4323 points | |
Help | ||
| Lenovo Yoga C740-14IML Samsung SSD PM981a MZVLB256HBHQ | Lenovo Yoga C940-14IIL 81Q9 Samsung PM981a MZVLB1T0HBLR | Dell XPS 13 7390 2-in-1 Core i3 Toshiba BG4 KBG40ZPZ256G | Microsoft Surface Laptop 3 13 Core i5-1035G7 SK hynix BC501 HFM256GDGTNG | Lenovo ThinkBook 15 Samsung SSD PM981 MZVLB512HAJQ | |
|---|---|---|---|---|---|
| AS SSD | 29% | -60% | -33% | 53% | |
| Seq Read (MB/s) | 1719 | 2213 29% | 1558 -9% | 1387 -19% | 2564 49% |
| Seq Write (MB/s) | 1211 | 1401 16% | 1103 -9% | 504 -58% | 2268 87% |
| 4K Read (MB/s) | 53.1 | 55.2 4% | 37.52 -29% | 42.35 -20% | 57 7% |
| 4K Write (MB/s) | 131.4 | 130.3 -1% | 59 -55% | 120 -9% | 141.4 8% |
| 4K-64 Read (MB/s) | 508 | 878 73% | 1684 231% | 497.4 -2% | 1175 131% |
| 4K-64 Write (MB/s) | 883 | 1478 67% | 198.9 -77% | 354.9 -60% | 1665 89% |
| Access Time Read * (ms) | 0.05 | 0.036 28% | 0.099 -98% | 0.055 -10% | 0.032 36% |
| Access Time Write * (ms) | 0.085 | 0.086 -1% | 0.722 -749% | 0.093 -9% | 0.025 71% |
| Score Read (Points) | 733 | 1154 57% | 1877 156% | 678 -8% | 1488 103% |
| Score Write (Points) | 1135 | 1748 54% | 368 -68% | 525 -54% | 2033 79% |
| Score Total (Points) | 2235 | 3467 55% | 3180 42% | 1520 -32% | 4279 91% |
| Copy ISO MB/s (MB/s) | 1636 | 2161 32% | 677 -59% | 764 -53% | 2118 29% |
| Copy Program MB/s (MB/s) | 698 | 572 -18% | 298.4 -57% | 256.1 -63% | 495.6 -29% |
| Copy Game MB/s (MB/s) | 1246 | 1433 15% | 496.1 -60% | 368.4 -70% | 1174 -6% |
| CrystalDiskMark 5.2 / 6 | 11% | -28% | -29% | 15% | |
| Write 4K (MB/s) | 125.6 | 128.6 2% | 61.6 -51% | 112.3 -11% | 176.3 40% |
| Read 4K (MB/s) | 43.46 | 45.25 4% | 39.12 -10% | 42.13 -3% | 48.98 13% |
| Write Seq (MB/s) | 2011 | 1949 -3% | 1220 -39% | 630 -69% | 1789 -11% |
| Read Seq (MB/s) | 2046 | 2359 15% | 1590 -22% | 1023 -50% | 1671 -18% |
| Write 4K Q32T1 (MB/s) | 375.8 | 445 18% | 283.4 -25% | 336.6 -10% | 433.5 15% |
| Read 4K Q32T1 (MB/s) | 338.1 | 404.5 20% | 350.3 4% | 399.6 18% | 526 56% |
| Write Seq Q32T1 (MB/s) | 2346 | 3019 29% | 1238 -47% | 821 -65% | 2983 27% |
| Read Seq Q32T1 (MB/s) | 3562 | 3564 0% | 2330 -35% | 2030 -43% | 3555 0% |
| Write 4K Q8T8 (MB/s) | 1688 | ||||
| Read 4K Q8T8 (MB/s) | 1036 | ||||
| Total Average (Program / Settings) | 20% /
23% | -44% /
-48% | -31% /
-32% | 34% /
39% |
* ... smaller is better

| 3DMark | |
| 1280x720 Cloud Gate Standard Graphics | |
| Dell Inspiron 15 5000 5585 | |
| Dell XPS 13 7390 2-in-1 Core i7 | |
| Lenovo Yoga 530-14ARR-81H9000VGE | |
| Walmart Motile M142 | |
| Lenovo Yoga C740-14IML | |
| Dell XPS 13 7390 Core i7-10710U | |
| Average Intel UHD Graphics 620 (6205 - 16400, n=225) | |
| HP Pavilion x360 15-dq0065cl | |
| Chuwi LapBook Plus | |
| 1920x1080 Fire Strike Graphics | |
| Dell XPS 13 7390 2-in-1 Core i7 | |
| Dell Inspiron 15 5000 5585 | |
| Lenovo Yoga 530-14ARR-81H9000VGE | |
| Walmart Motile M142 | |
| Apple MacBook Pro 13 2019 2TB3 | |
| Dell XPS 13 7390 Core i7-10710U | |
| Lenovo Yoga C740-14IML | |
| Average Intel UHD Graphics 620 (557 - 2608, n=213) | |
| HP Pavilion x360 15-dq0065cl | |
| 2560x1440 Time Spy Graphics | |
| Dell Inspiron 15 5000 5585 | |
| Dell XPS 13 7390 2-in-1 Core i7 | |
| Lenovo Yoga 530-14ARR-81H9000VGE | |
| Walmart Motile M142 | |
| Apple MacBook Pro 13 2019 2TB3 | |
| Dell XPS 13 7390 Core i7-10710U | |
| Lenovo Yoga C740-14IML | |
| Average Intel UHD Graphics 620 (299 - 797, n=88) | |
| HP Pavilion x360 15-dq0065cl | |
| Chuwi LapBook Plus | |
| 3DMark 11 | |
| 1280x720 Performance GPU | |
| Dell XPS 13 7390 2-in-1 Core i7 | |
| Dell Inspiron 15 5000 5585 | |
| Lenovo Yoga 530-14ARR-81H9000VGE | |
| Walmart Motile M142 | |
| Apple MacBook Pro 13 2019 2TB3 | |
| Dell XPS 13 7390 Core i7-10710U | |
| Lenovo Yoga C740-14IML | |
| HP Pavilion x360 15-dq0065cl | |
| Average Intel UHD Graphics 620 (1144 - 3432, n=244) | |
| Chuwi LapBook Plus | |
| 1280x720 Performance Combined | |
| Dell XPS 13 7390 2-in-1 Core i7 | |
| Dell Inspiron 15 5000 5585 | |
| Lenovo Yoga 530-14ARR-81H9000VGE | |
| Apple MacBook Pro 13 2019 2TB3 | |
| Dell XPS 13 7390 Core i7-10710U | |
| Walmart Motile M142 | |
| Lenovo Yoga C740-14IML | |
| Average Intel UHD Graphics 620 (927 - 2505, n=244) | |
| HP Pavilion x360 15-dq0065cl | |
| Chuwi LapBook Plus | |
| 3DMark 11 Performance | 2047 points | |
| 3DMark Cloud Gate Standard Score | 8981 points | |
| 3DMark Fire Strike Score | 1156 points | |
| 3DMark Time Spy Score | 467 points | |
Help | ||
| Rocket League | |
| 1280x720 Performance | |
| MSI Prestige 15 A10SC | |
| MSI Modern 15 A10RB | |
| Dell Inspiron 15 5000 5585 | |
| Lenovo Yoga C940-14IIL 81Q9 | |
| Microsoft Surface Pro 7 | |
| Microsoft Surface Laptop 3 13 Core i5-1035G7 | |
| Dell XPS 13 7390 Core i7-10710U | |
| Lenovo Yoga C740-14IML | |
| Dell XPS 13 7390 2-in-1 Core i3 | |
| HP Pavilion x360 15-dq0065cl | |
| Average Intel UHD Graphics 620 (20.1 - 95, n=26) | |
| Chuwi LapBook Plus | |
| Acer Aspire 5 A514-52 | |
| 1920x1080 Quality AA:Medium FX | |
| MSI Prestige 15 A10SC | |
| MSI Modern 15 A10RB | |
| Lenovo Yoga C940-14IIL 81Q9 | |
| Microsoft Surface Pro 7 | |
| Dell Inspiron 15 5000 5585 | |
| Microsoft Surface Laptop 3 13 Core i5-1035G7 | |
| Dell XPS 13 7390 2-in-1 Core i3 | |
| Dell XPS 13 7390 Core i7-10710U | |
| Lenovo Yoga C740-14IML | |
| Average Intel UHD Graphics 620 (13.1 - 43, n=24) | |
| Chuwi LapBook Plus | |
| low | med. | high | ultra | |
|---|---|---|---|---|
| BioShock Infinite (2013) | 75.6 | 38.2 | 31.8 | 10.5 |
| Rocket League (2017) | 70.4 | 33.6 | 20.6 | |
| Shadow of the Tomb Raider (2018) | 13 |
| Lenovo Yoga C740-14IML UHD Graphics 620, i5-10210U, Samsung SSD PM981a MZVLB256HBHQ | Lenovo Yoga C940-14IIL 81Q9 Iris Plus Graphics G7 (Ice Lake 64 EU), i7-1065G7, Samsung PM981a MZVLB1T0HBLR | Dell XPS 13 7390 2-in-1 Core i3 UHD Graphics G1 (Ice Lake 32 EU), i3-1005G1, Toshiba BG4 KBG40ZPZ256G | Asus ZenBook Flip 14 UM462DA-AI023T Vega 10, R7 3700U | Microsoft Surface Laptop 3 13 Core i5-1035G7 Iris Plus Graphics G7 (Ice Lake 64 EU), i5-1035G7, SK hynix BC501 HFM256GDGTNG | HP Spectre x360 13-aw0013dx Iris Plus Graphics G7 (Ice Lake 64 EU), i7-1065G7, Intel Optane Memory H10 with Solid State Storage 32GB + 512GB HBRPEKNX0202A(L/H) | |
|---|---|---|---|---|---|---|
| Noise | 1% | 1% | -2% | 3% | 5% | |
| off / environment * (dB) | 29 | 28.5 2% | 28 3% | 30 -3% | 28.5 2% | 28.5 2% |
| Idle Minimum * (dB) | 29 | 28.5 2% | 28 3% | 30 -3% | 28.5 2% | 28.5 2% |
| Idle Average * (dB) | 29 | 28.5 2% | 28 3% | 30 -3% | 28.5 2% | 28.5 2% |
| Idle Maximum * (dB) | 29.7 | 29 2% | 28 6% | 30 -1% | 28.5 4% | 28.5 4% |
| Load Average * (dB) | 32.6 | 33 -1% | 31.7 3% | 34.2 -5% | 28.5 13% | 28.5 13% |
| Load Maximum * (dB) | 39 | 39.5 -1% | 43.5 -12% | 37.5 4% | 40.4 -4% | 35.3 9% |
| Witcher 3 ultra * (dB) | 40.7 | 40.4 | 35.3 |
* ... smaller is better
Noise level
| Idle |
| 29 / 29 / 29.7 dB(A) |
| Load |
| 32.6 / 39 dB(A) |
 | ||
30 dB silent 40 dB(A) audible 50 dB(A) loud |
||
min: | ||
(+) The maximum temperature on the upper side is 38.6 °C / 101 F, compared to the average of 35.4 °C / 96 F, ranging from 19.6 to 60 °C for the class Convertible.
(±) The bottom heats up to a maximum of 42.6 °C / 109 F, compared to the average of 36.9 °C / 98 F
(+) In idle usage, the average temperature for the upper side is 25.2 °C / 77 F, compared to the device average of 30.3 °C / 87 F.
(+) The palmrests and touchpad are cooler than skin temperature with a maximum of 27.6 °C / 81.7 F and are therefore cool to the touch.
(±) The average temperature of the palmrest area of similar devices was 28 °C / 82.4 F (+0.4 °C / 0.7 F).
Lenovo Yoga C740-14IML audio analysis
(+) | speakers can play relatively loud (82.6 dB)
Bass 100 - 315 Hz
(±) | reduced bass - on average 13.1% lower than median
(±) | linearity of bass is average (9.4% delta to prev. frequency)
Mids 400 - 2000 Hz
(+) | balanced mids - only 4.7% away from median
(±) | linearity of mids is average (7.2% delta to prev. frequency)
Highs 2 - 16 kHz
(+) | balanced highs - only 4.2% away from median
(+) | highs are linear (6.1% delta to prev. frequency)
Overall 100 - 16.000 Hz
(±) | linearity of overall sound is average (21.1% difference to median)
Compared to same class
» 56% of all tested devices in this class were better, 11% similar, 33% worse
» The best had a delta of 6%, average was 20%, worst was 57%
Compared to all devices tested
» 58% of all tested devices were better, 7% similar, 35% worse
» The best had a delta of 4%, average was 24%, worst was 134%
Apple MacBook 12 (Early 2016) 1.1 GHz audio analysis
(+) | speakers can play relatively loud (83.6 dB)
Bass 100 - 315 Hz
(±) | reduced bass - on average 11.3% lower than median
(±) | linearity of bass is average (14.2% delta to prev. frequency)
Mids 400 - 2000 Hz
(+) | balanced mids - only 2.4% away from median
(+) | mids are linear (5.5% delta to prev. frequency)
Highs 2 - 16 kHz
(+) | balanced highs - only 2% away from median
(+) | highs are linear (4.5% delta to prev. frequency)
Overall 100 - 16.000 Hz
(+) | overall sound is linear (10.2% difference to median)
Compared to same class
» 7% of all tested devices in this class were better, 2% similar, 91% worse
» The best had a delta of 5%, average was 18%, worst was 53%
Compared to all devices tested
» 5% of all tested devices were better, 1% similar, 94% worse
» The best had a delta of 4%, average was 24%, worst was 134%
| Off / Standby | |
| Idle | |
| Load |
|
Key:
min: | |
| Lenovo Yoga C740-14IML i5-10210U, UHD Graphics 620, Samsung SSD PM981a MZVLB256HBHQ, IPS, 1920x1080, 14" | Lenovo Yoga C940-14IIL 81Q9 i7-1065G7, Iris Plus Graphics G7 (Ice Lake 64 EU), Samsung PM981a MZVLB1T0HBLR, IPS, 3840x2160, 14" | Dell XPS 13 7390 2-in-1 Core i3 i3-1005G1, UHD Graphics G1 (Ice Lake 32 EU), Toshiba BG4 KBG40ZPZ256G, IPS, 1920x1200, 13.4" | Asus ZenBook Flip 14 UM462DA-AI023T R7 3700U, Vega 10, , IPS, 1920x1080, 14" | Microsoft Surface Laptop 3 13 Core i5-1035G7 i5-1035G7, Iris Plus Graphics G7 (Ice Lake 64 EU), SK hynix BC501 HFM256GDGTNG, IPS, 2256x1504, 13.5" | Lenovo Yoga C740-15IML i7-10510U, UHD Graphics 620, Samsung SSD PM981 MZVLB512HAJQ, IPS LED, 1920x1080, 15.6" | |
|---|---|---|---|---|---|---|
| Power Consumption | -69% | 2% | -15% | -29% | -23% | |
| Idle Minimum * (Watt) | 3 | 5.6 -87% | 3 -0% | 3.7 -23% | 4.4 -47% | 2.97 1% |
| Idle Average * (Watt) | 3.9 | 10.5 -169% | 5.4 -38% | 6.9 -77% | 7.5 -92% | 7.2 -85% |
| Idle Maximum * (Watt) | 7.3 | 12 -64% | 7.3 -0% | 9.4 -29% | 7.8 -7% | 9.9 -36% |
| Load Average * (Watt) | 42.5 | 53.3 -25% | 33.4 21% | 34 20% | 41.9 1% | 40.8 4% |
| Load Maximum * (Watt) | 65.5 | 64.6 1% | 48.3 26% | 44 33% | 63.9 2% | 64.7 1% |
| Witcher 3 ultra * (Watt) | 46.9 | 40.8 |
* ... smaller is better
| Lenovo Yoga C740-14IML i5-10210U, UHD Graphics 620, 51 Wh | Lenovo Yoga C940-14IIL 81Q9 i7-1065G7, Iris Plus Graphics G7 (Ice Lake 64 EU), 60 Wh | Dell XPS 13 7390 2-in-1 Core i3 i3-1005G1, UHD Graphics G1 (Ice Lake 32 EU), 51 Wh | Asus ZenBook Flip 14 UM462DA-AI023T R7 3700U, Vega 10, 42 Wh | Microsoft Surface Laptop 3 13 Core i5-1035G7 i5-1035G7, Iris Plus Graphics G7 (Ice Lake 64 EU), 45 Wh | HP Spectre x360 13-aw0013dx i7-1065G7, Iris Plus Graphics G7 (Ice Lake 64 EU), 60 Wh | |
|---|---|---|---|---|---|---|
| Battery runtime | -21% | 39% | -18% | 29% | 55% | |
| Reader / Idle (h) | 18.6 | 35.7 92% | 34.4 85% | 37.1 99% | ||
| WiFi v1.3 (h) | 9.2 | 7.3 -21% | 8.9 -3% | 7.5 -18% | 8.3 -10% | 9.9 8% |
| Load (h) | 1.7 | 2.2 29% | 1.9 12% | 2.7 59% |
Pros
Cons
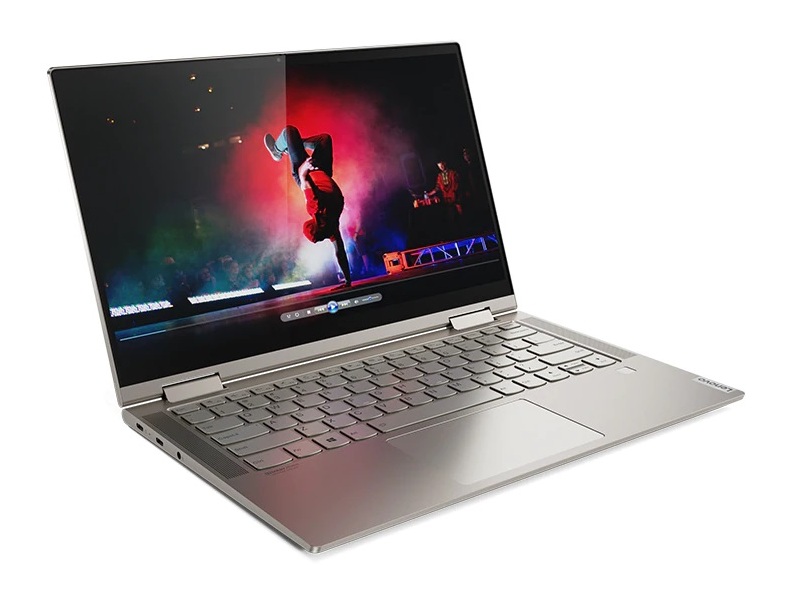
联想在当前市场上已经将Yoga C740-14定位得很好。当配置相同的RAM和存储容量,同时提供比HP Spectre x360 13更大的屏幕尺寸时,它比Dell XPS 13 7390 2合1和Asus ZenBook Flip 14便宜数百美元。 C740保留了高质量的外观和质感,即使售价远低于1000美元,大多数用户也可以得到旗舰机的品质。如果您不关心4K,Thunderbolt 3或Ice Lake的CPU,那么这是一个不错的选择。
不过仍然存在一系列弊端。例如一定的屏幕漏光,相对暗淡的屏幕,出厂的校准色差,软绵绵的键盘以及负载下的高音调风扇噪音,使整体体验不如预期的稳定。不过,考虑到价格,它是一款全能的翻转本,绝对比省钱去买可怕的HP Pavilion x360或便宜的VivoBook Flip等更值得。
联想Yoga C740-14是中端产品中最好的翻转本之一,因为它的外观和质感更接近价格更高的高端机型,而无需花费更多。
Lenovo Yoga C740-14IML
- 03/03/2020 v7 (old)
Allen Ngo
Price comparison

