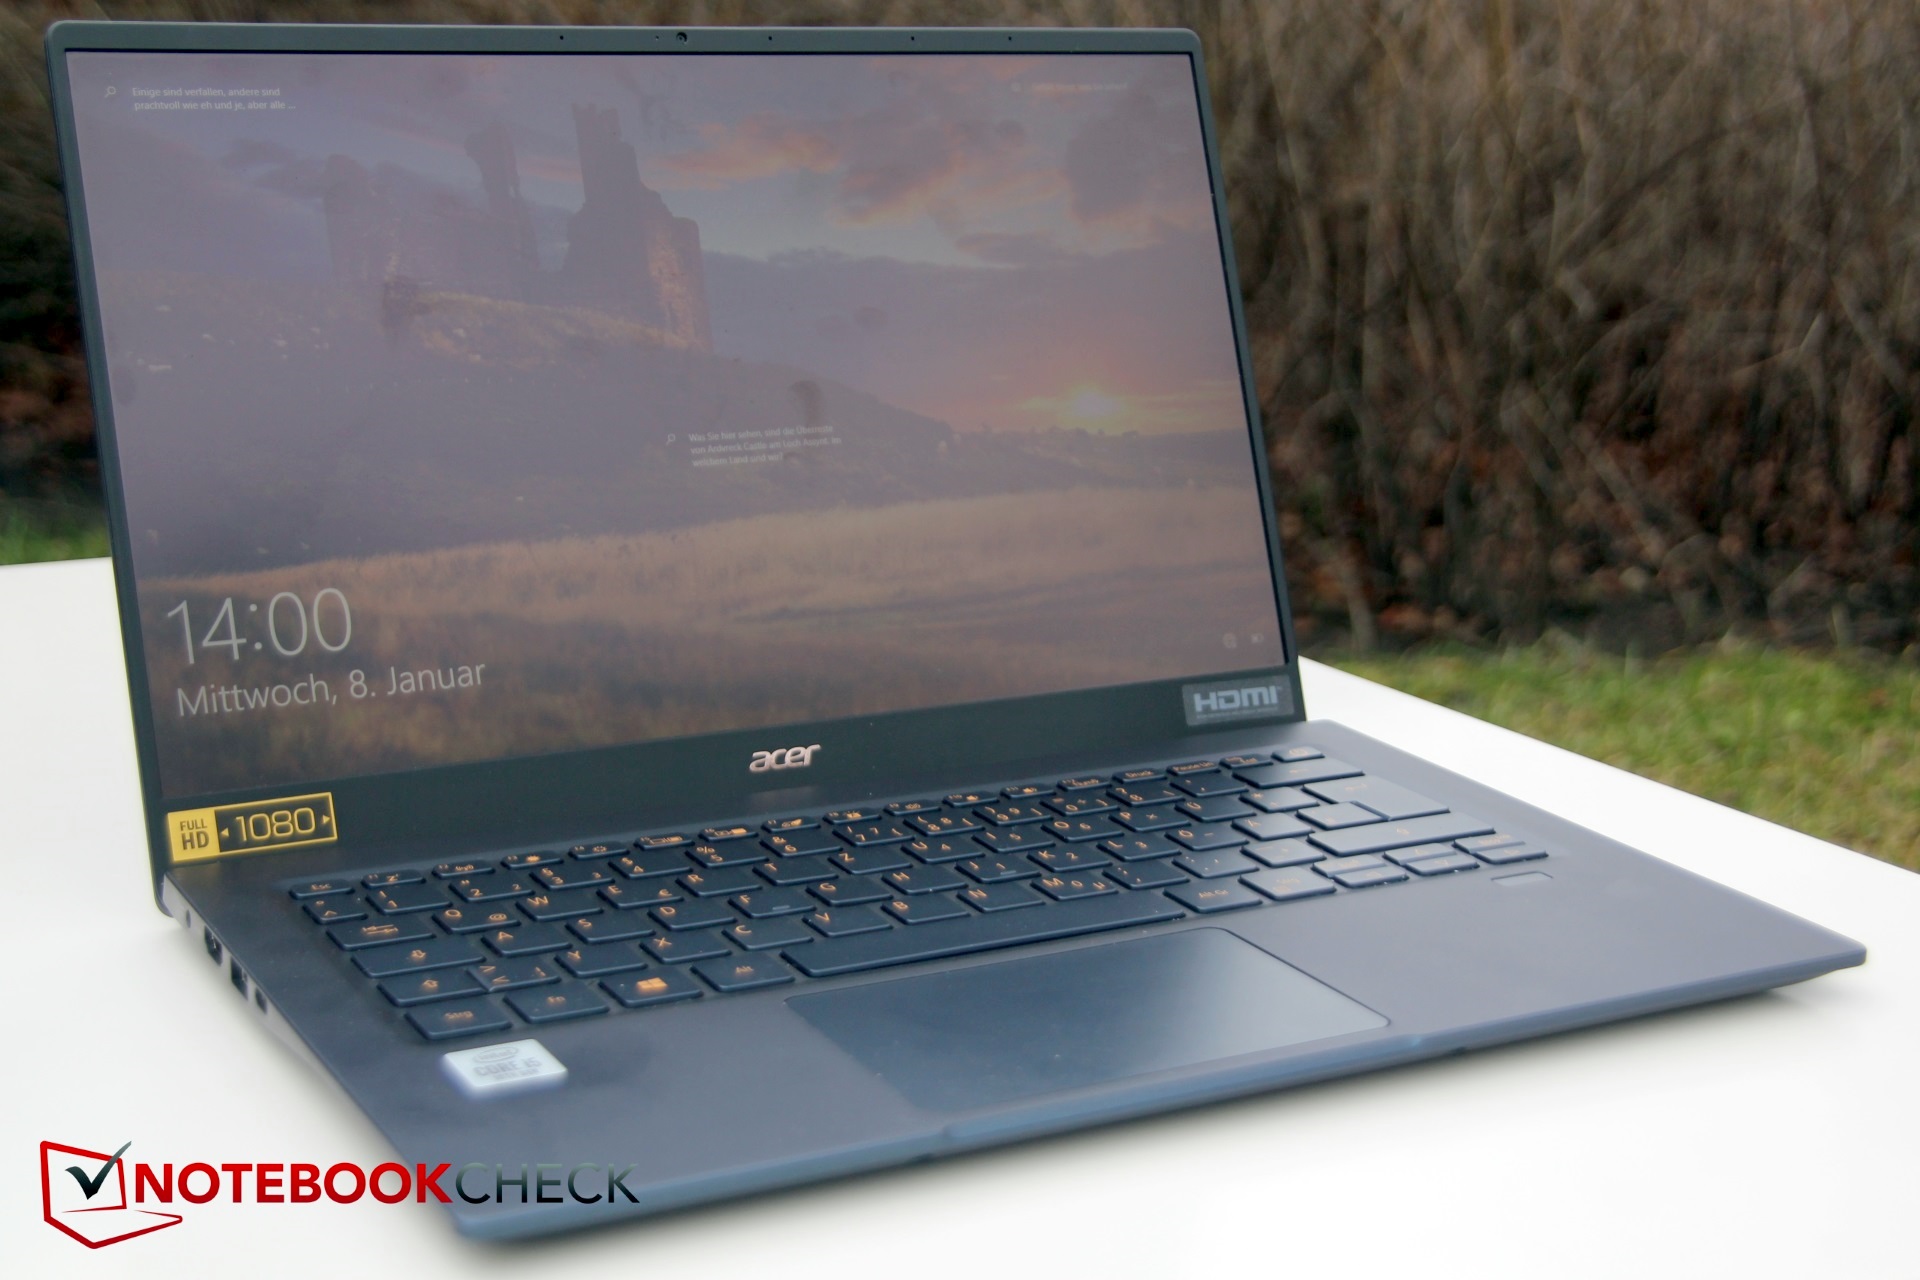
宏碁蜂鸟5笔记本电脑评测:14英寸超极本的全面提升
Rating | Date | Model | Weight | Height | Size | Resolution | Price |
|---|---|---|---|---|---|---|---|
| 86.3 % v7 (old) | 02 / 2020 | Acer Swift 5 SF514-54T-501U i5-1035G1, UHD Graphics G1 (Ice Lake 32 EU) | 943 g | 14.95 mm | 14.00" | 1920x1080 | |
| 84.3 % v6 (old) | Acer Swift 5 SF514-52T-59HY i5-8250U, UHD Graphics 620 | 930 g | 15 mm | 14.00" | 1920x1080 | ||
| 84.2 % v7 (old) | 11 / 2019 | Acer Swift 7 SF714-52T-76MR i7-8500Y, UHD Graphics 615 | 890 g | 9.95 mm | 14.00" | 1920x1080 | |
| 83.9 % v7 (old) | Acer TravelMate X514-51-511Q i5-8265U, UHD Graphics 620 | 980 g | 15 mm | 14.00" | 1920x1080 | ||
| 84.8 % v6 (old) | 02 / 2019 | Asus Zenbook 14 UX433FA-A6018T i5-8265U, UHD Graphics 620 | 1.2 kg | 15.9 mm | 14.00" | 1920x1080 | |
| 85 % v6 (old) | 07 / 2018 | LG Gram 14Z980-U.AAW5U1 i5-8250U, UHD Graphics 620 | 994 g | 15.2 mm | 14.00" | 1920x1080 |
| Networking | |
| iperf3 transmit AX12 | |
| Acer Swift 5 SF514-54T-501U | |
| Asus Zenbook 14 UX433FA-A6018T | |
| Acer Swift 5 SF514-52T-59HY | |
| LG Gram 14Z980-U.AAW5U1 | |
| iperf3 receive AX12 | |
| Acer Swift 5 SF514-54T-501U | |
| Asus Zenbook 14 UX433FA-A6018T | |
| LG Gram 14Z980-U.AAW5U1 | |
| Acer Swift 5 SF514-52T-59HY | |
| |||||||||||||||||||||||||
Brightness Distribution: 84 %
Center on Battery: 320 cd/m²
Contrast: 1387:1 (Black: 0.23 cd/m²)
ΔE ColorChecker Calman: 2.53 | ∀{0.5-29.43 Ø4.73}
calibrated: 2.67
ΔE Greyscale Calman: 2.22 | ∀{0.09-98 Ø4.97}
95% sRGB (Argyll 1.6.3 3D)
62% AdobeRGB 1998 (Argyll 1.6.3 3D)
69.2% AdobeRGB 1998 (Argyll 3D)
94.7% sRGB (Argyll 3D)
68.6% Display P3 (Argyll 3D)
Gamma: 2.54
CCT: 6381 K
| Acer Swift 5 SF514-54T-501U AU Optronics AUO253D, IPS, CineCrystal, 1920x1080, 14" | Acer Swift 5 SF514-52T-59HY AU Optronics AUO203D, IPS, 1920x1080, 14" | Acer Swift 7 SF714-52T-76MR AU Optronics B140HAN06.0, IPS, 1920x1080, 14" | Acer TravelMate X514-51-511Q Chi mei CMN14D5, IPS, 1920x1080, 14" | LG Gram 14Z980-U.AAW5U1 LG Philips LP140WF7-SPG1, IPS, 1920x1080, 14" | Asus Zenbook 14 UX433FA-A6018T AU Optronics B140HAN03.2, IPS, 1920x1080, 14" | |
|---|---|---|---|---|---|---|
| Display | 3% | 3% | 0% | -4% | -6% | |
| Display P3 Coverage (%) | 68.6 | 69.7 2% | 69.9 2% | 67 -2% | 64.7 -6% | 63.5 -7% |
| sRGB Coverage (%) | 94.7 | 97.1 3% | 99.4 5% | 98.9 4% | 94.3 0% | 90.9 -4% |
| AdobeRGB 1998 Coverage (%) | 69.2 | 71 3% | 71 3% | 68.6 -1% | 66 -5% | 64.6 -7% |
| Response Times | 25% | -6% | 16% | 14% | 12% | |
| Response Time Grey 50% / Grey 80% * (ms) | 47 ? | 37 ? 21% | 55 ? -17% | 40 ? 15% | 36.8 ? 22% | 42 ? 11% |
| Response Time Black / White * (ms) | 32 ? | 23 ? 28% | 30 ? 6% | 27 ? 16% | 30 ? 6% | 28 ? 12% |
| PWM Frequency (Hz) | 250 ? | |||||
| Screen | -25% | 3% | -6% | -23% | -46% | |
| Brightness middle (cd/m²) | 319 | 254 -20% | 296 -7% | 295 -8% | 333.8 5% | 321 1% |
| Brightness (cd/m²) | 292 | 231 -21% | 272 -7% | 276 -5% | 307 5% | 282 -3% |
| Brightness Distribution (%) | 84 | 86 2% | 79 -6% | 82 -2% | 83 -1% | 77 -8% |
| Black Level * (cd/m²) | 0.23 | 0.25 -9% | 0.095 59% | 0.215 7% | 0.4 -74% | 0.2 13% |
| Contrast (:1) | 1387 | 1016 -27% | 3116 125% | 1372 -1% | 835 -40% | 1605 16% |
| Colorchecker dE 2000 * | 2.53 | 3.85 -52% | 3.1 -23% | 2.6 -3% | 3.54 -40% | 6.35 -151% |
| Colorchecker dE 2000 max. * | 5.5 | 7.05 -28% | 6.2 -13% | 5.6 -2% | 5.8 -5% | 12.2 -122% |
| Colorchecker dE 2000 calibrated * | 2.67 | 3.66 -37% | 2.36 12% | 1.88 30% | ||
| Greyscale dE 2000 * | 2.22 | 4.1 -85% | 4.5 -103% | 3.4 -53% | 4.7 -112% | 8.35 -276% |
| Gamma | 2.54 87% | 2.43 91% | 2.15 102% | 2.08 106% | 2.14 103% | 2.51 88% |
| CCT | 6381 102% | 7369 88% | 7277 89% | 7192 90% | 6261 104% | 8227 79% |
| Color Space (Percent of AdobeRGB 1998) (%) | 62 | 63 2% | 65 5% | 63 2% | 61.2 -1% | 59 -5% |
| Color Space (Percent of sRGB) (%) | 95 | 97 2% | 99 4% | 99 4% | 94.7 0% | 91 -4% |
| Total Average (Program / Settings) | 1% /
-14% | 0% /
2% | 3% /
-2% | -4% /
-15% | -13% /
-32% |
* ... smaller is better
Display Response Times
| ↔ Response Time Black to White | ||
|---|---|---|
| 32 ms ... rise ↗ and fall ↘ combined | ↗ 18 ms rise | 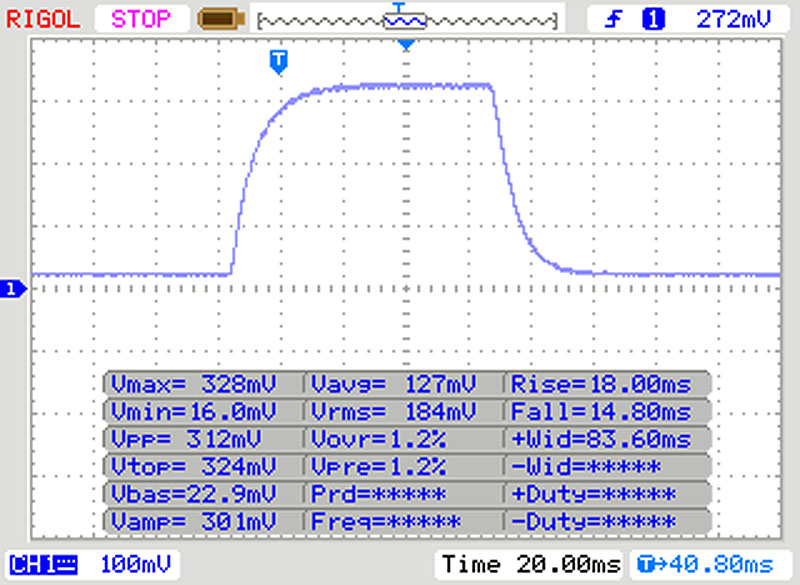 |
| ↘ 14 ms fall | ||
| The screen shows slow response rates in our tests and will be unsatisfactory for gamers. In comparison, all tested devices range from 0.1 (minimum) to 240 (maximum) ms. » 86 % of all devices are better. This means that the measured response time is worse than the average of all tested devices (19.9 ms). | ||
| ↔ Response Time 50% Grey to 80% Grey | ||
| 47 ms ... rise ↗ and fall ↘ combined | ↗ 21 ms rise | 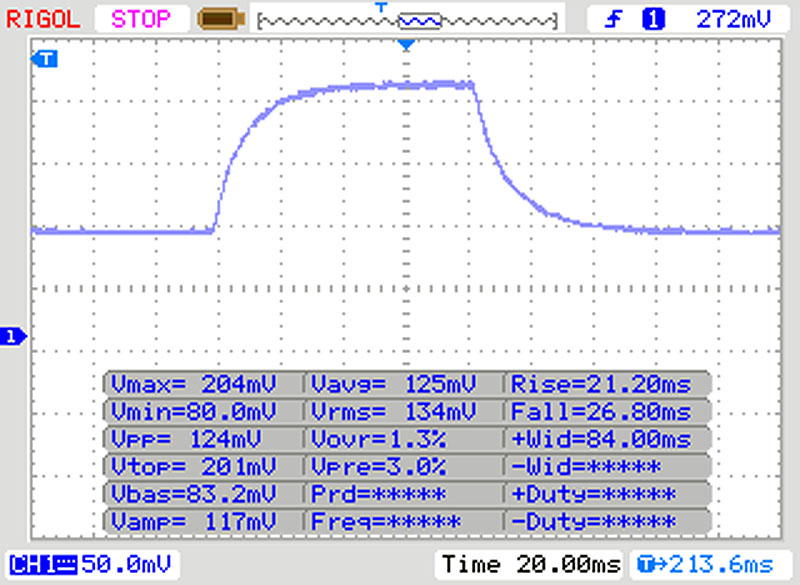 |
| ↘ 26 ms fall | ||
| The screen shows slow response rates in our tests and will be unsatisfactory for gamers. In comparison, all tested devices range from 0.165 (minimum) to 636 (maximum) ms. » 81 % of all devices are better. This means that the measured response time is worse than the average of all tested devices (31.1 ms). | ||
Screen Flickering / PWM (Pulse-Width Modulation)
| Screen flickering / PWM not detected | 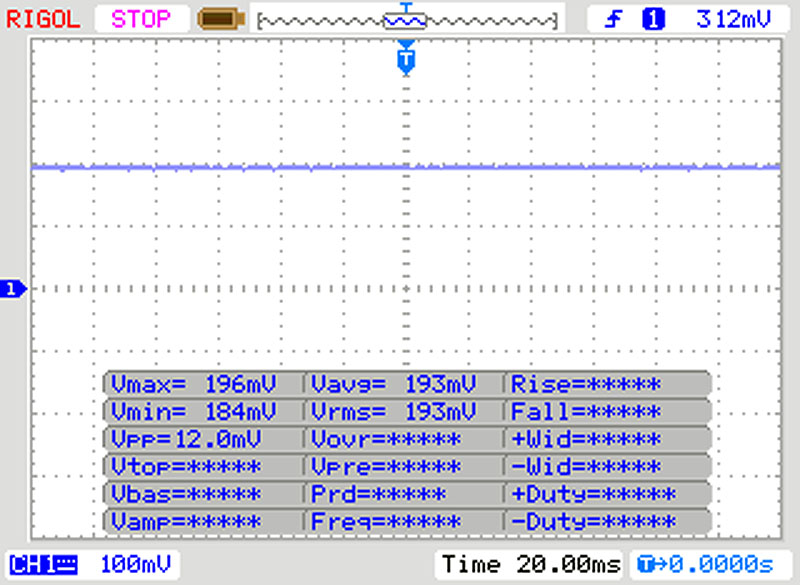 | ||
In comparison: 52 % of all tested devices do not use PWM to dim the display. If PWM was detected, an average of 7791 (minimum: 5 - maximum: 343500) Hz was measured. | |||
| Cinebench R15 | |
| CPU Single 64Bit | |
| Average of class Subnotebook (72.4 - 322, n=57, last 2 years) | |
| Acer Swift 5 SF514-54T-501U | |
| Average Intel Core i5-1035G1 (144 - 171, n=8) | |
| Acer TravelMate X514-51-511Q | |
| Asus Zenbook 14 UX433FA-A6018T | |
| LG Gram 14Z980-U.AAW5U1 | |
| Acer Swift 5 SF514-52T-59HY | |
| Acer Swift 7 SF714-52T-76MR | |
| CPU Multi 64Bit | |
| Average of class Subnotebook (327 - 3345, n=57, last 2 years) | |
| Asus Zenbook 14 UX433FA-A6018T | |
| Asus Zenbook 14 UX433FA-A6018T | |
| Average Intel Core i5-1035G1 (518 - 803, n=11) | |
| Acer Swift 5 SF514-54T-501U | |
| LG Gram 14Z980-U.AAW5U1 | |
| Acer TravelMate X514-51-511Q | |
| Acer Swift 5 SF514-52T-59HY | |
| Acer Swift 7 SF714-52T-76MR | |
| Cinebench R11.5 | |
| CPU Single 64Bit | |
| Average of class Subnotebook (1.89 - 3.71, n=13, last 2 years) | |
| Acer Swift 5 SF514-54T-501U | |
| Average Intel Core i5-1035G1 (n=1) | |
| Asus Zenbook 14 UX433FA-A6018T | |
| Acer Swift 5 SF514-52T-59HY | |
| CPU Multi 64Bit | |
| Average of class Subnotebook (14.8 - 36, n=13, last 2 years) | |
| Asus Zenbook 14 UX433FA-A6018T | |
| Acer Swift 5 SF514-54T-501U | |
| Average Intel Core i5-1035G1 (n=1) | |
| Acer Swift 5 SF514-52T-59HY | |
| Cinebench R10 | |
| Rendering Single CPUs 64Bit | |
| Average of class Subnotebook (11450 - 15516, n=4, last 2 years) | |
| Acer Swift 5 SF514-54T-501U | |
| Average Intel Core i5-1035G1 (n=1) | |
| Acer Swift 5 SF514-52T-59HY | |
| Rendering Multiple CPUs 64Bit | |
| Average of class Subnotebook (53207 - 66113, n=4, last 2 years) | |
| Acer Swift 5 SF514-54T-501U | |
| Average Intel Core i5-1035G1 (n=1) | |
| Acer Swift 5 SF514-52T-59HY | |
| PCMark 8 | |
| Home Score Accelerated v2 | |
| Asus Zenbook 14 UX433FA-A6018T | |
| Average Intel Core i5-1035G1, Intel UHD Graphics G1 (Ice Lake 32 EU) (3469 - 3988, n=5) | |
| Acer Swift 5 SF514-54T-501U | |
| Acer Swift 5 SF514-52T-59HY | |
| LG Gram 14Z980-U.AAW5U1 | |
| Acer TravelMate X514-51-511Q | |
| Acer Swift 7 SF714-52T-76MR | |
| Average of class Subnotebook (1739 - 1828, n=2, last 2 years) | |
| Work Score Accelerated v2 | |
| Acer Swift 5 SF514-54T-501U | |
| Asus Zenbook 14 UX433FA-A6018T | |
| Acer Swift 5 SF514-52T-59HY | |
| Acer TravelMate X514-51-511Q | |
| LG Gram 14Z980-U.AAW5U1 | |
| Acer Swift 7 SF714-52T-76MR | |
| Average Intel Core i5-1035G1, Intel UHD Graphics G1 (Ice Lake 32 EU) (2647 - 5035, n=5) | |
| Average of class Subnotebook (1609 - 1656, n=2, last 2 years) | |
| PCMark 8 Home Score Accelerated v2 | 3590 points | |
| PCMark 8 Work Score Accelerated v2 | 4950 points | |
| PCMark 10 Score | 3807 points | |
Help | ||
| Acer Swift 5 SF514-54T-501U Kingston RBUSNS8154P3512GJ1 | Acer Swift 5 SF514-52T-59HY Intel SSD 600p SSDPEKKW256G7 | Acer Swift 7 SF714-52T-76MR SK Hynix BC501 HFM512GDJTNG | Acer TravelMate X514-51-511Q Kingston RBUSNS8154P3256GJ1 | LG Gram 14Z980-U.AAW5U1 SK Hynix SC313 HFS256G39TNF | Asus Zenbook 14 UX433FA-A6018T WDC PC SN520 SDAPNUW-256G | Average Kingston RBUSNS8154P3512GJ1 | |
|---|---|---|---|---|---|---|---|
| CrystalDiskMark 5.2 / 6 | -29% | -33% | -10% | -54% | -7% | -9% | |
| Write 4K (MB/s) | 107.8 | 98 -9% | 48.38 -55% | 122.3 13% | 74.7 -31% | 99.9 -7% | 87.6 ? -19% |
| Read 4K (MB/s) | 45.42 | 33.88 -25% | 28.98 -36% | 45.51 0% | 14.89 -67% | 40.03 -12% | 40.3 ? -11% |
| Write Seq (MB/s) | 990 | 585 -41% | 743 -25% | 667 -33% | 502 -49% | 973 -2% | 941 ? -5% |
| Read Seq (MB/s) | 1129 | 1149 2% | 1027 -9% | 713 -37% | 498.6 -56% | 1111 -2% | 1070 ? -5% |
| Write 4K Q32T1 (MB/s) | 490.9 | 161.6 -67% | 94.6 -81% | 411.8 -16% | 214.3 -56% | 424.6 -14% | 418 ? -15% |
| Read 4K Q32T1 (MB/s) | 518 | 289.5 -44% | 300 -42% | 559 8% | 225.5 -56% | 255.9 -51% | 428 ? -17% |
| Write Seq Q32T1 (MB/s) | 1033 | 578 -44% | 870 -16% | 892 -14% | 505 -51% | 1300 26% | 1035 ? 0% |
| Read Seq Q32T1 (MB/s) | 1644 | 1563 -5% | 1640 0% | 1639 0% | 560 -66% | 1723 5% | 1629 ? -1% |
| AS SSD | -39% | -13% | -7% | -43% | -8% | -9% | |
| Seq Read (MB/s) | 1454 | 1382 -5% | 1437 -1% | 1222 -16% | 476.1 -67% | 1389 -4% | 1398 ? -4% |
| Seq Write (MB/s) | 939 | 576 -39% | 689 -27% | 775 -17% | 487.4 -48% | 795 -15% | 848 ? -10% |
| 4K Read (MB/s) | 54.6 | 24.72 -55% | 42.64 -22% | 54.8 0% | 30.57 -44% | 37.3 -32% | 45.1 ? -17% |
| 4K Write (MB/s) | 100.8 | 90.8 -10% | 112.8 12% | 114.4 13% | 66.1 -34% | 130.8 30% | 82.2 ? -18% |
| 4K-64 Read (MB/s) | 954 | 274.6 -71% | 488 -49% | 896 -6% | 352.9 -63% | 653 -32% | 852 ? -11% |
| 4K-64 Write (MB/s) | 707 | 192.2 -73% | 475.7 -33% | 604 -15% | 263.1 -63% | 605 -14% | 654 ? -7% |
| Access Time Read * (ms) | 0.075 | 0.054 | 0.092 | 0.114 | 0.04167 ? | ||
| Access Time Write * (ms) | 0.044 | 0.041 7% | 0.034 23% | 0.044 -0% | 0.055 -25% | 0.028 36% | 0.05333 ? -21% |
| Score Read (Points) | 1154 | 438 -62% | 674 -42% | 1073 -7% | 431 -63% | 829 -28% | 1037 ? -10% |
| Score Write (Points) | 902 | 341 -62% | 657 -27% | 796 -12% | 378 -58% | 815 -10% | 821 ? -9% |
| Score Total (Points) | 2635 | 969 -63% | 1653 -37% | 2411 -9% | 1040 -61% | 2048 -22% | 2372 ? -10% |
| Copy ISO MB/s (MB/s) | 655 | 504 -23% | 873 33% | 514 -22% | 601 -8% | 655 ? 0% | |
| Copy Program MB/s (MB/s) | 262.2 | 226.7 -14% | 236 -10% | 259.3 -1% | 246.8 -6% | 262 ? 0% | |
| Copy Game MB/s (MB/s) | 542 | 372.8 -31% | 572 6% | 521 -4% | 549 1% | 542 ? 0% | |
| Total Average (Program / Settings) | -34% /
-35% | -23% /
-21% | -9% /
-8% | -49% /
-47% | -8% /
-8% | -9% /
-9% |
* ... smaller is better

| 3DMark 11 - 1280x720 Performance GPU | |
| Average of class Subnotebook (995 - 18489, n=55, last 2 years) | |
| Acer Swift 5 SF514-54T-501U | |
| Average Intel UHD Graphics G1 (Ice Lake 32 EU) (1684 - 2578, n=15) | |
| Asus Zenbook 14 UX433FA-A6018T | |
| LG Gram 14Z980-U.AAW5U1 | |
| Acer TravelMate X514-51-511Q | |
| Acer Swift 5 SF514-52T-59HY | |
| Acer Swift 7 SF714-52T-76MR | |
| 3DMark | |
| 1280x720 Cloud Gate Standard Graphics | |
| Average of class Subnotebook (5577 - 61591, n=28, last 2 years) | |
| Acer Swift 5 SF514-54T-501U | |
| Asus Zenbook 14 UX433FA-A6018T | |
| Average Intel UHD Graphics G1 (Ice Lake 32 EU) (7448 - 12698, n=14) | |
| LG Gram 14Z980-U.AAW5U1 | |
| Acer TravelMate X514-51-511Q | |
| Acer Swift 5 SF514-52T-59HY | |
| Acer Swift 7 SF714-52T-76MR | |
| 1920x1080 Fire Strike Graphics | |
| Average of class Subnotebook (832 - 16347, n=56, last 2 years) | |
| Acer Swift 5 SF514-54T-501U | |
| Average Intel UHD Graphics G1 (Ice Lake 32 EU) (960 - 1755, n=15) | |
| Asus Zenbook 14 UX433FA-A6018T | |
| LG Gram 14Z980-U.AAW5U1 | |
| Acer TravelMate X514-51-511Q | |
| Acer Swift 5 SF514-52T-59HY | |
| Acer Swift 7 SF714-52T-76MR | |
| 2560x1440 Time Spy Graphics | |
| Average of class Subnotebook (804 - 6288, n=55, last 2 years) | |
| Acer Swift 5 SF514-54T-501U | |
| Average Intel UHD Graphics G1 (Ice Lake 32 EU) (320 - 476, n=10) | |
| Acer Swift 7 SF714-52T-76MR | |
| 3DMark 06 1280x800 Score | 12136 points | |
| 3DMark Vantage P Result | 8750 points | |
| 3DMark 11 Performance | 2730 points | |
| 3DMark Ice Storm Standard Score | 55398 points | |
| 3DMark Cloud Gate Standard Score | 9444 points | |
| 3DMark Fire Strike Score | 1614 points | |
| 3DMark Time Spy Score | 512 points | |
Help | ||
| The Witcher 3 | |
| 1024x768 Low Graphics & Postprocessing | |
| Average of class Subnotebook (38.8 - 176, n=13, last 2 years) | |
| Average Intel UHD Graphics G1 (Ice Lake 32 EU) (26.8 - 35, n=6) | |
| Acer Swift 5 SF514-54T-501U | |
| Acer Swift 7 SF714-52T-76MR | |
| Acer Swift 5 SF514-52T-59HY | |
| 1366x768 Medium Graphics & Postprocessing | |
| Average of class Subnotebook (71 - 115, n=8, last 2 years) | |
| Average Intel UHD Graphics G1 (Ice Lake 32 EU) (16.4 - 21.6, n=5) | |
| Acer Swift 5 SF514-54T-501U | |
| Acer Swift 5 SF514-52T-59HY | |
| Acer Swift 7 SF714-52T-76MR | |
| 1920x1080 High Graphics & Postprocessing (Nvidia HairWorks Off) | |
| Average of class Subnotebook (25.6 - 64, n=13, last 2 years) | |
| Average Intel UHD Graphics G1 (Ice Lake 32 EU) (7 - 11.5, n=5) | |
| Acer Swift 5 SF514-54T-501U | |
| Rocket League | |
| 1280x720 Performance | |
| Average Intel UHD Graphics G1 (Ice Lake 32 EU) (54.8 - 69.5, n=2) | |
| Acer Swift 5 SF514-52T-59HY | |
| LG Gram 14Z980-U.AAW5U1 | |
| Acer Swift 5 SF514-54T-501U | |
| 1920x1080 Performance | |
| Average Intel UHD Graphics G1 (Ice Lake 32 EU) (43 - 58.8, n=2) | |
| Acer Swift 5 SF514-52T-59HY | |
| Acer Swift 5 SF514-54T-501U | |
| 1920x1080 Quality AA:Medium FX | |
| Average Intel UHD Graphics G1 (Ice Lake 32 EU) (37 - 42.2, n=2) | |
| Acer Swift 5 SF514-54T-501U | |
| LG Gram 14Z980-U.AAW5U1 | |
| Acer Swift 5 SF514-52T-59HY | |
| 1920x1080 High Quality AA:High FX | |
| Acer Swift 5 SF514-54T-501U | |
| Average Intel UHD Graphics G1 (Ice Lake 32 EU) (22.8 - 24, n=2) | |
| LG Gram 14Z980-U.AAW5U1 | |
| Acer Swift 5 SF514-52T-59HY | |
| BioShock Infinite | |
| 1280x720 Very Low Preset | |
| Acer Swift 5 SF514-54T-501U | |
| Average Intel UHD Graphics G1 (Ice Lake 32 EU) (58.4 - 82.6, n=7) | |
| Asus Zenbook 14 UX433FA-A6018T | |
| LG Gram 14Z980-U.AAW5U1 | |
| Acer TravelMate X514-51-511Q | |
| Acer Swift 7 SF714-52T-76MR | |
| 1366x768 Medium Preset | |
| Acer Swift 5 SF514-54T-501U | |
| Average Intel UHD Graphics G1 (Ice Lake 32 EU) (30.3 - 46.8, n=7) | |
| Asus Zenbook 14 UX433FA-A6018T | |
| LG Gram 14Z980-U.AAW5U1 | |
| Acer TravelMate X514-51-511Q | |
| Acer Swift 7 SF714-52T-76MR | |
| 1366x768 High Preset | |
| Acer Swift 5 SF514-54T-501U | |
| Average Intel UHD Graphics G1 (Ice Lake 32 EU) (25 - 40.4, n=7) | |
| Asus Zenbook 14 UX433FA-A6018T | |
| Acer TravelMate X514-51-511Q | |
| LG Gram 14Z980-U.AAW5U1 | |
| Acer Swift 7 SF714-52T-76MR | |
| low | med. | high | ultra | |
|---|---|---|---|---|
| BioShock Infinite (2013) | 75.9 | 42.1 | 33.6 | 12.9 |
| The Witcher 3 (2015) | 27 | 17.9 | 7 | |
| Rocket League (2017) | 54.8 | 37 | 24 |
| Acer Swift 5 SF514-54T-501U UHD Graphics G1 (Ice Lake 32 EU), i5-1035G1, Kingston RBUSNS8154P3512GJ1 | Acer Swift 5 SF514-52T-59HY UHD Graphics 620, i5-8250U, Intel SSD 600p SSDPEKKW256G7 | LG Gram 14Z980-U.AAW5U1 UHD Graphics 620, i5-8250U, SK Hynix SC313 HFS256G39TNF | Acer TravelMate X514-51-511Q UHD Graphics 620, i5-8265U, Kingston RBUSNS8154P3256GJ1 | Asus Zenbook 14 UX433FA-A6018T UHD Graphics 620, i5-8265U, WDC PC SN520 SDAPNUW-256G | |
|---|---|---|---|---|---|
| Noise | -1% | 2% | -1% | 0% | |
| off / environment * (dB) | 30.3 | 30.3 -0% | 28.2 7% | 30.4 -0% | 30.5 -1% |
| Idle Minimum * (dB) | 30.3 | 30.3 -0% | 28.4 6% | 30.4 -0% | 30.5 -1% |
| Idle Average * (dB) | 30.3 | 30.3 -0% | 28.4 6% | 30.4 -0% | 30.5 -1% |
| Idle Maximum * (dB) | 30.6 | 31.2 -2% | 28.4 7% | 30.4 1% | 30.9 -1% |
| Load Average * (dB) | 32 | 33.1 -3% | 35.7 -12% | 34.1 -7% | 32.7 -2% |
| Load Maximum * (dB) | 33.7 | 34.4 -2% | 34.2 -1% | 34.4 -2% | 31.5 7% |
* ... smaller is better
Noise level
| Idle |
| 30.3 / 30.3 / 30.6 dB(A) |
| Load |
| 32 / 33.7 dB(A) |
 | ||
30 dB silent 40 dB(A) audible 50 dB(A) loud |
||
min: | ||
| Acer Swift 5 SF514-54T-501U UHD Graphics G1 (Ice Lake 32 EU), i5-1035G1, Kingston RBUSNS8154P3512GJ1 | Acer Swift 5 SF514-52T-59HY UHD Graphics 620, i5-8250U, Intel SSD 600p SSDPEKKW256G7 | Acer Swift 7 SF714-52T-76MR UHD Graphics 615, i7-8500Y, SK Hynix BC501 HFM512GDJTNG | Acer TravelMate X514-51-511Q UHD Graphics 620, i5-8265U, Kingston RBUSNS8154P3256GJ1 | LG Gram 14Z980-U.AAW5U1 UHD Graphics 620, i5-8250U, SK Hynix SC313 HFS256G39TNF | Asus Zenbook 14 UX433FA-A6018T UHD Graphics 620, i5-8265U, WDC PC SN520 SDAPNUW-256G | |
|---|---|---|---|---|---|---|
| Heat | -9% | -18% | -6% | -7% | -1% | |
| Maximum Upper Side * (°C) | 40 | 42.9 -7% | 55 -38% | 44.9 -12% | 45.2 -13% | 41 -2% |
| Maximum Bottom * (°C) | 42.1 | 44.9 -7% | 51.4 -22% | 44.2 -5% | 41.4 2% | 41.4 2% |
| Idle Upper Side * (°C) | 25.4 | 28.4 -12% | 27.1 -7% | 26.3 -4% | 26.8 -6% | 26.1 -3% |
| Idle Bottom * (°C) | 26.1 | 28.5 -9% | 27.1 -4% | 26.6 -2% | 29 -11% | 25.8 1% |
* ... smaller is better
(±) The maximum temperature on the upper side is 40 °C / 104 F, compared to the average of 35.9 °C / 97 F, ranging from 21.4 to 59 °C for the class Subnotebook.
(±) The bottom heats up to a maximum of 42.1 °C / 108 F, compared to the average of 39.2 °C / 103 F
(+) In idle usage, the average temperature for the upper side is 23.7 °C / 75 F, compared to the device average of 30.8 °C / 87 F.
(+) The palmrests and touchpad are cooler than skin temperature with a maximum of 30 °C / 86 F and are therefore cool to the touch.
(±) The average temperature of the palmrest area of similar devices was 28.2 °C / 82.8 F (-1.8 °C / -3.2 F).
| Acer Swift 5 SF514-54T-501U UHD Graphics G1 (Ice Lake 32 EU), i5-1035G1, Kingston RBUSNS8154P3512GJ1 | Acer Swift 5 SF514-52T-59HY UHD Graphics 620, i5-8250U, Intel SSD 600p SSDPEKKW256G7 | Acer Swift 7 SF714-52T-76MR UHD Graphics 615, i7-8500Y, SK Hynix BC501 HFM512GDJTNG | Acer TravelMate X514-51-511Q UHD Graphics 620, i5-8265U, Kingston RBUSNS8154P3256GJ1 | LG Gram 14Z980-U.AAW5U1 UHD Graphics 620, i5-8250U, SK Hynix SC313 HFS256G39TNF | Asus Zenbook 14 UX433FA-A6018T UHD Graphics 620, i5-8265U, WDC PC SN520 SDAPNUW-256G | |
|---|---|---|---|---|---|---|
| Heat | -9% | -18% | -6% | -7% | -1% | |
| Maximum Upper Side * (°C) | 40 | 42.9 -7% | 55 -38% | 44.9 -12% | 45.2 -13% | 41 -2% |
| Maximum Bottom * (°C) | 42.1 | 44.9 -7% | 51.4 -22% | 44.2 -5% | 41.4 2% | 41.4 2% |
| Idle Upper Side * (°C) | 25.4 | 28.4 -12% | 27.1 -7% | 26.3 -4% | 26.8 -6% | 26.1 -3% |
| Idle Bottom * (°C) | 26.1 | 28.5 -9% | 27.1 -4% | 26.6 -2% | 29 -11% | 25.8 1% |
* ... smaller is better
Acer Swift 5 SF514-54T-501U audio analysis
(-) | not very loud speakers (69.6 dB)
Bass 100 - 315 Hz
(-) | nearly no bass - on average 26.4% lower than median
(±) | linearity of bass is average (9% delta to prev. frequency)
Mids 400 - 2000 Hz
(+) | balanced mids - only 3.7% away from median
(±) | linearity of mids is average (8.6% delta to prev. frequency)
Highs 2 - 16 kHz
(+) | balanced highs - only 1.6% away from median
(+) | highs are linear (5.4% delta to prev. frequency)
Overall 100 - 16.000 Hz
(±) | linearity of overall sound is average (25.3% difference to median)
Compared to same class
» 85% of all tested devices in this class were better, 3% similar, 11% worse
» The best had a delta of 5%, average was 18%, worst was 53%
Compared to all devices tested
» 78% of all tested devices were better, 5% similar, 18% worse
» The best had a delta of 4%, average was 24%, worst was 134%
Apple MacBook 12 (Early 2016) 1.1 GHz audio analysis
(+) | speakers can play relatively loud (83.6 dB)
Bass 100 - 315 Hz
(±) | reduced bass - on average 11.3% lower than median
(±) | linearity of bass is average (14.2% delta to prev. frequency)
Mids 400 - 2000 Hz
(+) | balanced mids - only 2.4% away from median
(+) | mids are linear (5.5% delta to prev. frequency)
Highs 2 - 16 kHz
(+) | balanced highs - only 2% away from median
(+) | highs are linear (4.5% delta to prev. frequency)
Overall 100 - 16.000 Hz
(+) | overall sound is linear (10.2% difference to median)
Compared to same class
» 7% of all tested devices in this class were better, 2% similar, 91% worse
» The best had a delta of 5%, average was 18%, worst was 53%
Compared to all devices tested
» 5% of all tested devices were better, 1% similar, 94% worse
» The best had a delta of 4%, average was 24%, worst was 134%
| Off / Standby | |
| Idle | |
| Load |
|
Key:
min: | |
| Acer Swift 5 SF514-54T-501U i5-1035G1, UHD Graphics G1 (Ice Lake 32 EU), Kingston RBUSNS8154P3512GJ1, IPS, CineCrystal, 1920x1080, 14" | Acer Swift 5 SF514-52T-59HY i5-8250U, UHD Graphics 620, Intel SSD 600p SSDPEKKW256G7, IPS, 1920x1080, 14" | Acer Swift 7 SF714-52T-76MR i7-8500Y, UHD Graphics 615, SK Hynix BC501 HFM512GDJTNG, IPS, 1920x1080, 14" | Acer TravelMate X514-51-511Q i5-8265U, UHD Graphics 620, Kingston RBUSNS8154P3256GJ1, IPS, 1920x1080, 14" | LG Gram 14Z980-U.AAW5U1 i5-8250U, UHD Graphics 620, SK Hynix SC313 HFS256G39TNF, IPS, 1920x1080, 14" | Asus Zenbook 14 UX433FA-A6018T i5-8265U, UHD Graphics 620, WDC PC SN520 SDAPNUW-256G, IPS, 1920x1080, 14" | Average Intel UHD Graphics G1 (Ice Lake 32 EU) | Average of class Subnotebook | |
|---|---|---|---|---|---|---|---|---|
| Power Consumption | 30% | 36% | 29% | 10% | 1% | -9% | -26% | |
| Idle Minimum * (Watt) | 4.3 | 2.8 35% | 2.7 37% | 2.3 47% | 2.7 37% | 2.7 37% | 4.13 ? 4% | 3.82 ? 11% |
| Idle Average * (Watt) | 7.5 | 4.8 36% | 4.9 35% | 4.6 39% | 6 20% | 5.8 23% | 7.07 ? 6% | 6.61 ? 12% |
| Idle Maximum * (Watt) | 8.9 | 6.3 29% | 5.8 35% | 5.8 35% | 6.5 27% | 10.2 -15% | 8.36 ? 6% | 7.99 ? 10% |
| Load Average * (Watt) | 29 | 21 28% | 15.7 46% | 22.4 23% | 32.5 -12% | 34.9 -20% | 30.6 ? -6% | 41.9 ? -44% |
| Load Maximum * (Watt) | 29.4 | 23 22% | 21.7 26% | 29 1% | 35.5 -21% | 35 -19% | 45.6 ? -55% | 64.1 ? -118% |
* ... smaller is better
| Acer Swift 5 SF514-54T-501U i5-1035G1, UHD Graphics G1 (Ice Lake 32 EU), 56 Wh | Acer Swift 5 SF514-52T-59HY i5-8250U, UHD Graphics 620, 36 Wh | Acer Swift 7 SF714-52T-76MR i7-8500Y, UHD Graphics 615, 31.9 Wh | Acer TravelMate X514-51-511Q i5-8265U, UHD Graphics 620, 36 Wh | LG Gram 14Z980-U.AAW5U1 i5-8250U, UHD Graphics 620, 72 Wh | Asus Zenbook 14 UX433FA-A6018T i5-8265U, UHD Graphics 620, 50 Wh | Average of class Subnotebook | |
|---|---|---|---|---|---|---|---|
| Battery runtime | -4% | 27% | -10% | 76% | 21% | 63% | |
| Reader / Idle (h) | 14.8 | 16 8% | 21.2 43% | 17.9 21% | 37.3 152% | 28.6 ? 93% | |
| H.264 (h) | 8.1 | 7.8 -4% | 10.5 30% | 15.6 ? 93% | |||
| WiFi v1.3 (h) | 7.8 | 5.2 -33% | 8.8 13% | 6.3 -19% | 12 54% | 9.4 21% | 14 ? 79% |
| Load (h) | 2.2 | 2.5 14% | 2.7 23% | 1.5 -32% | 2.7 23% | 1.946 ? -12% |
Pros
Cons
Verdict - good upgrade from Acer
我们必须赞扬宏碁接受并回应了我们的批评。制造商在正确的位置进行了许多更改-结果令人印象深刻。
最重要的是,宏碁终于成功获得了正常的性能。我们的测试单元能够轻松地跟其他竞品竞争-不像其前任一样受到限制。我们也对更亮,表面更光滑的屏幕感到满意。增加的亮度不影响对比度,对比度也有所提高。另一个积极的变化是更大的电池,从而延长了系统的续航时间。我们还对出色的SSD和系统性能以及3D性能感到惊讶,这些性能可以击败配备较旧Intel UHD Graphics芯片的竞争对手。更快的Wi-Fi和Thunderbolt 3的集成完善了清单。
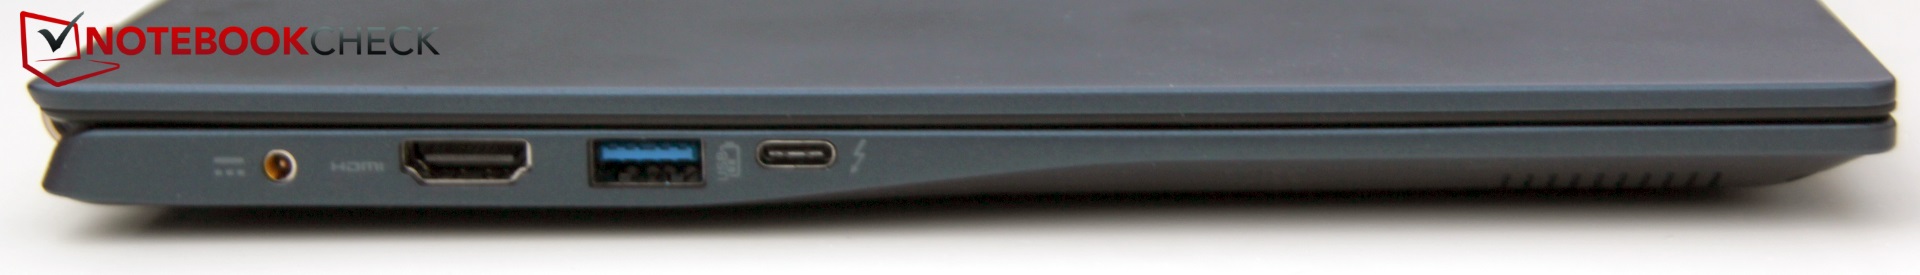
对于当前的Swift 5,我们没有多少可批评的地方。USB2.0端口本可以换成更现代的标准,并且读卡器再次缺失。与其他超级本相比,端口选择还受到更多限制。我们还要提到RAM是板载的,这意味着它不能被更换或扩展。功耗增加了,这意味着尽管电池容量更大,但续航时间充其量只能达到平均水平。性能本身已经提高,但是设备仍然无法充分利用其CPU。但这可以归结为性能和散热之间必要的折衷,而宏碁为Swift 5处理的挺好。
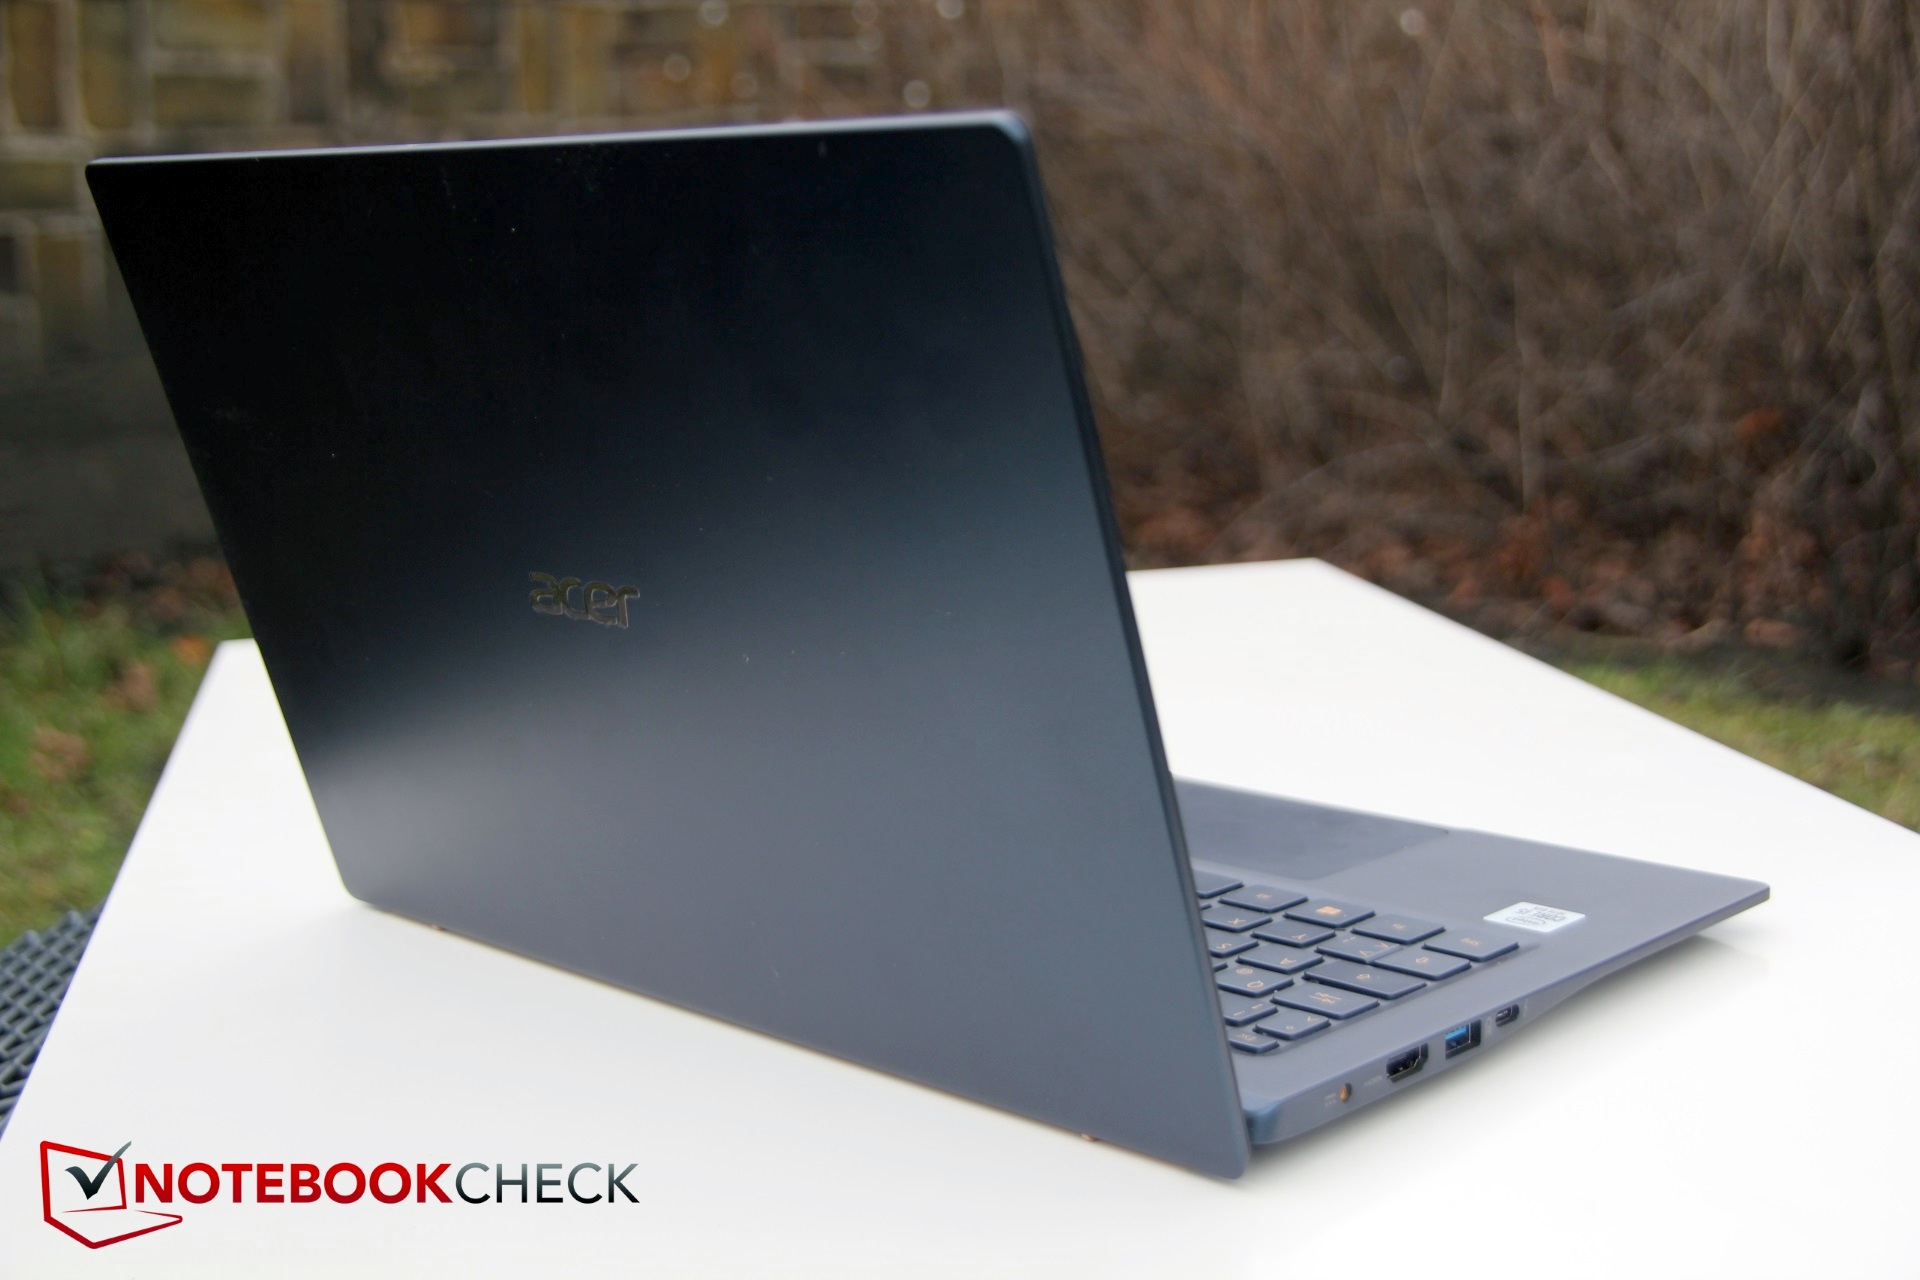
新的Swift 5受到了很多赞扬,几乎没有批评。14英寸的超极本小巧轻便,触摸屏好,性能也不错。与它的前身相比,它似乎已经得到了全方位升级。
考虑到这些结果,我们很高兴推荐新的宏碁,目前它的价格约为900美元。
Acer Swift 5 SF514-54T-501U
- 01/09/2020 v7 (old)
Christian Hintze
Price comparison

