华硕 ROG Strix GL553VD (7700HQ, FHD, GTX 1050) 笔记本简短评测

| SD Card Reader | |
| average JPG Copy Test (av. of 3 runs) | |
| HP Omen 15-ax007ng | |
| Asus ROG Strix GL553VD-DS71 | |
| MSI GL62M 7RD-077 | |
| Acer Aspire VX5-591G-D0DD | |
| Dell Inspiron 15 7000 7567 | |
| maximum AS SSD Seq Read Test (1GB) | |
| Asus ROG Strix GL553VD-DS71 | |
| HP Omen 15-ax007ng | |
| Acer Aspire VX5-591G-D0DD | |
| MSI GL62M 7RD-077 | |
| Dell Inspiron 15 7000 7567 | |
| Networking | |
| iperf3 transmit AX12 | |
| Acer Aspire VX5-591G-D0DD | |
| Asus ROG Strix GL553VD-DS71 | |
| MSI GL62M 7RD-077 (jseb) | |
| Dell Inspiron 15 7000 7567 (jseb) | |
| iperf3 receive AX12 | |
| Asus ROG Strix GL553VD-DS71 | |
| Acer Aspire VX5-591G-D0DD | |
| MSI GL62M 7RD-077 (jseb) | |
| Dell Inspiron 15 7000 7567 (jseb) | |
| |||||||||||||||||||||||||
Brightness Distribution: 93 %
Center on Battery: 289.3 cd/m²
Contrast: 998:1 (Black: 0.29 cd/m²)
ΔE ColorChecker Calman: 3.1 | ∀{0.5-29.43 Ø4.71}
ΔE Greyscale Calman: 2.1 | ∀{0.09-98 Ø4.96}
91% sRGB (Argyll 1.6.3 3D)
59% AdobeRGB 1998 (Argyll 1.6.3 3D)
66.4% AdobeRGB 1998 (Argyll 3D)
90.8% sRGB (Argyll 3D)
67.6% Display P3 (Argyll 3D)
Gamma: 2.22
CCT: 6226 K
| Asus ROG Strix GL553VD-DS71 BOE HF NV156FHM-N43, IPS, 15.6", 1920x1080 | Dell Inspiron 15 7000 7567 AU Optronics AUO38ED B156HTN 28H80, TN, 15.6", 1920x1080 | MSI GL62M 7RD-077 Chi Mei N156HGE-EAL, TN LED, 15.6", 1920x1080 | HP Omen 15-ax007ng LGD0519, IPS, 15.6", 1920x1080 | |
|---|---|---|---|---|
| Display | -43% | 21% | -22% | |
| Display P3 Coverage (%) | 67.6 | 36.42 -46% | 85.4 26% | 59.9 -11% 40.34 -40% |
| sRGB Coverage (%) | 90.8 | 54.9 -40% | 100 10% | 85.9 -5% 60.3 -34% |
| AdobeRGB 1998 Coverage (%) | 66.4 | 37.62 -43% | 83.8 26% | 61.6 -7% 41.73 -37% |
| Response Times | 20% | 23% | 11% | |
| Response Time Grey 50% / Grey 80% * (ms) | 57.6 ? | 36 ? 37% | 44 ? 24% | 55 ? 5% |
| Response Time Black / White * (ms) | 37.2 ? | 36 ? 3% | 29 ? 22% | 31 ? 17% |
| PWM Frequency (Hz) | 198 ? | |||
| Screen | -123% | -91% | -50% | |
| Brightness middle (cd/m²) | 289.3 | 246 -15% | 258 -11% | 214 -26% |
| Brightness (cd/m²) | 280 | 235 -16% | 234 -16% | 203 -27% |
| Brightness Distribution (%) | 93 | 75 -19% | 79 -15% | 79 -15% |
| Black Level * (cd/m²) | 0.29 | 0.55 -90% | 0.54 -86% | 0.28 3% |
| Contrast (:1) | 998 | 447 -55% | 478 -52% | 764 -23% |
| Colorchecker dE 2000 * | 3.1 | 10.97 -254% | 9.74 -214% | 6.04 -95% |
| Colorchecker dE 2000 max. * | 7.1 | 14.6 -106% | 12 -69% | |
| Greyscale dE 2000 * | 2.1 | 14.25 -579% | 11.59 -452% | 5.91 -181% |
| Gamma | 2.22 99% | 1.83 120% | 2.19 100% | 2.44 90% |
| CCT | 6226 104% | 11200 58% | 11851 55% | 7362 88% |
| Color Space (Percent of AdobeRGB 1998) (%) | 59 | 35 -41% | 76 29% | 38 -36% |
| Color Space (Percent of sRGB) (%) | 91 | 55 -40% | 100 10% | 60 -34% |
| Total Average (Program / Settings) | -49% /
-86% | -16% /
-54% | -20% /
-34% |
* ... smaller is better
Display Response Times
| ↔ Response Time Black to White | ||
|---|---|---|
| 37.2 ms ... rise ↗ and fall ↘ combined | ↗ 4.8 ms rise | 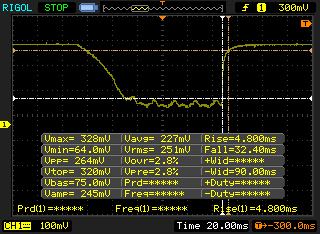 |
| ↘ 32.4 ms fall | ||
| The screen shows slow response rates in our tests and will be unsatisfactory for gamers. In comparison, all tested devices range from 0.1 (minimum) to 240 (maximum) ms. » 95 % of all devices are better. This means that the measured response time is worse than the average of all tested devices (19.8 ms). | ||
| ↔ Response Time 50% Grey to 80% Grey | ||
| 57.6 ms ... rise ↗ and fall ↘ combined | ↗ 23.6 ms rise | 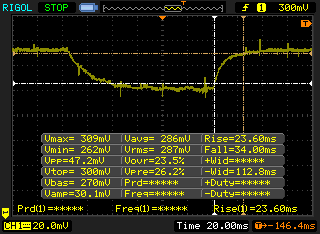 |
| ↘ 34 ms fall | ||
| The screen shows slow response rates in our tests and will be unsatisfactory for gamers. In comparison, all tested devices range from 0.165 (minimum) to 636 (maximum) ms. » 94 % of all devices are better. This means that the measured response time is worse than the average of all tested devices (30.9 ms). | ||
Screen Flickering / PWM (Pulse-Width Modulation)
| Screen flickering / PWM not detected | 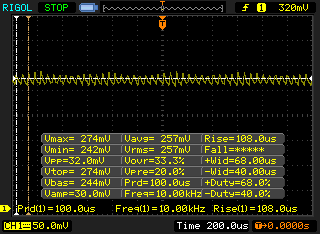 | ||
In comparison: 52 % of all tested devices do not use PWM to dim the display. If PWM was detected, an average of 7744 (minimum: 5 - maximum: 343500) Hz was measured. | |||
| Cinebench R15 | |
| CPU Single 64Bit | |
| Dell Inspiron 15 7000 7567 | |
| Acer Aspire VX5-591G-D0DD | |
| Asus ROG Strix GL553VD-DS71 | |
| HP Omen 15-ax007ng | |
| MSI GL62M 7RD-077 | |
| CPU Multi 64Bit | |
| Asus ROG Strix GL553VD-DS71 | |
| MSI GL62M 7RD-077 | |
| Dell Inspiron 15 7000 7567 | |
| HP Omen 15-ax007ng | |
| Acer Aspire VX5-591G-D0DD | |
| Cinebench R11.5 | |
| CPU Single 64Bit | |
| Asus ROG Strix GL553VD-DS71 | |
| HP Omen 15-ax007ng | |
| MSI GL62M 7RD-077 | |
| CPU Multi 64Bit | |
| MSI GL62M 7RD-077 | |
| Asus ROG Strix GL553VD-DS71 | |
| HP Omen 15-ax007ng | |
| Cinebench R10 | |
| Rendering Multiple CPUs 32Bit | |
| MSI GL62M 7RD-077 | |
| Asus ROG Strix GL553VD-DS71 | |
| Rendering Single 32Bit | |
| MSI GL62M 7RD-077 | |
| Asus ROG Strix GL553VD-DS71 | |
| wPrime 2.10 - 1024m | |
| Asus ROG Strix GL553VD-DS71 | |
* ... smaller is better
| PCMark 8 | |
| Home Score Accelerated v2 | |
| HP Omen 15-ax007ng | |
| MSI GL62M 7RD-077 | |
| Dell Inspiron 15 7000 7567 | |
| Asus ROG Strix GL553VD-DS71 | |
| Acer Aspire VX5-591G-D0DD | |
| Work Score Accelerated v2 | |
| Dell Inspiron 15 7000 7567 | |
| HP Omen 15-ax007ng | |
| MSI GL62M 7RD-077 | |
| Asus ROG Strix GL553VD-DS71 | |
| Creative Score Accelerated v2 | |
| HP Omen 15-ax007ng | |
| MSI GL62M 7RD-077 | |
| Asus ROG Strix GL553VD-DS71 | |
| PCMark 7 Score | 3567 points | |
| PCMark 8 Home Score Accelerated v2 | 3770 points | |
| PCMark 8 Creative Score Accelerated v2 | 4317 points | |
| PCMark 8 Work Score Accelerated v2 | 4680 points | |
Help | ||
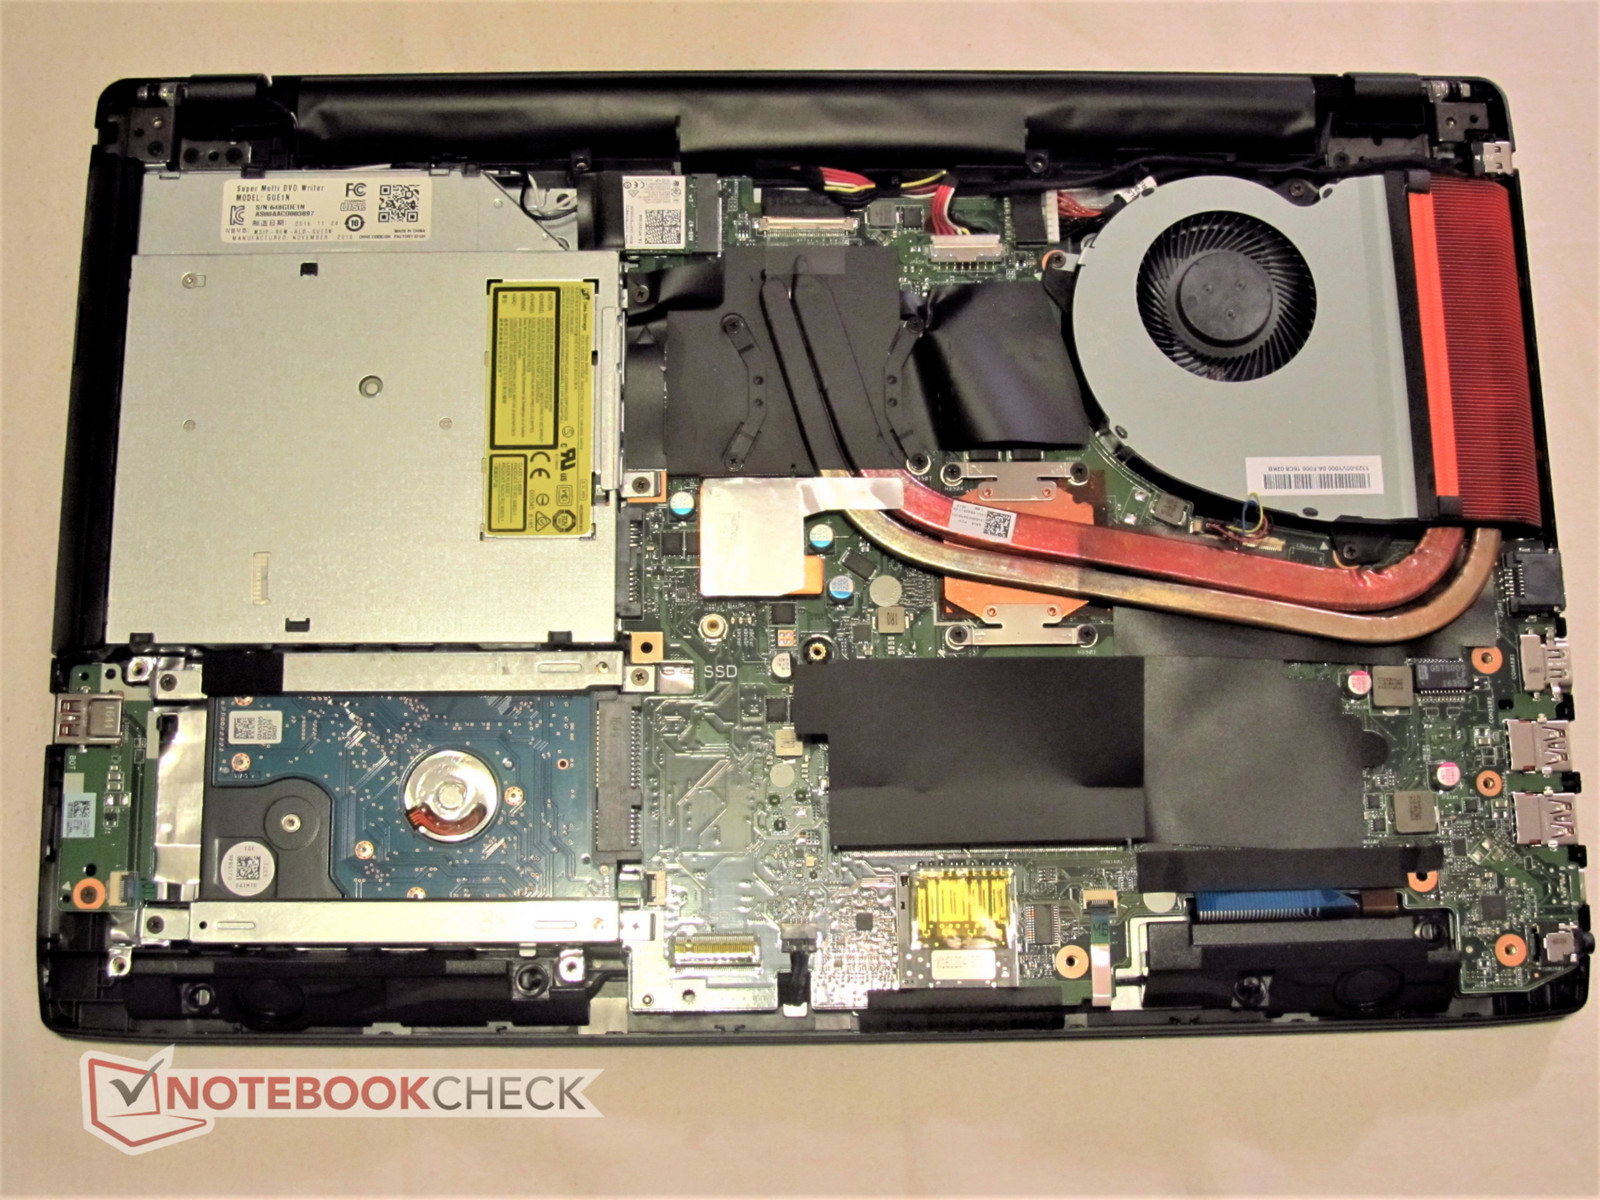
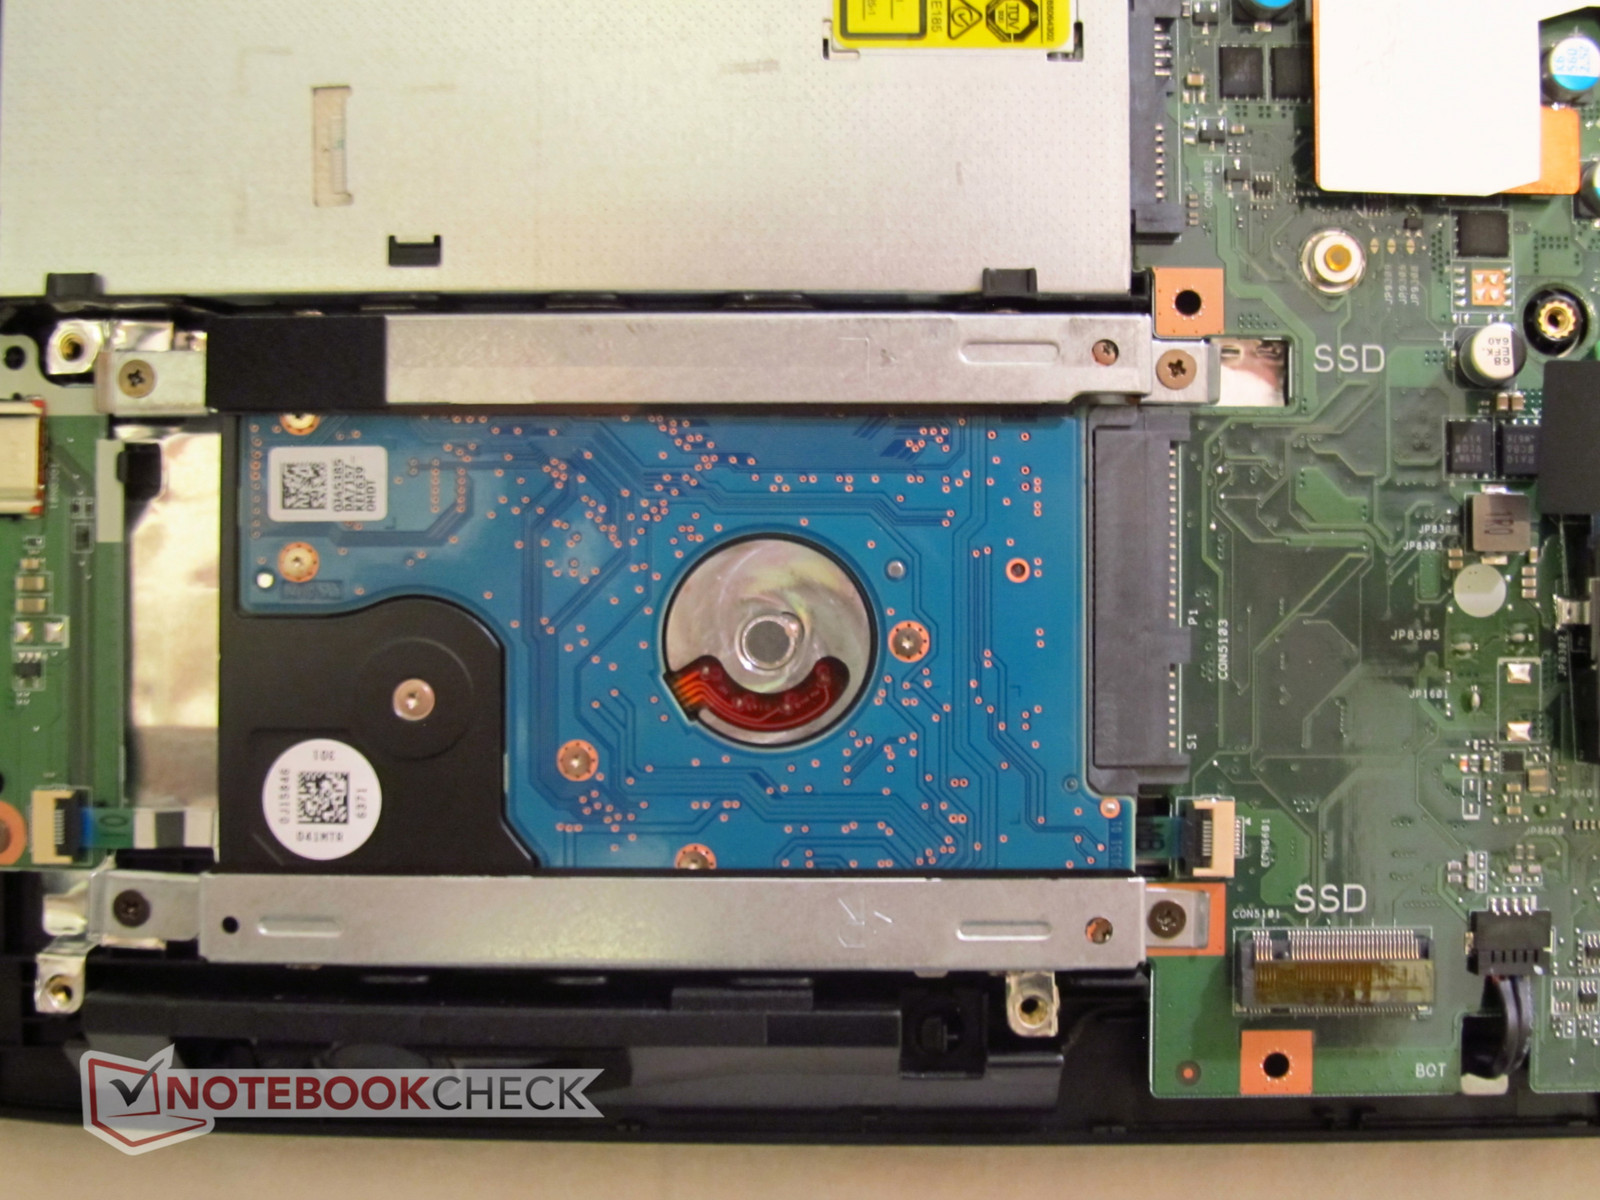
| Asus ROG Strix GL553VD-DS71 HGST Travelstar 7K1000 HTS721010A9E630 | Dell Inspiron 15 7000 7567 Intel SSDSCKKF256H6 | MSI GL62M 7RD-077 HGST Travelstar 7K1000 HTS721010A9E630 | HP Omen 15-ax007ng Adata IM2S3138E-128GM-B | Acer Aspire VX5-591G-D0DD SK Hynix Canvas SC300 512GB M.2 (HFS512G39MND) | |
|---|---|---|---|---|---|
| CrystalDiskMark 3.0 | 8181% | 10% | 7113% | 9543% | |
| Read Seq (MB/s) | 93.5 | 485.8 420% | 112.4 20% | 475.7 409% | 494.2 429% |
| Write Seq (MB/s) | 89.6 | 422.8 372% | 107.3 20% | 169.2 89% | 449.6 402% |
| Read 512 (MB/s) | 39.06 | 338.9 768% | 43.19 11% | 327.6 739% | 348.1 791% |
| Write 512 (MB/s) | 51.1 | 304 495% | 57 12% | 169.6 232% | 418.2 718% |
| Read 4k (MB/s) | 0.57 | 27.11 4656% | 0.494 -13% | 33.14 5714% | 16.97 2877% |
| Write 4k (MB/s) | 1.05 | 85.4 8033% | 1.122 7% | 81.4 7652% | 38.36 3553% |
| Read 4k QD32 (MB/s) | 1.06 | 279.6 26277% | 1.088 3% | 276.8 26013% | 394.9 37155% |
| Write 4k QD32 (MB/s) | 1.04 | 255.1 24429% | 1.234 19% | 168 16054% | 317.4 30419% |

| 3DMark 11 | |
| 1280x720 Performance GPU | |
| Dell Inspiron 15 7000 7567 | |
| Acer Aspire VX5-591G-D0DD | |
| MSI GL62M 7RD-077 | |
| HP Omen 15-ax007ng | |
| Asus ROG Strix GL553VD-DS71 | |
| 1280x720 Performance Combined | |
| Dell Inspiron 15 7000 7567 | |
| HP Omen 15-ax007ng | |
| MSI GL62M 7RD-077 | |
| Asus ROG Strix GL553VD-DS71 | |
| Acer Aspire VX5-591G-D0DD | |
| 3DMark | |
| 1280x720 Cloud Gate Standard Graphics | |
| Dell Inspiron 15 7000 7567 | |
| Acer Aspire VX5-591G-D0DD | |
| MSI GL62M 7RD-077 | |
| Asus ROG Strix GL553VD-DS71 | |
| HP Omen 15-ax007ng | |
| 1920x1080 Fire Strike Graphics | |
| Acer Aspire VX5-591G-D0DD | |
| Dell Inspiron 15 7000 7567 | |
| MSI GL62M 7RD-077 | |
| Asus ROG Strix GL553VD-DS71 | |
| HP Omen 15-ax007ng | |
| 1920x1080 Ice Storm Extreme Graphics | |
| MSI GL62M 7RD-077 | |
| Acer Aspire VX5-591G-D0DD | |
| Asus ROG Strix GL553VD-DS71 | |
| 3DMark 11 Performance | 7423 points | |
| 3DMark Ice Storm Standard Score | 65973 points | |
| 3DMark Cloud Gate Standard Score | 18436 points | |
| 3DMark Fire Strike Score | 5455 points | |
| 3DMark Fire Strike Extreme Score | 2693 points | |
Help | ||
| Rise of the Tomb Raider | |
| 1920x1080 Very High Preset AA:FX AF:16x (sort by value) | |
| Asus ROG Strix GL553VD-DS71 | |
| Dell Inspiron 15 7000 7567 | |
| MSI GL62M 7RD-077 | |
| HP Omen 15-ax007ng | |
| Acer Aspire VX5-591G-D0DD | |
| 1920x1080 High Preset AA:FX AF:4x (sort by value) | |
| Asus ROG Strix GL553VD-DS71 | |
| Dell Inspiron 15 7000 7567 | |
| MSI GL62M 7RD-077 | |
| HP Omen 15-ax007ng | |
| Acer Aspire VX5-591G-D0DD | |
| Doom | |
| 1920x1080 Ultra Preset AA:SM (sort by value) | |
| Asus ROG Strix GL553VD-DS71 | |
| Dell Inspiron 15 7000 7567 | |
| HP Omen 15-ax007ng | |
| 1920x1080 High Preset AA:FX (sort by value) | |
| Asus ROG Strix GL553VD-DS71 | |
| Dell Inspiron 15 7000 7567 | |
| HP Omen 15-ax007ng | |
| Ashes of the Singularity - 1920x1080 high (sort by value) | |
| Asus ROG Strix GL553VD-DS71 | |
| MSI GL62M 7RD-077 | |
| BioShock Infinite | |
| 1920x1080 Ultra Preset, DX11 (DDOF) (sort by value) | |
| Asus ROG Strix GL553VD-DS71 | |
| Dell Inspiron 15 7000 7567 | |
| MSI GL62M 7RD-077 | |
| 1366x768 High Preset (sort by value) | |
| Asus ROG Strix GL553VD-DS71 | |
| Dell Inspiron 15 7000 7567 | |
| MSI GL62M 7RD-077 | |
| Thief | |
| 1920x1080 Very High Preset AA:FXAA & High SS AF:8x (sort by value) | |
| Asus ROG Strix GL553VD-DS71 | |
| MSI GL62M 7RD-077 | |
| 1366x768 High Preset AA:FXAA & Low SS AF:4x (sort by value) | |
| Asus ROG Strix GL553VD-DS71 | |
| MSI GL62M 7RD-077 | |
| Fallout 4 | |
| 1920x1080 Ultra Preset AA:T AF:16x (sort by value) | |
| Asus ROG Strix GL553VD-DS71 | |
| Acer Aspire VX5-591G-D0DD | |
| 1920x1080 High Preset AA:T AF:16x (sort by value) | |
| Asus ROG Strix GL553VD-DS71 | |
| Acer Aspire VX5-591G-D0DD | |
| low | med. | high | ultra | |
|---|---|---|---|---|
| BioShock Infinite (2013) | 128 | 62 | ||
| Metro: Last Light (2013) | 64 | 41 | ||
| Thief (2014) | 61 | 42 | ||
| Fallout 4 (2015) | 39 | 34 | ||
| Rise of the Tomb Raider (2016) | 36 | 30 | ||
| Ashes of the Singularity (2016) | 32 | 28 | ||
| Doom (2016) | 58 | 54 | ||
| Mafia 3 (2016) | 26 | 24 |
Noise level
| Idle |
| 33.4 / 33.4 / 33.4 dB(A) |
| Load |
| 46.5 / 49.6 dB(A) |
 | ||
30 dB silent 40 dB(A) audible 50 dB(A) loud |
||
min: | ||
| Asus ROG Strix GL553VD-DS71 GeForce GTX 1050 Mobile, i7-7700HQ, HGST Travelstar 7K1000 HTS721010A9E630 | Dell Inspiron 15 7000 7567 GeForce GTX 1050 Ti Mobile, i7-7700HQ, Intel SSDSCKKF256H6 | MSI GL62M 7RD-077 GeForce GTX 1050 Mobile, i7-7700HQ, HGST Travelstar 7K1000 HTS721010A9E630 | HP Omen 15-ax007ng GeForce GTX 965M, 6700HQ, Adata IM2S3138E-128GM-B | HP Pavilion 17t-ab200 GeForce GTX 1050 Mobile, i7-7700HQ, Samsung CM871a MZNTY128HDHP | |
|---|---|---|---|---|---|
| Noise | 5% | 4% | 1% | -4% | |
| off / environment * (dB) | 30.6 | 30.3 1% | 30.6 -0% | 30 2% | 30.8 -1% |
| Idle Minimum * (dB) | 33.4 | 30.9 7% | 32.5 3% | 32 4% | 35.3 -6% |
| Idle Average * (dB) | 33.4 | 30.9 7% | 32.5 3% | 33 1% | 35.4 -6% |
| Idle Maximum * (dB) | 33.4 | 31 7% | 32.5 3% | 36 -8% | 35.4 -6% |
| Load Average * (dB) | 46.5 | 46.5 -0% | 36.4 22% | 43 8% | 48.6 -5% |
| Load Maximum * (dB) | 49.6 | 46.8 6% | 52.4 -6% | 49 1% | 49.8 -0% |
* ... smaller is better
(±) The maximum temperature on the upper side is 42.6 °C / 109 F, compared to the average of 40.4 °C / 105 F, ranging from 21.2 to 68.8 °C for the class Gaming.
(+) The bottom heats up to a maximum of 37.4 °C / 99 F, compared to the average of 43.2 °C / 110 F
(+) In idle usage, the average temperature for the upper side is 23.3 °C / 74 F, compared to the device average of 33.9 °C / 93 F.
(+) The palmrests and touchpad are cooler than skin temperature with a maximum of 30.2 °C / 86.4 F and are therefore cool to the touch.
(±) The average temperature of the palmrest area of similar devices was 28.8 °C / 83.8 F (-1.4 °C / -2.6 F).
Asus ROG Strix GL553VD-DS71 audio analysis
(±) | speaker loudness is average but good (75.2 dB)
Bass 100 - 315 Hz
(±) | reduced bass - on average 12.6% lower than median
(±) | linearity of bass is average (11.3% delta to prev. frequency)
Mids 400 - 2000 Hz
(+) | balanced mids - only 2.5% away from median
(±) | linearity of mids is average (9.1% delta to prev. frequency)
Highs 2 - 16 kHz
(±) | higher highs - on average 7.8% higher than median
(±) | linearity of highs is average (10% delta to prev. frequency)
Overall 100 - 16.000 Hz
(±) | linearity of overall sound is average (24.6% difference to median)
Compared to same class
» 89% of all tested devices in this class were better, 4% similar, 8% worse
» The best had a delta of 6%, average was 18%, worst was 132%
Compared to all devices tested
» 75% of all tested devices were better, 5% similar, 20% worse
» The best had a delta of 4%, average was 23%, worst was 134%
Dell Inspiron 15 7000 7567 audio analysis
(±) | speaker loudness is average but good (74 dB)
Bass 100 - 315 Hz
(±) | reduced bass - on average 12.6% lower than median
(±) | linearity of bass is average (13.2% delta to prev. frequency)
Mids 400 - 2000 Hz
(+) | balanced mids - only 1.8% away from median
(+) | mids are linear (4.3% delta to prev. frequency)
Highs 2 - 16 kHz
(+) | balanced highs - only 4% away from median
(+) | highs are linear (3.9% delta to prev. frequency)
Overall 100 - 16.000 Hz
(+) | overall sound is linear (12% difference to median)
Compared to same class
» 12% of all tested devices in this class were better, 4% similar, 84% worse
» The best had a delta of 6%, average was 18%, worst was 132%
Compared to all devices tested
» 9% of all tested devices were better, 2% similar, 88% worse
» The best had a delta of 4%, average was 23%, worst was 134%
MSI GL62M 7RD-077 audio analysis
(+) | speakers can play relatively loud (86 dB)
Bass 100 - 315 Hz
(-) | nearly no bass - on average 28.4% lower than median
(±) | linearity of bass is average (9.6% delta to prev. frequency)
Mids 400 - 2000 Hz
(±) | higher mids - on average 9% higher than median
(±) | linearity of mids is average (8.2% delta to prev. frequency)
Highs 2 - 16 kHz
(±) | higher highs - on average 7% higher than median
(+) | highs are linear (6.8% delta to prev. frequency)
Overall 100 - 16.000 Hz
(±) | linearity of overall sound is average (27.7% difference to median)
Compared to same class
» 93% of all tested devices in this class were better, 1% similar, 5% worse
» The best had a delta of 6%, average was 18%, worst was 132%
Compared to all devices tested
» 84% of all tested devices were better, 3% similar, 13% worse
» The best had a delta of 4%, average was 23%, worst was 134%
| Off / Standby | |
| Idle | |
| Load |
|
Key:
min: | |
| Asus ROG Strix GL553VD-DS71 i7-7700HQ, GeForce GTX 1050 Mobile, HGST Travelstar 7K1000 HTS721010A9E630, IPS, 1920x1080, 15.6" | Dell Inspiron 15 7000 7567 i7-7700HQ, GeForce GTX 1050 Ti Mobile, Intel SSDSCKKF256H6, TN, 1920x1080, 15.6" | MSI GL62M 7RD-077 i7-7700HQ, GeForce GTX 1050 Mobile, HGST Travelstar 7K1000 HTS721010A9E630, TN LED, 1920x1080, 15.6" | HP Omen 15-ax007ng 6700HQ, GeForce GTX 965M, Adata IM2S3138E-128GM-B, IPS, 1920x1080, 15.6" | HP Pavilion 17t-ab200 i7-7700HQ, GeForce GTX 1050 Mobile, Samsung CM871a MZNTY128HDHP, IPS, 1920x1080, 17.3" | |
|---|---|---|---|---|---|
| Power Consumption | 23% | -21% | -7% | 4% | |
| Idle Minimum * (Watt) | 7.7 | 4.4 43% | 10.6 -38% | 7 9% | 8.2 -6% |
| Idle Average * (Watt) | 11.7 | 6.8 42% | 14.5 -24% | 11 6% | 11 6% |
| Idle Maximum * (Watt) | 12 | 8.3 31% | 15 -25% | 19 -58% | 11.1 7% |
| Load Average * (Watt) | 80.5 | 81 -1% | 90 -12% | 79 2% | 77 4% |
| Load Maximum * (Watt) | 128.4 | 127 1% | 135 -5% | 119 7% | 116.9 9% |
* ... smaller is better
| Asus ROG Strix GL553VD-DS71 i7-7700HQ, GeForce GTX 1050 Mobile, 48 Wh | Dell Inspiron 15 7000 7567 i7-7700HQ, GeForce GTX 1050 Ti Mobile, 74 Wh | MSI GL62M 7RD-077 i7-7700HQ, GeForce GTX 1050 Mobile, 41 Wh | HP Omen 15-ax007ng 6700HQ, GeForce GTX 965M, 61.5 Wh | Acer Aspire VX5-591G-D0DD i7-7700HQ, GeForce GTX 1050 Ti Mobile, 52 Wh | |
|---|---|---|---|---|---|
| Battery runtime | 123% | -14% | 35% | 33% | |
| Reader / Idle (h) | 7.3 | 19.6 168% | 6.5 -11% | 7.8 7% | |
| WiFi v1.3 (h) | 4.6 | 10.4 126% | 3.8 -17% | 4.5 -2% | 6.1 33% |
| Load (h) | 0.8 | 1.4 75% | 0.7 -13% | 1.6 100% |
Pros
Cons

华硕GL553VD 是穷人中的王子。尽管其显卡定位在廉价级别,但它的价格却不是。 微星GL62M有着相同的硬件配置但价格却低100~150美元。 t若用户放弃Core i7-770HQ 转而选择更加合适的 Core i5-7300HQ 价格将会更低。 用户可以以同样的价格买到配备有更强大的GTX 1050 Ti 的 Dell Inspiron 15 7000 或者 低50美元的价格购买 Acer Aspire VX5。
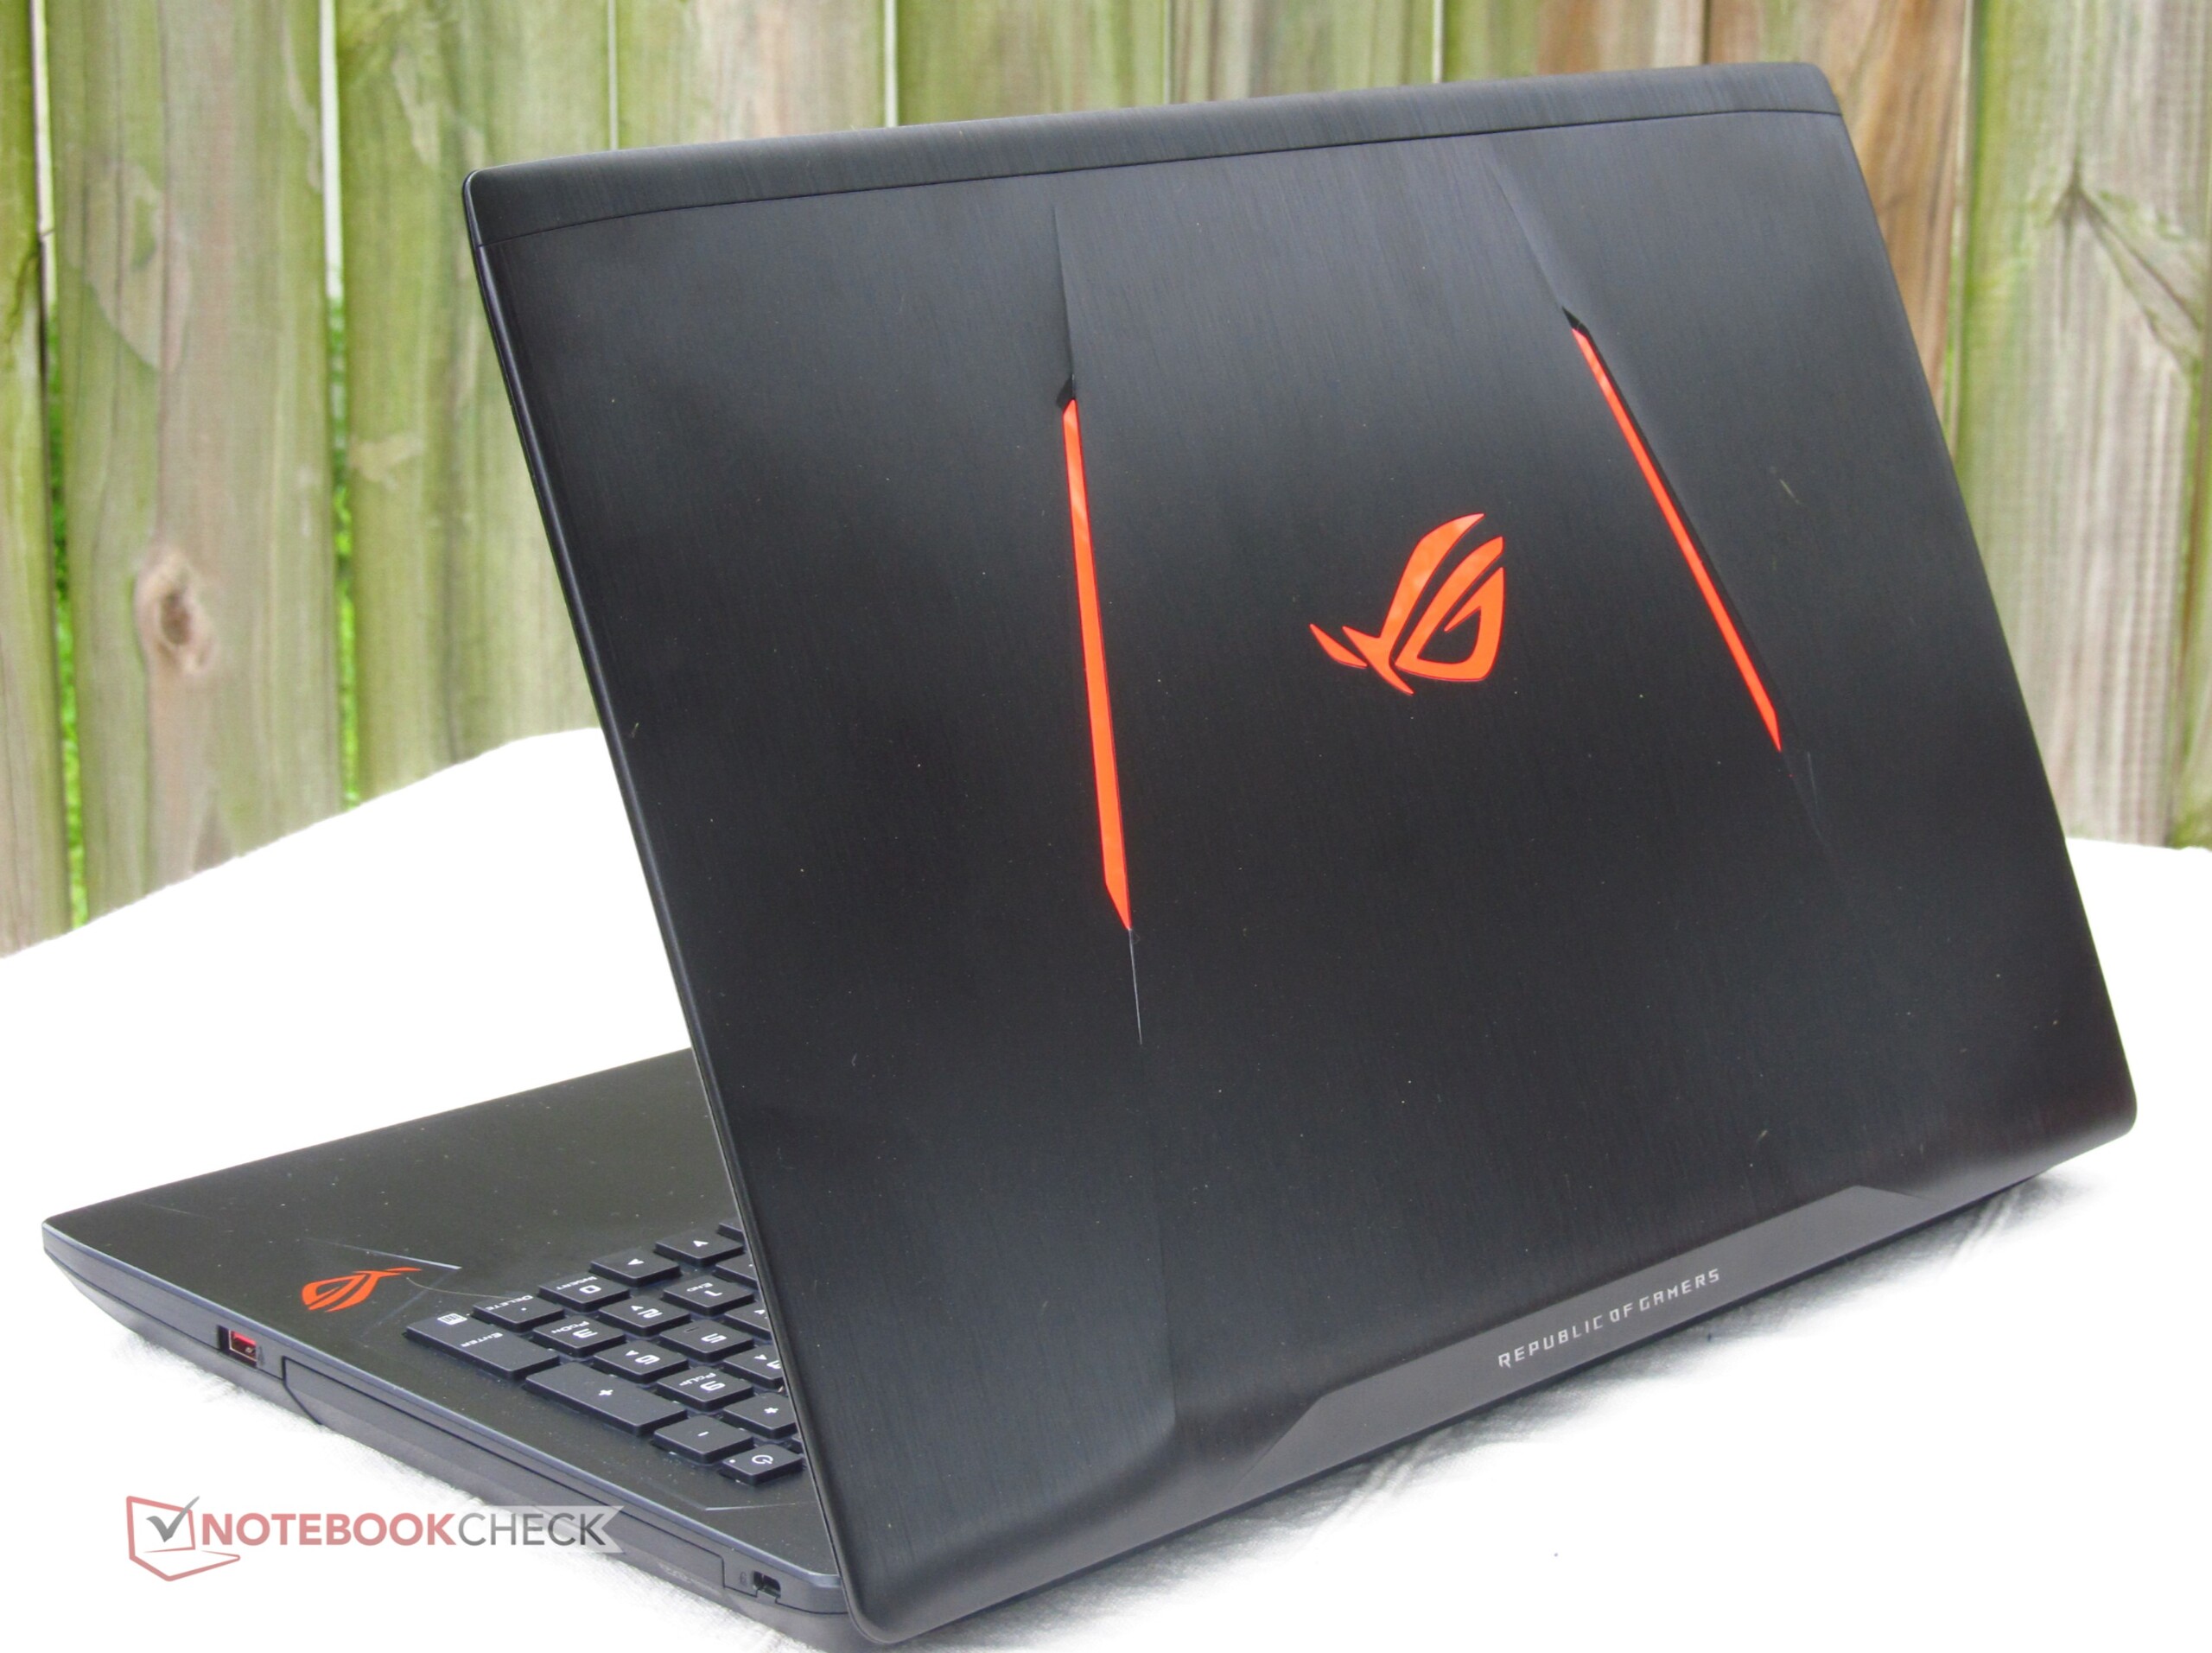
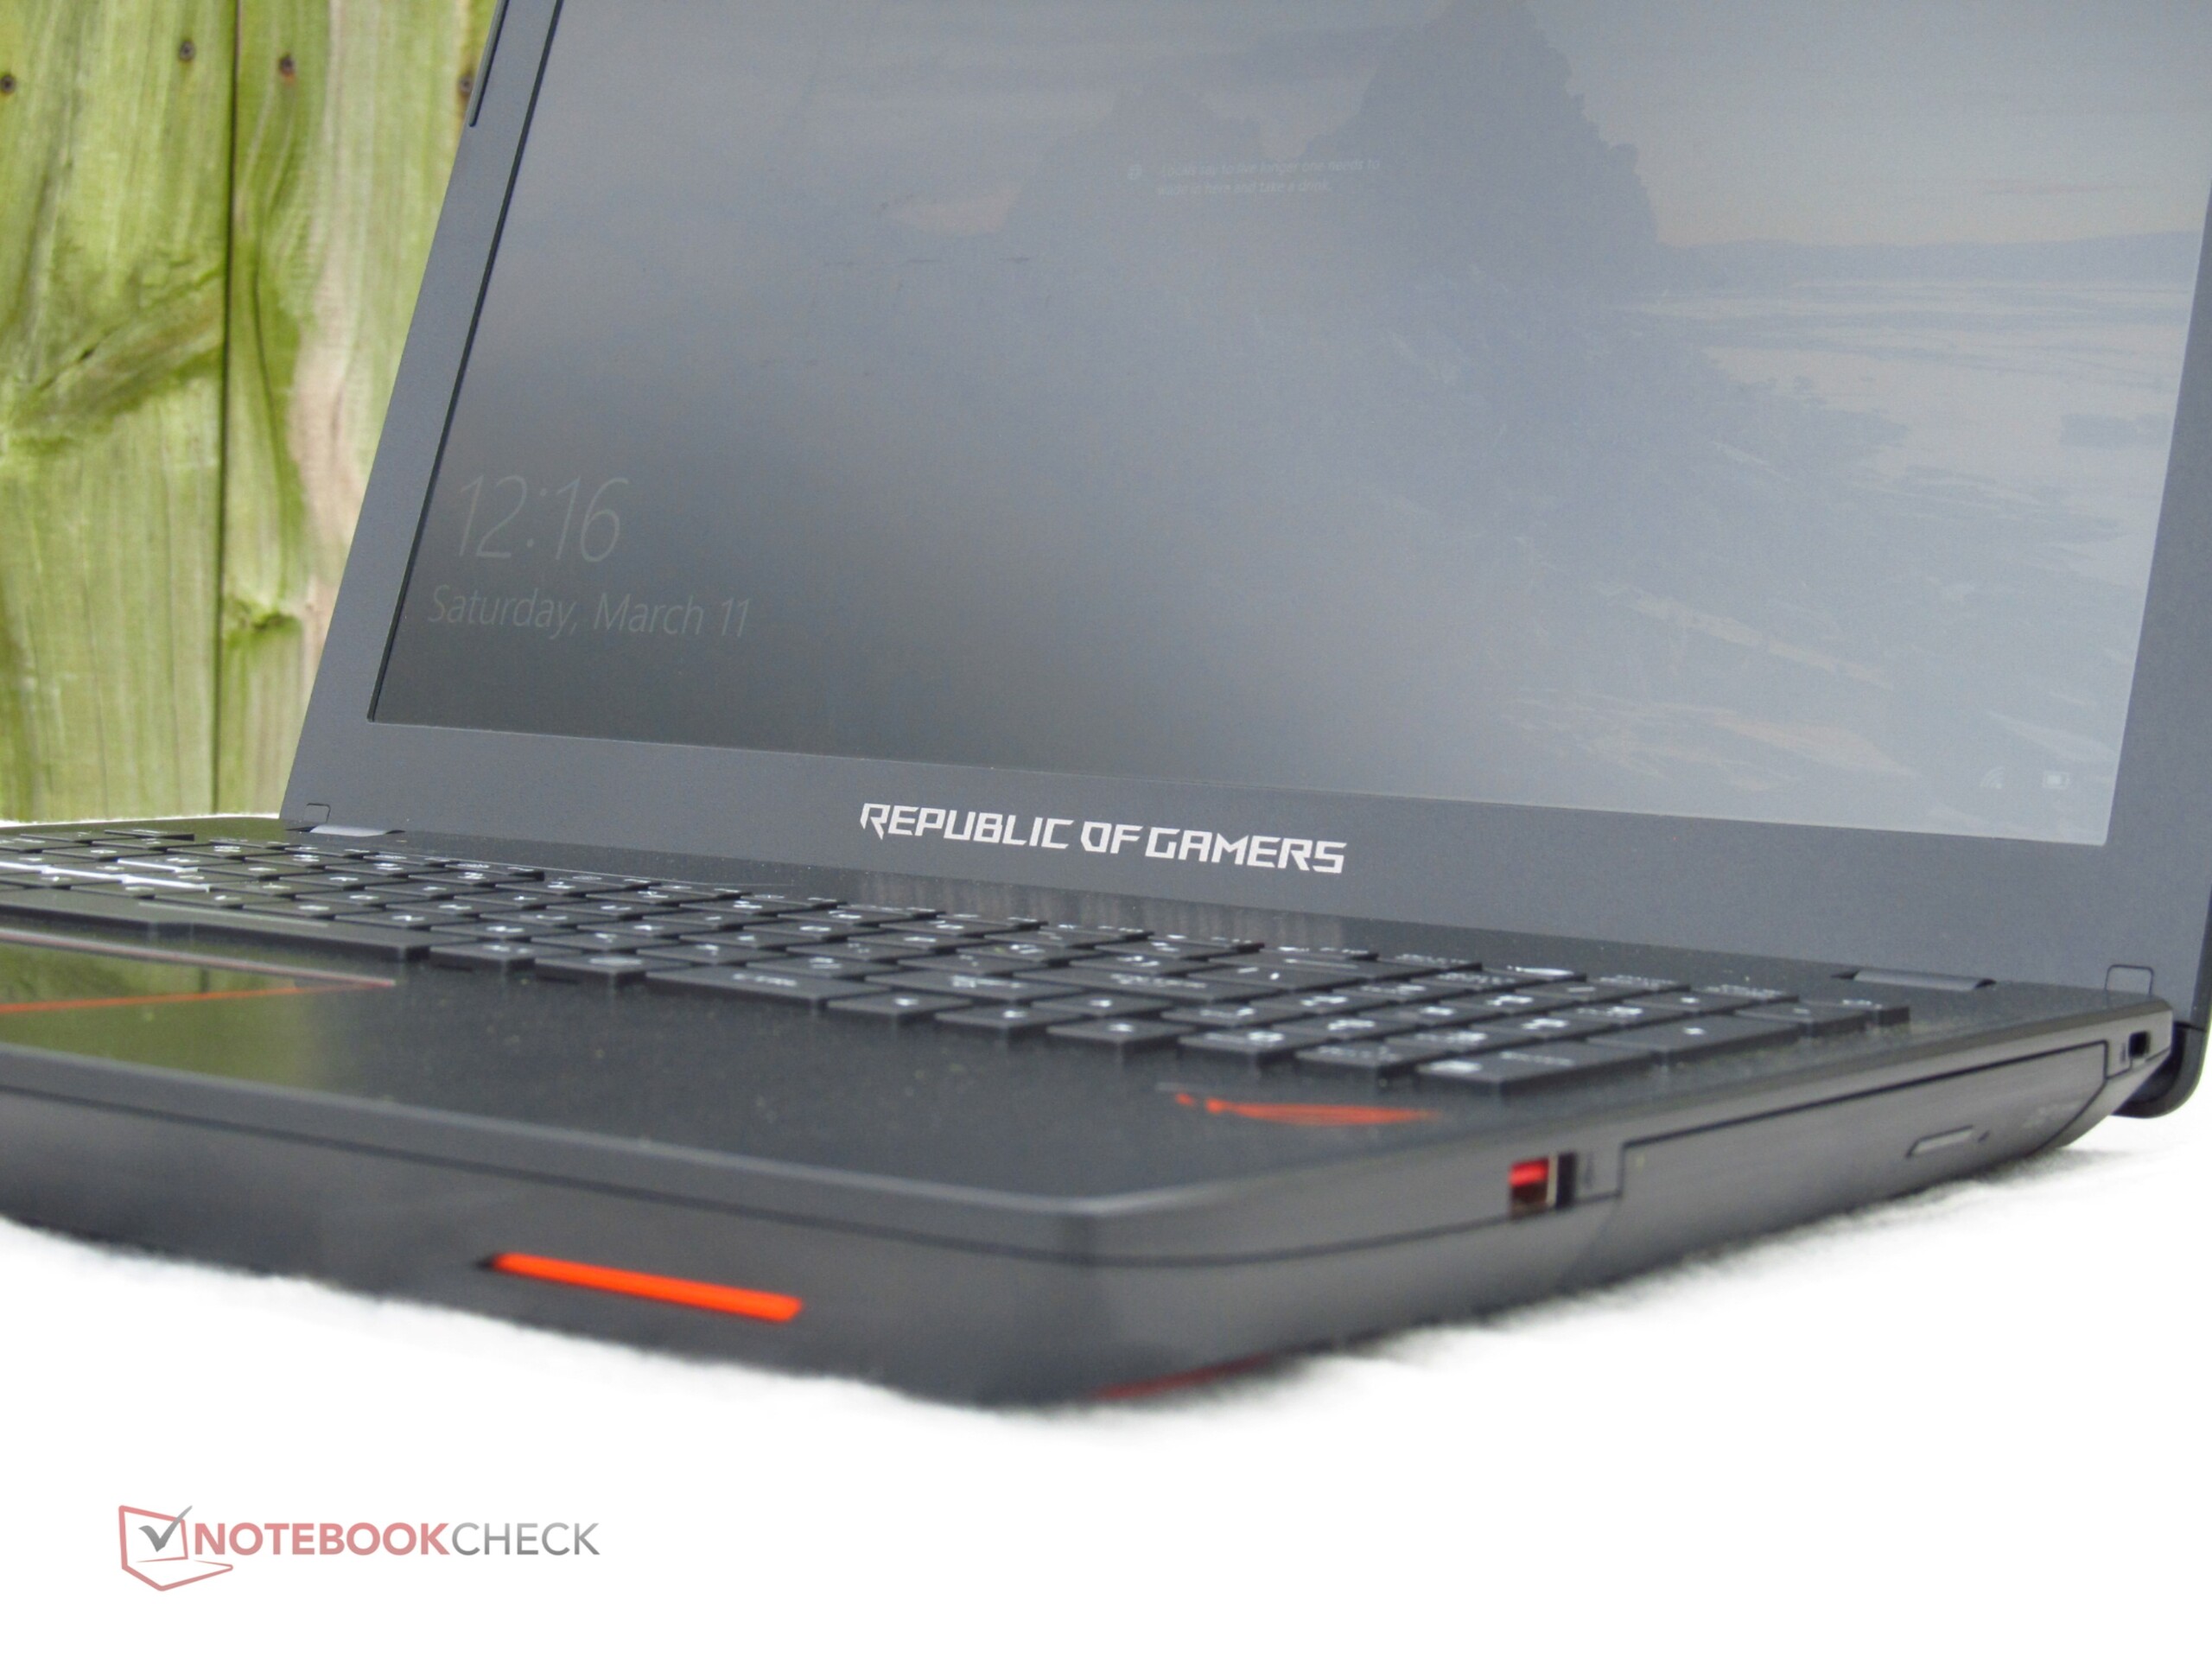
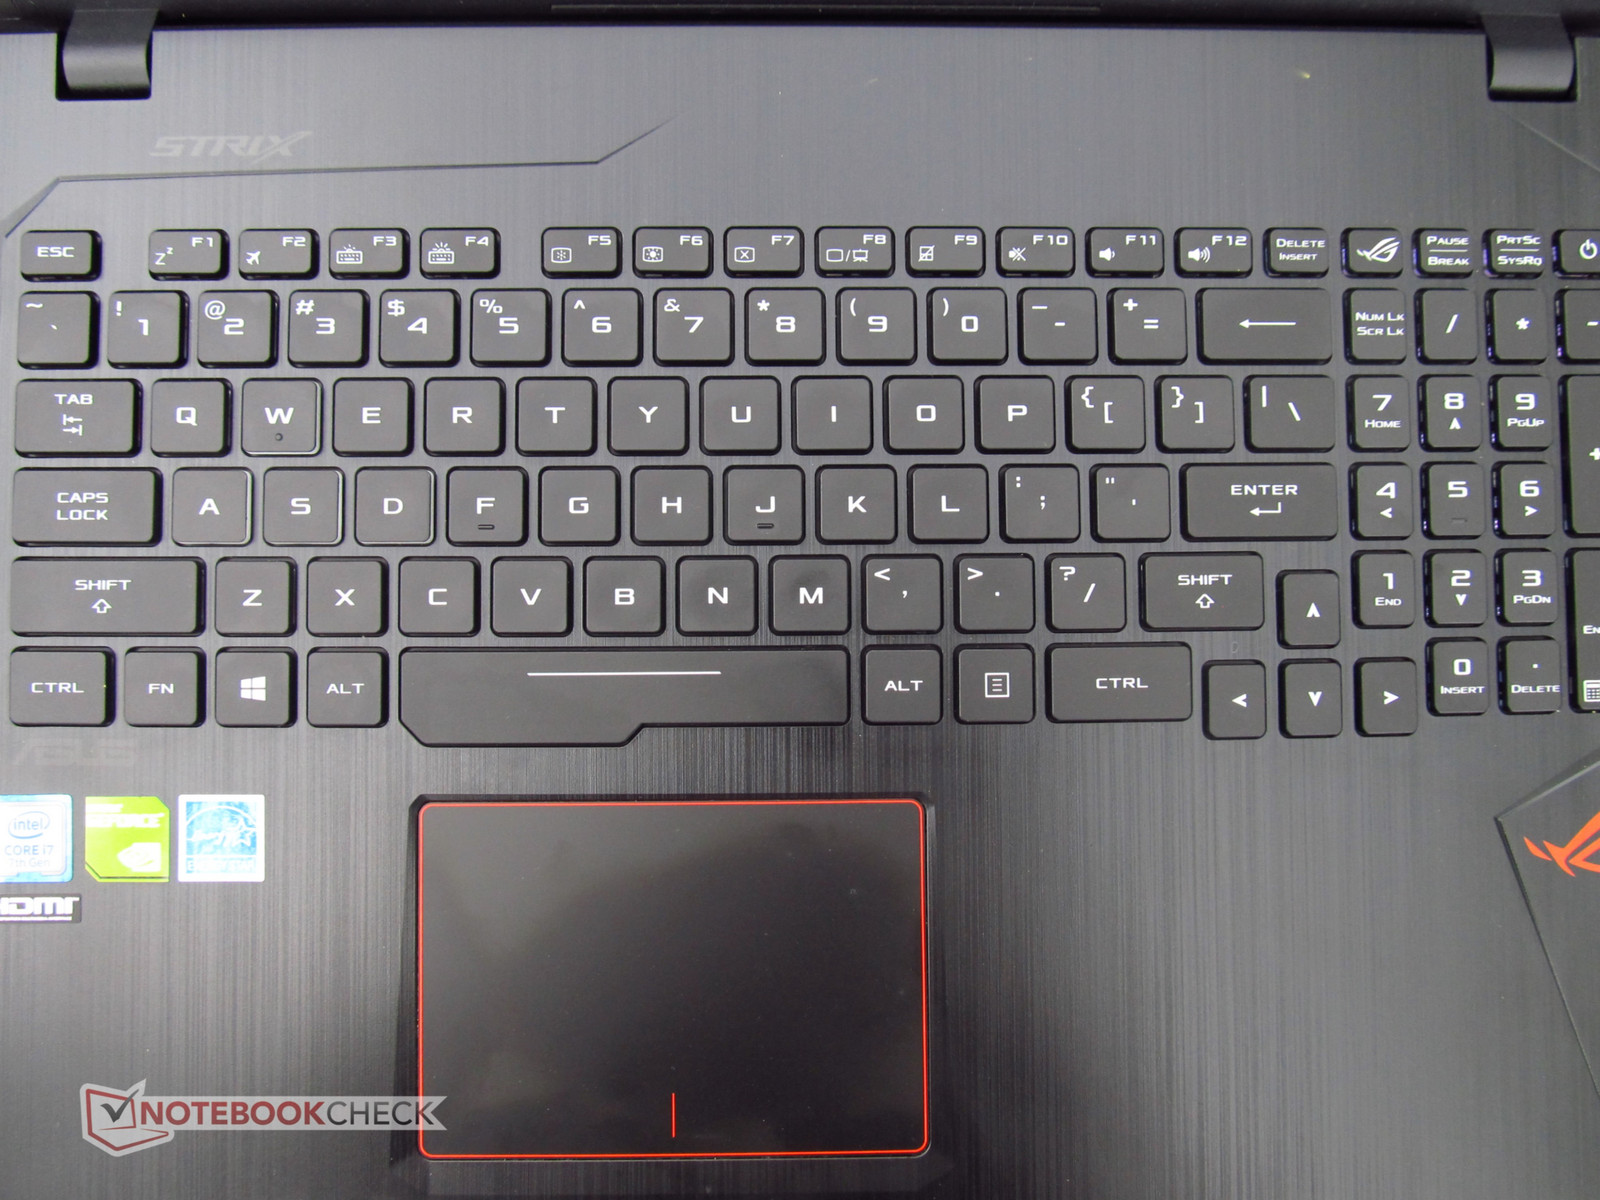
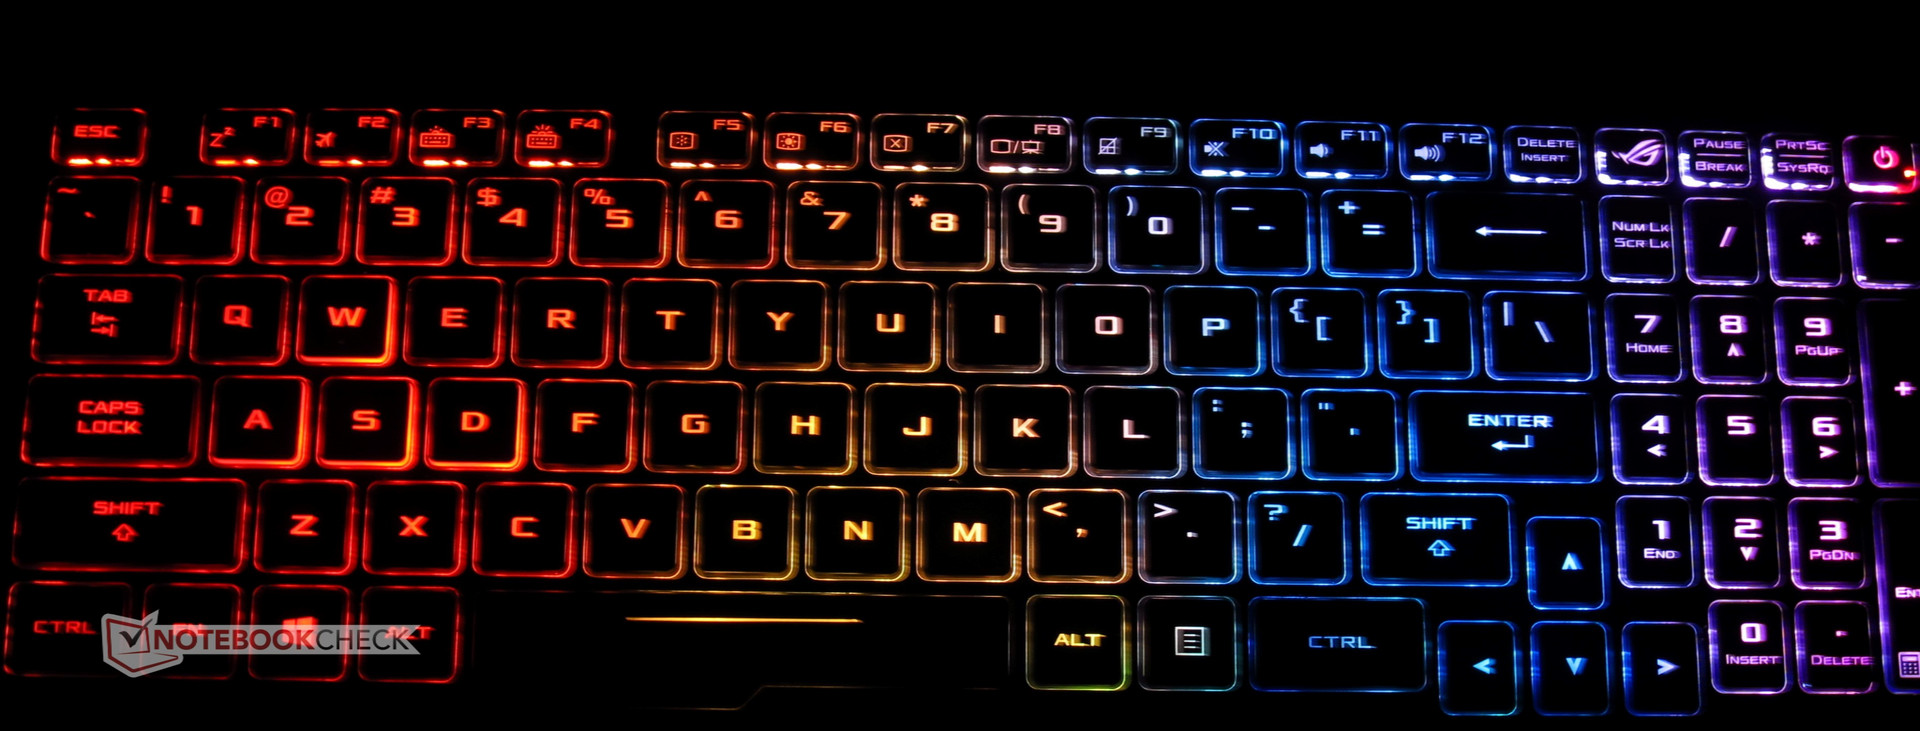
那么额外的费用带来了什么?华硕 GL553 的键盘的是令人难以置信的且带有全RGB背光。其散热系统设计出色,IPS屏幕色彩艳丽且丰富。制造质量上乘,笔记本看起来和感觉起来都极为出色。但买家需要决定是否为这些优点支付额外的100~200美元。
对于那些希望能够在全高清分辨高画质下运行游戏的玩家来说,选择从未如此困难。华硕GL553有着出色的游戏表现且外壳制造优异。对于屏幕质量,键盘,和外观有需求的用户会对华硕 GL553 感到满意。但是,对于那些仅仅在乎游戏而不在乎用于游戏的设备的玩一家来说,有着更好(且更便宜)的选择。
惠普 Omen 15依旧是令人满意的,尽管仅搭载上一代硬件,但性能表现相近。想要找到更加廉价机器的潜在买家可能需要考虑二手市场。有着更好GPU以及固态硬盘的戴尔 Inspiron 15 7000 显然应该被考虑。再加几百美元便可以获得搭载 英伟达 GeForce GTX 1060 的笔记本,它能提供在全高清甚至更高分辨率下出色的游戏表现。
注:本文是基于完整评测的缩减版本,阅读完整的英文评测,请点击这里。
Asus ROG Strix GL553VD-DS71
- 03/12/2017 v6 (old)
Sam Medley
Price comparison
