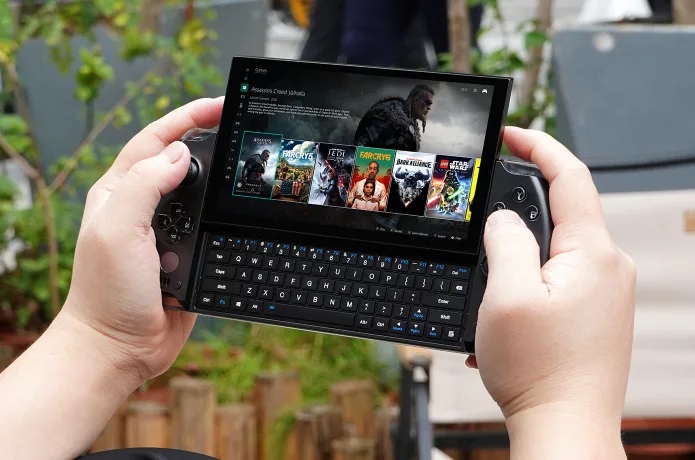
GPD Win 4掌上电脑回顾。1080P的Ryzen 7游戏在你的手掌上
2023年GPD Win 4手持式Windows PC是2021年Win 3的直接继承者。除了处理器从第11代英特尔换成更强大的AMD Zen 3+外,其设计也从头到尾进行了全面改造,成为一台整体上更强大的机器,我们的审查将显示出这一点。
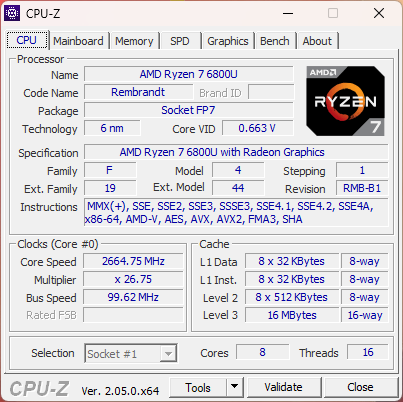
Win 4采用了相同的 Ryzen 7 6800U华硕ZenBook S13等旗舰超极本上的处理器。目前所有的配置只在内存(16或32GB LPDDR5-6400)和固态硬盘容量(1或2TB)方面有所不同,而AMD处理器和6英寸1080p IPS触摸屏保持不变。关于Win 4的更多制造商提供的信息可以在其Indiegogo页面上找到。.
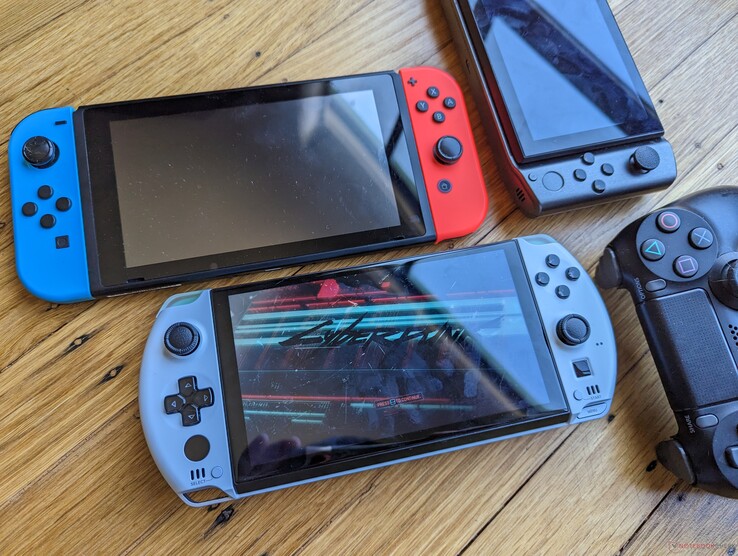
竞争者包括Steam Deck、任天堂Switch和OneXPlayer。我们下面的比较也包括U系列供电的子笔记本。
更多GPD评论。
潜在的竞争对手比较
Rating | Date | Model | Weight | Height | Size | Resolution | Price |
|---|---|---|---|---|---|---|---|
| 80.3 % v7 (old) | 03 / 2023 | GPD Win 4 R7 6800U, Radeon 680M | 607 g | 28 mm | 6.00" | 1920x1080 | |
| 84.5 % v7 (old) | 07 / 2022 | GPD Win Max 2 i7-1260P, Iris Xe G7 96EUs | 1 kg | 23 mm | 10.10" | 2560x1600 | |
v (old) | GPD Win 3 i5-1135G7, Iris Xe G7 80EUs | 553 g | 27 mm | 5.50" | 1280x720 | ||
| 85.5 % v7 (old) | 04 / 2021 | Razer Blade Stealth i7-1165G7 GTX 1650 Ti Max-Q i7-1165G7, GeForce GTX 1650 Ti Max-Q | 1.4 kg | 15.3 mm | 13.30" | 1920x1080 | |
| 90.1 % v7 (old) | 11 / 2022 | Dell XPS 13 9315 2-in-1 Core i5-1230U i5-1230U, Iris Xe G7 80EUs | 764 g | 7.4 mm | 13.00" | 2880x1920 | |
| 90.1 % v7 (old) | 07 / 2022 | Asus Zenbook S 13 OLED R7 6800U, Radeon 680M | 1.1 kg | 14.9 mm | 13.30" | 2880x1800 |
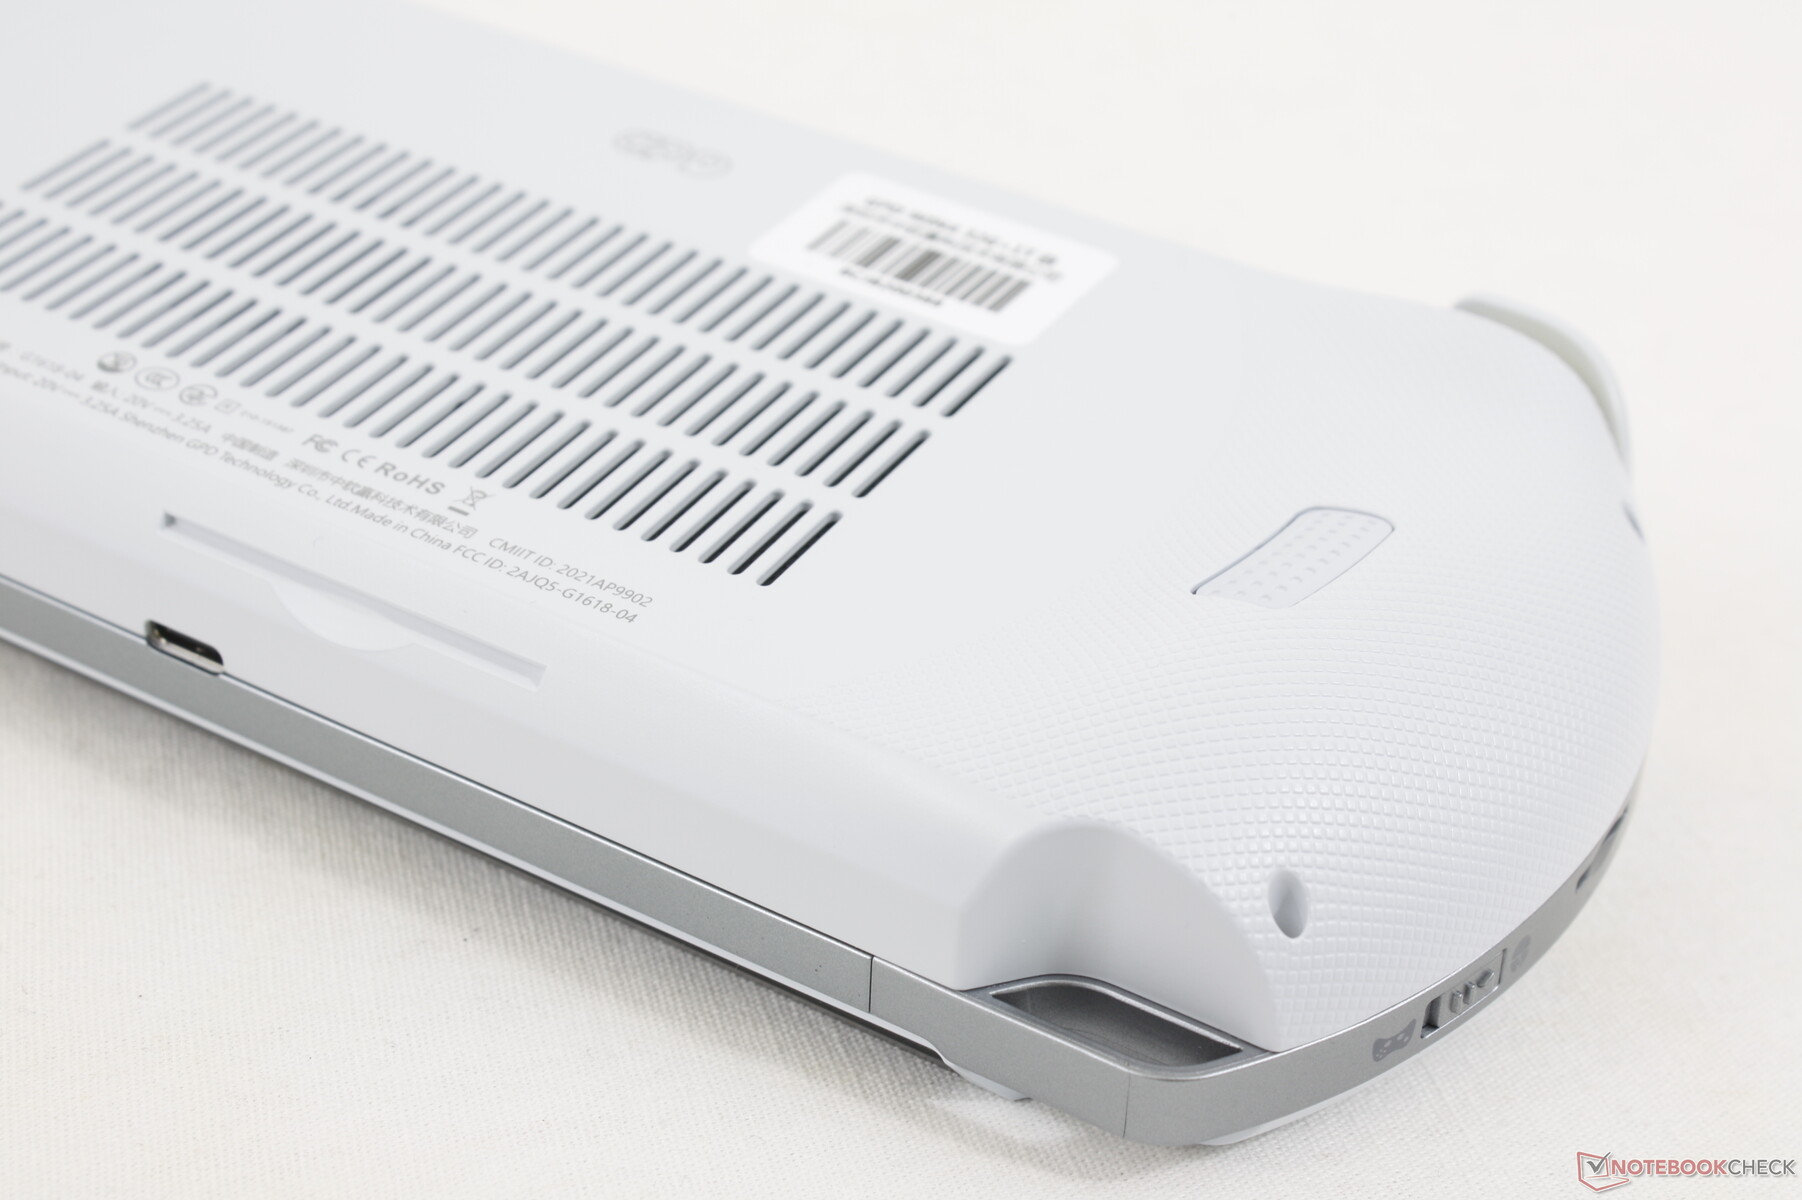
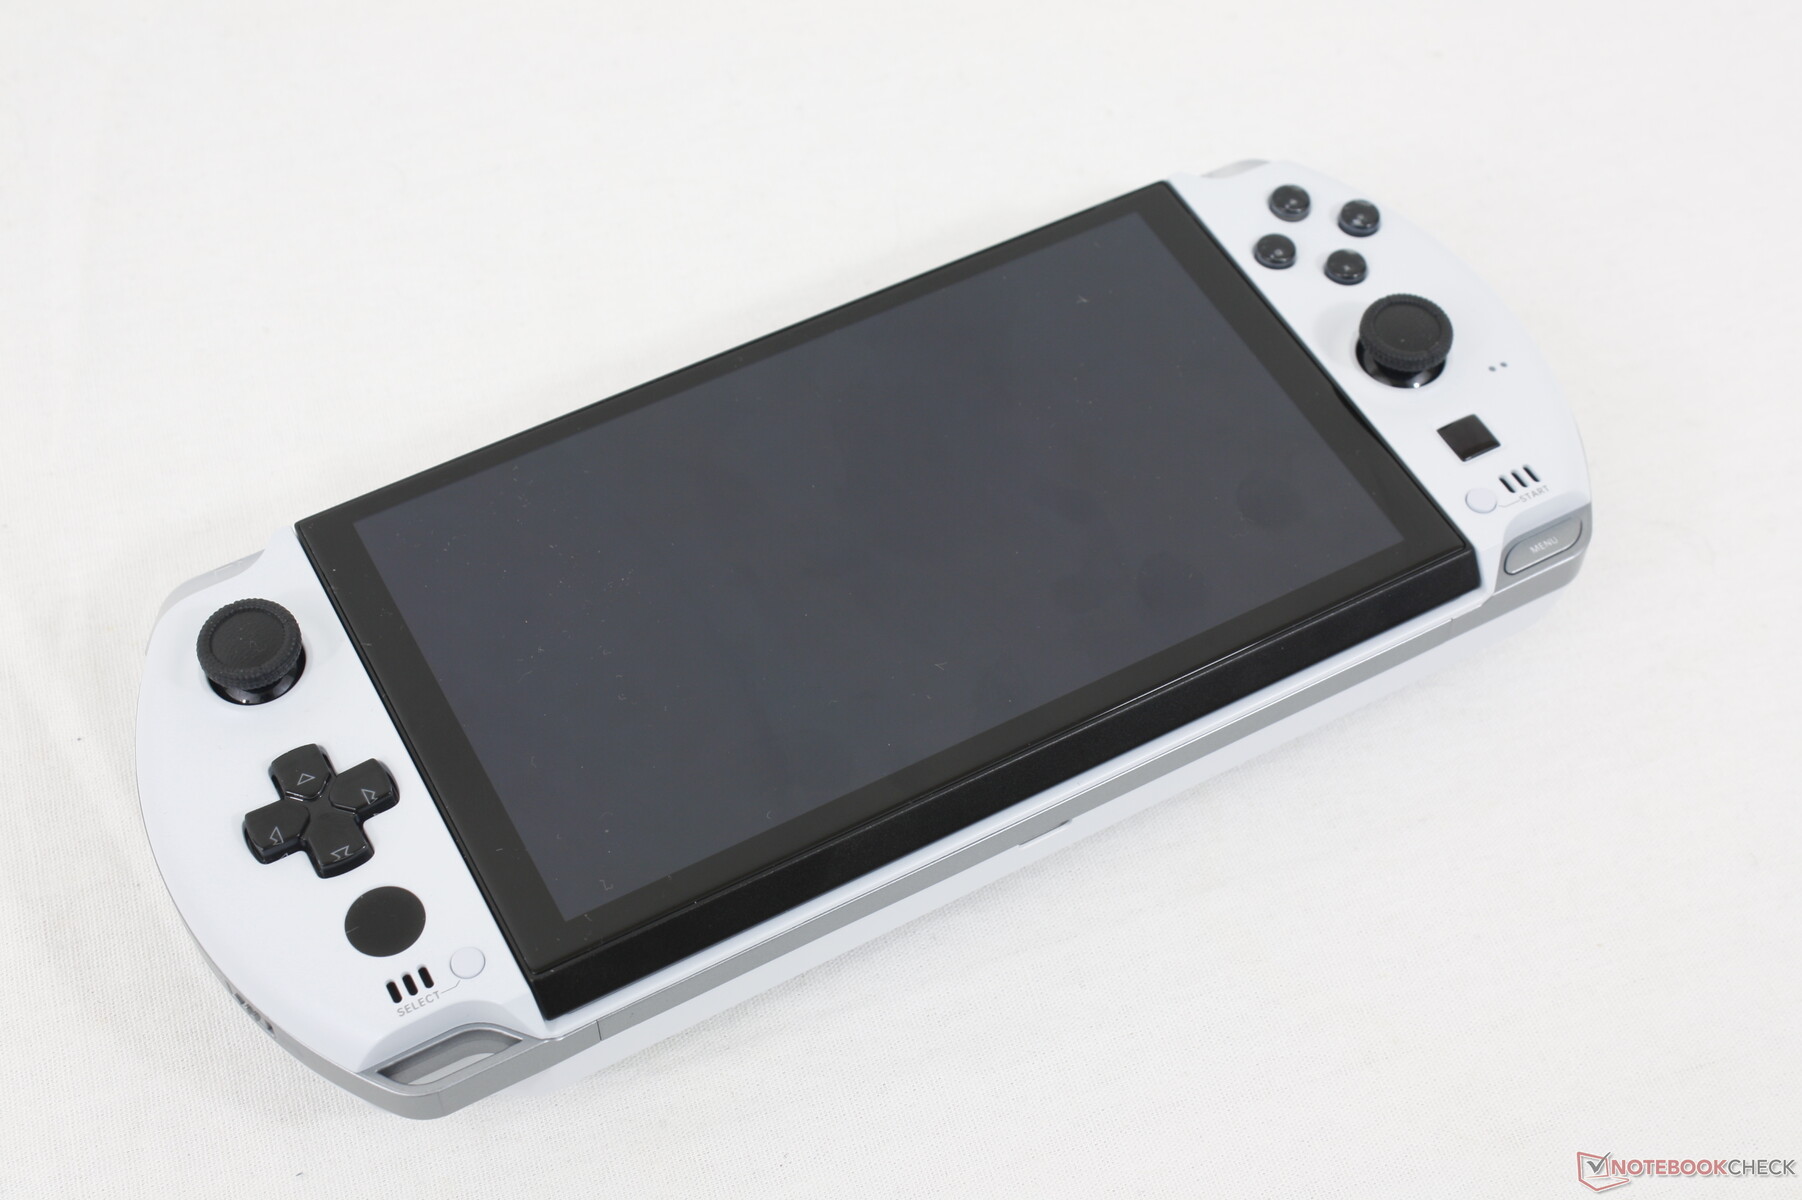
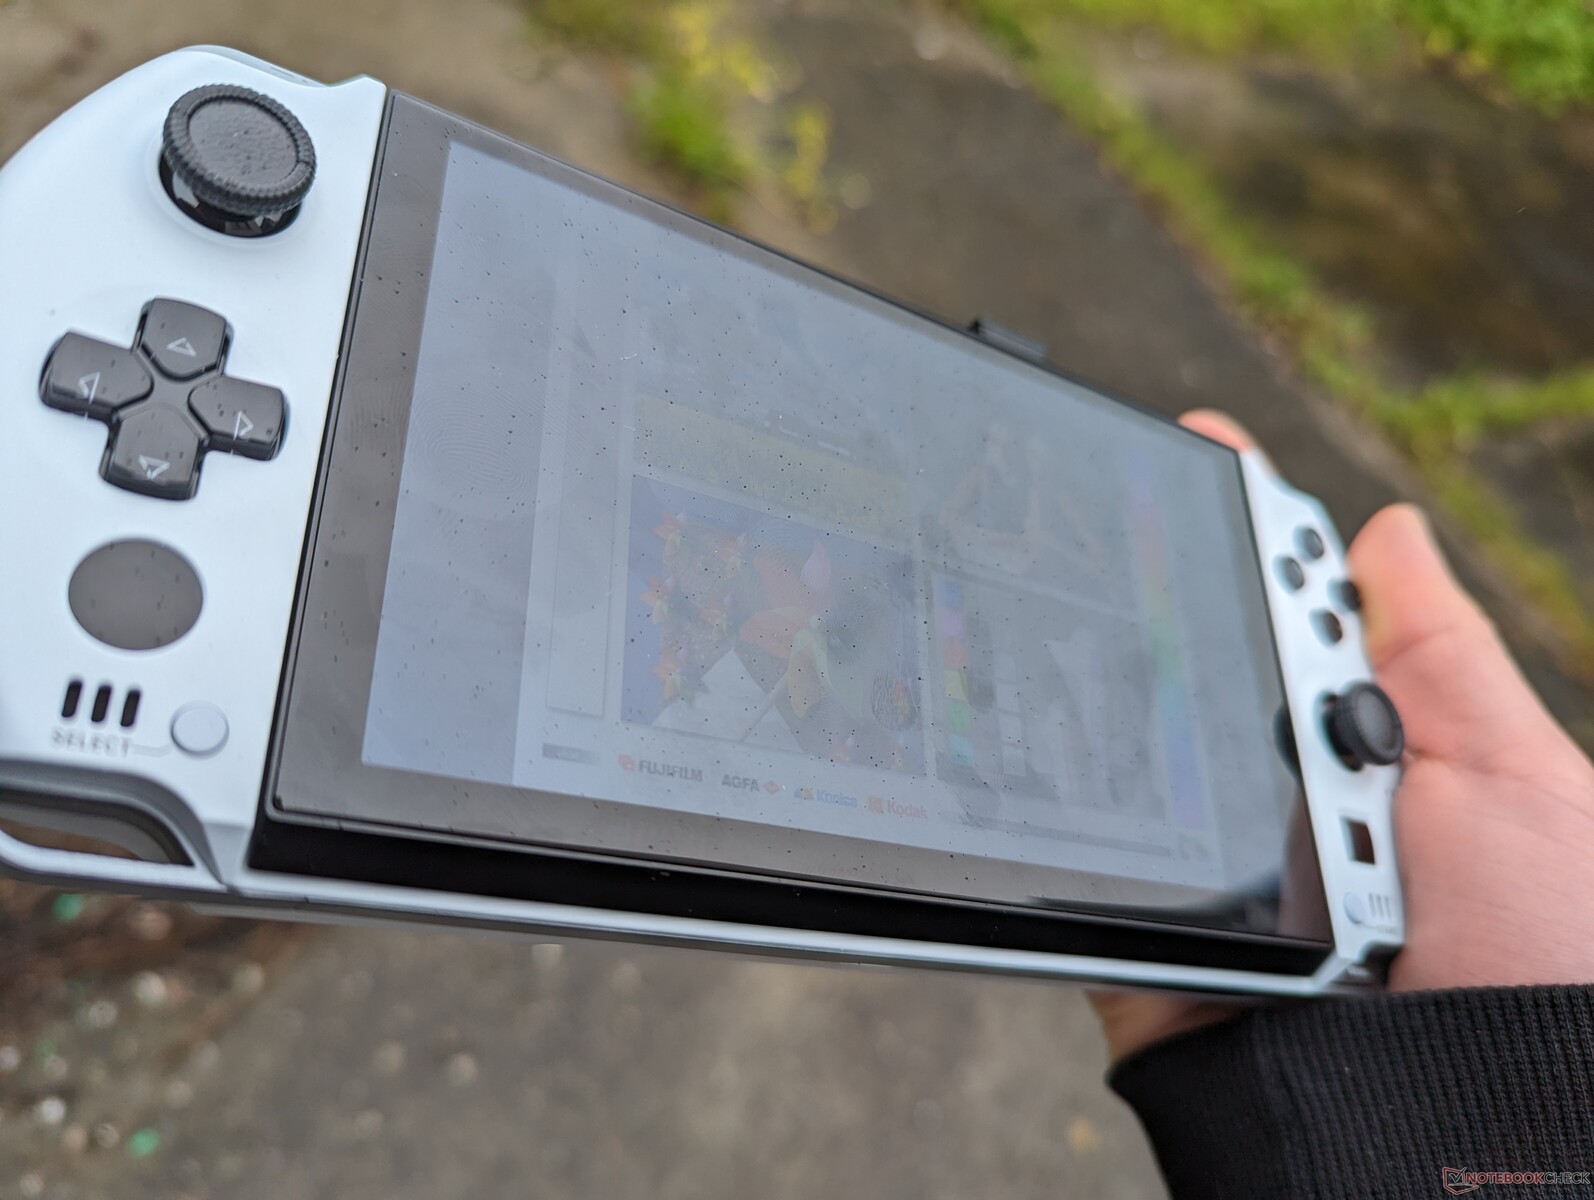
案例--看起来像Vita,刺眼得像Switch
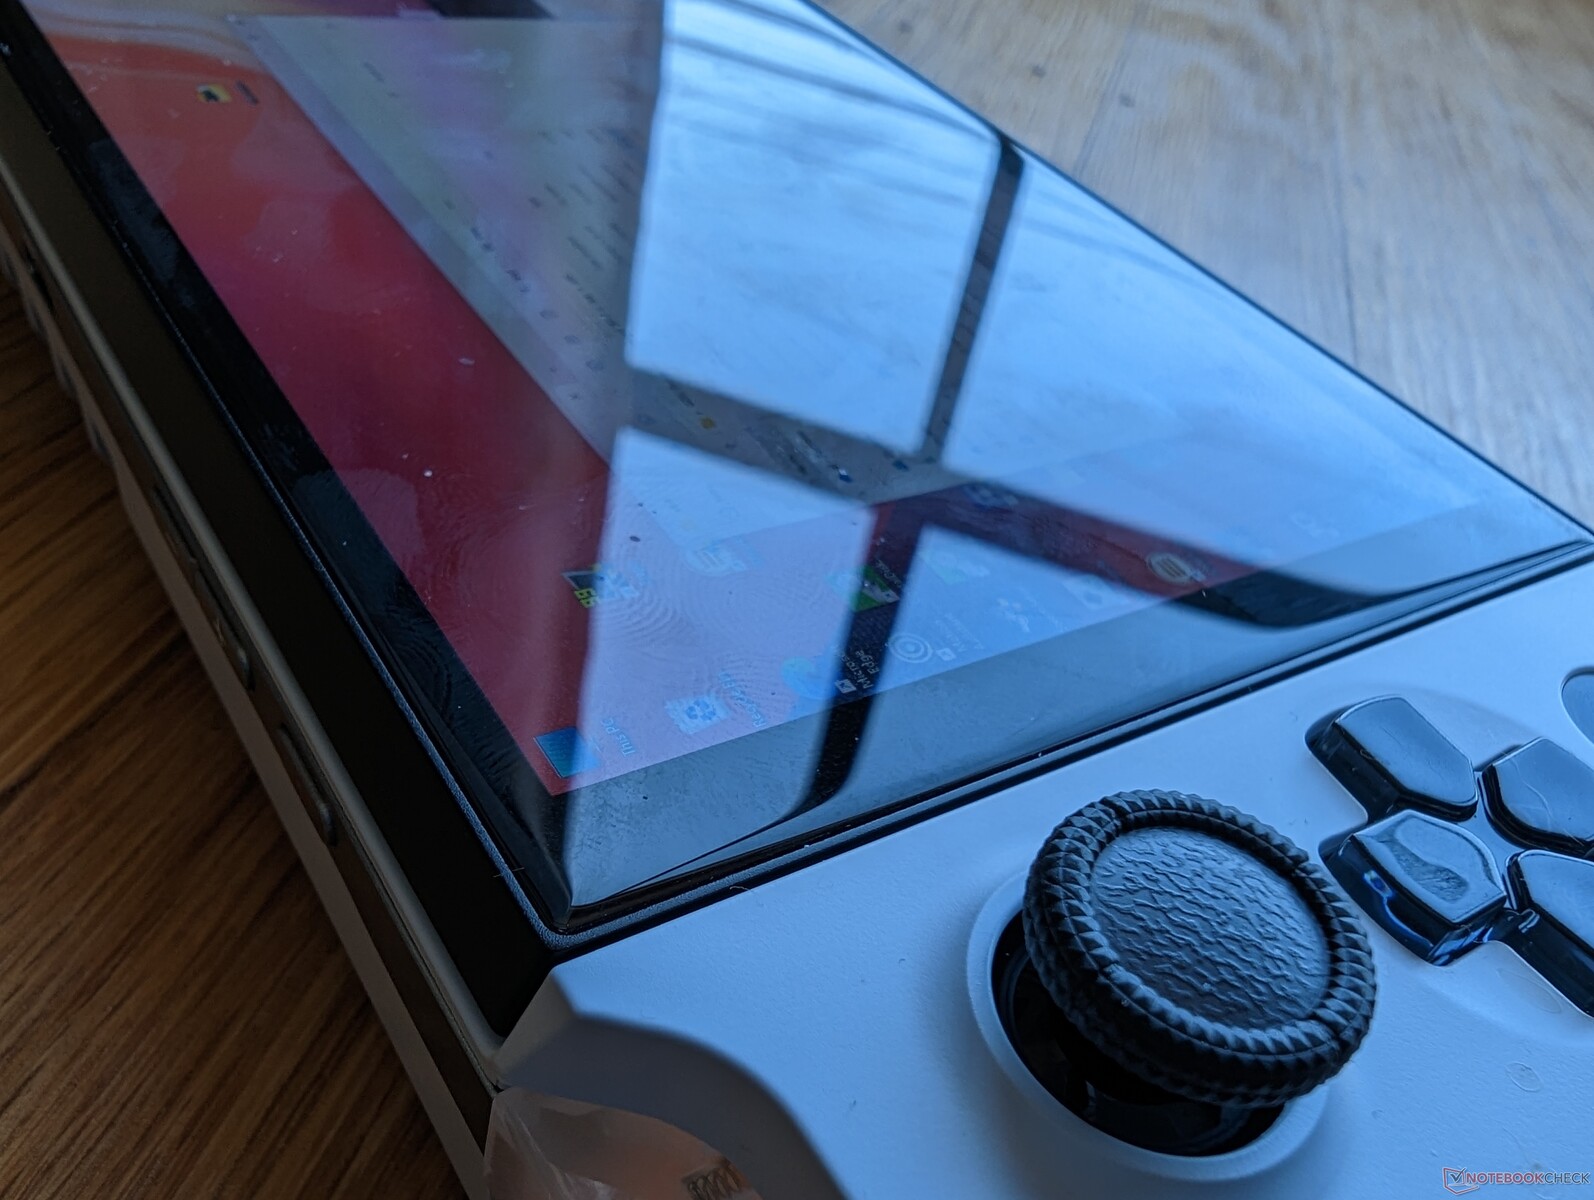
机箱由灰色镁合金、白色或黑色的ABS塑料组成,触摸屏采用边缘到边缘的大猩猩玻璃5保护。整体设计是Win 3的演变,同时融入了索尼和任天堂掌机的特点。例如,它的形状和游戏手柄的尺寸分别与PSP和Switch相似。最终的结果是比即将离去的Win 3更具吸引力和游戏性的外观。
Win 3的底盘刚性很好,现在Win 4的底盘刚性甚至更好。我们的设备会表现出最小的弯曲或扭曲,没有装配缺陷或缝隙,尽管所有不同的材料和移动部件构成了这个箱子。在背面施加压力时,有一些可以听到的吱吱声,但这并不是什么大问题。总的来说,建造质量可以通过任何一个主要游戏开发商的官方手持设备。
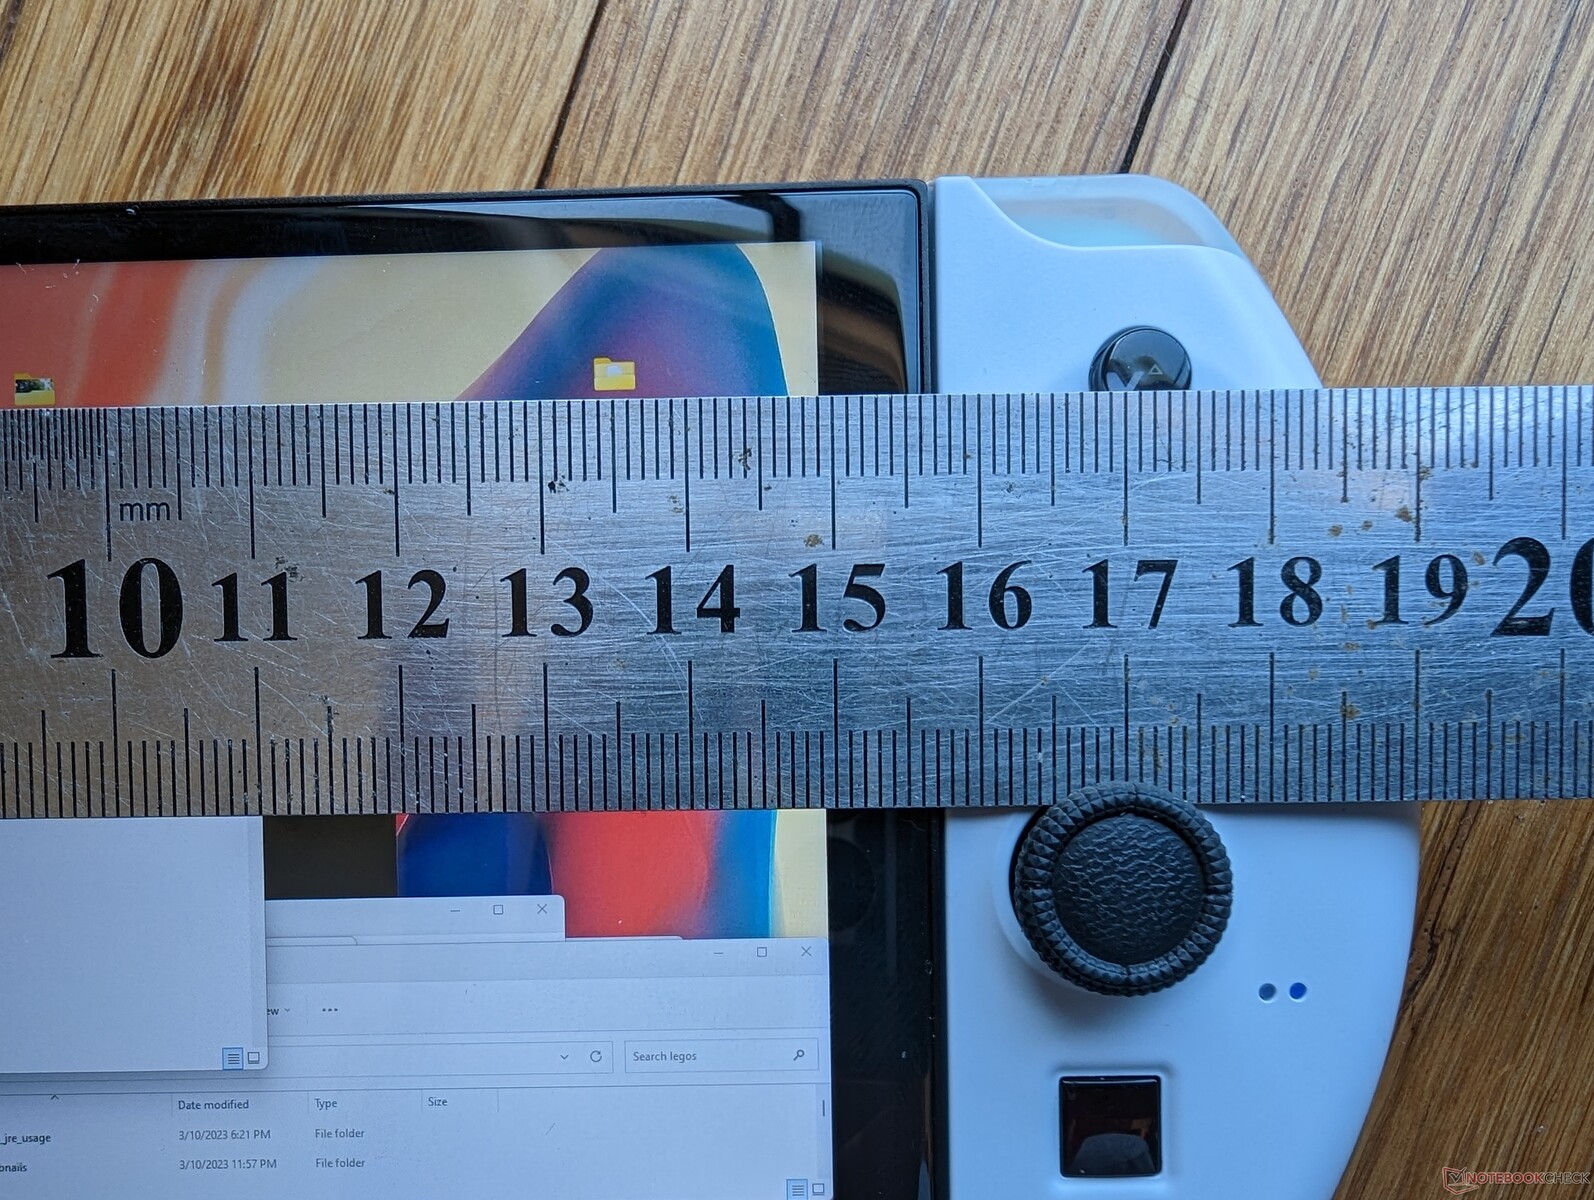
正如我们下面的尺寸对比图所示,该机型比旧版Win 3更厚、更大、更重。作为回报,用户得到了更大的6英寸屏幕,更强大的硬件,更多的端口,以及更强大的结构。这当然是一款更适合放在包里或钱包里的手持设备,而不是放在裤子口袋里。
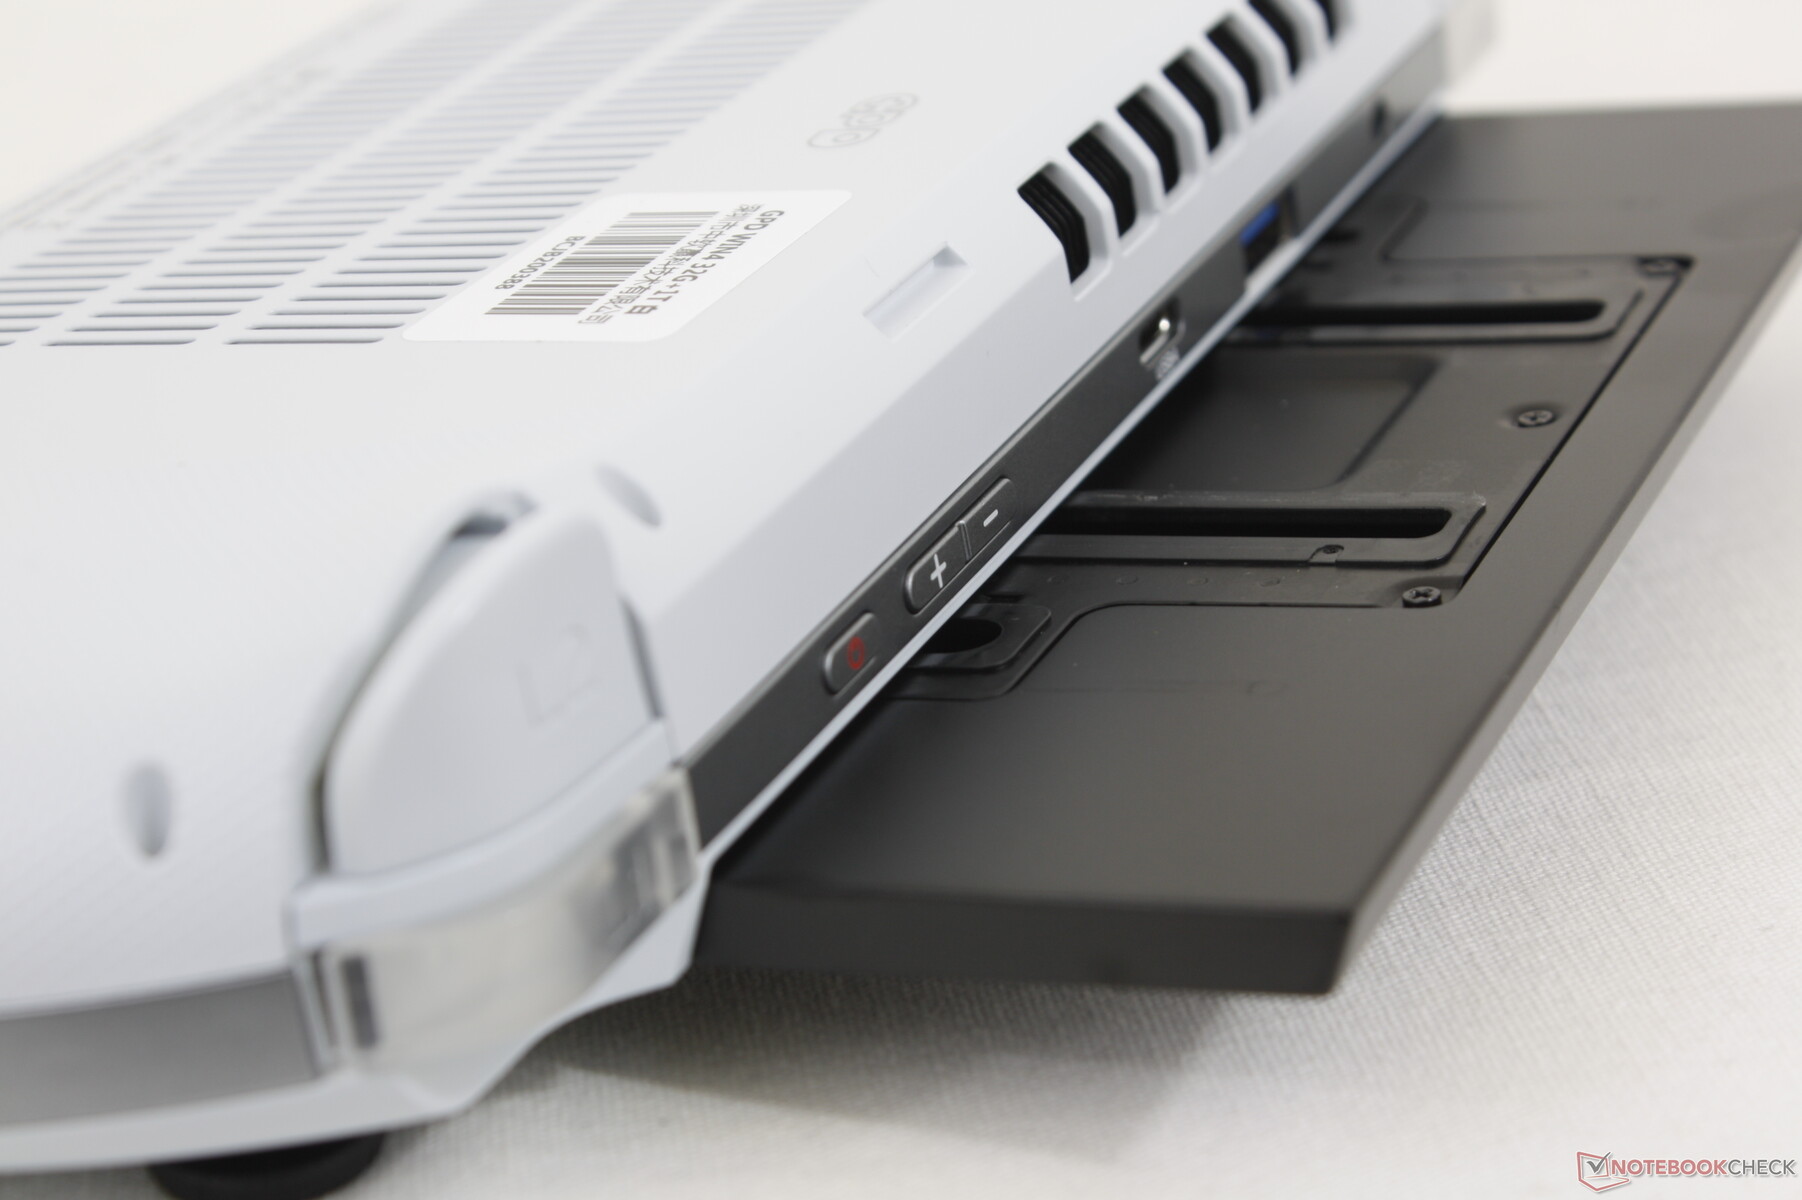
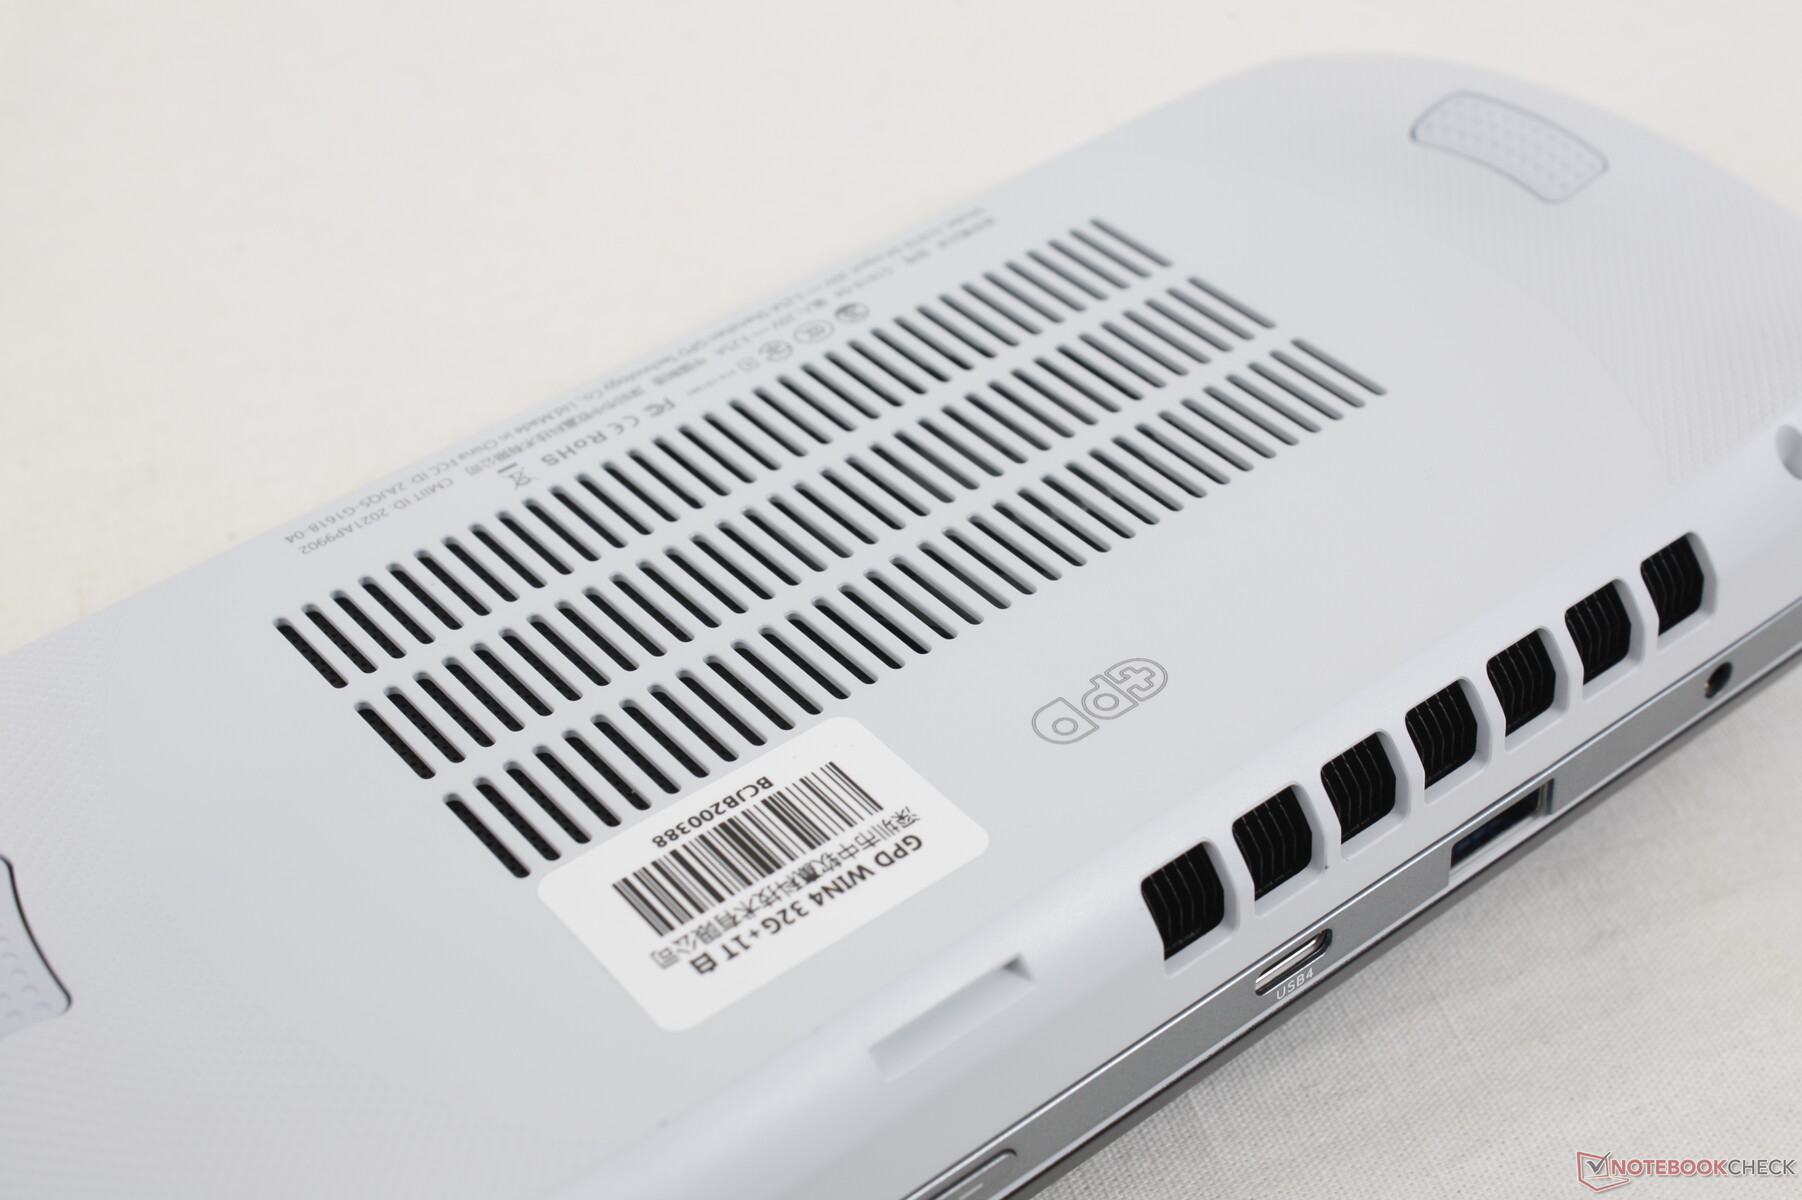
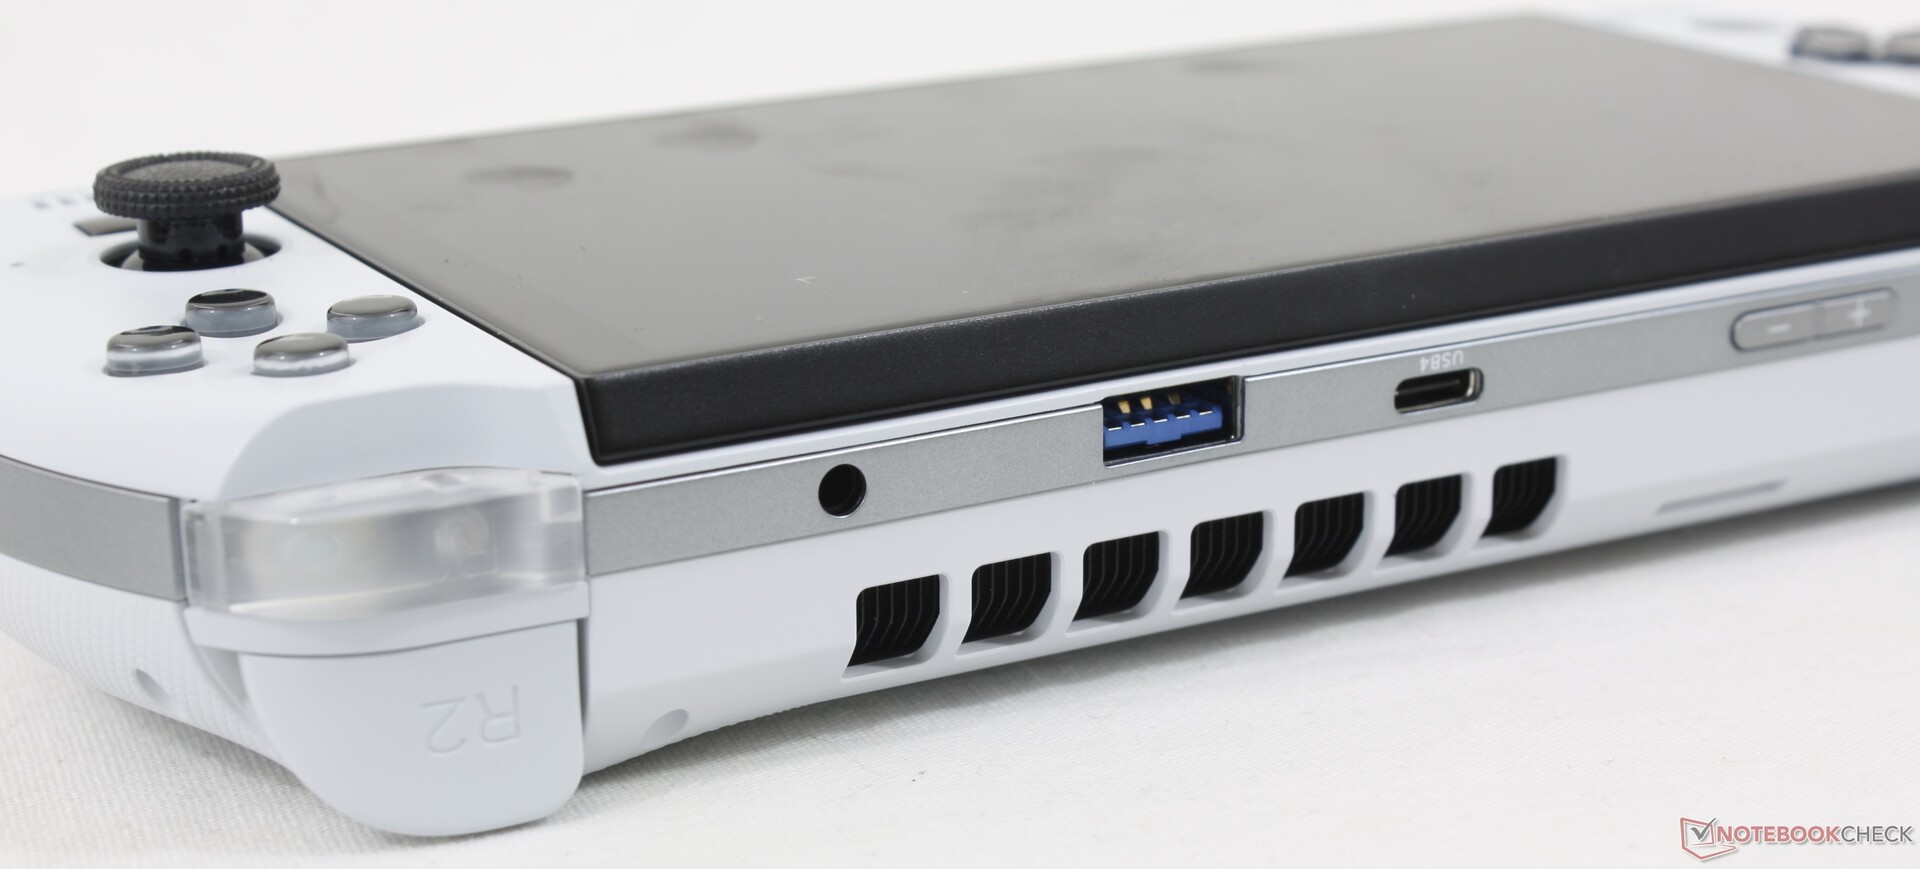
连接性 - 是的,支持eGPU!
该模型集成了两个USB-C端口和一个USB-A。顶部的USB-C端口支持USB4,意味着该系统与外部GPU扩展坞兼容。否则,两个USB-C端口都可用于充电或连接外部显示器,而任天堂Switch只能通过其底部的USB-C端口进行充电。

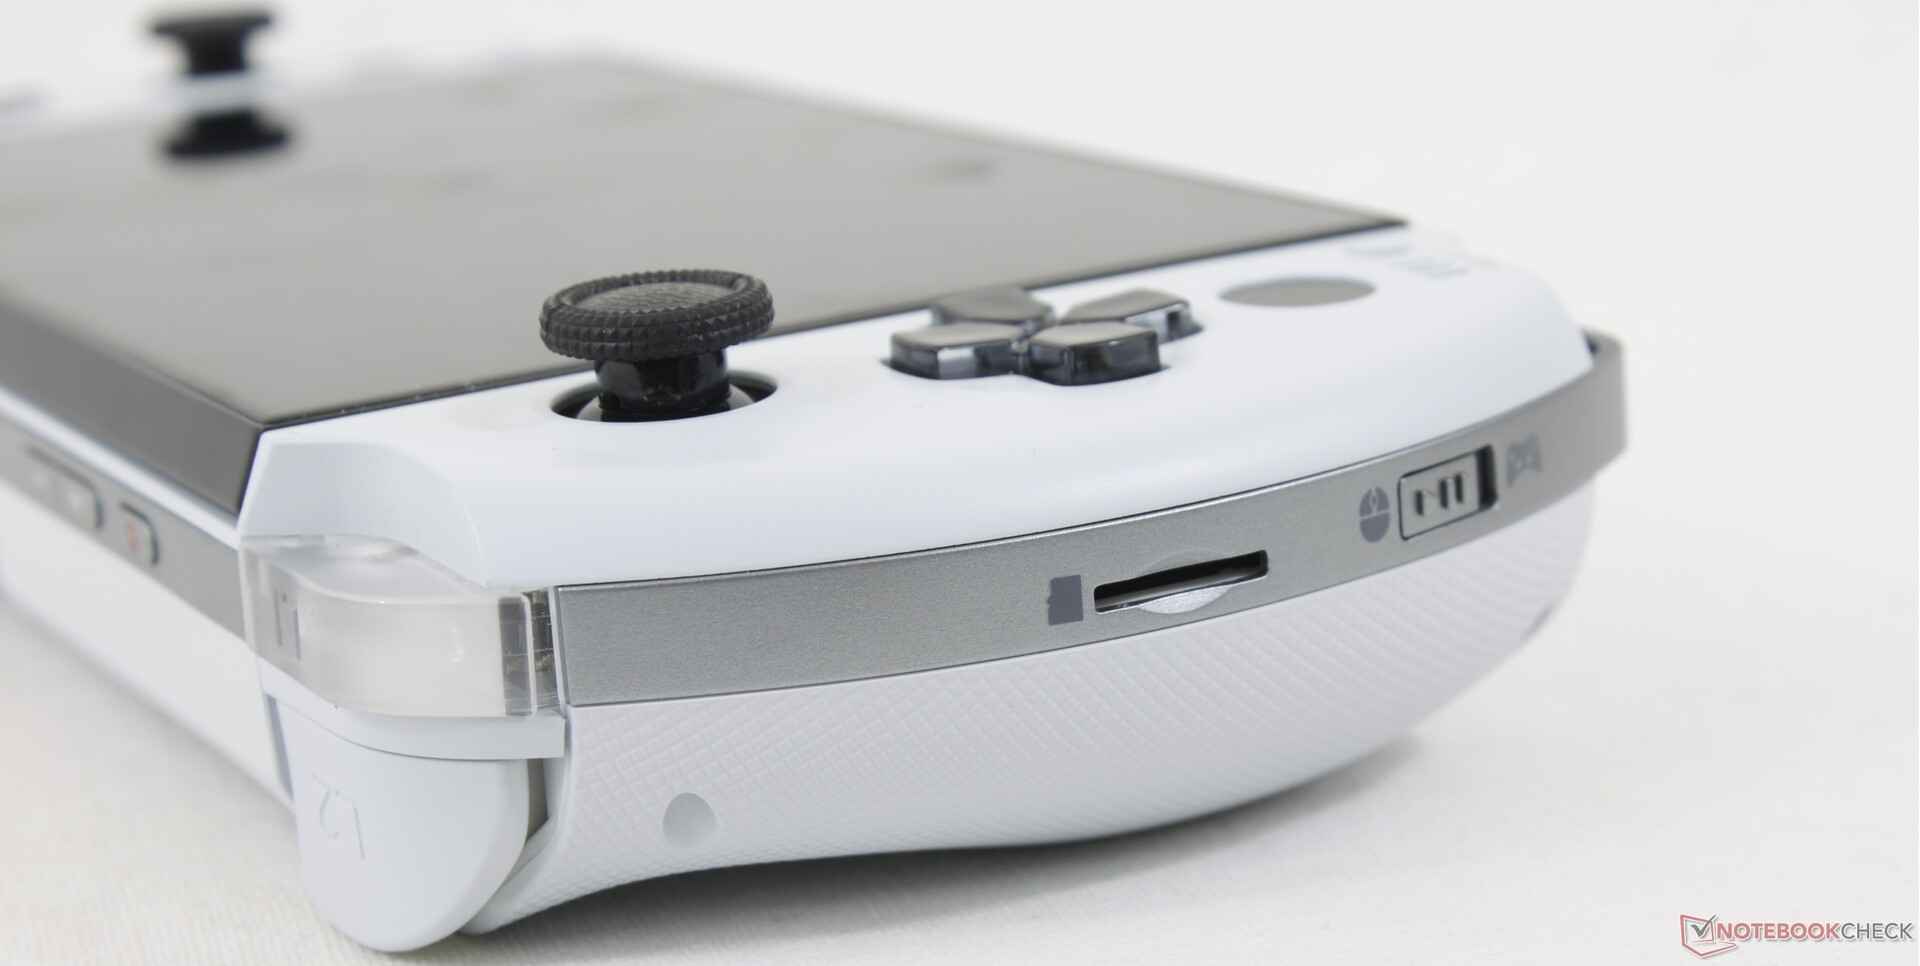
SD卡阅读器
弹簧式MicroSD读卡器从Win 3上回归。尽管它的速度只有Win MAX 2中的MicroSD读卡器的一半,但性能还是不错的。 Win MAX 2.不过,它在将游戏转移到Win 4上时还是很方便的。
| SD Card Reader | |
| average JPG Copy Test (av. of 3 runs) | |
| GPD Win Max 2 (Toshiba Exceria Pro SDXC 64 GB UHS-II) | |
| GPD Win 3 (Toshiba Exceria Pro M501 32 GB UHS-II) | |
| GPD Win 4 (AV Pro SD microSD 128 GB V60) | |
| maximum AS SSD Seq Read Test (1GB) | |
| GPD Win Max 2 (Toshiba Exceria Pro SDXC 64 GB UHS-II) | |
| GPD Win 4 (AV Pro SD microSD 128 GB V60) | |
| GPD Win 3 (Toshiba Exceria Pro M501 32 GB UHS-II) | |
沟通
英特尔AX210是Wi-Fi 6E兼容性的标准配置。在实际传输率方面,Wi-Fi 6E不一定总是比Wi-Fi 6快,但它得益于延迟的减少,这在流媒体游戏中会有所帮助。
| Networking | |
| iperf3 transmit AX12 | |
| GPD Win 3 | |
| Razer Blade Stealth i7-1165G7 GTX 1650 Ti Max-Q | |
| iperf3 receive AX12 | |
| Razer Blade Stealth i7-1165G7 GTX 1650 Ti Max-Q | |
| GPD Win 3 | |
| iperf3 transmit AXE11000 | |
| Asus Zenbook S 13 OLED | |
| GPD Win 4 | |
| iperf3 receive AXE11000 | |
| Asus Zenbook S 13 OLED | |
| GPD Win 4 | |
| iperf3 transmit AXE11000 6GHz | |
| GPD Win Max 2 | |
| Dell XPS 13 9315 2-in-1 Core i5-1230U | |
| GPD Win 4 | |
| iperf3 receive AXE11000 6GHz | |
| GPD Win Max 2 | |
| Dell XPS 13 9315 2-in-1 Core i5-1230U | |
| GPD Win 4 | |
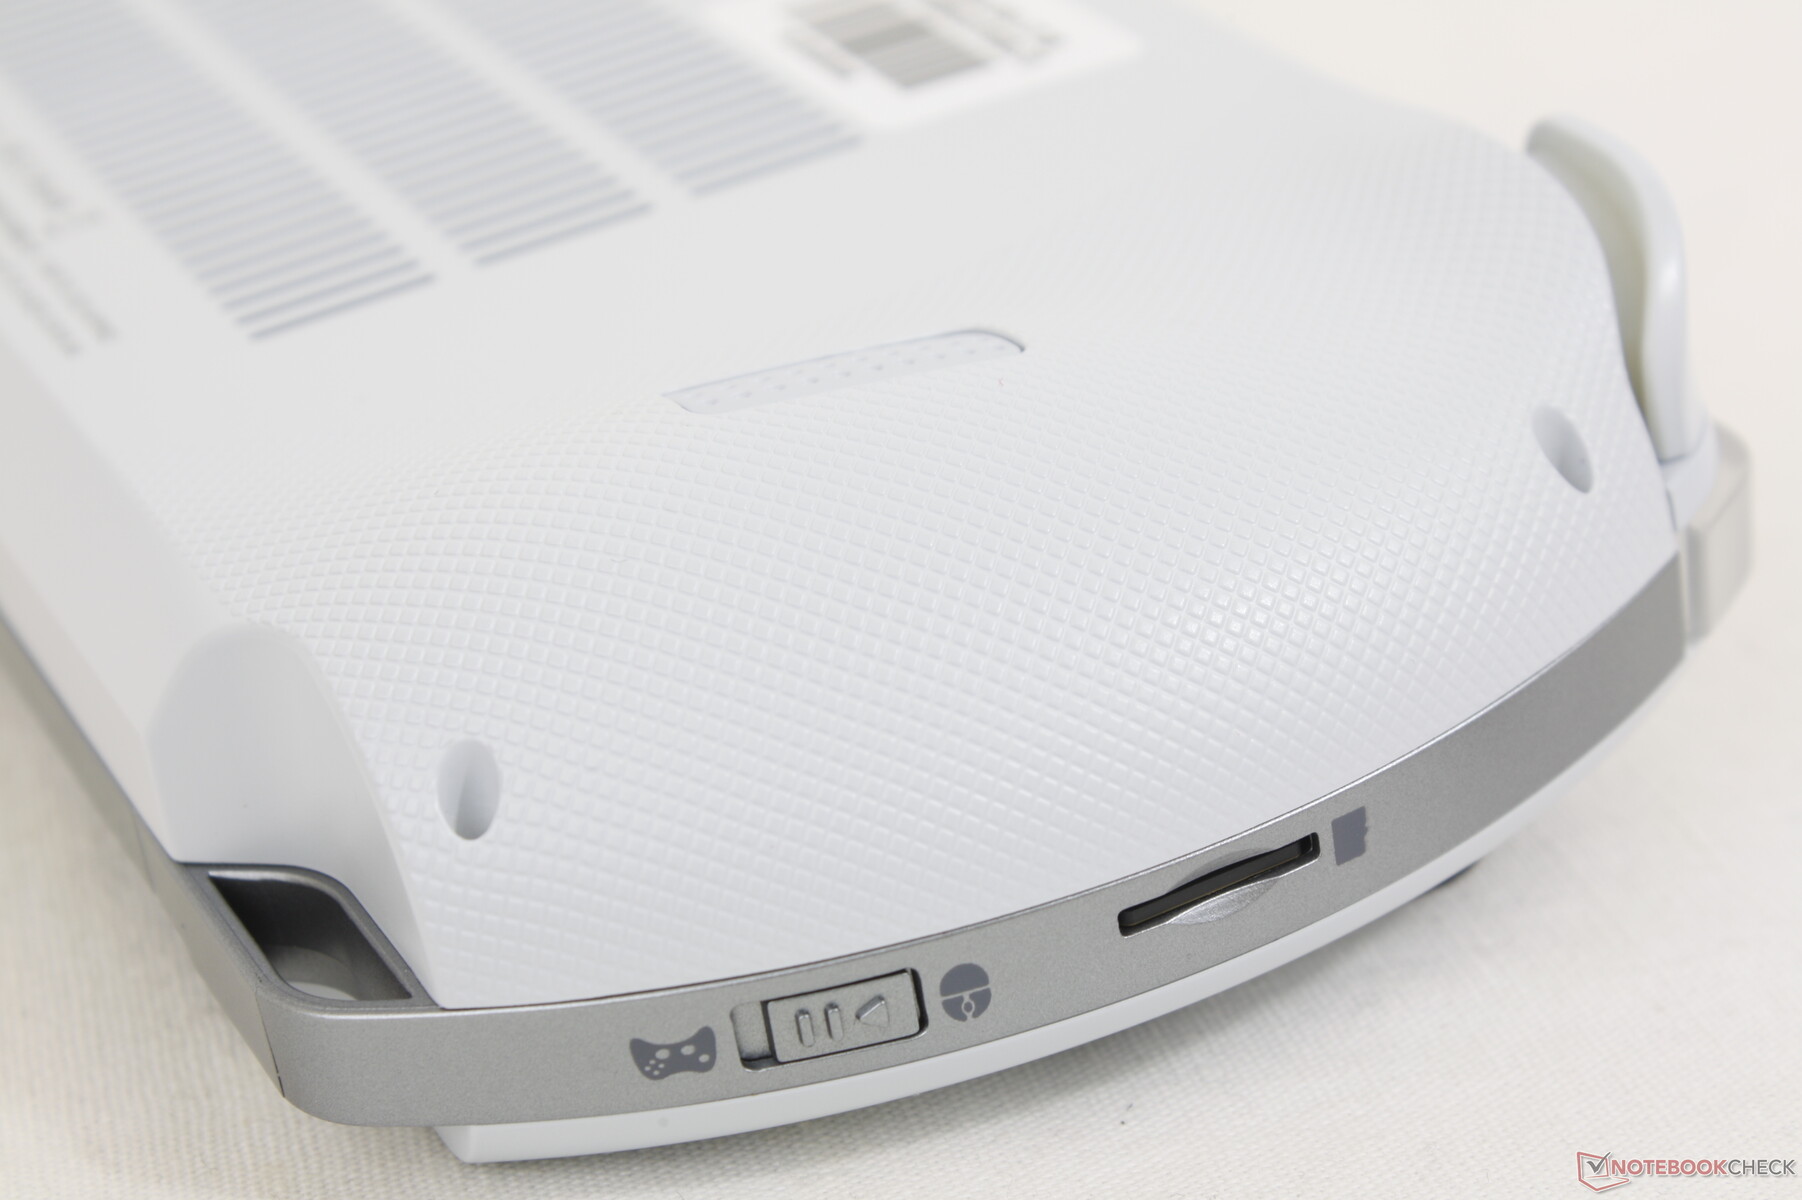
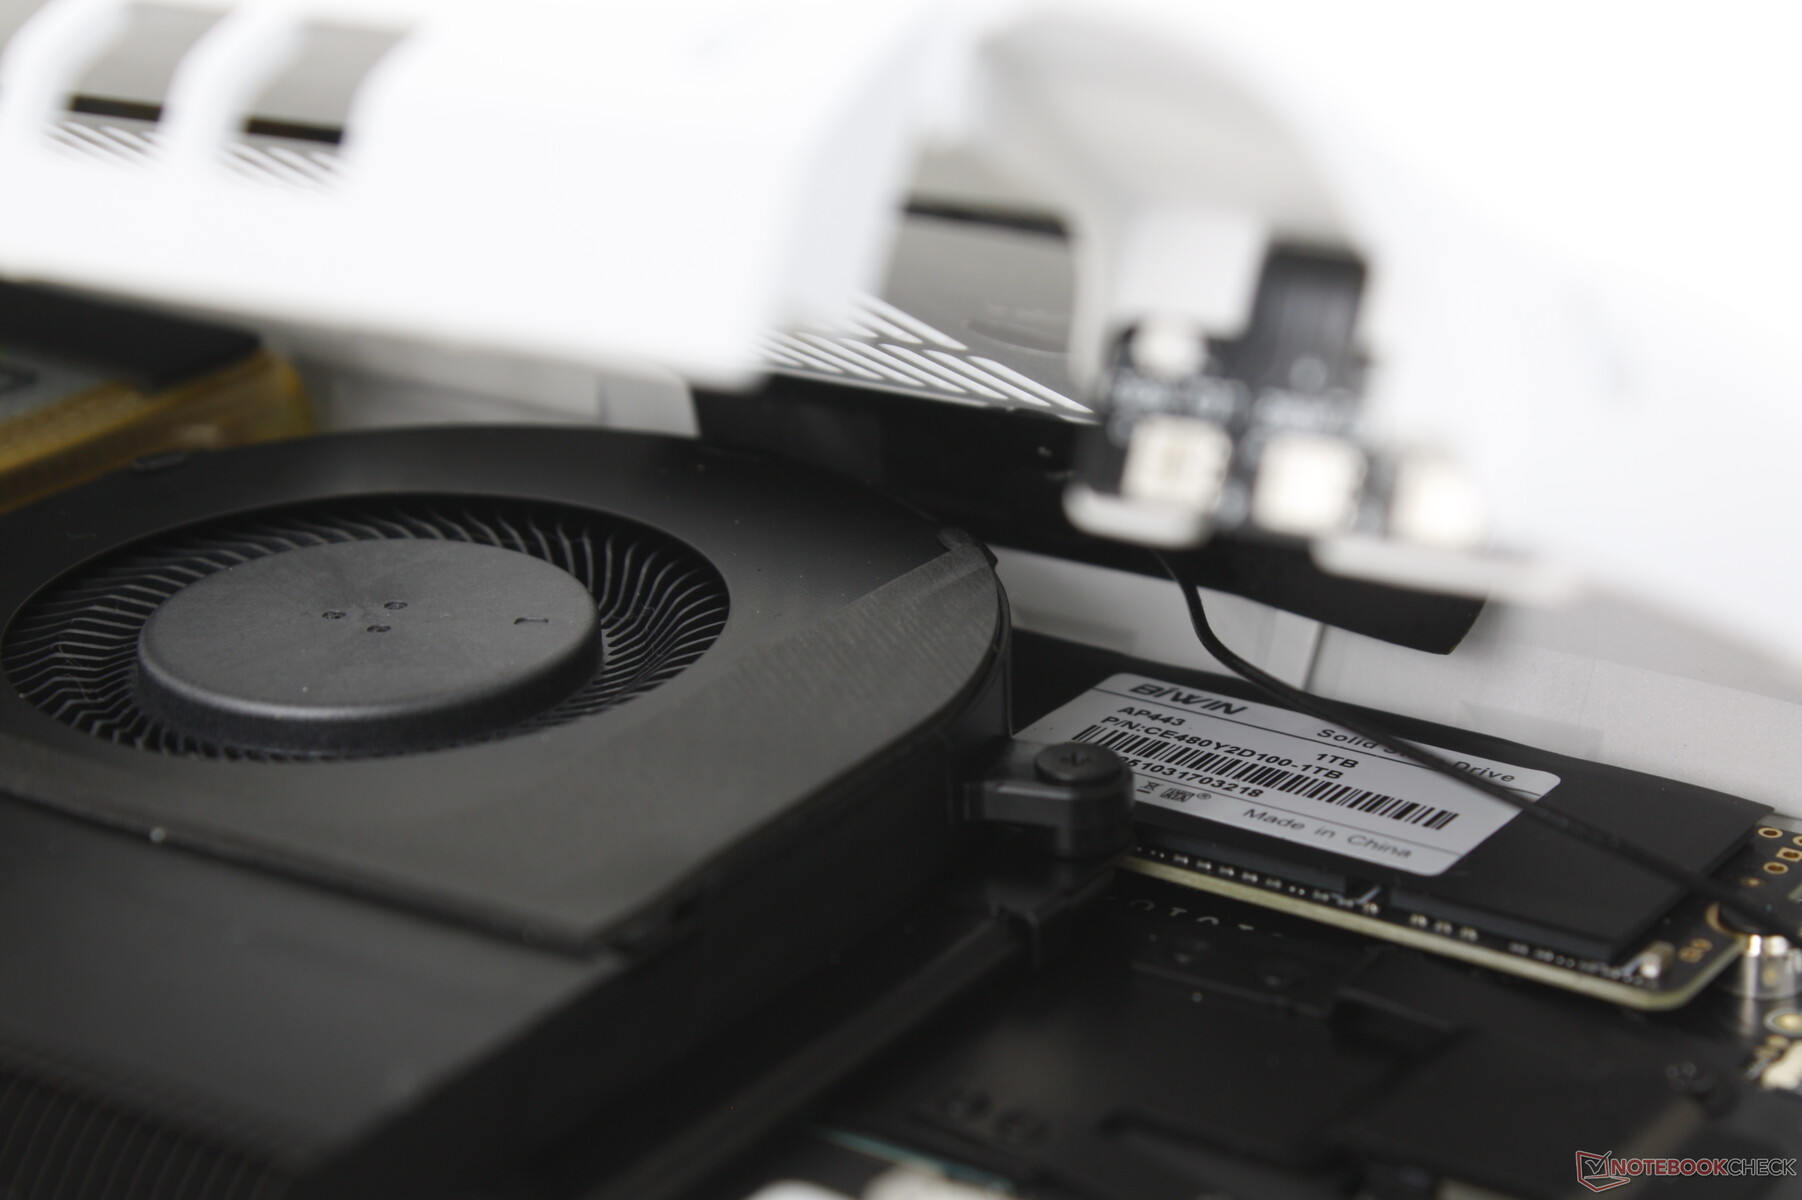
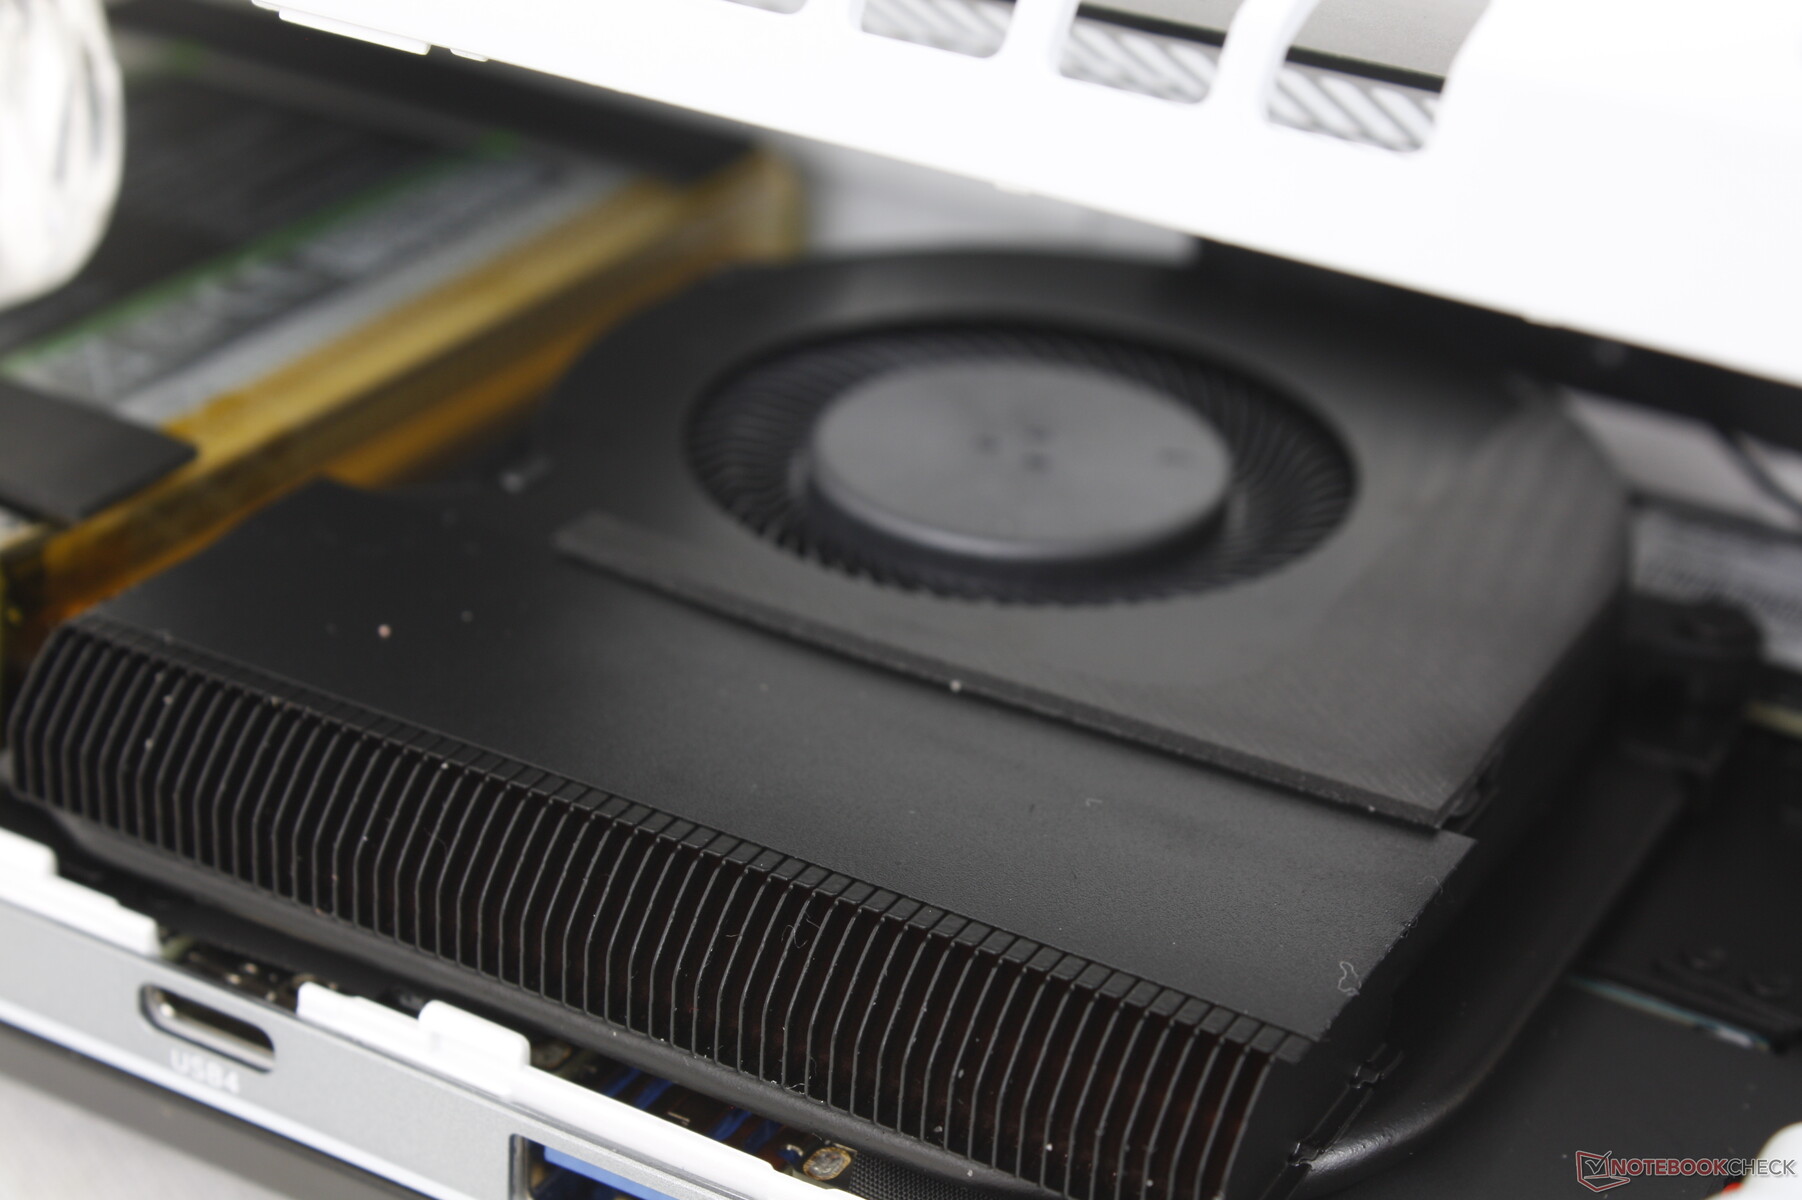
维护
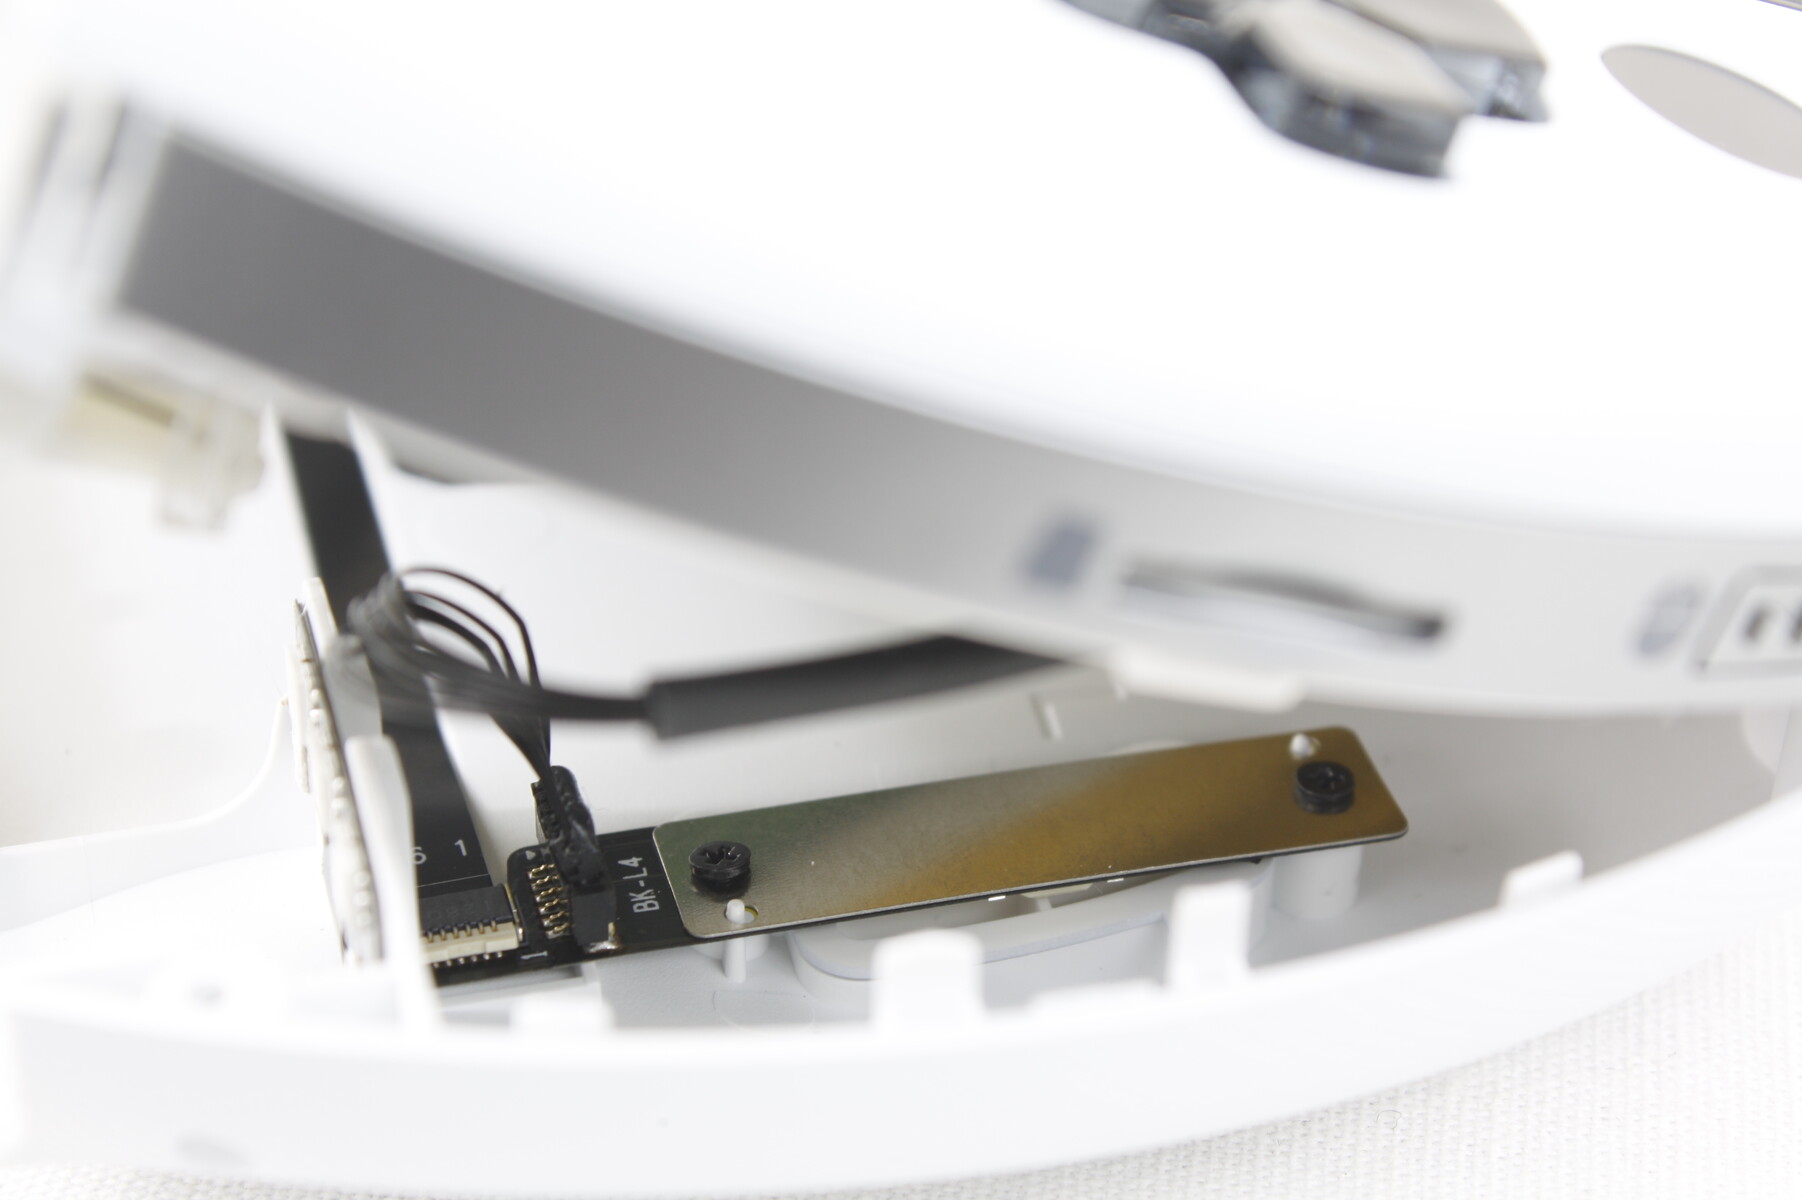
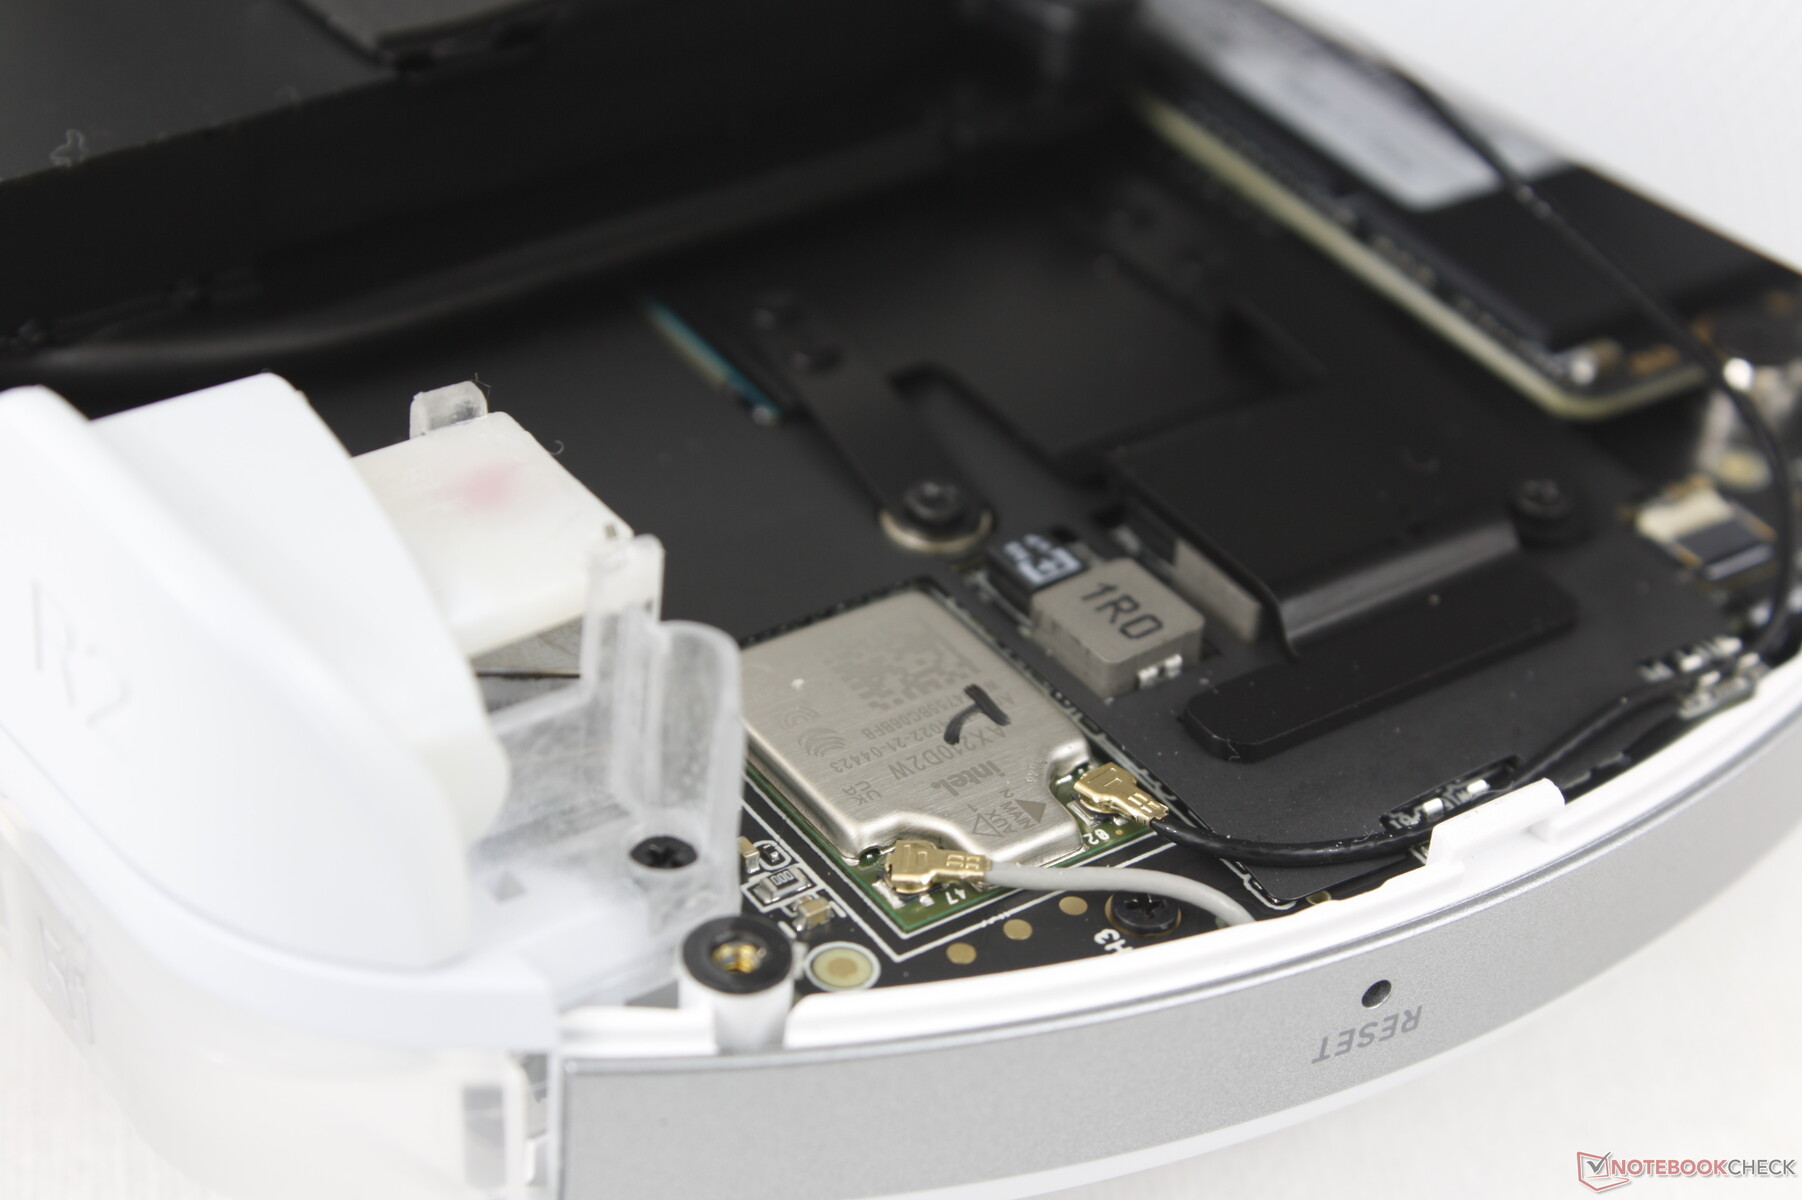
塑料背板由六个非常小的飞利浦螺钉固定。不幸的是,在我们的设备上,背板边缘的锁扣非常紧,很难在不损坏设备的情况下拆除,这是一个耻辱,因为GPD Win 3在其他方面很容易维修。我们可以看到,M.2 2280固态硬盘是可拆卸的,而WLAN和内存模块是焊接的。
请记住,由于后部的按钮,背板是通过脆弱的带状电缆连接到主板上的。因此,你还是要小心,不要撕掉后面板或冒着损坏按钮的风险。
配件和保修
除了交流电适配器和文件之外,零售盒中没有其他附件。可选的附件包括一个背装的4G LTE适配器和一个官方的USB-C基座。太糟糕了,该机型没有免费的便携箱或屏幕保护膜。
如果在美国购买,标准的一年有限制造商保修适用。
输入设备
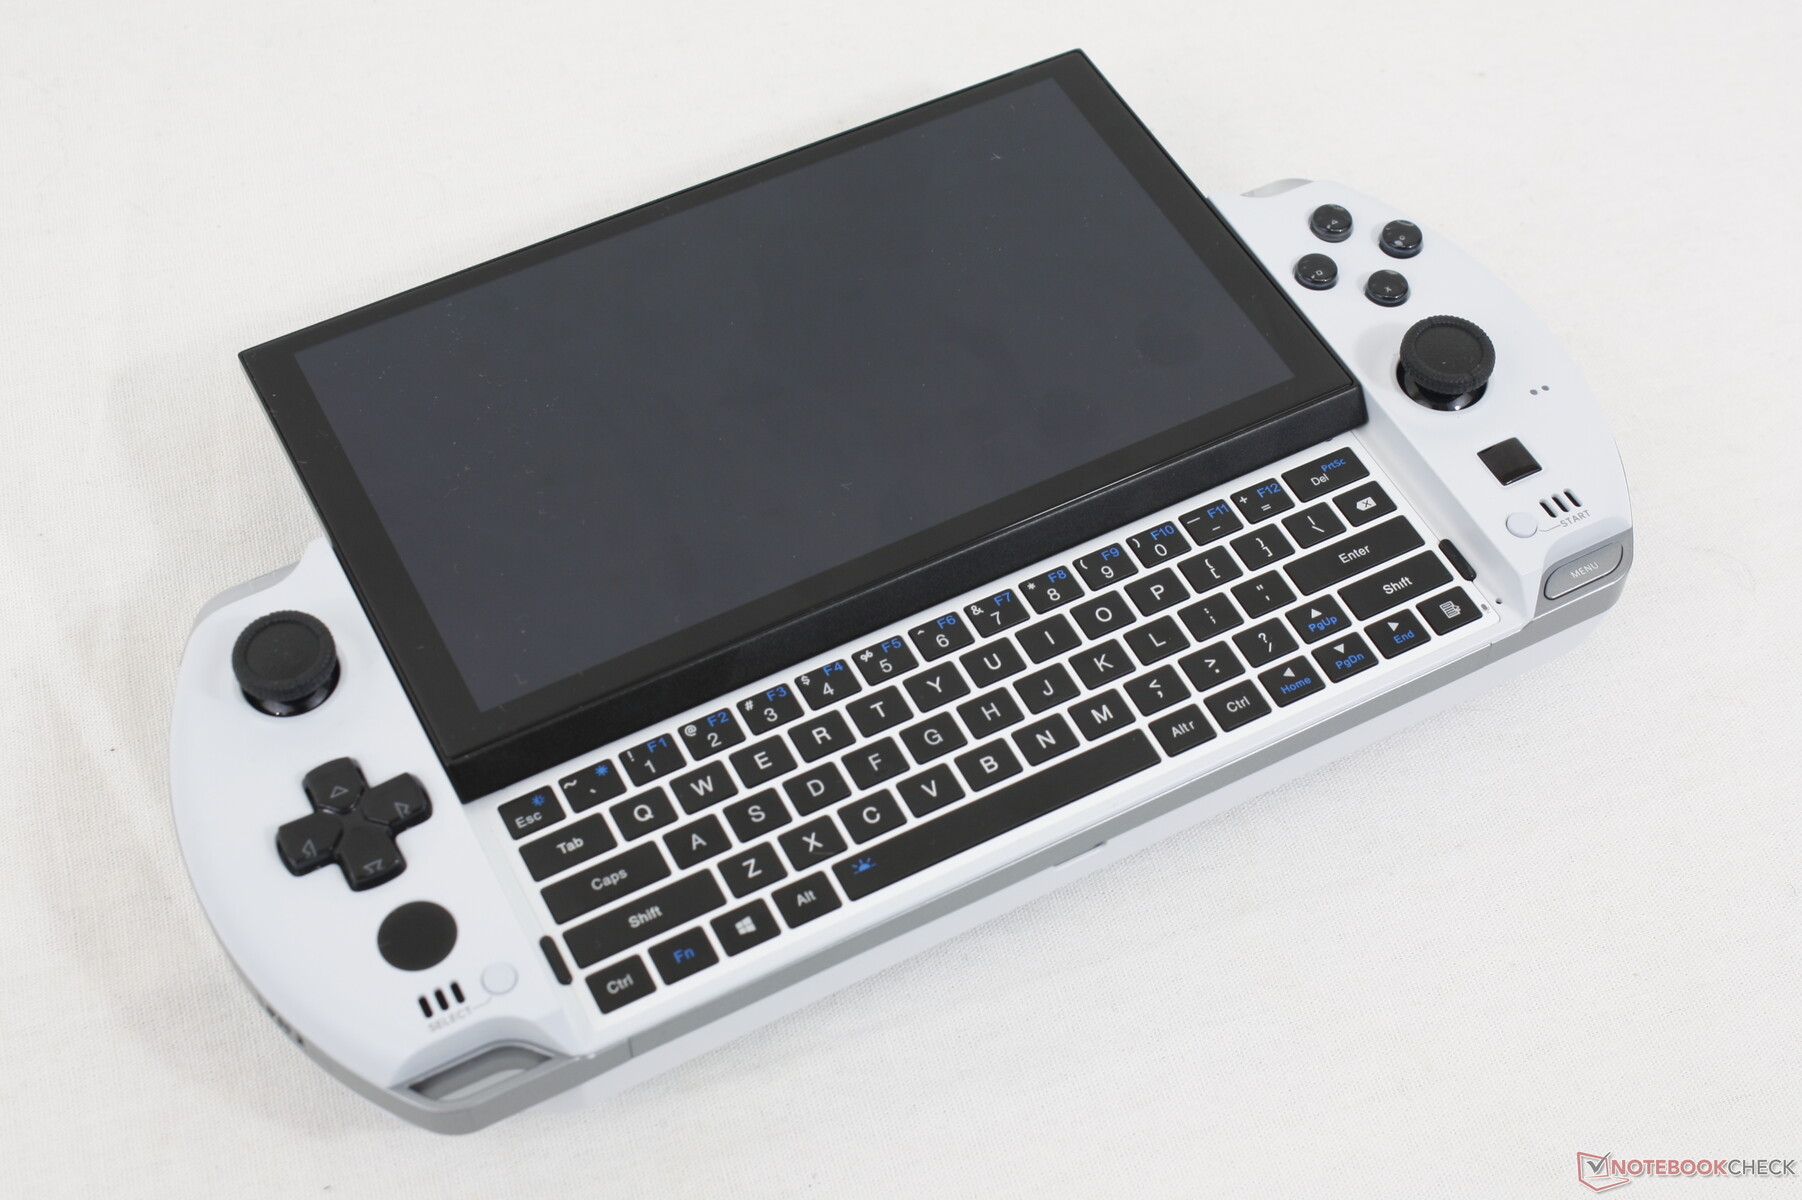
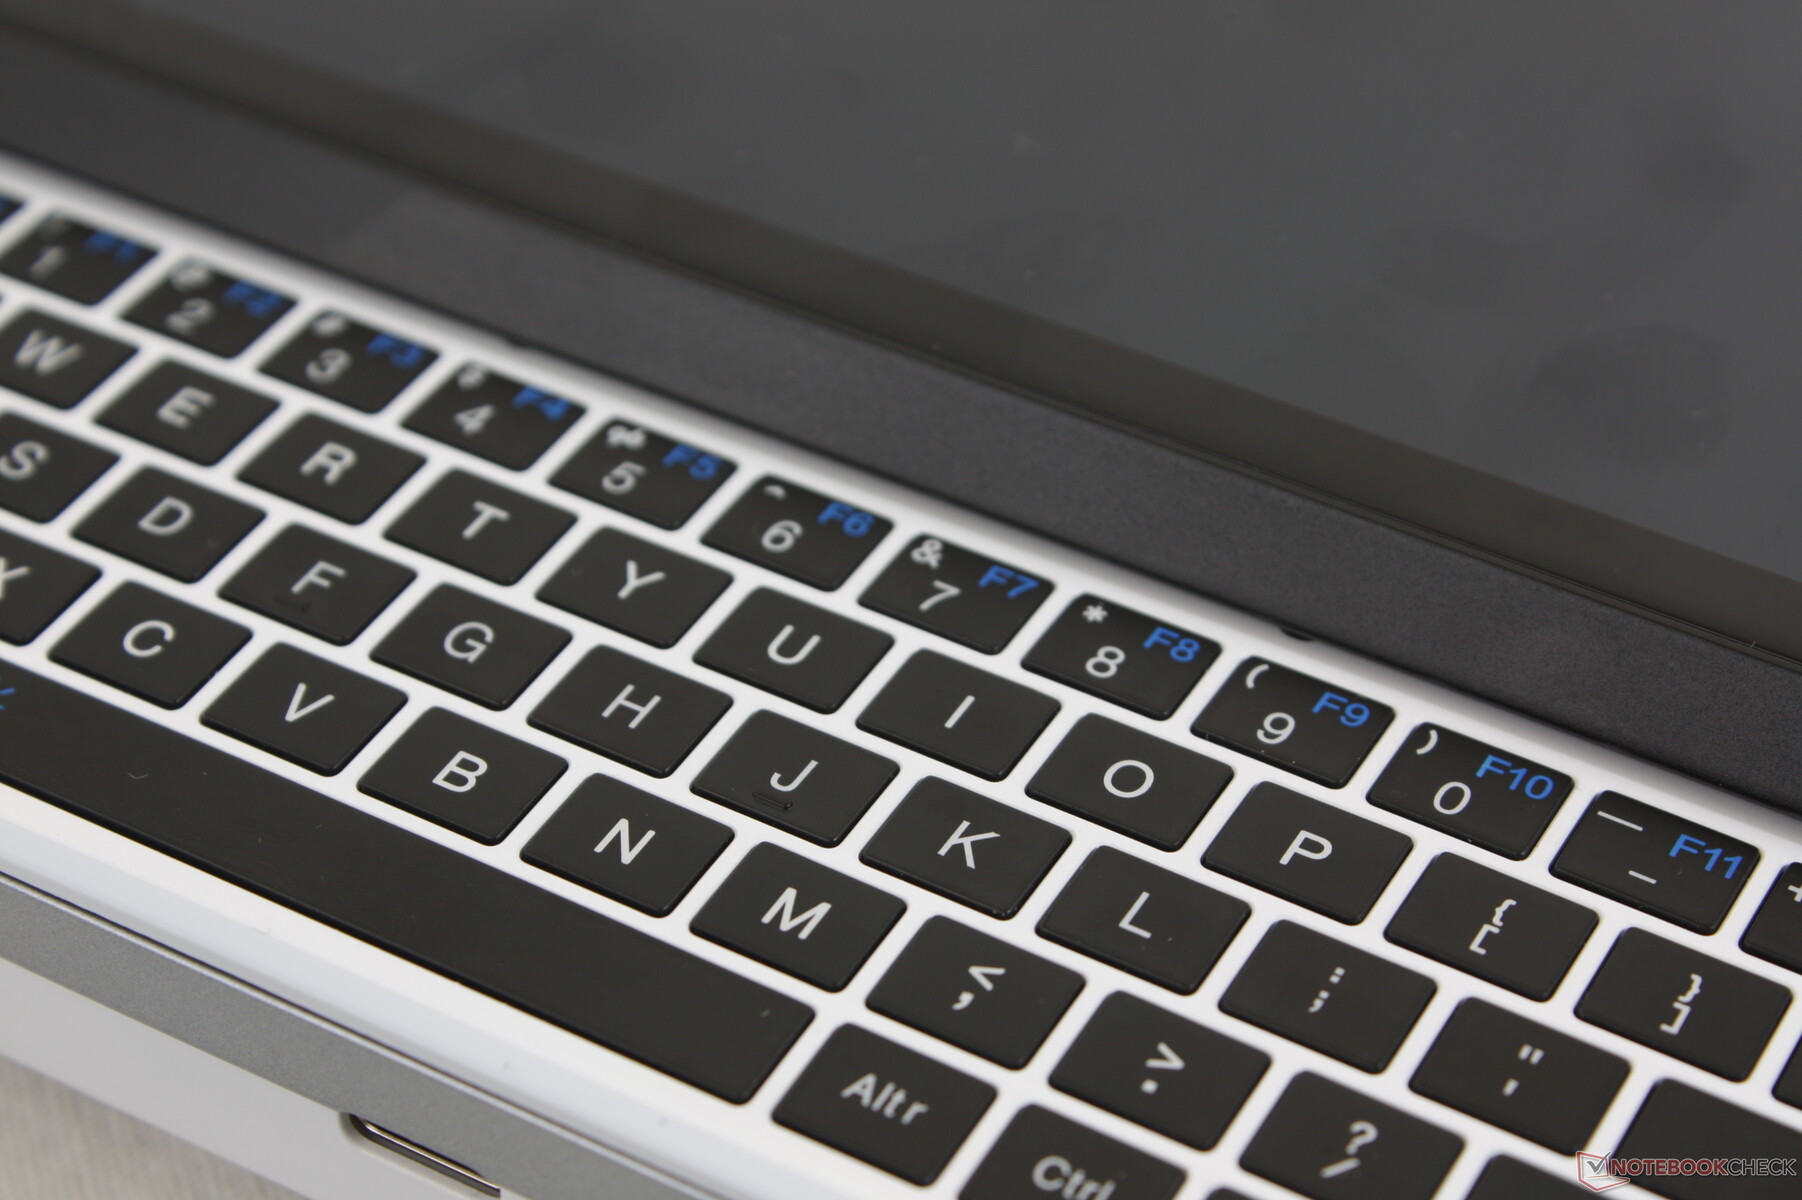
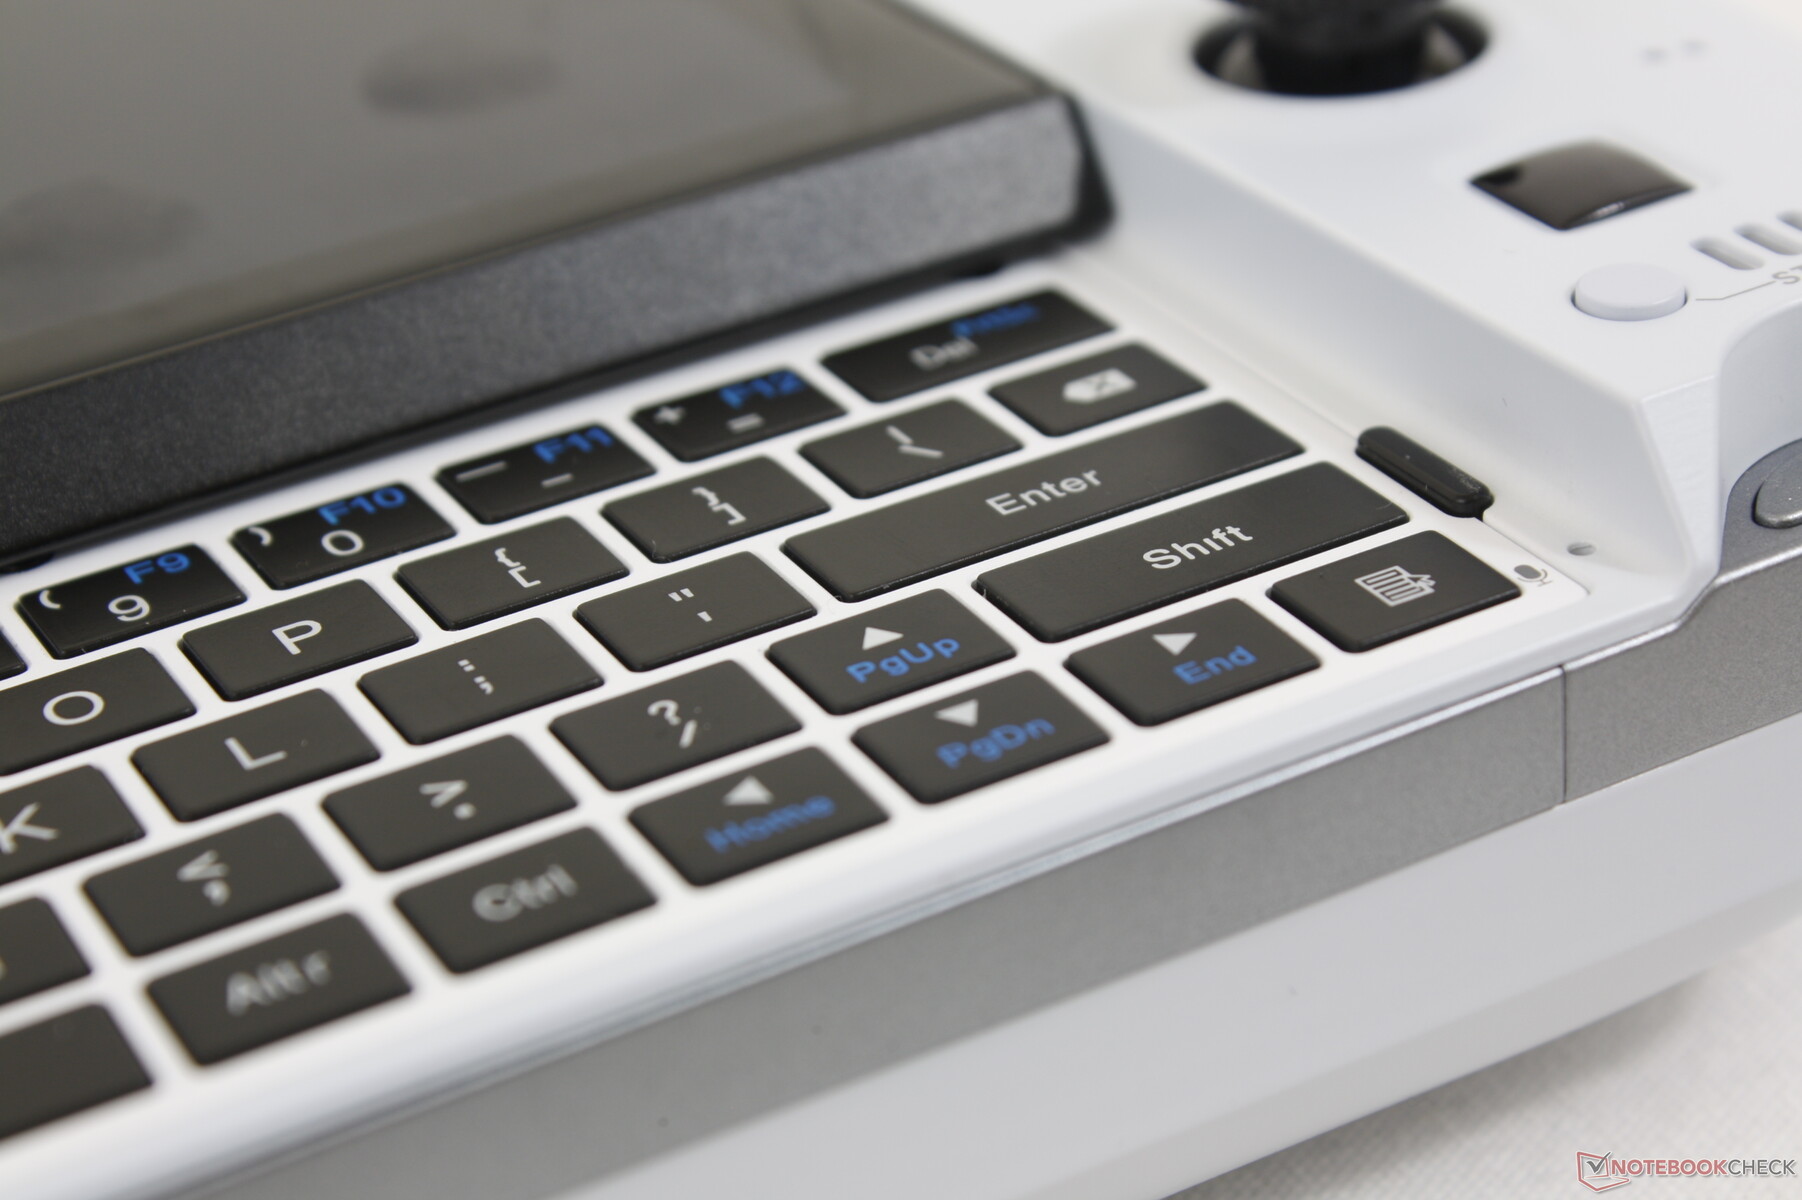
键盘 - 比Win 3更可靠
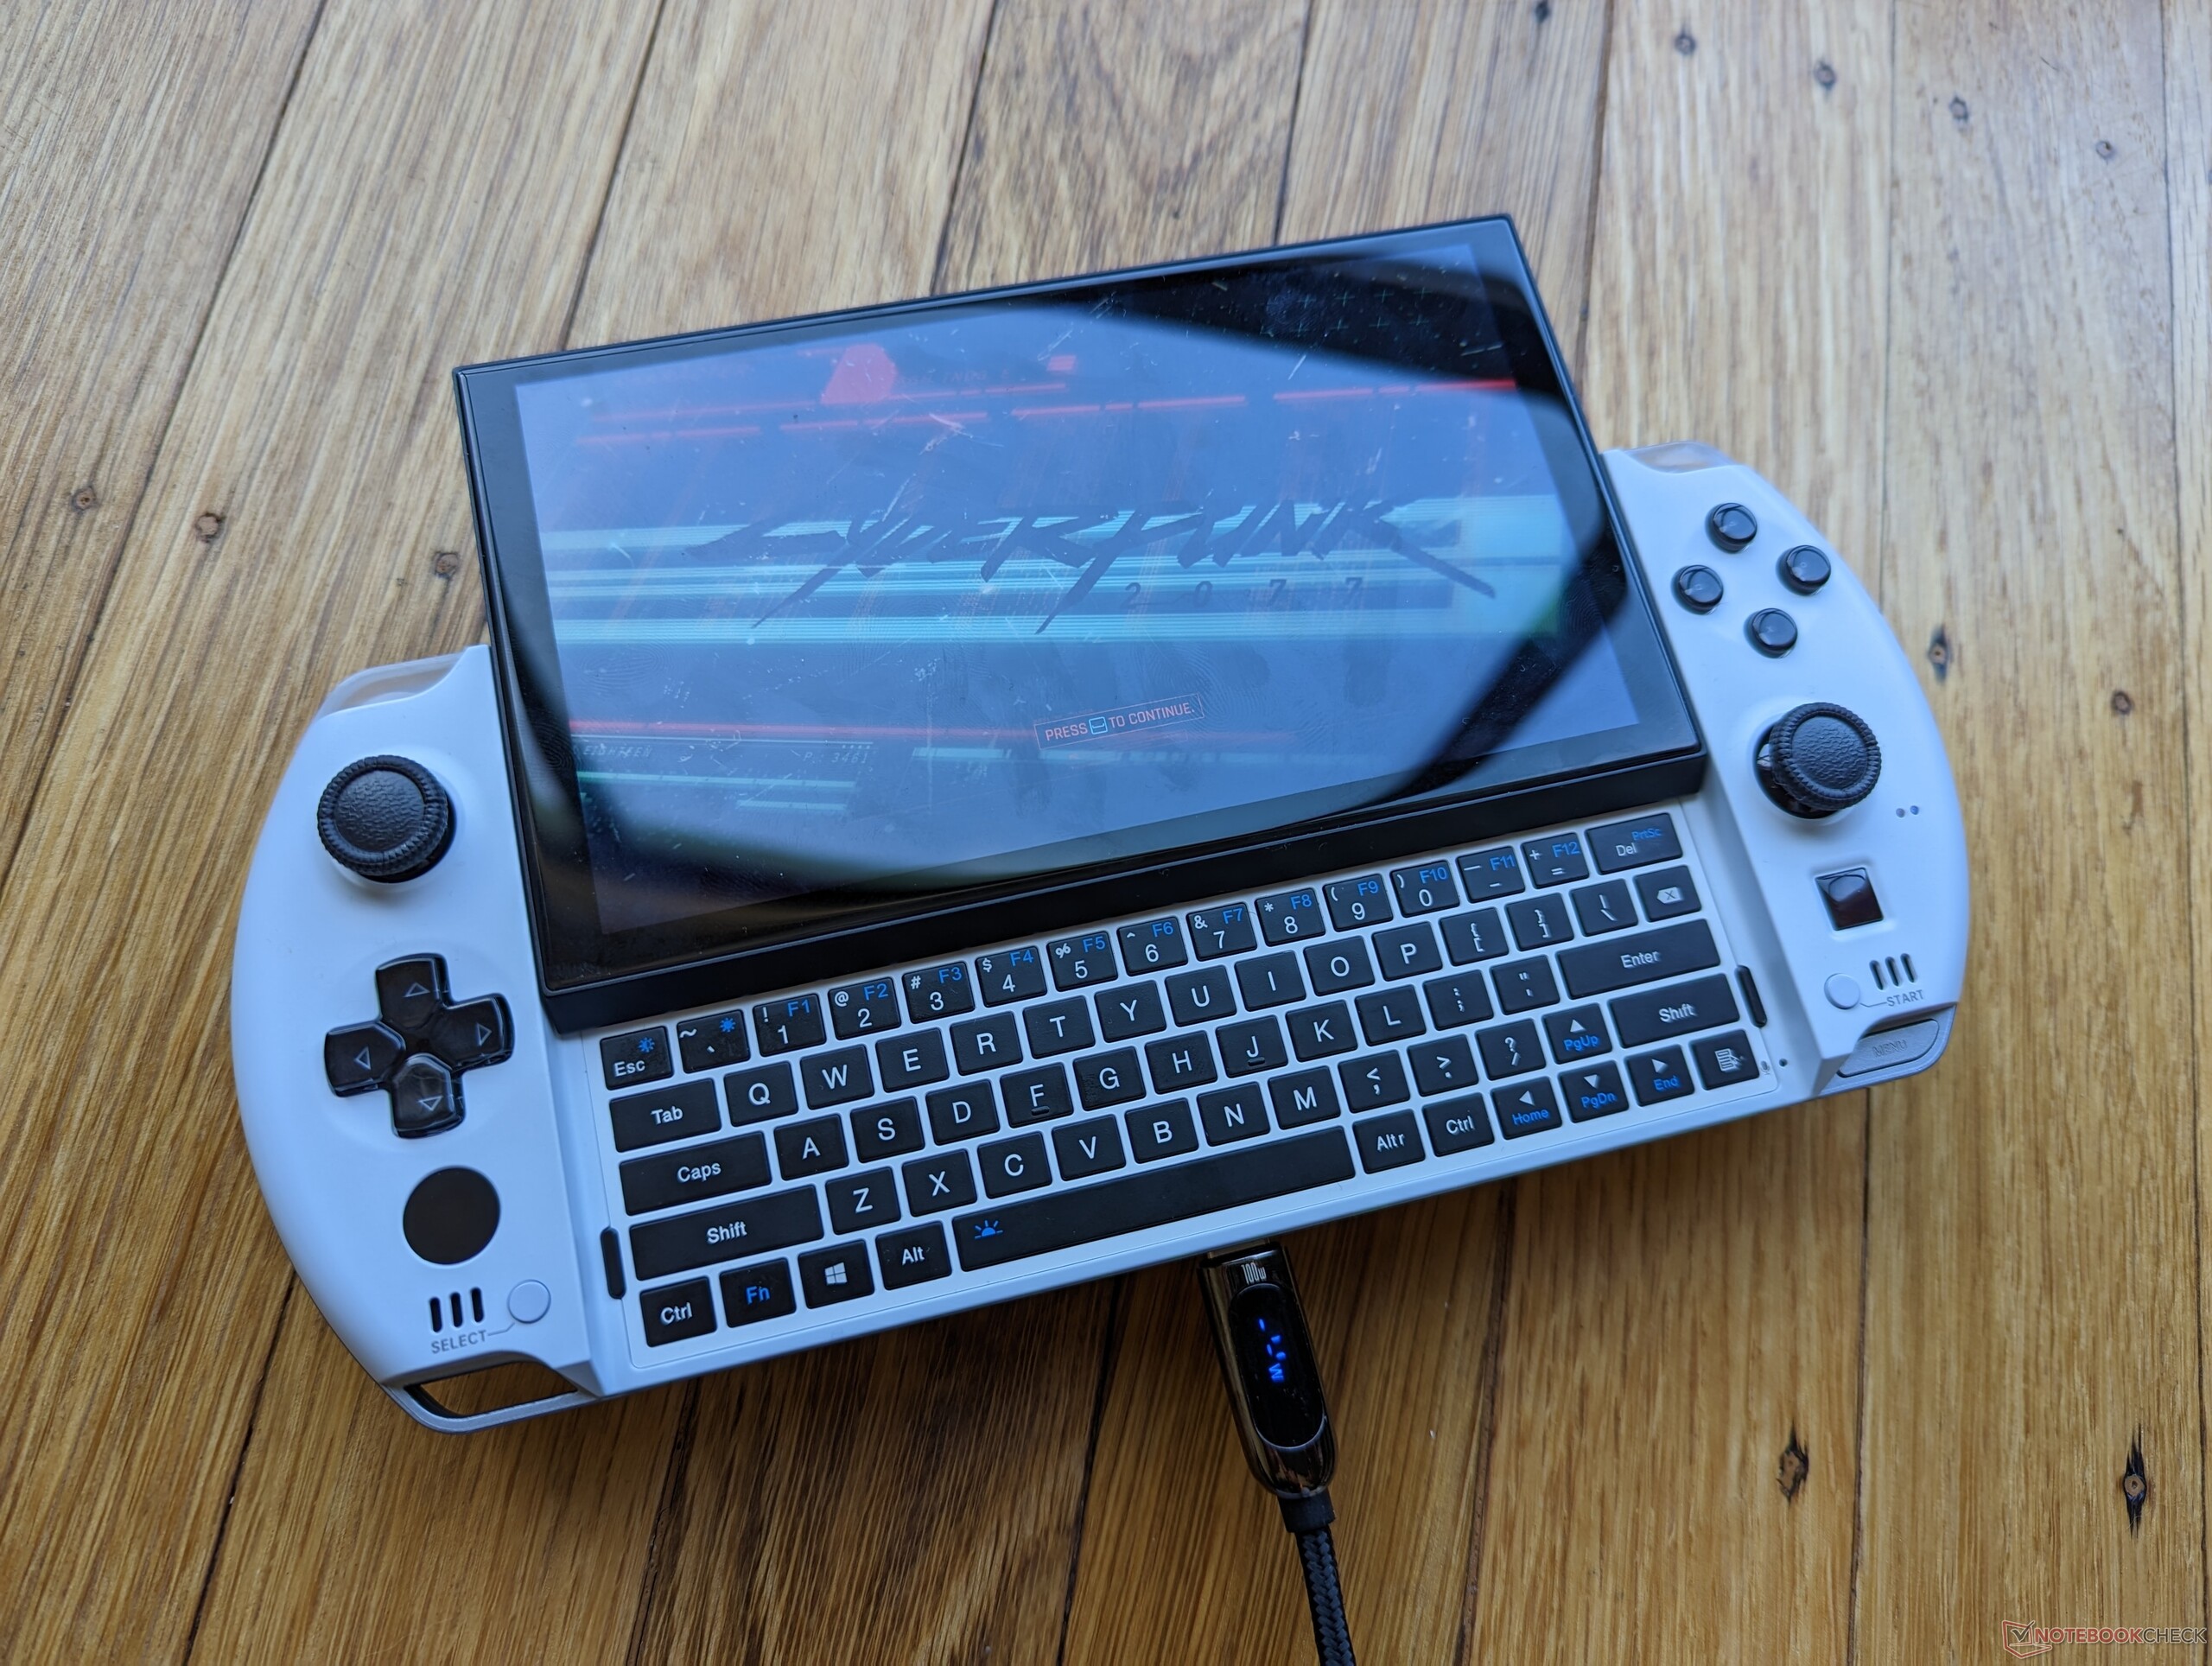
键盘已经被完全改造,从Win 3上的触摸感应键到Win 4上的触觉物理键。它们是点击式的,反馈更好,但打字速度仍然比典型的触摸屏键盘或智能手机慢得多。它们对于偶尔的输入来说已经足够好了。
请注意,我们在Win 3上遇到的错误在Win 4上已经被修复;上下滑动屏幕不再按键盘上的任何按钮。
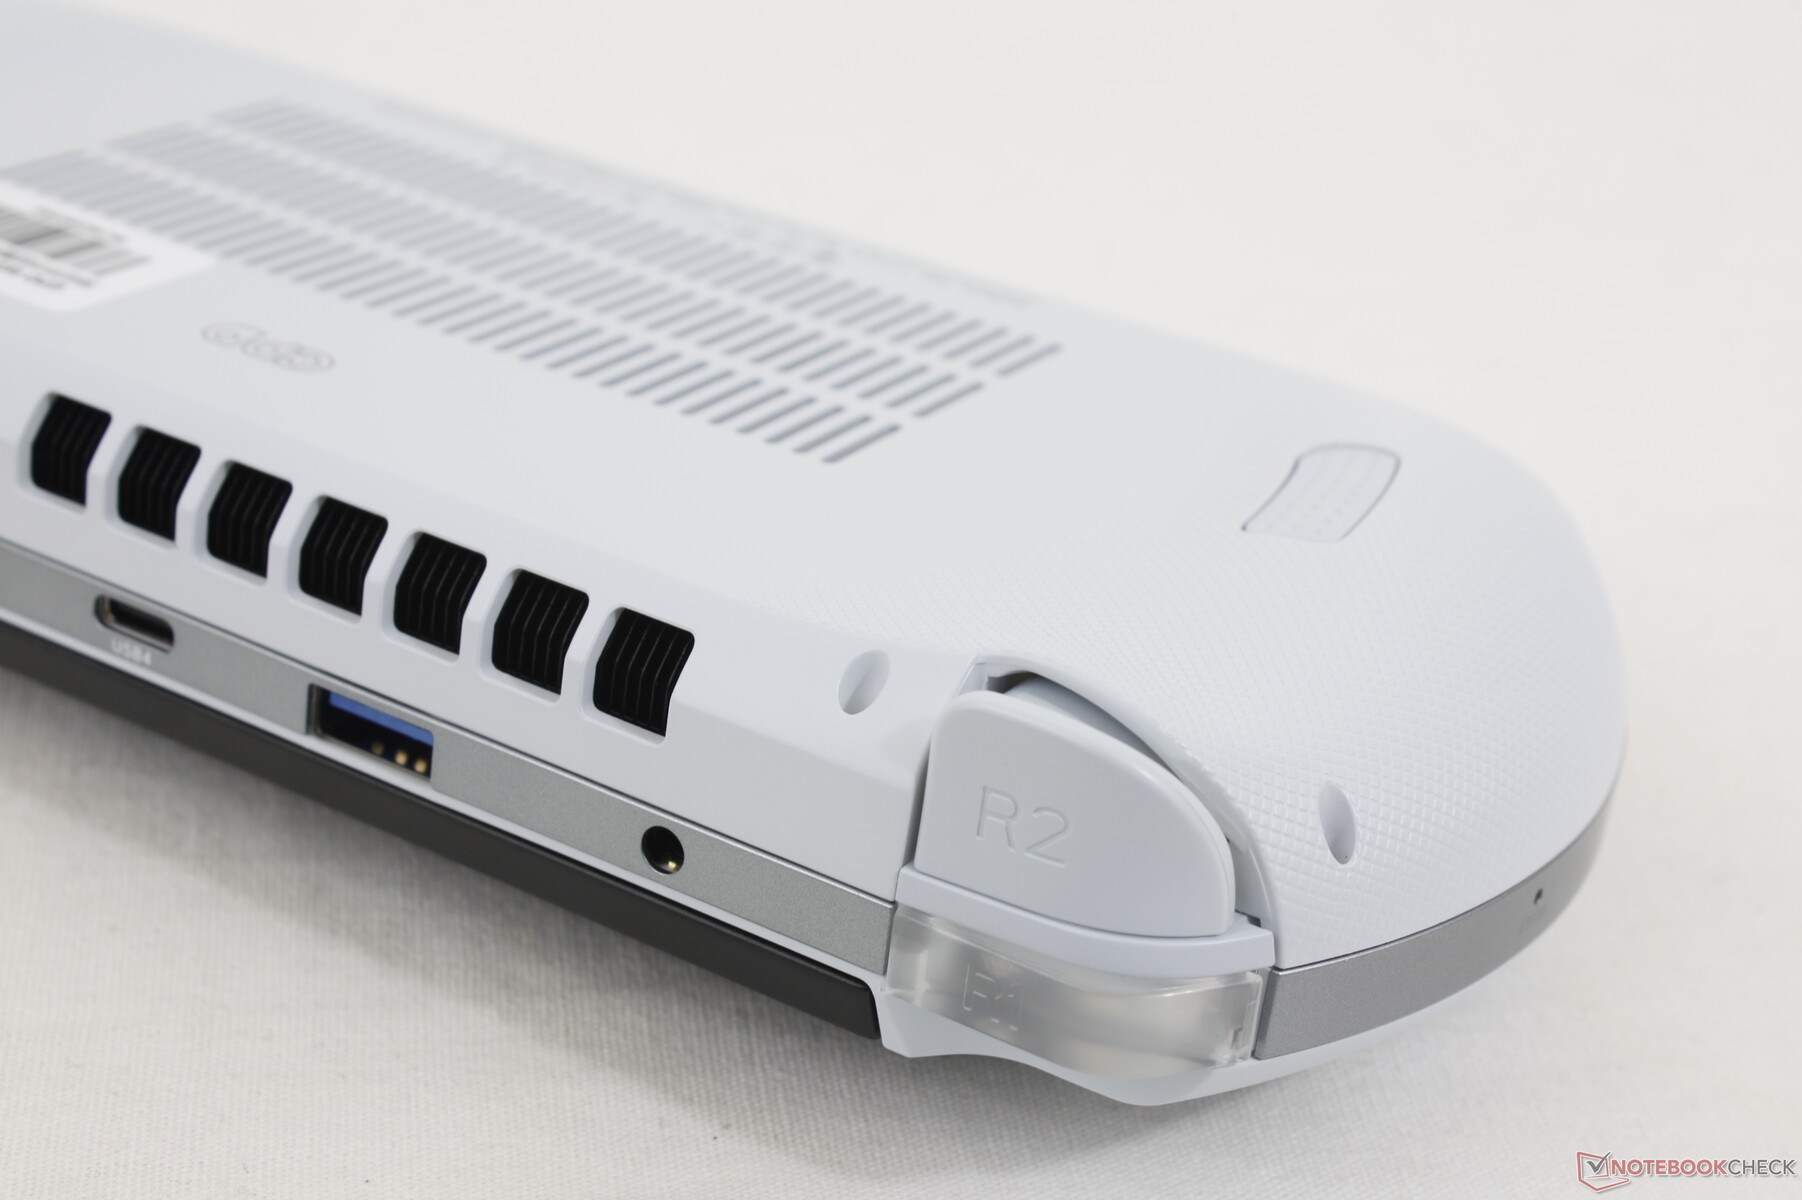
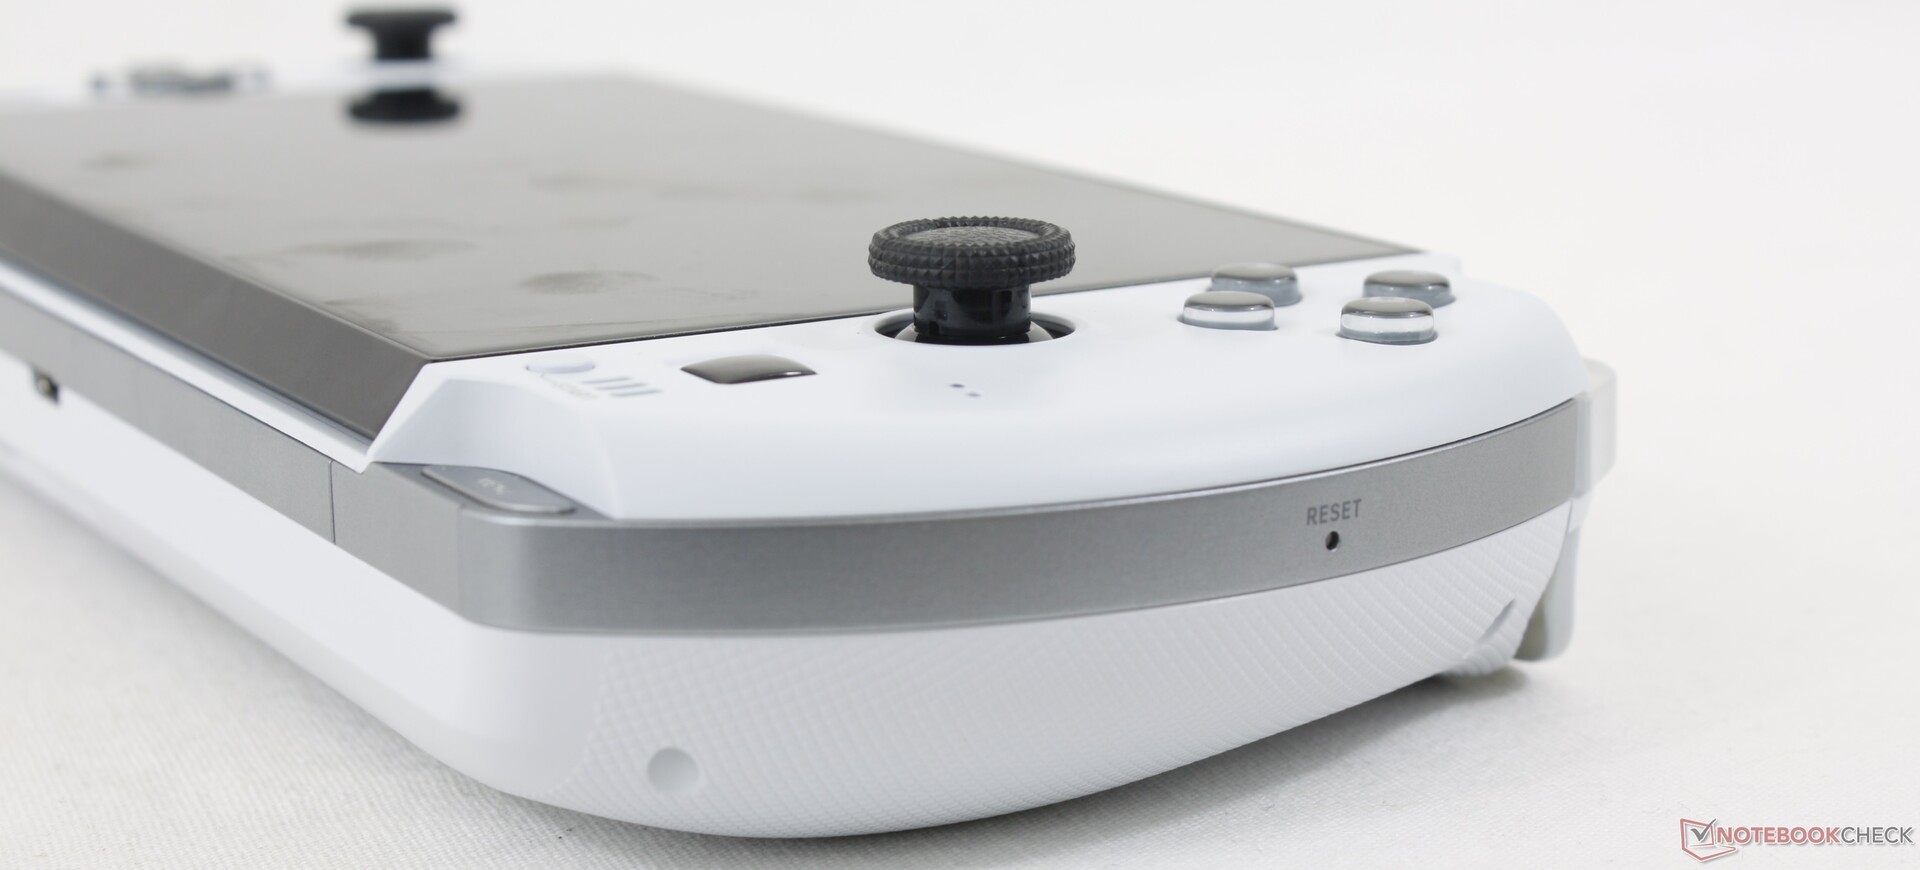
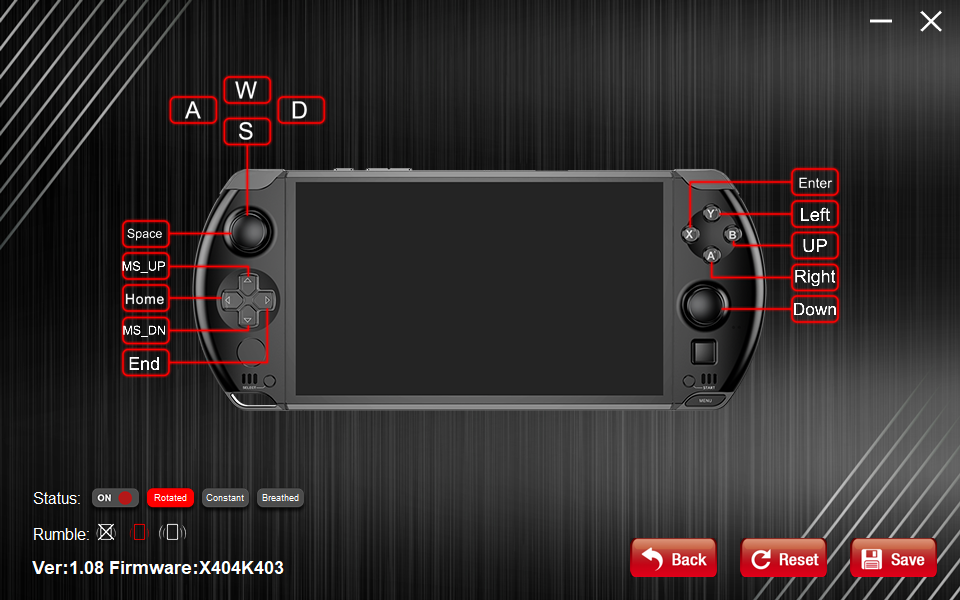
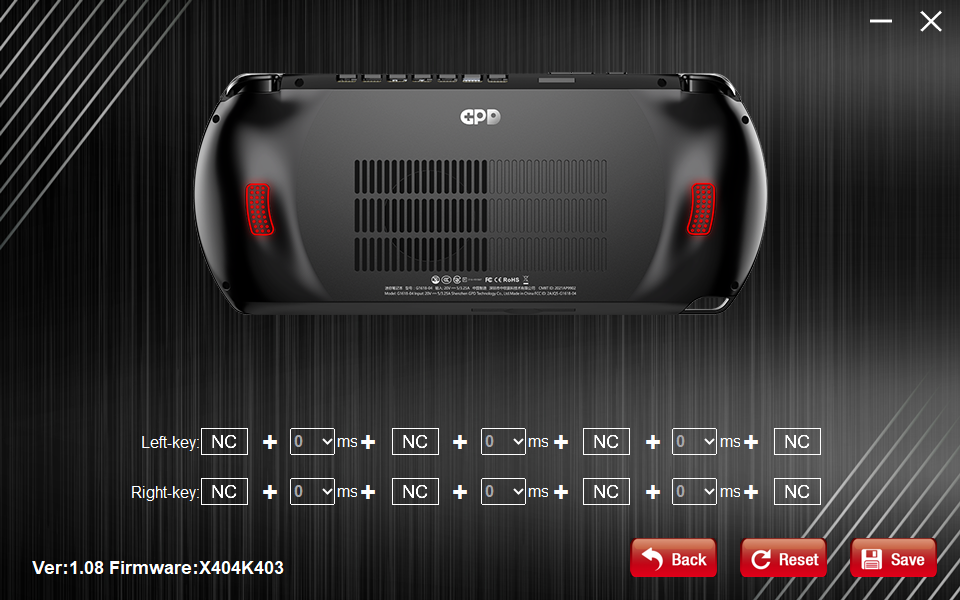
游戏手柄--就像在开关上玩一样
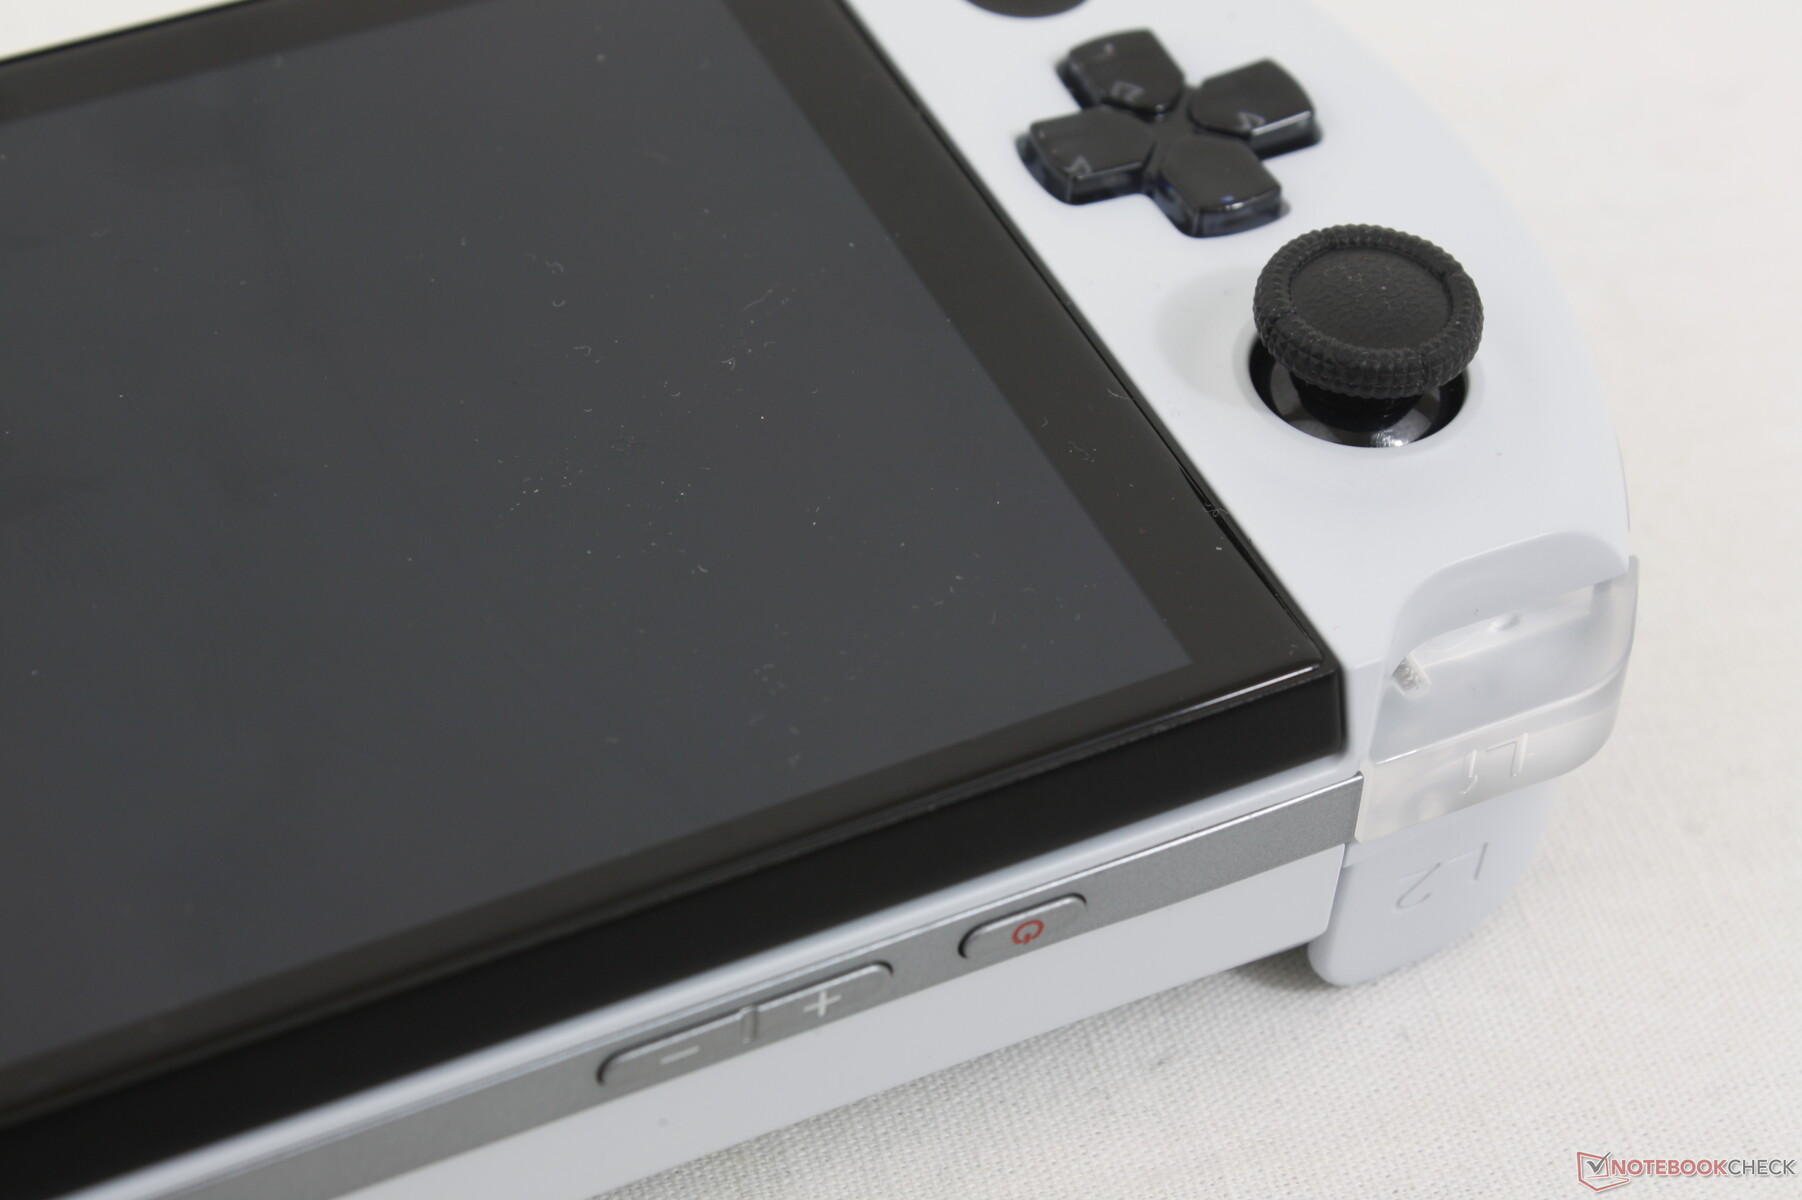
Win4上的操纵杆和按钮与任天堂Switch上的操纵杆和按钮尺寸完全相同,这并非巧合。毕竟,为什么要改变已经在最受欢迎的掌上游戏机上运行的东西?这里的主要优势是,如果你在Switch上玩得很舒服,那么Win 4游戏板将感觉非常熟悉。相反,我们主要担心的是,游戏手柄的按钮是不可拆卸的,所以随着时间的推移,任何磨损都很难维修,而控制台控制器则可以廉价更换。
后方的两个肩部按钮(L2、R2)比Switch上的相同按钮有更多行程。这是一个微小但明显的改进,使控制器的体验更接近普通XBox或PS游戏板。
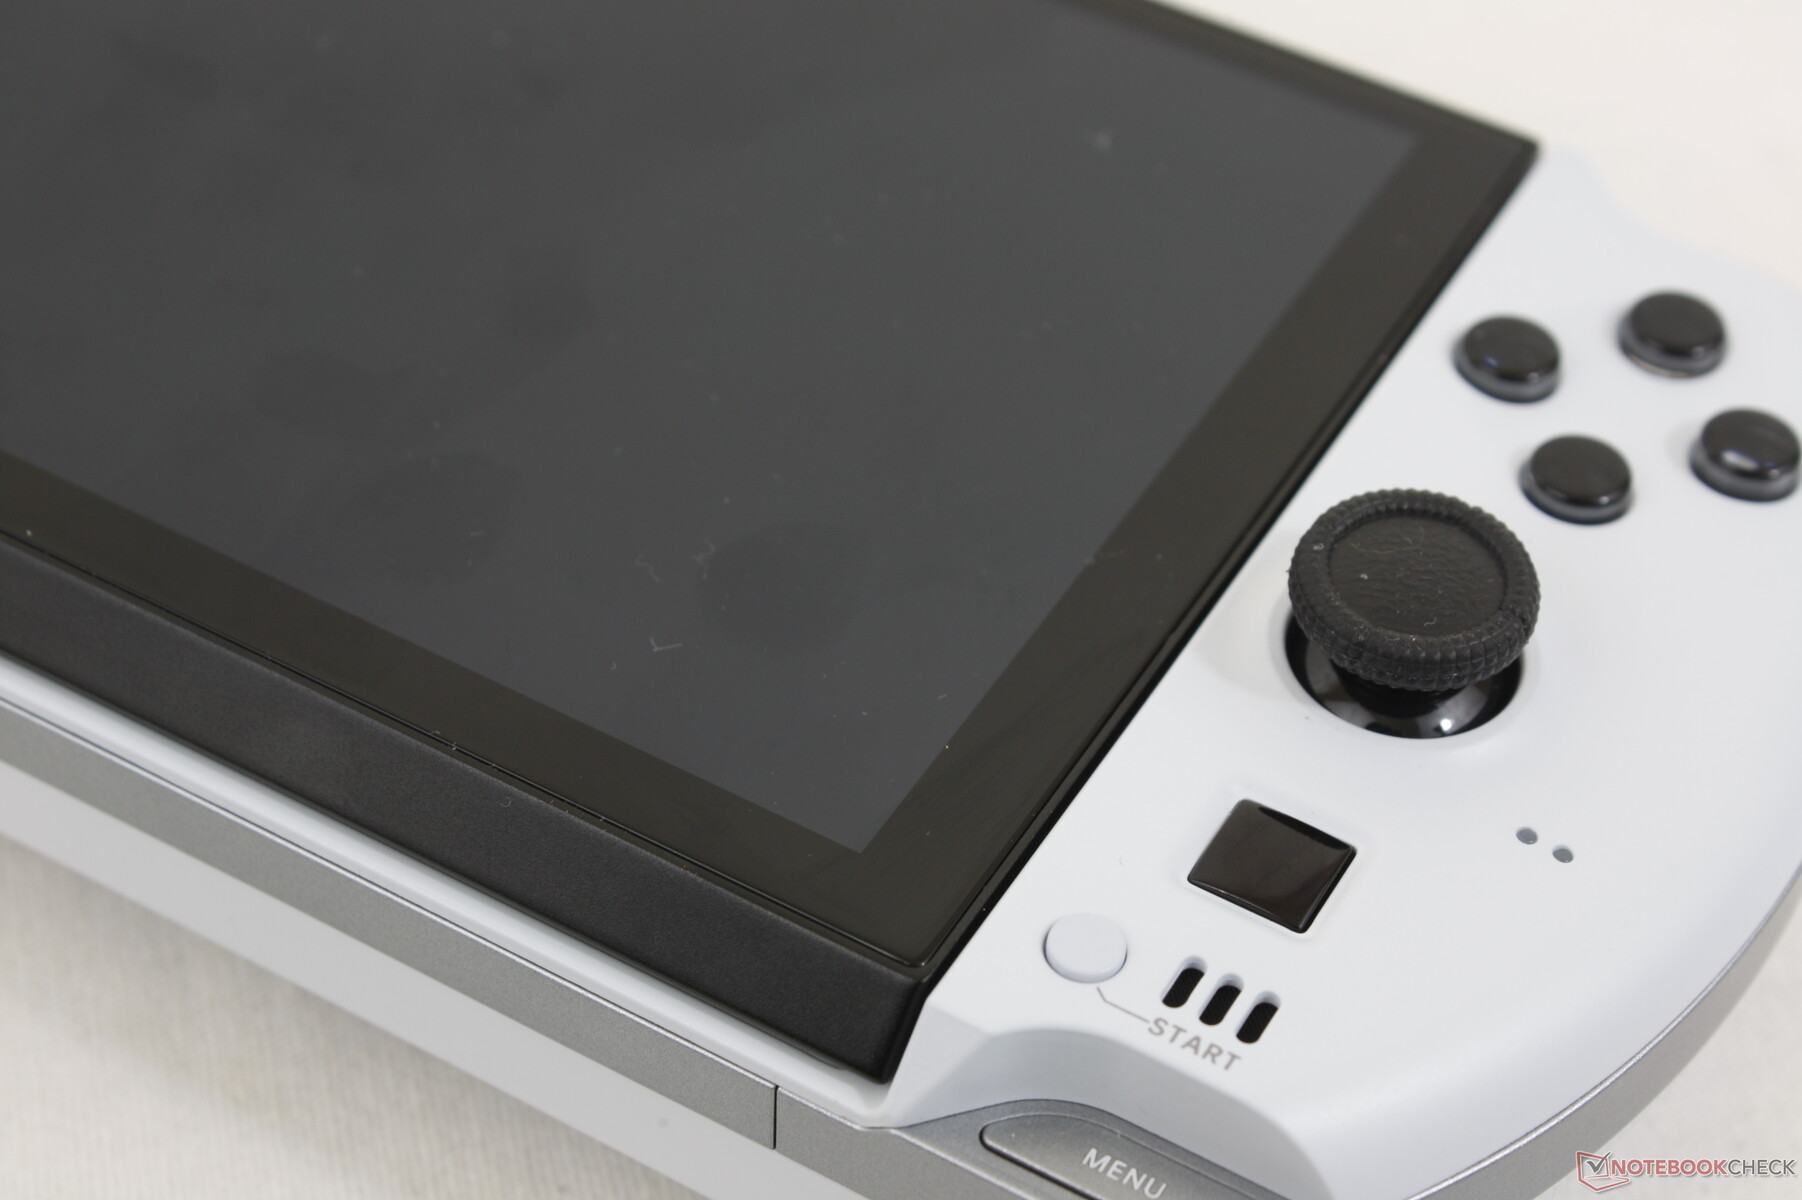
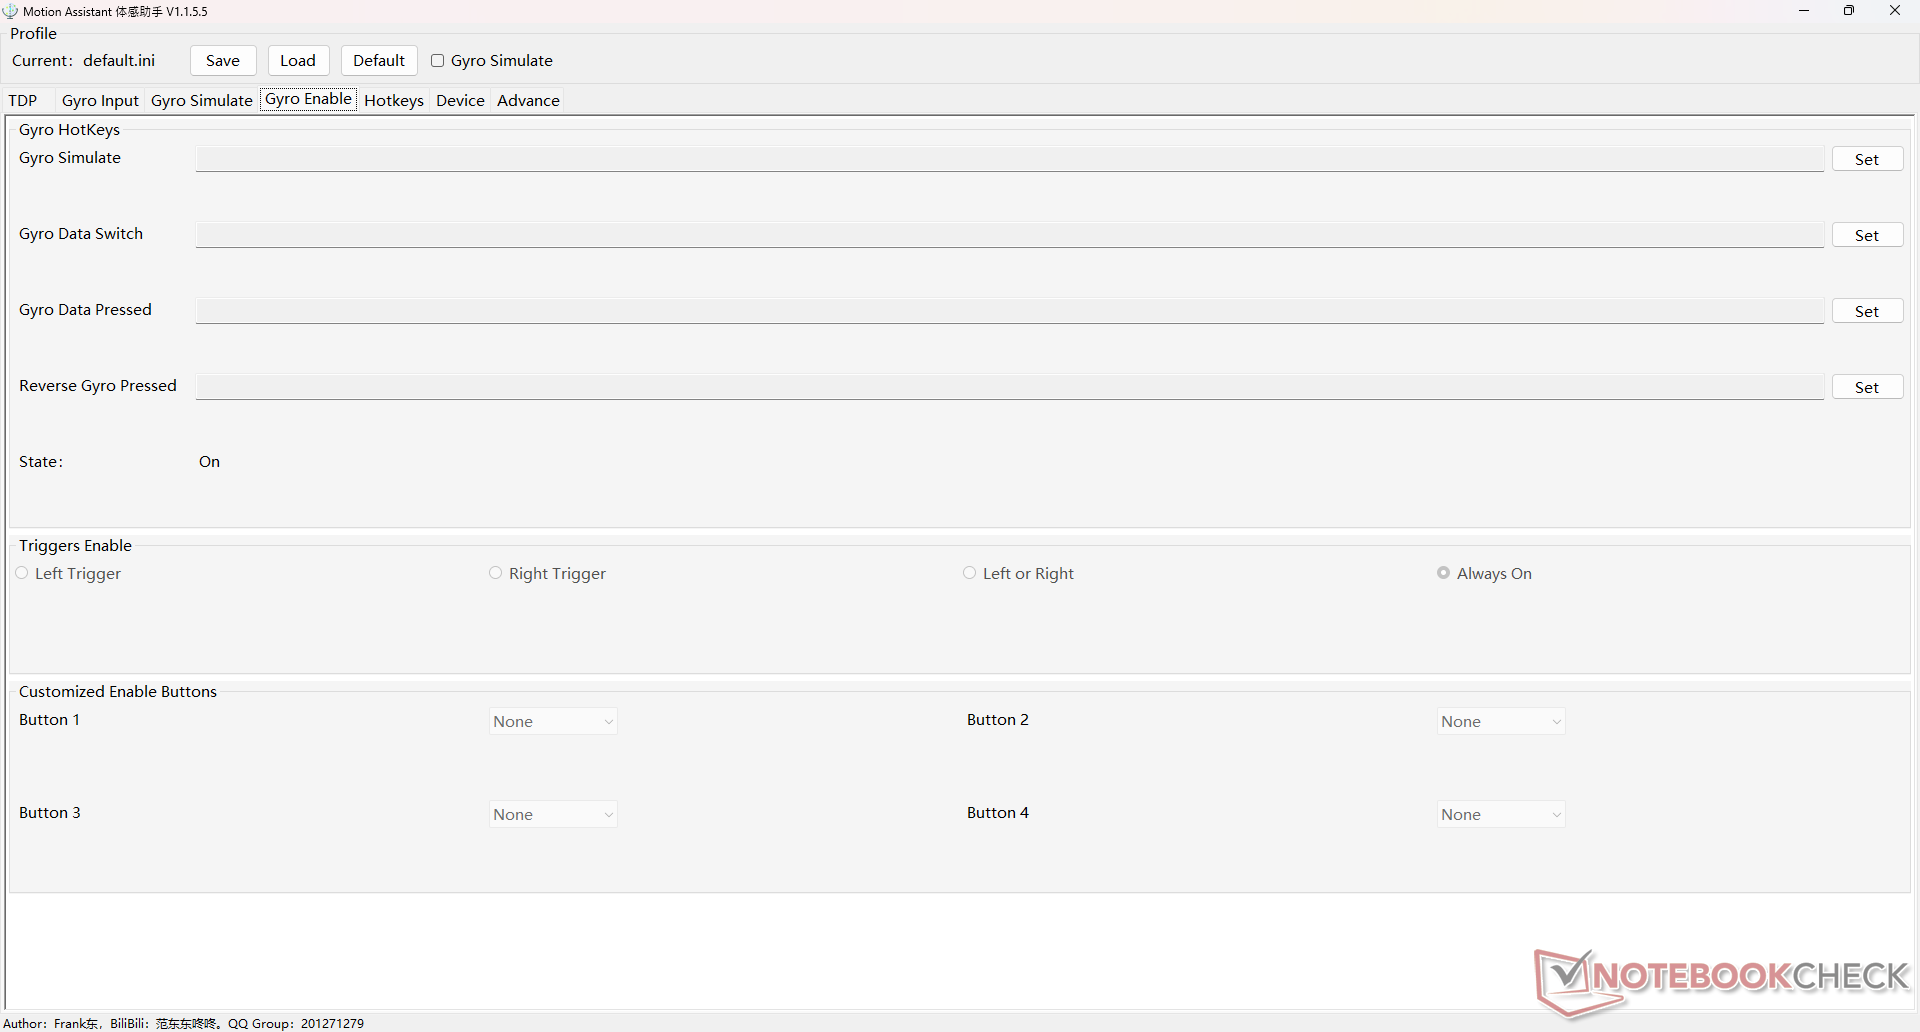
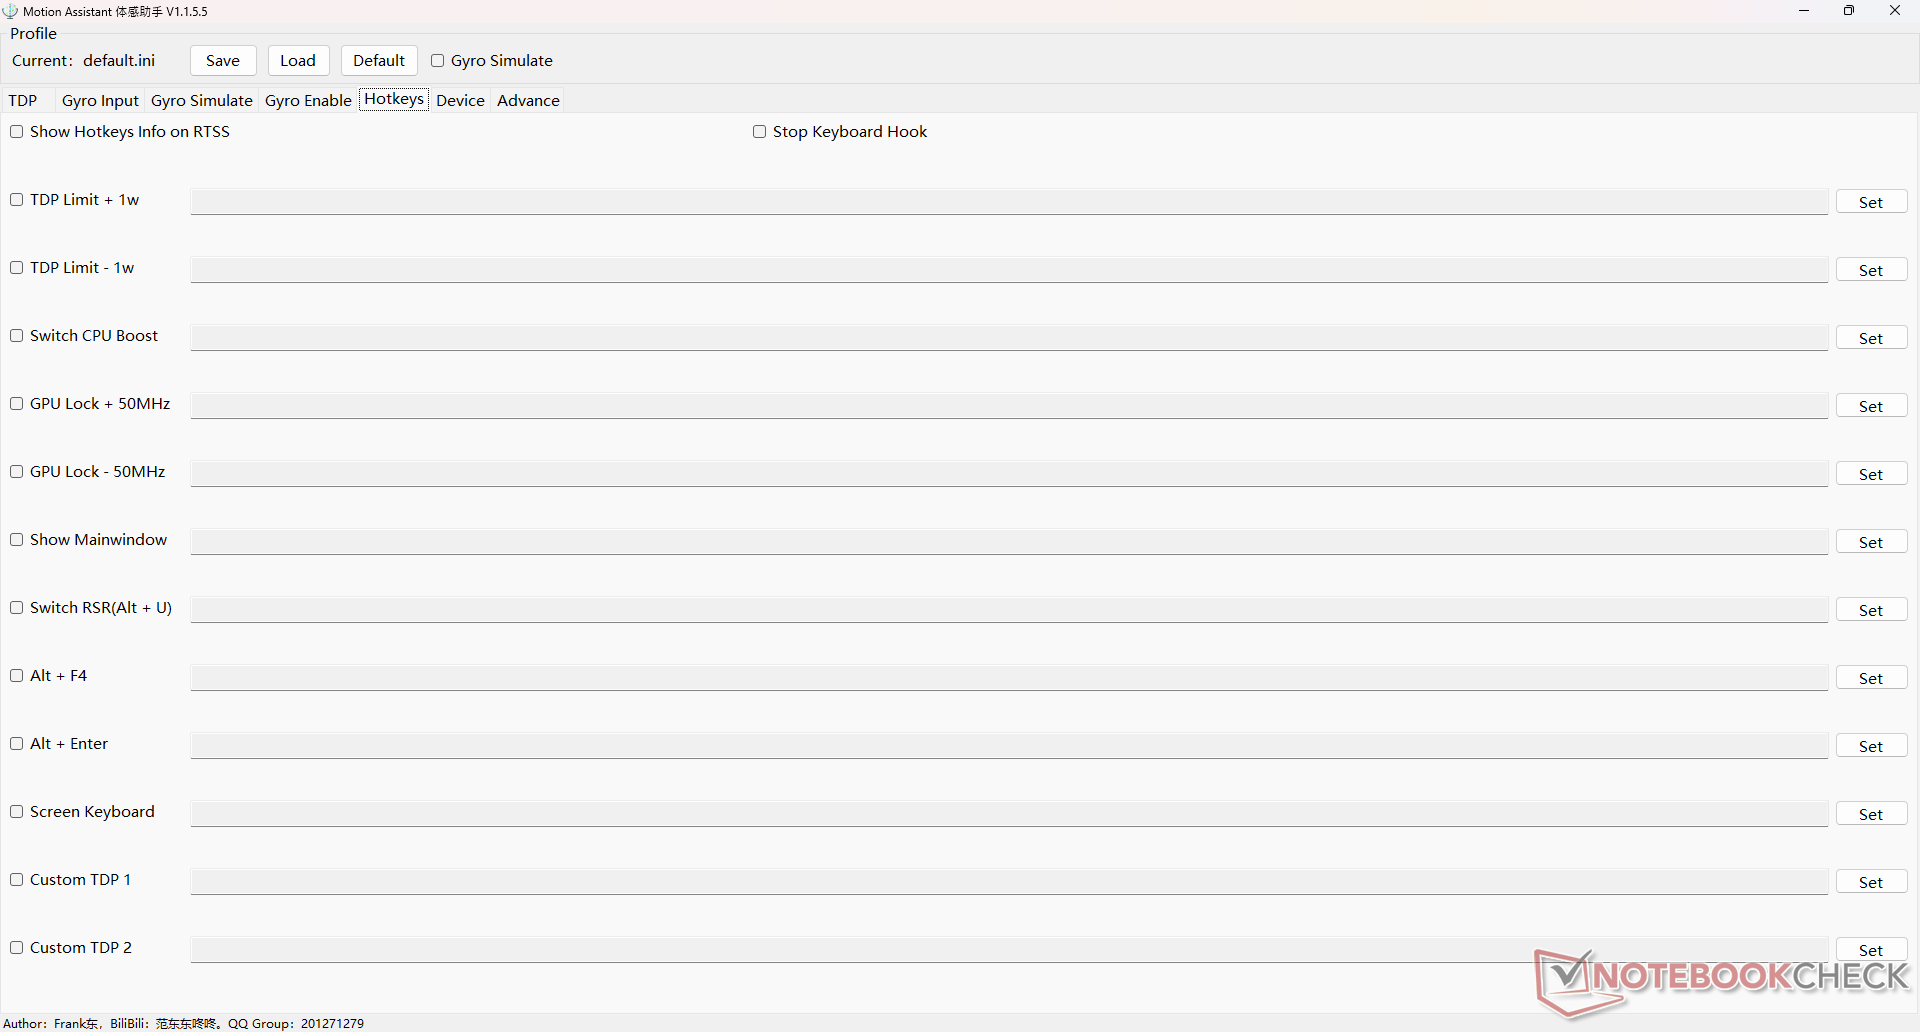
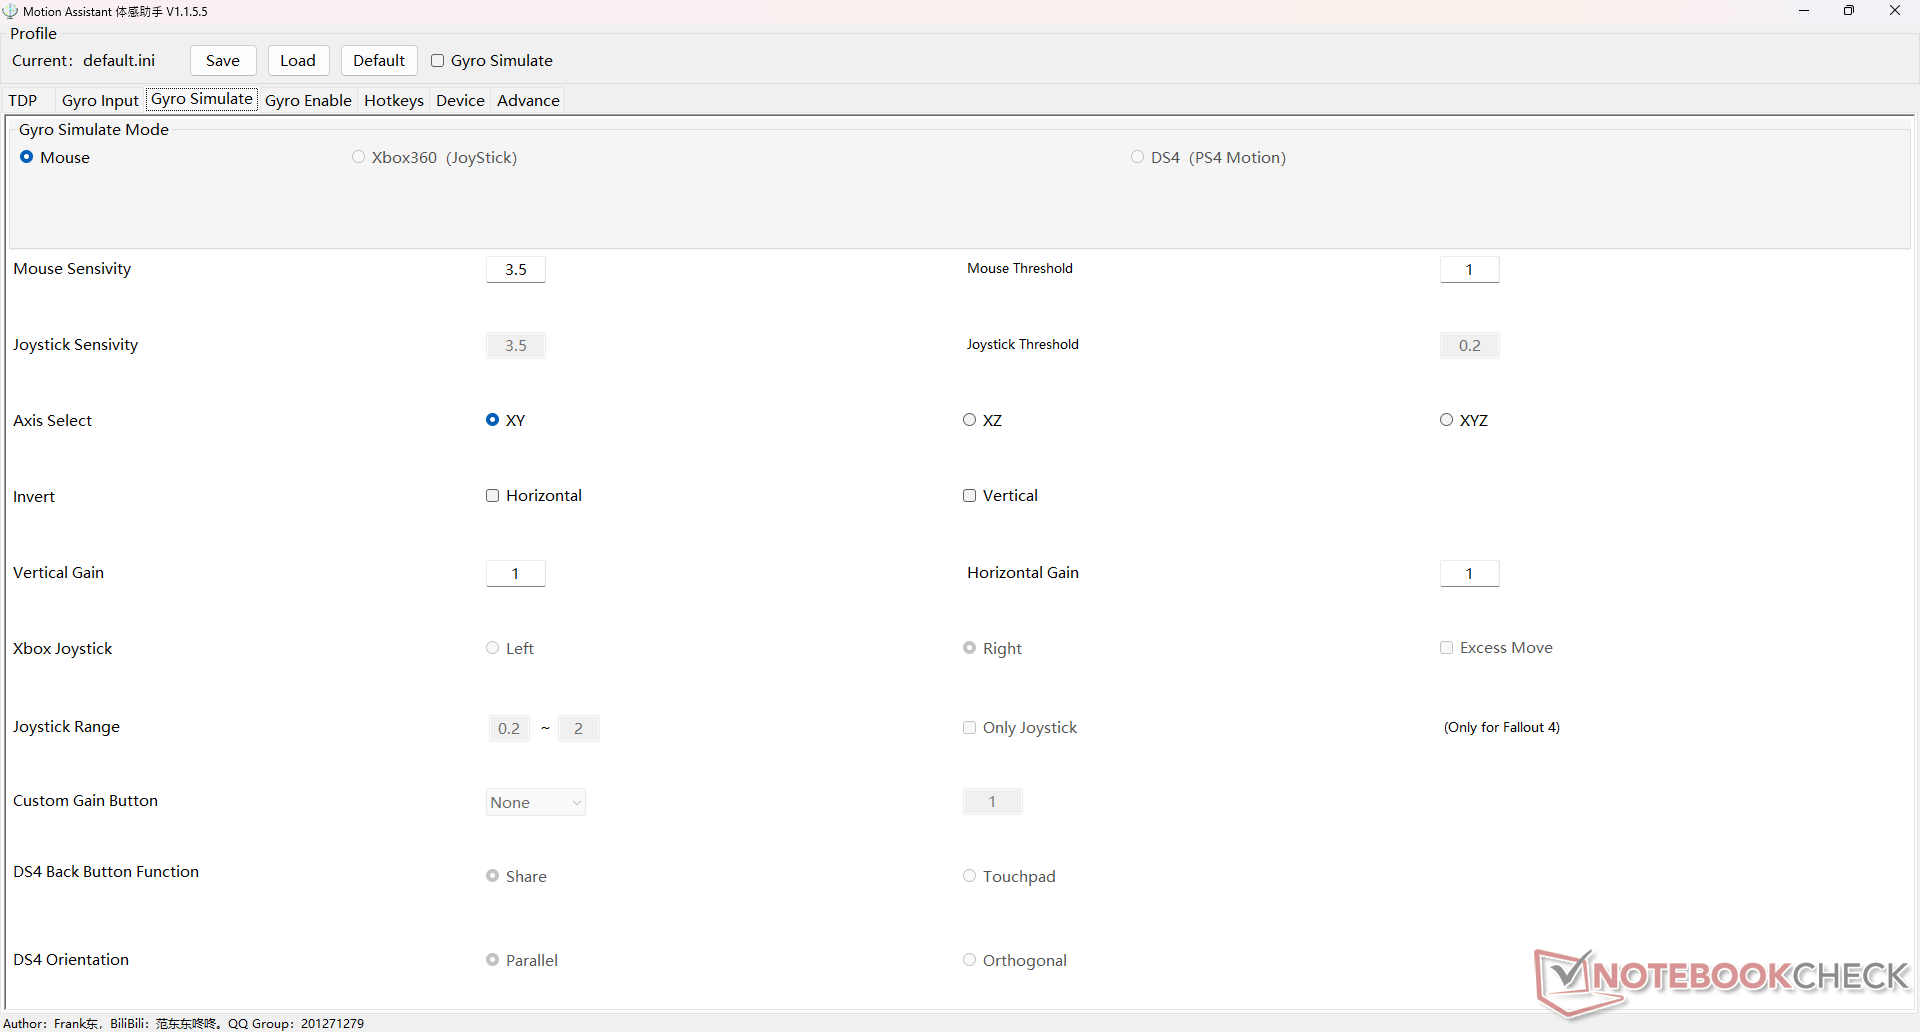
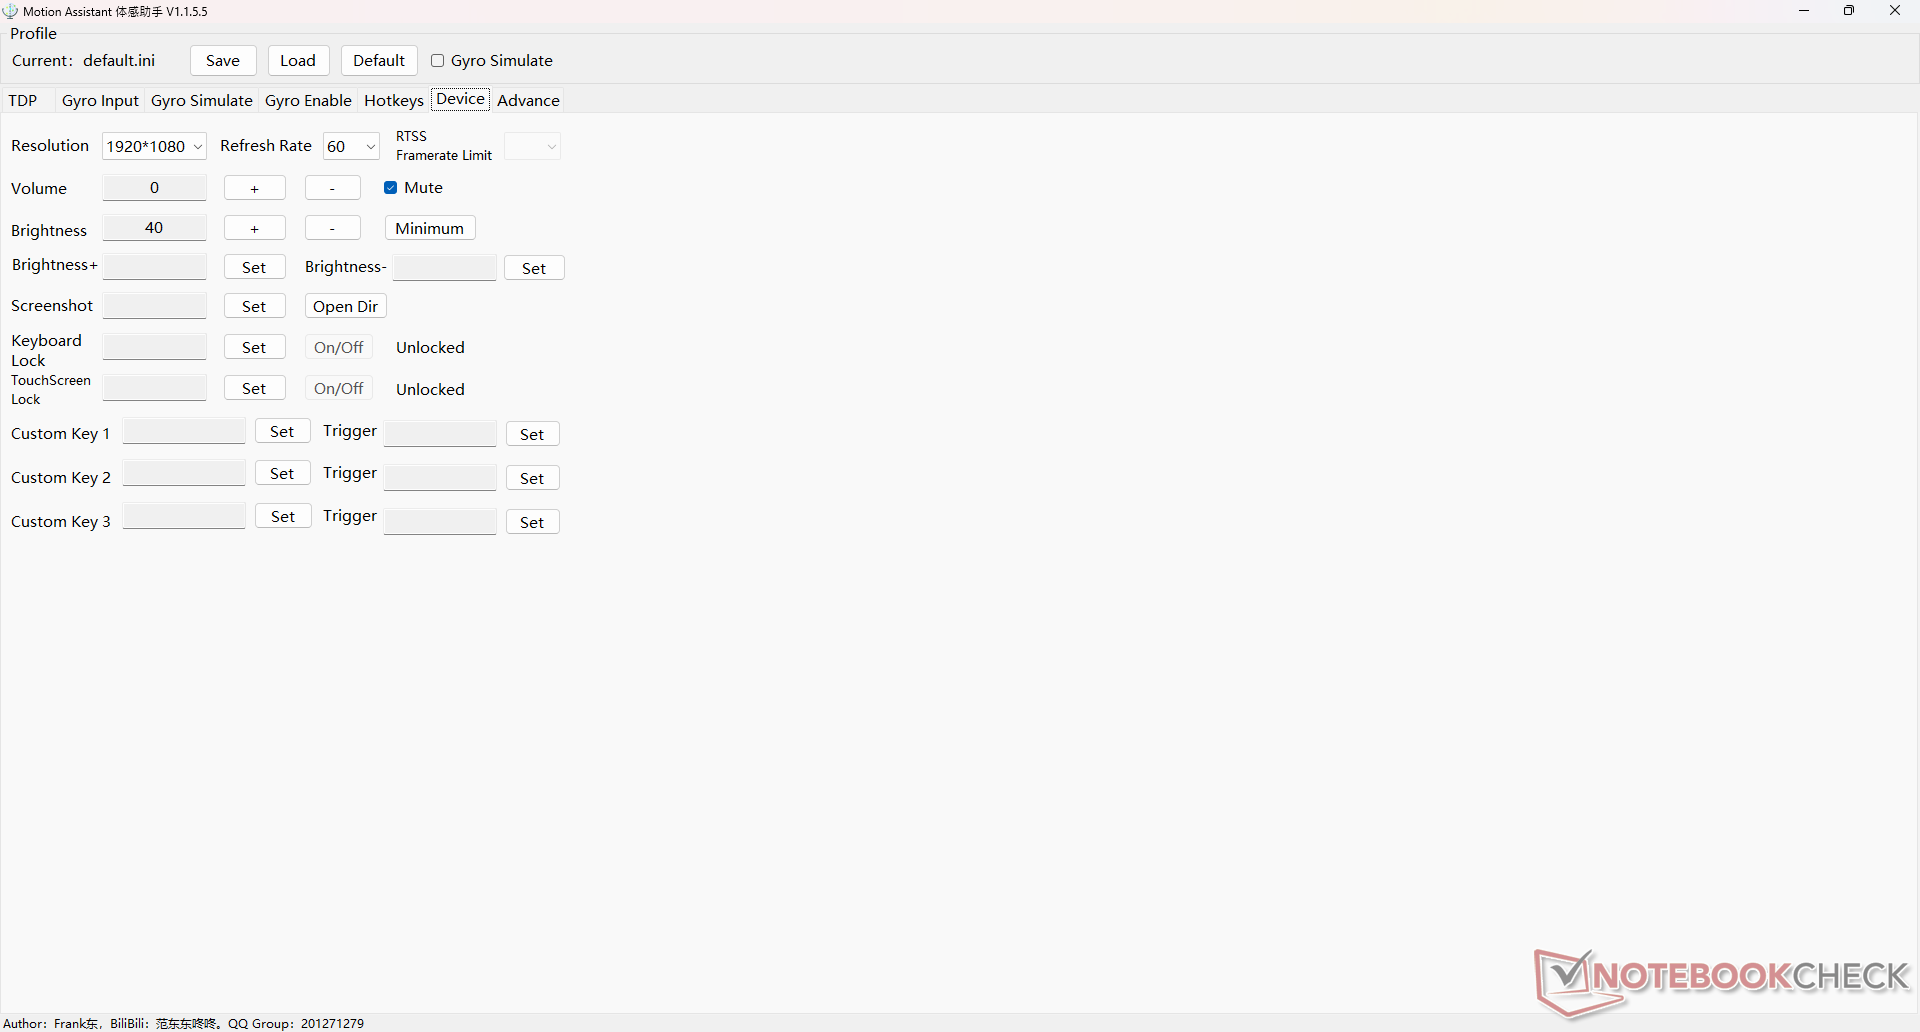
游戏手柄有两种模式,就像Win 3一样:鼠标和游戏手柄。如果在鼠标模式下,游戏板按钮被预先映射到以下按键,如下面的截图所示。如果在游戏板模式下,Windows会将游戏板识别为标准的XBox控制器,以便自动与Steam和其他游戏兼容。在这两种情况下,预装的软件WinControls可以让用户根据需要重新映射按键。
除了L1和R1的肩部按钮外,游戏板的所有按钮都没有背光。
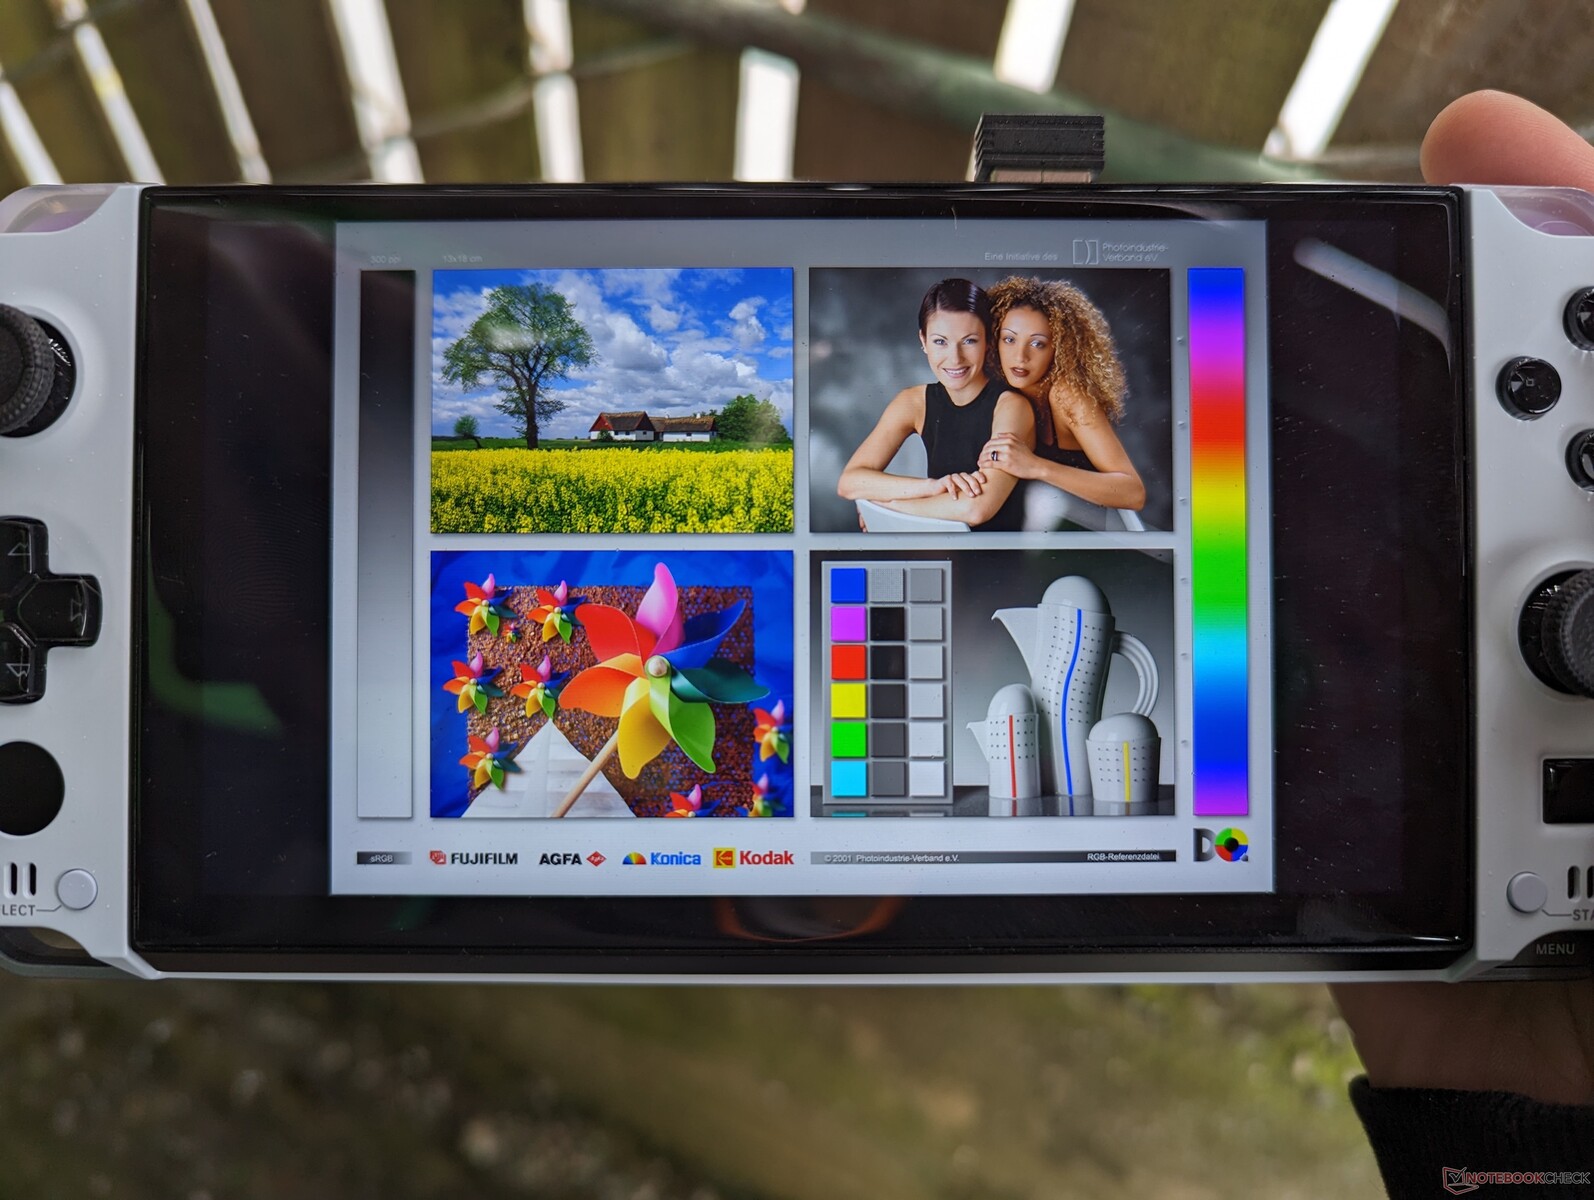
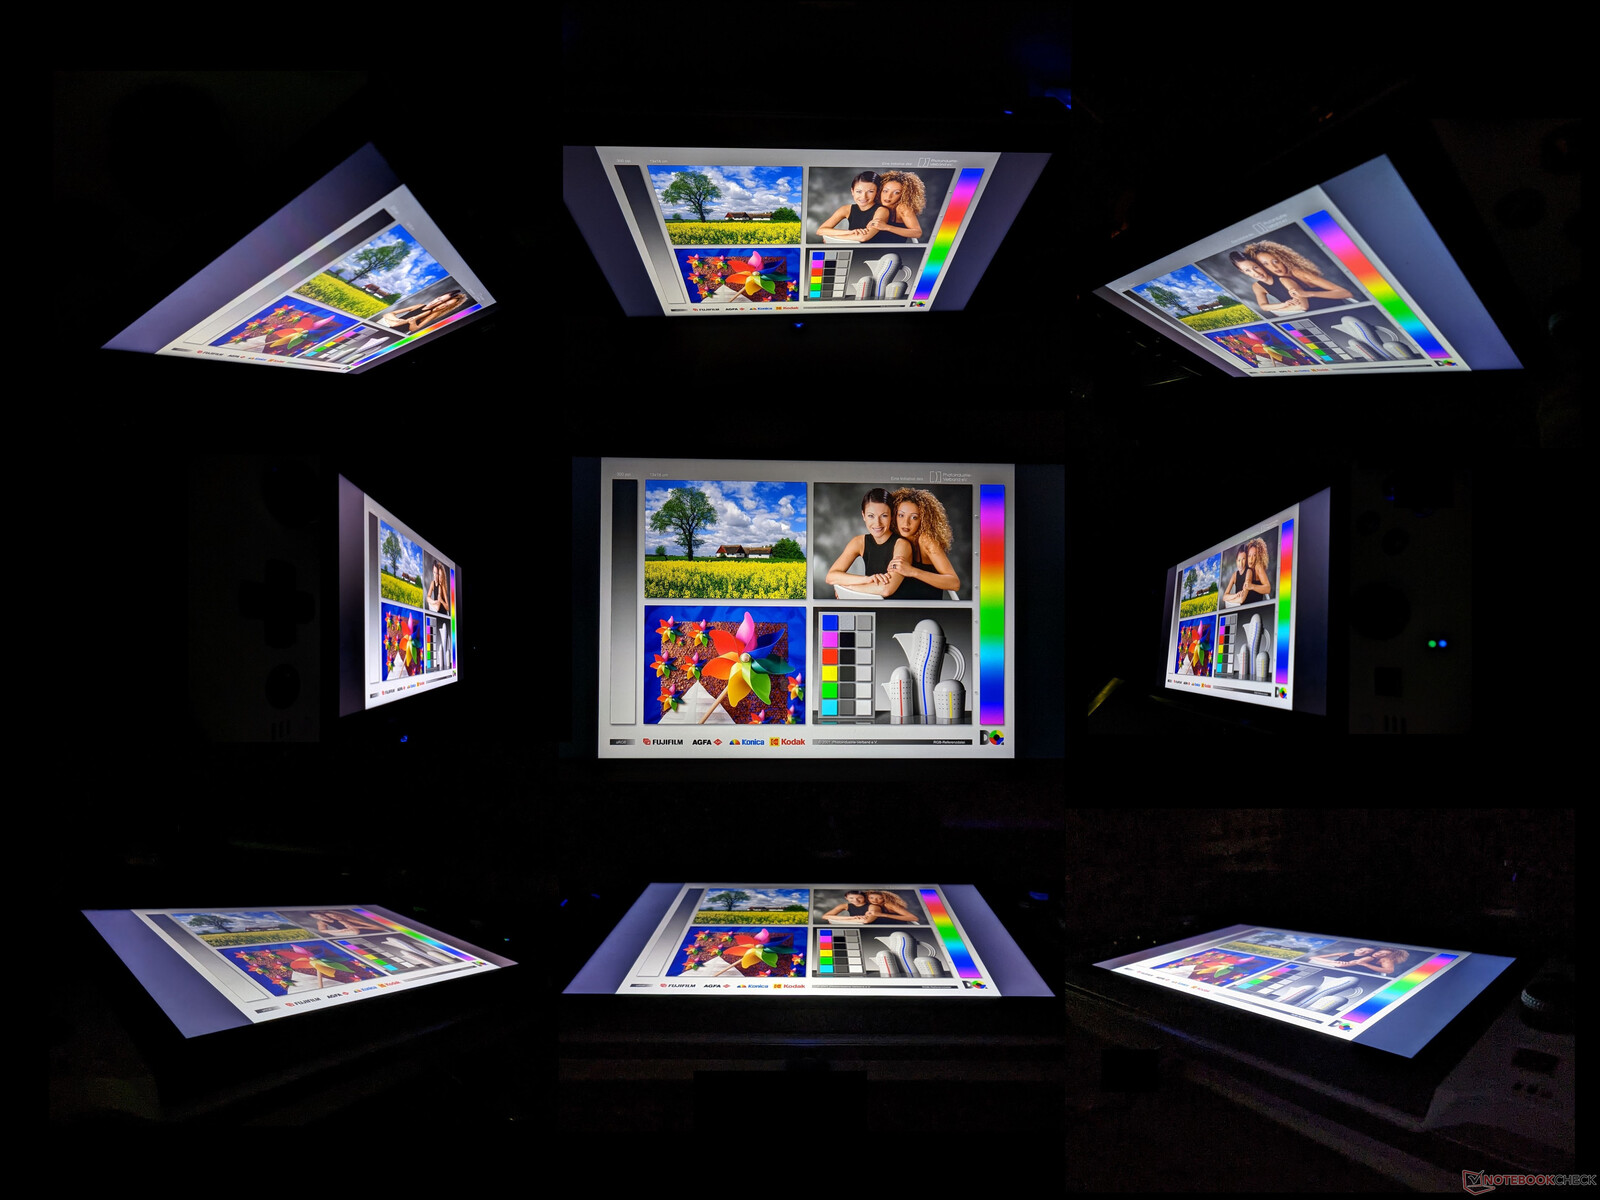
显示屏 - 全1080p IPS,60 Hz
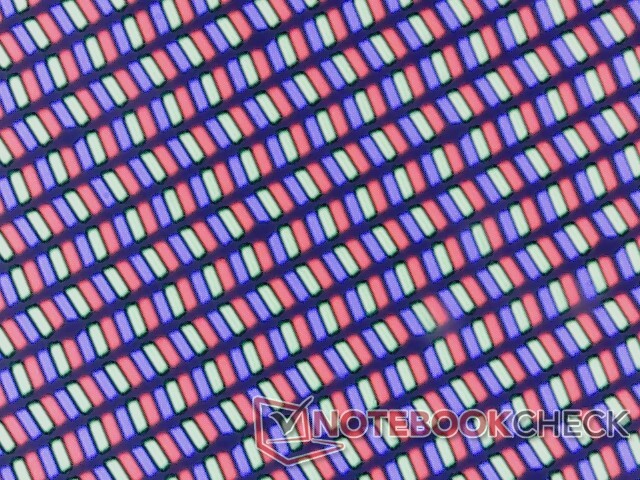
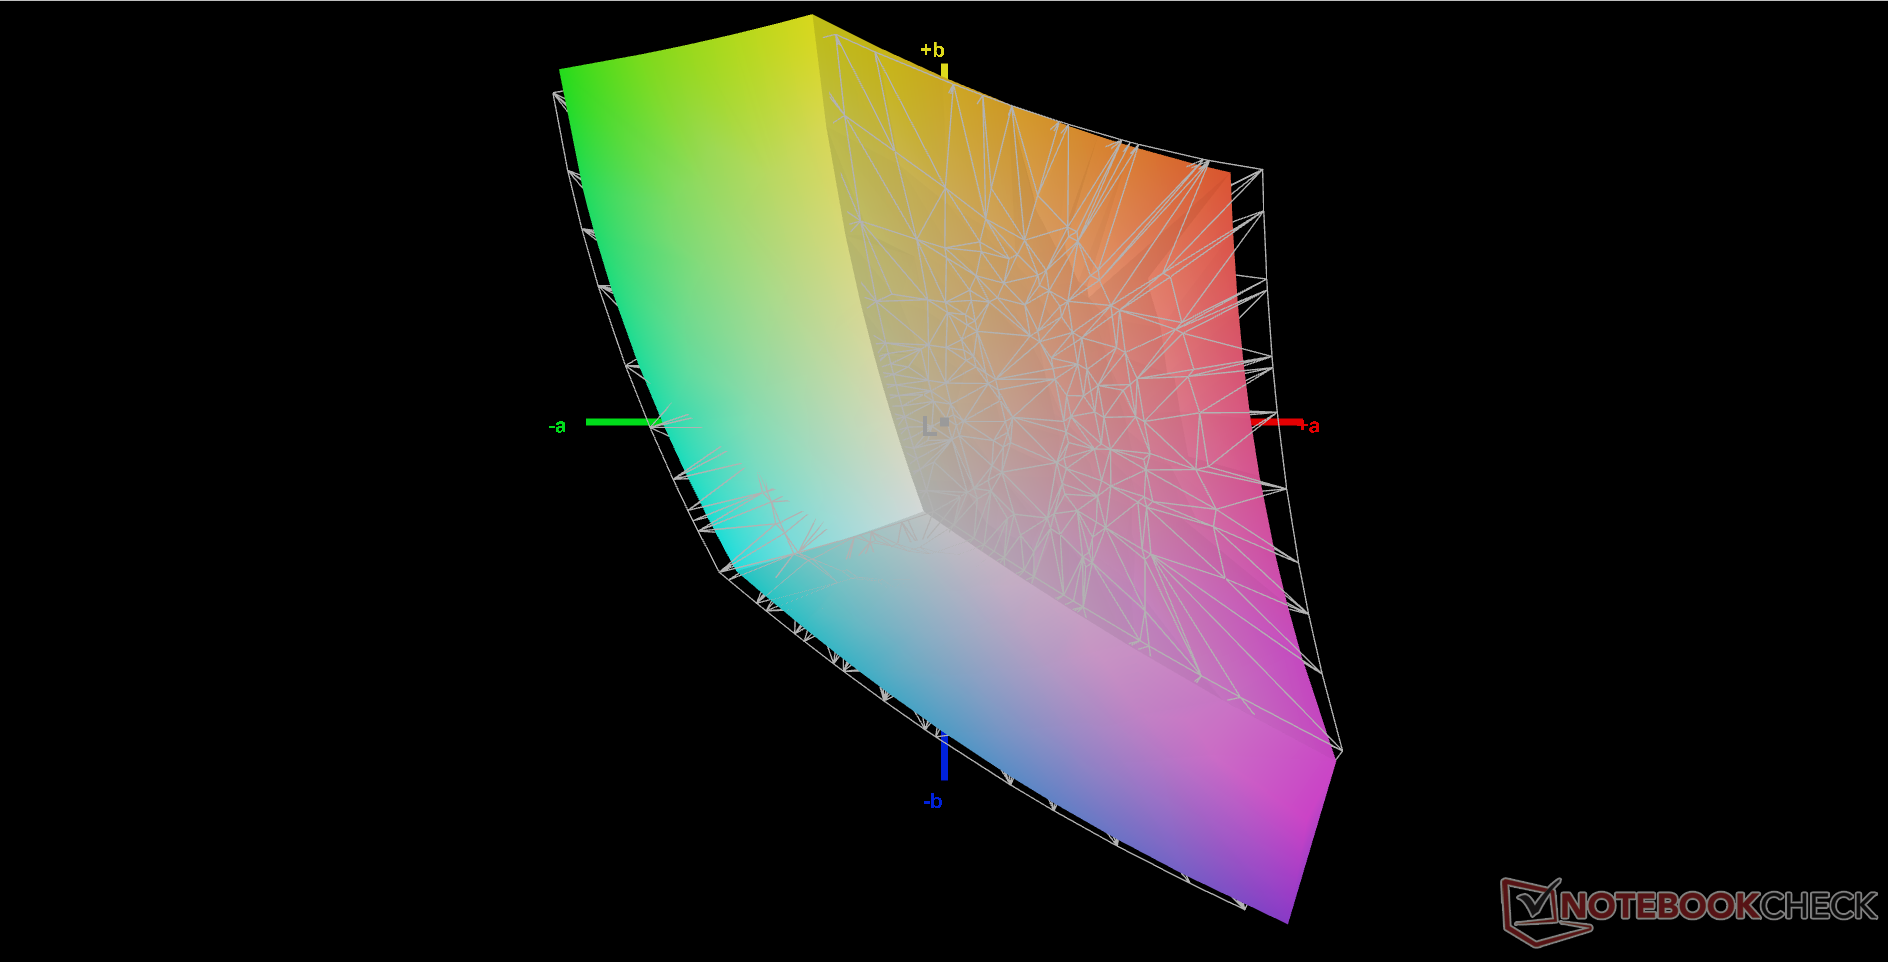
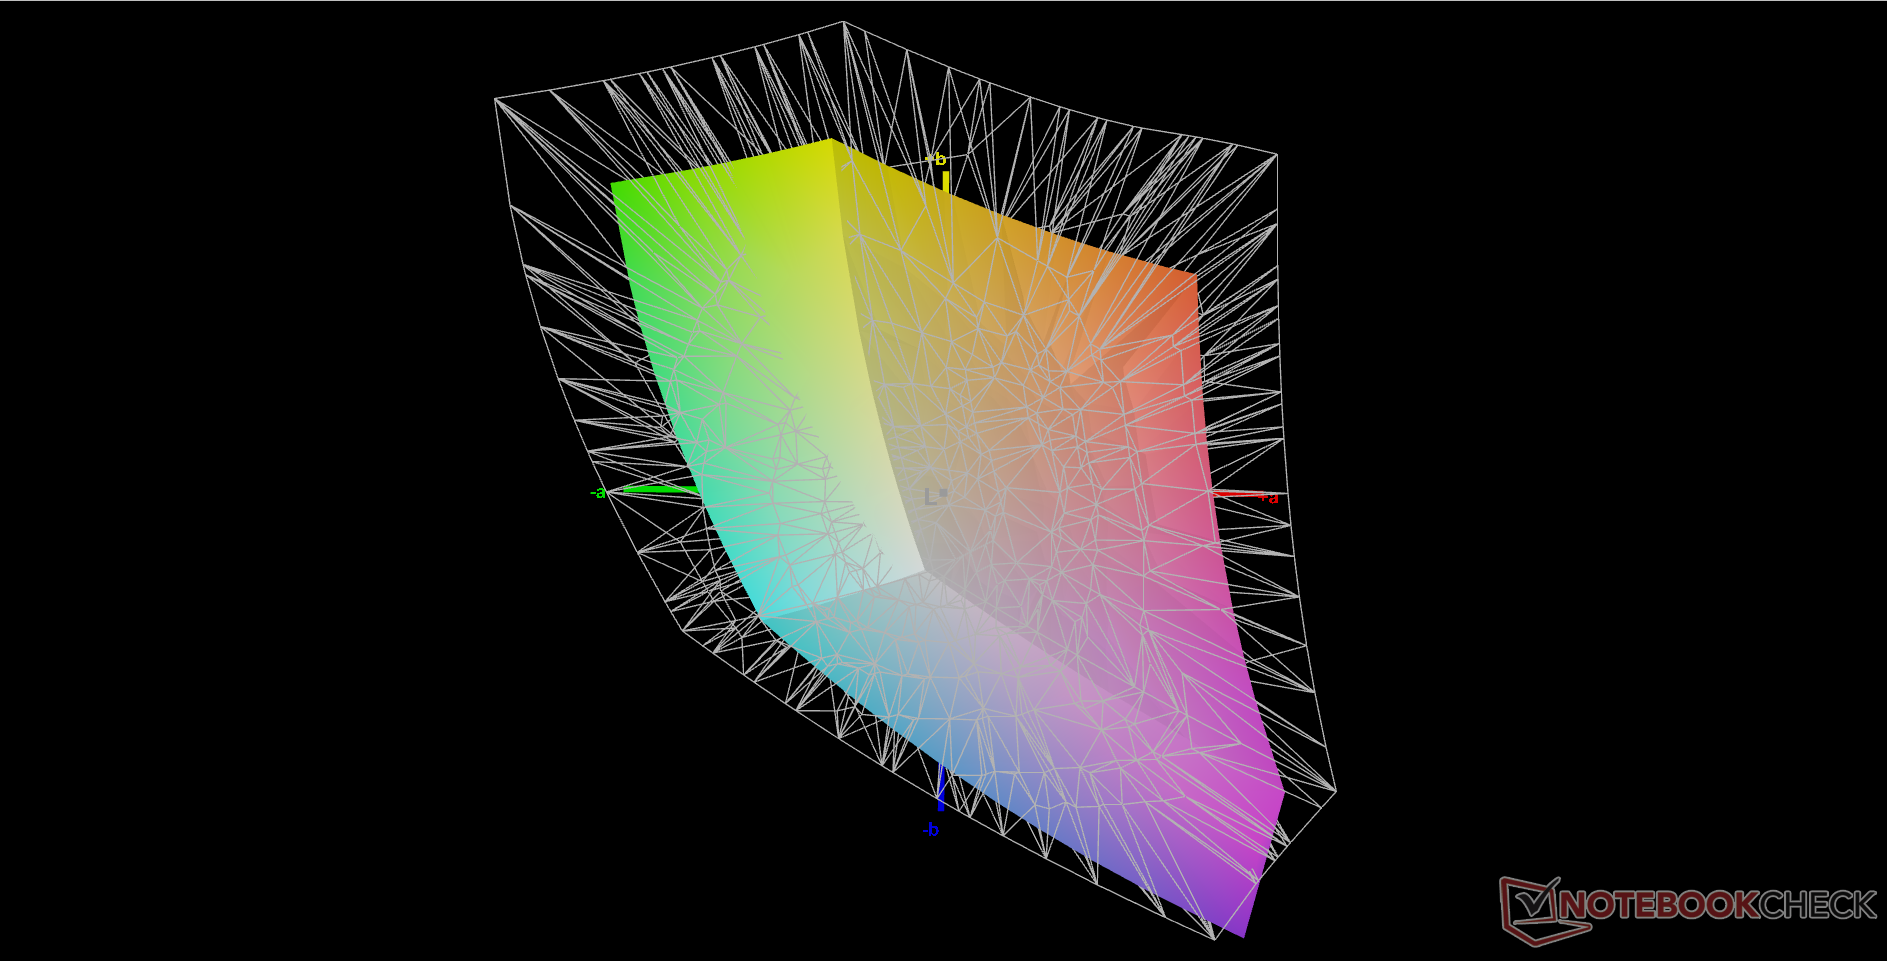
Win3的一个主要缺点是它的屏幕尺寸很小,只有5.5英寸。许多PC游戏没有针对这种小屏幕进行优化,因此HUD和UI图标往往显得很小。Win 4通过更大的6英寸屏幕和更高的1080p原生分辨率解决了这个问题。黑白响应时间也更快,而色域和对比度与Win 3保持一致。IPS显示屏可能不像iPad Pro那样是层压式的,但它还是非常清晰和高质量的。
90%的sRGB色域允许深色,可与许多中端至高端笔记本电脑显示屏相媲美。遗憾的是,没有OLED选项,而OLED可以将颜色扩大到更多,以覆盖P3。
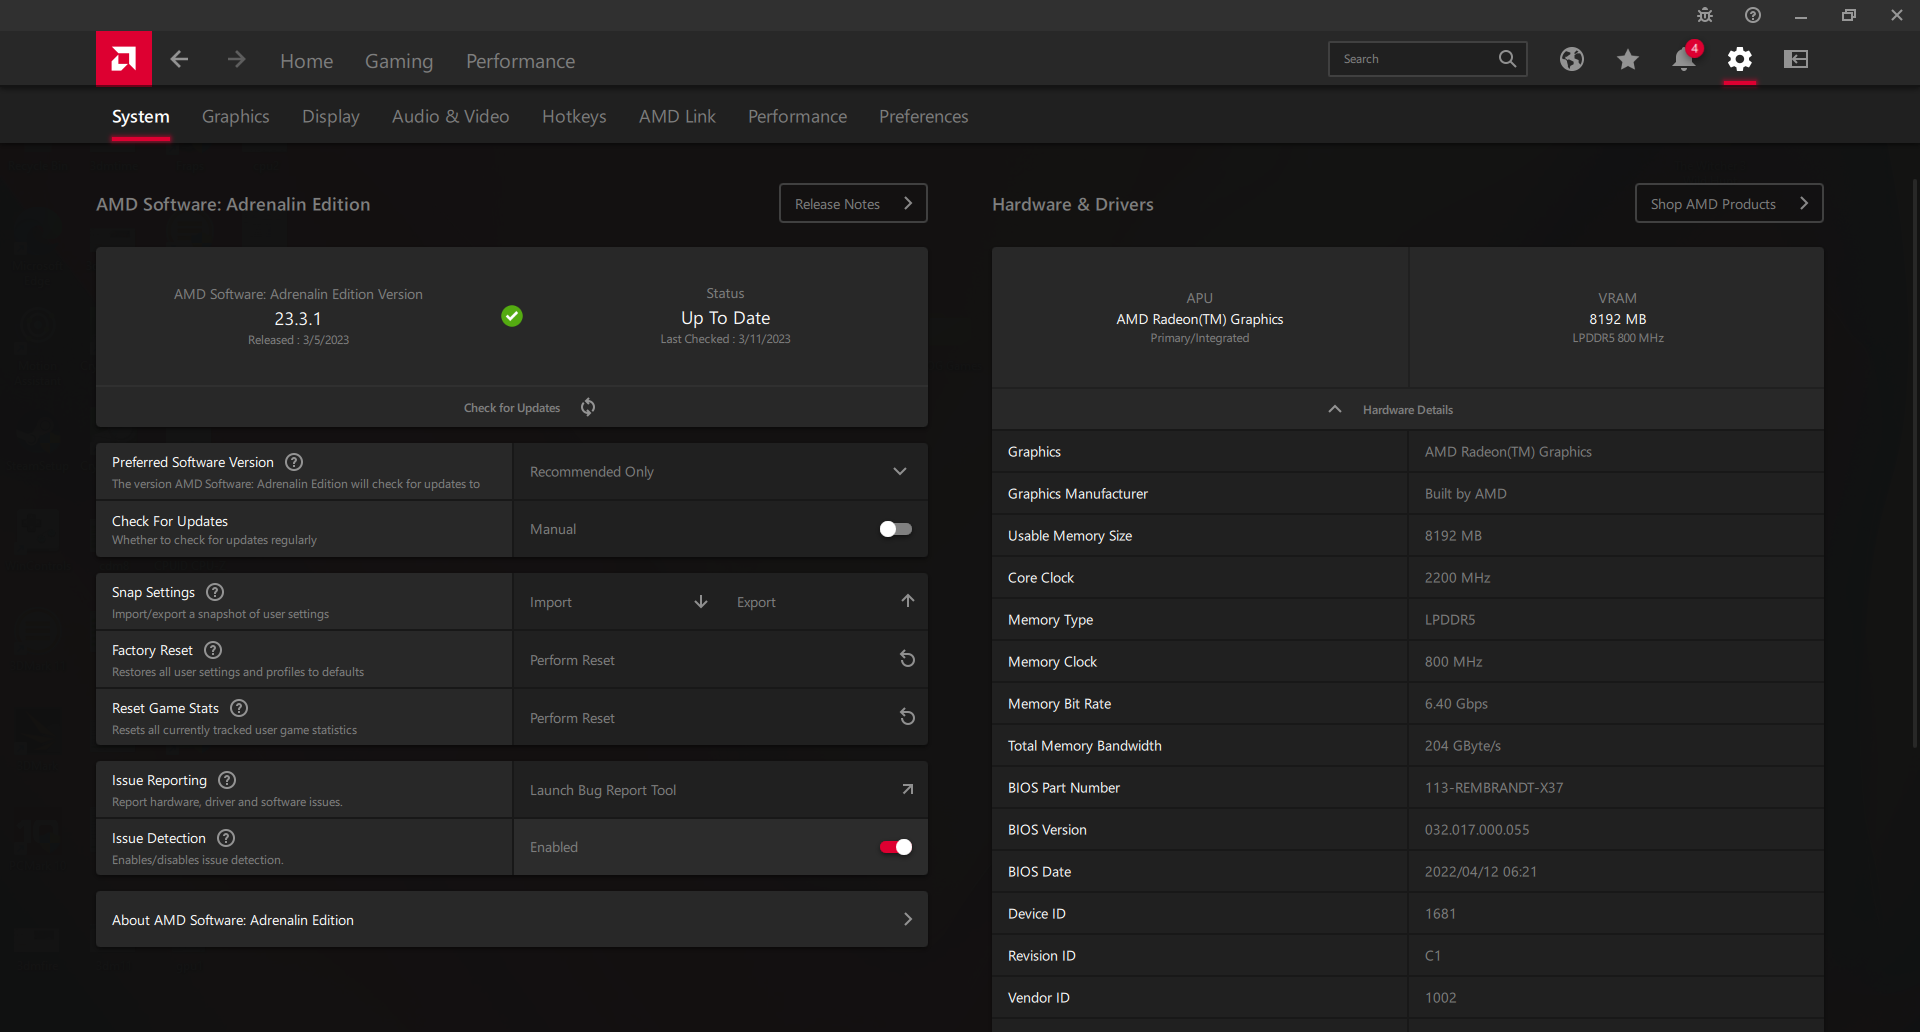
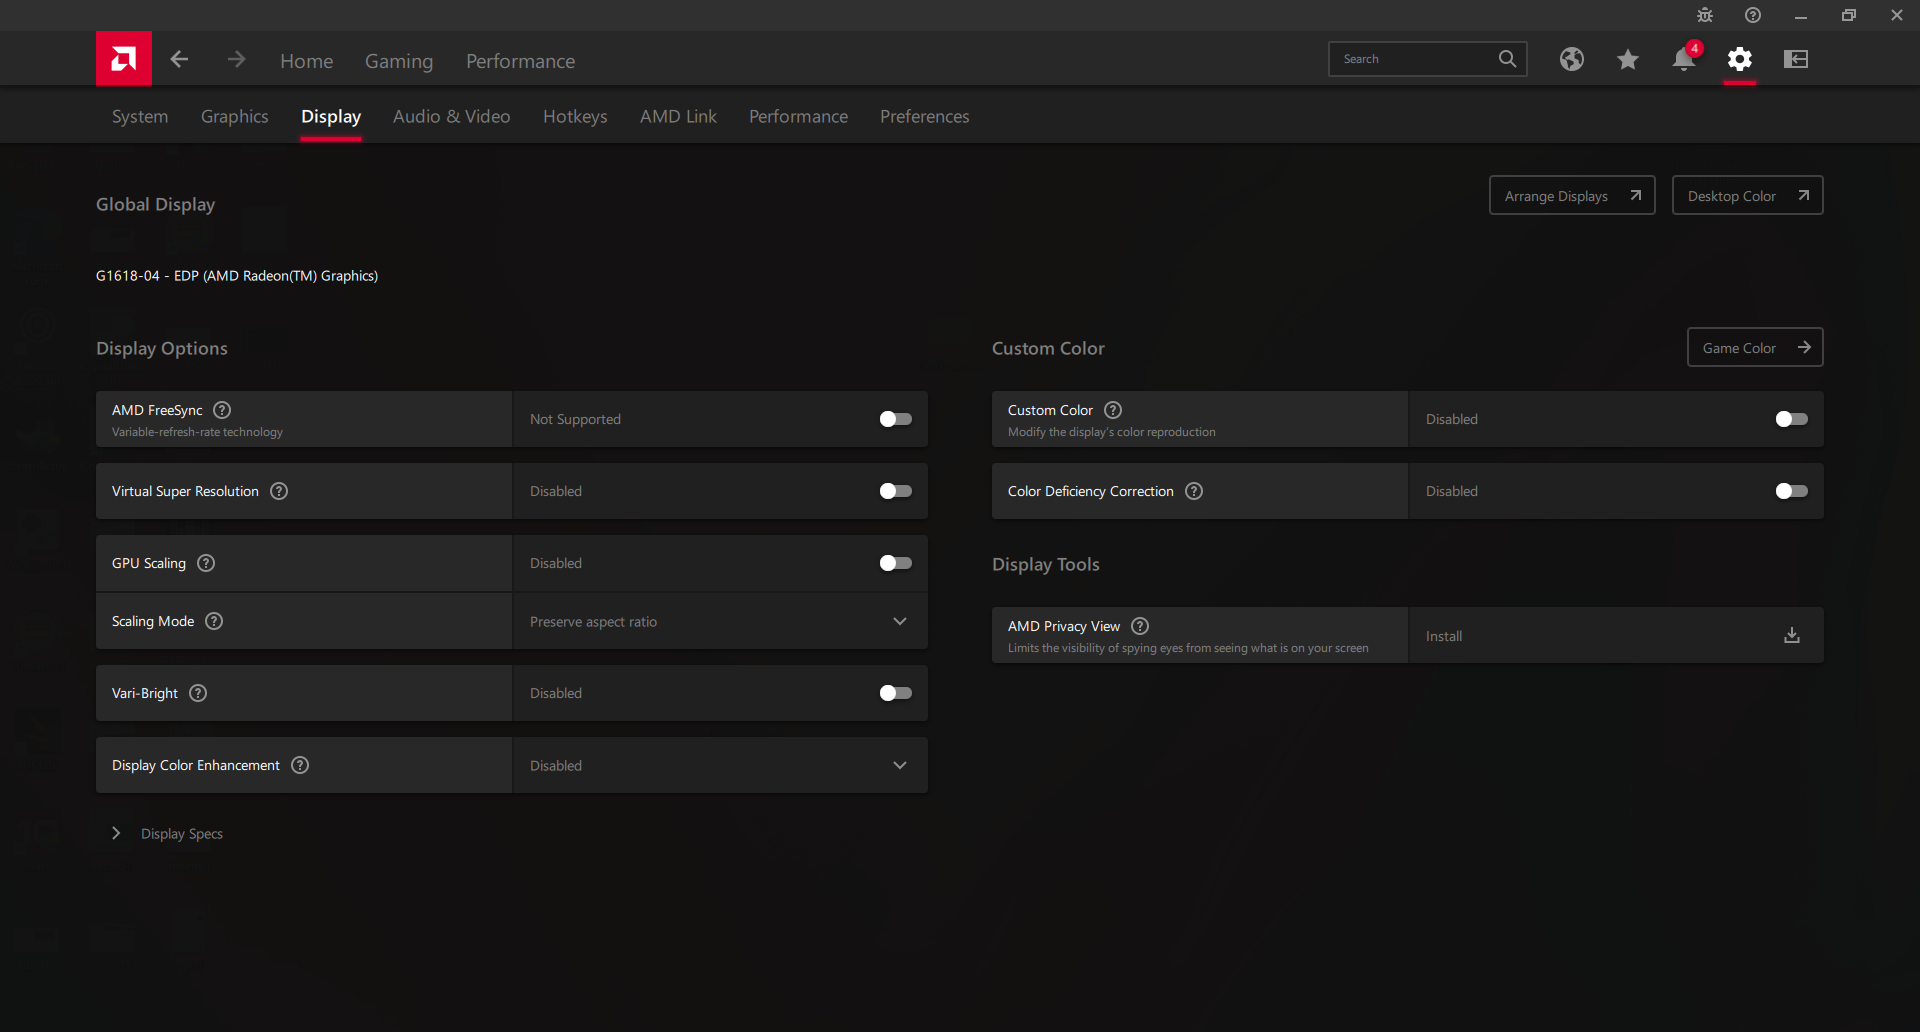
值得注意的是,该显示器不支持自适应同步或FreeSync。考虑到Radeon 680M在1080p时经常表现在40至60FPS的范围内,这一功能对该系统来说是完美的。
| |||||||||||||||||||||||||
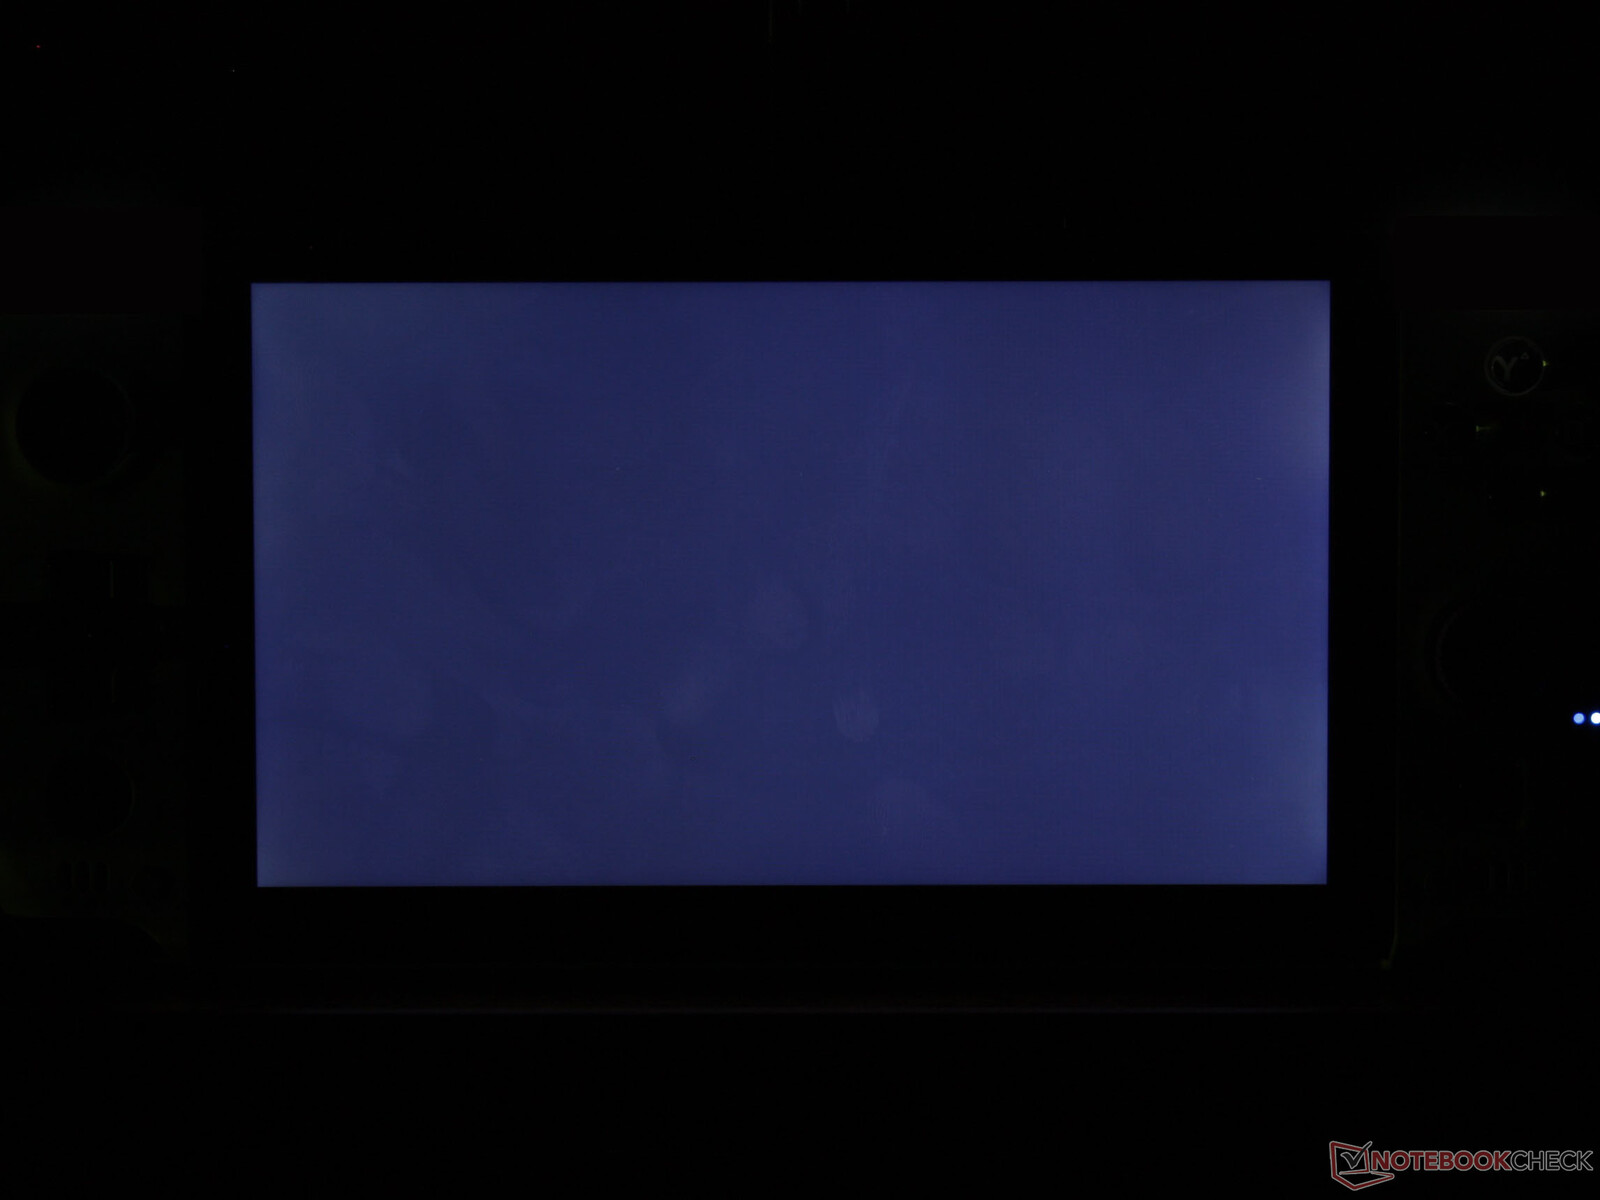
Brightness Distribution: 81 %
Center on Battery: 413.1 cd/m²
Contrast: 1059:1 (Black: 0.39 cd/m²)
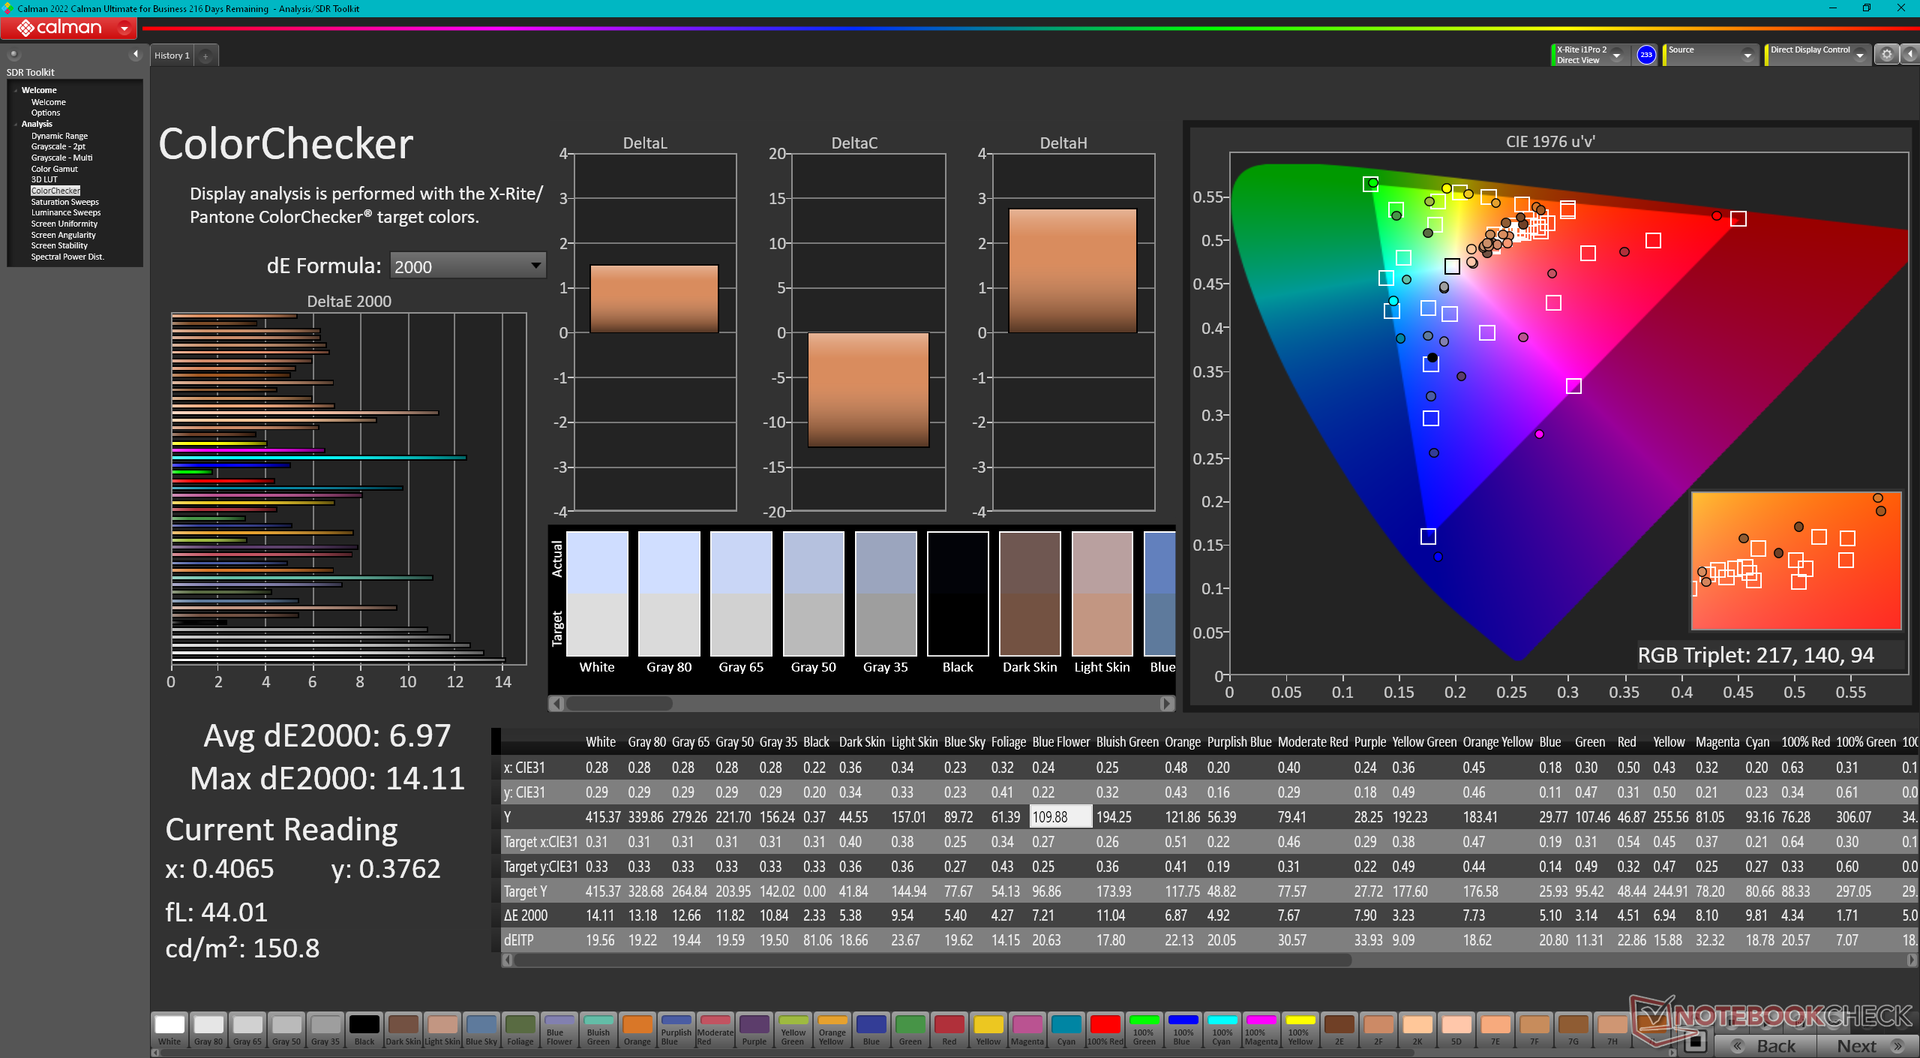
ΔE ColorChecker Calman: 6.97 | ∀{0.5-29.43 Ø4.71}
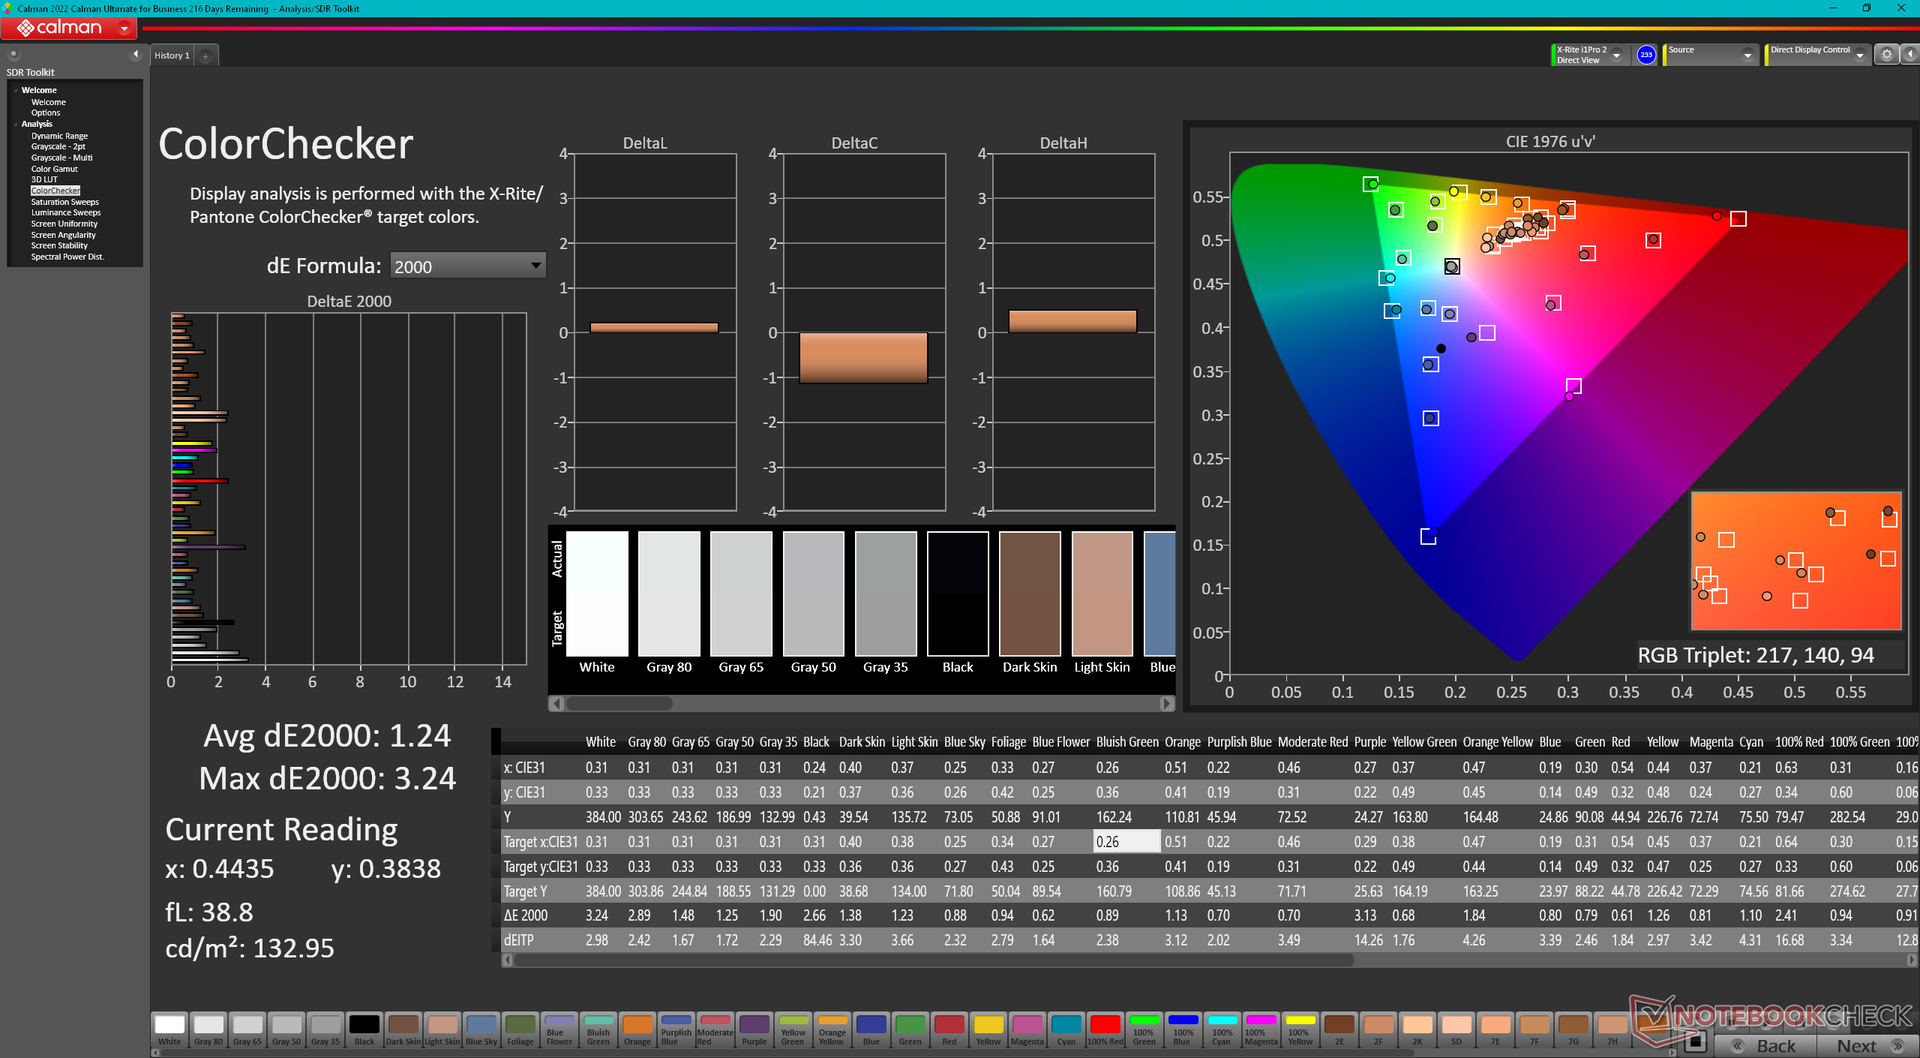
calibrated: 1.24
ΔE Greyscale Calman: 9.9 | ∀{0.09-98 Ø4.96}
64.6% AdobeRGB 1998 (Argyll 3D)
92% sRGB (Argyll 3D)
63.1% Display P3 (Argyll 3D)
Gamma: 2.04
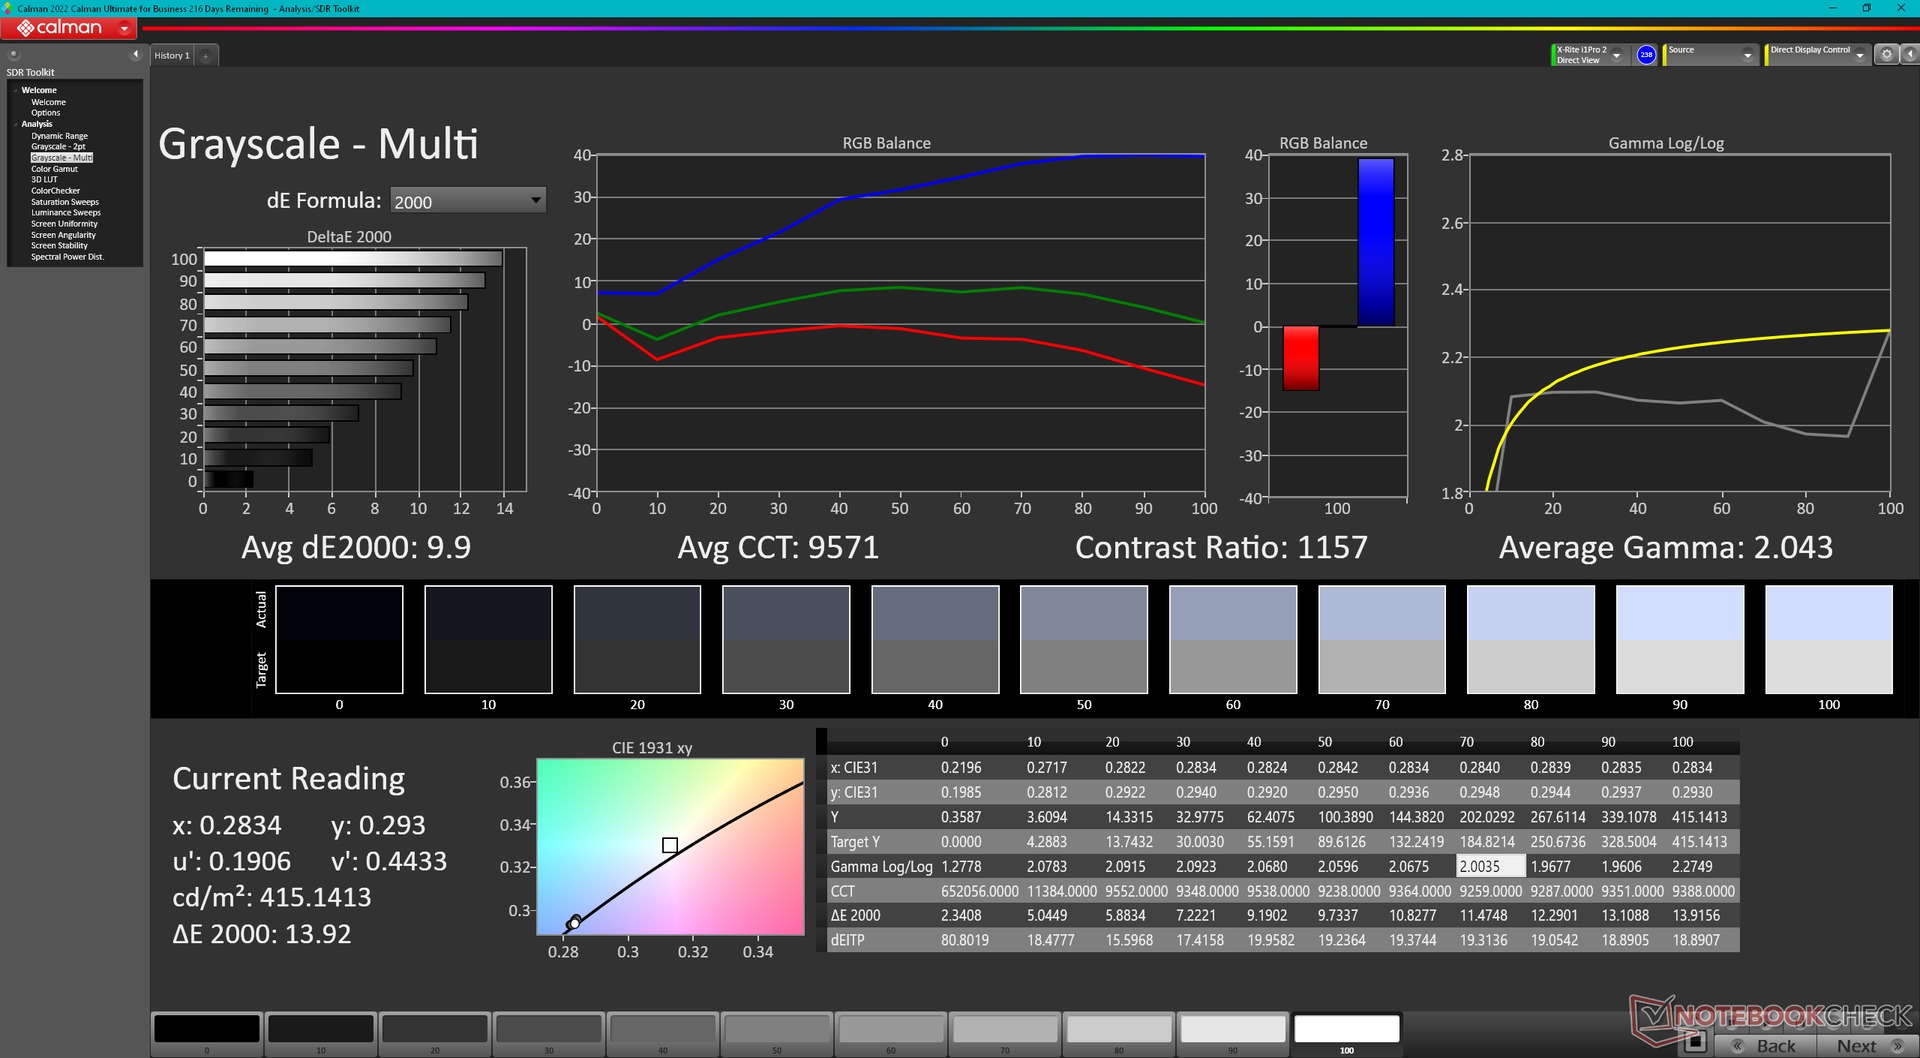
CCT: 9571 K
| GPD Win 4 G1618-04, IPS, 1920x1080, 6" | GPD Win Max 2 Toshiba HX_10.1_LCD, IPS, 2560x1600, 10.1" | GPD Win 3 IPS, 1280x720, 5.5" | Razer Blade Stealth i7-1165G7 GTX 1650 Ti Max-Q Sharp LQ133M1JW46, IPS, 1920x1080, 13.3" | Dell XPS 13 9315 2-in-1 Core i5-1230U BOE NE13A1M, IPS, 2880x1920, 13" | Asus Zenbook S 13 OLED SDC4172, OLED, 2880x1800, 13.3" | |
|---|---|---|---|---|---|---|
| Display | 4% | -5% | 5% | 11% | 39% | |
| Display P3 Coverage (%) | 63.1 | 69.8 11% | 59.5 -6% | 66 5% | 70.7 12% | 99.8 58% |
| sRGB Coverage (%) | 92 | 91 -1% | 89.6 -3% | 97.4 6% | 99.8 8% | 100 9% |
| AdobeRGB 1998 Coverage (%) | 64.6 | 66.6 3% | 61.4 -5% | 67.1 4% | 72.6 12% | 97.8 51% |
| Response Times | 16% | -36% | -98% | -42% | 92% | |
| Response Time Grey 50% / Grey 80% * (ms) | 26.8 ? | 21.2 ? 21% | 40 ? -49% | 57.6 ? -115% | 44 ? -64% | 2.1 ? 92% |
| Response Time Black / White * (ms) | 20.9 ? | 18.7 ? 11% | 25.6 ? -22% | 37.6 ? -80% | 24.8 ? -19% | 1.68 ? 92% |
| PWM Frequency (Hz) | 240.4 ? | |||||
| Screen | 8% | -9% | 24% | 41% | 196% | |
| Brightness middle (cd/m²) | 413.1 | 396.7 -4% | 468.8 13% | 356.8 -14% | 507 23% | 336 -19% |
| Brightness (cd/m²) | 407 | 381 -6% | 460 13% | 336 -17% | 486 19% | 338 -17% |
| Brightness Distribution (%) | 81 | 89 10% | 93 15% | 88 9% | 87 7% | 99 22% |
| Black Level * (cd/m²) | 0.39 | 0.36 8% | 0.45 -15% | 0.34 13% | 0.34 13% | 0.02 95% |
| Contrast (:1) | 1059 | 1102 4% | 1042 -2% | 1049 -1% | 1491 41% | 16800 1486% |
| Colorchecker dE 2000 * | 6.97 | 6.31 9% | 9 -29% | 1.63 77% | 2.04 71% | 1.8 74% |
| Colorchecker dE 2000 max. * | 14.11 | 10.23 27% | 15.5 -10% | 5.03 64% | 3.1 78% | 3.8 73% |
| Colorchecker dE 2000 calibrated * | 1.24 | 1.44 -16% | 1.91 -54% | 1.08 13% | 0.86 31% | 1.8 -45% |
| Greyscale dE 2000 * | 9.9 | 5.5 44% | 10.9 -10% | 3 70% | 1.8 82% | 0.9 91% |
| Gamma | 2.04 108% | 2.17 101% | 2.13 103% | 2.23 99% | 2.12 104% | 2.22 99% |
| CCT | 9571 68% | 7502 87% | 10972 59% | 6434 101% | 6561 99% | 6580 99% |
| Color Space (Percent of AdobeRGB 1998) (%) | 56.6 | 62 | ||||
| Color Space (Percent of sRGB) (%) | 89.2 | 97.6 | ||||
| Total Average (Program / Settings) | 9% /
9% | -17% /
-12% | -23% /
2% | 3% /
22% | 109% /
147% |
* ... smaller is better
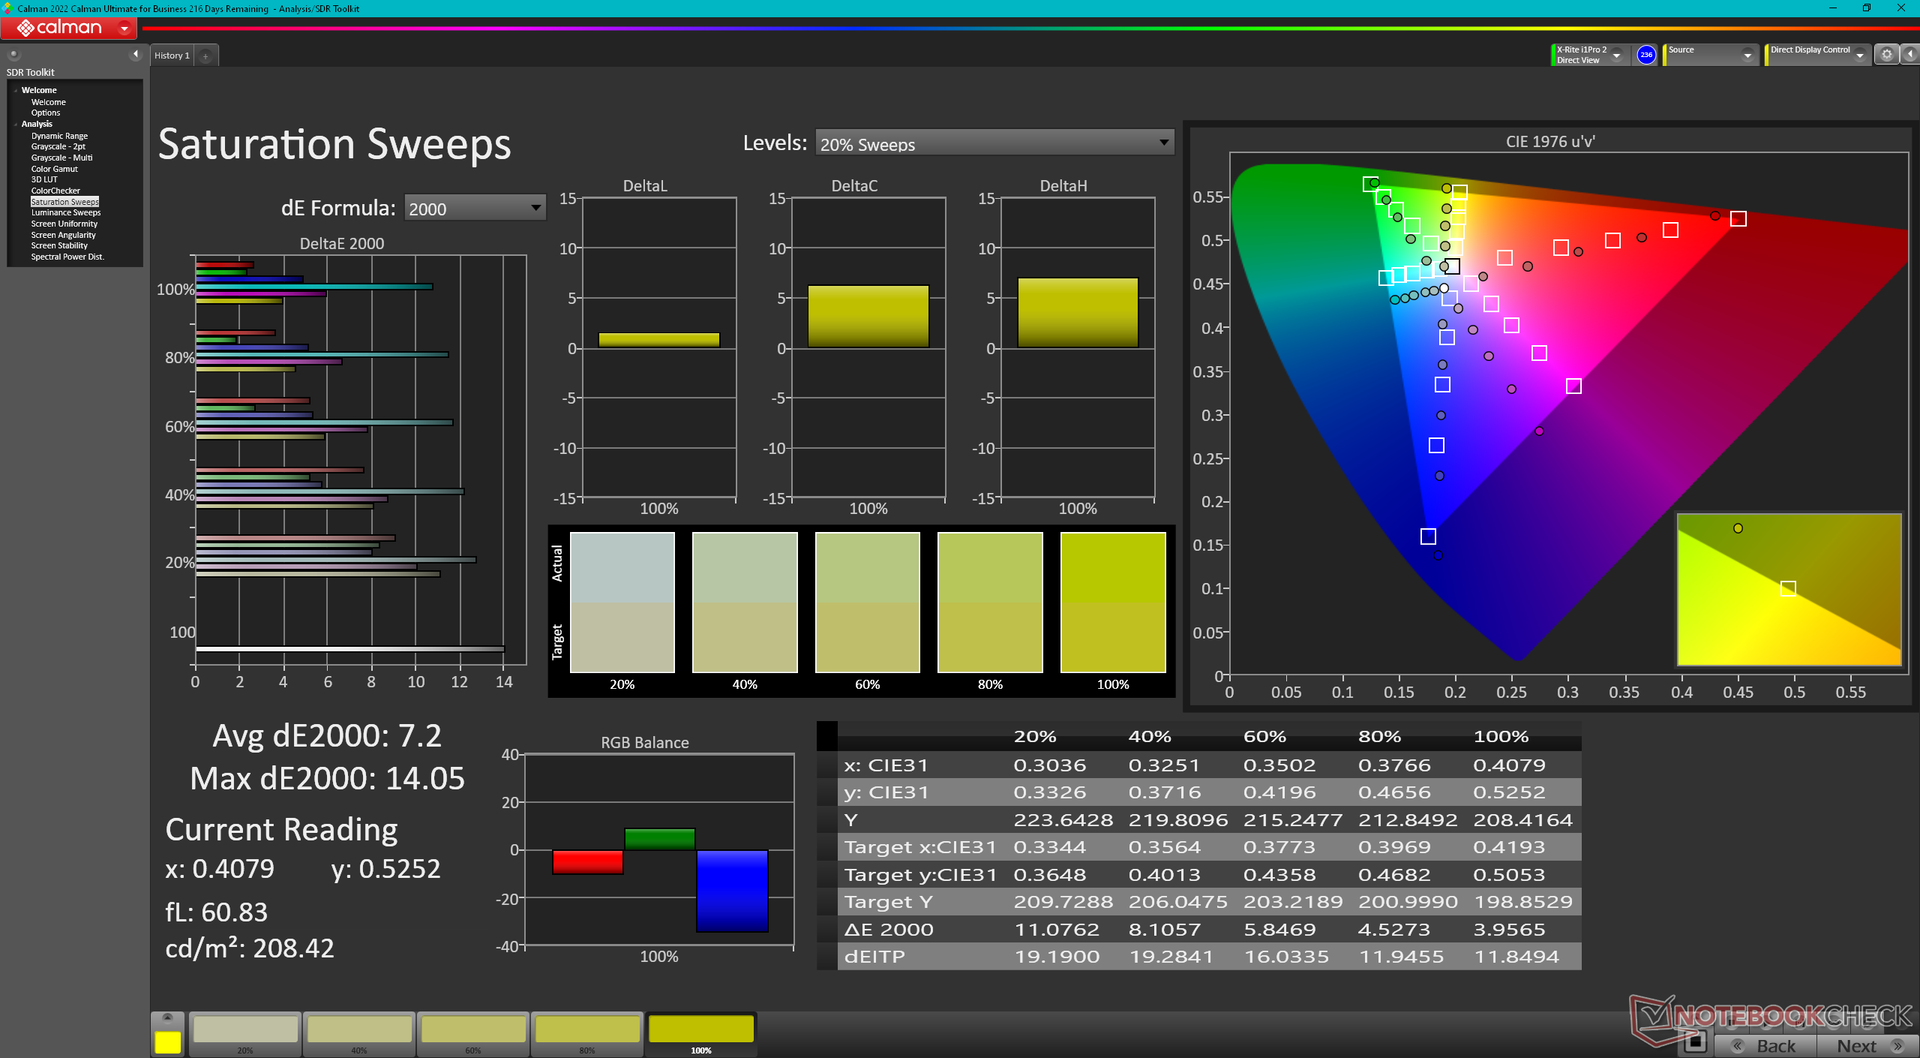
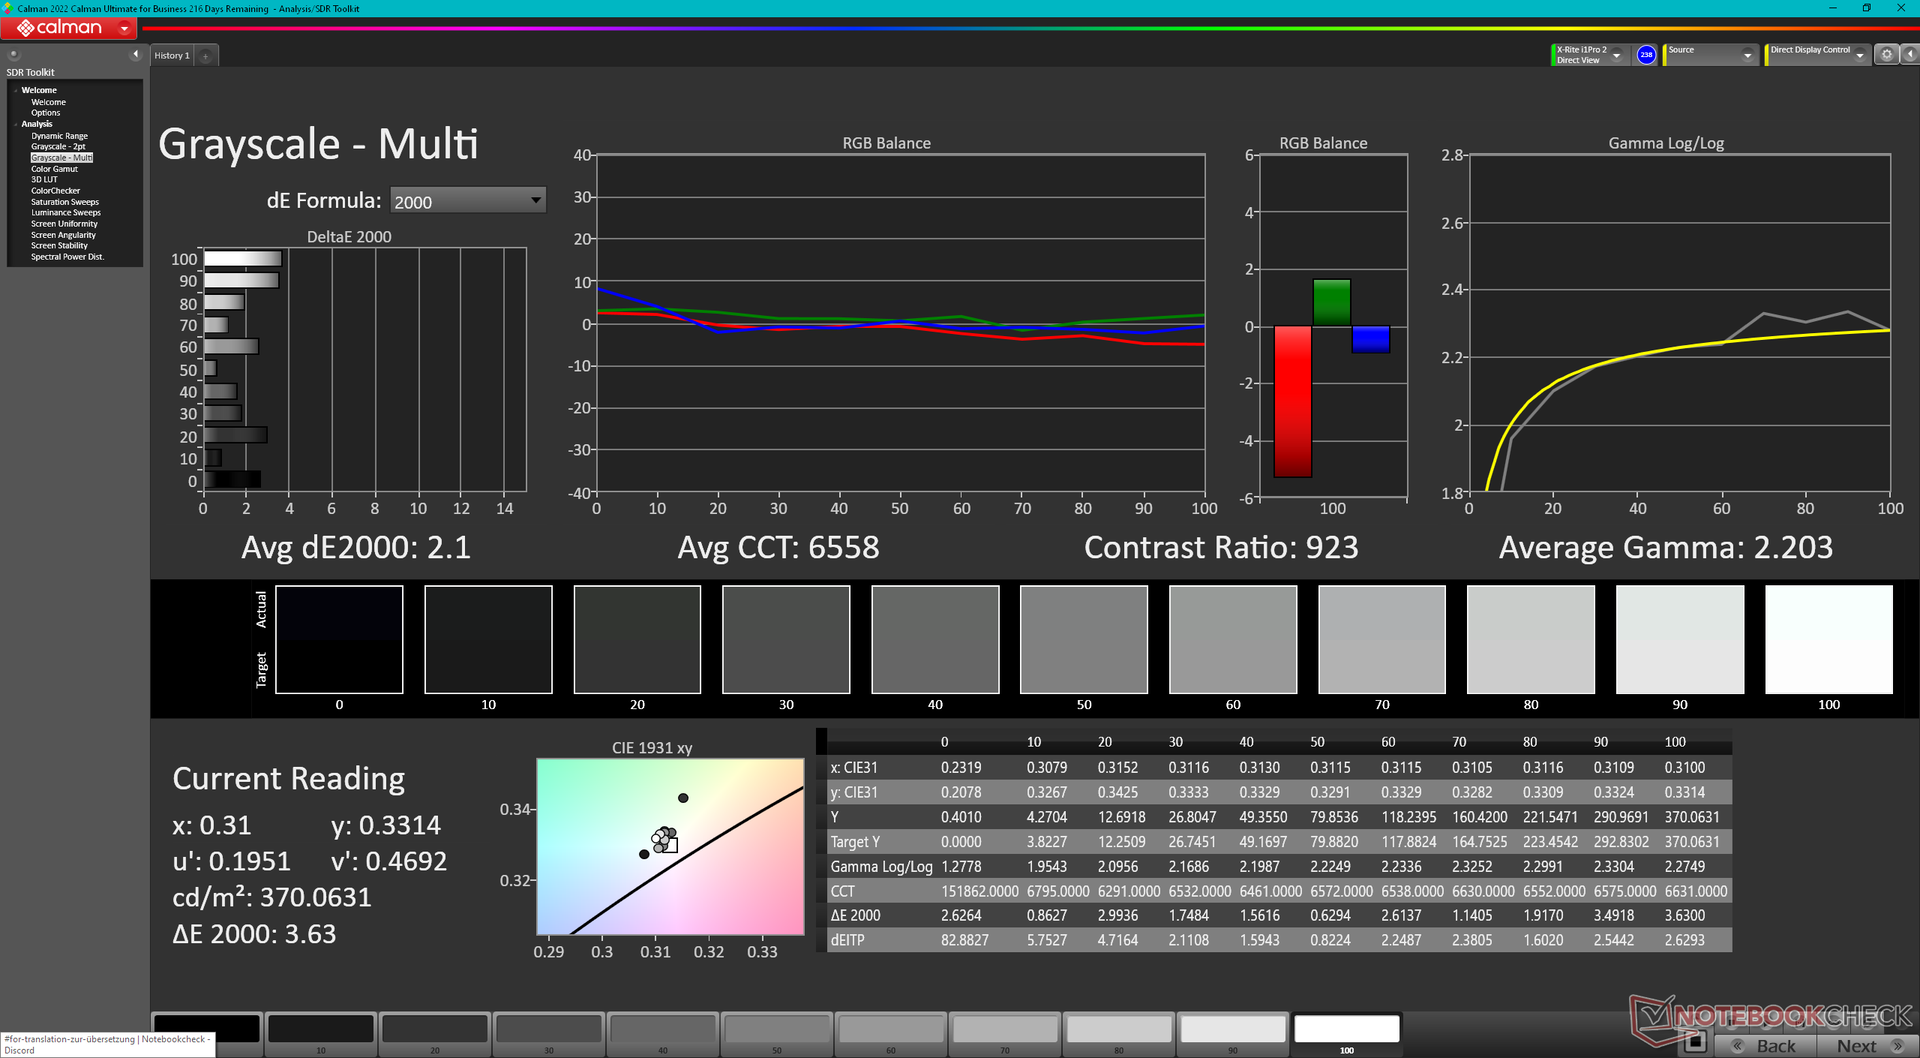
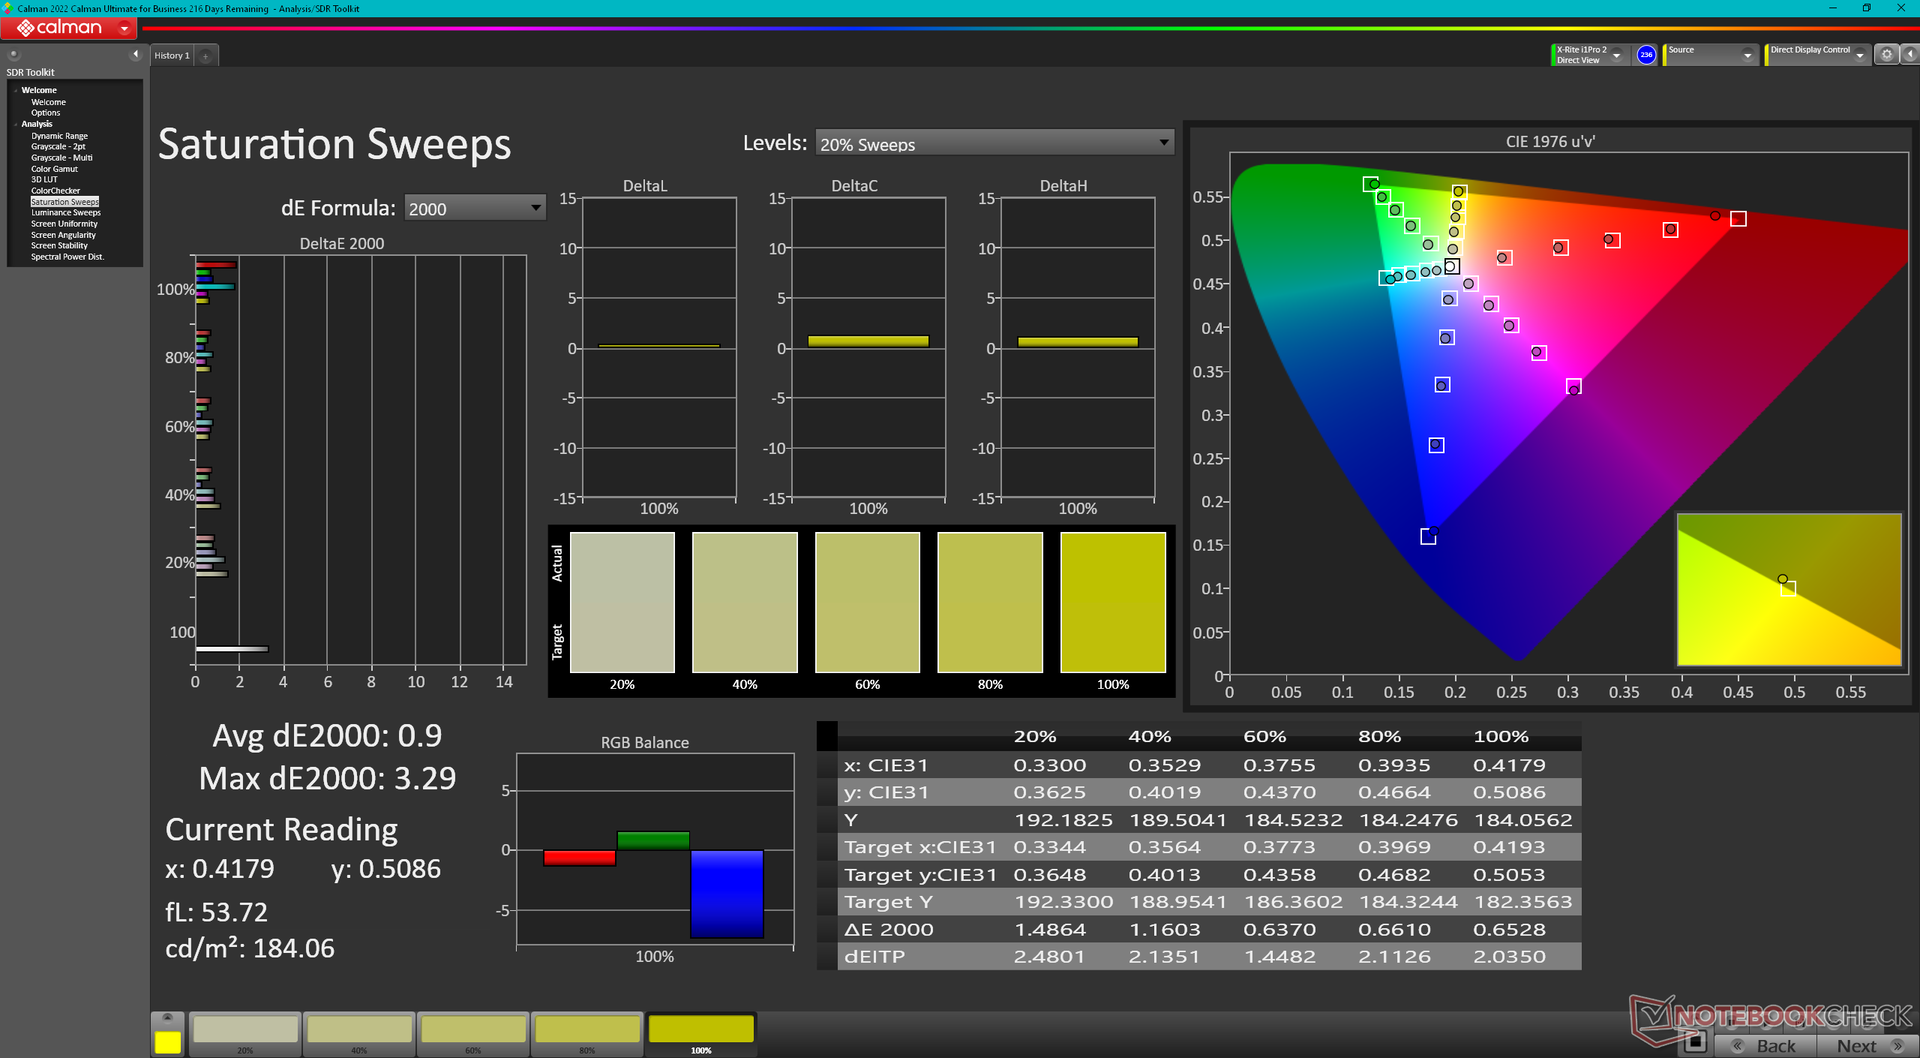
显示屏开箱后的校准效果很差。特别是色温在9571时太冷了,所以屏幕显得太蓝了。用X-Rite色度计自行校准显示器,可以将平均灰度和色彩deltaE值从9.9和6.97分别大幅提高到2.1和1.24。我们建议应用我们上面的校准过的ICM配置文件,以便从显示器中获得更多的sRGB准确的颜色。
Display Response Times
| ↔ Response Time Black to White | ||
|---|---|---|
| 20.9 ms ... rise ↗ and fall ↘ combined | ↗ 11.4 ms rise | 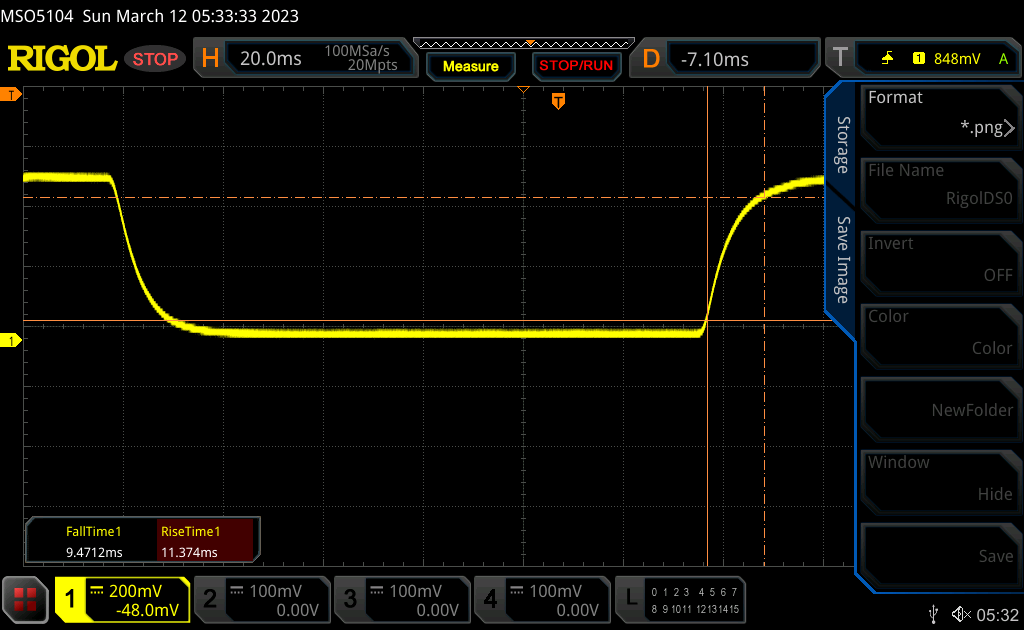 |
| ↘ 9.5 ms fall | ||
| The screen shows good response rates in our tests, but may be too slow for competitive gamers. In comparison, all tested devices range from 0.1 (minimum) to 240 (maximum) ms. » 47 % of all devices are better. This means that the measured response time is similar to the average of all tested devices (19.8 ms). | ||
| ↔ Response Time 50% Grey to 80% Grey | ||
| 26.8 ms ... rise ↗ and fall ↘ combined | ↗ 12.5 ms rise | 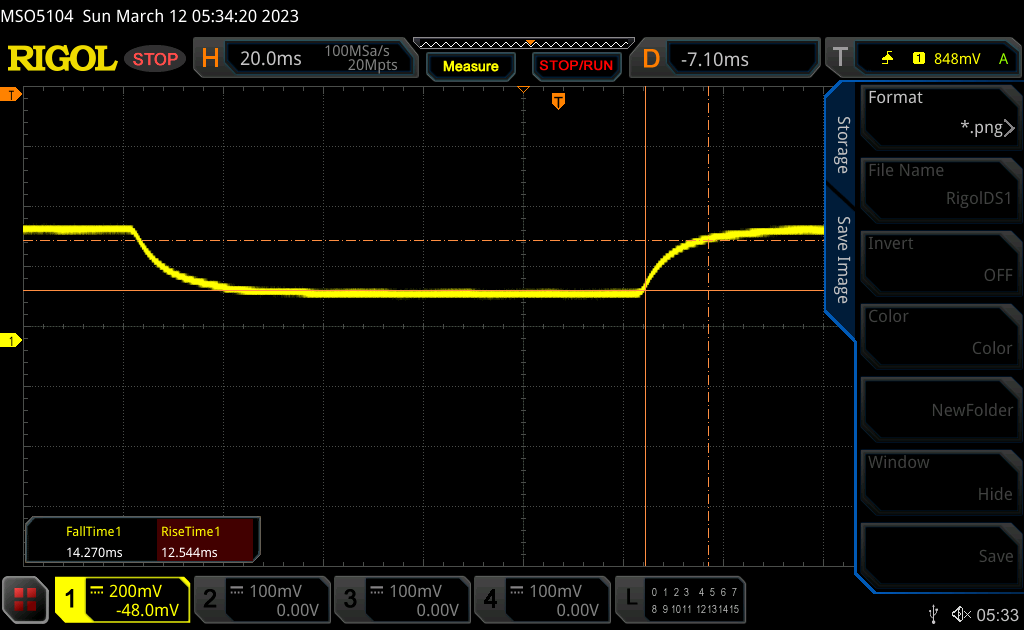 |
| ↘ 14.3 ms fall | ||
| The screen shows relatively slow response rates in our tests and may be too slow for gamers. In comparison, all tested devices range from 0.165 (minimum) to 636 (maximum) ms. » 37 % of all devices are better. This means that the measured response time is better than the average of all tested devices (31 ms). | ||
Screen Flickering / PWM (Pulse-Width Modulation)
| Screen flickering / PWM not detected | 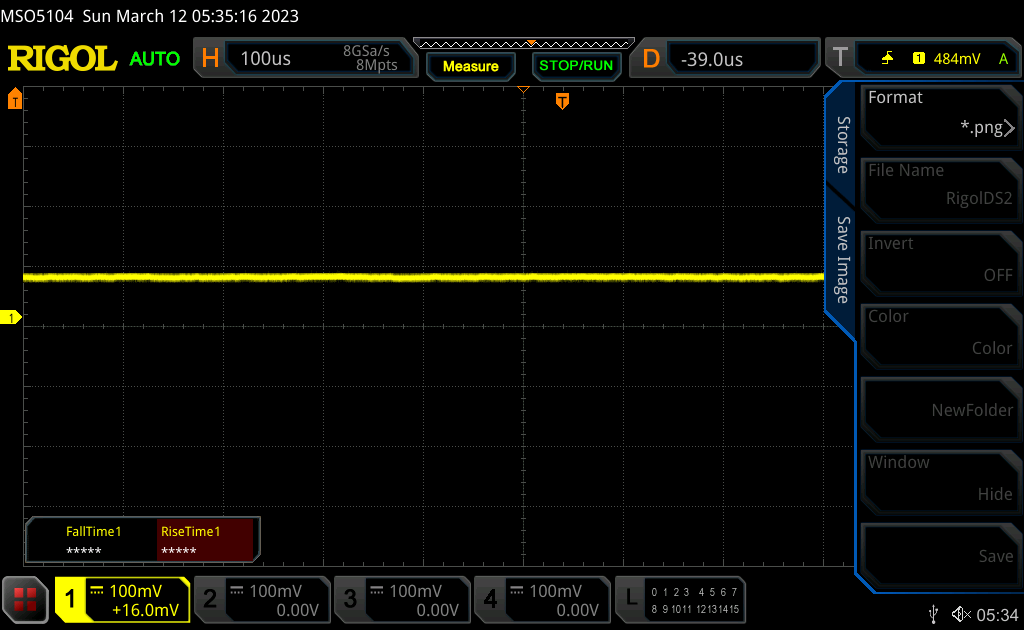 | ||
In comparison: 52 % of all tested devices do not use PWM to dim the display. If PWM was detected, an average of 7751 (minimum: 5 - maximum: 343500) Hz was measured. | |||
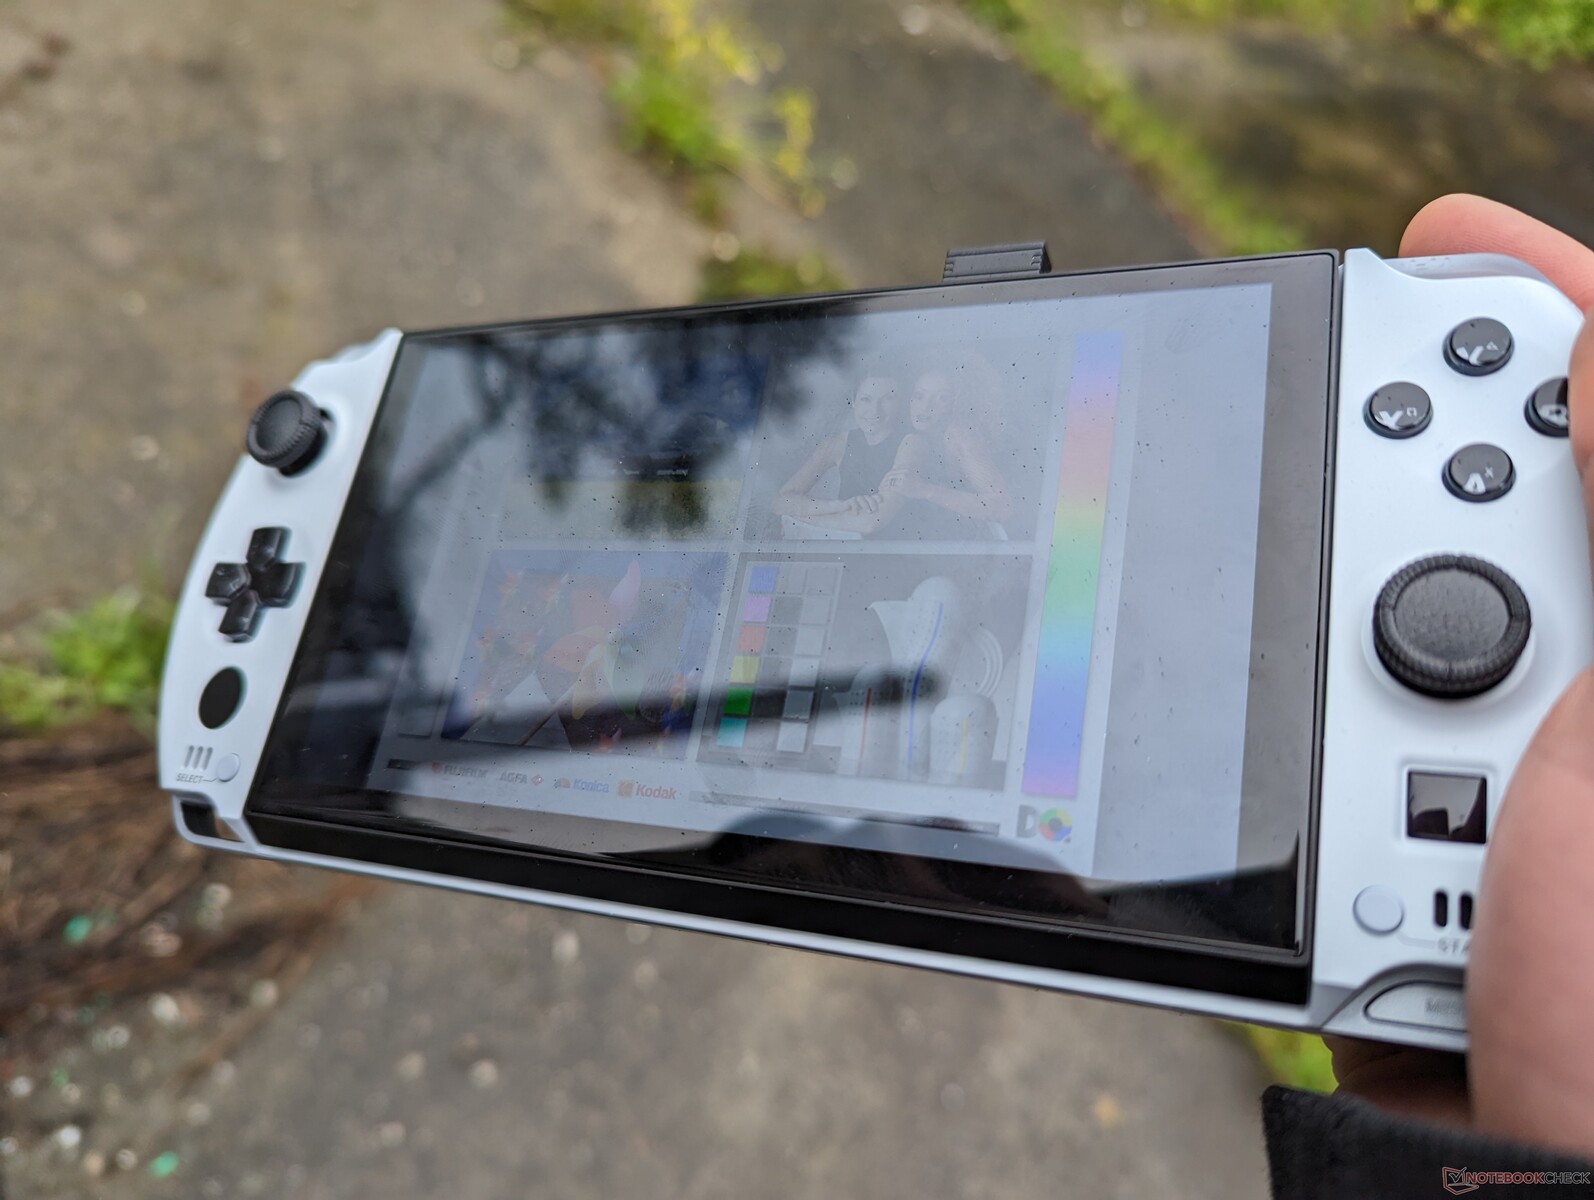
如果在阴凉处,户外能见度是相当好的。然而,如果再亮一点,光面屏幕的眩光就会成为一个问题。400尼特的屏幕并不像大多数流行的智能手机那样明亮,那里的显示屏可以达到1000尼特或者更高。
性能 - 与最新的超极本一样强大
测试条件
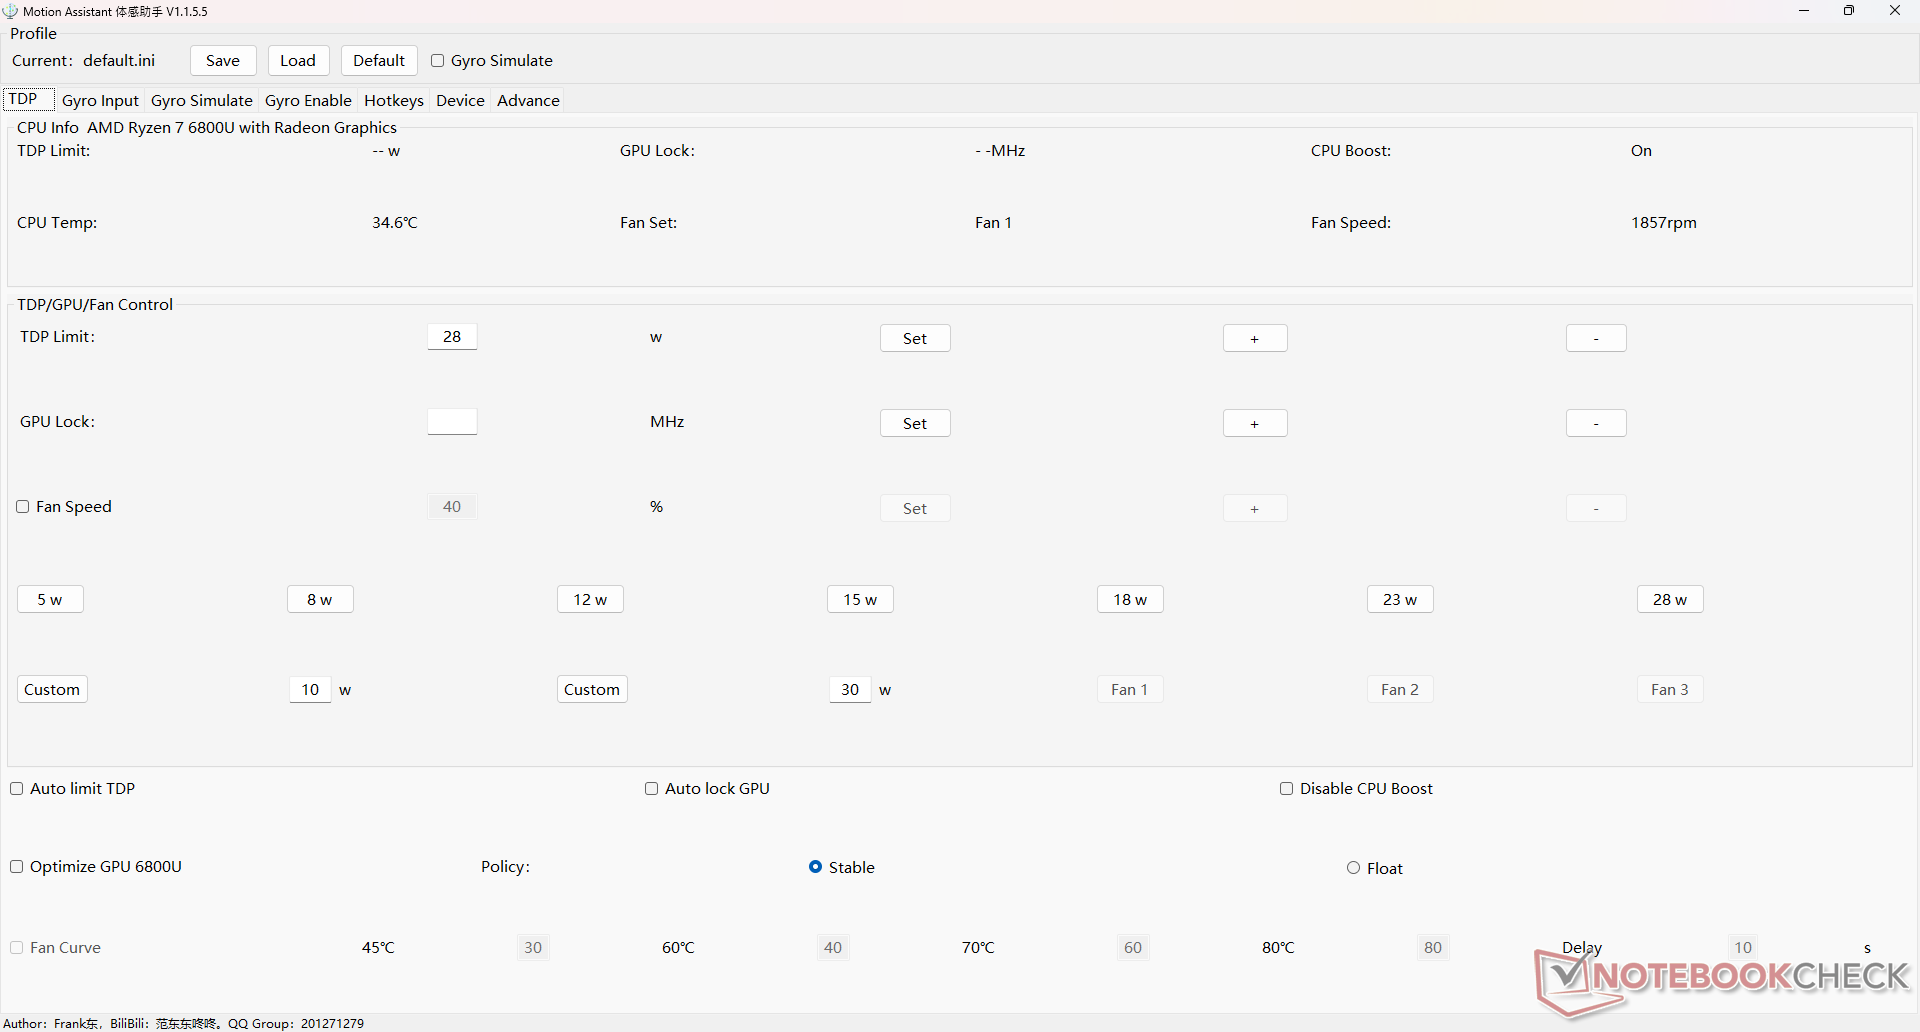
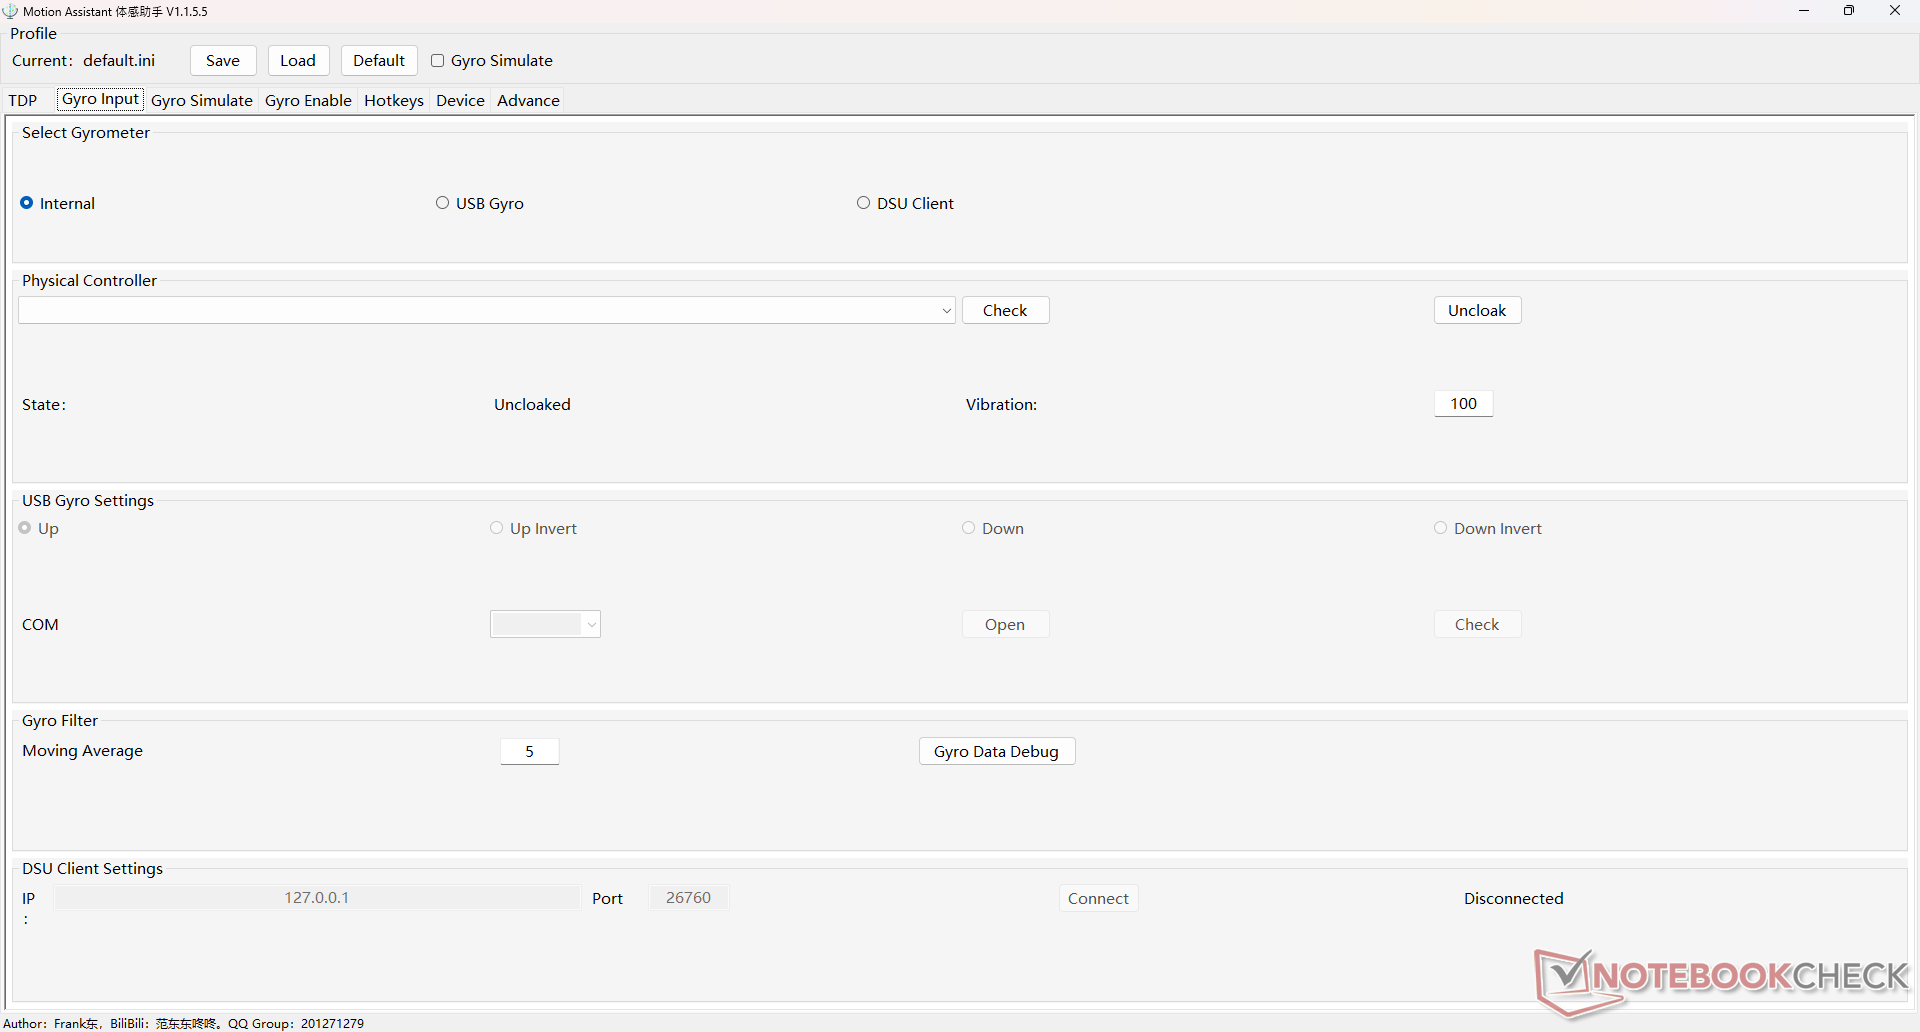
在运行以下任何基准测试之前,我们将Windows设置为性能模式,将Motion Assistant设置为28W。我们强烈建议用户习惯使用Motion Assistant,因为它是Win 4的控制中心软件。 下面的截图显示了Motion Assistant提供的选项。
处理器
的 Ryzen 7 6800U是市场上最快的U系列处理器之一。它是为许多最新超极本提供动力的相同CPU,包括联想Yoga 7 14 或惠普EliteBook 845 G9.原始多线程性能比Core i5-1135G7快2倍以上。酷睿i5-1135G7在上一代GPD Win 3中。
然而,性能的可持续性,可以更好一点。循环运行CineBench R15 xT会导致初始得分1776分,然后稳步下降并稳定在18%的性能赤字上。这款华硕Zenbook S13携带相同的CPU,能够在更长时间内保持更高的时钟速率。
Cinebench R15 Multi Loop
Cinebench R23: Multi Core | Single Core
Cinebench R20: CPU (Multi Core) | CPU (Single Core)
Cinebench R15: CPU Multi 64Bit | CPU Single 64Bit
Blender: v2.79 BMW27 CPU
7-Zip 18.03: 7z b 4 | 7z b 4 -mmt1
Geekbench 5.5: Multi-Core | Single-Core
HWBOT x265 Benchmark v2.2: 4k Preset
LibreOffice : 20 Documents To PDF
R Benchmark 2.5: Overall mean
* ... smaller is better
AIDA64: FP32 Ray-Trace | FPU Julia | CPU SHA3 | CPU Queen | FPU SinJulia | FPU Mandel | CPU AES | CPU ZLib | FP64 Ray-Trace | CPU PhotoWorxx
| Performance rating | |
| Average AMD Ryzen 7 6800U | |
| GPD Win 4 | |
| Asus Zenbook S 13 OLED | |
| Dell XPS 13 9315 2-in-1 Core i5-1230U | |
| GPD Win Max 2 | |
| AIDA64 / FP32 Ray-Trace | |
| Average AMD Ryzen 7 6800U (10902 - 12818, n=6) | |
| GPD Win 4 | |
| Asus Zenbook S 13 OLED | |
| Dell XPS 13 9315 2-in-1 Core i5-1230U | |
| GPD Win Max 2 | |
| AIDA64 / FPU Julia | |
| Average AMD Ryzen 7 6800U (67503 - 84031, n=6) | |
| GPD Win 4 | |
| Asus Zenbook S 13 OLED | |
| Dell XPS 13 9315 2-in-1 Core i5-1230U | |
| GPD Win Max 2 | |
| AIDA64 / CPU SHA3 | |
| Average AMD Ryzen 7 6800U (2296 - 2818, n=6) | |
| GPD Win 4 | |
| Asus Zenbook S 13 OLED | |
| Dell XPS 13 9315 2-in-1 Core i5-1230U | |
| GPD Win Max 2 | |
| AIDA64 / CPU Queen | |
| GPD Win 4 | |
| Average AMD Ryzen 7 6800U (62082 - 96306, n=6) | |
| Asus Zenbook S 13 OLED | |
| GPD Win Max 2 | |
| Dell XPS 13 9315 2-in-1 Core i5-1230U | |
| AIDA64 / FPU SinJulia | |
| GPD Win 4 | |
| Average AMD Ryzen 7 6800U (7753 - 11982, n=6) | |
| Asus Zenbook S 13 OLED | |
| GPD Win Max 2 | |
| Dell XPS 13 9315 2-in-1 Core i5-1230U | |
| AIDA64 / FPU Mandel | |
| Average AMD Ryzen 7 6800U (37417 - 45748, n=6) | |
| GPD Win 4 | |
| Asus Zenbook S 13 OLED | |
| Dell XPS 13 9315 2-in-1 Core i5-1230U | |
| GPD Win Max 2 | |
| AIDA64 / CPU AES | |
| GPD Win 4 | |
| Asus Zenbook S 13 OLED | |
| Average AMD Ryzen 7 6800U (50547 - 115681, n=6) | |
| GPD Win Max 2 | |
| Dell XPS 13 9315 2-in-1 Core i5-1230U | |
| AIDA64 / CPU ZLib | |
| Average AMD Ryzen 7 6800U (554 - 755, n=6) | |
| GPD Win 4 | |
| Asus Zenbook S 13 OLED | |
| GPD Win Max 2 | |
| Dell XPS 13 9315 2-in-1 Core i5-1230U | |
| AIDA64 / FP64 Ray-Trace | |
| Average AMD Ryzen 7 6800U (5825 - 6694, n=6) | |
| GPD Win 4 | |
| Asus Zenbook S 13 OLED | |
| Dell XPS 13 9315 2-in-1 Core i5-1230U | |
| GPD Win Max 2 | |
| AIDA64 / CPU PhotoWorxx | |
| Dell XPS 13 9315 2-in-1 Core i5-1230U | |
| GPD Win Max 2 | |
| GPD Win 4 | |
| Average AMD Ryzen 7 6800U (24728 - 27274, n=6) | |
| Asus Zenbook S 13 OLED | |
系统性能
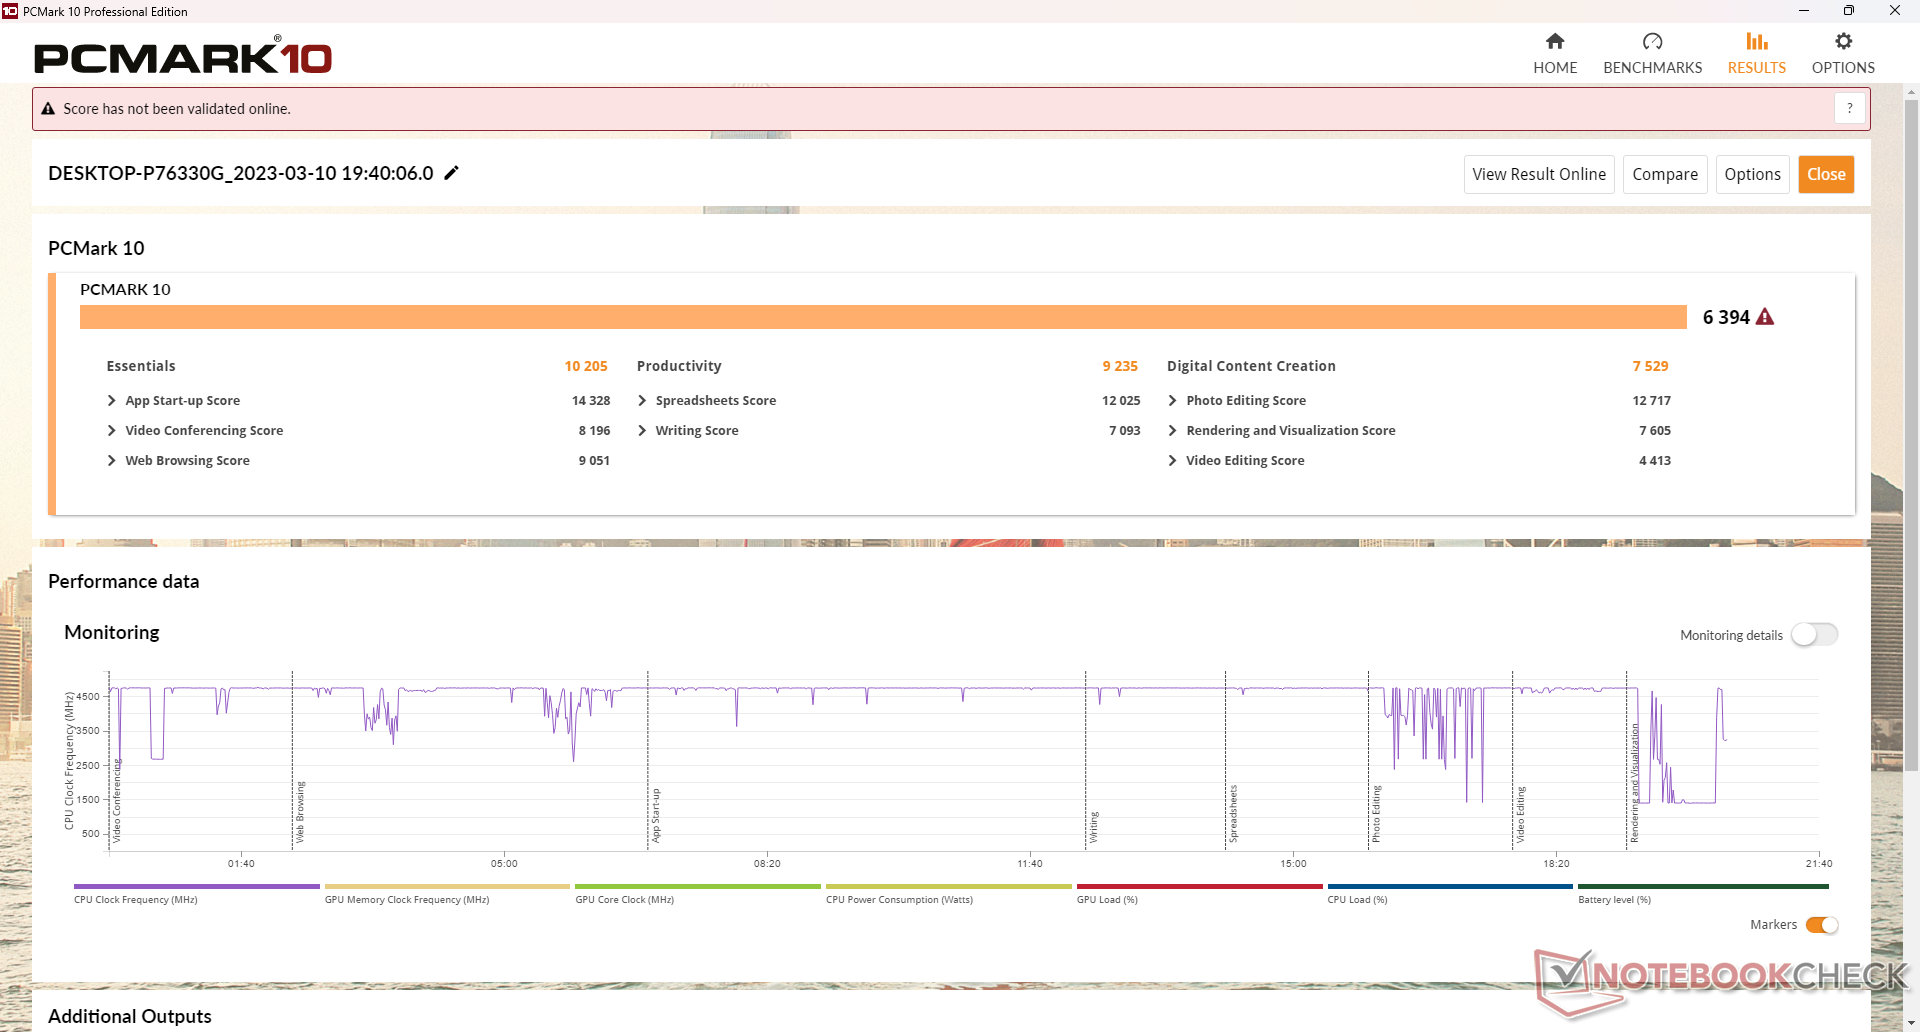
PCMark 10的结果与最新的U系列动力超极本相当,同时远远领先于老款的Win 3。
CrossMark: Overall | Productivity | Creativity | Responsiveness
| PCMark 10 / Score | |
| GPD Win 4 | |
| Asus Zenbook S 13 OLED | |
| Average AMD Ryzen 7 6800U, AMD Radeon 680M (5057 - 6639, n=7) | |
| Razer Blade Stealth i7-1165G7 GTX 1650 Ti Max-Q | |
| GPD Win Max 2 | |
| Dell XPS 13 9315 2-in-1 Core i5-1230U | |
| GPD Win 3 | |
| PCMark 10 / Essentials | |
| GPD Win Max 2 | |
| Asus Zenbook S 13 OLED | |
| GPD Win 4 | |
| Dell XPS 13 9315 2-in-1 Core i5-1230U | |
| Average AMD Ryzen 7 6800U, AMD Radeon 680M (8143 - 10766, n=6) | |
| GPD Win 3 | |
| Razer Blade Stealth i7-1165G7 GTX 1650 Ti Max-Q | |
| PCMark 10 / Productivity | |
| GPD Win 4 | |
| Asus Zenbook S 13 OLED | |
| Razer Blade Stealth i7-1165G7 GTX 1650 Ti Max-Q | |
| Average AMD Ryzen 7 6800U, AMD Radeon 680M (6089 - 9328, n=6) | |
| GPD Win Max 2 | |
| Dell XPS 13 9315 2-in-1 Core i5-1230U | |
| GPD Win 3 | |
| PCMark 10 / Digital Content Creation | |
| GPD Win 4 | |
| Average AMD Ryzen 7 6800U, AMD Radeon 680M (6066 - 8144, n=6) | |
| Asus Zenbook S 13 OLED | |
| Razer Blade Stealth i7-1165G7 GTX 1650 Ti Max-Q | |
| GPD Win Max 2 | |
| Dell XPS 13 9315 2-in-1 Core i5-1230U | |
| GPD Win 3 | |
| CrossMark / Overall | |
| GPD Win Max 2 | |
| GPD Win 4 | |
| Asus Zenbook S 13 OLED | |
| Average AMD Ryzen 7 6800U, AMD Radeon 680M (1009 - 1575, n=7) | |
| Dell XPS 13 9315 2-in-1 Core i5-1230U | |
| CrossMark / Productivity | |
| GPD Win Max 2 | |
| GPD Win 4 | |
| Asus Zenbook S 13 OLED | |
| Average AMD Ryzen 7 6800U, AMD Radeon 680M (971 - 1596, n=7) | |
| Dell XPS 13 9315 2-in-1 Core i5-1230U | |
| CrossMark / Creativity | |
| GPD Win Max 2 | |
| GPD Win 4 | |
| Asus Zenbook S 13 OLED | |
| Average AMD Ryzen 7 6800U, AMD Radeon 680M (1054 - 1686, n=7) | |
| Dell XPS 13 9315 2-in-1 Core i5-1230U | |
| CrossMark / Responsiveness | |
| GPD Win Max 2 | |
| GPD Win 4 | |
| Average AMD Ryzen 7 6800U, AMD Radeon 680M (994 - 1473, n=7) | |
| Asus Zenbook S 13 OLED | |
| Dell XPS 13 9315 2-in-1 Core i5-1230U | |
| PCMark 10 Score | 6394 points | |
Help | ||
| AIDA64 / Memory Copy | |
| GPD Win Max 2 | |
| Dell XPS 13 9315 2-in-1 Core i5-1230U | |
| GPD Win 4 | |
| Average AMD Ryzen 7 6800U (47010 - 52159, n=6) | |
| Asus Zenbook S 13 OLED | |
| AIDA64 / Memory Read | |
| GPD Win Max 2 | |
| Dell XPS 13 9315 2-in-1 Core i5-1230U | |
| GPD Win 4 | |
| Average AMD Ryzen 7 6800U (39197 - 45084, n=6) | |
| Asus Zenbook S 13 OLED | |
| AIDA64 / Memory Write | |
| Dell XPS 13 9315 2-in-1 Core i5-1230U | |
| GPD Win Max 2 | |
| GPD Win 4 | |
| Average AMD Ryzen 7 6800U (48723 - 51117, n=6) | |
| Asus Zenbook S 13 OLED | |
| AIDA64 / Memory Latency | |
| Asus Zenbook S 13 OLED | |
| Average AMD Ryzen 7 6800U (106.3 - 123.1, n=6) | |
| GPD Win 4 | |
| GPD Win Max 2 | |
| Dell XPS 13 9315 2-in-1 Core i5-1230U | |
* ... smaller is better
DPC延时
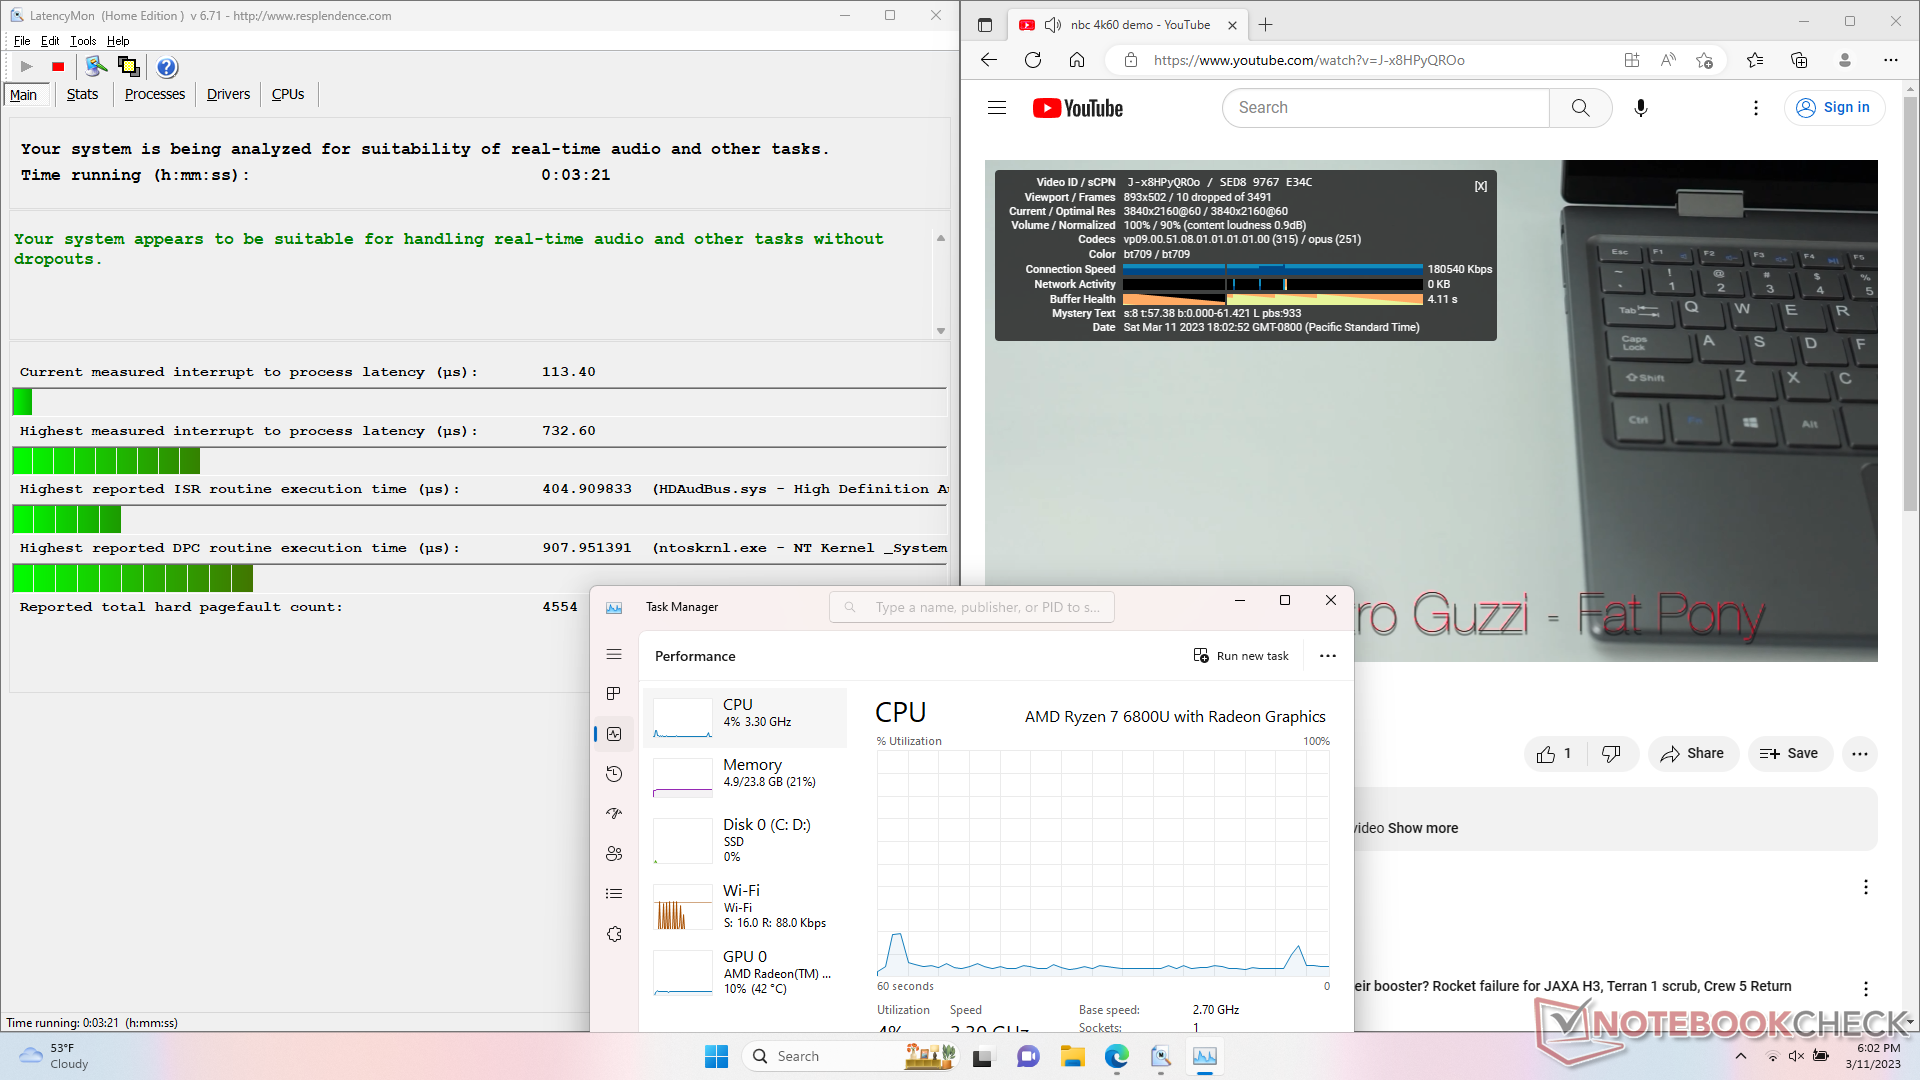
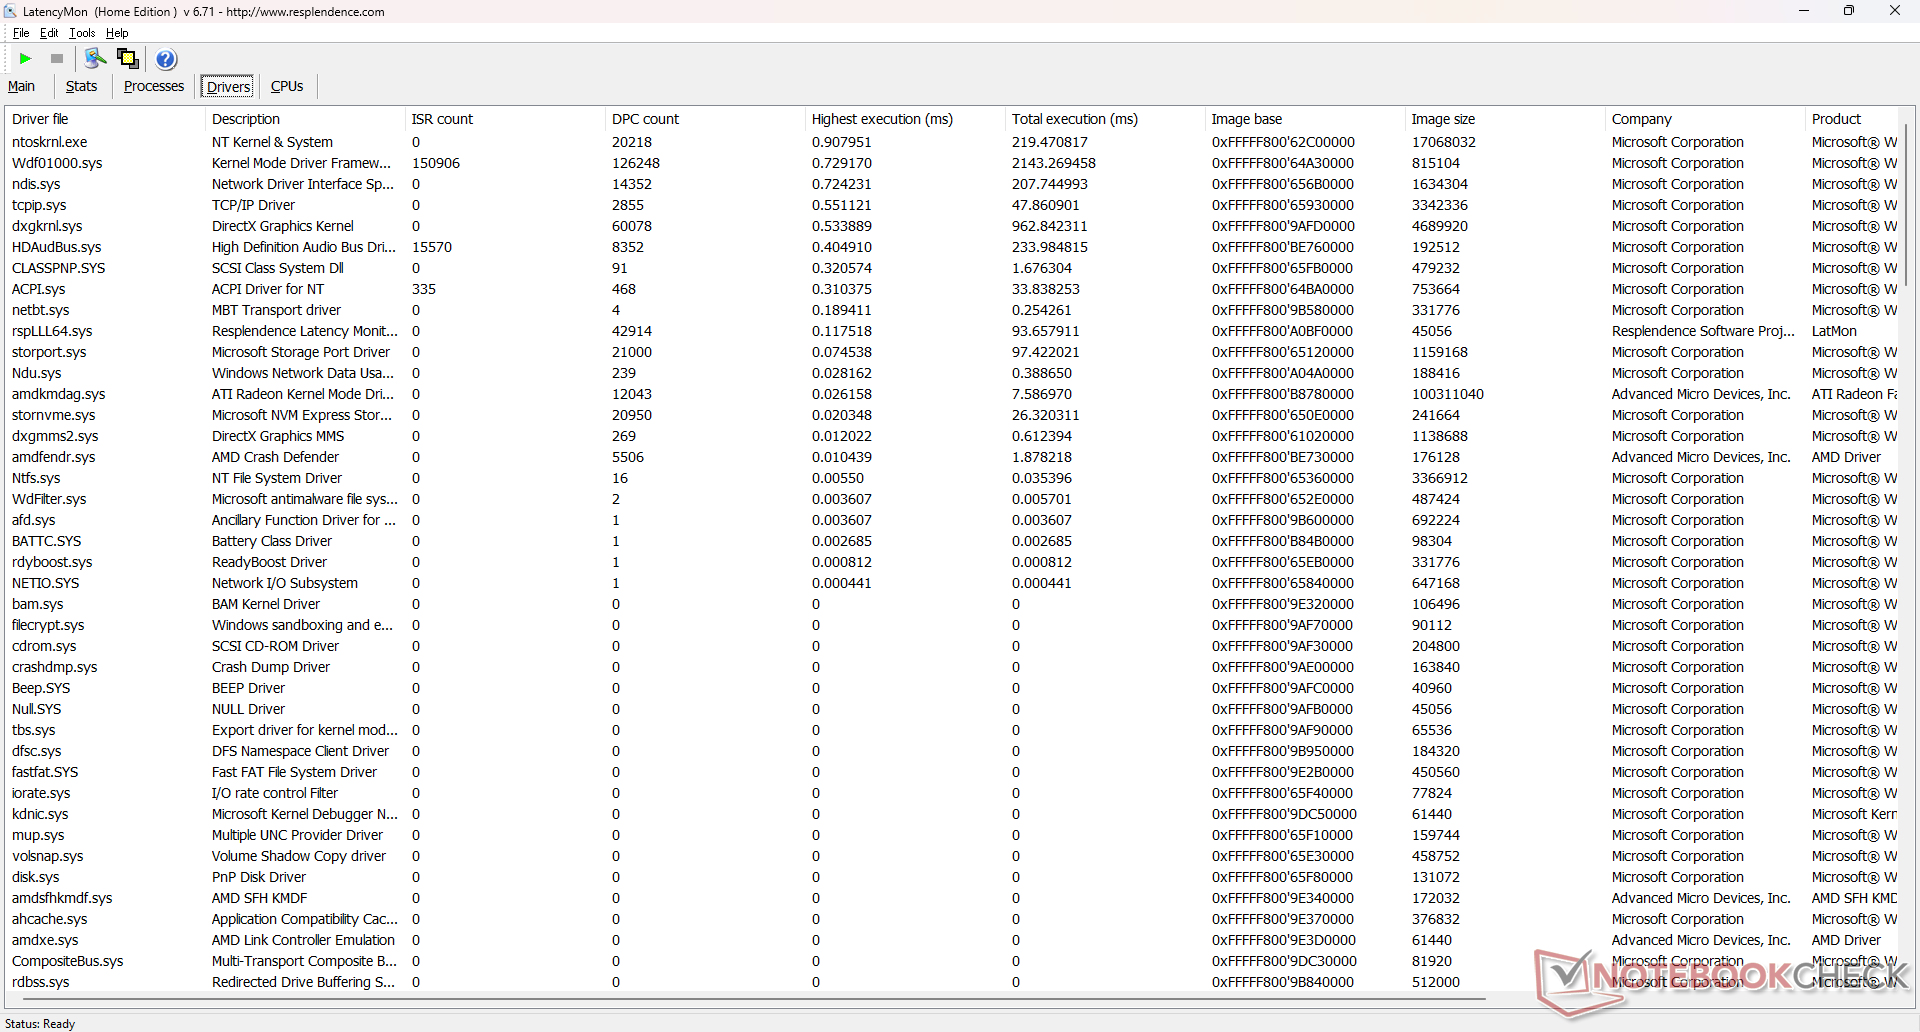
LatencyMon显示,在打开我们主页的多个浏览器标签时,没有重大的DPC问题。然而,在我们的4K60视频播放测试中,即使经过多次重试,我们也能记录到一些丢帧。掉帧的情况并不频繁,而且大多不引人注意,但考虑到底层硬件,它们根本不应该发生。
| DPC Latencies / LatencyMon - interrupt to process latency (max), Web, Youtube, Prime95 | |
| Dell XPS 13 9315 2-in-1 Core i5-1230U | |
| Razer Blade Stealth i7-1165G7 GTX 1650 Ti Max-Q | |
| GPD Win 3 | |
| GPD Win 4 | |
| Asus Zenbook S 13 OLED | |
| GPD Win Max 2 | |
* ... smaller is better
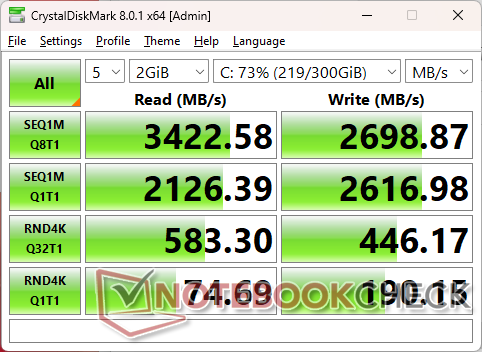
存储设备
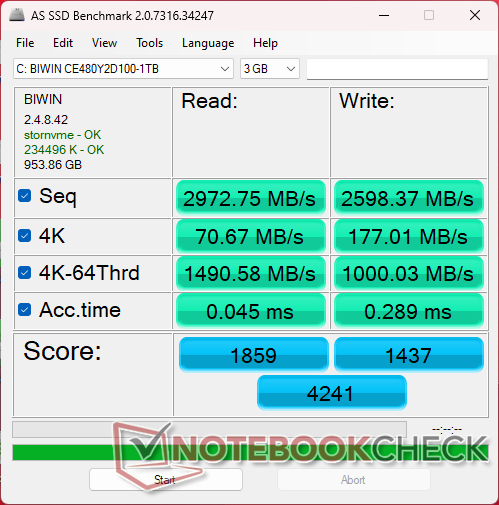
虽然主板芯片组支持PCIe4 x4 M.2 2280 NVMe驱动器,但该设备配备的是较慢的PCIe3驱动器。这不是一个问题,因为该模型没有为固态硬盘提供散热器,所以快速的PCIe4 x4驱动器在压力下很可能会节流。这款 1TB Biwin PCIe3 SSD在我们的设备中没有表现出随时间推移的性能节流。

| Drive Performance rating - Percent | |
| Asus Zenbook S 13 OLED | |
| GPD Win Max 2 | |
| GPD Win 4 | |
| GPD Win 3 | |
| Razer Blade Stealth i7-1165G7 GTX 1650 Ti Max-Q | |
| Dell XPS 13 9315 2-in-1 Core i5-1230U | |
* ... smaller is better
Disk Throttling: DiskSpd Read Loop, Queue Depth 8
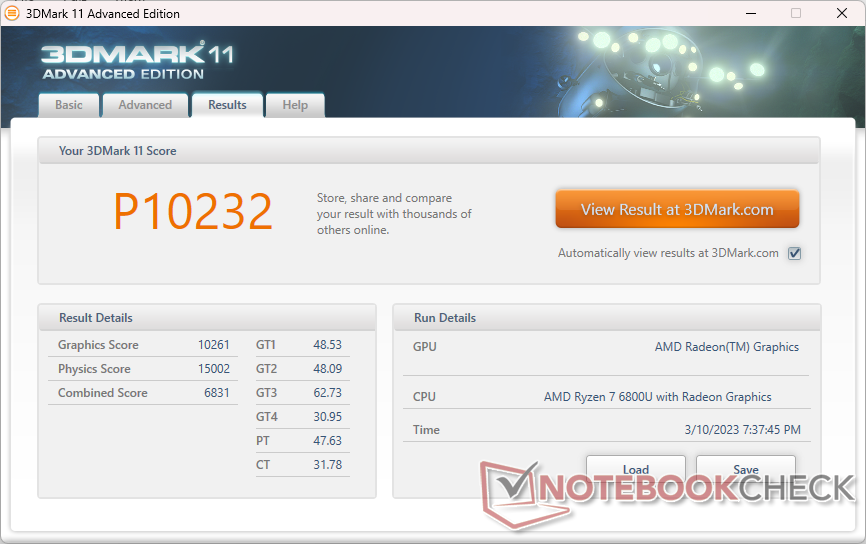
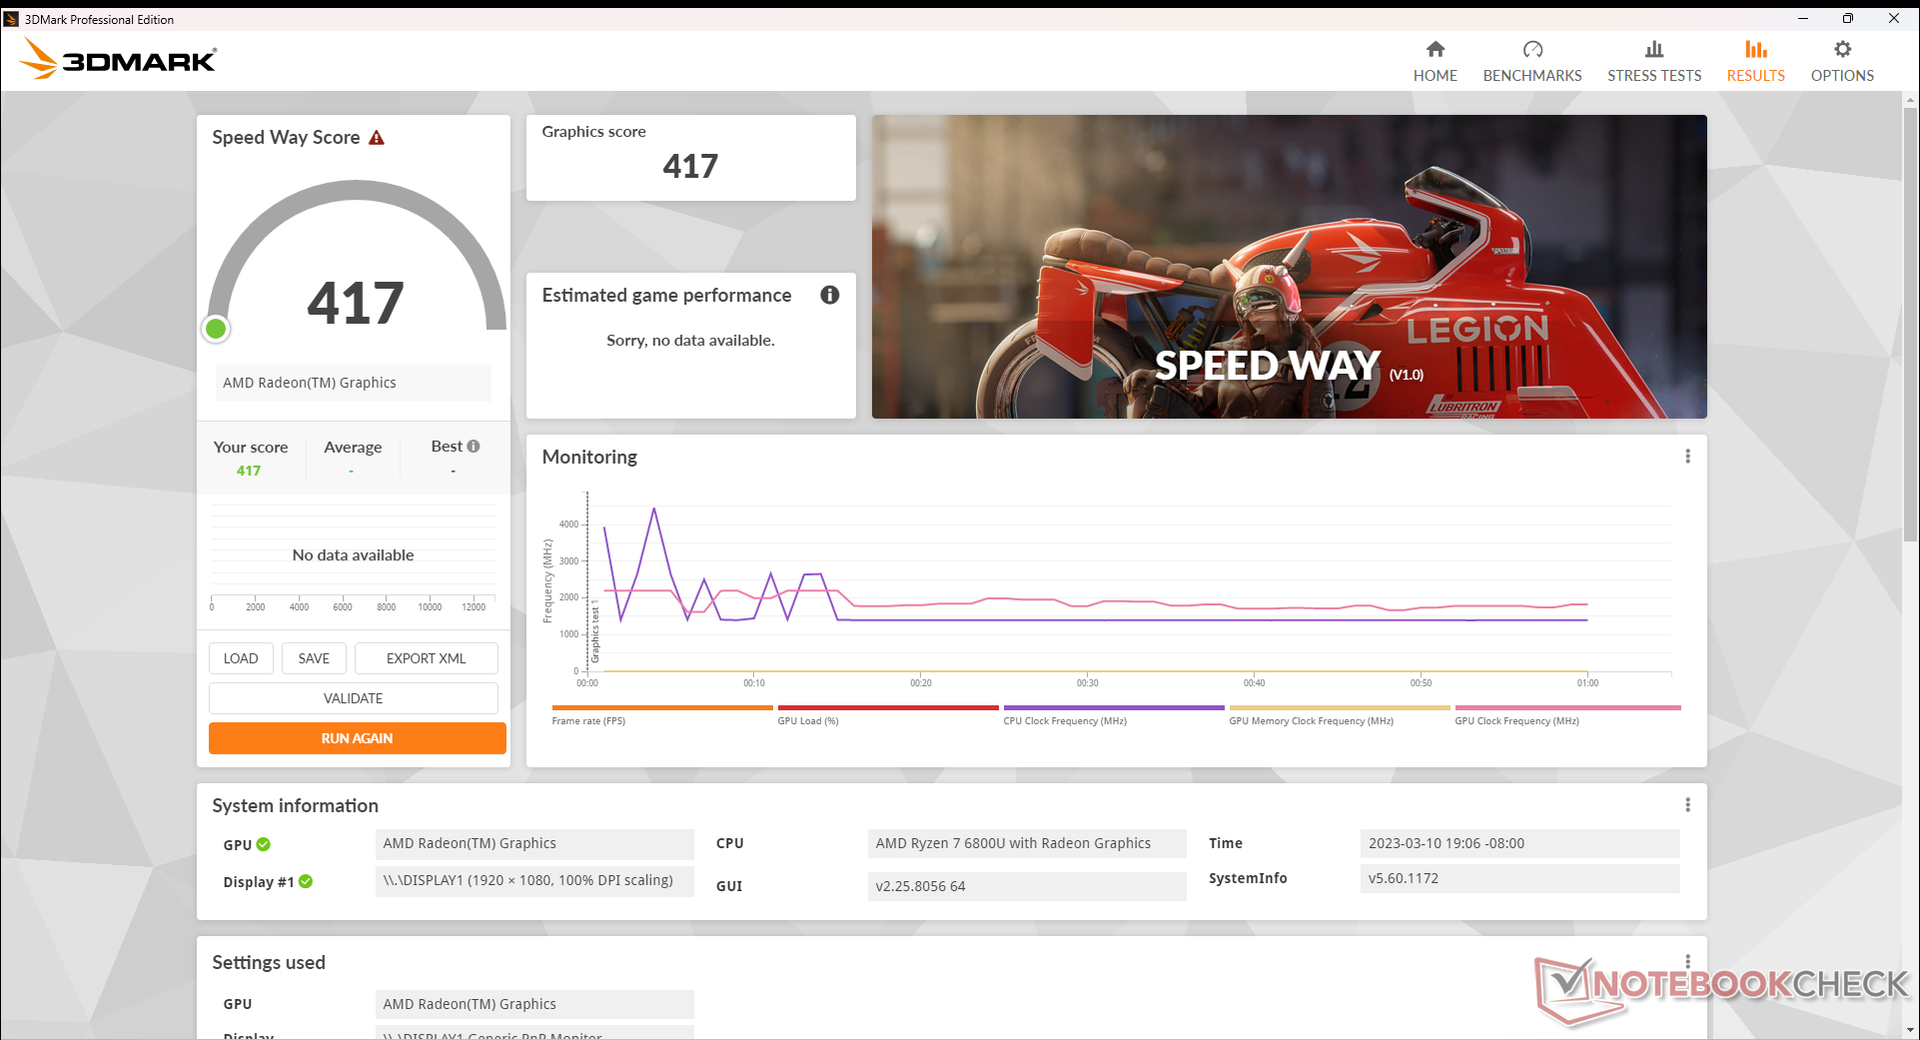
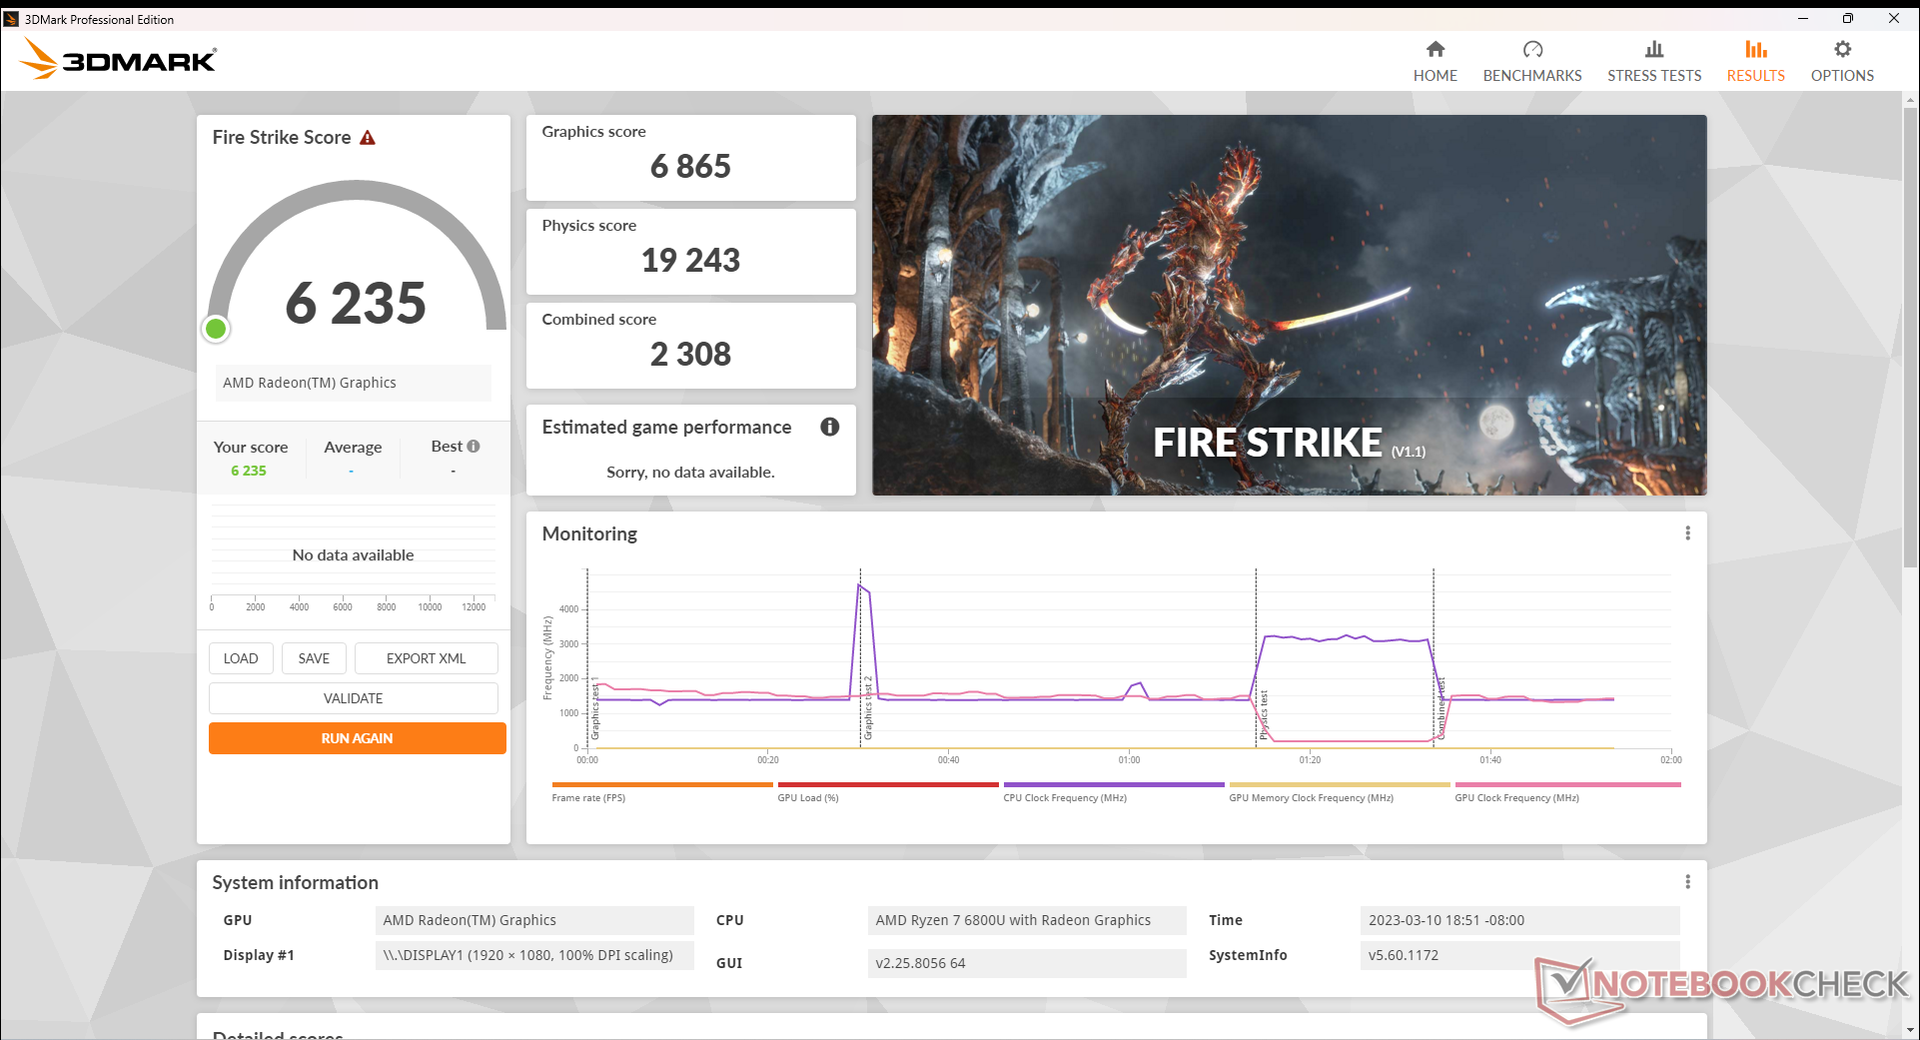
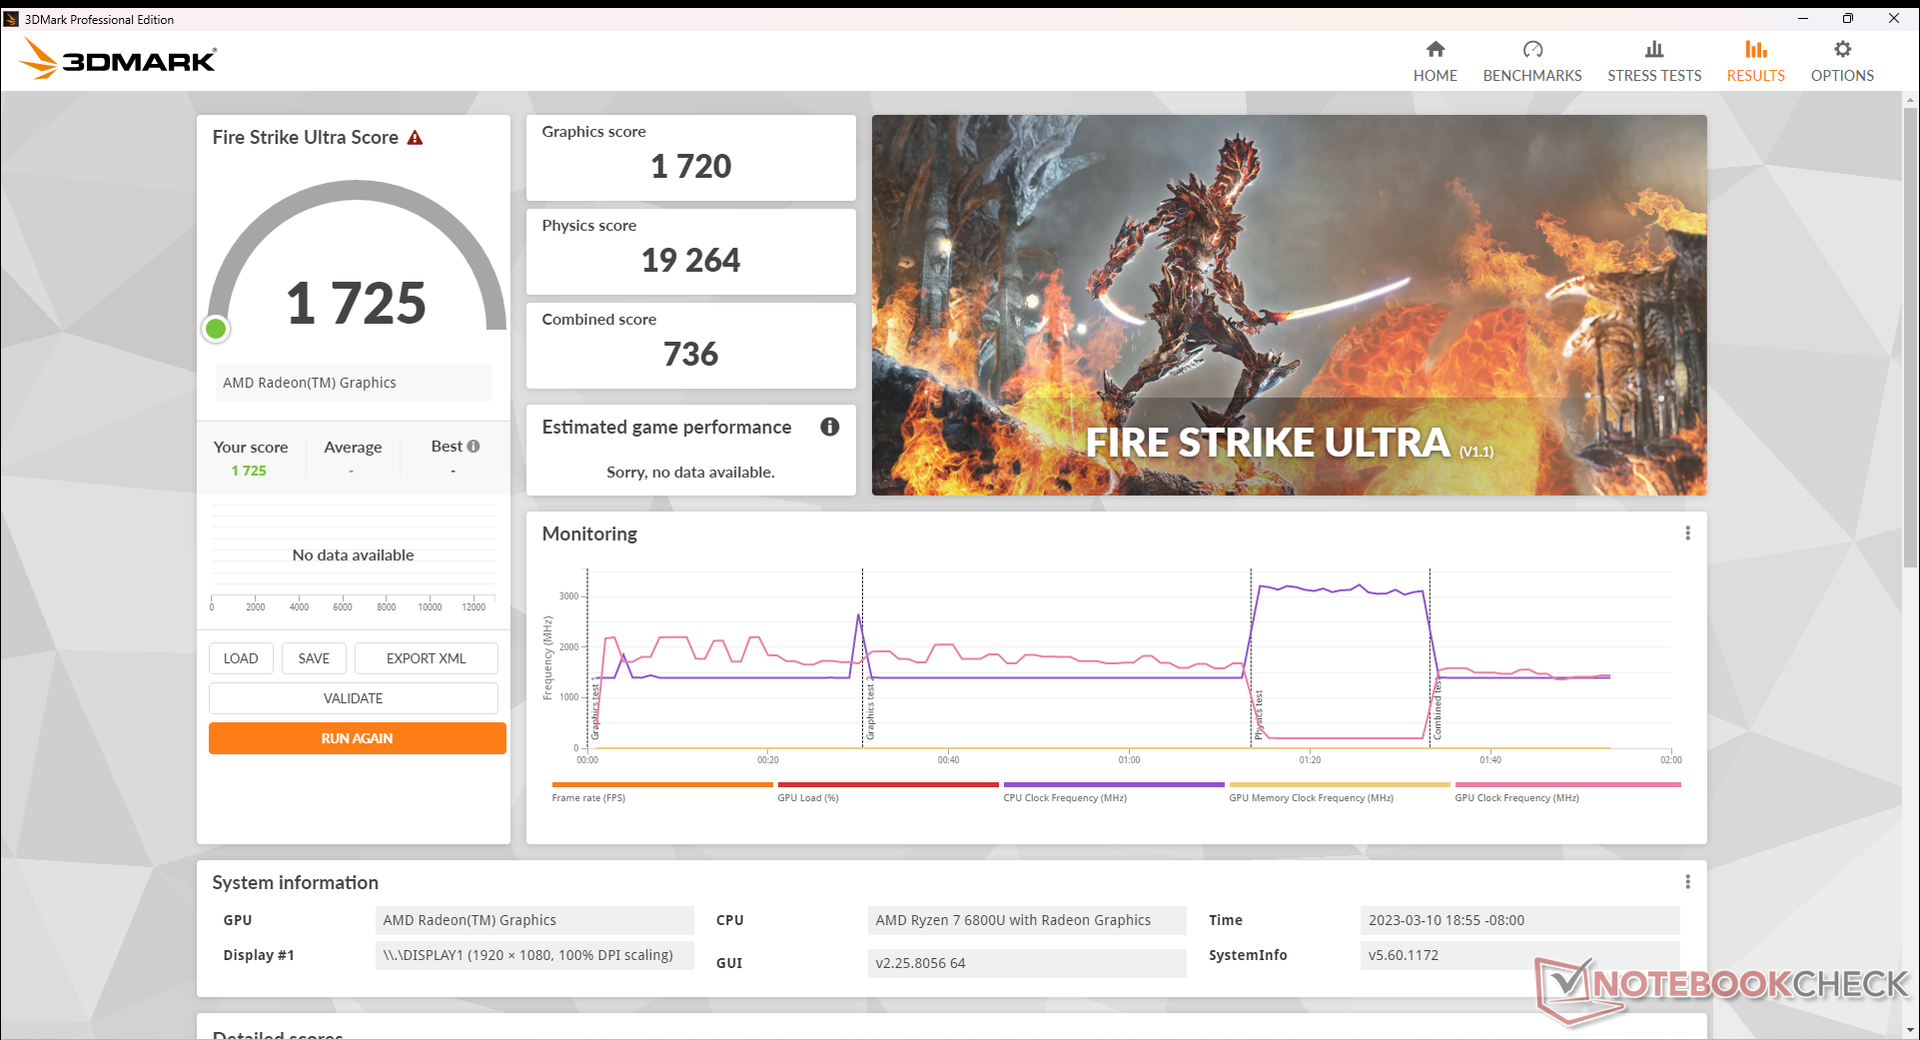
GPU性能--Radeon 680M在掌上游戏中表现出色
芯片 Radeon 680M是目前市场上最快的集成GPU。当与竞争者的Iris Xe Graphics G7 96EUs相比,AMD的解决方案要快40%到45%,或者说比上一代产品快大约80%。 Radeon RX Vega 8系列.
大多数游戏在1080p的原始分辨率下是可以玩的(>30 FPS),甚至包括像《赛博朋克2077》或《最终幻想15》这样要求较低的设置。我们建议降低纹理质量和/或抗锯齿来提高帧率,因为这些图形功能对小屏幕屏幕尺寸的影响要小得多。
| 3DMark 11 - 1280x720 Performance GPU | |
| MSI RTX 2060 Gaming Z 6G | |
| Desktop PC Intel Xeon E5 2680v4 KFA2 GTX 1060 6GB | |
| Lenovo Slim 7 Pro X 14ARH7 | |
| Razer Blade Stealth i7-1165G7 GTX 1650 Ti Max-Q | |
| GPD Win 4 | |
| Average AMD Radeon 680M (6858 - 11755, n=39) | |
| Asus Zenbook S 13 OLED | |
| GPD Win Max 2 | |
| HP Spectre x360 2-in-1 16-f1075ng | |
| HP Spectre x360 13.5 14t-ef000 | |
| GPD Win 3 | |
| HP Pavilion Aero 13 be0097nr | |
| Infinix INBook X2 | |
| Dell XPS 13 9315 2-in-1 Core i5-1230U | |
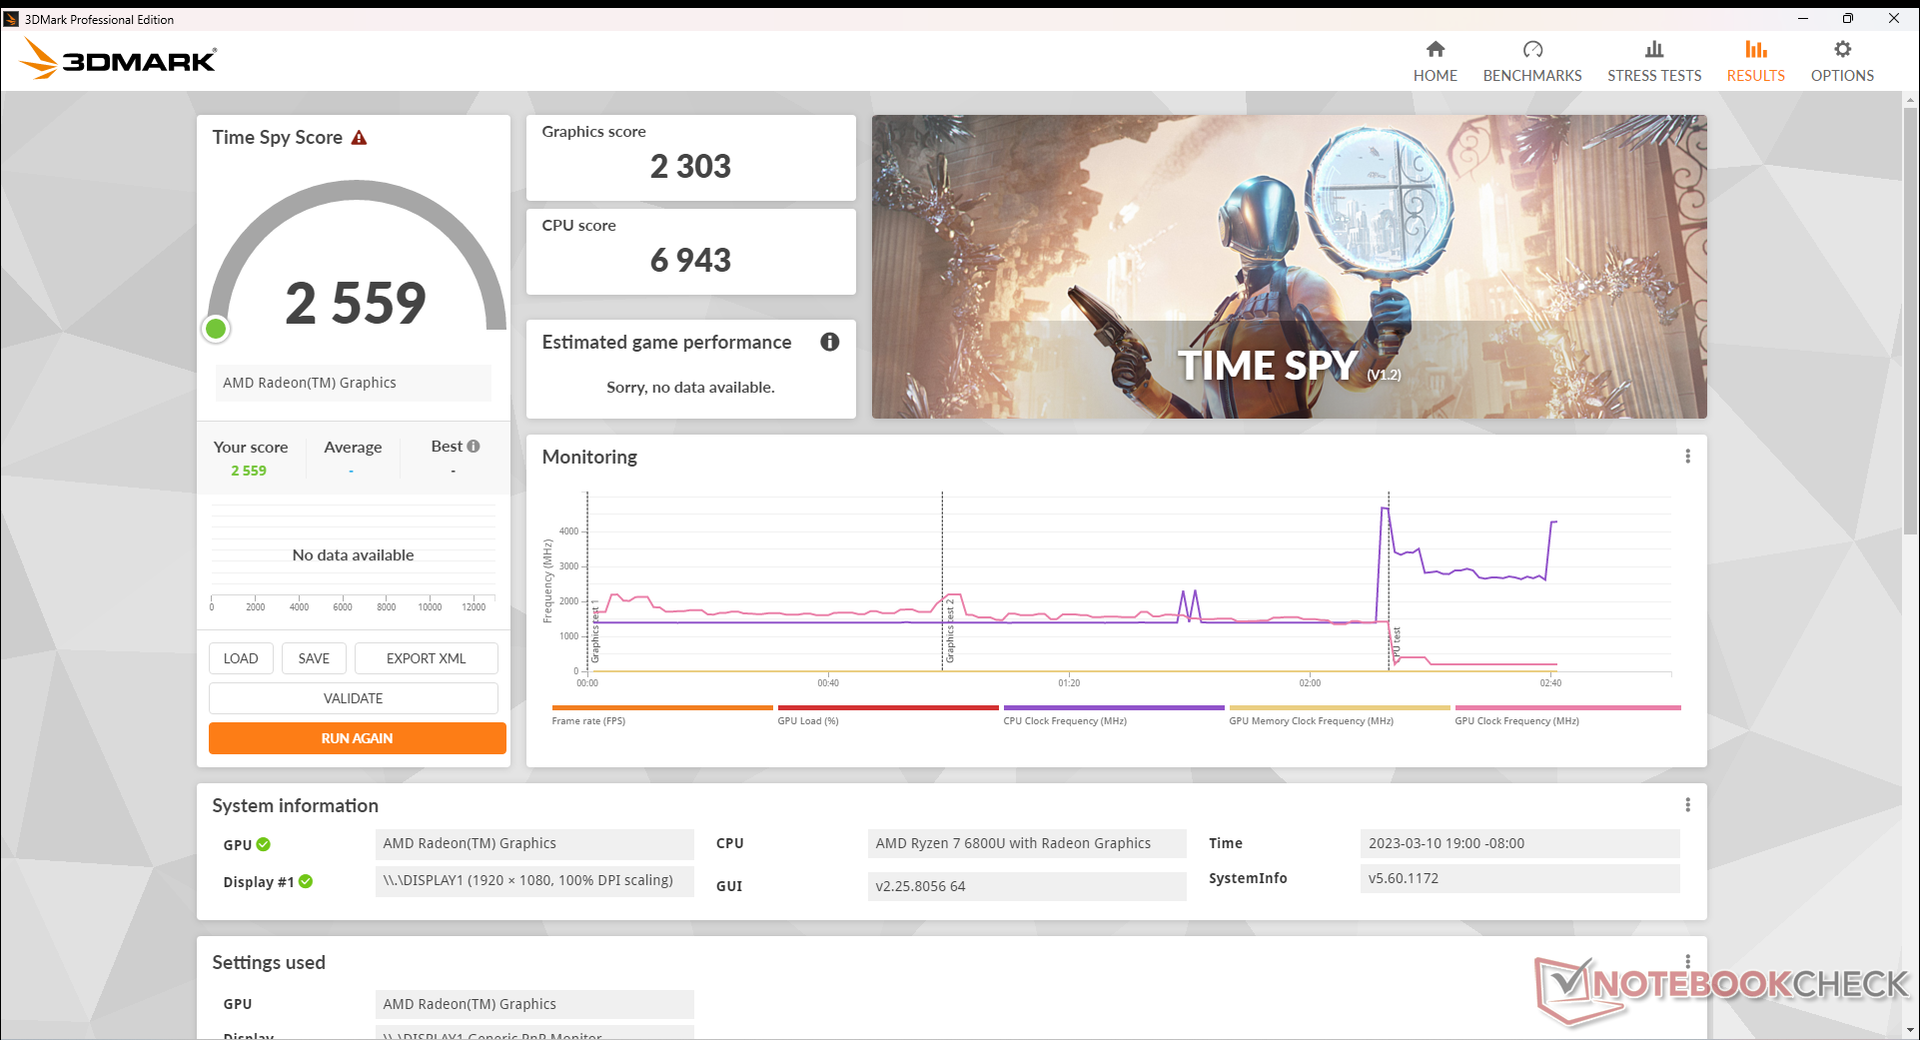
| 3DMark 11 Performance | 10232 points | |
| 3DMark Fire Strike Score | 6235 points | |
| 3DMark Time Spy Score | 2559 points | |
Help | ||
| Blender | |
| v3.3 Classroom HIP/AMD | |
| Average AMD Radeon 680M (270 - 555, n=34) | |
| GPD Win 4 | |
| v3.3 Classroom OPTIX/RTX | |
| Lenovo Slim 7 Pro X 14ARH7 | |
| MSI Summit E16 Flip A12UDT-031 | |
| v3.3 Classroom CUDA | |
| Lenovo Slim 7 Pro X 14ARH7 | |
| MSI Summit E16 Flip A12UDT-031 | |
| v3.3 Classroom CPU | |
| Dell XPS 13 9315 2-in-1 Core i5-1230U | |
| HP Spectre x360 13.5 14t-ef000 | |
| MSI Summit E16 Flip A12UDT-031 | |
| GPD Win 4 | |
| Average AMD Radeon 680M (389 - 980, n=37) | |
| HP Spectre x360 2-in-1 16-f1075ng | |
| Lenovo Slim 7 Pro X 14ARH7 | |
* ... smaller is better
| The Witcher 3 - 1920x1080 Ultra Graphics & Postprocessing (HBAO+) | |
| MSI Summit E16 Flip A12UDT-031 | |
| Lenovo Slim 7 Pro X 14ARH7 | |
| Razer Blade Stealth i7-1165G7 GTX 1650 Ti Max-Q | |
| Asus Zenbook S 13 OLED | |
| GPD Win 4 | |
| HP Pavilion Aero 13 be0097nr | |
| HP Spectre x360 13.5 14t-ef000 | |
| GPD Win Max 2 | |
| GPD Win 3 | |
| HP Spectre x360 2-in-1 16-f1075ng | |
| Infinix INBook X2 | |
| Dell XPS 13 9315 2-in-1 Core i5-1230U | |
| F1 22 | |
| 1280x720 Ultra Low Preset AA:T AF:16x | |
| GPD Win 4 | |
| Average AMD Radeon 680M (75.5 - 147.3, n=19) | |
| HP Spectre x360 2-in-1 16-f1075ng | |
| 1920x1080 Low Preset AA:T AF:16x | |
| GPD Win 4 | |
| Average AMD Radeon 680M (44.1 - 85.4, n=25) | |
| HP Spectre x360 2-in-1 16-f1075ng | |
| 1920x1080 Medium Preset AA:T AF:16x | |
| GPD Win 4 | |
| Average AMD Radeon 680M (38 - 75.1, n=25) | |
| HP Spectre x360 2-in-1 16-f1075ng | |
| 1920x1080 High Preset AA:T AF:16x | |
| GPD Win 4 | |
| Average AMD Radeon 680M (30 - 56.2, n=25) | |
| HP Spectre x360 2-in-1 16-f1075ng | |
| 1920x1080 Ultra High Preset AA:T AF:16x | |
| HP Spectre x360 2-in-1 16-f1075ng | |
| GPD Win 4 | |
| Average AMD Radeon 680M (7.85 - 14.7, n=22) | |
怠速运行 Witcher 3 来测试帧率的稳定性,会发现重大问题。如下图所示,性能开始时很高,超过80 FPS,然后稳定地下降到65 FPS,并不断波动。虽然随着时间的推移性能下降并不罕见,但波动是不正常的,它们导致了游戏过程中的周期性微卡顿。为了确定这一点,我们测试了两次,结果没有改善。背景任务或应用程序的CPU利用率未得到优化,通常是游戏时产生这种行为的原因。
Witcher 3 FPS Chart
| low | med. | high | ultra | |
|---|---|---|---|---|
| GTA V (2015) | 140.3 | 127.6 | 51.4 | 24.8 |
| The Witcher 3 (2015) | 94.3 | 63.8 | 37.5 | 22.8 |
| Dota 2 Reborn (2015) | 120.2 | 100.1 | 76.4 | 67.2 |
| Final Fantasy XV Benchmark (2018) | 57.1 | 32.7 | 23.9 | |
| X-Plane 11.11 (2018) | 56.2 | 41.4 | 33.5 | |
| Strange Brigade (2018) | 145.7 | 57.5 | 47.8 | 41.5 |
| Cyberpunk 2077 1.6 (2022) | 37.7 | 28.9 | 21.6 | 16.7 |
| F1 22 (2022) | 78.1 | 70.4 | 51.5 | 12.6 |
排放--几乎总是能听到
系统噪音
无论屏幕上的负载如何,内部风扇总是在运转。例如,当在桌面上空转时,风扇的噪音将徘徊在31 dB(A)左右,而背景是24 dB(A),这已经比许多笔记本电脑在类似空转条件下的噪音大了。用户应该期望在浏览或观看视频时有安静但明显的呼啸声。
运行更高的负载,如游戏,将引起略低于49分贝(A)的风扇噪音。考虑到大多数超极本和游戏笔记本的最高噪音分别为40 dB(A)和50 dB(A)左右,Win 4在噪音方面不幸地更接近于游戏笔记本而不是超极本。我们不建议在上课时偷偷用Win 4进行游戏。
Noise level
| Idle |
| 31.2 / 31.2 / 33.5 dB(A) |
| Load |
| 45.5 / 49 dB(A) |
 | ||
30 dB silent 40 dB(A) audible 50 dB(A) loud |
||
min: | ||
| GPD Win 4 Radeon 680M, R7 6800U, BiWin CE480Y2D100-1TB | GPD Win Max 2 Iris Xe G7 96EUs, i7-1260P, BiWin NQ200 1TB CNF82GS1D00-1TB | GPD Win 3 Iris Xe G7 80EUs, i5-1135G7, BIWIN NS200 1TB CNF82GS1G02-1TB | Razer Blade Stealth i7-1165G7 GTX 1650 Ti Max-Q GeForce GTX 1650 Ti Max-Q, i7-1165G7, Samsung SSD PM981a MZVLB512HBJQ | Dell XPS 13 9315 2-in-1 Core i5-1230U Iris Xe G7 80EUs, i5-1230U | Asus Zenbook S 13 OLED Radeon 680M, R7 6800U, Samsung PM9A1 MZVL21T0HCLR | |
|---|---|---|---|---|---|---|
| Noise | 18% | 6% | 11% | 19% | ||
| off / environment * (dB) | 24 | 22.6 6% | 27.4 -14% | 25.3 -5% | 24 -0% | |
| Idle Minimum * (dB) | 31.2 | 23.7 24% | 29.1 7% | 25.3 19% | 24 23% | |
| Idle Average * (dB) | 31.2 | 23.7 24% | 29.1 7% | 25.3 19% | 24 23% | |
| Idle Maximum * (dB) | 33.5 | 28.5 15% | 29.1 13% | 27 19% | 24 28% | |
| Load Average * (dB) | 45.5 | 36.5 20% | 40.7 11% | 47.9 -5% | 33.1 27% | |
| Witcher 3 ultra * (dB) | 48.6 | 39.8 18% | 42.8 12% | 38.4 21% | 40.2 17% | |
| Load Maximum * (dB) | 49 | 40.5 17% | 46.3 6% | 45.9 6% | 41.7 15% |
* ... smaller is better
温度
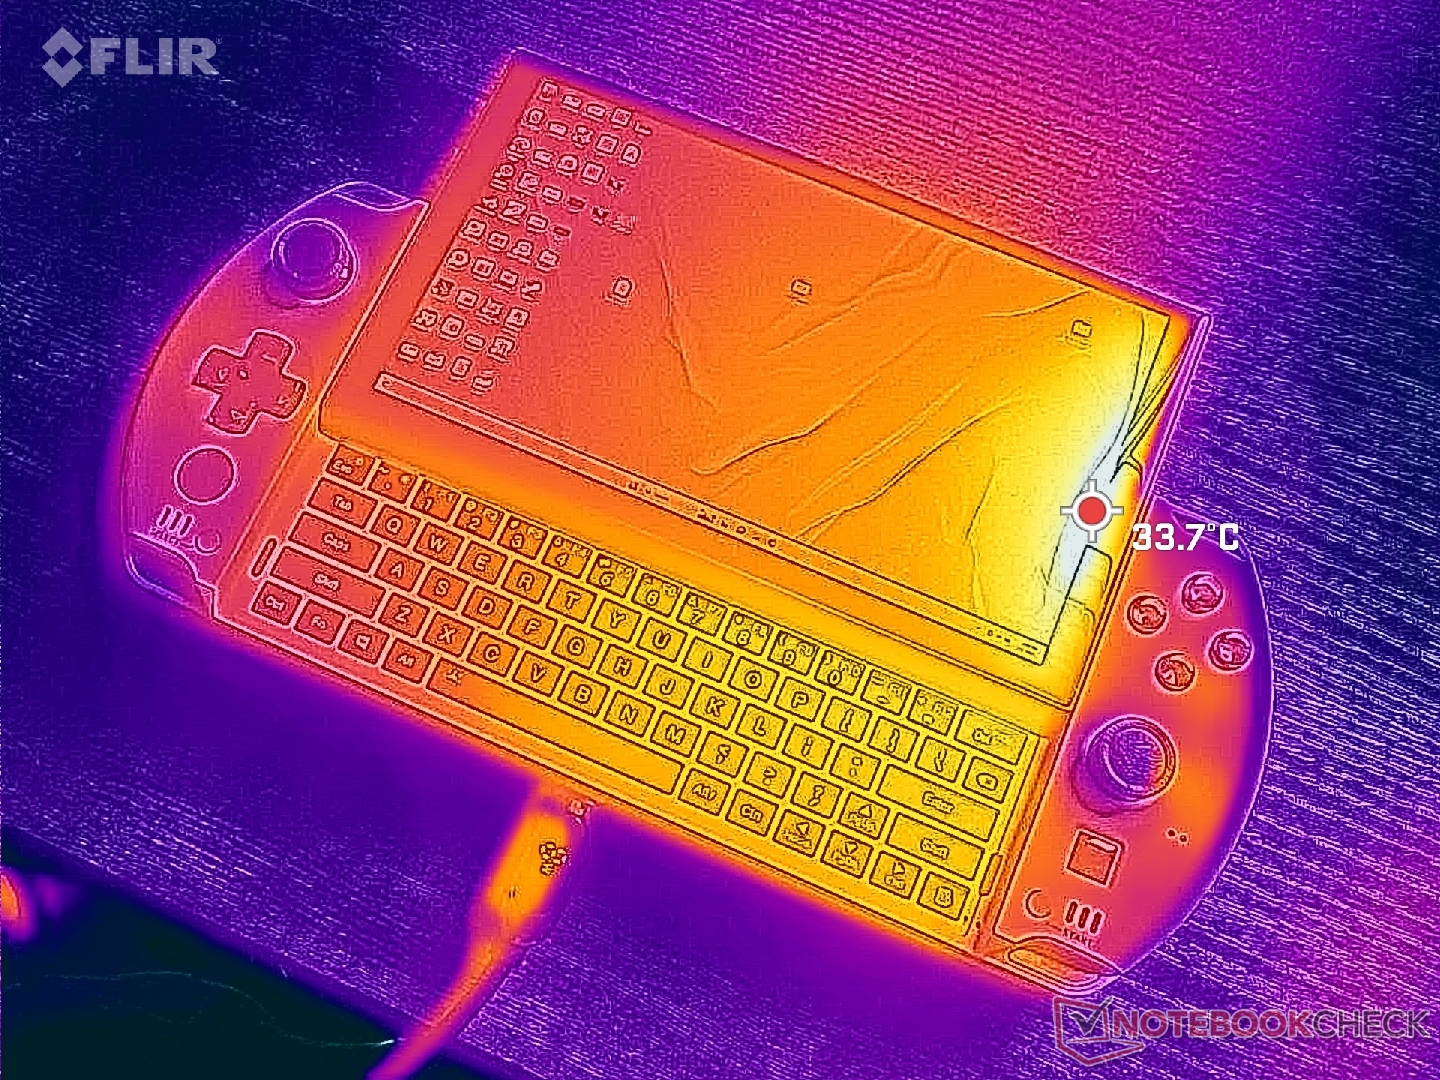
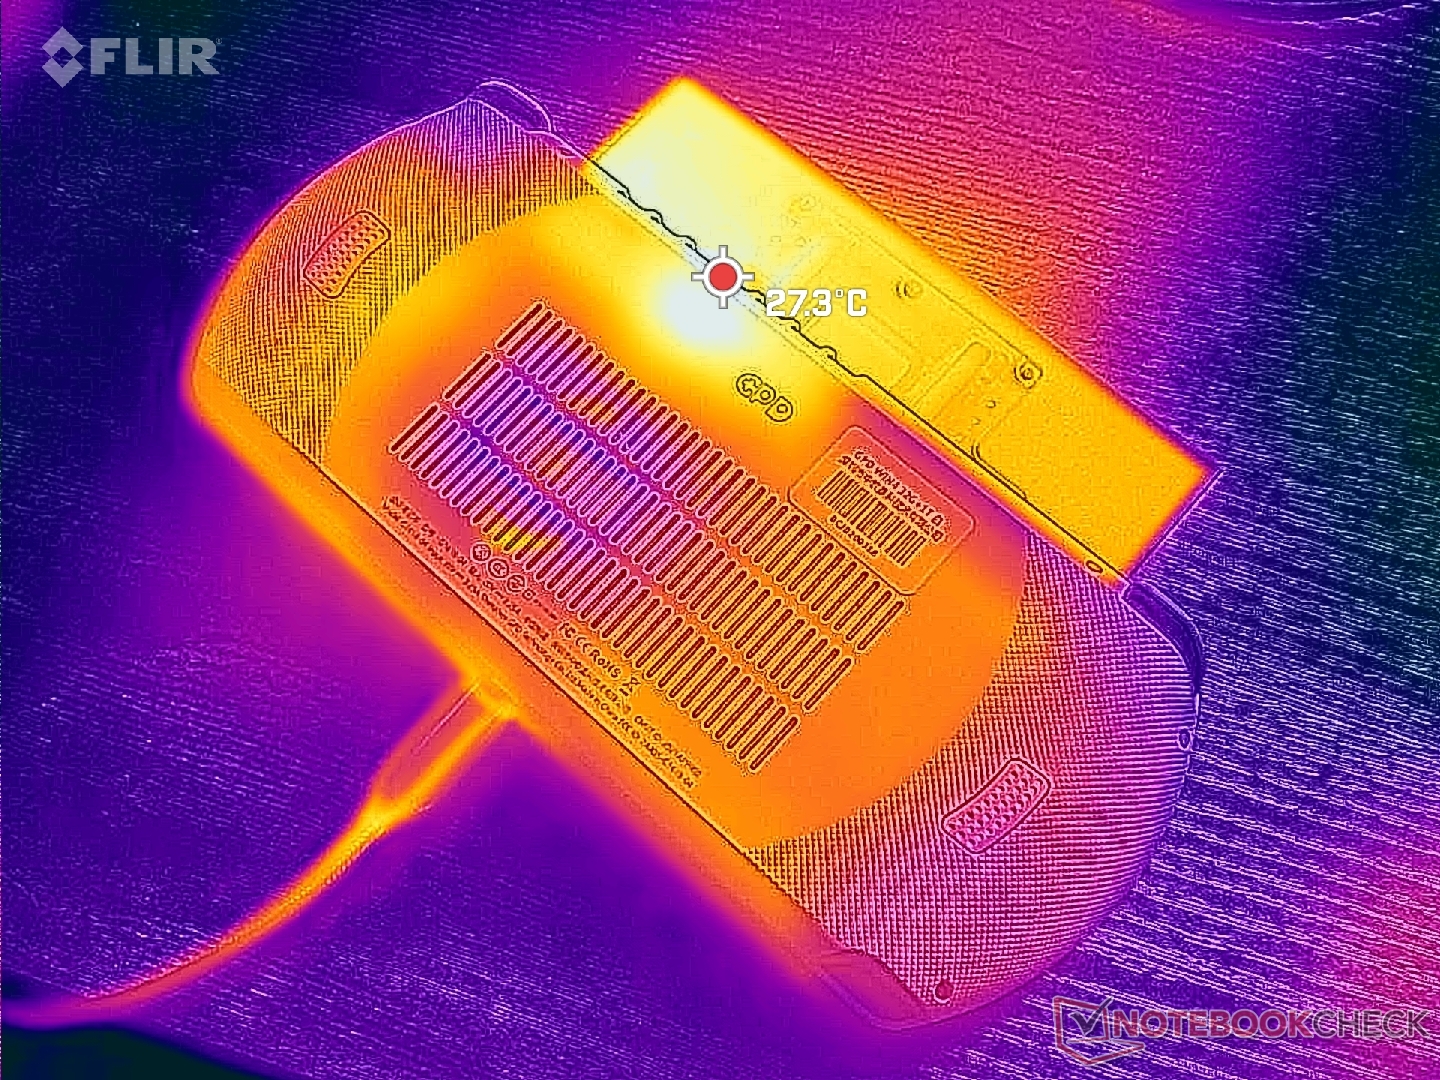
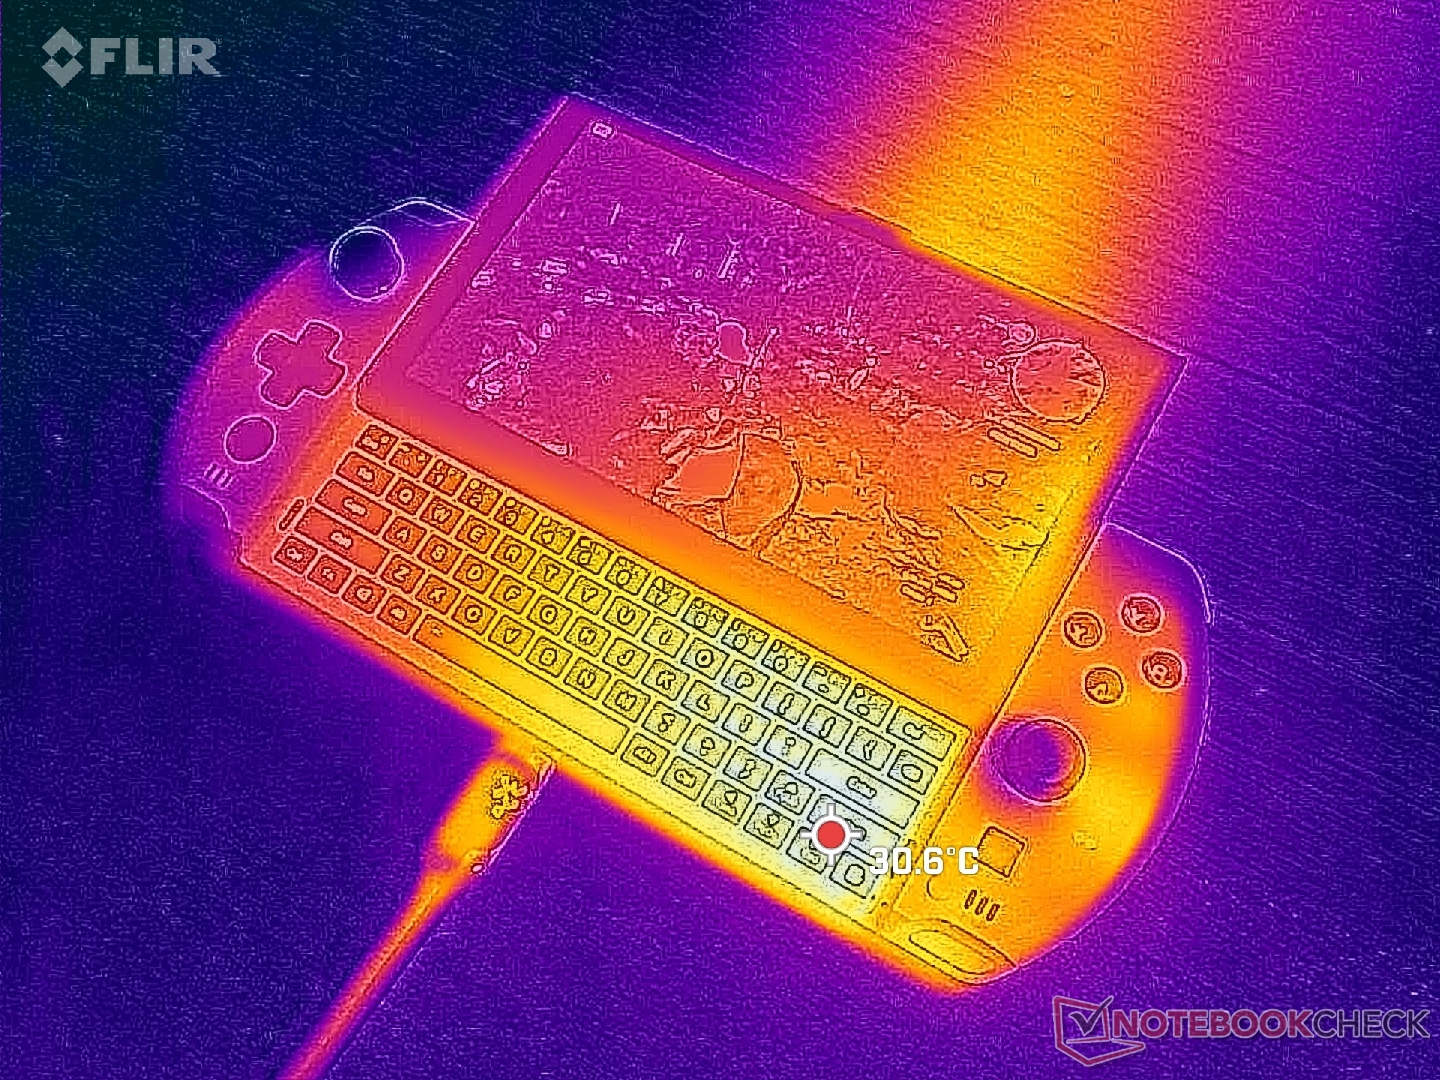
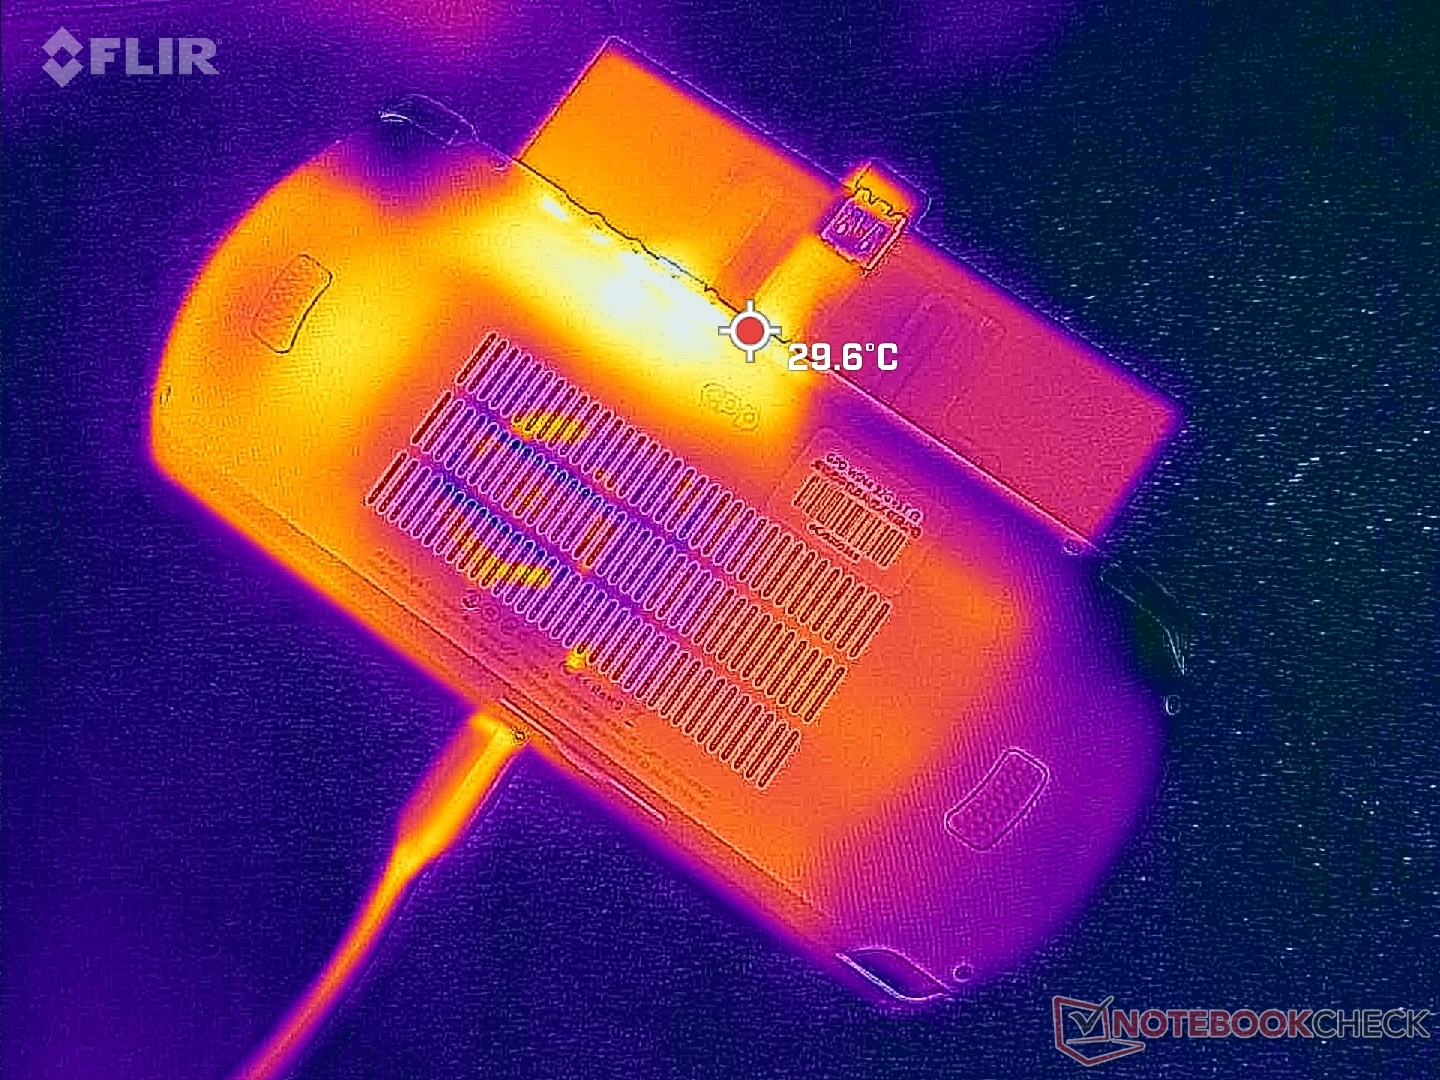
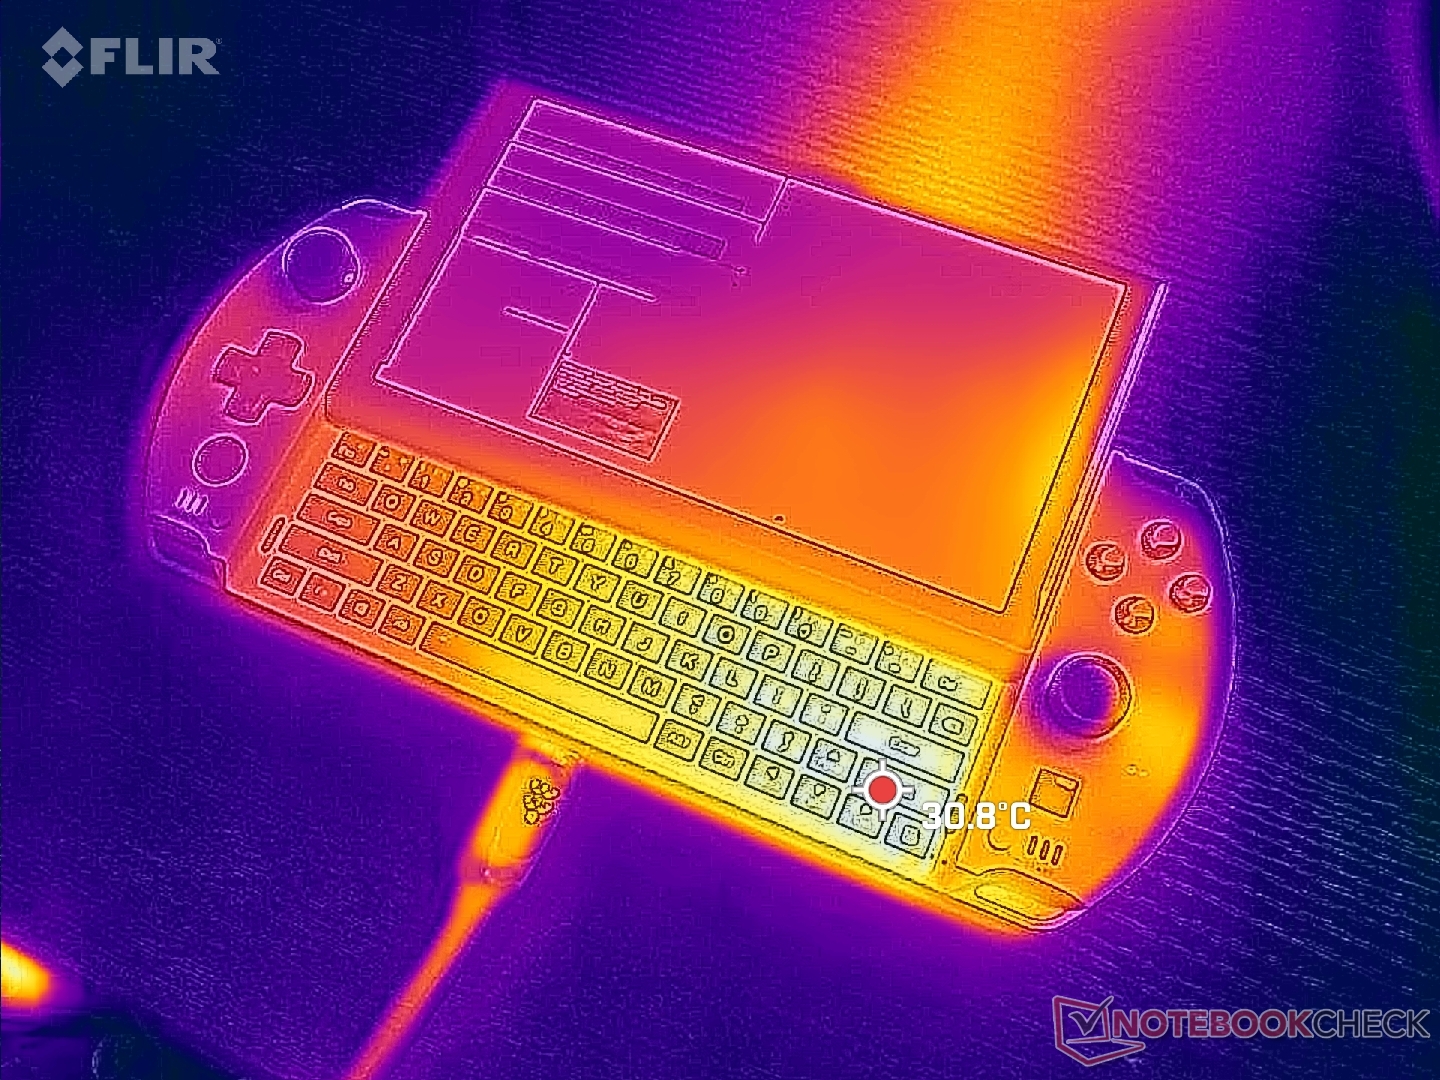
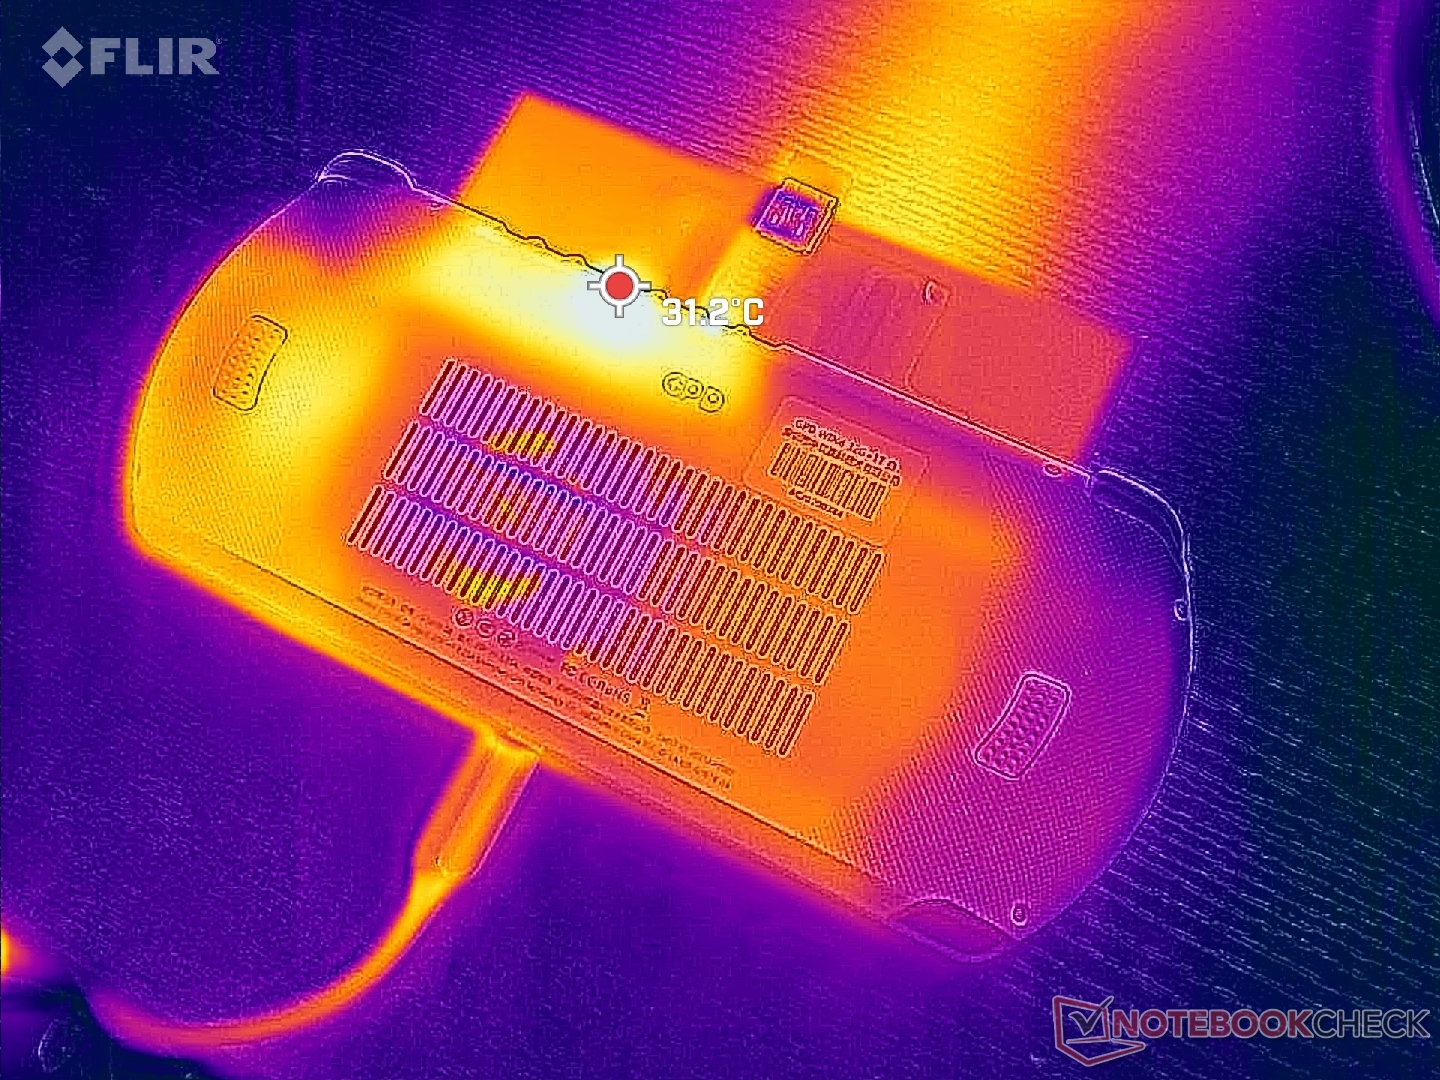
尽管单位体积的性能很高,但表面温度绝不会让人感到不舒服。虽然该系统比传统的笔记本电脑要小,但它仍然相当厚,因此表面温度并不像人们想象的那样热。
该设备的右侧总是比左侧的温度高几摄氏度,这并不令人讨厌,但在游戏过程中还是很明显的。过多的热量从设备的顶部边缘流出,就像Switch一样。
(+) The maximum temperature on the upper side is 35 °C / 95 F, compared to the average of 35.9 °C / 97 F, ranging from 21.4 to 59 °C for the class Subnotebook.
(+) The bottom heats up to a maximum of 26.8 °C / 80 F, compared to the average of 39.2 °C / 103 F
(+) In idle usage, the average temperature for the upper side is 26 °C / 79 F, compared to the device average of 30.8 °C / 87 F.
(+) Playing The Witcher 3, the average temperature for the upper side is 28.1 °C / 83 F, compared to the device average of 30.8 °C / 87 F.
(+) The palmrests and touchpad are reaching skin temperature as a maximum (32.2 °C / 90 F) and are therefore not hot.
(-) The average temperature of the palmrest area of similar devices was 28.2 °C / 82.8 F (-4 °C / -7.2 F).
| GPD Win 4 AMD Ryzen 7 6800U, AMD Radeon 680M | GPD Win Max 2 Intel Core i7-1260P, Intel Iris Xe Graphics G7 96EUs | Razer Blade Stealth i7-1165G7 GTX 1650 Ti Max-Q Intel Core i7-1165G7, NVIDIA GeForce GTX 1650 Ti Max-Q | Dell XPS 13 9315 2-in-1 Core i5-1230U Intel Core i5-1230U, Intel Iris Xe Graphics G7 80EUs | Asus Zenbook S 13 OLED AMD Ryzen 7 6800U, AMD Radeon 680M | |
|---|---|---|---|---|---|
| Heat | -1% | -40% | -17% | -37% | |
| Maximum Upper Side * (°C) | 35 | 28.6 18% | 44 -26% | 41.8 -19% | 47.9 -37% |
| Maximum Bottom * (°C) | 26.8 | 33 -23% | 47.4 -77% | 38.2 -43% | 56.1 -109% |
| Idle Upper Side * (°C) | 28.4 | 24.6 13% | 32.2 -13% | 27.4 4% | 26.8 6% |
| Idle Bottom * (°C) | 25 | 27.6 -10% | 36 -44% | 27.2 -9% | 27.3 -9% |
* ... smaller is better
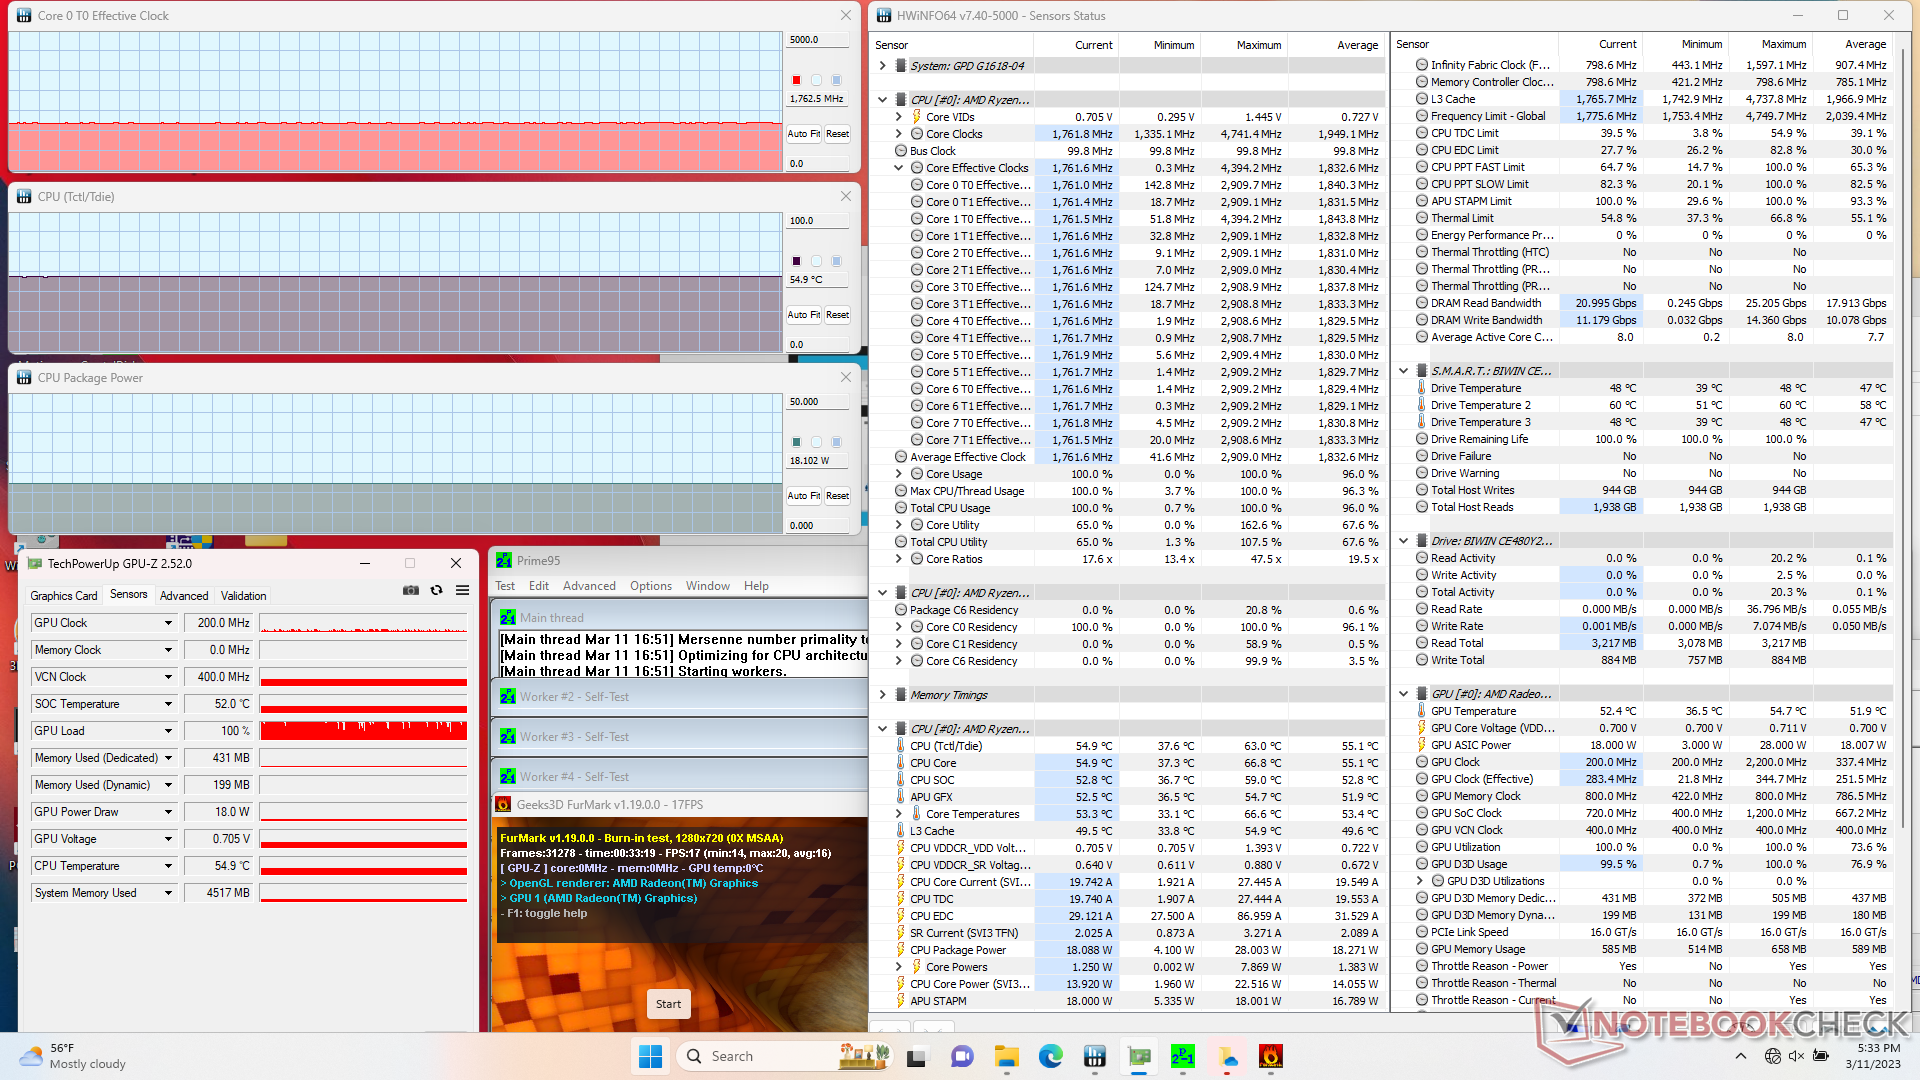
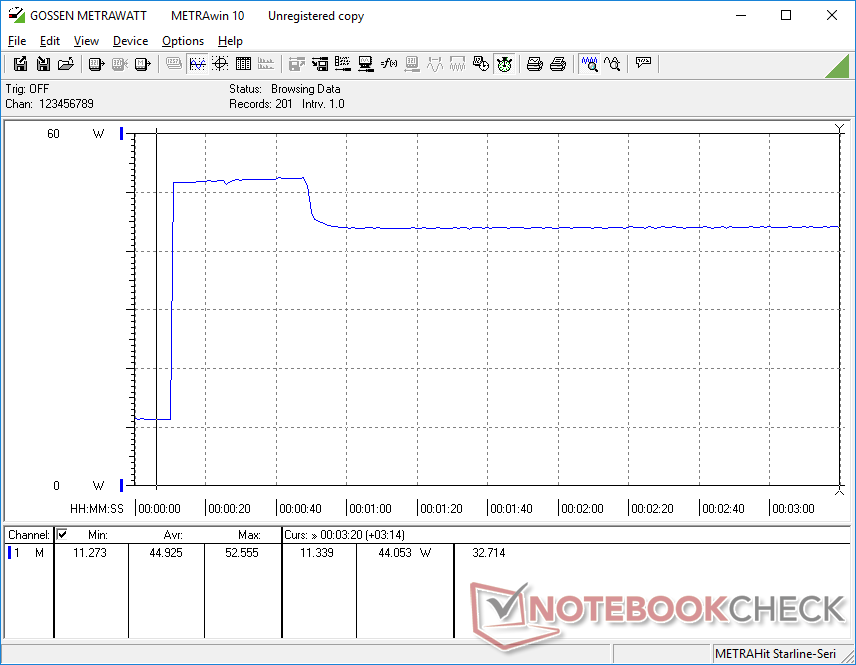
压力测试
当运行Prime95对CPU施加压力时,时钟频率和电路板功耗将分别提升到2.9 GHz和28 W,持续约30秒或直到核心温度达到63 C。此后,时钟频率和电路板功耗将稳步下降,然后分别稳定在约2.3 GHz和18 W。尽管压力水平很高,但核心温度相对较低,为57 C;在英特尔驱动的电脑上重复这一测试 联想IdeaPad Flex 7i 14将导致更高的稳定核心温度为71 C。
当运行时,GPU时钟速率和温度将分别稳定在1316 MHz和55 C。 Witcher 3.即使设置为性能模式,核心温度也出奇的保守。
用电池供电运行并不限制性能。在电池上进行的3DMark 11测试将返回与在主电源上运行时基本相同的CPU和GPU分数。
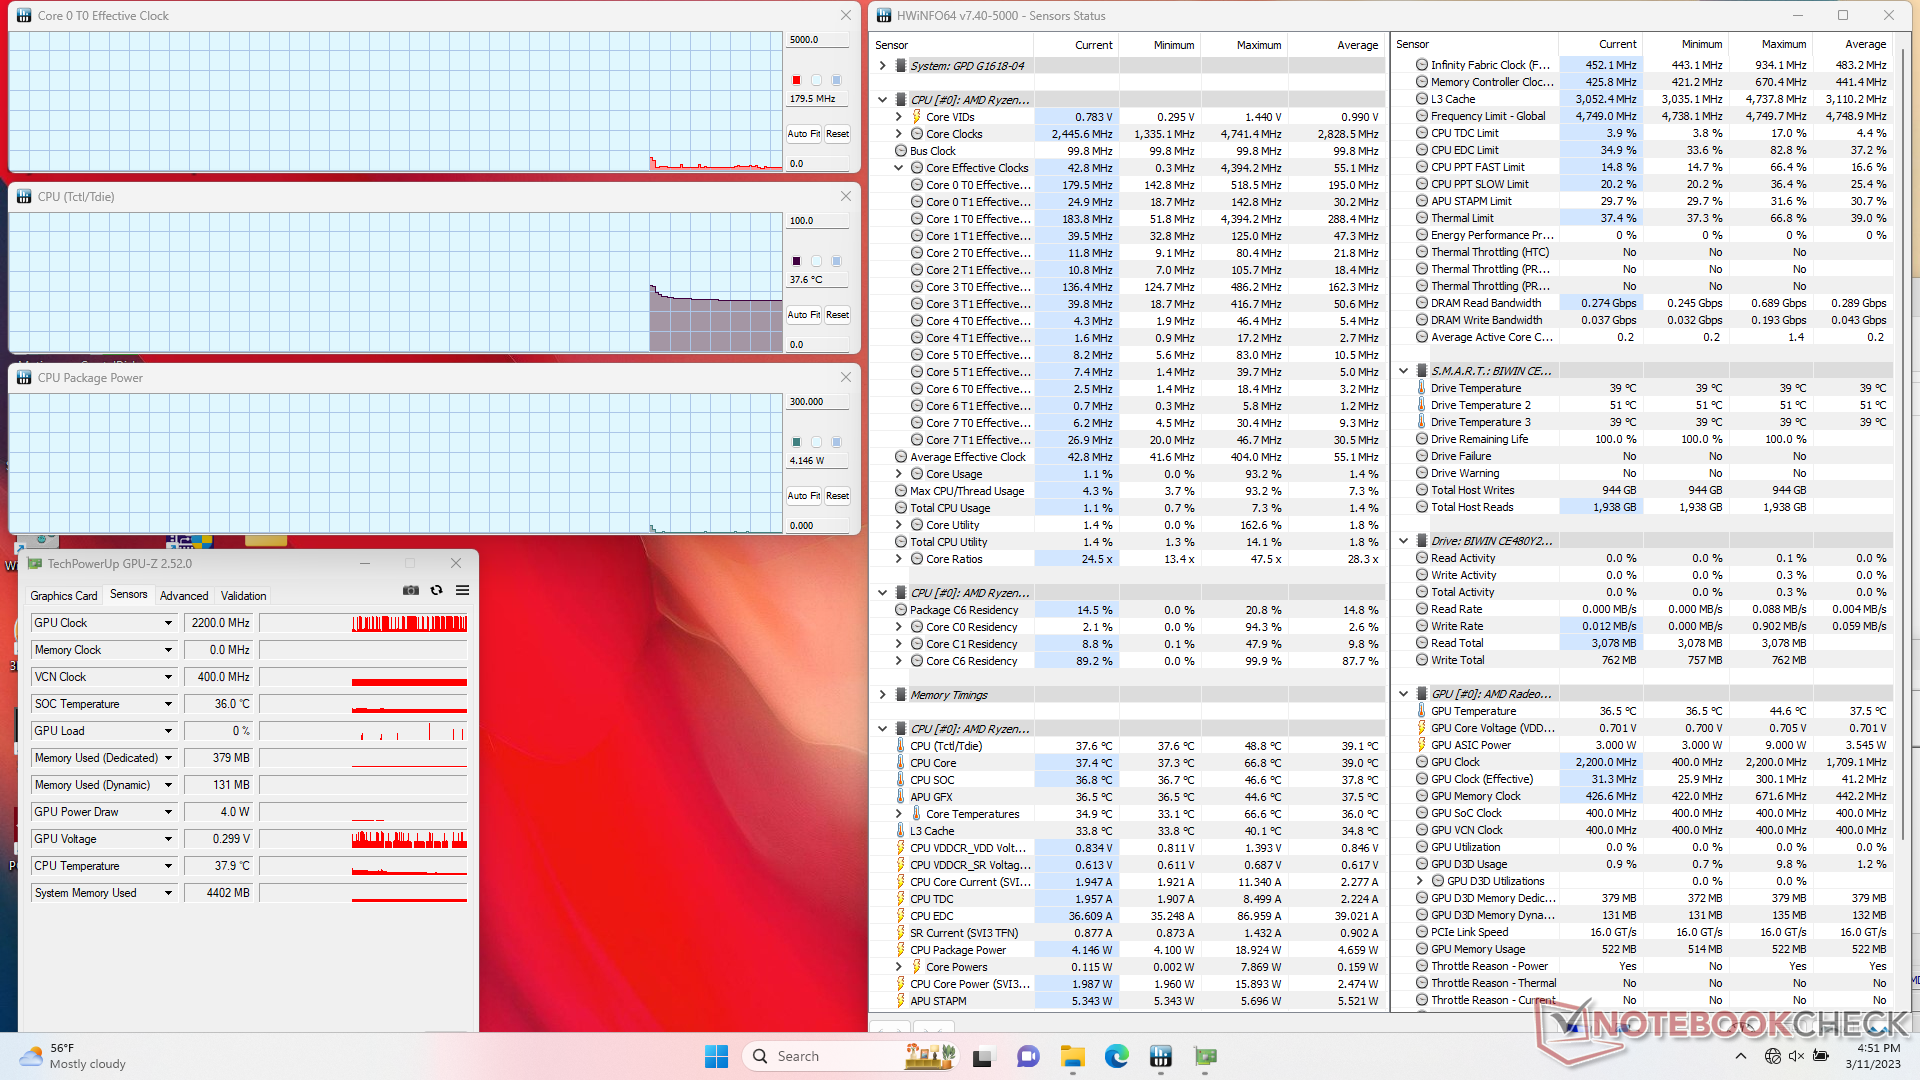
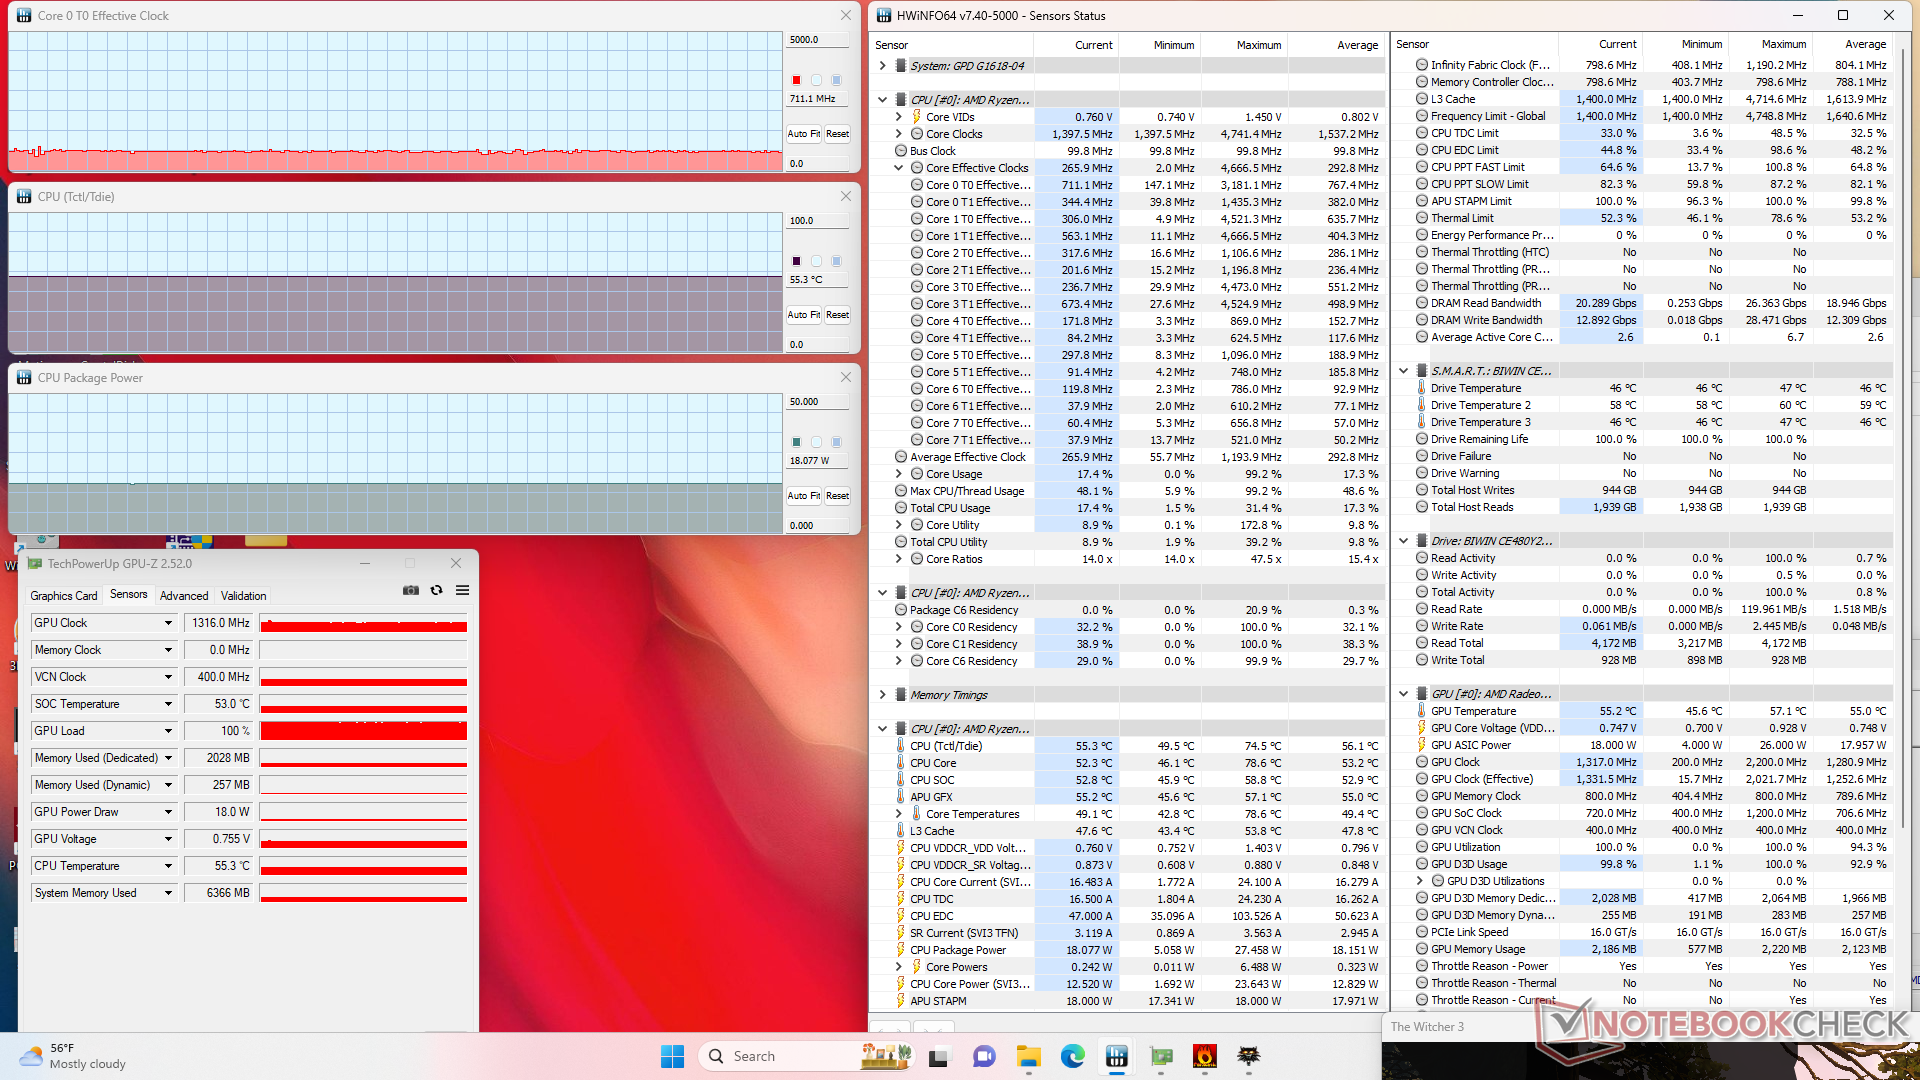
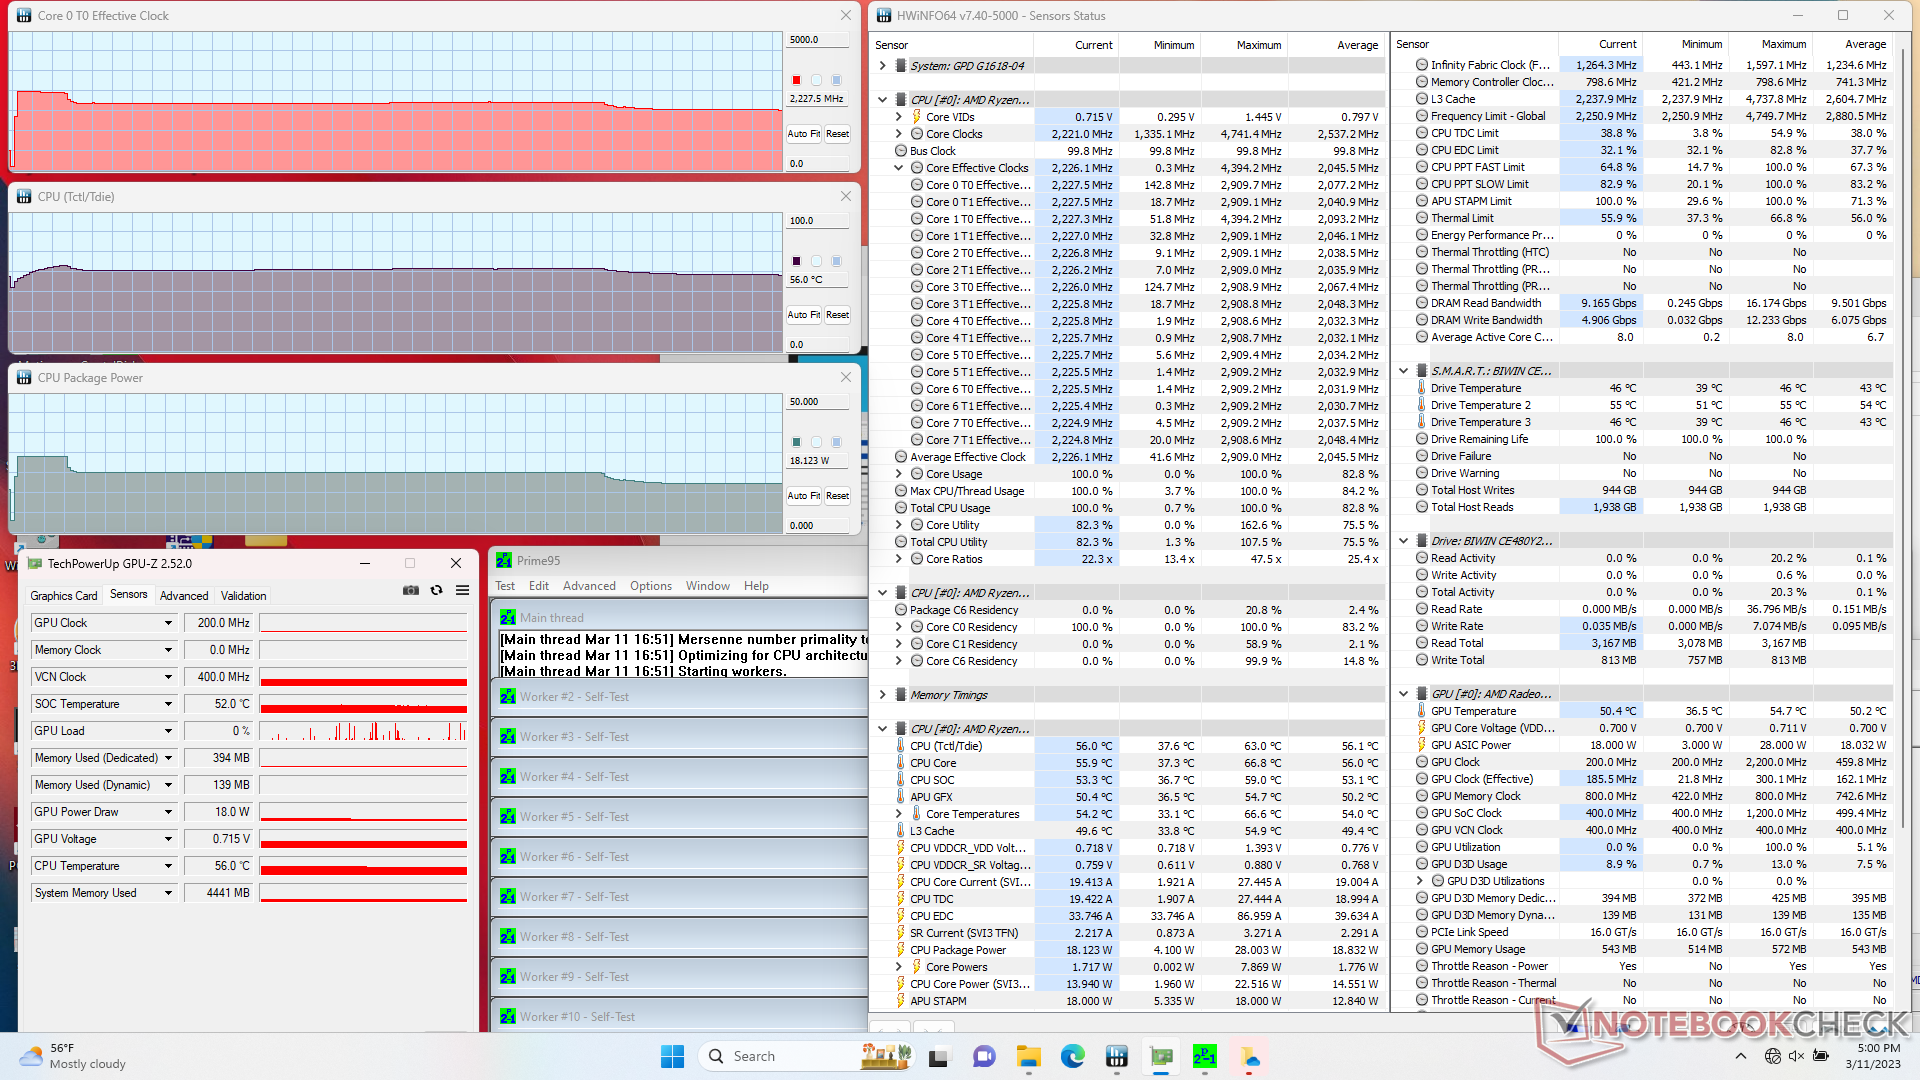
| CPU时钟(GHz) | GPU时钟(MHz) | CPU平均温度(°C) | |
| 系统空闲 | -- | -- | 38 |
| Prime95压力 | 2.2 | -- | 56 |
| Prime95 + FurMark 压力 | 1.8 | 200 | 55 |
| Witcher 3 应力 | 0.7 | 1316 | 55 |
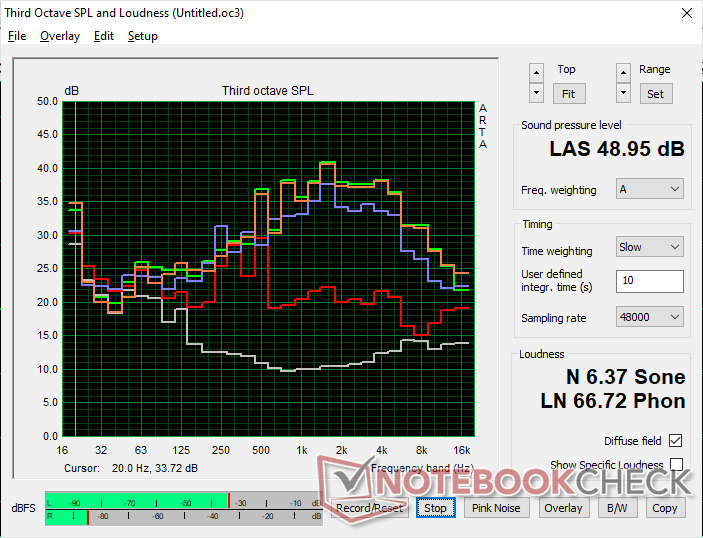
发言人
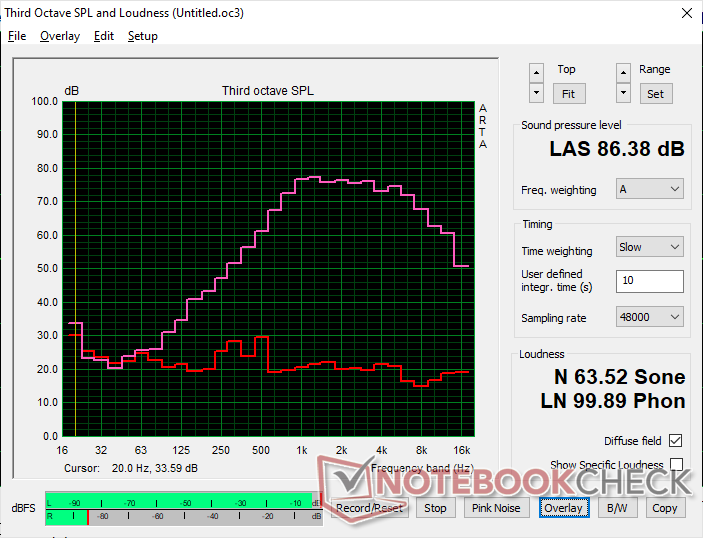
GPD Win 4 audio analysis
(+) | speakers can play relatively loud (86.4 dB)
Bass 100 - 315 Hz
(-) | nearly no bass - on average 26.1% lower than median
(±) | linearity of bass is average (9.1% delta to prev. frequency)
Mids 400 - 2000 Hz
(±) | higher mids - on average 7.3% higher than median
(±) | linearity of mids is average (7.4% delta to prev. frequency)
Highs 2 - 16 kHz
(±) | higher highs - on average 5.6% higher than median
(+) | highs are linear (5.4% delta to prev. frequency)
Overall 100 - 16.000 Hz
(±) | linearity of overall sound is average (25.6% difference to median)
Compared to same class
» 86% of all tested devices in this class were better, 3% similar, 11% worse
» The best had a delta of 5%, average was 18%, worst was 53%
Compared to all devices tested
» 79% of all tested devices were better, 4% similar, 17% worse
» The best had a delta of 4%, average was 23%, worst was 134%
Apple MacBook Pro 16 2021 M1 Pro audio analysis
(+) | speakers can play relatively loud (84.7 dB)
Bass 100 - 315 Hz
(+) | good bass - only 3.8% away from median
(+) | bass is linear (5.2% delta to prev. frequency)
Mids 400 - 2000 Hz
(+) | balanced mids - only 1.3% away from median
(+) | mids are linear (2.1% delta to prev. frequency)
Highs 2 - 16 kHz
(+) | balanced highs - only 1.9% away from median
(+) | highs are linear (2.7% delta to prev. frequency)
Overall 100 - 16.000 Hz
(+) | overall sound is linear (4.6% difference to median)
Compared to same class
» 0% of all tested devices in this class were better, 0% similar, 100% worse
» The best had a delta of 5%, average was 17%, worst was 45%
Compared to all devices tested
» 0% of all tested devices were better, 0% similar, 100% worse
» The best had a delta of 4%, average was 23%, worst was 134%
能源管理--对尺寸要求很高的电源
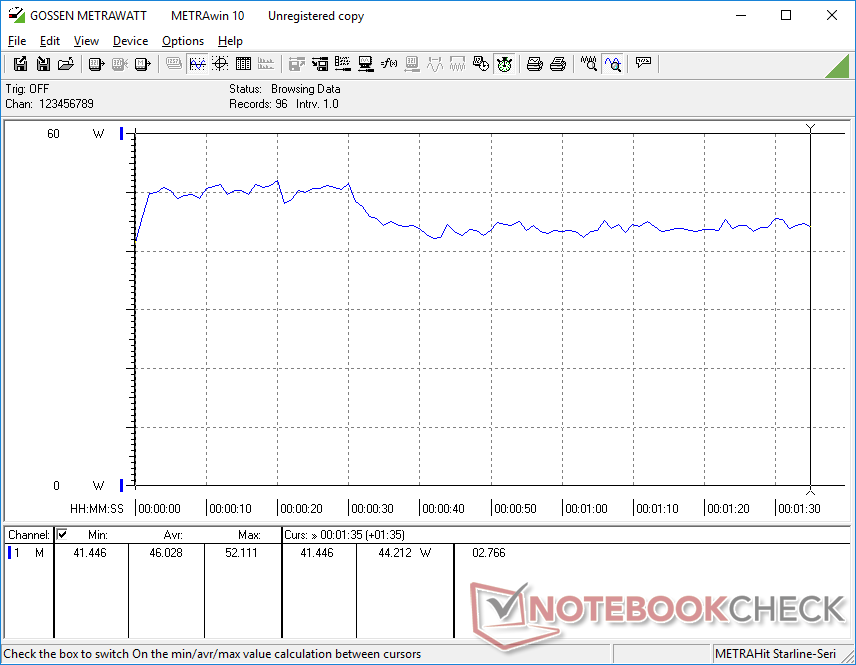
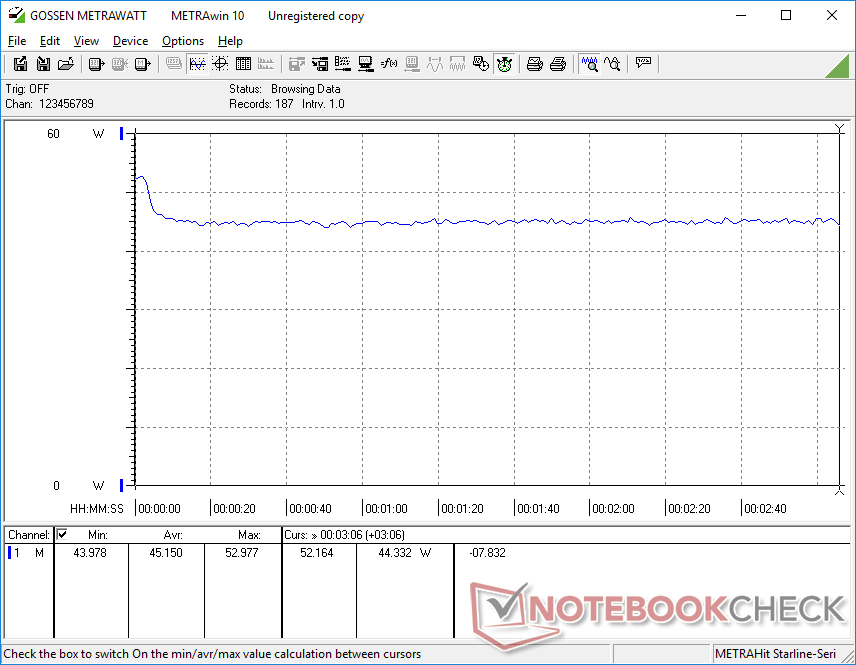
消耗功率
总体功耗高于Win 3和许多U系列驱动的超极本,主要是因为Ryzen 7 CPU和更大、更高分辨率的触摸屏。例如,游戏需要比搭载Core i5的Win 3多20%至55%的电量,但这被比i5-1135G7快2倍的CPU性能和1.5倍的GPU性能所抵消。仅仅在桌面上空转就需要7瓦到13瓦,这与许多超极本相似。
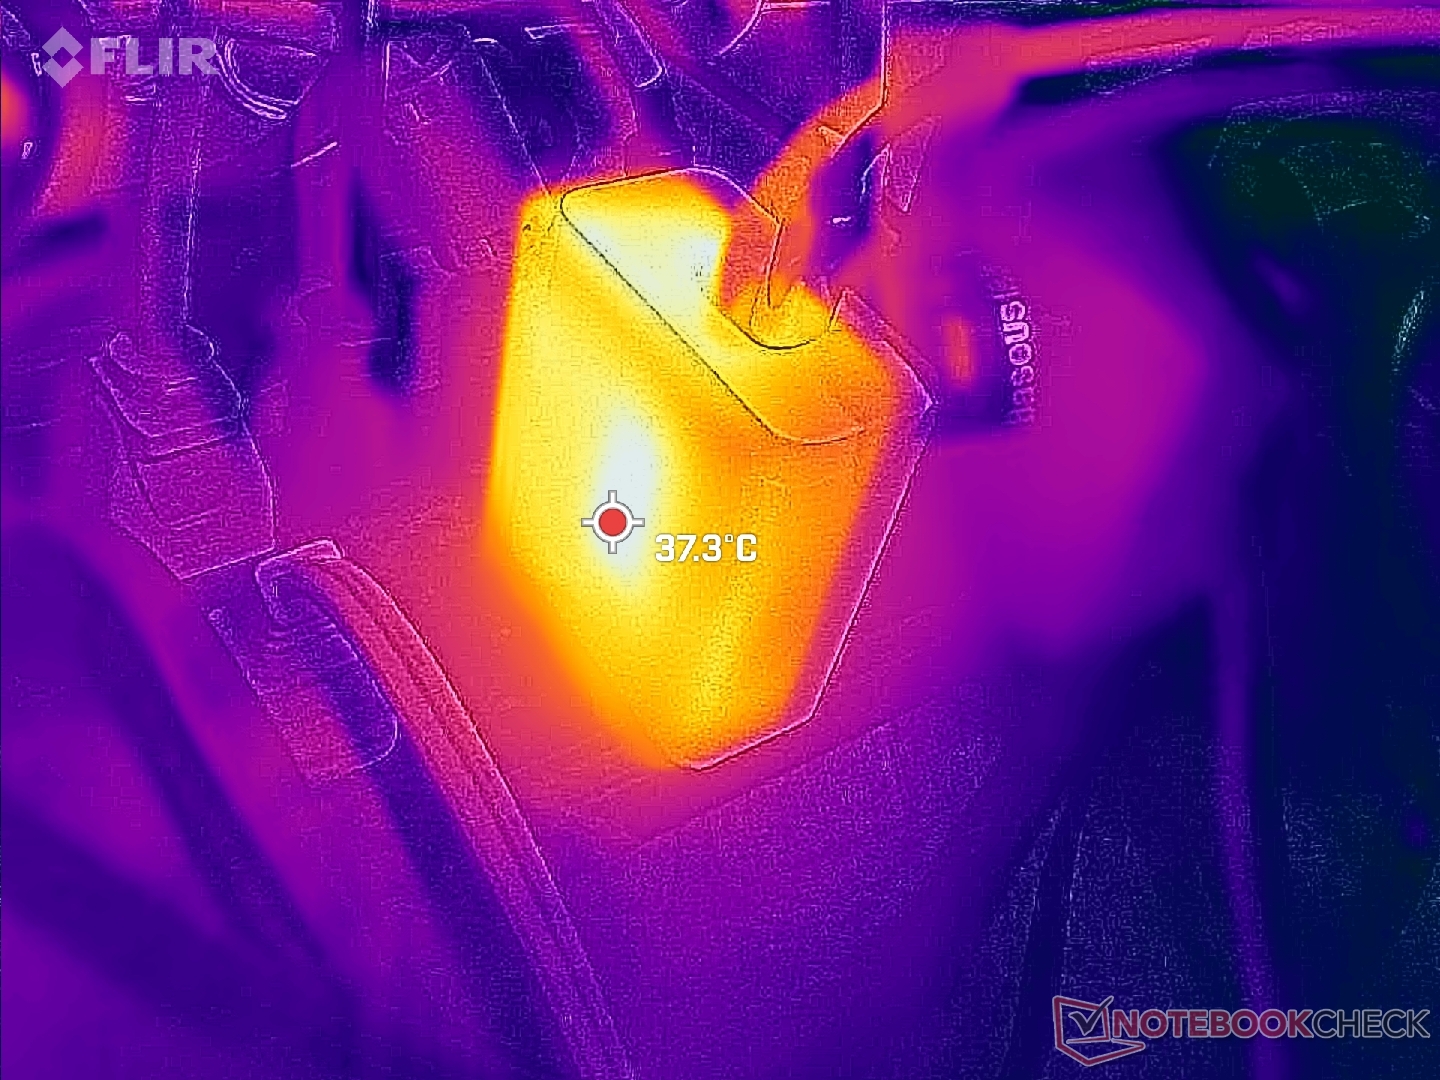
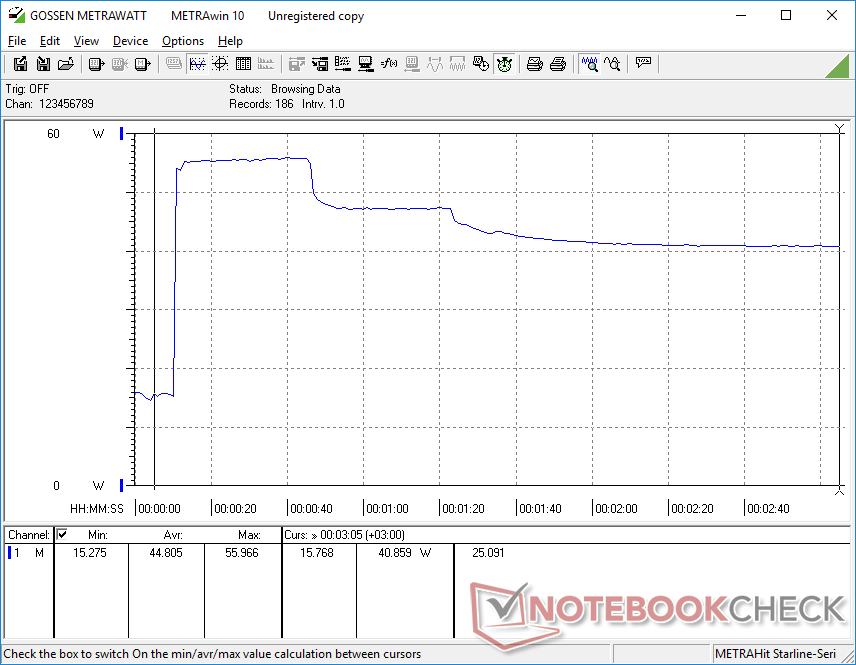
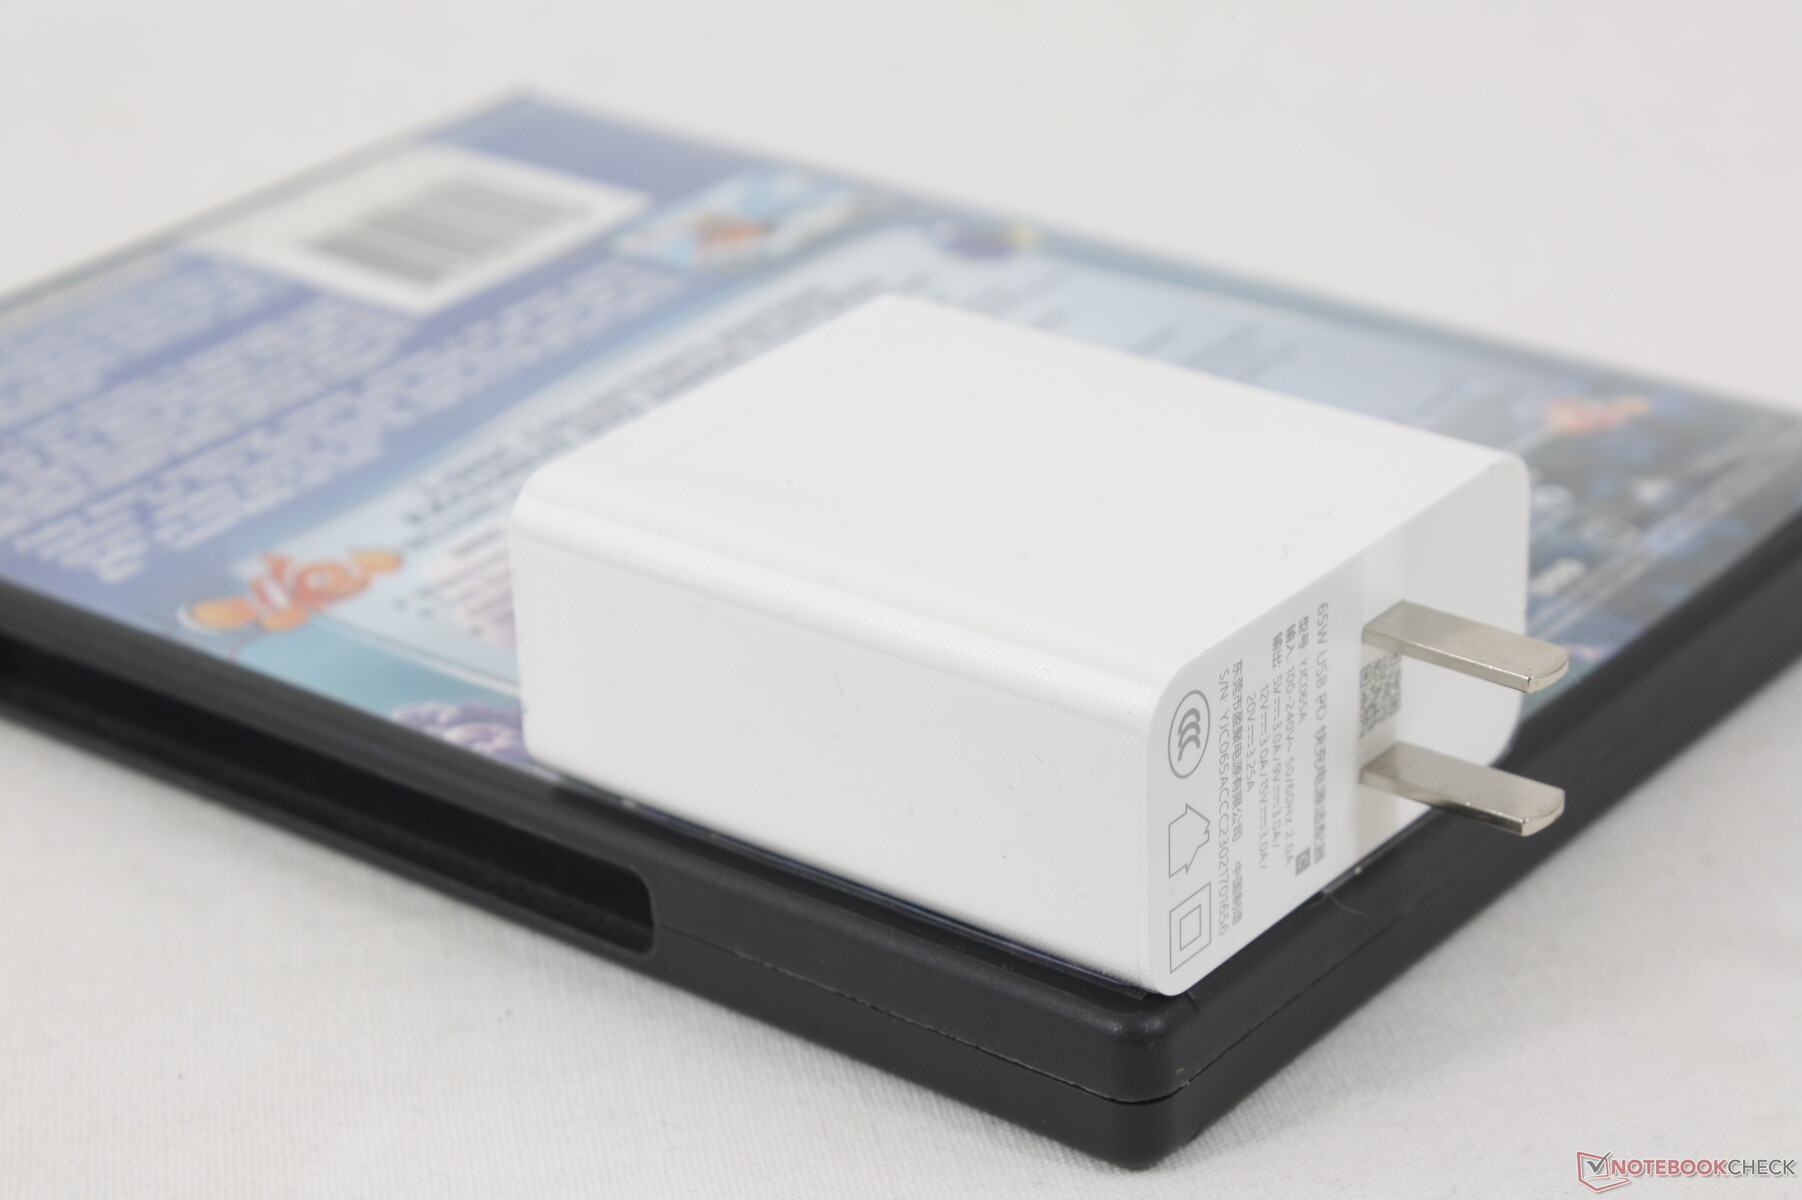
我们能够从小型(约6.4 x 5.5 x 2.8厘米)的65瓦USB-C交流适配器测量到,当处理器处于100%的利用率时,临时的最大功耗为56瓦。如下图所示,由于该型号的CPU Boost潜力有限,这一比率在几秒钟的压力后就会下降。令人遗憾的是,交流电适配器上的棱角是不能伸缩的。
| Off / Standby | |
| Idle | |
| Load |
|
Key:
min: | |
| GPD Win 4 R7 6800U, Radeon 680M, BiWin CE480Y2D100-1TB, IPS, 1920x1080, 6" | GPD Win Max 2 i7-1260P, Iris Xe G7 96EUs, BiWin NQ200 1TB CNF82GS1D00-1TB, IPS, 2560x1600, 10.1" | GPD Win 3 i5-1135G7, Iris Xe G7 80EUs, BIWIN NS200 1TB CNF82GS1G02-1TB, IPS, 1280x720, 5.5" | Razer Blade Stealth i7-1165G7 GTX 1650 Ti Max-Q i7-1165G7, GeForce GTX 1650 Ti Max-Q, Samsung SSD PM981a MZVLB512HBJQ, IPS, 1920x1080, 13.3" | Dell XPS 13 9315 2-in-1 Core i5-1230U i5-1230U, Iris Xe G7 80EUs, , IPS, 2880x1920, 13" | Asus Zenbook S 13 OLED R7 6800U, Radeon 680M, Samsung PM9A1 MZVL21T0HCLR, OLED, 2880x1800, 13.3" | |
|---|---|---|---|---|---|---|
| Power Consumption | 2% | 45% | -20% | 32% | 18% | |
| Idle Minimum * (Watt) | 7.5 | 5.8 23% | 2.9 61% | 4 47% | 5.2 31% | 4.8 36% |
| Idle Average * (Watt) | 12.4 | 10.2 18% | 4.5 64% | 6.3 49% | 7.9 36% | 8.7 30% |
| Idle Maximum * (Watt) | 13 | 11.5 12% | 4.5 65% | 14.5 -12% | 8 38% | 10.1 22% |
| Load Average * (Watt) | 46 | 47.7 -4% | 38.5 16% | 79.2 -72% | 31.2 32% | 45.6 1% |
| Witcher 3 ultra * (Watt) | 45.2 | 45.6 -1% | 28.9 36% | 68.2 -51% | 28.2 38% | 42.4 6% |
| Load Maximum * (Watt) | 56 | 76.8 -37% | 41.4 26% | 99.4 -78% | 47.6 15% | 49.5 12% |
* ... smaller is better
Power Consumption Witcher 3 / Stresstest
Power Consumption external Monitor
电池寿命
尽管Win 4的性能更快、整体尺寸更大,但电池容量几乎与Win 3相同。因此,Win 4的电池寿命缩短几个小时也许并不奇怪。在150尼特亮度下浏览网页时,我们能够记录到7.5小时的总运行时间,而在最大亮度设置下运行高要求的游戏时,仅有77分钟。
从空电到满电需要大约90分钟,与大多数超极本一样。请记住,如果同时进行游戏,充电速度会减慢。
| GPD Win 4 R7 6800U, Radeon 680M, 46 Wh | GPD Win Max 2 i7-1260P, Iris Xe G7 96EUs, 70 Wh | GPD Win 3 i5-1135G7, Iris Xe G7 80EUs, 44 Wh | Razer Blade Stealth i7-1165G7 GTX 1650 Ti Max-Q i7-1165G7, GeForce GTX 1650 Ti Max-Q, 53.1 Wh | Dell XPS 13 9315 2-in-1 Core i5-1230U i5-1230U, Iris Xe G7 80EUs, 49.5 Wh | Asus Zenbook S 13 OLED R7 6800U, Radeon 680M, 67 Wh | |
|---|---|---|---|---|---|---|
| Battery runtime | 35% | 26% | 66% | 38% | 54% | |
| Reader / Idle (h) | 9.7 | 15.4 59% | 20.6 112% | 13.6 40% | ||
| WiFi v1.3 (h) | 7.5 | 8.7 16% | 11.3 51% | 9 20% | 9 20% | 9.2 23% |
| Load (h) | 1.3 | 1.7 31% | 1.3 0% | 2 54% | 2.4 85% | |
| H.264 (h) | 15.2 |
Pros
Cons
评语--使蒸汽甲板看起来过时了
Win4在几乎所有方面都比Win3有了巨大的改进。显示屏更大,控制更有触感,设计更强大、更有吸引力,键盘更可靠,性能也明显更快。你可以在前面贴上一个PS标志,它可能会骗过很多人的眼睛。
新的屏幕、性能和集成的物理键盘促成了Win 4更重的重量、更厚的外形和更大的风扇噪音,这是该机型的三个主要缺点。它的结构可能很坚固,但其他游戏掌机如Switch或OneXPlayer更薄、更轻,更容易在路上游戏。即便如此,它在与Steam Deck的竞争中仍有优势,因为Steam Deck比GPD的解决方案既慢又笨重。
GPD Win 4将强大的AMD Radeon 680M GPU与顶级的制造质量结合起来,使这款掌上电脑在几乎所有方面都比Steam Deck强。
Win 4的两个缺失是其糟糕的终端用户服务性和缺乏FreeSync支持。密集的设计使其难以更换内部固态硬盘或任何可能损坏的按钮,而FreeSync会在没有任何额外硬件的情况下改善游戏体验。值得一提的是,如果用户想以40 FPS为目标,减少屏幕撕裂的频率,该显示器有一个原生的40 Hz模式。
绝对应该解决的是游戏时帧率稳定性差或微卡顿的问题。大多数超极本,特别是游戏笔记本电脑没有表现出这个问题,我们希望在游戏是关键卖点的手持设备上也能如此。
对于未来的型号,我们希望看到GPD从目前的游戏笔记本中吸收更多的技术,以尽量减少厚度和潜在的重量。例如,改用液态金属导热膏、蒸汽室冷却和更大直径的内部风扇,可以使每体积的性能更高。在那之前,GPD Win 4很容易成为目前最好和最快的基于Windows的游戏手持设备之一。
价格和可用性
Win 4的Indiegogo页面Win 4的页面现在已经上线,最初的出货量将于2023年3月开始。配置方面,16GB内存和1TB固态硬盘的起价略低于1000美元,而内存和存储的两倍则为1300美元。
Transparency
The selection of devices to be reviewed is made by our editorial team. The test sample was provided to the author as a loan by the manufacturer or retailer for the purpose of this review. The lender had no influence on this review, nor did the manufacturer receive a copy of this review before publication. There was no obligation to publish this review. As an independent media company, Notebookcheck is not subjected to the authority of manufacturers, retailers or publishers.
This is how Notebookcheck is testing
Every year, Notebookcheck independently reviews hundreds of laptops and smartphones using standardized procedures to ensure that all results are comparable. We have continuously developed our test methods for around 20 years and set industry standards in the process. In our test labs, high-quality measuring equipment is utilized by experienced technicians and editors. These tests involve a multi-stage validation process. Our complex rating system is based on hundreds of well-founded measurements and benchmarks, which maintains objectivity. Further information on our test methods can be found here.
Price comparison

