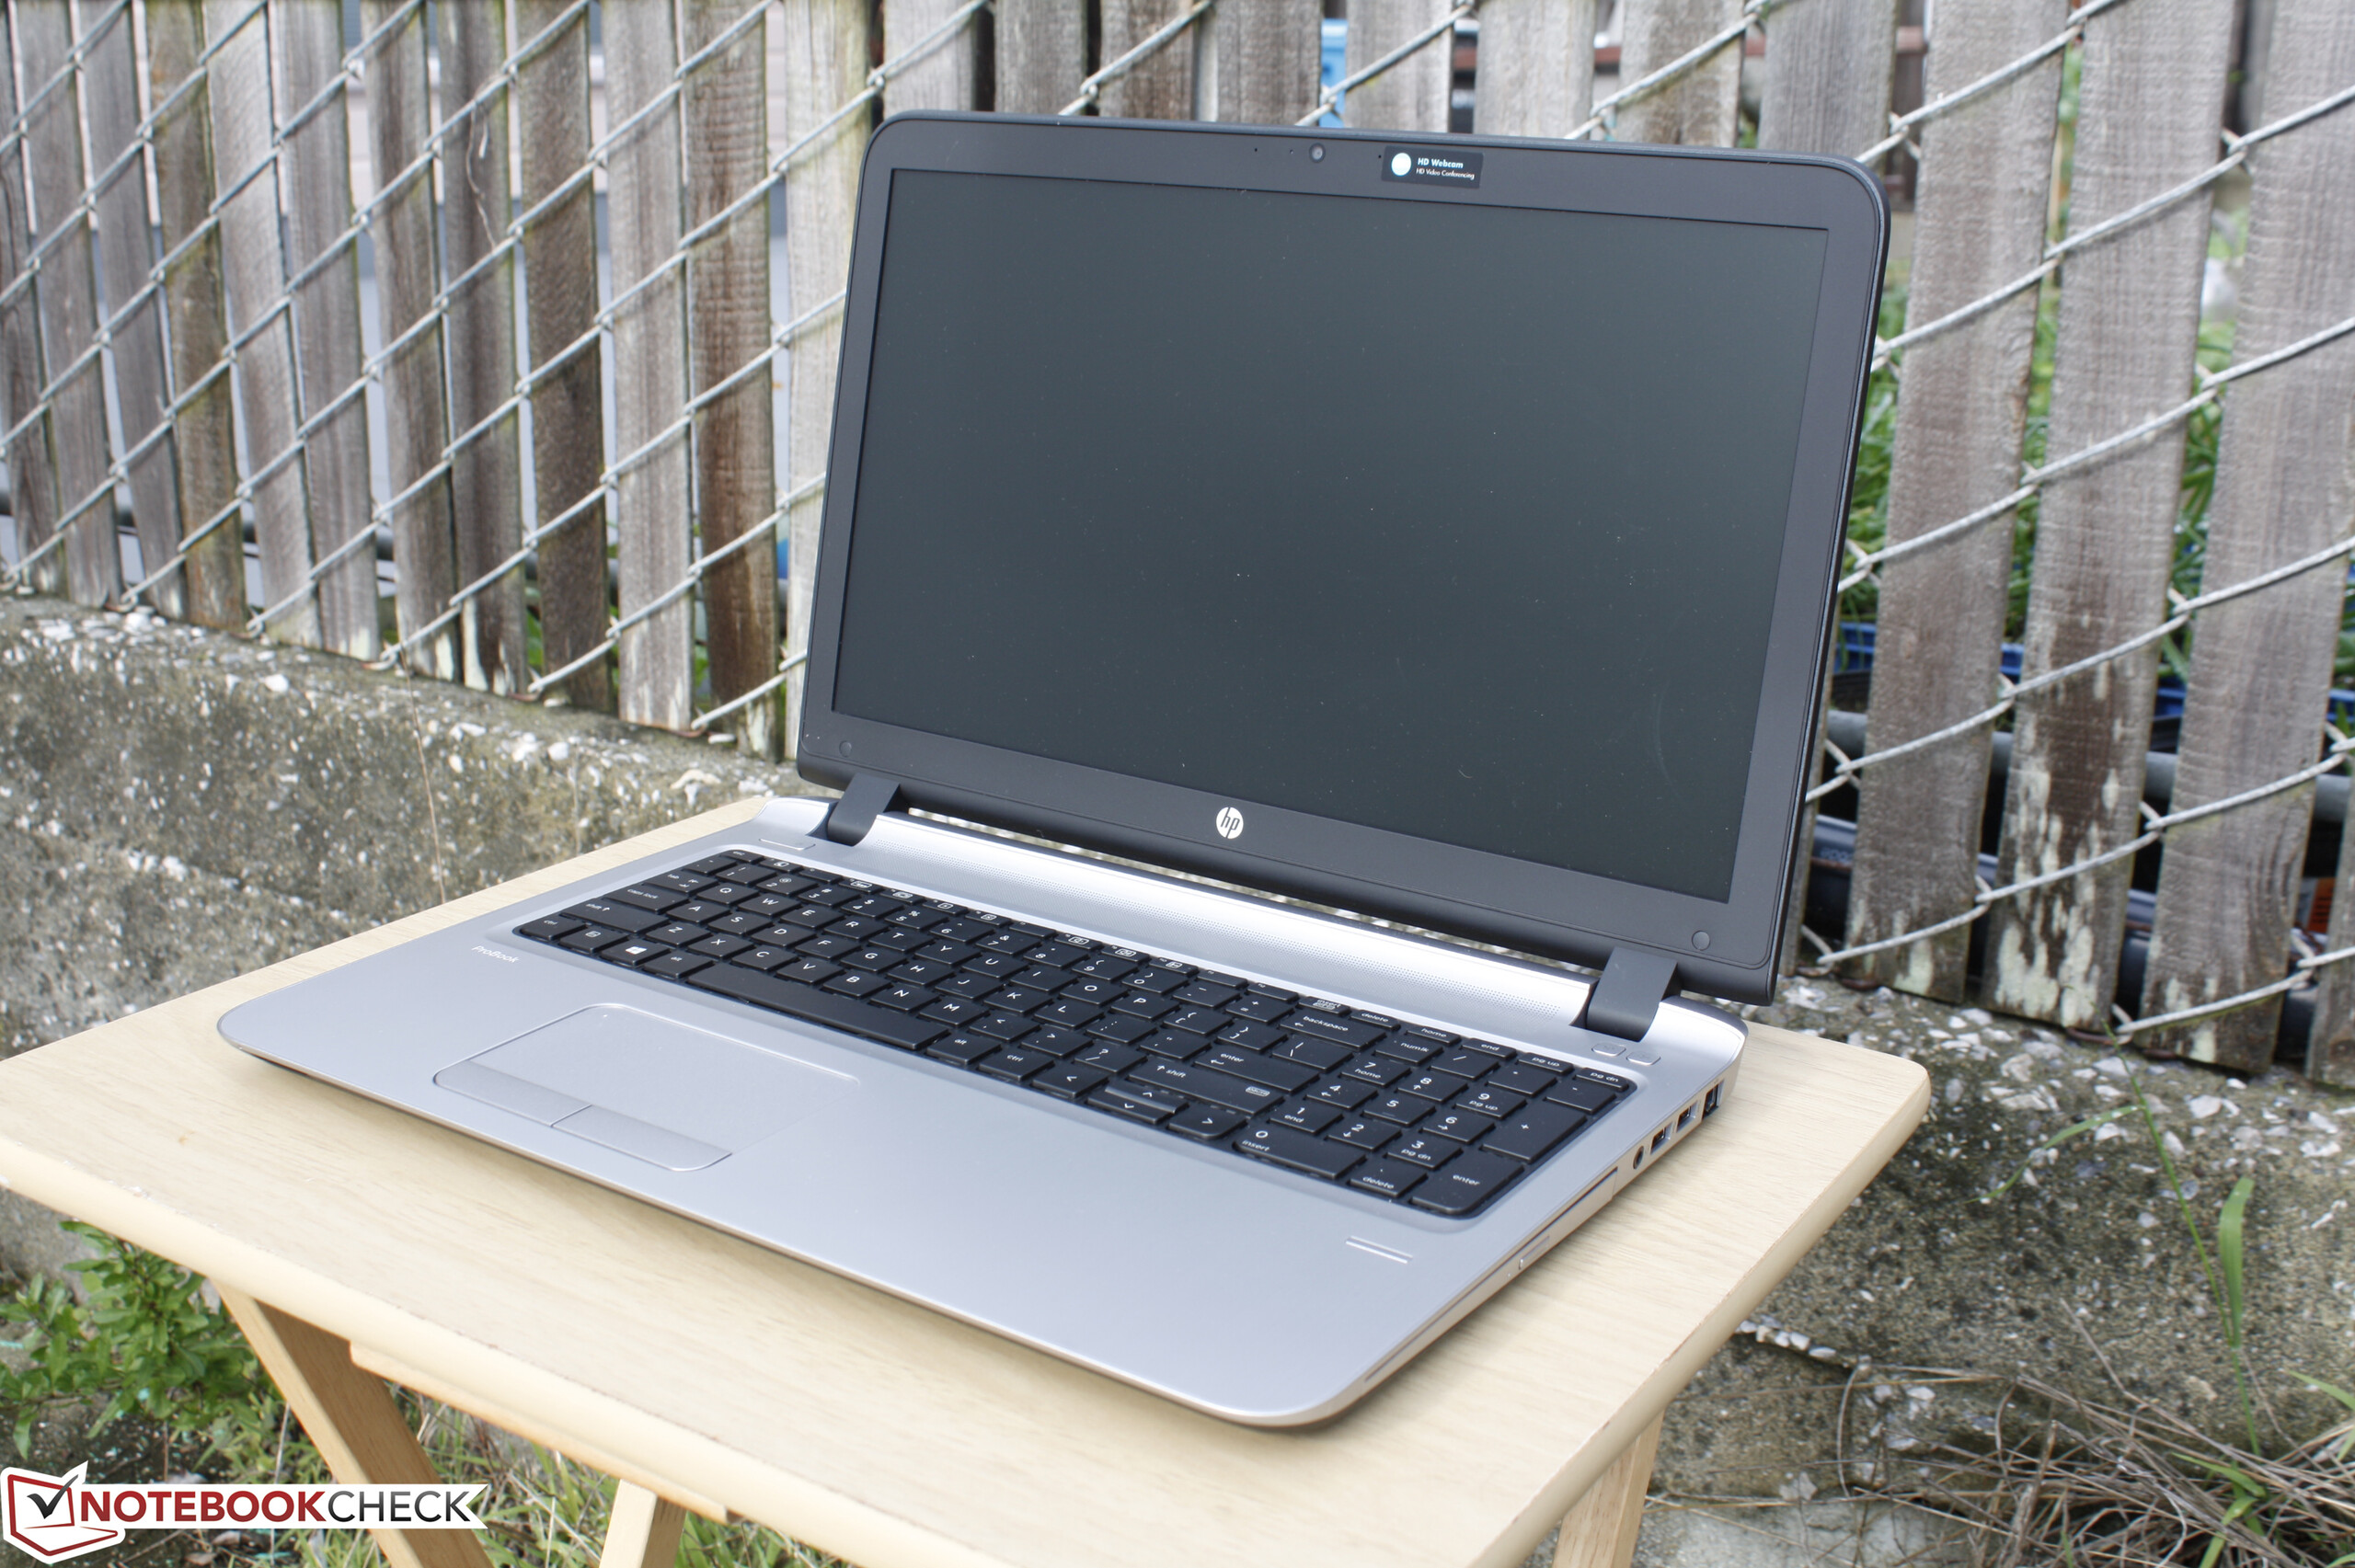
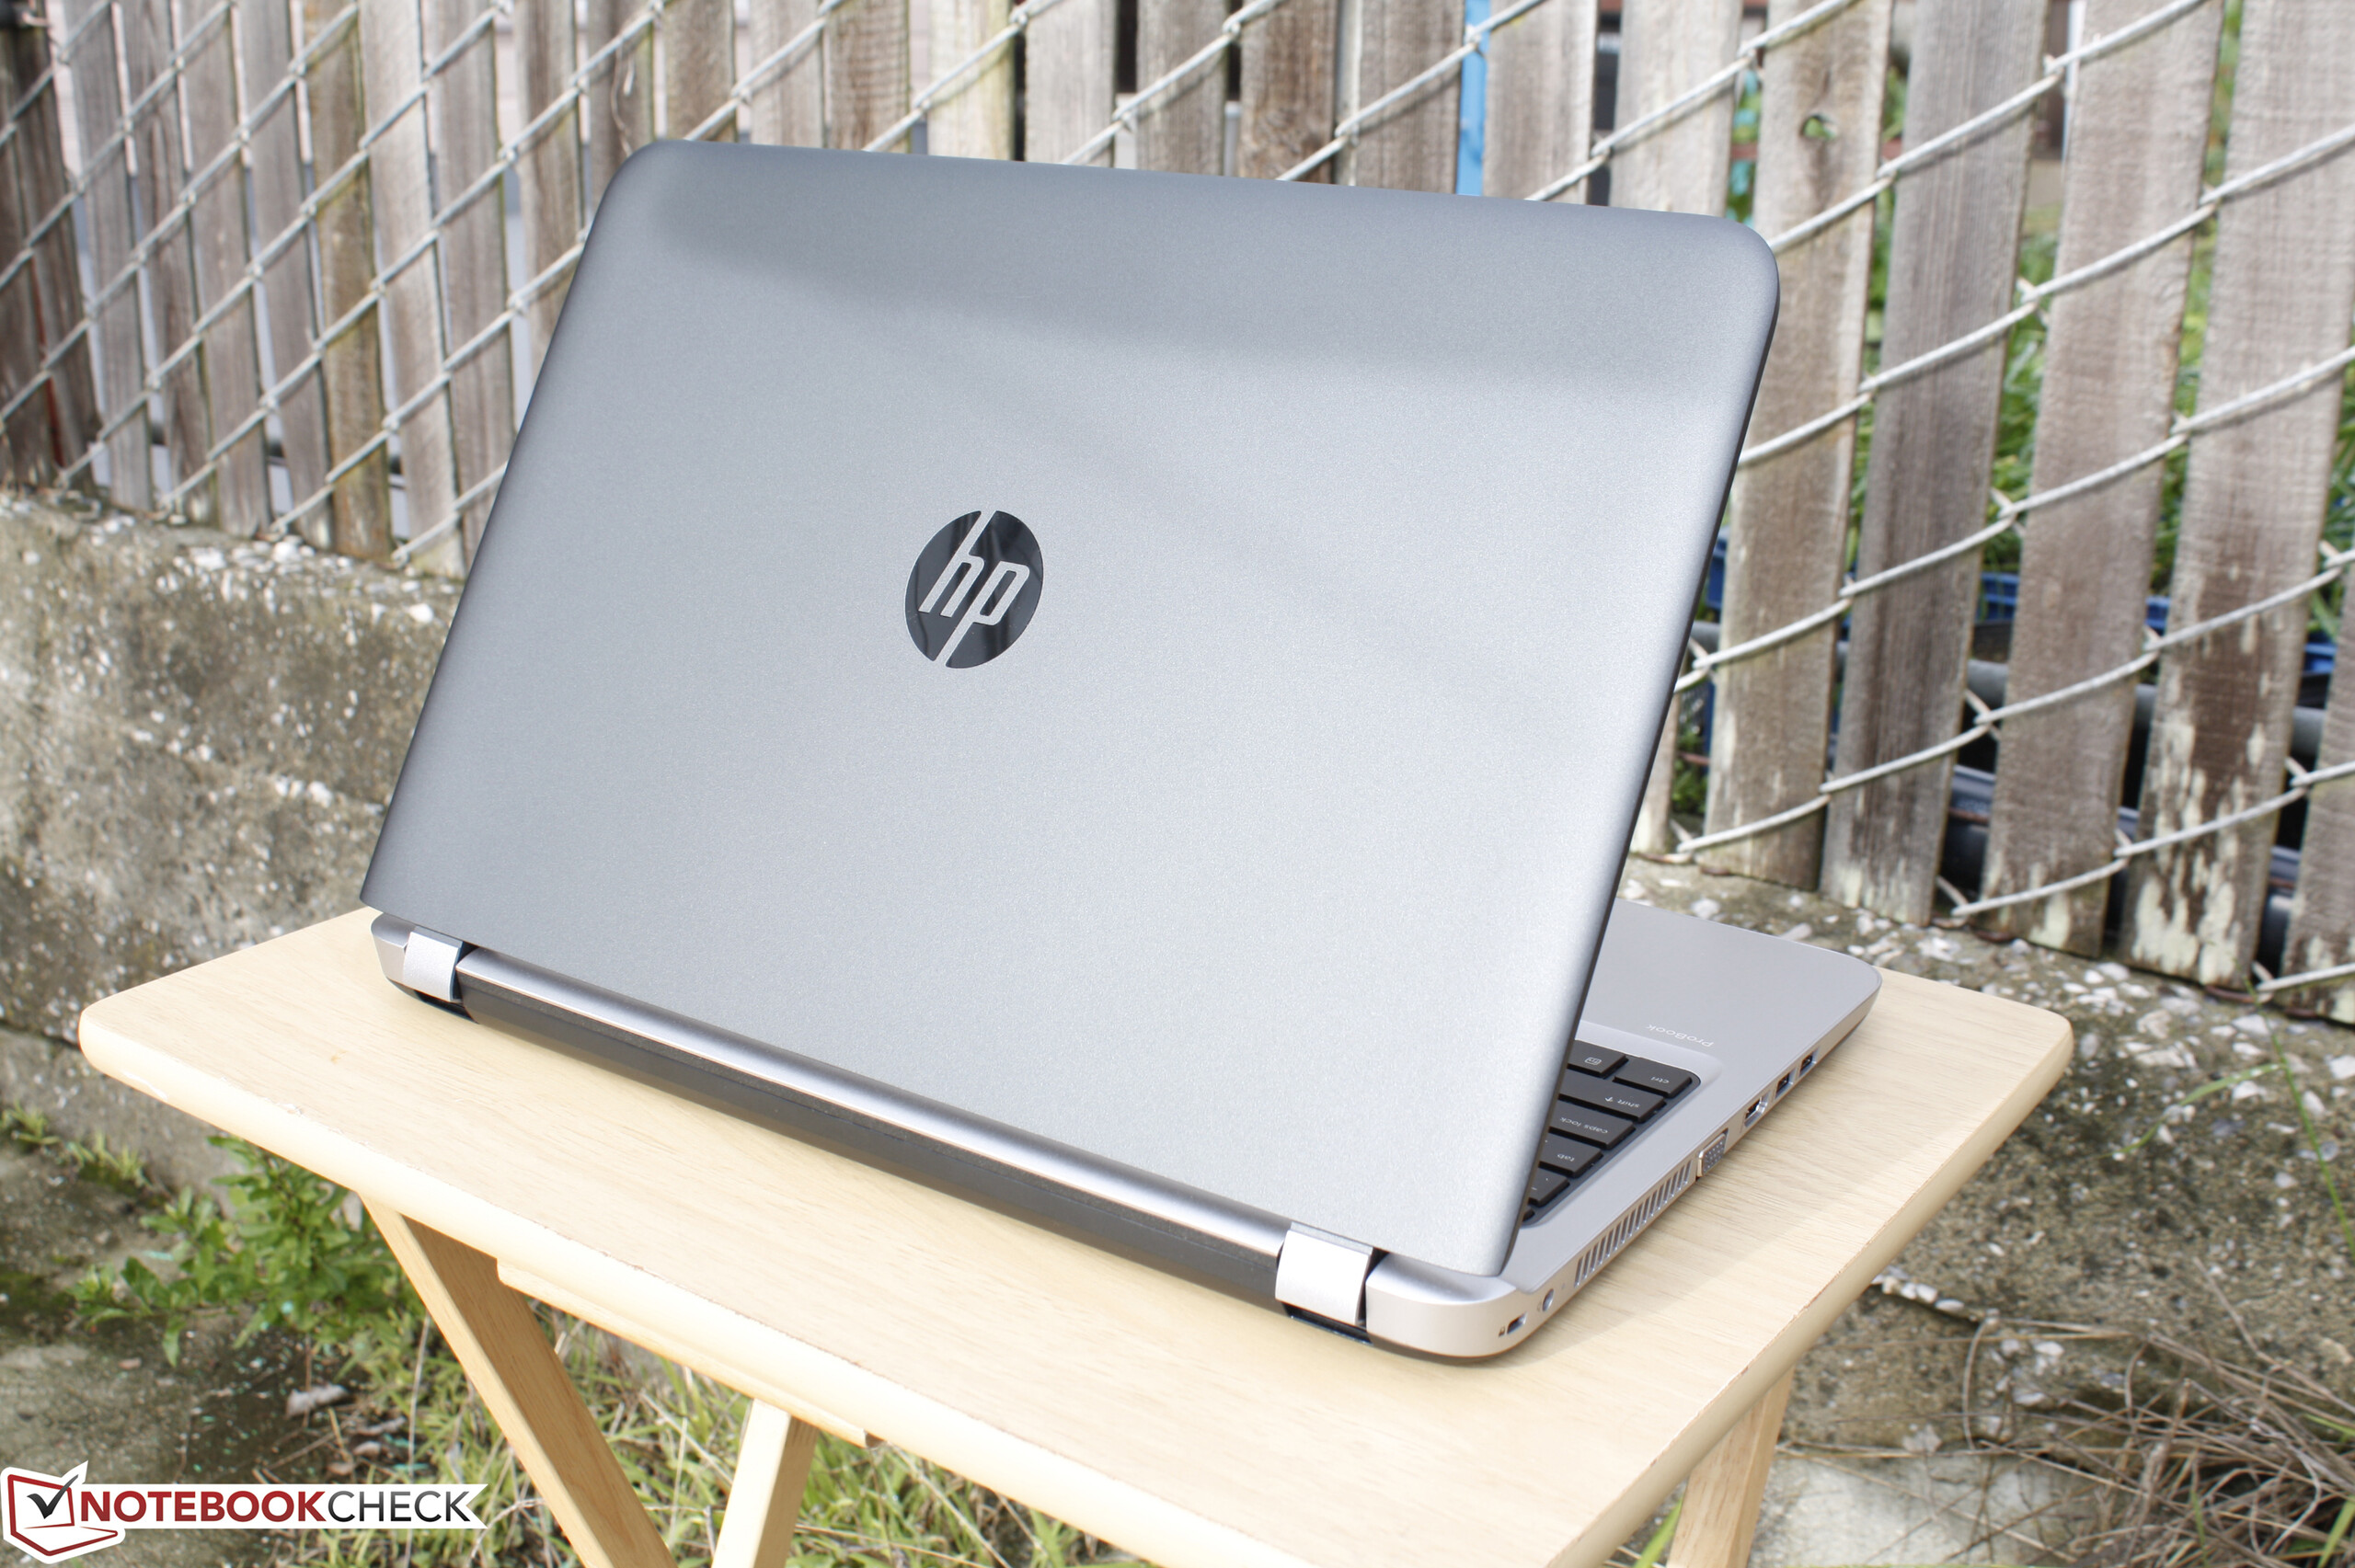
惠普 ProBook 455 G3 T1B79UT 笔记本电脑简短评测

| SD Card Reader | |
| average JPG Copy Test (av. of 3 runs) | |
| MSI GT73VR 6RF | |
| Dell XPS 13 9360 FHD i5 | |
| HP ProBook 455 T1B79UT | |
| maximum AS SSD Seq Read Test (1GB) | |
| Dell XPS 13 9360 FHD i5 | |
| MSI GT73VR 6RF | |
| HP ProBook 455 T1B79UT | |
| Networking | |
| iperf3 receive AX12 | |
| Dell XPS 13 9360 FHD i5 | |
| HP Pavilion x360 15t X3W72AV | |
| HP ProBook 455 T1B79UT | |
| iperf3 transmit AX12 | |
| Dell XPS 13 9360 FHD i5 | |
| HP Pavilion x360 15t X3W72AV | |
| HP ProBook 455 T1B79UT | |
Warranty
The usual one-year limited warranty period applies to new purchases made in the US.
| |||||||||||||||||||||||||
Brightness Distribution: 72 %
Center on Battery: 245.3 cd/m²
Contrast: 598:1 (Black: 0.41 cd/m²)
ΔE ColorChecker Calman: 9.4 | ∀{0.5-29.43 Ø4.72}
ΔE Greyscale Calman: 11.1 | ∀{0.09-98 Ø4.97}
66.1% sRGB (Argyll 1.6.3 3D)
42.3% AdobeRGB 1998 (Argyll 1.6.3 3D)
45.98% AdobeRGB 1998 (Argyll 3D)
66.4% sRGB (Argyll 3D)
44.46% Display P3 (Argyll 3D)
Gamma: 2.27
CCT: 12802 K
| HP ProBook 455 T1B79UT TN, 15.6", 1366x768 | HP 15z-ba000 BOE06A4, TN, 15.6", 1366x768 | Dell Latitude 15-3570 LG Philips LGD04AF / 156WHU, TN LED, 15.6", 1366x768 | Lenovo ThinkPad E560 20EV000MGE Lenovo N156B6-L07, TN LED, 15.6", 1366x768 | Asus F555UB-XO043T AU Optronics B156XTN04.6, TN LED, 15.6", 1366x768 | |
|---|---|---|---|---|---|
| Display | -13% | -9% | -15% | -14% | |
| Display P3 Coverage (%) | 44.46 | 38.58 -13% | 40.61 -9% | 37.63 -15% | 38.22 -14% |
| sRGB Coverage (%) | 66.4 | 57.7 -13% | 61.1 -8% | 56.7 -15% | 57.5 -13% |
| AdobeRGB 1998 Coverage (%) | 45.98 | 39.86 -13% | 41.96 -9% | 38.88 -15% | 39.49 -14% |
| Response Times | 0% | -1% | 7% | 5% | |
| Response Time Grey 50% / Grey 80% * (ms) | 45.2 ? | 41.2 ? 9% | 37 ? 18% | 50 ? -11% | 46 ? -2% |
| Response Time Black / White * (ms) | 30.8 ? | 33.6 ? -9% | 37 ? -20% | 23 ? 25% | 27 ? 12% |
| PWM Frequency (Hz) | 198.4 ? | 595 ? | 50 ? | ||
| Screen | 4% | -17% | -10% | 5% | |
| Brightness middle (cd/m²) | 245.3 | 244.5 0% | 202 -18% | 241 -2% | 214 -13% |
| Brightness (cd/m²) | 231 | 232 0% | 211 -9% | 226 -2% | 205 -11% |
| Brightness Distribution (%) | 72 | 80 11% | 88 22% | 89 24% | 82 14% |
| Black Level * (cd/m²) | 0.41 | 0.385 6% | 0.62 -51% | 0.48 -17% | 0.46 -12% |
| Contrast (:1) | 598 | 635 6% | 326 -45% | 502 -16% | 465 -22% |
| Colorchecker dE 2000 * | 9.4 | 8.62 8% | 12.35 -31% | 12.43 -32% | 6.52 31% |
| Colorchecker dE 2000 max. * | 20 | 17.38 13% | 19.9 1% | 21.03 -5% | 9.1 55% |
| Greyscale dE 2000 * | 11.1 | 9.8 12% | 13.46 -21% | 13.24 -19% | 7.05 36% |
| Gamma | 2.27 97% | 2.09 105% | 2.44 90% | 2.61 84% | 2.41 91% |
| CCT | 12802 51% | 11391 57% | 15217 43% | 15733 41% | 8623 75% |
| Color Space (Percent of AdobeRGB 1998) (%) | 42.3 | 39.86 -6% | 39 -8% | 36 -15% | 36.6 -13% |
| Color Space (Percent of sRGB) (%) | 66.1 | 57.71 -13% | 61 -8% | 57 -14% | 57.8 -13% |
| Total Average (Program / Settings) | -3% /
-0% | -9% /
-13% | -6% /
-9% | -1% /
1% |
* ... smaller is better
Display Response Times
| ↔ Response Time Black to White | ||
|---|---|---|
| 30.8 ms ... rise ↗ and fall ↘ combined | ↗ 11.2 ms rise | 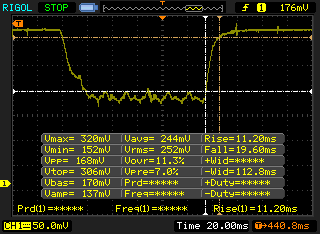 |
| ↘ 19.6 ms fall | ||
| The screen shows slow response rates in our tests and will be unsatisfactory for gamers. In comparison, all tested devices range from 0.1 (minimum) to 240 (maximum) ms. » 83 % of all devices are better. This means that the measured response time is worse than the average of all tested devices (19.8 ms). | ||
| ↔ Response Time 50% Grey to 80% Grey | ||
| 45.2 ms ... rise ↗ and fall ↘ combined | ↗ 23.2 ms rise | 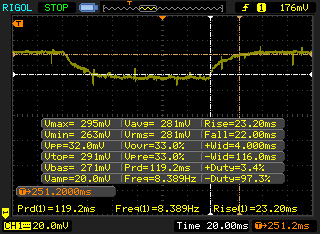 |
| ↘ 22 ms fall | ||
| The screen shows slow response rates in our tests and will be unsatisfactory for gamers. In comparison, all tested devices range from 0.165 (minimum) to 636 (maximum) ms. » 78 % of all devices are better. This means that the measured response time is worse than the average of all tested devices (31 ms). | ||
Screen Flickering / PWM (Pulse-Width Modulation)
| Screen flickering / PWM detected | 198.4 Hz | ≤ 99 % brightness setting | 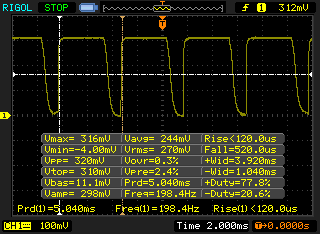 |
The display backlight flickers at 198.4 Hz (worst case, e.g., utilizing PWM) Flickering detected at a brightness setting of 99 % and below. There should be no flickering or PWM above this brightness setting. The frequency of 198.4 Hz is relatively low, so sensitive users will likely notice flickering and experience eyestrain at the stated brightness setting and below. In comparison: 52 % of all tested devices do not use PWM to dim the display. If PWM was detected, an average of 7775 (minimum: 5 - maximum: 343500) Hz was measured. | |||
| Cinebench R15 | |
| CPU Single 64Bit | |
| Dell XPS 13 9360 FHD i5 | |
| Acer TravelMate P249-M-5452 | |
| HP 250 G4 T6P08ES | |
| Lenovo IdeaPad Z40-59422614 | |
| HP ProBook 455 T1B79UT | |
| HP 250 G5 Y1V08UT | |
| CPU Multi 64Bit | |
| Dell XPS 13 9360 FHD i5 | |
| Acer TravelMate P249-M-5452 | |
| HP 250 G4 T6P08ES | |
| Lenovo IdeaPad Z40-59422614 | |
| HP ProBook 455 T1B79UT | |
| HP 250 G5 Y1V08UT | |
| Cinebench R11.5 | |
| CPU Single 64Bit | |
| Dell XPS 13 9360 FHD i5 | |
| Acer TravelMate P249-M-5452 | |
| HP 250 G4 T6P08ES | |
| Lenovo IdeaPad Z40-59422614 | |
| HP ProBook 455 T1B79UT | |
| HP 250 G5 Y1V08UT | |
| CPU Multi 64Bit | |
| Dell XPS 13 9360 FHD i5 | |
| Acer TravelMate P249-M-5452 | |
| HP 250 G4 T6P08ES | |
| Lenovo IdeaPad Z40-59422614 | |
| HP ProBook 455 T1B79UT | |
| HP 250 G5 Y1V08UT | |
| Cinebench R10 | |
| Rendering Multiple CPUs 32Bit | |
| Dell XPS 13 9360 FHD i5 | |
| Acer TravelMate P249-M-5452 | |
| HP 250 G4 T6P08ES | |
| Lenovo IdeaPad Z40-59422614 | |
| HP ProBook 455 T1B79UT | |
| HP 250 G5 Y1V08UT | |
| Rendering Single 32Bit | |
| Dell XPS 13 9360 FHD i5 | |
| Acer TravelMate P249-M-5452 | |
| HP 250 G4 T6P08ES | |
| Lenovo IdeaPad Z40-59422614 | |
| HP ProBook 455 T1B79UT | |
| HP 250 G5 Y1V08UT | |
| wPrime 2.10 - 1024m | |
| HP 250 G5 Y1V08UT | |
| Lenovo IdeaPad Z40-59422614 | |
| HP ProBook 455 T1B79UT | |
| Super Pi Mod 1.5 XS 32M - 32M | |
| HP 250 G5 Y1V08UT | |
| HP ProBook 455 T1B79UT | |
| Lenovo IdeaPad Z40-59422614 | |
| Dell XPS 13 9360 FHD i5 | |
* ... smaller is better
| PCMark 8 | |
| Home Score Accelerated v2 | |
| Dell XPS 13 9360 FHD i5 | |
| Acer TravelMate P249-M-5452 | |
| HP 250 G4 T6P08ES | |
| HP ProBook 455 T1B79UT | |
| Lenovo IdeaPad Z40-59422614 | |
| HP 250 G5 Y1V08UT | |
| Work Score Accelerated v2 | |
| Dell XPS 13 9360 FHD i5 | |
| Acer TravelMate P249-M-5452 | |
| HP 250 G4 T6P08ES | |
| HP ProBook 455 T1B79UT | |
| Lenovo IdeaPad Z40-59422614 | |
| HP 250 G5 Y1V08UT | |
| Creative Score Accelerated v2 | |
| Dell XPS 13 9360 FHD i5 | |
| Acer TravelMate P249-M-5452 | |
| HP 250 G4 T6P08ES | |
| HP ProBook 455 T1B79UT | |
| Lenovo IdeaPad Z40-59422614 | |
| HP 250 G5 Y1V08UT | |
| PCMark 8 Home Score Accelerated v2 | 2577 points | |
| PCMark 8 Creative Score Accelerated v2 | 3086 points | |
| PCMark 8 Work Score Accelerated v2 | 3511 points | |
Help | ||
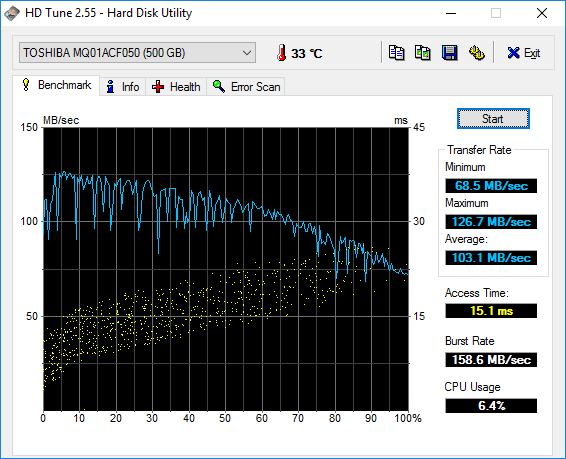
| HP ProBook 455 T1B79UT Toshiba MQ01ACF050 | HP 15z-ba000 Adata IM2S3138E-128GM-B | Dell Latitude 15-3570 Samsung CM871 MZNLF128HCHP | Lenovo ThinkPad E560 20EV000MGE Western Digital WD Black Mobile 500GB (WD5000LPLX) | Lenovo Yoga 510-15IKB 80VC000XGE Samsung MZYTY256HDHP | |
|---|---|---|---|---|---|
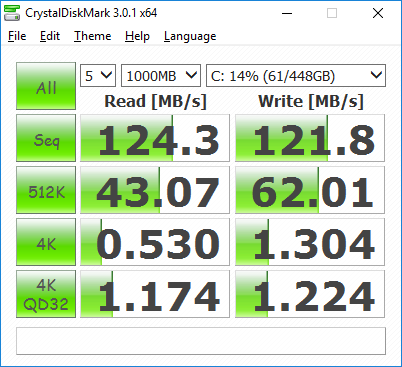
| CrystalDiskMark 3.0 | 4322% | 1964% | -7% | 8581% | |
| Read Seq (MB/s) | 124.3 | 397.9 220% | 453.2 265% | 120.4 -3% | 529 326% |
| Write Seq (MB/s) | 121.8 | 171.4 41% | 137.7 13% | 123.1 1% | 508 317% |
| Read 512 (MB/s) | 43.07 | 367.5 753% | 308.5 616% | 34.31 -20% | 409.8 851% |
| Write 512 (MB/s) | 62 | 172.3 178% | 134.1 116% | 66.8 8% | 316.5 410% |
| Read 4k (MB/s) | 0.53 | 26.11 4826% | 19.06 3496% | 0.373 -30% | 36.01 6694% |
| Write 4k (MB/s) | 1.304 | 52.3 3911% | 21.31 1534% | 1.29 -1% | 106.7 8083% |
| Read 4k QD32 (MB/s) | 1.174 | 164.3 13895% | 93.5 7864% | 0.976 -17% | 384.8 32677% |
| Write 4k QD32 (MB/s) | 1.224 | 132.8 10750% | 23.3 1804% | 1.285 5% | 237.3 19287% |

| 3DMark 11 | |
| 1280x720 Performance GPU | |
| HP 250 G4 T6P08ES | |
| Dell XPS 13 9360 FHD i5 | |
| HP ProBook 455 T1B79UT | |
| Acer TravelMate P249-M-5452 | |
| Lenovo IdeaPad Z40-59422614 | |
| HP 250 G5 Y1V08UT | |
| 1280x720 Performance Combined | |
| HP 250 G4 T6P08ES | |
| Dell XPS 13 9360 FHD i5 | |
| Acer TravelMate P249-M-5452 | |
| Lenovo IdeaPad Z40-59422614 | |
| HP ProBook 455 T1B79UT | |
| HP 250 G5 Y1V08UT | |
| 3DMark | |
| 1280x720 Cloud Gate Standard Graphics | |
| Dell XPS 13 9360 FHD i5 | |
| Acer TravelMate P249-M-5452 | |
| Lenovo IdeaPad Z40-59422614 | |
| HP 250 G4 T6P08ES | |
| HP ProBook 455 T1B79UT | |
| HP 250 G5 Y1V08UT | |
| 1920x1080 Fire Strike Graphics | |
| HP 250 G4 T6P08ES | |
| Dell XPS 13 9360 FHD i5 | |
| Lenovo IdeaPad Z40-59422614 | |
| HP ProBook 455 T1B79UT | |
| Acer TravelMate P249-M-5452 | |
| 1920x1080 Ice Storm Extreme Graphics | |
| Dell XPS 13 9360 FHD i5 | |
| Acer TravelMate P249-M-5452 | |
| HP ProBook 455 T1B79UT | |
| HP 250 G5 Y1V08UT | |
| 3DMark 11 Performance | 1457 points | |
| 3DMark Ice Storm Standard Score | 36716 points | |
| 3DMark Cloud Gate Standard Score | 3463 points | |
| 3DMark Fire Strike Score | 736 points | |
| 3DMark Fire Strike Extreme Score | 373 points | |
Help | ||
| BioShock Infinite | |
| 1280x720 Very Low Preset | |
| Acer TravelMate P249-M-5452 | |
| HP 250 G4 T6P08ES | |
| Acer TravelMate P257-M-56AX | |
| HP ProBook 455 T1B79UT | |
| Asus UX32LA-R3025H | |
| Acer Aspire E5-774-54HJ | |
| 1366x768 Medium Preset | |
| HP 250 G4 T6P08ES | |
| Acer TravelMate P249-M-5452 | |
| HP ProBook 455 T1B79UT | |
| Acer TravelMate P257-M-56AX | |
| Acer Aspire E5-774-54HJ | |
| Asus UX32LA-R3025H | |
| 1366x768 High Preset | |
| HP 250 G4 T6P08ES | |
| Acer TravelMate P249-M-5452 | |
| HP ProBook 455 T1B79UT | |
| Acer Aspire E5-774-54HJ | |
| Asus UX32LA-R3025H | |
| low | med. | high | ultra | |
|---|---|---|---|---|
| BioShock Infinite (2013) | 40.9 | 24.4 | 19.2 | |
| Metro: Last Light (2013) | 15.4 | |||
| Rise of the Tomb Raider (2016) | 16.8 | |||
| Overwatch (2016) | 26.1 |
| CPU Clock (GHz) | GPU Clock (MHz) | Average CPU Temperature (°C) | |
| Prime95 Stress | 2.3 | -- | 63 |
| FurMark Stress | -- | 720 | 57 |
| Prime95 + FurMark Stress | 1.3 | 617 | 62 |
| Unigine Heaven Stress | 1.3 - 1.8 | 642 | 60 |
Emissions
Noise level
| Idle |
| 32.4 / 32.4 / 32.5 dB(A) |
| Load |
| 35.5 / 36.6 dB(A) |
 | ||
30 dB silent 40 dB(A) audible 50 dB(A) loud |
||
min: | ||
| HP ProBook 455 T1B79UT Radeon R6 (Carrizo), A10-8700P, Toshiba MQ01ACF050 | HP 15z-ba000 Radeon R4 (Beema), A6-7310, Adata IM2S3138E-128GM-B | Dell Latitude 15-3570 HD Graphics 520, 6200U, Samsung CM871 MZNLF128HCHP | Lenovo ThinkPad E560 20EV000MGE HD Graphics 520, 6100U, Western Digital WD Black Mobile 500GB (WD5000LPLX) | Lenovo Yoga 510-15IKB 80VC000XGE Radeon R7 M460, i5-7200U, Samsung MZYTY256HDHP | |
|---|---|---|---|---|---|
| Noise | -0% | 3% | -3% | 0% | |
| off / environment * (dB) | 28.8 | 28.6 1% | 31 -8% | 31.2 -8% | 30.15 -5% |
| Idle Minimum * (dB) | 32.4 | 31.6 2% | 31 4% | 32.3 -0% | 30.2 7% |
| Idle Average * (dB) | 32.4 | 31.6 2% | 31 4% | 32.3 -0% | 30.2 7% |
| Idle Maximum * (dB) | 32.5 | 31.6 3% | 31 5% | 32.5 -0% | 31 5% |
| Load Average * (dB) | 35.5 | 37.2 -5% | 34.2 4% | 36 -1% | 38 -7% |
| Load Maximum * (dB) | 36.6 | 38.2 -4% | 34.3 6% | 38.8 -6% | 38.6 -5% |
* ... smaller is better
(±) The maximum temperature on the upper side is 44 °C / 111 F, compared to the average of 34.3 °C / 94 F, ranging from 21.2 to 62.5 °C for the class Office.
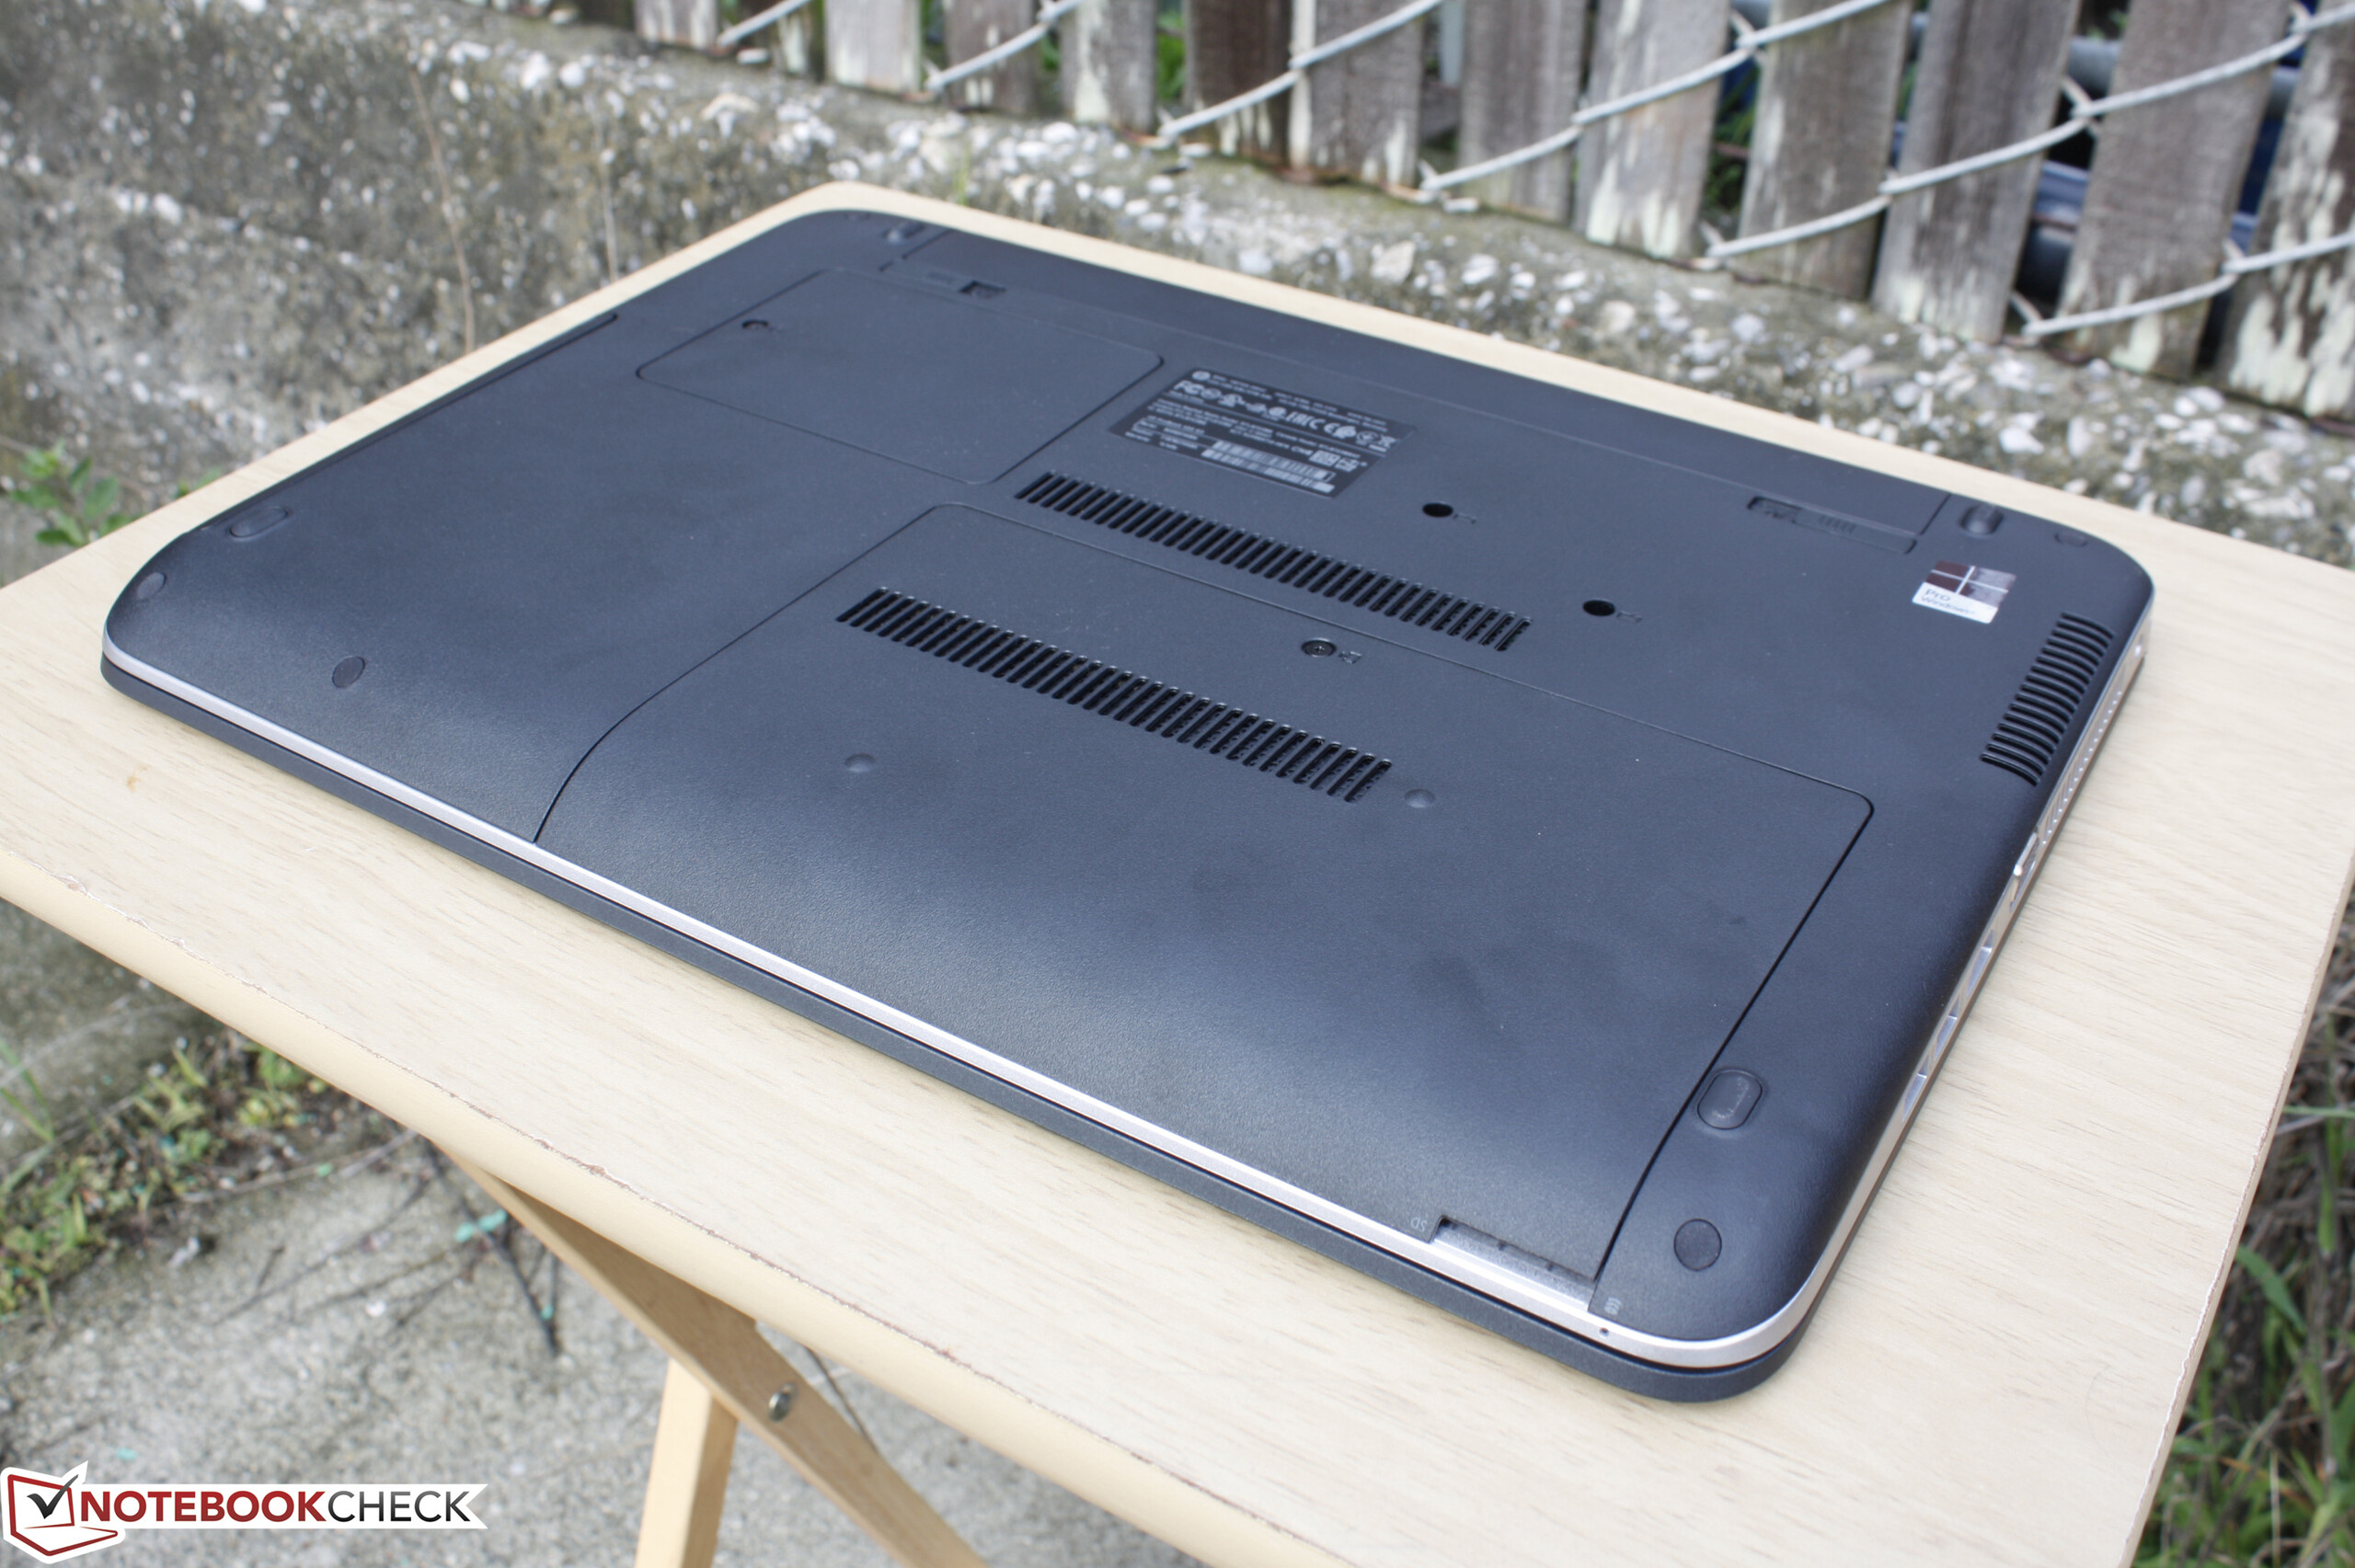
(±) The bottom heats up to a maximum of 42 °C / 108 F, compared to the average of 36.8 °C / 98 F
(+) In idle usage, the average temperature for the upper side is 24.8 °C / 77 F, compared to the device average of 29.5 °C / 85 F.
(+) The palmrests and touchpad are cooler than skin temperature with a maximum of 25.8 °C / 78.4 F and are therefore cool to the touch.
(±) The average temperature of the palmrest area of similar devices was 27.5 °C / 81.5 F (+1.7 °C / 3.1 F).
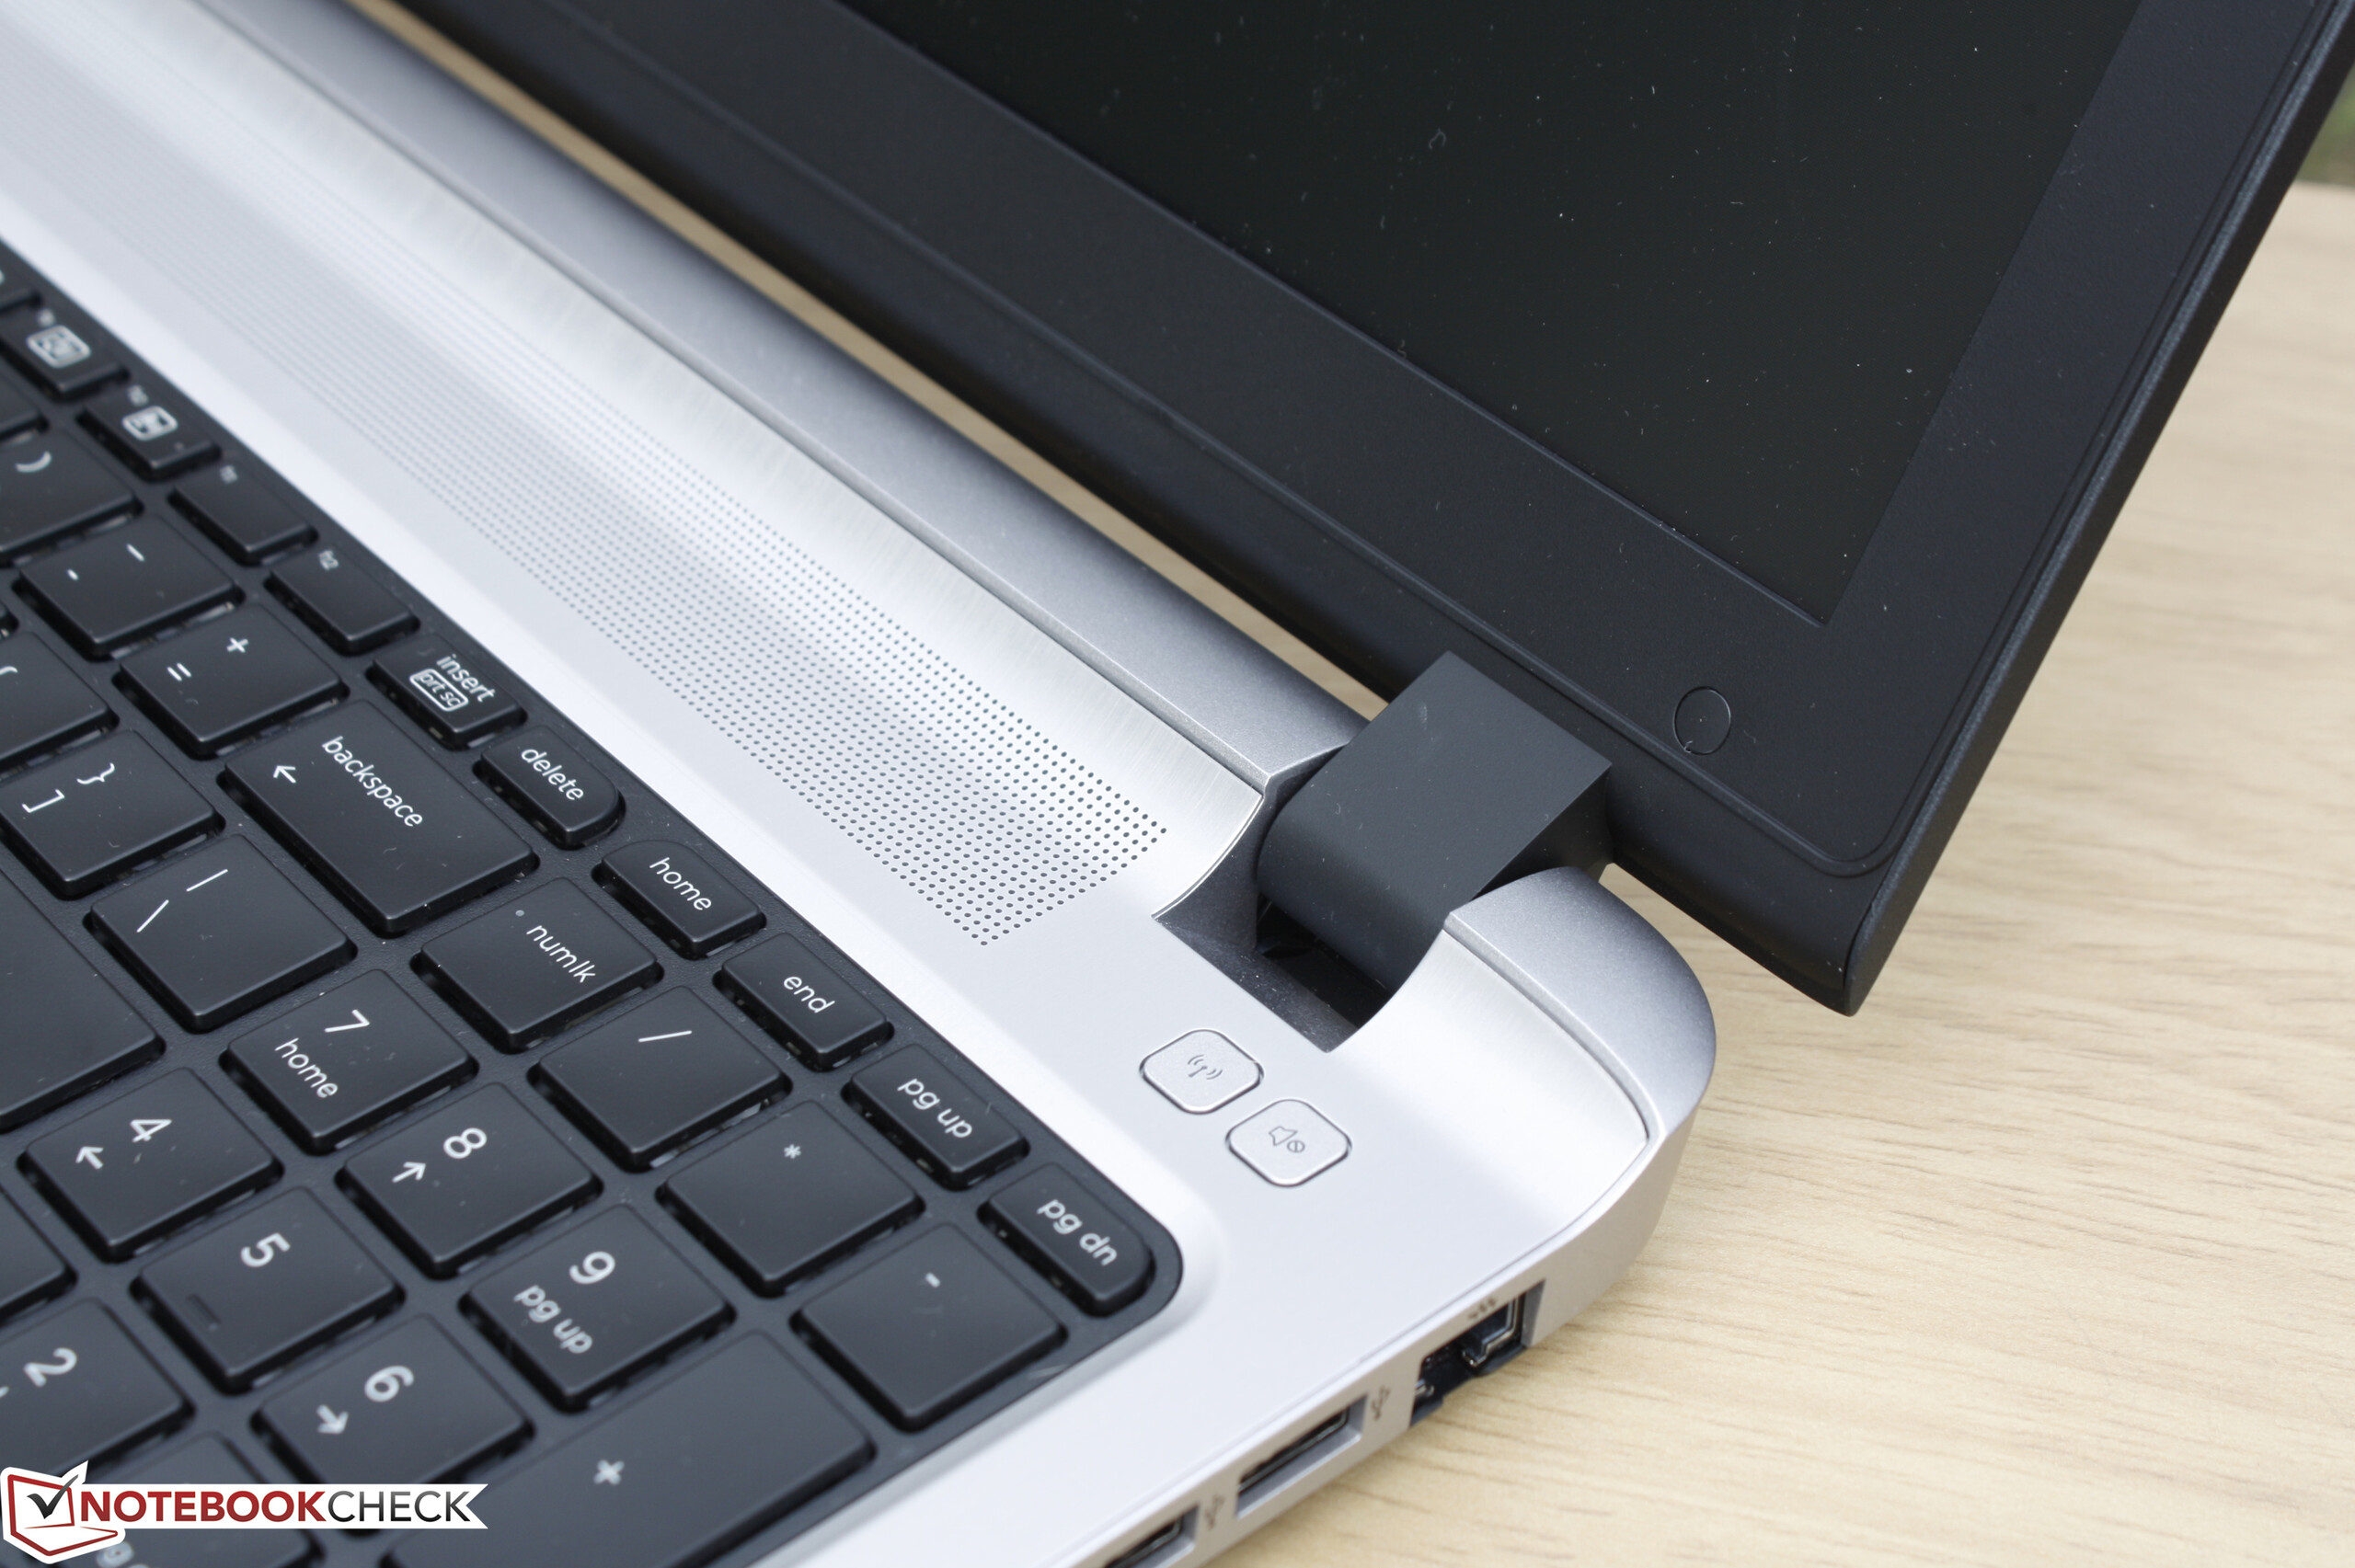
HP ProBook 455 T1B79UT audio analysis
(±) | speaker loudness is average but good (77.6 dB)
Bass 100 - 315 Hz
(-) | nearly no bass - on average 26.8% lower than median
(±) | linearity of bass is average (11.8% delta to prev. frequency)
Mids 400 - 2000 Hz
(+) | balanced mids - only 3.6% away from median
(±) | linearity of mids is average (9.7% delta to prev. frequency)
Highs 2 - 16 kHz
(+) | balanced highs - only 2.8% away from median
(+) | highs are linear (6.2% delta to prev. frequency)
Overall 100 - 16.000 Hz
(±) | linearity of overall sound is average (28.1% difference to median)
Compared to same class
» 88% of all tested devices in this class were better, 3% similar, 9% worse
» The best had a delta of 7%, average was 21%, worst was 53%
Compared to all devices tested
» 85% of all tested devices were better, 3% similar, 12% worse
» The best had a delta of 4%, average was 24%, worst was 134%
Apple MacBook 12 (Early 2016) 1.1 GHz audio analysis
(+) | speakers can play relatively loud (83.6 dB)
Bass 100 - 315 Hz
(±) | reduced bass - on average 11.3% lower than median
(±) | linearity of bass is average (14.2% delta to prev. frequency)
Mids 400 - 2000 Hz
(+) | balanced mids - only 2.4% away from median
(+) | mids are linear (5.5% delta to prev. frequency)
Highs 2 - 16 kHz
(+) | balanced highs - only 2% away from median
(+) | highs are linear (4.5% delta to prev. frequency)
Overall 100 - 16.000 Hz
(+) | overall sound is linear (10.2% difference to median)
Compared to same class
» 7% of all tested devices in this class were better, 2% similar, 91% worse
» The best had a delta of 5%, average was 18%, worst was 53%
Compared to all devices tested
» 5% of all tested devices were better, 1% similar, 94% worse
» The best had a delta of 4%, average was 24%, worst was 134%
Frequency Comparison (Checkbox selectable!)
Graph 1: Pink Noise 100% Vol.; Graph 2: Audio off
Energy Management
| Off / Standby | |
| Idle | |
| Load |
|
Key:
min: | |
| HP ProBook 455 T1B79UT A10-8700P, Radeon R6 (Carrizo), Toshiba MQ01ACF050, TN, 1366x768, 15.6" | HP 15z-ba000 A6-7310, Radeon R4 (Beema), Adata IM2S3138E-128GM-B, TN, 1366x768, 15.6" | Dell Latitude 15-3570 6200U, HD Graphics 520, Samsung CM871 MZNLF128HCHP, TN LED, 1366x768, 15.6" | Lenovo ThinkPad E560 20EV000MGE 6100U, HD Graphics 520, Western Digital WD Black Mobile 500GB (WD5000LPLX), TN LED, 1366x768, 15.6" | Lenovo Yoga 510-15IKB 80VC000XGE i5-7200U, Radeon R7 M460, Samsung MZYTY256HDHP, IPS, 1920x1080, 15.6" | |
|---|---|---|---|---|---|
| Power Consumption | 29% | 23% | 23% | 9% | |
| Idle Minimum * (Watt) | 5.9 | 5.22 12% | 4.9 17% | 5.2 12% | 3.9 34% |
| Idle Average * (Watt) | 8.2 | 5.67 31% | 7.2 12% | 7.25 12% | 7.8 5% |
| Idle Maximum * (Watt) | 9.9 | 7.82 21% | 7.5 24% | 7.9 20% | 8.4 15% |
| Load Average * (Watt) | 37.5 | 19.67 48% | 25.4 32% | 25.1 33% | 37 1% |
| Load Maximum * (Watt) | 41 | 26.72 35% | 28 32% | 25.1 39% | 46 -12% |
* ... smaller is better
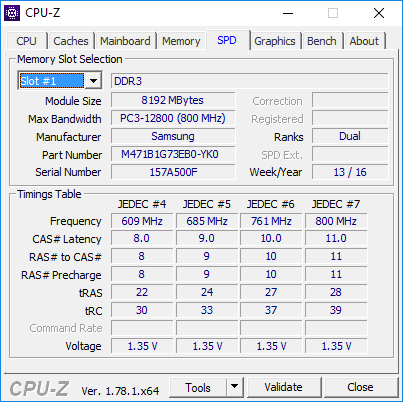
| HP ProBook 455 T1B79UT A10-8700P, Radeon R6 (Carrizo), 44 Wh | HP 15z-ba000 A6-7310, Radeon R4 (Beema), 31 Wh | Dell Latitude 15-3570 6200U, HD Graphics 520, 65 Wh | Lenovo ThinkPad E560 20EV000MGE 6100U, HD Graphics 520, 48 Wh | Lenovo Yoga 510-15IKB 80VC000XGE i5-7200U, Radeon R7 M460, 35 Wh | |
|---|---|---|---|---|---|
| Battery runtime | 21% | 114% | 109% | 33% | |
| Reader / Idle (h) | 9.5 | 8.5 -11% | 17.1 80% | 14.8 56% | |
| WiFi v1.3 (h) | 4 | 4.1 2% | 9 125% | 9.4 135% | 5.3 33% |
| Load (h) | 1.1 | 1.9 73% | 2.6 136% | 2.6 136% |
Pros
Cons
Verdict
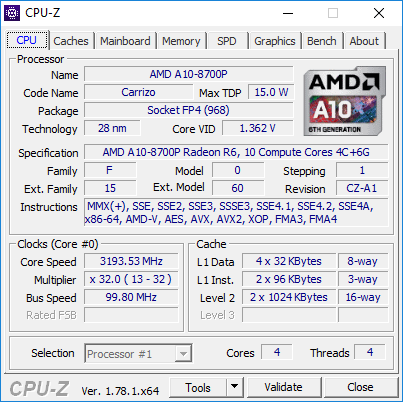
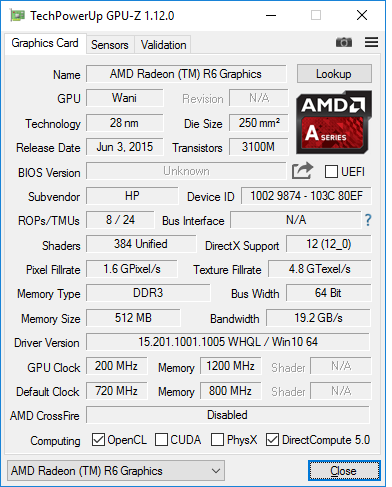
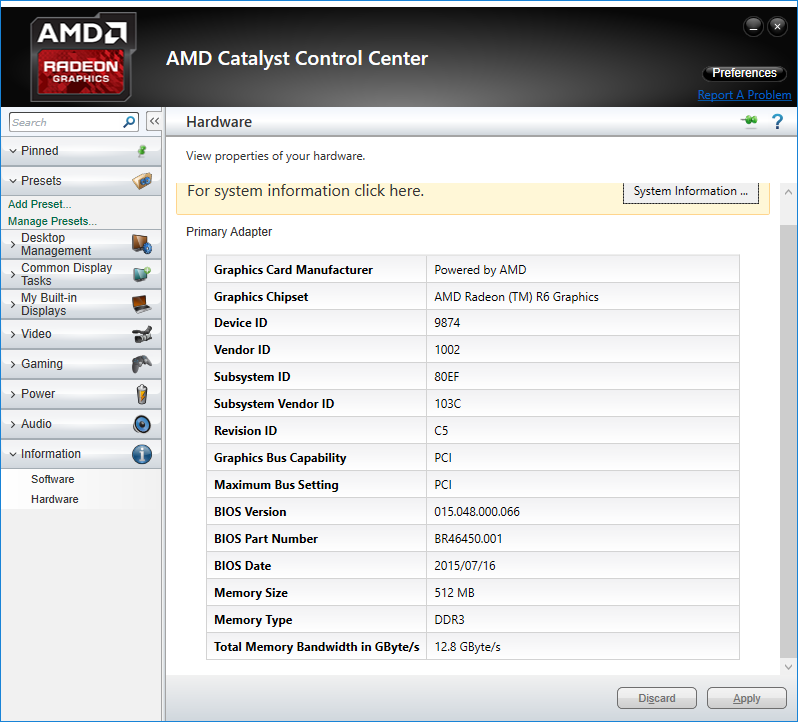
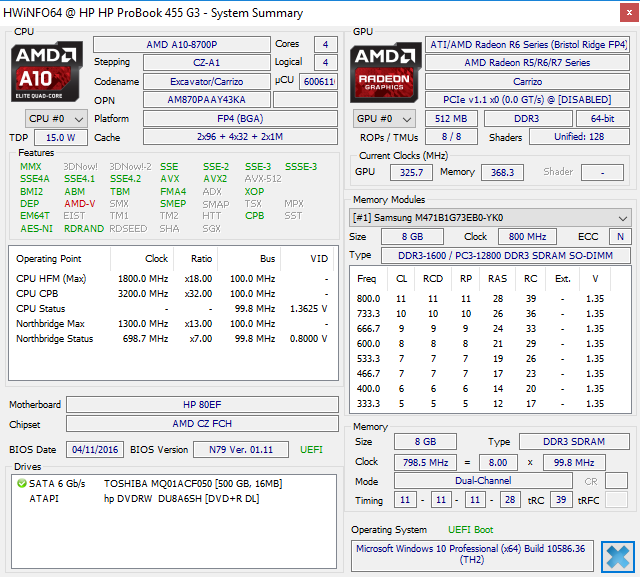
用于笔电的AMD Carrizo处理器具备可定制热设计功耗,本应算是极具通用性的。然而它的性能表现却比之前的第三代酷睿i5-4200U慢得多。相比较早前在英特尔硬件上搭载的 HD Graphics 520或HD Graphics 5500显卡,集成的Radeon R6显卡也存在着类似的问题。
如果ProBook 455运行时明显地更为安静和持久,那么AMD的性能短板也会变得可以接受。然而事与愿违。机器表面的温度并没有更低,电池续航甚至比预期的更短。
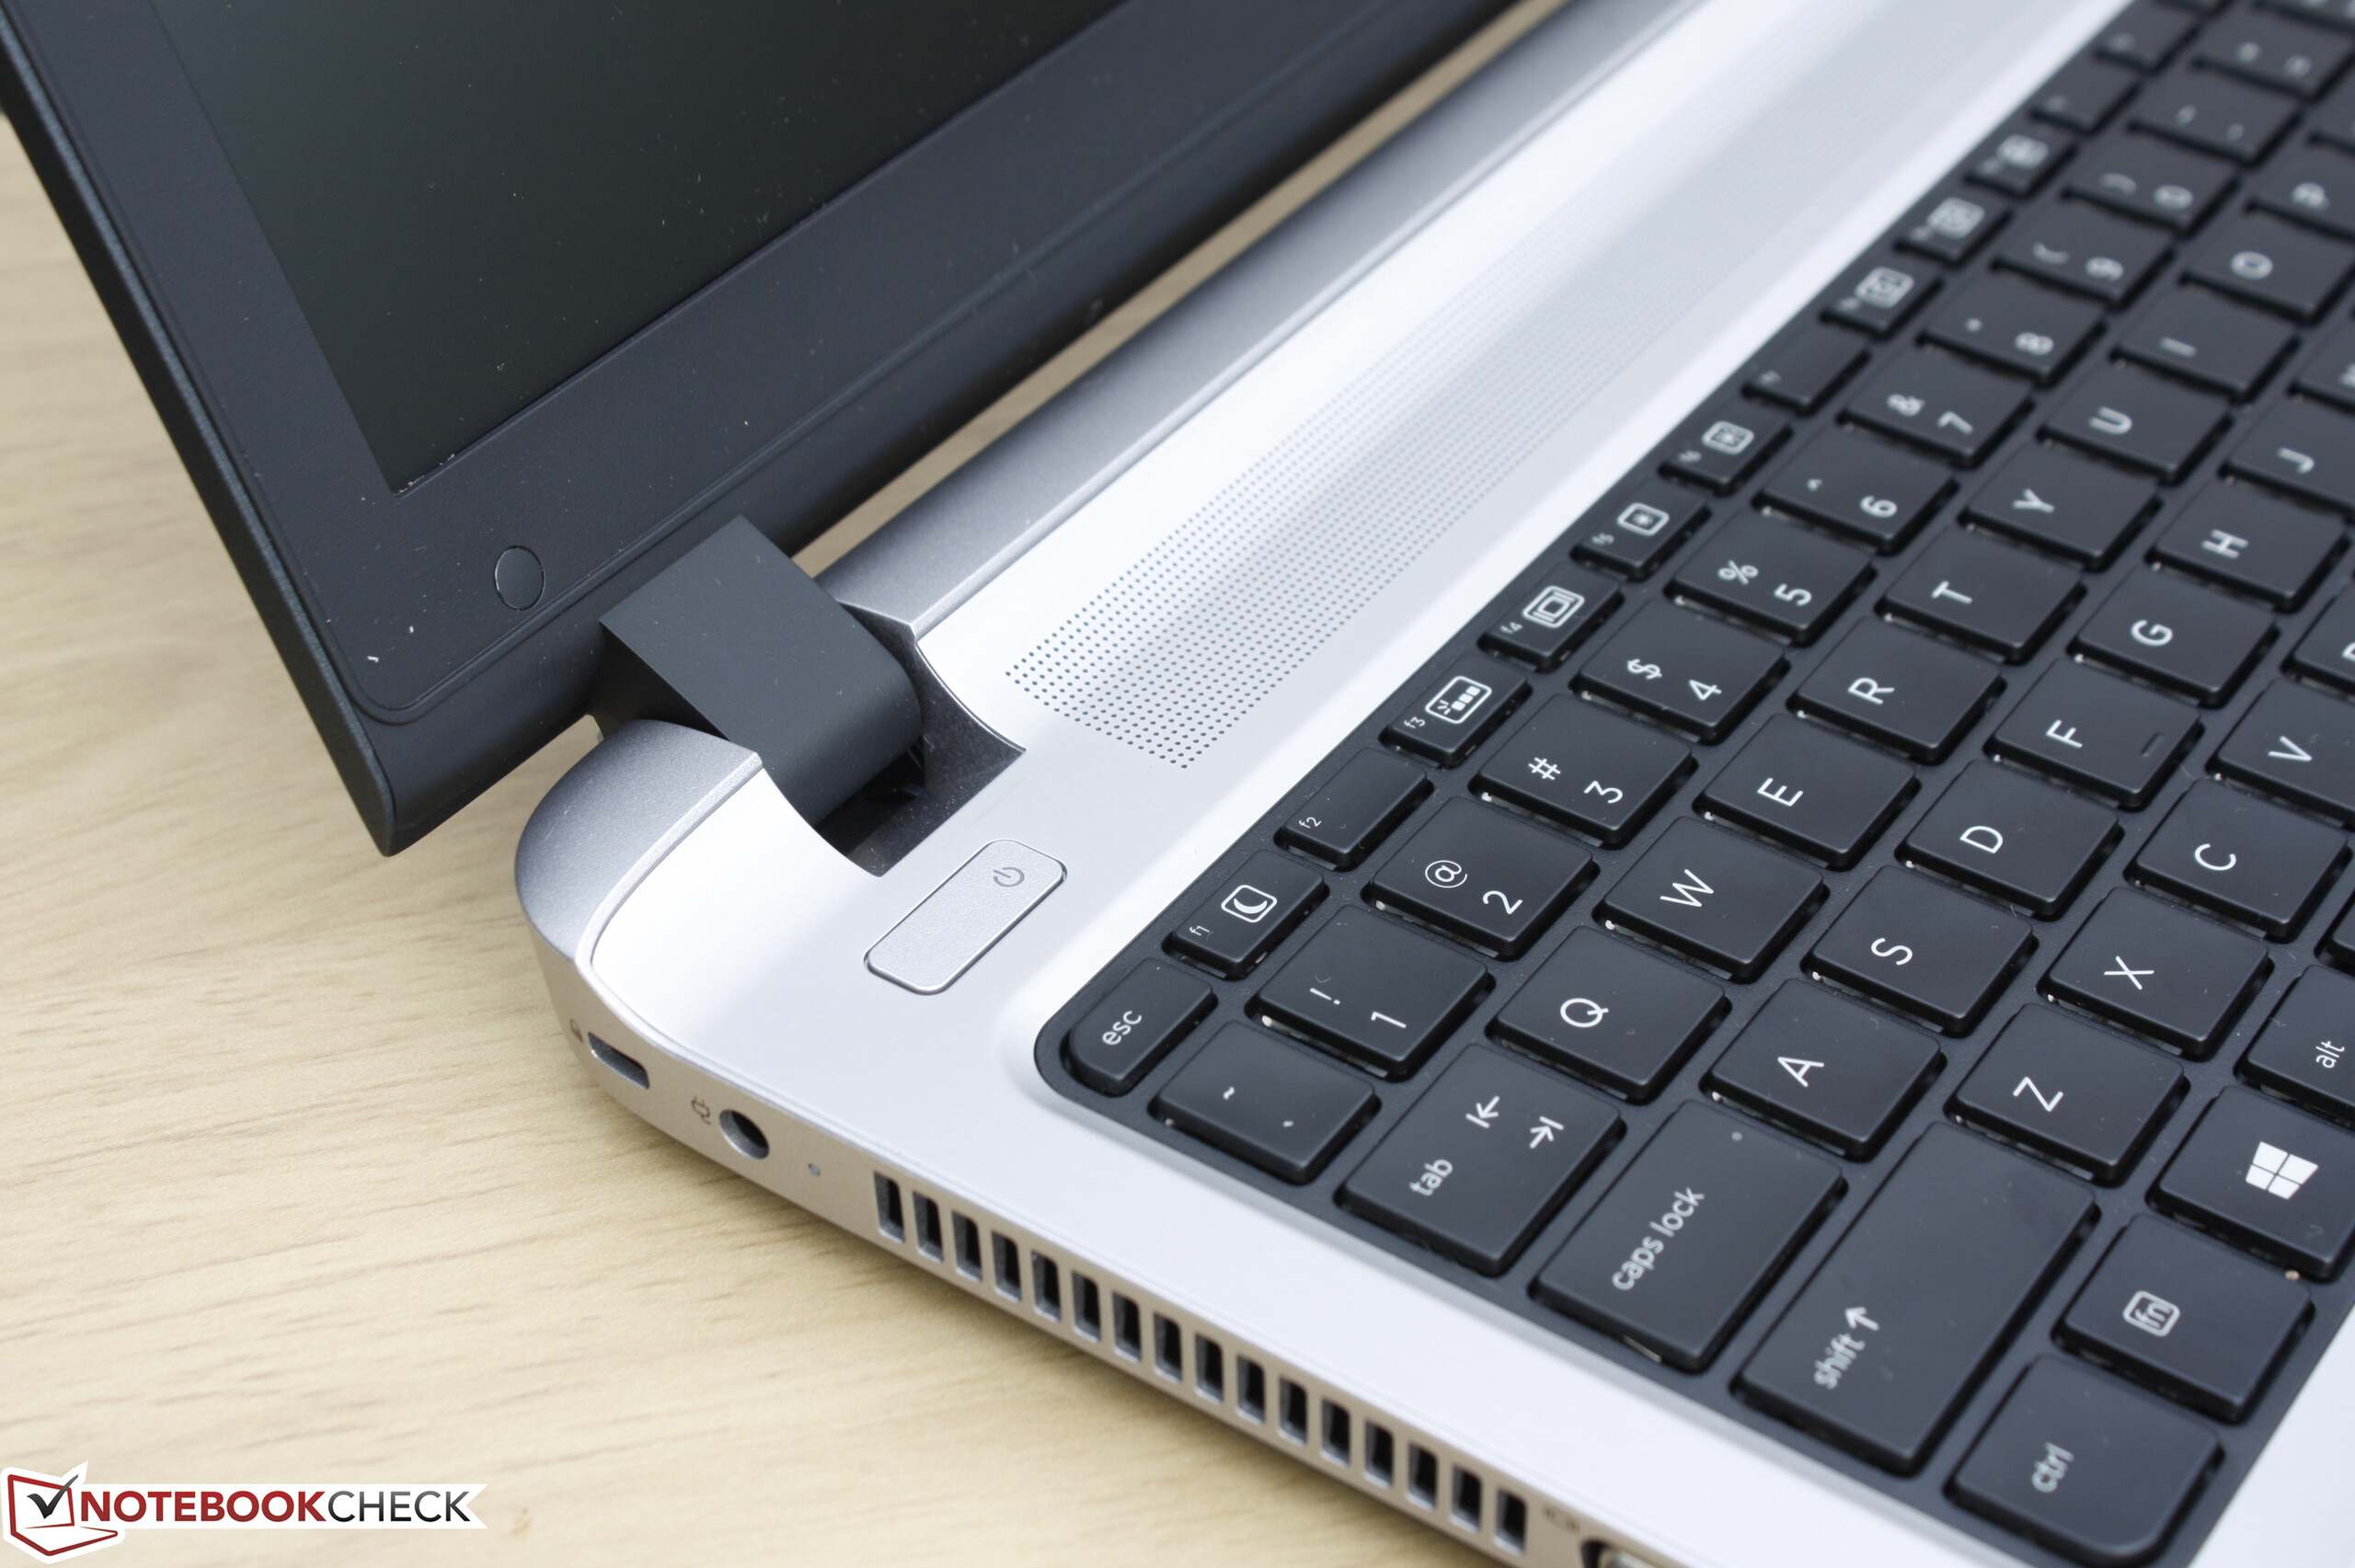
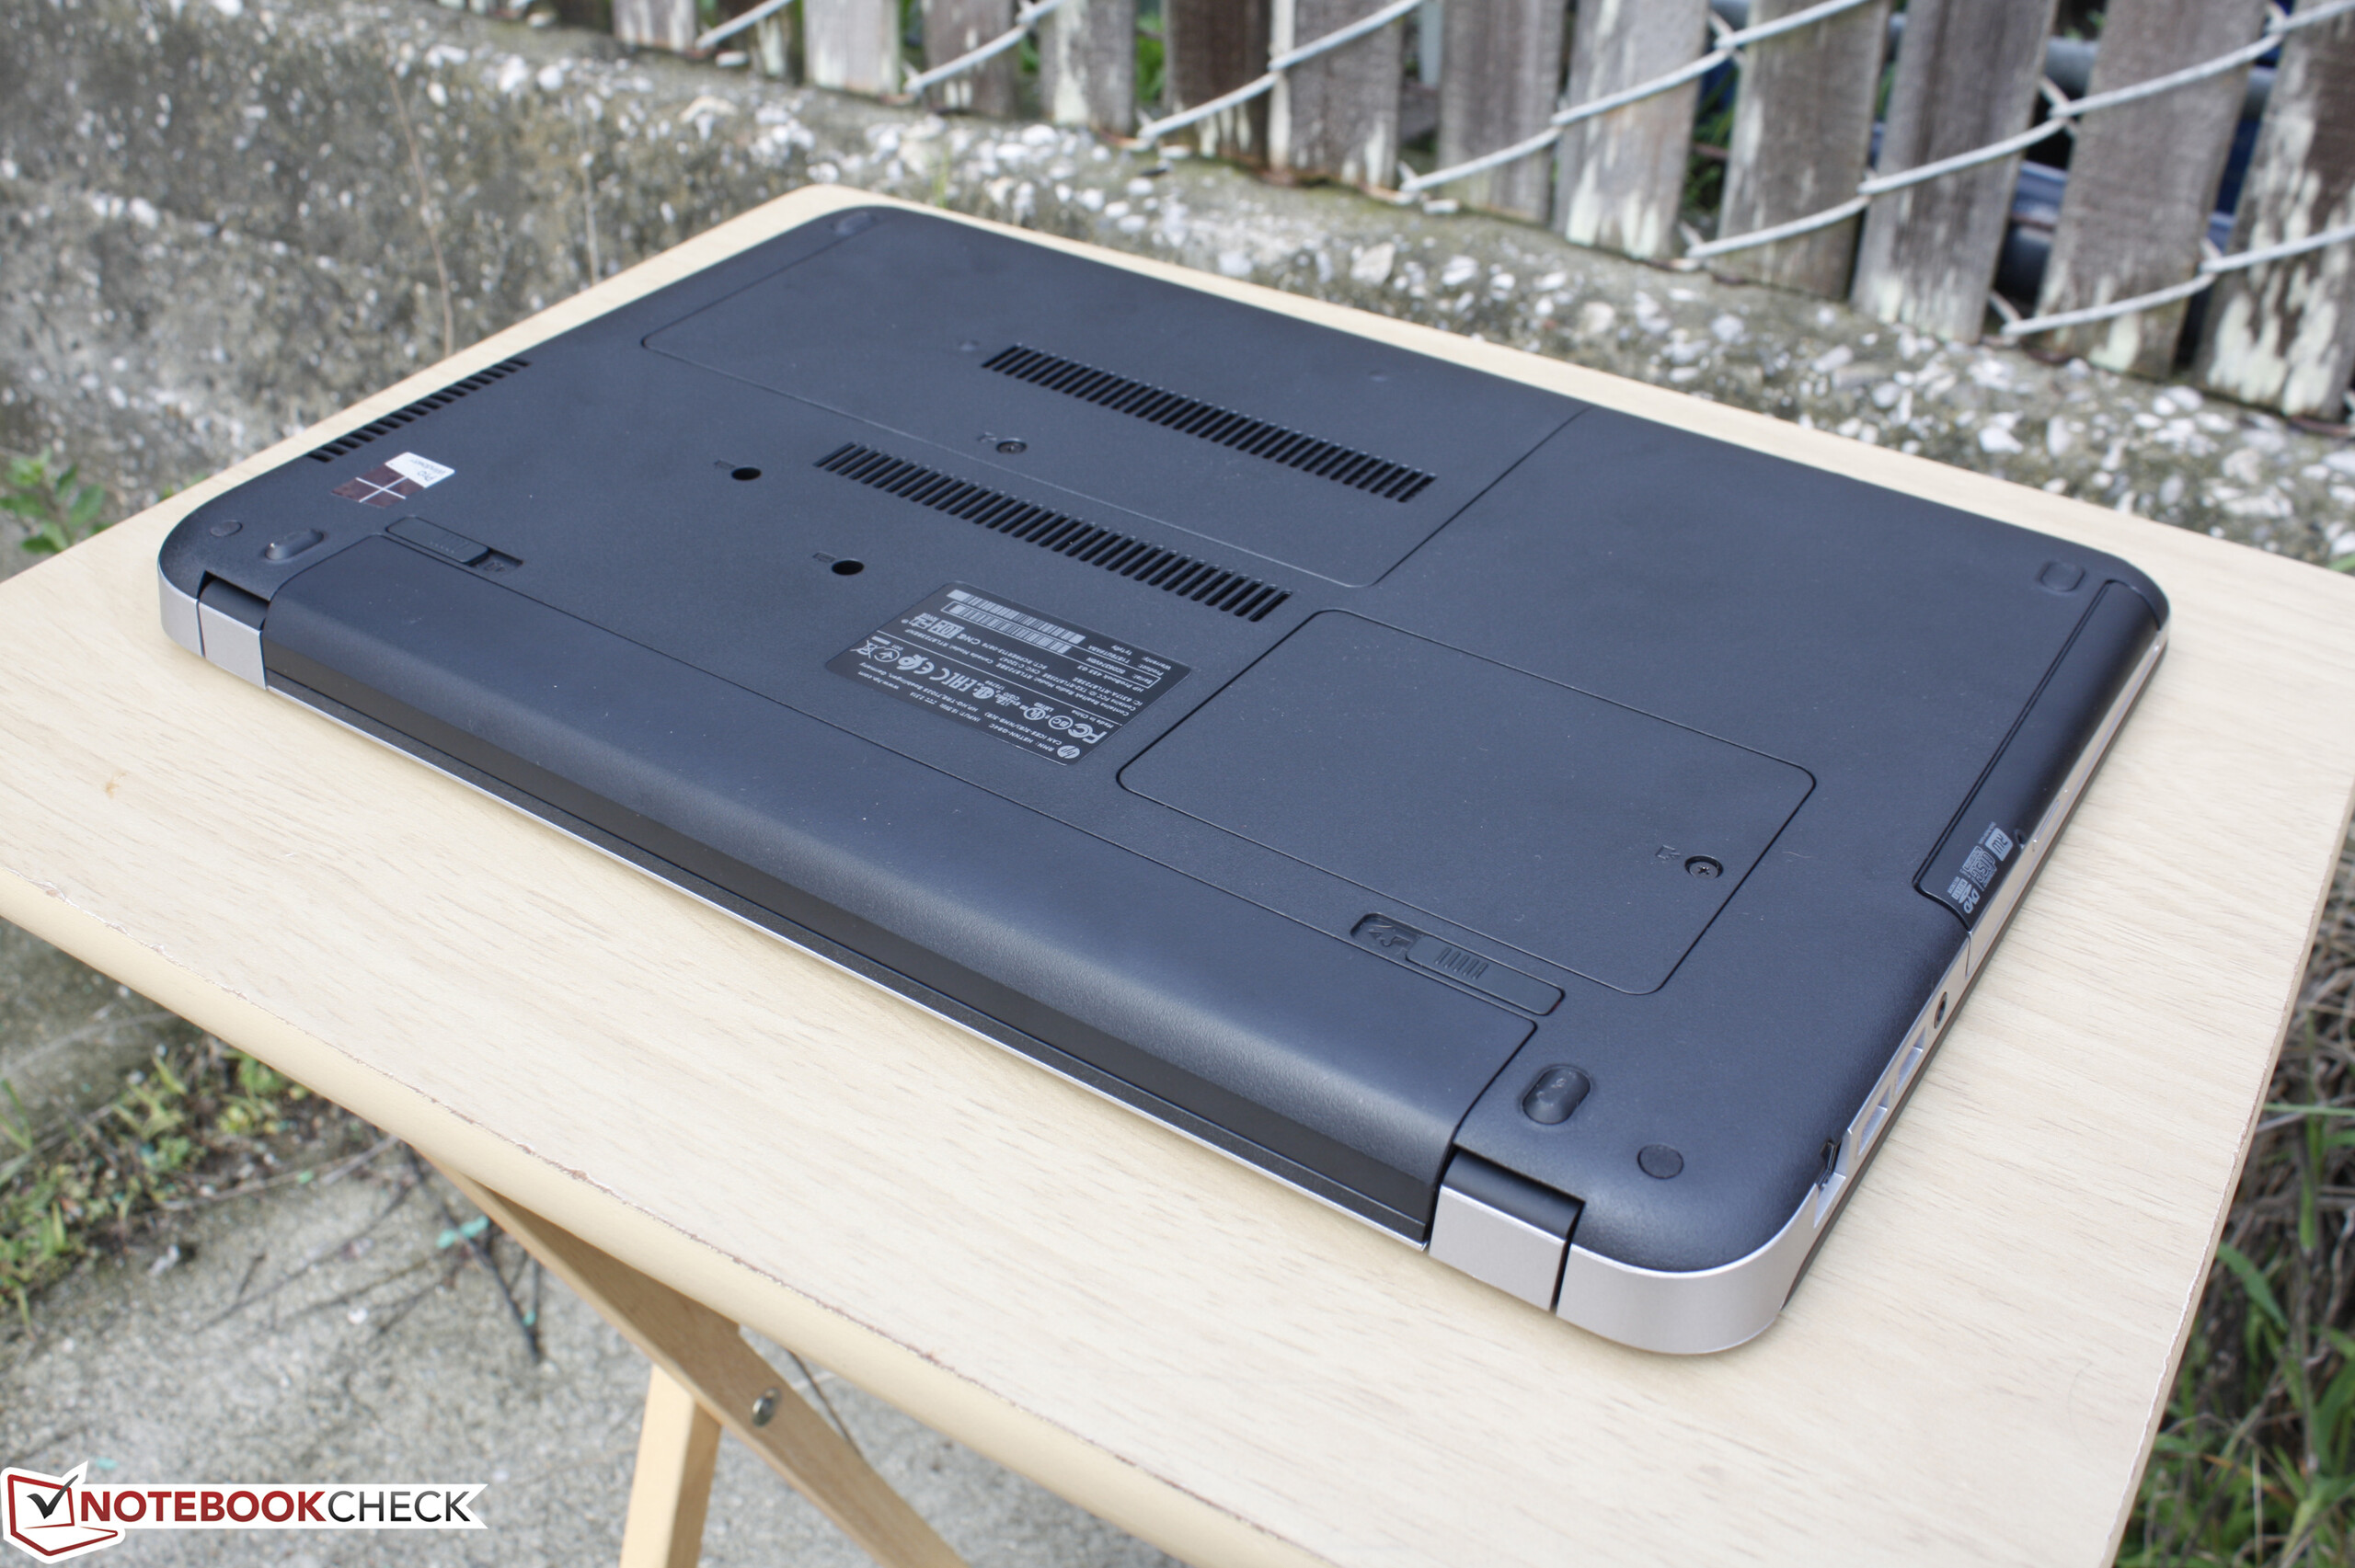
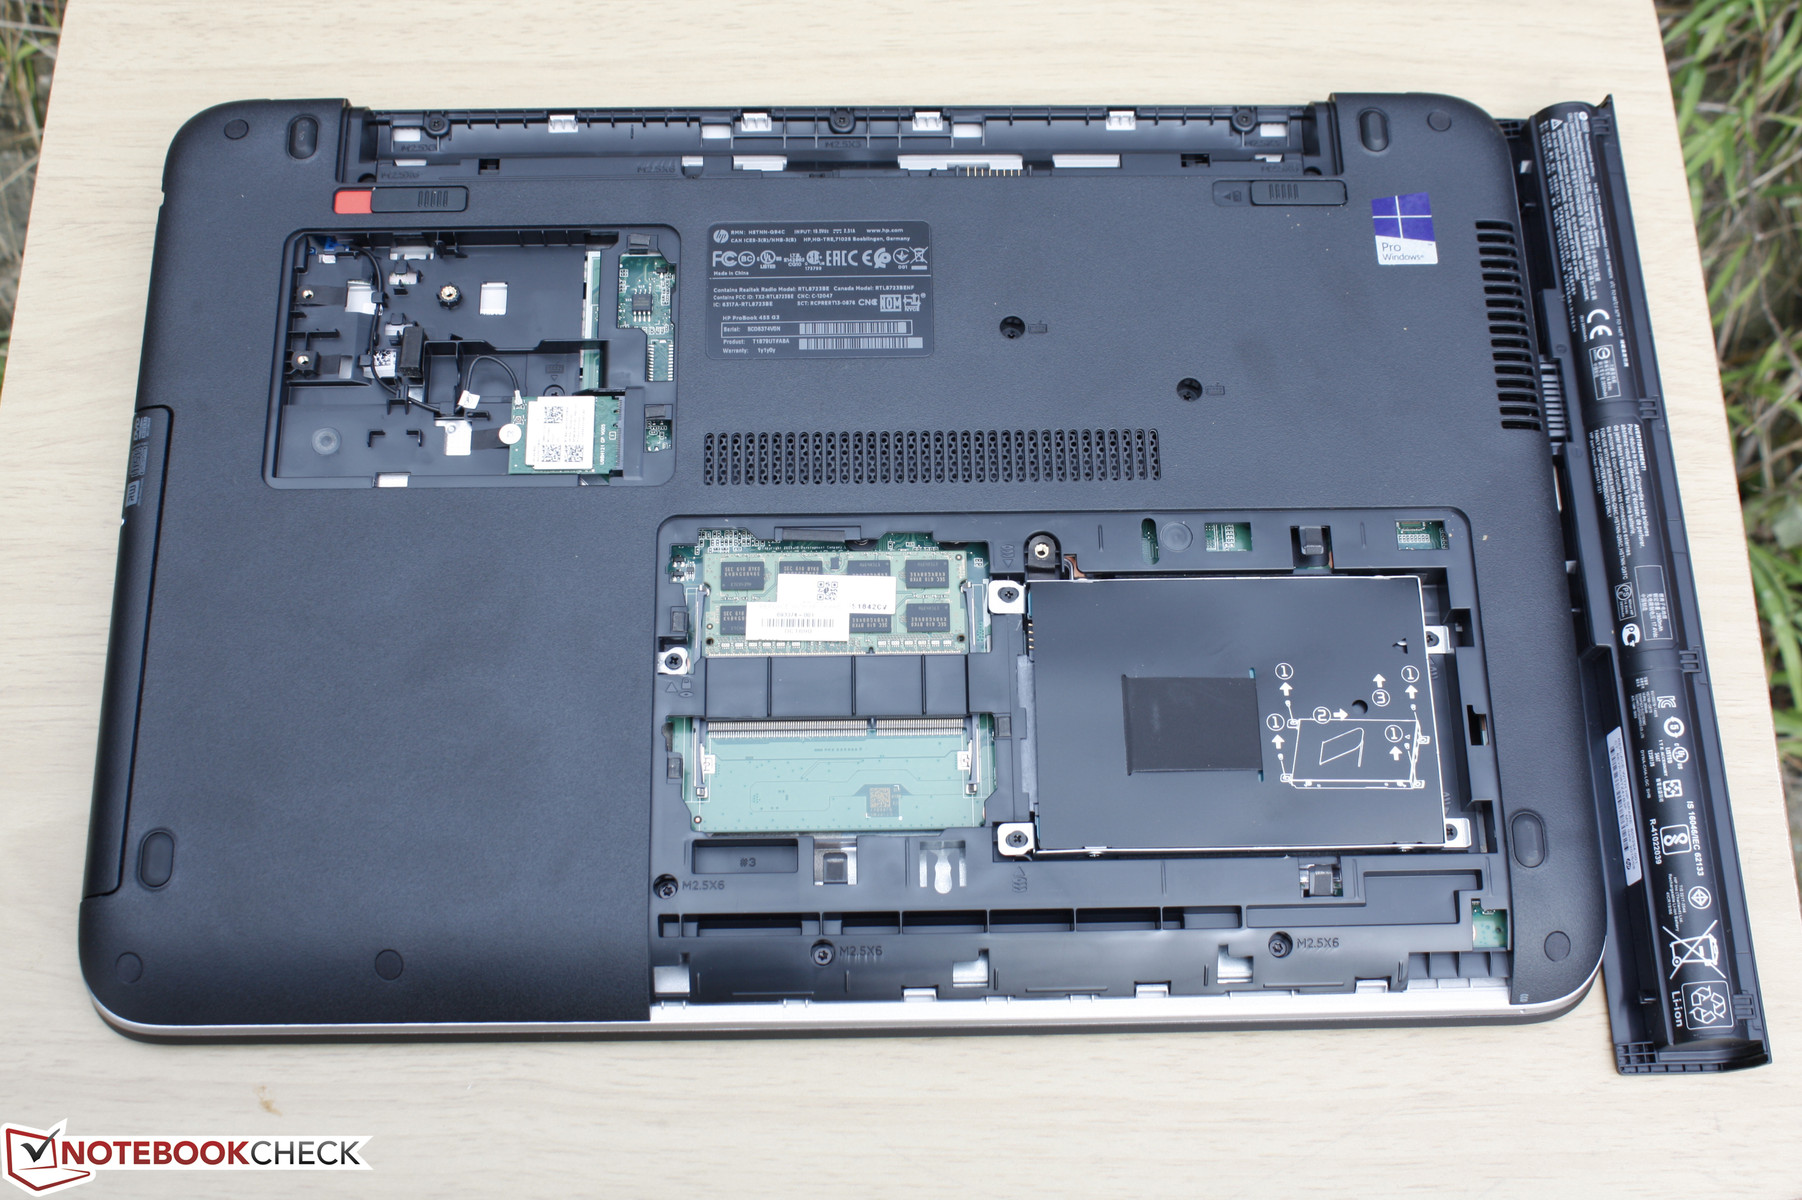
撇开处理器不谈,ProBook 455是良好的低工作负载准系统解决方案。它在概念和设计上都十分平庸,我们希望未来的修订版本至少能为硬件添加一些功能,包括USB-C以及指点杆选项。
当较老的英特尔酷睿ix处理器比最新AMD处理器提供的性能更高且续航更长时,我们很难推荐采用Carrizo平台的机型。
注:本文是基于完整评测的缩减版本,阅读完整的英文评测,请点击这里。
HP ProBook 455 T1B79UT
- 12/15/2016 v6 (old)
Allen Ngo
Price comparison
