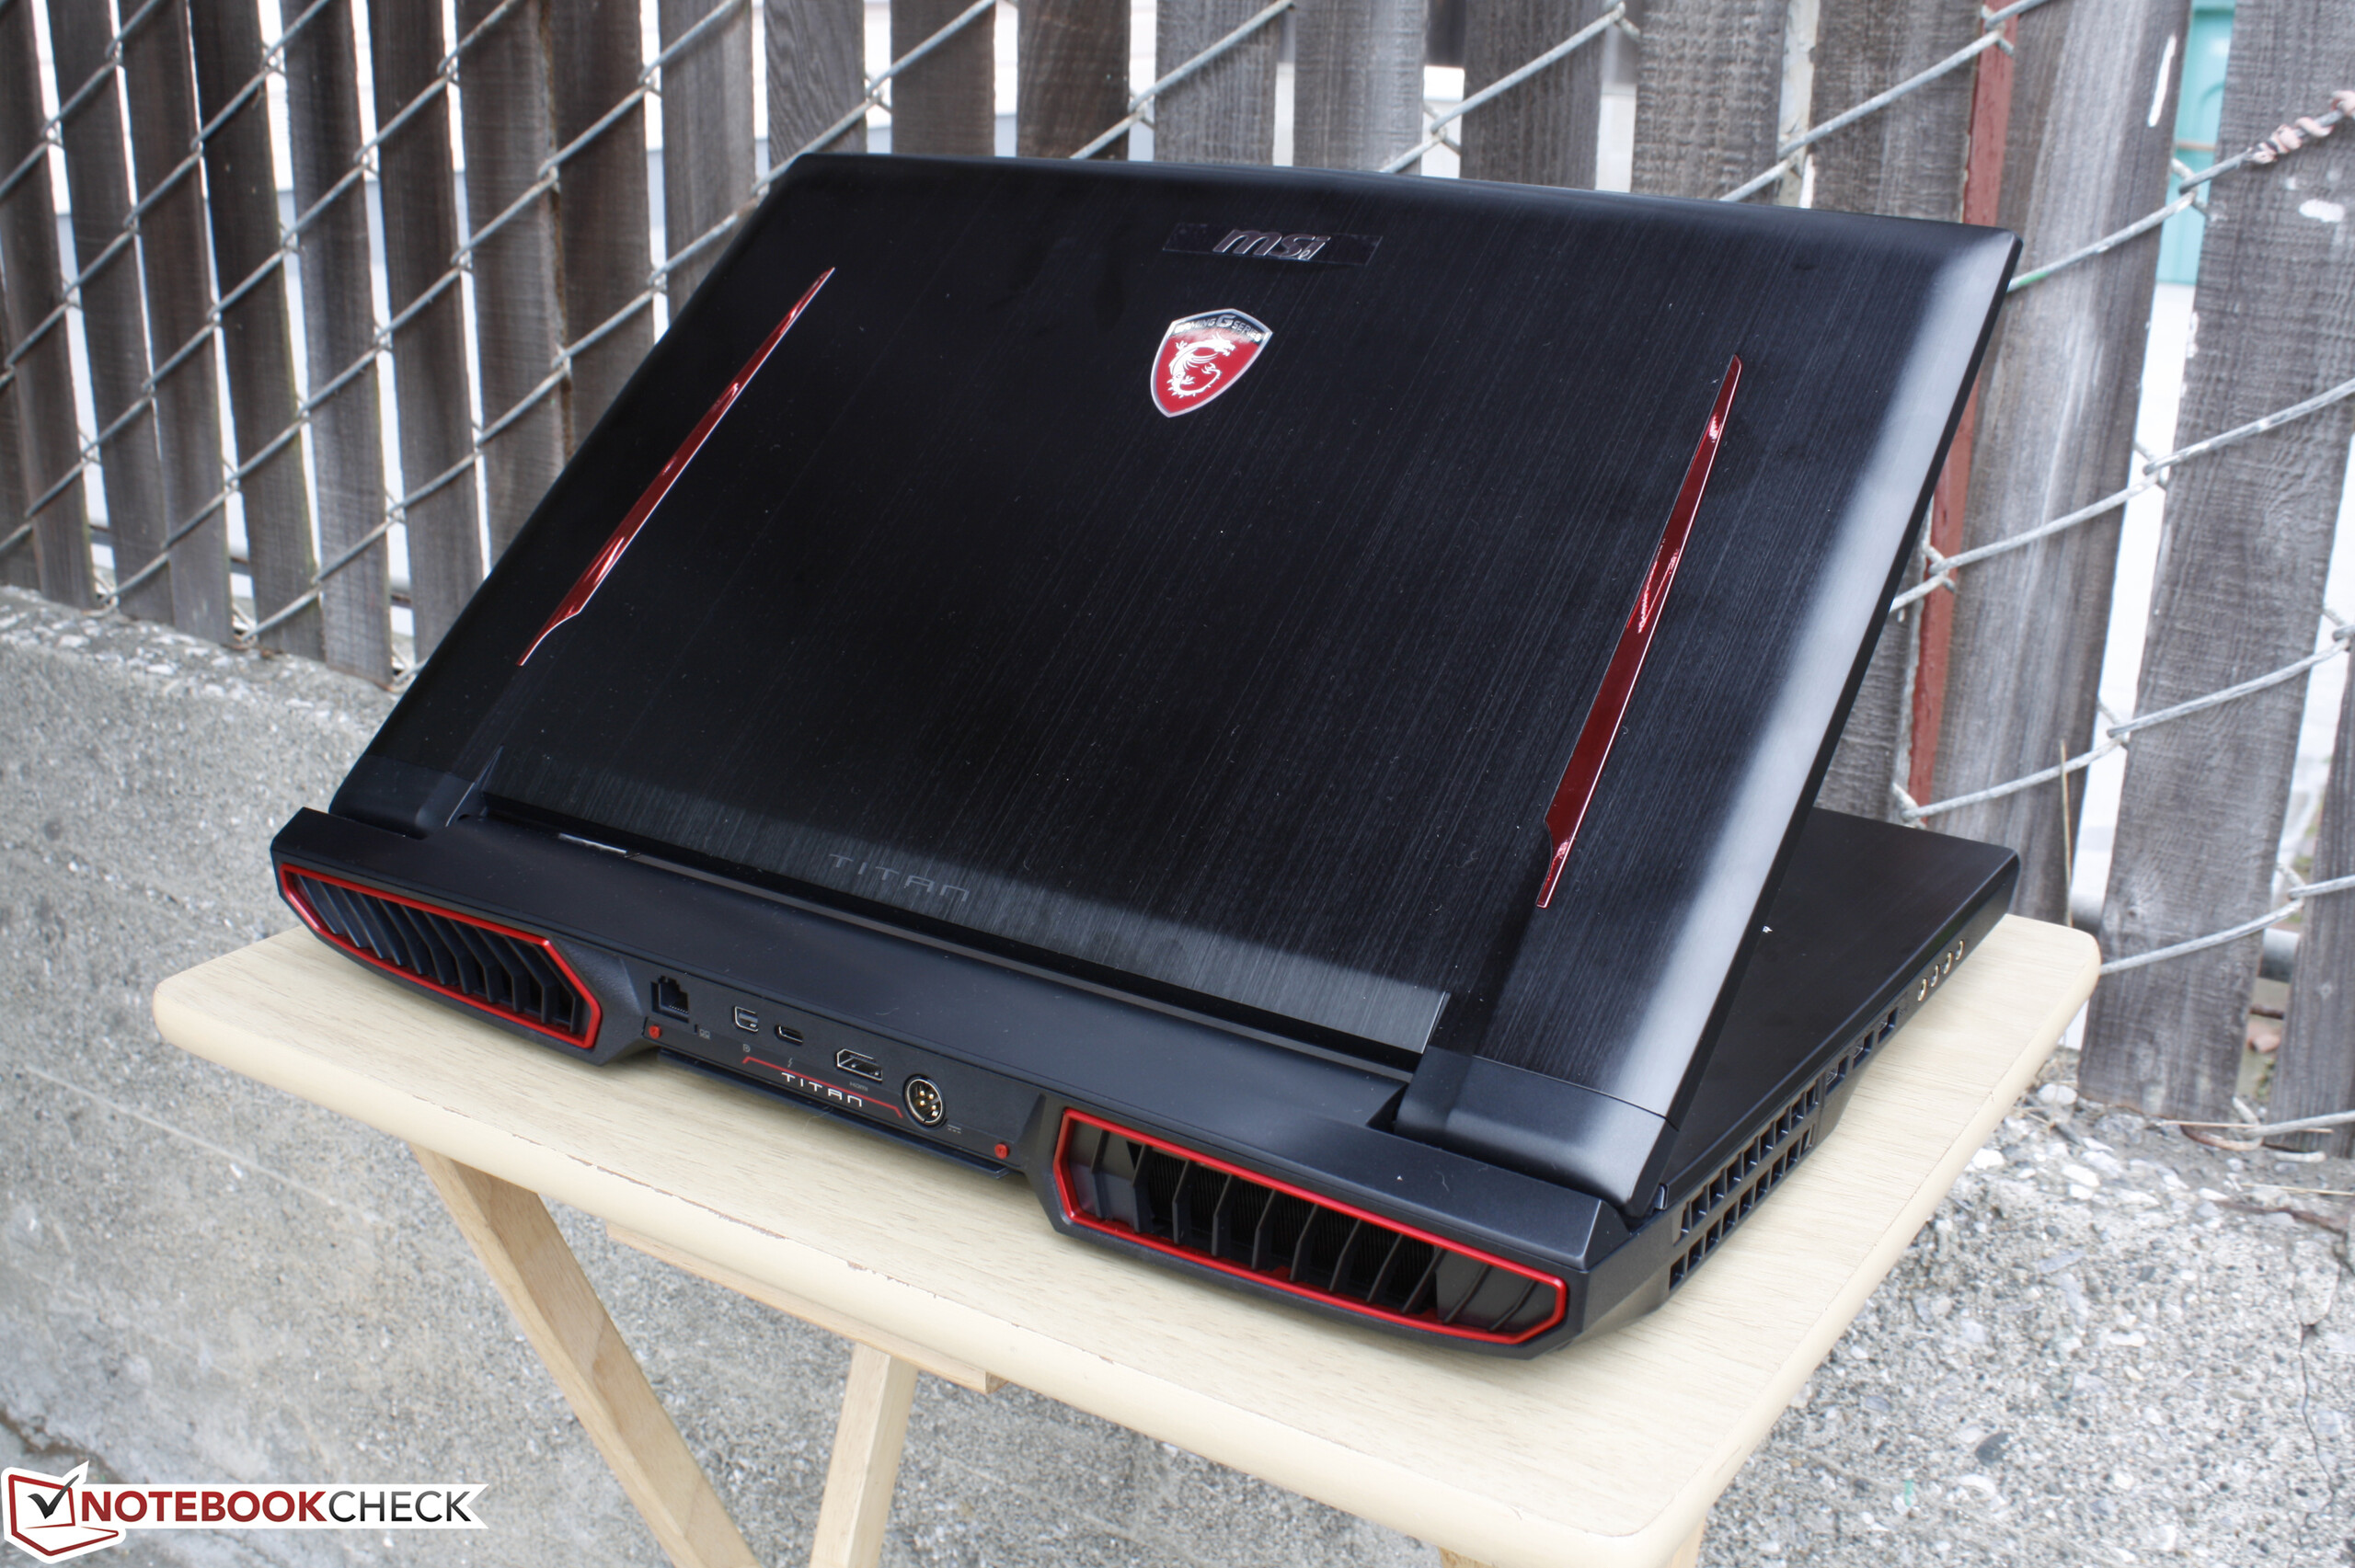
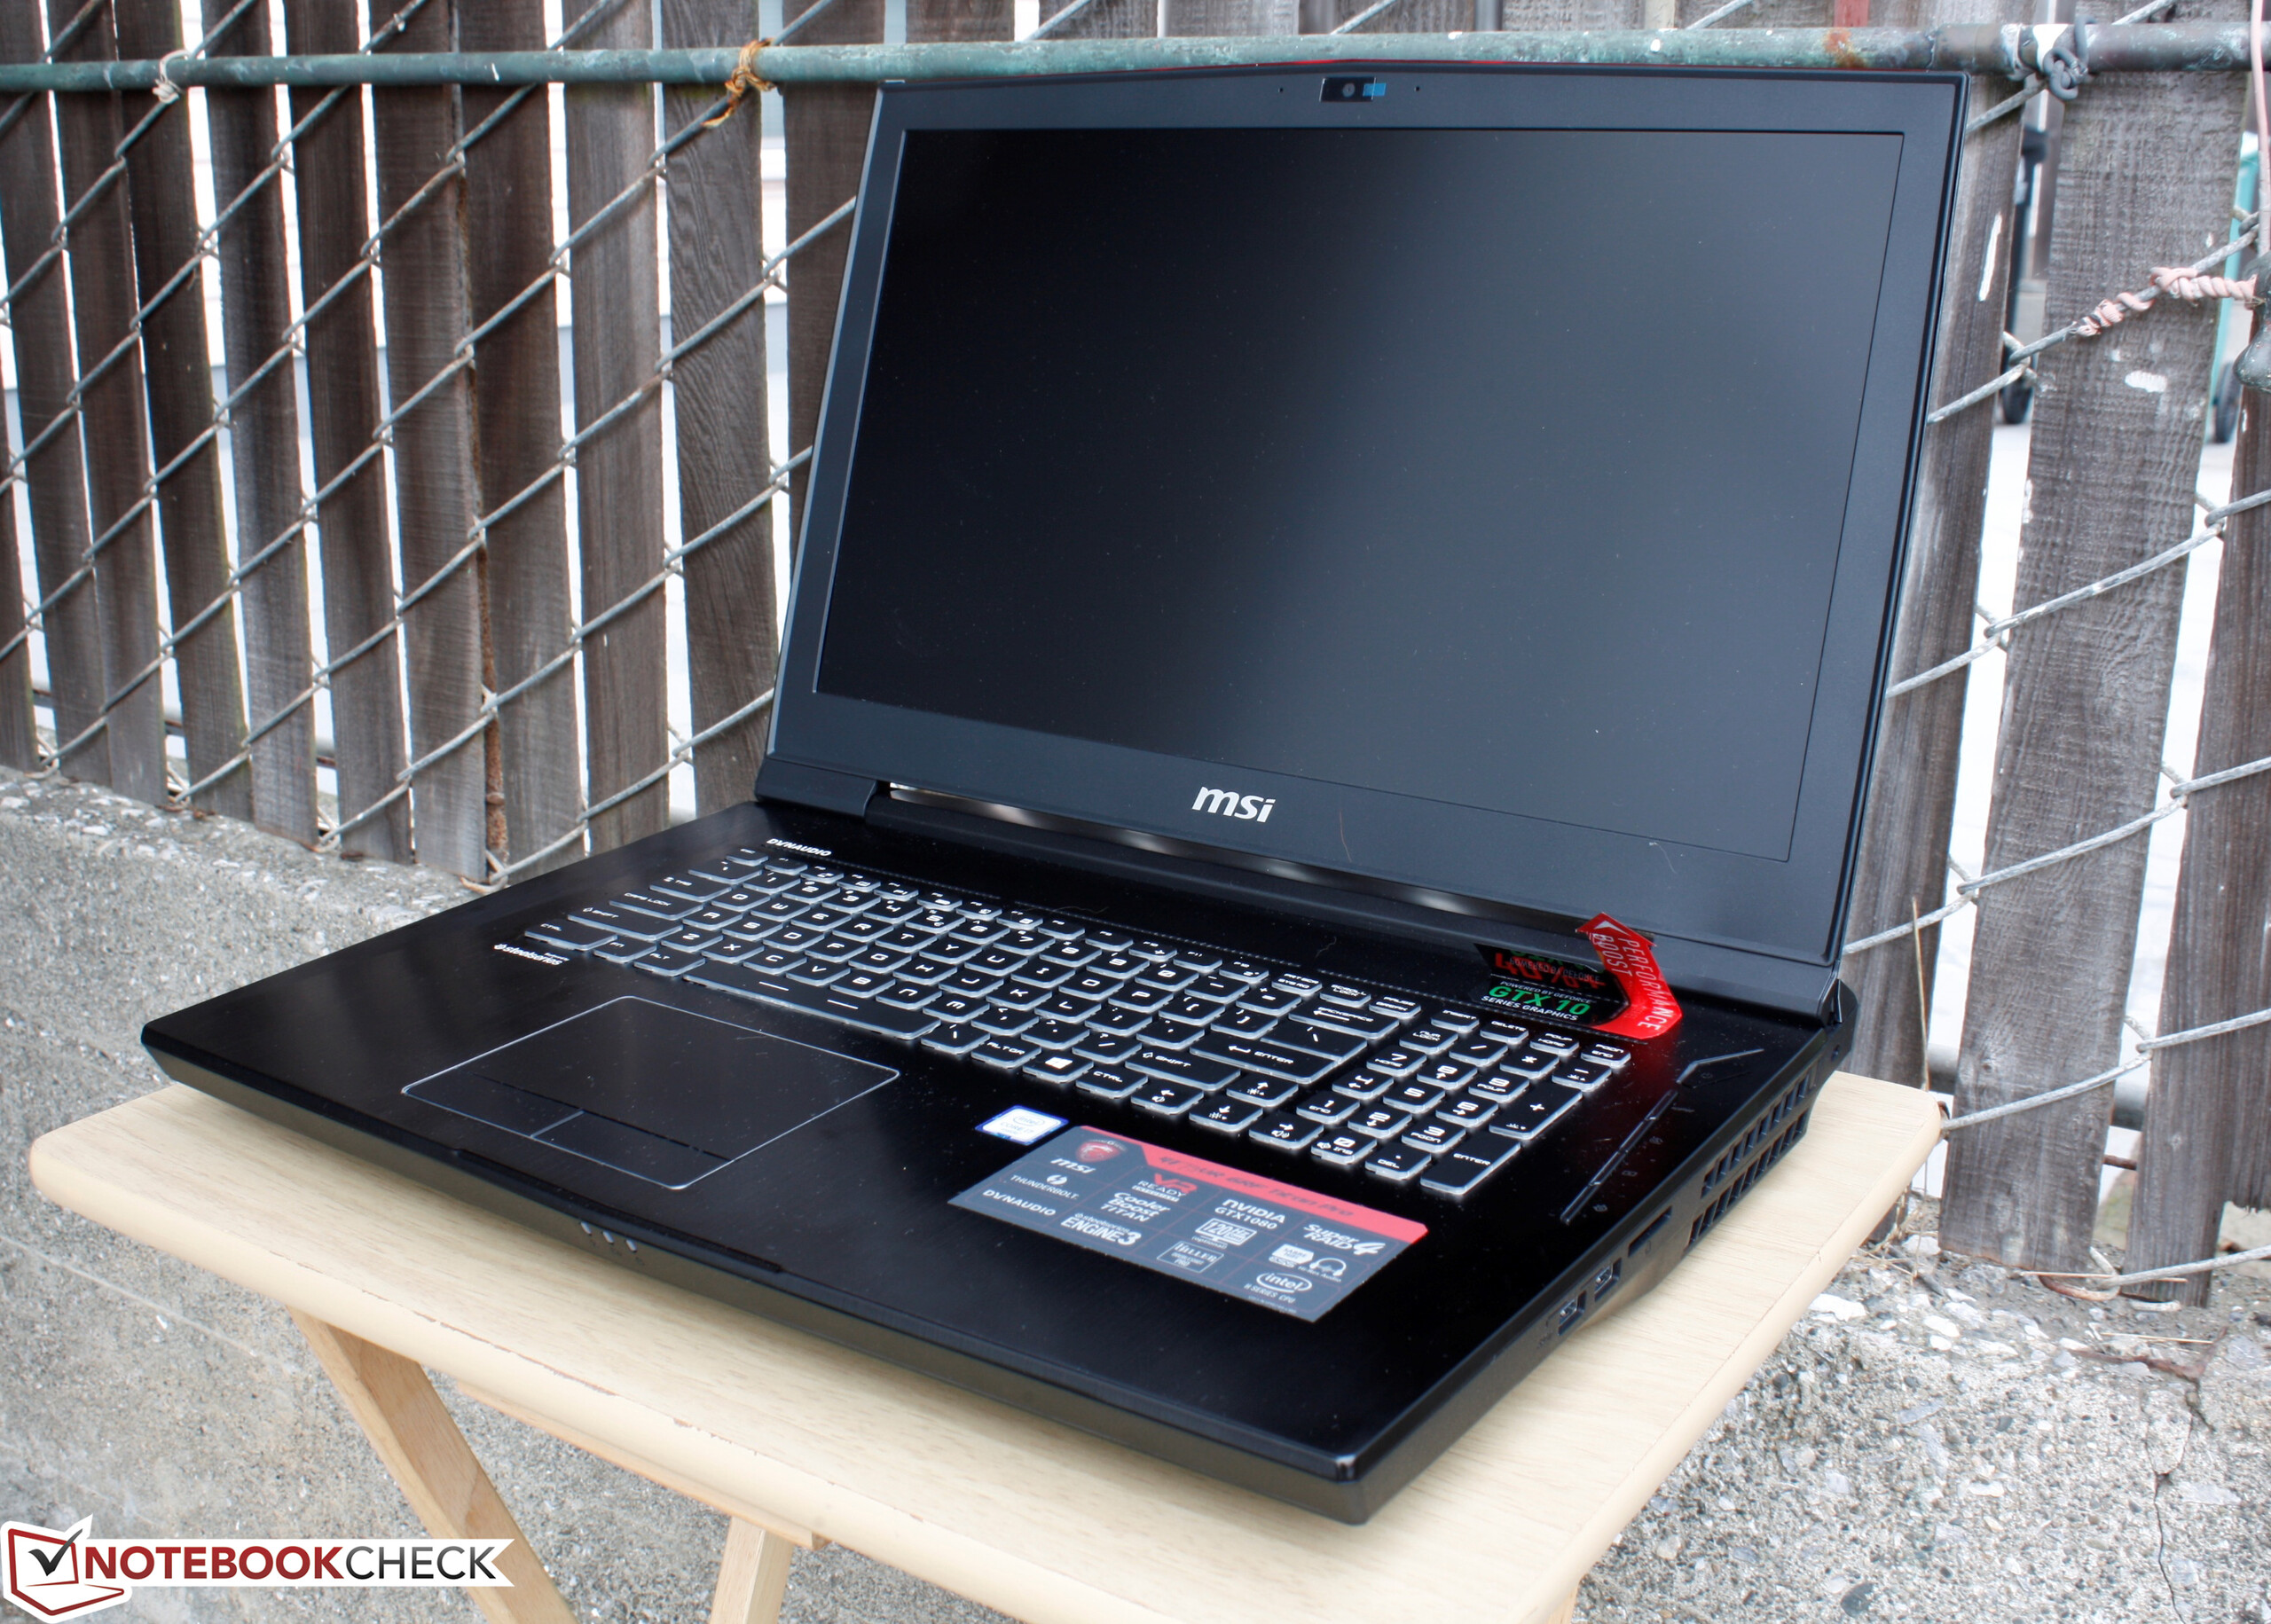
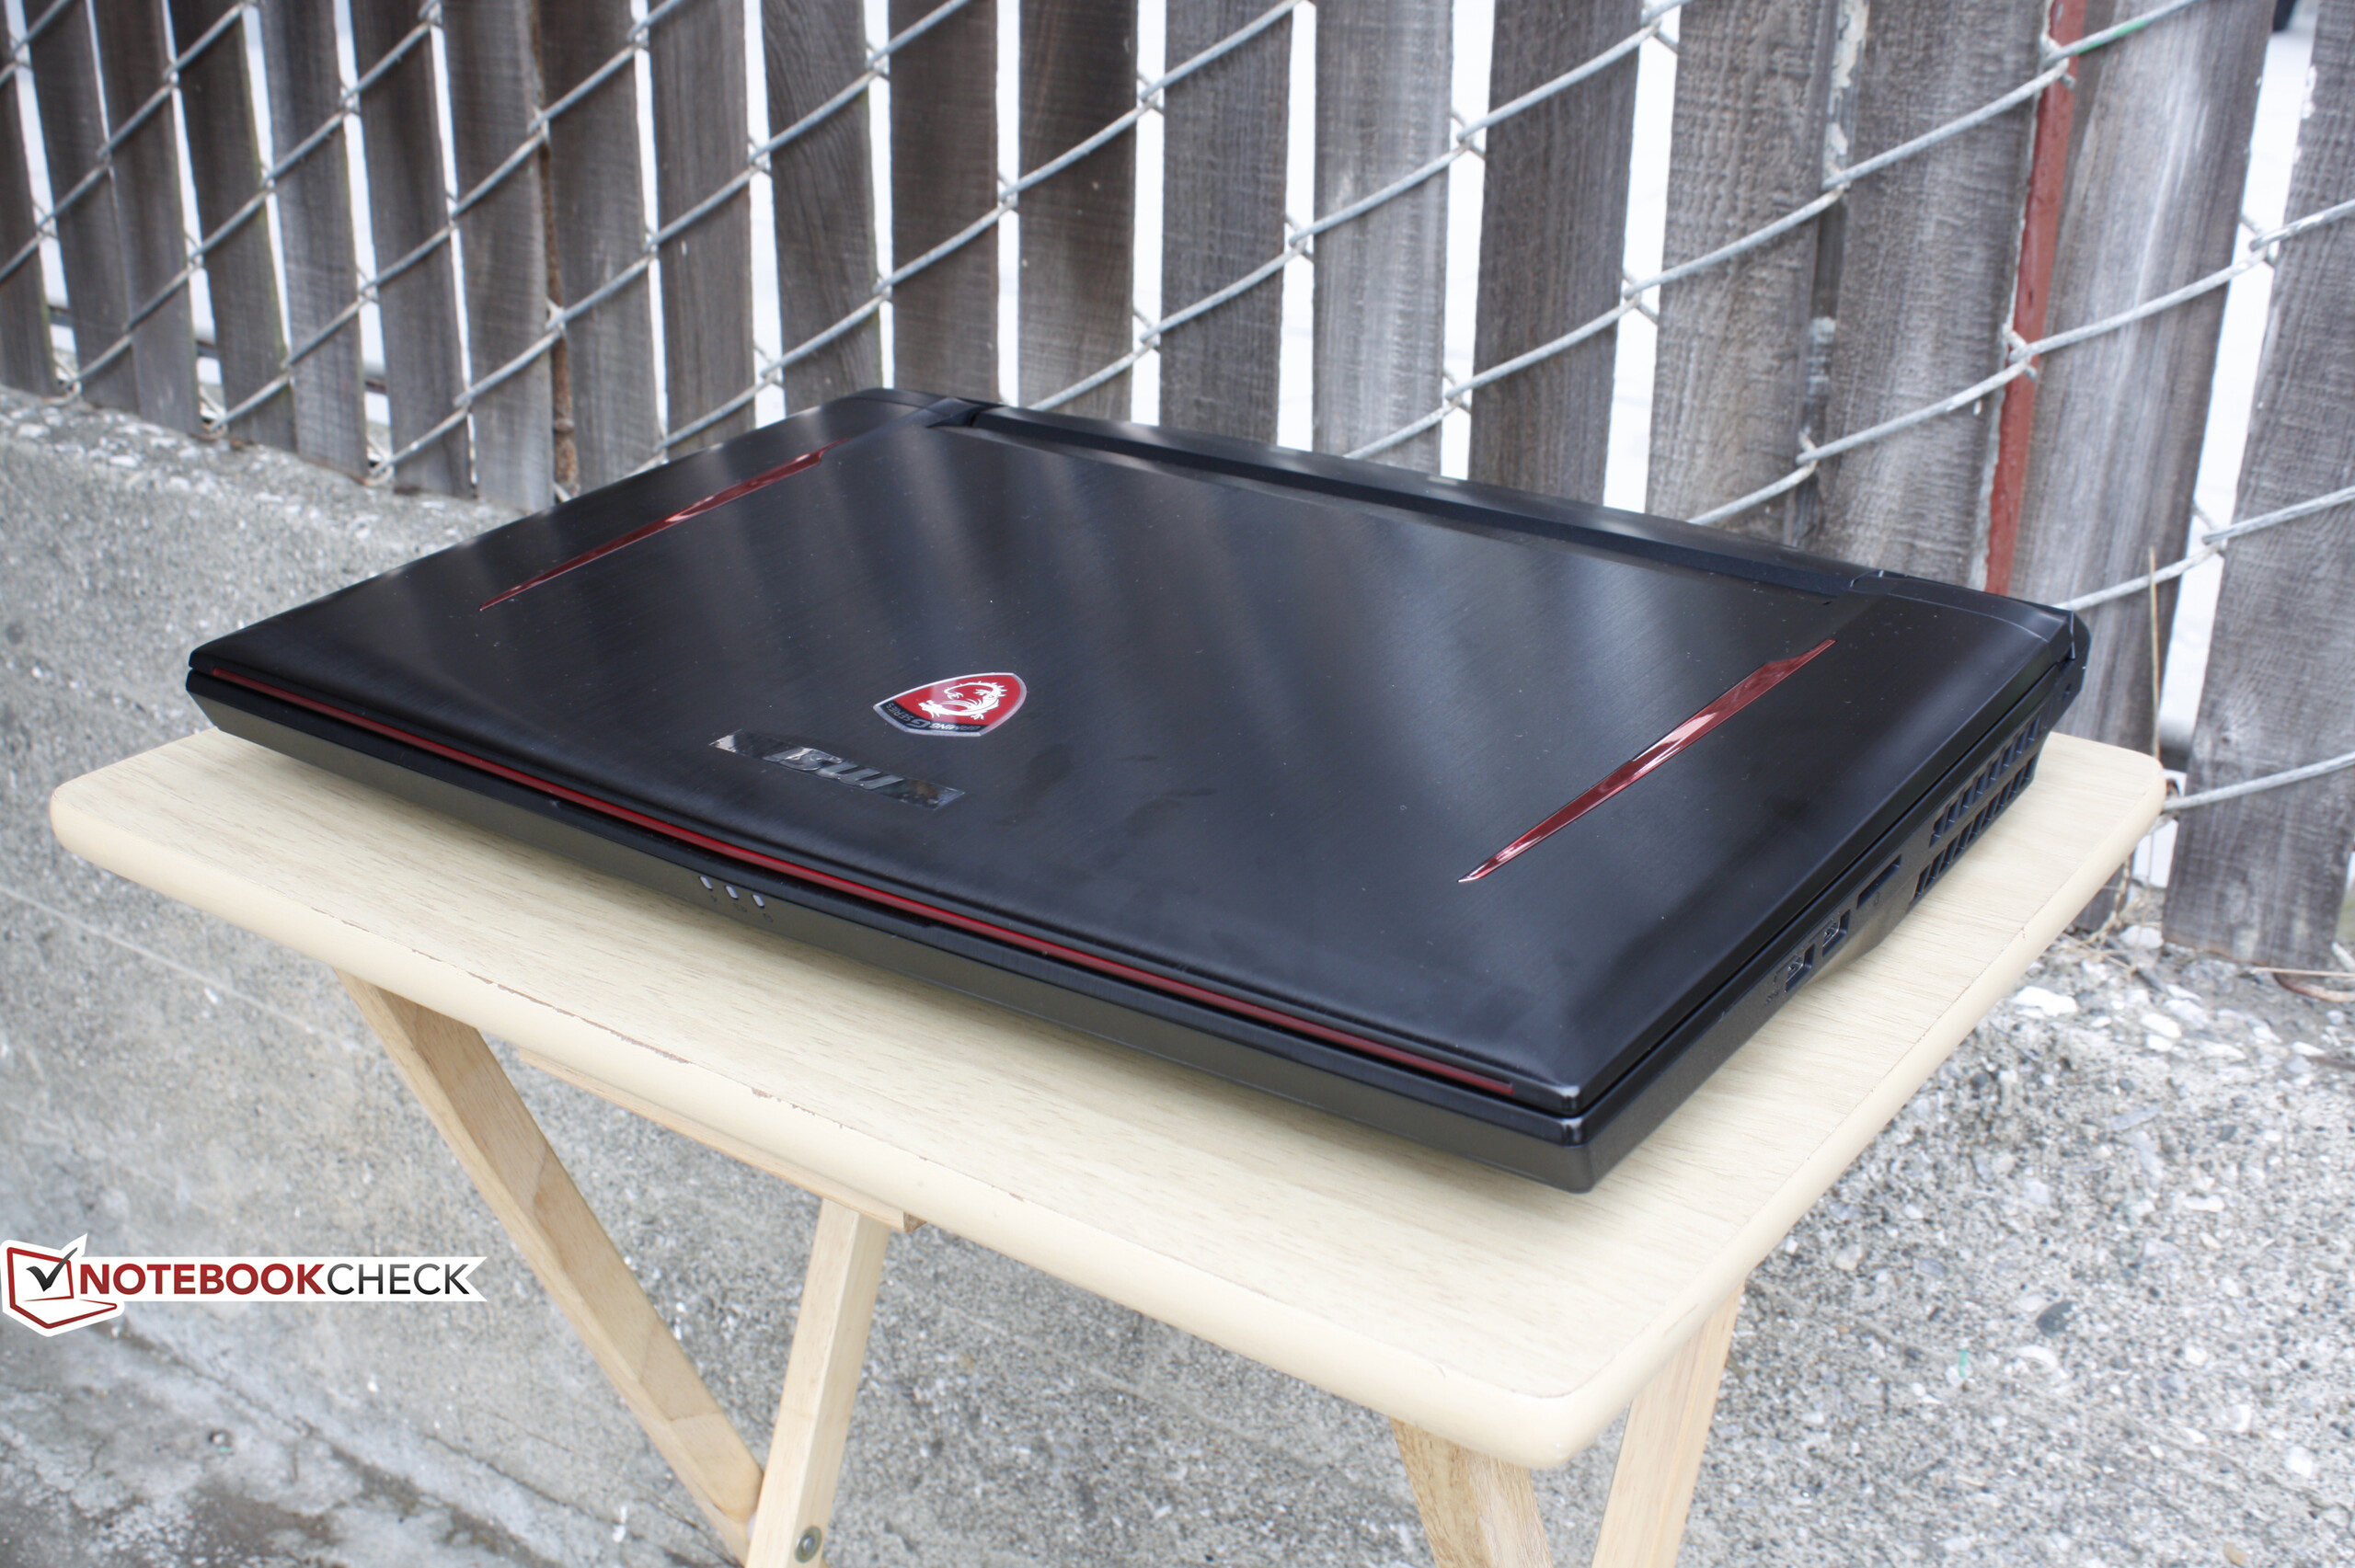
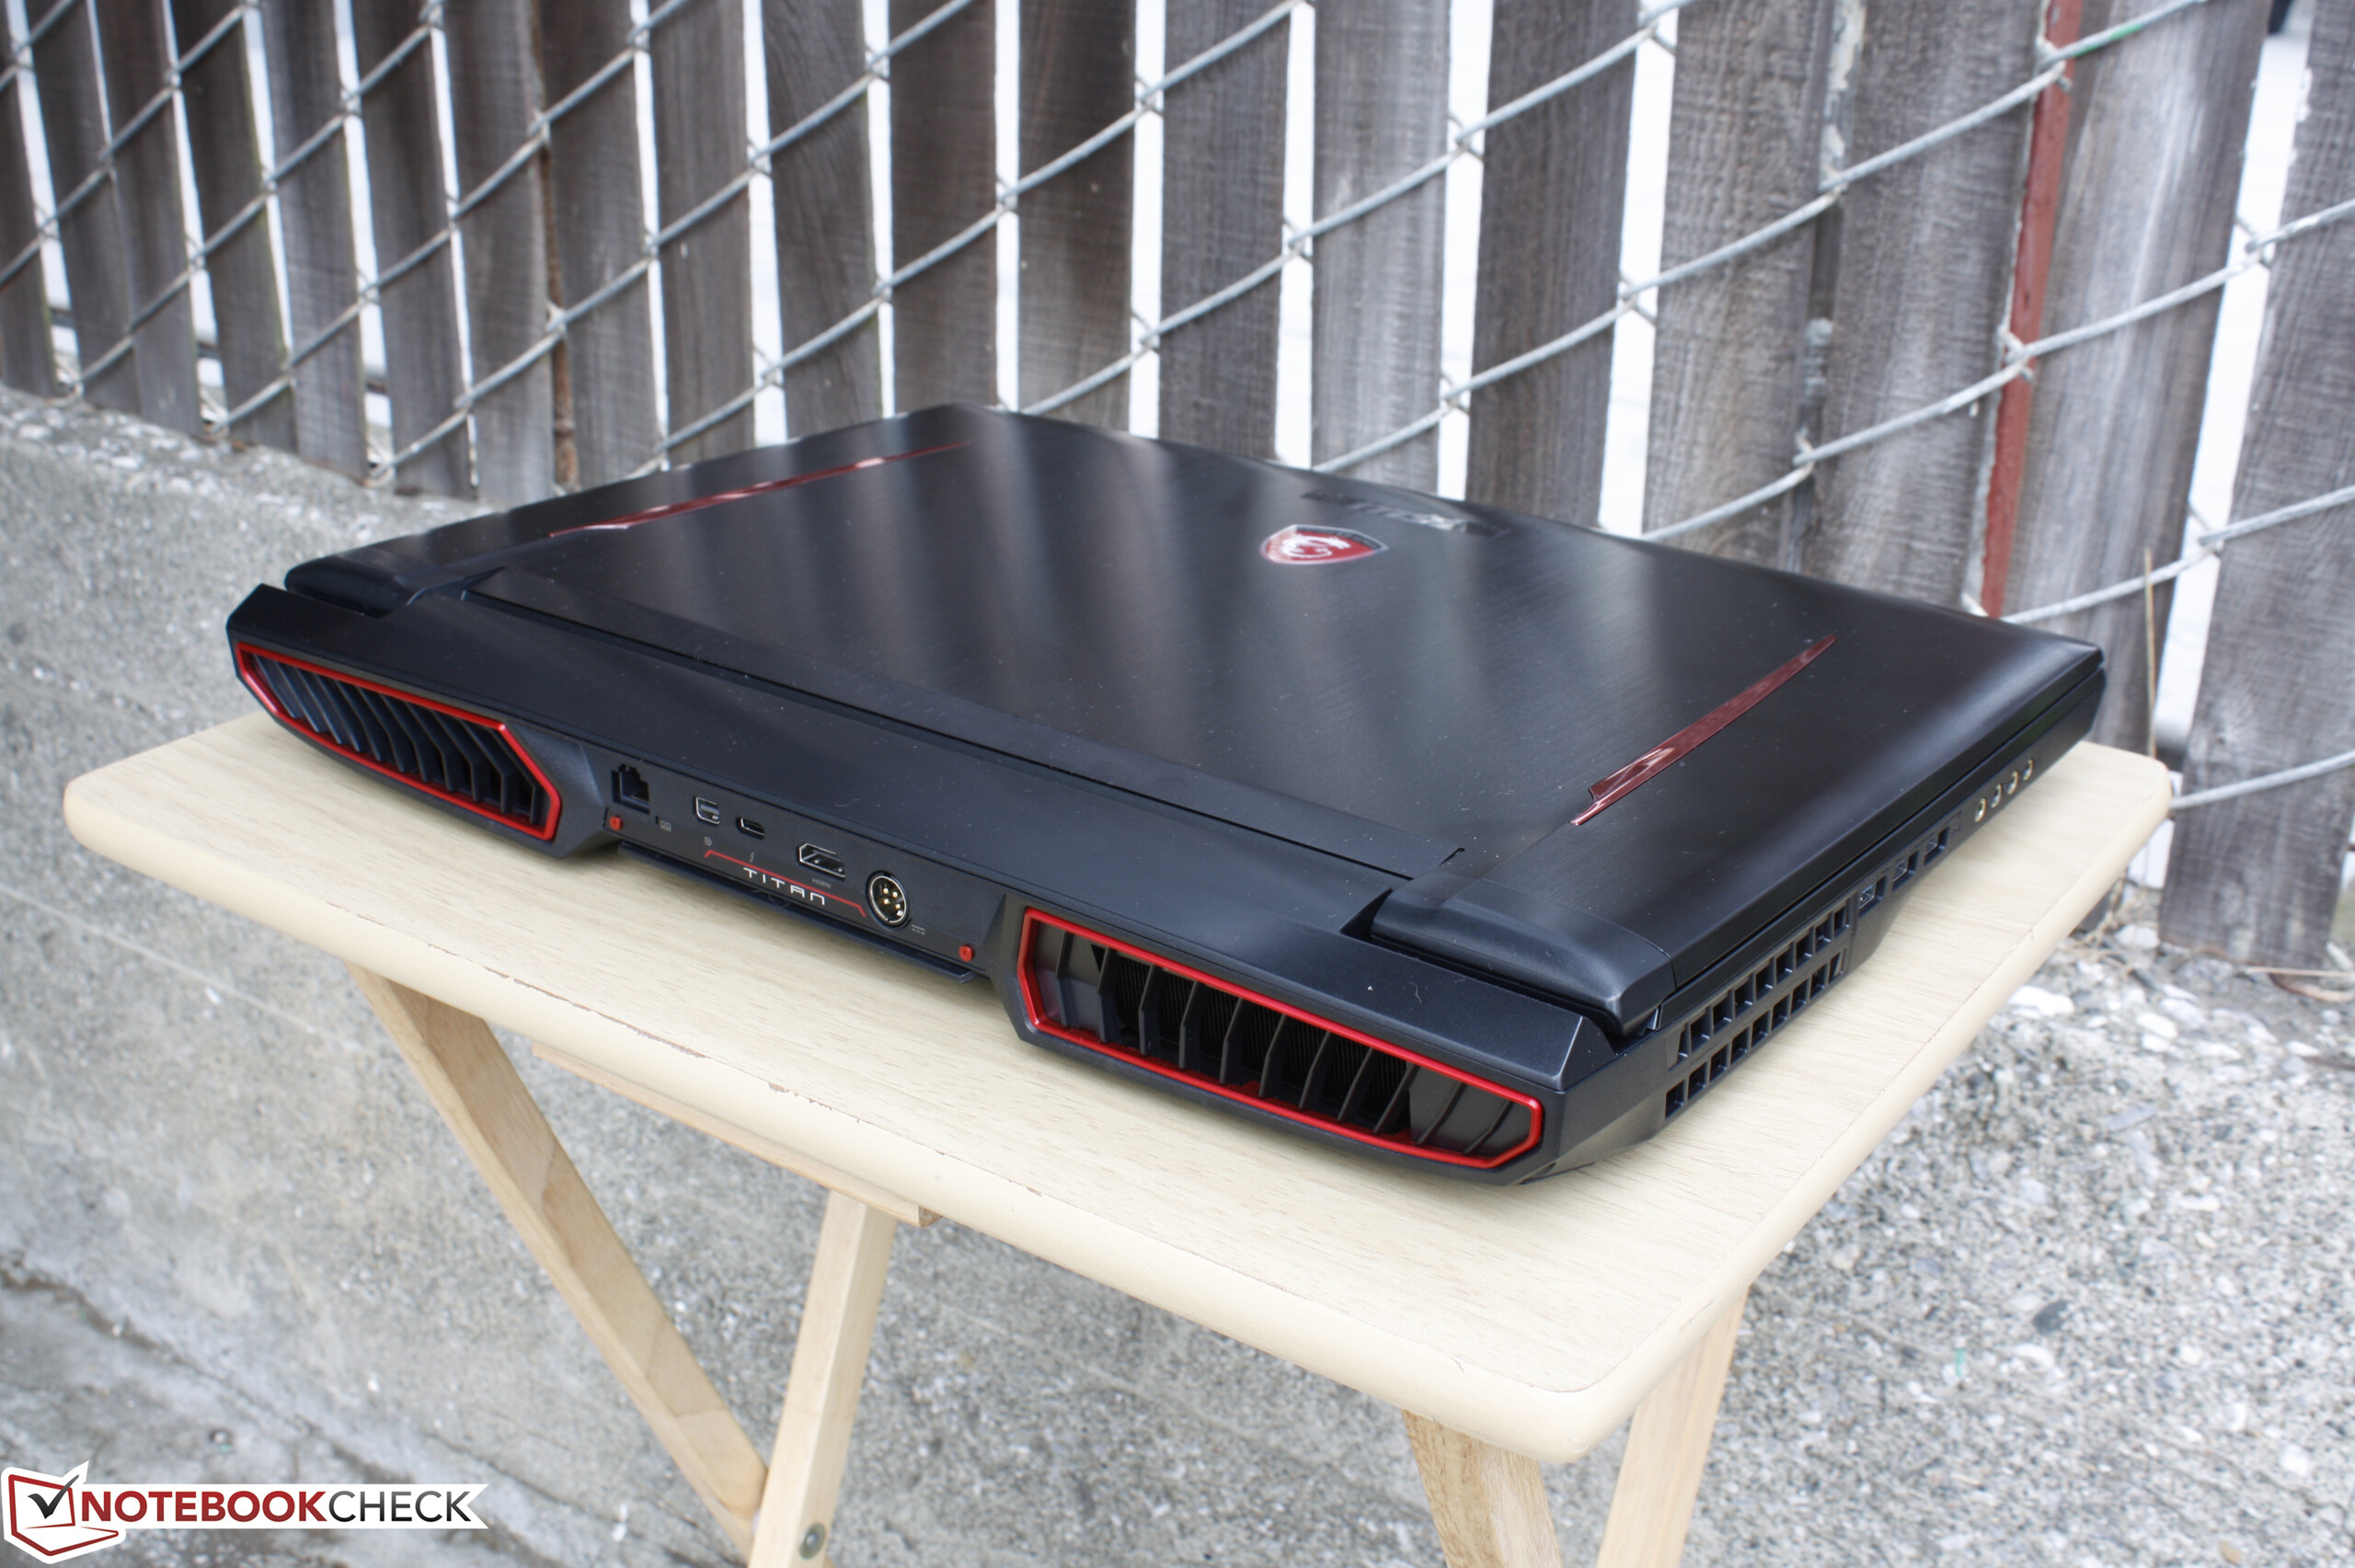
微星 GT73VR 6RF Titan 笔记本电脑简短评测
| SD Card Reader | |
| average JPG Copy Test (av. of 3 runs) | |
| Asus G701VO-CS74K | |
| MSI GT73VR 6RF | |
| MSI GS73VR 6RF | |
| maximum AS SSD Seq Read Test (1GB) | |
| Asus G701VO-CS74K | |
| MSI GT73VR 6RF | |
| MSI GS73VR 6RF | |
| Networking | |
| Wi-Fi Client 1m 512KB | |
| Wi-Fi Server 1m 512KB |
| |||||||||||||||||||||||||
Brightness Distribution: 87 %
Center on Battery: 334.8 cd/m²
Contrast: 793:1 (Black: 0.422 cd/m²)
ΔE ColorChecker Calman: 4.11 | ∀{0.5-29.43 Ø4.71}
ΔE Greyscale Calman: 5.74 | ∀{0.09-98 Ø4.96}
96% sRGB (Argyll 1.6.3 3D)
60.5% AdobeRGB 1998 (Argyll 1.6.3 3D)
65.7% AdobeRGB 1998 (Argyll 3D)
95.8% sRGB (Argyll 3D)
63.6% Display P3 (Argyll 3D)
Gamma: 2.3
CCT: 5987 K
| MSI GT73VR 6RF IPS, 17.3", 3840x2160 | MSI GT73VR-6RE16SR451 N173HHE-G32 (CMN1747), TN, 17.3", 1920x1080 | Acer Predator 17 G9-793-77LG AU Optronics B173ZAN01.0 (AUO109B), IPS, 17.3", 3840x2160 | Asus G701VO-CS74K IPS, 17.3", 1920x1080 | MSI GS73VR 6RF TN LED, 17.3", 1920x1080 | |
|---|---|---|---|---|---|
| Display | 25% | 31% | -1% | 24% | |
| Display P3 Coverage (%) | 63.6 | 91.2 43% | 86.9 37% | 68.8 8% | 90 42% |
| sRGB Coverage (%) | 95.8 | 100 4% | 100 4% | 87.7 -8% | 99.9 4% |
| AdobeRGB 1998 Coverage (%) | 65.7 | 84.9 29% | 99.4 51% | 64.1 -2% | 83.6 27% |
| Response Times | 50% | 5% | 13% | 43% | |
| Response Time Grey 50% / Grey 80% * (ms) | 33.6 ? | 26 ? 23% | 37 ? -10% | 29.2 ? 13% | 28 ? 17% |
| Response Time Black / White * (ms) | 30 ? | 6.8 ? 77% | 24 ? 20% | 26.4 ? 12% | 9.6 ? 68% |
| PWM Frequency (Hz) | |||||
| Screen | -17% | 21% | 7% | 21% | |
| Brightness middle (cd/m²) | 334.8 | 314 -6% | 336 0% | 368.1 10% | 337.2 1% |
| Brightness (cd/m²) | 316 | 294 -7% | 320 1% | 349 10% | 315 0% |
| Brightness Distribution (%) | 87 | 89 2% | 88 1% | 86 -1% | 86 -1% |
| Black Level * (cd/m²) | 0.422 | 0.23 45% | 0.25 41% | 0.365 14% | 0.308 27% |
| Contrast (:1) | 793 | 1365 72% | 1344 69% | 1008 27% | 1095 38% |
| Colorchecker dE 2000 * | 4.11 | 9.74 -137% | 3.61 12% | 4.16 -1% | 2.96 28% |
| Colorchecker dE 2000 max. * | 7.8 | 15.71 -101% | 6.02 23% | 8.7 -12% | 5.45 30% |
| Greyscale dE 2000 * | 5.74 | 9.58 -67% | 4.78 17% | 3.86 33% | 2.57 55% |
| Gamma | 2.3 96% | 2.5 88% | 2.32 95% | 2.19 100% | 2.25 98% |
| CCT | 5987 109% | 11854 55% | 6185 105% | 6892 94% | 7114 91% |
| Color Space (Percent of AdobeRGB 1998) (%) | 60.5 | 76 26% | 88 45% | 57.6 -5% | 74.3 23% |
| Color Space (Percent of sRGB) (%) | 96 | 100 4% | 100 4% | 87.6 -9% | 100 4% |
| Total Average (Program / Settings) | 19% /
0% | 19% /
21% | 6% /
6% | 29% /
24% |
* ... smaller is better
Display Response Times
| ↔ Response Time Black to White | ||
|---|---|---|
| 30 ms ... rise ↗ and fall ↘ combined | ↗ 5.2 ms rise | 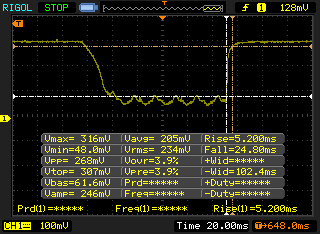 |
| ↘ 24.8 ms fall | ||
| The screen shows slow response rates in our tests and will be unsatisfactory for gamers. In comparison, all tested devices range from 0.1 (minimum) to 240 (maximum) ms. » 80 % of all devices are better. This means that the measured response time is worse than the average of all tested devices (19.8 ms). | ||
| ↔ Response Time 50% Grey to 80% Grey | ||
| 33.6 ms ... rise ↗ and fall ↘ combined | ↗ 13.2 ms rise | 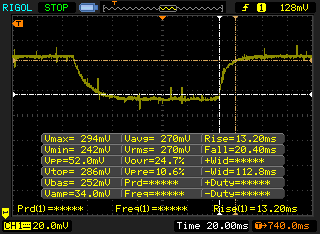 |
| ↘ 20.4 ms fall | ||
| The screen shows slow response rates in our tests and will be unsatisfactory for gamers. In comparison, all tested devices range from 0.165 (minimum) to 636 (maximum) ms. » 46 % of all devices are better. This means that the measured response time is similar to the average of all tested devices (31 ms). | ||
Screen Flickering / PWM (Pulse-Width Modulation)
| Screen flickering / PWM not detected | 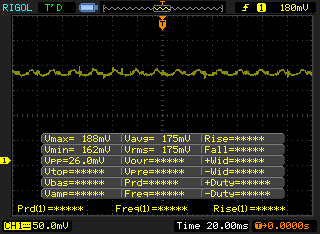 | ||
In comparison: 52 % of all tested devices do not use PWM to dim the display. If PWM was detected, an average of 7754 (minimum: 5 - maximum: 343500) Hz was measured. | |||
| Cinebench R11.5 | |
| CPU Single 64Bit | |
| MSI GT73VR 6RF | |
| Eurocom Sky X7E2 | |
| MSI GP62-2QEi781FD | |
| MSI GT72VR 6RD-063US | |
| Toshiba Satellite S70-B-106 | |
| CPU Multi 64Bit | |
| MSI GT73VR 6RF | |
| Eurocom Sky X7E2 | |
| MSI GP62-2QEi781FD | |
| MSI GT72VR 6RD-063US | |
| Toshiba Satellite S70-B-106 | |
| Cinebench R10 | |
| Rendering Multiple CPUs 32Bit | |
| MSI GT73VR 6RF | |
| Eurocom Sky X7E2 | |
| MSI GT72VR 6RD-063US | |
| MSI GP62-2QEi781FD | |
| Rendering Single 32Bit | |
| Eurocom Sky X7E2 | |
| MSI GT73VR 6RF | |
| MSI GP62-2QEi781FD | |
| MSI GT72VR 6RD-063US | |
| PCMark 8 | |
| Home Score Accelerated v2 | |
| Asus G752VS-XB78K | |
| Asus G701VO-CS74K | |
| MSI GT73VR 6RF | |
| MSI GS73VR 6RF | |
| EVGA SC17 | |
| Work Score Accelerated v2 | |
| Asus G752VS-XB78K | |
| Asus G701VO-CS74K | |
| MSI GS73VR 6RF | |
| MSI GT73VR 6RF | |
| EVGA SC17 | |
| Creative Score Accelerated v2 | |
| Asus G752VS-XB78K | |
| MSI GT73VR 6RF | |
| Asus G701VO-CS74K | |
| MSI GS73VR 6RF | |
| EVGA SC17 | |
| PCMark 8 Home Score Accelerated v2 | 4252 points | |
| PCMark 8 Creative Score Accelerated v2 | 8227 points | |
| PCMark 8 Work Score Accelerated v2 | 4378 points | |
Help | ||
| MSI GT73VR 6RF 2x SanDisk X400 1TB M.2 SD8SN8U1T001122 (RAID 0) | MSI GT73VR-6RE16SR451 2x Samsung SM951 MZVPV256HDGL (RAID 0) | Asus G701VO-CS74K 2x Samsung SM951 MZVPV512HDGL (RAID 0) | Eurocom Sky X7E2 Samsung SM951 MZVPV512HDGL m.2 PCI-e | MSI GS73VR 6RF SanDisk SD8SN8U1T001122 | |
|---|---|---|---|---|---|
| CrystalDiskMark 3.0 | 127% | 105% | 67% | -55% | |
| Read Seq (MB/s) | 914 | 3285 259% | 3067 236% | 1673 83% | 334.3 -63% |
| Write Seq (MB/s) | 916 | 2560 179% | 2434 166% | 1576 72% | 319 -65% |
| Read 512 (MB/s) | 698 | 1775 154% | 1582 127% | 1180 69% | 242.3 -65% |
| Write 512 (MB/s) | 916 | 2327 154% | 2255 146% | 1561 70% | 254.4 -72% |
| Read 4k (MB/s) | 31.37 | 52.2 66% | 47.25 51% | 51.5 64% | 20.3 -35% |
| Write 4k (MB/s) | 65.7 | 153.1 133% | 110.7 68% | 144 119% | 42.51 -35% |
| Read 4k QD32 (MB/s) | 425 | 627 48% | 584 37% | 694 63% | 251.6 -41% |
| Write 4k QD32 (MB/s) | 441.8 | 527 19% | 463.3 5% | 422.1 -4% | 167.1 -62% |

| 3DMark | |
| 1920x1080 Fire Strike Graphics | |
| MSI GT73VR 6RF | |
| Nvidia GeForce GTX 1080 Founders Edition | |
| Eurocom X8 | |
| MSI GT73VR-6RE16SR451 | |
| Asus G701VO-CS74K | |
| MSI GT72VR 6RD-063US | |
| Asus Strix GL502VY-DS71 | |
| 3840x2160 Fire Strike Ultra Graphics | |
| MSI GT73VR 6RF | |
| Nvidia GeForce GTX 1080 Founders Edition | |
| MSI GT73VR-6RE16SR451 | |
| Asus G701VO-CS74K | |
| MSI GT72VR 6RD-063US | |
| Asus Strix GL502VY-DS71 | |
| Fire Strike Extreme Graphics | |
| MSI GT73VR 6RF | |
| Nvidia GeForce GTX 1080 Founders Edition | |
| Eurocom X8 | |
| Asus G701VO-CS74K | |
| MSI GT72VR 6RD-063US | |
| Asus Strix GL502VY-DS71 | |
| 3DMark 11 | |
| 1280x720 Performance GPU | |
| Nvidia GeForce GTX 1080 Founders Edition | |
| MSI GT73VR 6RF | |
| MSI GT73VR-6RE16SR451 | |
| Eurocom X8 | |
| Asus G701VO-CS74K | |
| MSI GT72VR 6RD-063US | |
| Asus Strix GL502VY-DS71 | |
| 1280x720 Performance Combined | |
| Nvidia GeForce GTX 1080 Founders Edition | |
| MSI GT73VR-6RE16SR451 | |
| Asus G701VO-CS74K | |
| MSI GT73VR 6RF | |
| Eurocom X8 | |
| Asus Strix GL502VY-DS71 | |
| MSI GT72VR 6RD-063US | |
| 3DMark 11 Performance | 18087 points | |
| 3DMark Ice Storm Standard Score | 124187 points | |
| 3DMark Cloud Gate Standard Score | 24487 points | |
| 3DMark Fire Strike Score | 14820 points | |
| 3DMark Fire Strike Extreme Score | 9042 points | |
Help | ||
| Fallout 4 - 3840x2160 High Preset AA:T AF:16x | |
| Nvidia GeForce GTX 1080 Founders Edition | |
| MSI GT73VR 6RF | |
| Nvidia GeForce GTX 1070 Founders Edition | |
| Nvidia GeForce GTX 1060 Founders Edition 6 GB | |
| Batman: Arkham Knight - 3840x2160 High / On (Interactive Smoke & Paper Debris Off) AA:SM AF:8x | |
| MSI GT73VR 6RF | |
| Nvidia GeForce GTX 1060 Founders Edition 6 GB | |
| Rise of the Tomb Raider - 3840x2160 High Preset AA:FX AF:4x | |
| Nvidia GeForce GTX 1080 Founders Edition | |
| Nvidia GeForce GTX 1080 Founders Edition | |
| MSI GT73VR 6RF | |
| Nvidia GeForce GTX 1070 Founders Edition | |
| Nvidia GeForce GTX 1060 Founders Edition 6 GB | |
| Nvidia GeForce GTX 1060 Founders Edition 6 GB | |
| Doom - 3840x2160 High Preset AA:FX | |
| MSI GT73VR 6RF | |
| Nvidia GeForce GTX 1080 Founders Edition | |
| Nvidia GeForce GTX 1070 Founders Edition | |
| Nvidia GeForce GTX 1060 Founders Edition 6 GB | |
| Overwatch - 3840x2160 High (Render Scale 100 %) AA:SM AF:4x | |
| Nvidia GeForce GTX 1080 Founders Edition | |
| MSI GT73VR 6RF | |
| Nvidia GeForce GTX 1070 Founders Edition | |
| Nvidia GeForce GTX 1060 Founders Edition 6 GB | |
| Mafia 3 - 3840x2160 High Preset | |
| Nvidia GeForce GTX 1080 Founders Edition | |
| low | med. | high | ultra | 4K | |
|---|---|---|---|---|---|
| Batman: Arkham Knight (2015) | 52 | ||||
| Metal Gear Solid V (2015) | 60 | ||||
| Fallout 4 (2015) | 51.7 | ||||
| Rise of the Tomb Raider (2016) | 49.8 | ||||
| Doom (2016) | 64.1 | ||||
| Overwatch (2016) | 103.1 | ||||
| Mafia 3 (2016) | 73.6 |
Noise level
| Idle |
| 32 / 32 / 35 dB(A) |
| Load |
| 50 / 64 dB(A) |
 | ||
30 dB silent 40 dB(A) audible 50 dB(A) loud |
||
min: | ||
| MSI GT73VR 6RF GeForce GTX 1080 Mobile, 6820HK, 2x SanDisk X400 1TB M.2 SD8SN8U1T001122 (RAID 0) | MSI GT73VR-6RE16SR451 GeForce GTX 1070 Mobile, 6820HK, 2x Samsung SM951 MZVPV256HDGL (RAID 0) | Acer Predator 17 G9-793-77LG GeForce GTX 1070 Mobile, 6700HQ, Toshiba NVMe THNSN5256GPU7 | Asus G701VO-CS74K GeForce GTX 980 (Laptop), 6820HK, 2x Samsung SM951 MZVPV512HDGL (RAID 0) | MSI GS73VR 6RF GeForce GTX 1060 Mobile, 6700HQ, SanDisk SD8SN8U1T001122 | |
|---|---|---|---|---|---|
| Noise | 8% | 1% | 9% | 6% | |
| off / environment * (dB) | 29.2 | 30 -3% | 31 -6% | 29.1 -0% | 28.4 3% |
| Idle Minimum * (dB) | 32 | 32 -0% | 33 -3% | 29.1 9% | 31.9 -0% |
| Idle Average * (dB) | 32 | 33 -3% | 34 -6% | 31.9 -0% | 32 -0% |
| Idle Maximum * (dB) | 35 | 35 -0% | 40 -14% | 31.9 9% | 34 3% |
| Load Average * (dB) | 50 | 35 30% | 44 12% | 46 8% | 47 6% |
| Load Maximum * (dB) | 64 | 49 23% | 50 22% | 47.5 26% | 49.4 23% |
* ... smaller is better
(±) The maximum temperature on the upper side is 41.4 °C / 107 F, compared to the average of 40.4 °C / 105 F, ranging from 21.2 to 68.8 °C for the class Gaming.
(-) The bottom heats up to a maximum of 59 °C / 138 F, compared to the average of 43.2 °C / 110 F
(+) In idle usage, the average temperature for the upper side is 26.8 °C / 80 F, compared to the device average of 33.9 °C / 93 F.
(+) The palmrests and touchpad are cooler than skin temperature with a maximum of 30.4 °C / 86.7 F and are therefore cool to the touch.
(±) The average temperature of the palmrest area of similar devices was 28.8 °C / 83.8 F (-1.6 °C / -2.9 F).
MSI GT73VR 6RF audio analysis
(±) | speaker loudness is average but good (79.1 dB)
Bass 100 - 315 Hz
(±) | reduced bass - on average 8.2% lower than median
(±) | linearity of bass is average (8% delta to prev. frequency)
Mids 400 - 2000 Hz
(+) | balanced mids - only 3.3% away from median
(+) | mids are linear (6.4% delta to prev. frequency)
Highs 2 - 16 kHz
(+) | balanced highs - only 4.6% away from median
(±) | linearity of highs is average (9.9% delta to prev. frequency)
Overall 100 - 16.000 Hz
(±) | linearity of overall sound is average (19.9% difference to median)
Compared to same class
» 70% of all tested devices in this class were better, 6% similar, 24% worse
» The best had a delta of 6%, average was 18%, worst was 132%
Compared to all devices tested
» 51% of all tested devices were better, 7% similar, 42% worse
» The best had a delta of 4%, average was 23%, worst was 134%
Apple MacBook 12 (Early 2016) 1.1 GHz audio analysis
(+) | speakers can play relatively loud (83.6 dB)
Bass 100 - 315 Hz
(±) | reduced bass - on average 11.3% lower than median
(±) | linearity of bass is average (14.2% delta to prev. frequency)
Mids 400 - 2000 Hz
(+) | balanced mids - only 2.4% away from median
(+) | mids are linear (5.5% delta to prev. frequency)
Highs 2 - 16 kHz
(+) | balanced highs - only 2% away from median
(+) | highs are linear (4.5% delta to prev. frequency)
Overall 100 - 16.000 Hz
(+) | overall sound is linear (10.2% difference to median)
Compared to same class
» 7% of all tested devices in this class were better, 2% similar, 90% worse
» The best had a delta of 5%, average was 18%, worst was 53%
Compared to all devices tested
» 5% of all tested devices were better, 1% similar, 94% worse
» The best had a delta of 4%, average was 23%, worst was 134%
| Off / Standby | |
| Idle | |
| Load |
|
Key:
min: | |
| MSI GT73VR 6RF 6820HK, GeForce GTX 1080 Mobile, 2x SanDisk X400 1TB M.2 SD8SN8U1T001122 (RAID 0), IPS, 3840x2160, 17.3" | MSI GT73VR-6RE16SR451 6820HK, GeForce GTX 1070 Mobile, 2x Samsung SM951 MZVPV256HDGL (RAID 0), TN, 1920x1080, 17.3" | Acer Predator 17 G9-793-77LG 6700HQ, GeForce GTX 1070 Mobile, Toshiba NVMe THNSN5256GPU7, IPS, 3840x2160, 17.3" | Asus G701VO-CS74K 6820HK, GeForce GTX 980 (Laptop), 2x Samsung SM951 MZVPV512HDGL (RAID 0), IPS, 1920x1080, 17.3" | MSI GS73VR 6RF 6700HQ, GeForce GTX 1060 Mobile, SanDisk SD8SN8U1T001122, TN LED, 1920x1080, 17.3" | |
|---|---|---|---|---|---|
| Power Consumption | 8% | 8% | 14% | 22% | |
| Idle Minimum * (Watt) | 28.9 | 31 -7% | 25 13% | 28.2 2% | 22.6 22% |
| Idle Average * (Watt) | 30.6 | 35 -14% | 35 -14% | 32 -5% | 32.7 -7% |
| Idle Maximum * (Watt) | 33.1 | 40 -21% | 46 -39% | 32.6 2% | 32.8 1% |
| Load Average * (Watt) | 224.4 | 106 53% | 103 54% | 162.2 28% | 114.7 49% |
| Load Maximum * (Watt) | 302.6 | 218 28% | 223 26% | 173.5 43% | 167.9 45% |
* ... smaller is better
| MSI GT73VR 6RF 6820HK, GeForce GTX 1080 Mobile, 75.2 Wh | MSI GT73VR-6RE16SR451 6820HK, GeForce GTX 1070 Mobile, 75.2 Wh | Acer Predator 17 G9-793-77LG 6700HQ, GeForce GTX 1070 Mobile, 88 Wh | Asus G701VO-CS74K 6820HK, GeForce GTX 980 (Laptop), 93 Wh | MSI GS73VR 6RF 6700HQ, GeForce GTX 1060 Mobile, 65 Wh | |
|---|---|---|---|---|---|
| Battery runtime | 2% | 9% | 6% | 8% | |
| Reader / Idle (h) | 5.1 | 4.8 -6% | 4.6 -10% | 4 -22% | 5.9 16% |
| WiFi v1.3 (h) | 3.3 | 3.4 3% | 3.3 0% | 3.4 3% | 3.6 9% |
| Load (h) | 1.1 | 1.2 9% | 1.5 36% | 1.5 36% | 1.1 0% |
Pros
Cons

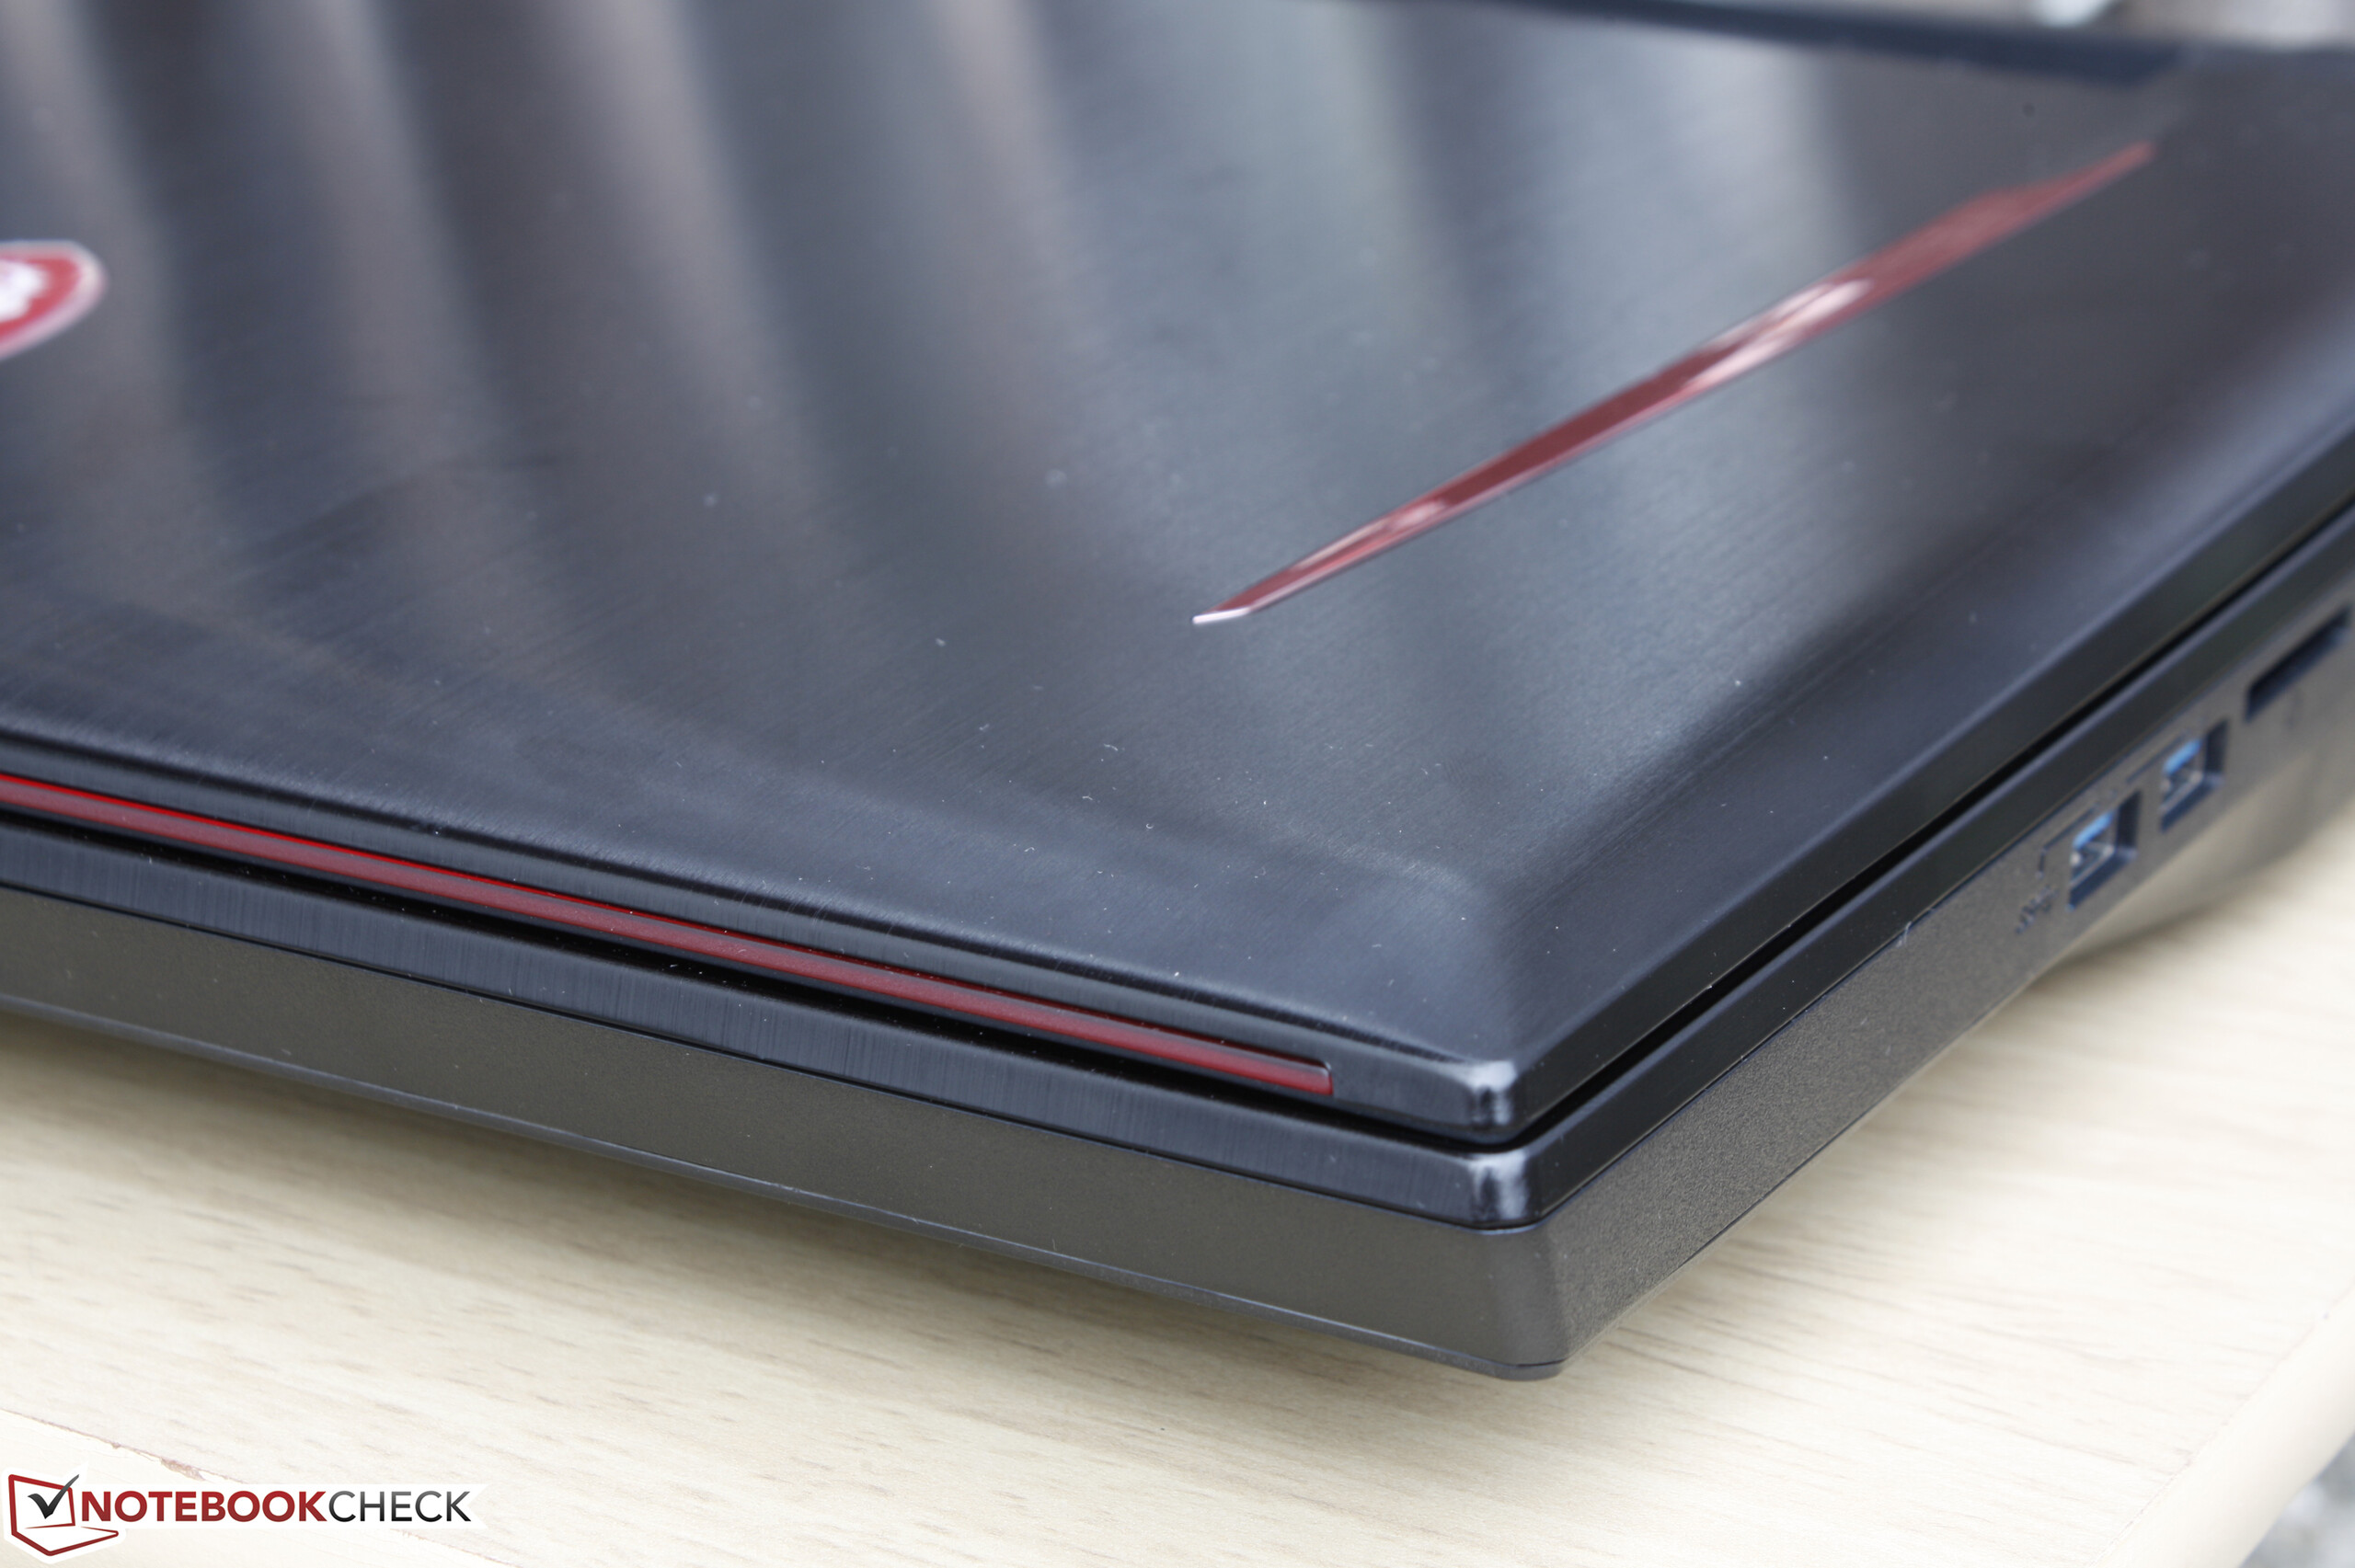
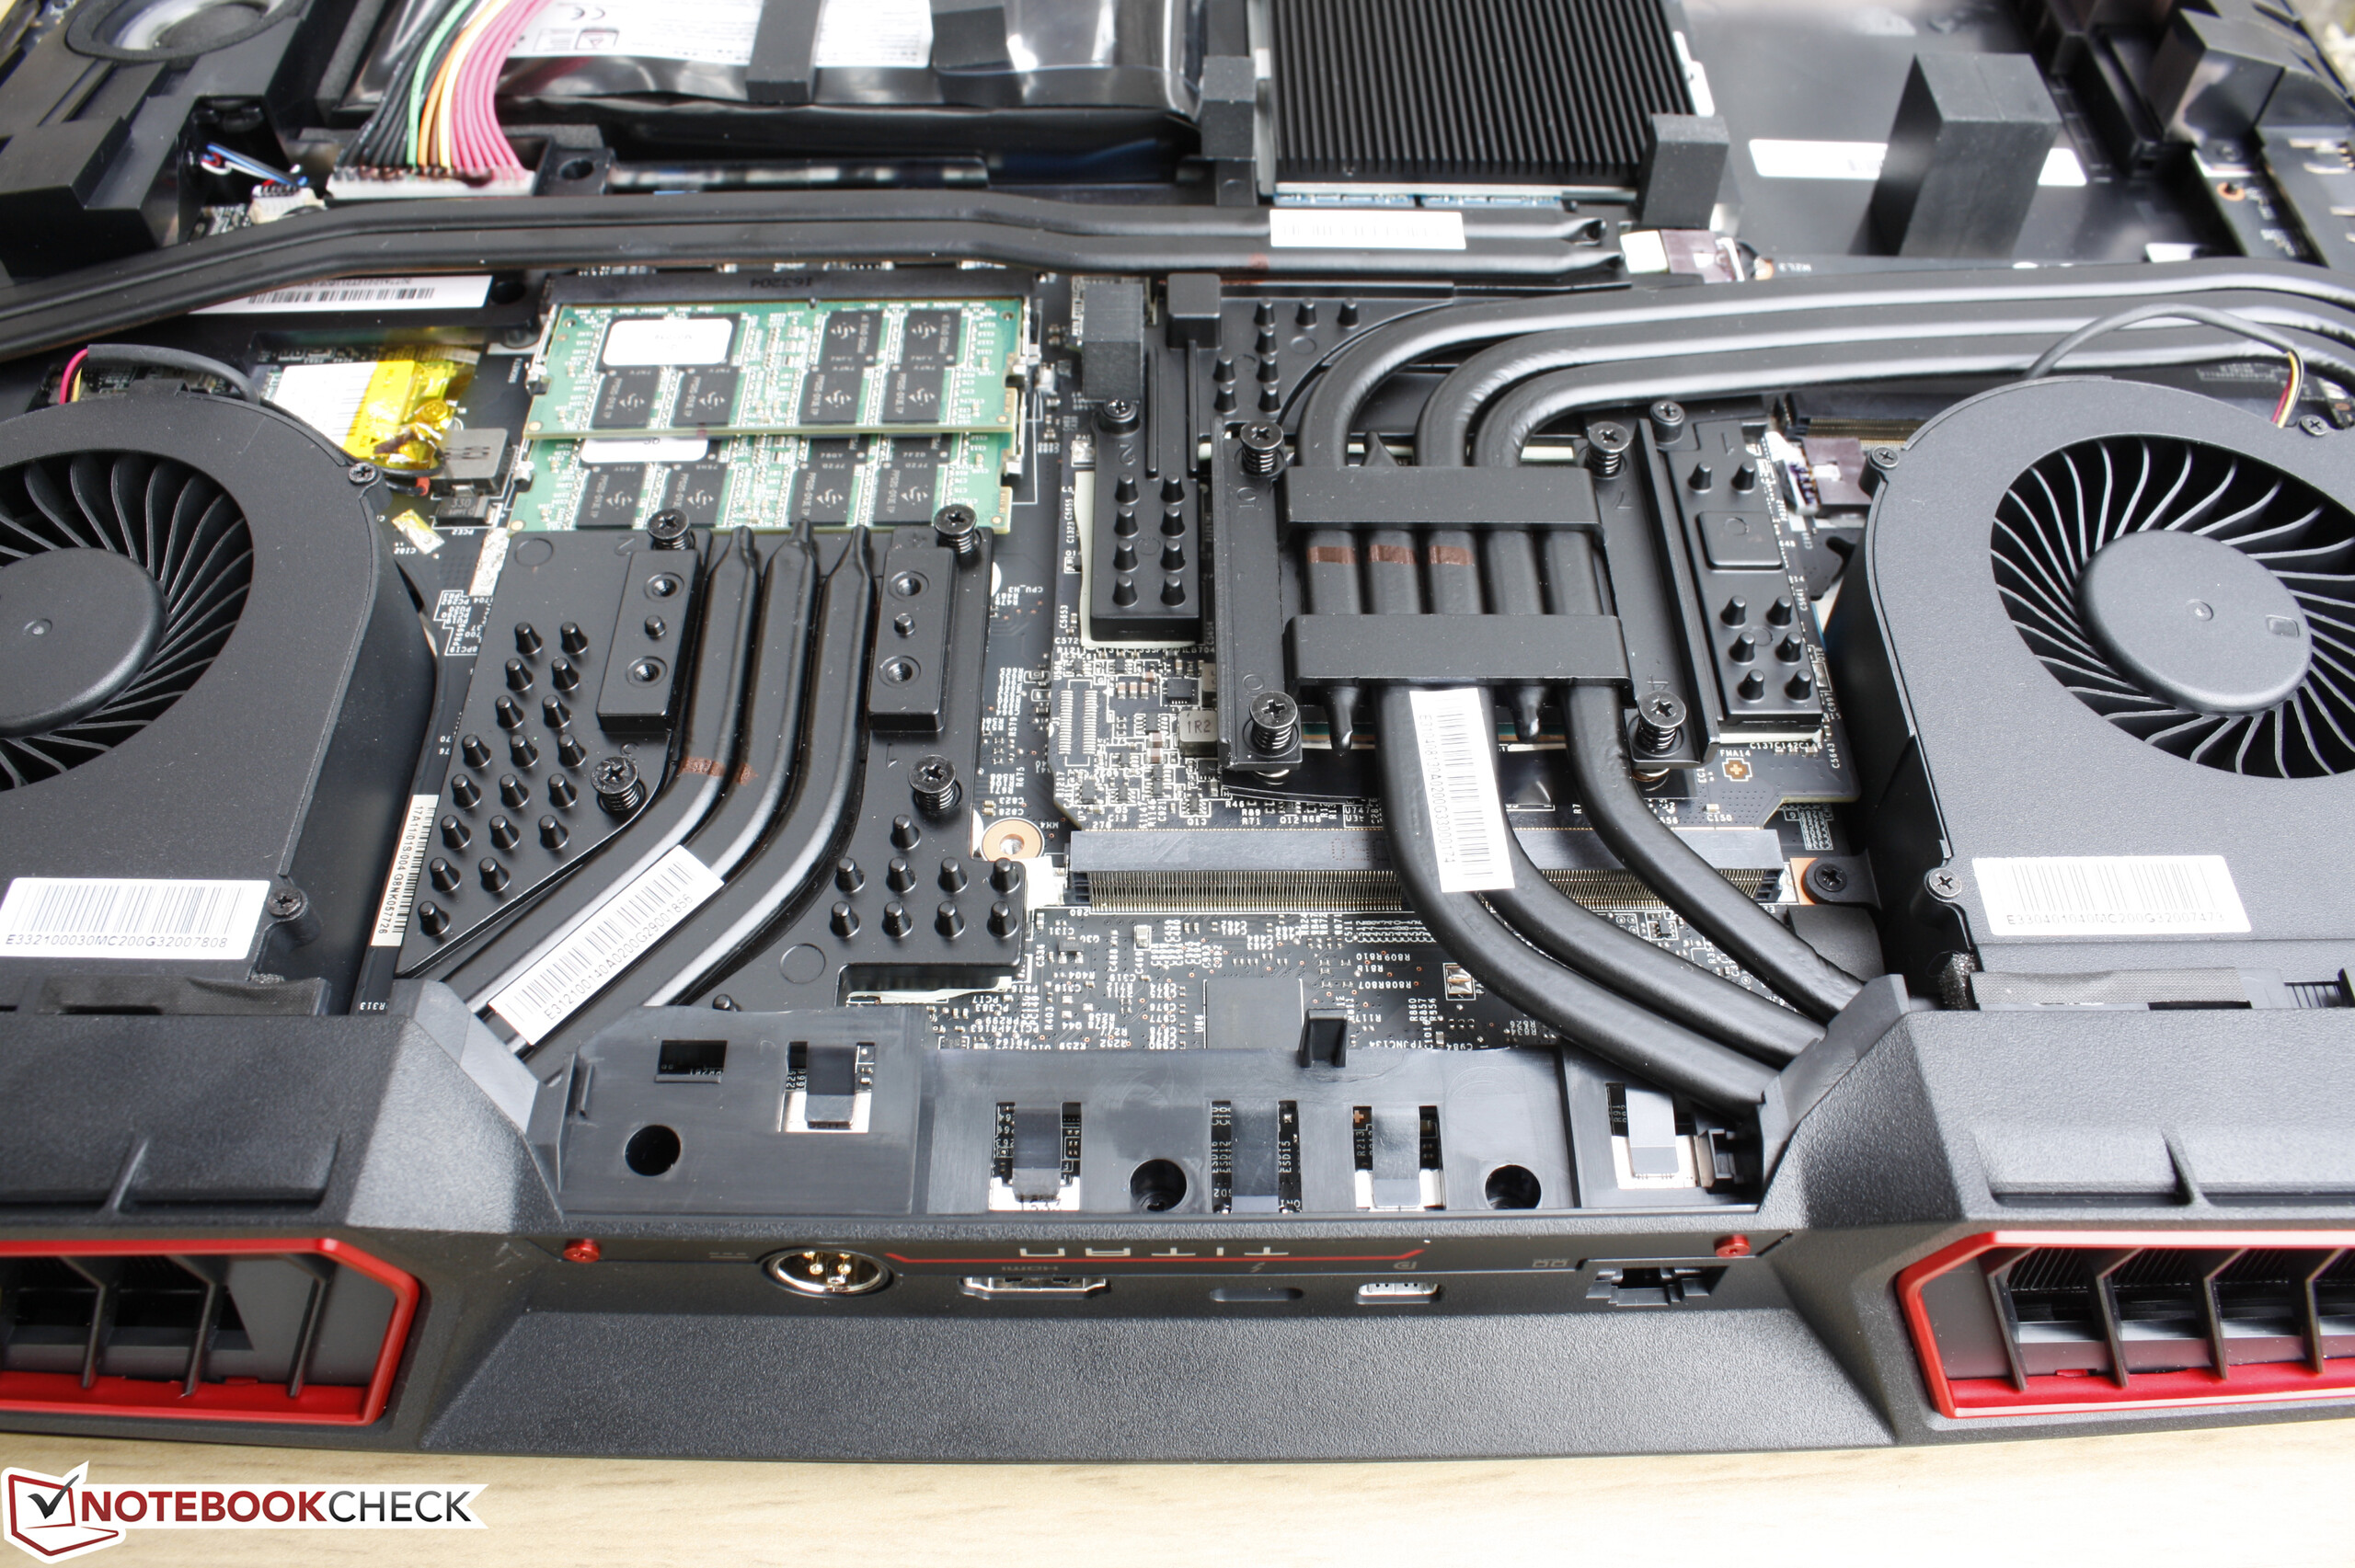
4K UHD屏幕和GTX 1080显卡的搭配是目前GT73VR的“Ultimate”单显卡配置型号。它的性能足以让人瞠目结舌,不过相比售价较低的全高清屏幕和GTX 1070显卡型号,它的缺点也十分突出。
首先,这块4K屏幕只支持60赫兹刷新率,相比全高清的120赫兹/5毫秒刷新率更容易遇到延迟鬼影问题。它的对比度和色彩都比全高清屏幕面板更差。其次,GTX 1080带来了更高的发热量,也让散热系统相比使用GTX 1070时更吵,因此更强的显卡性能带来的不仅仅是更高的价位。
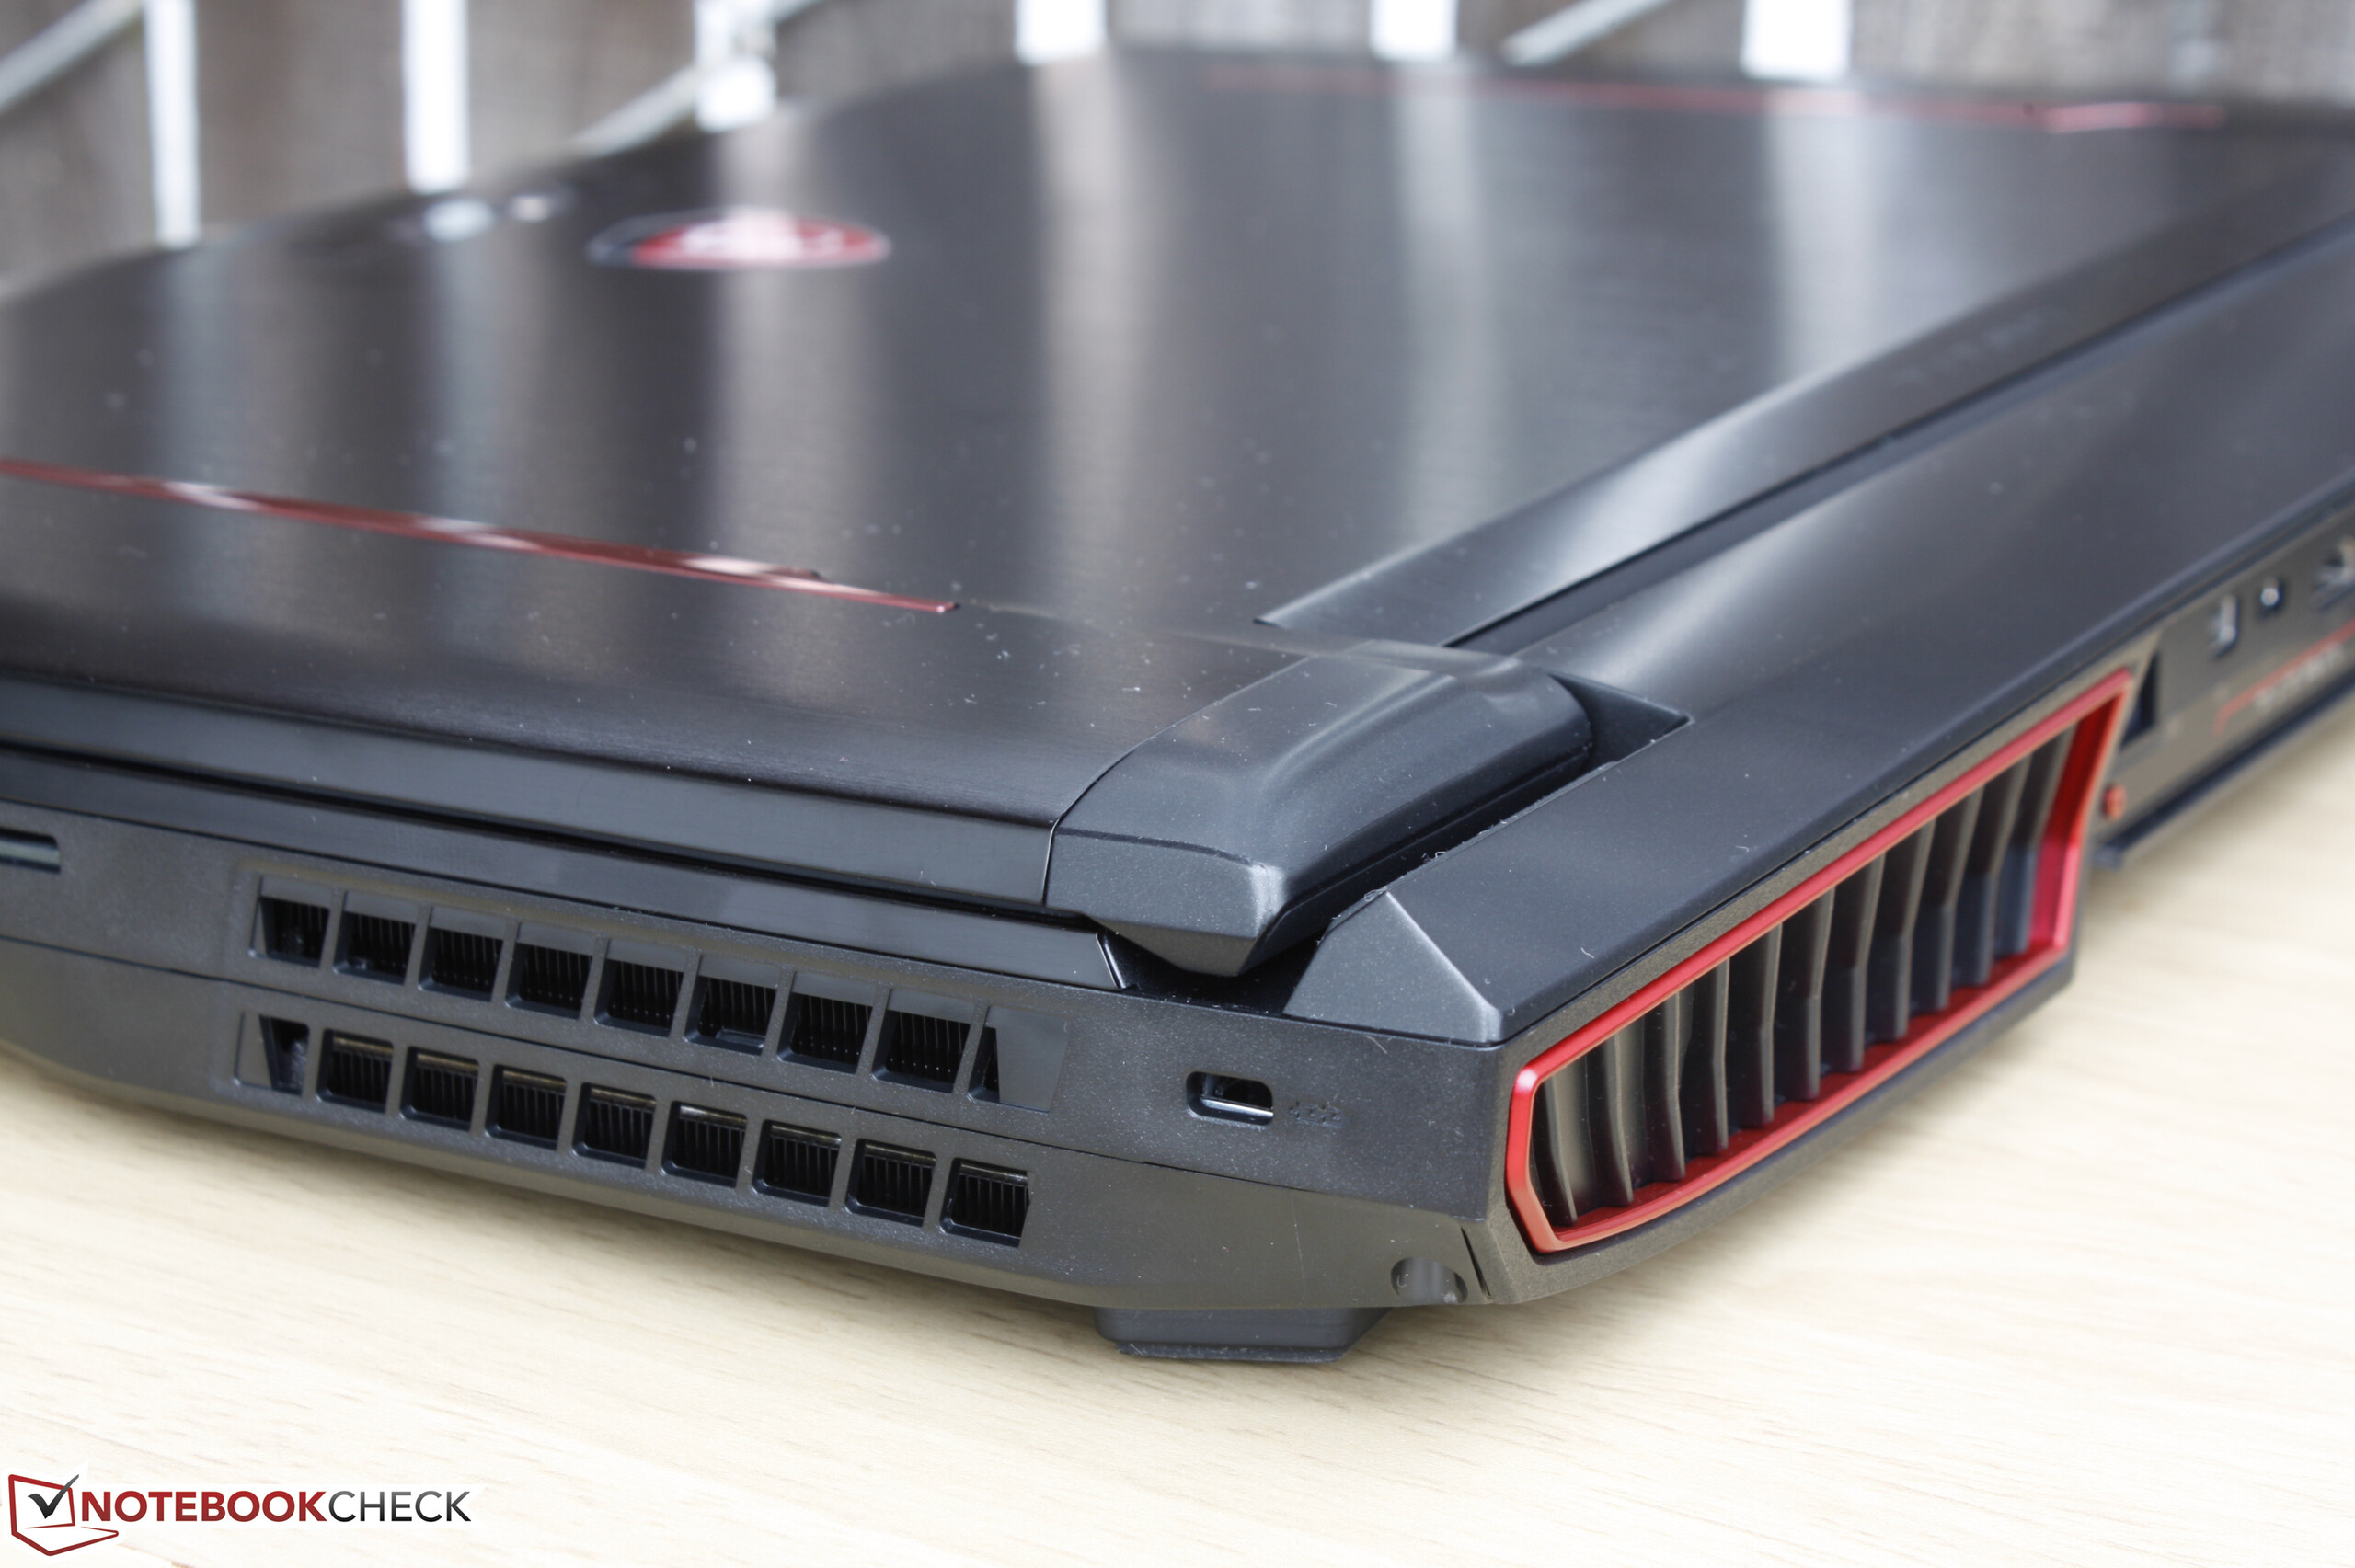
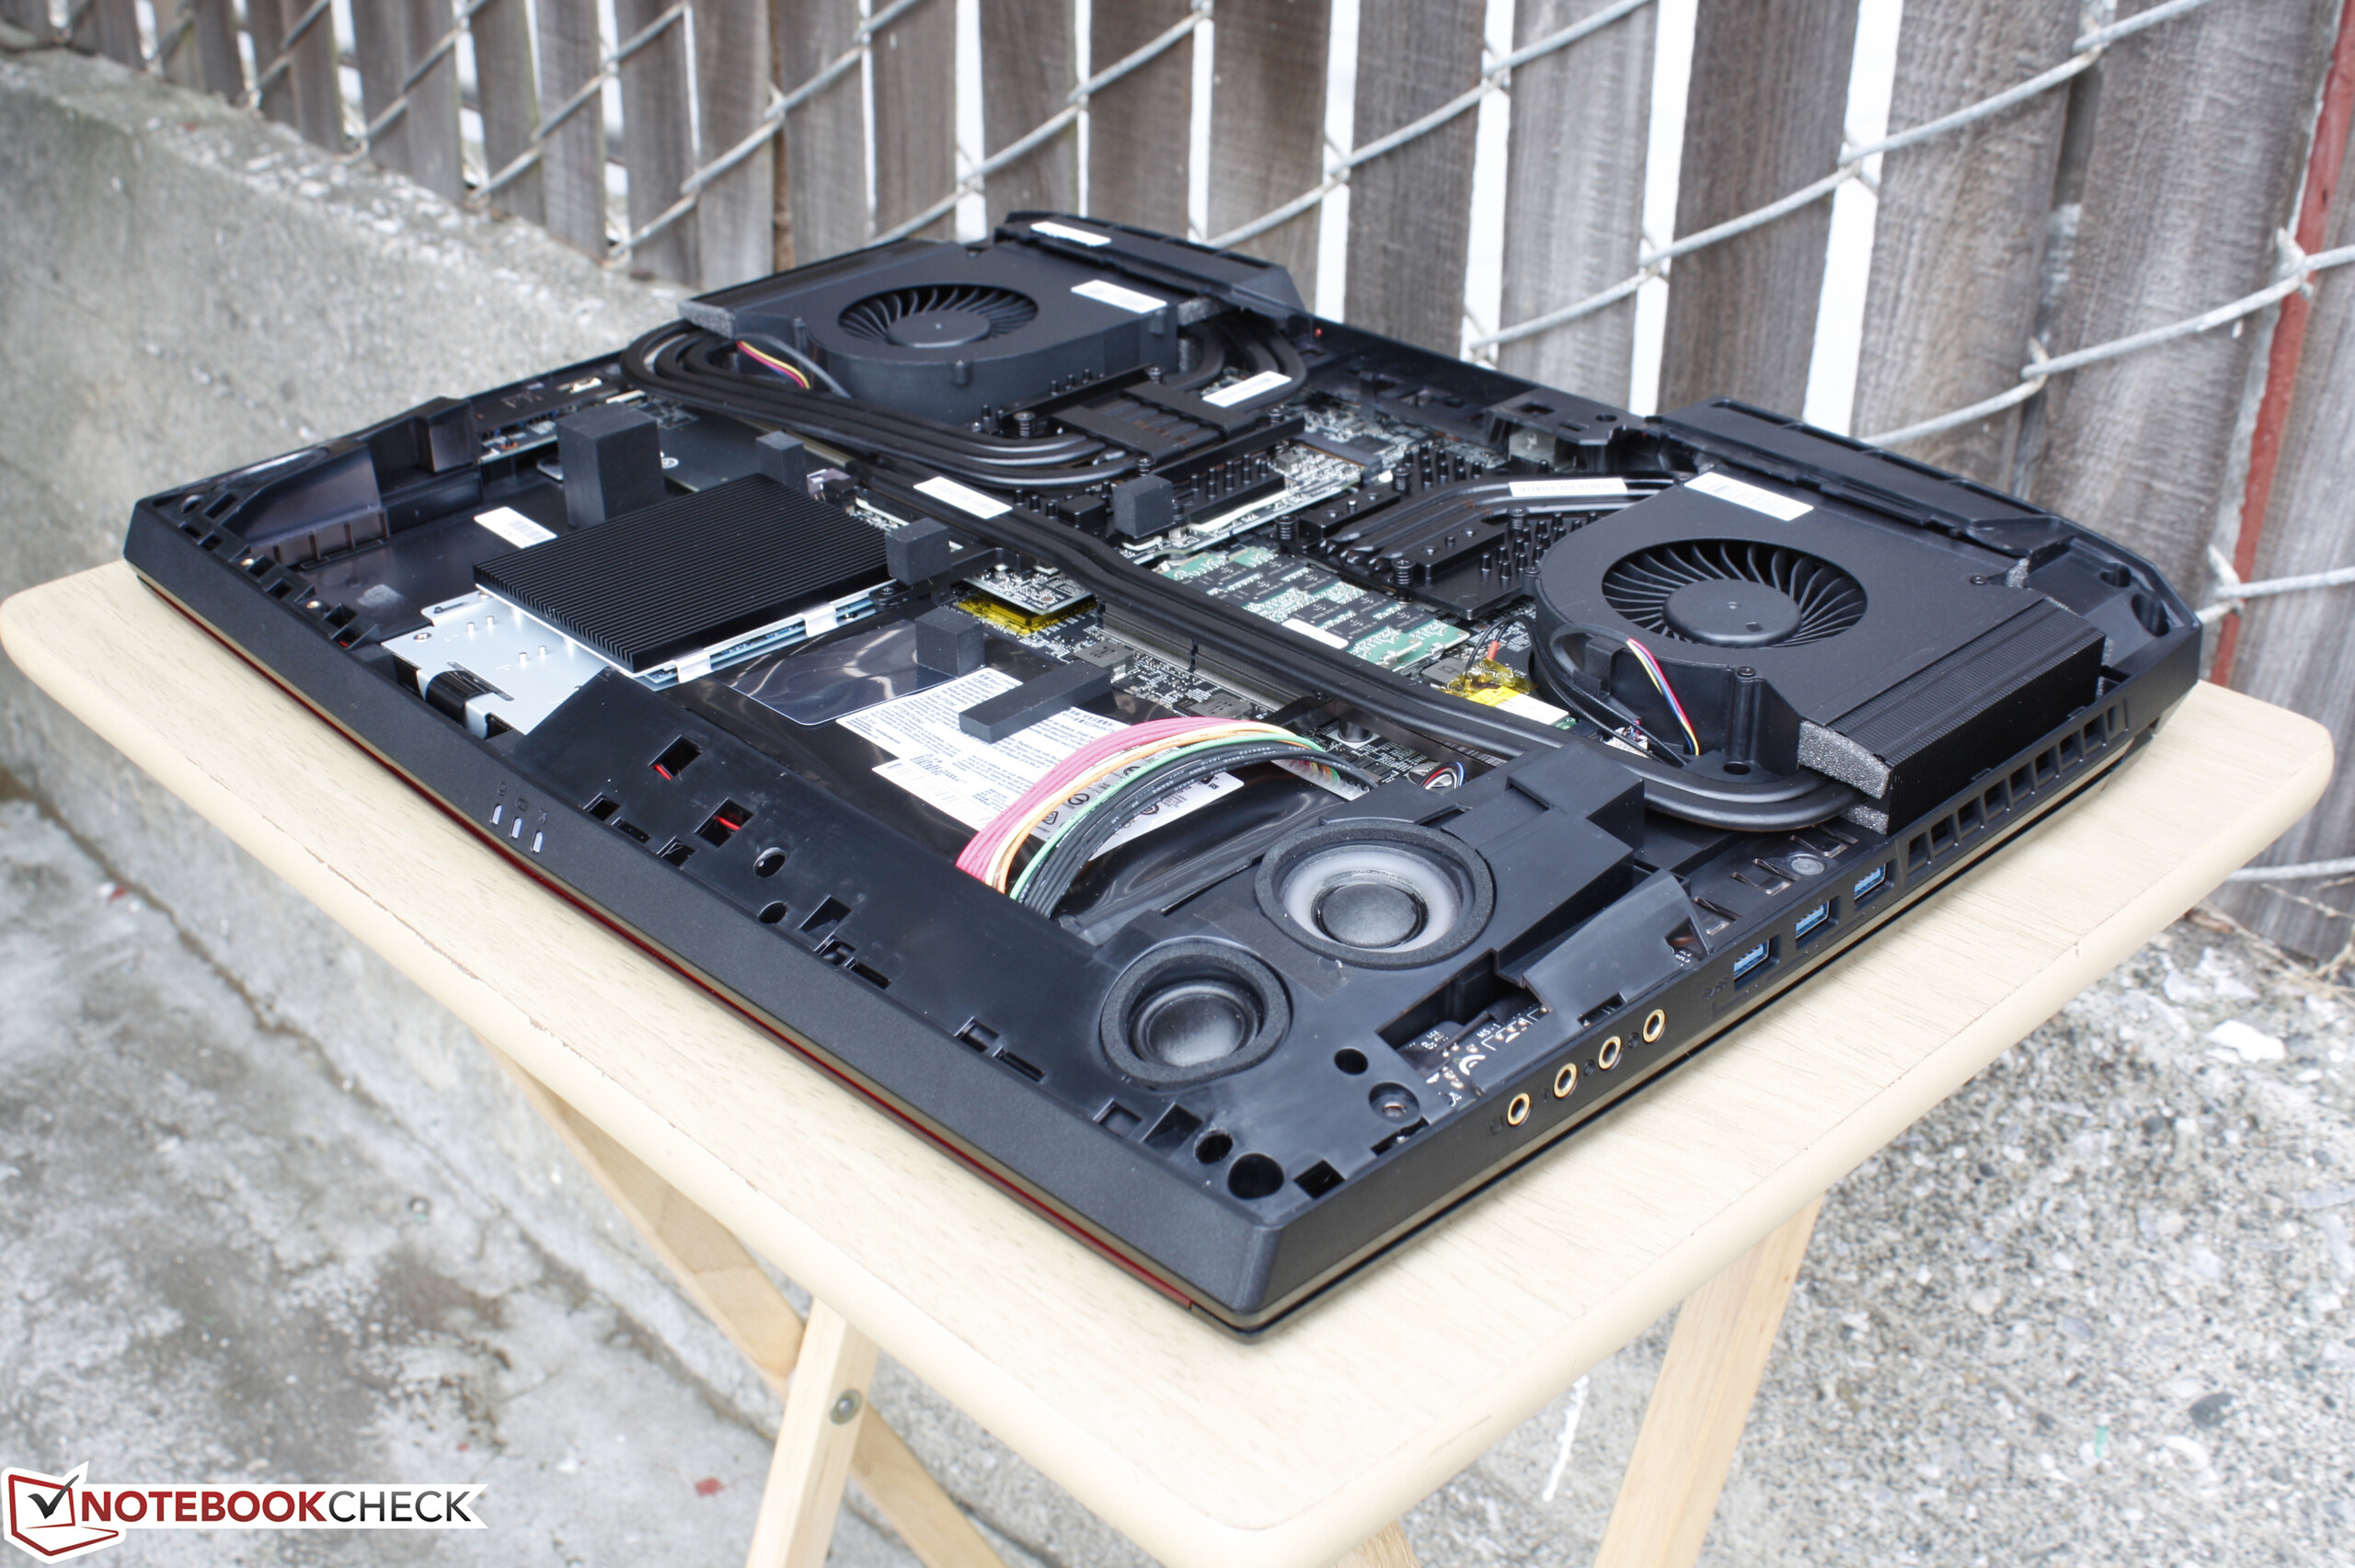
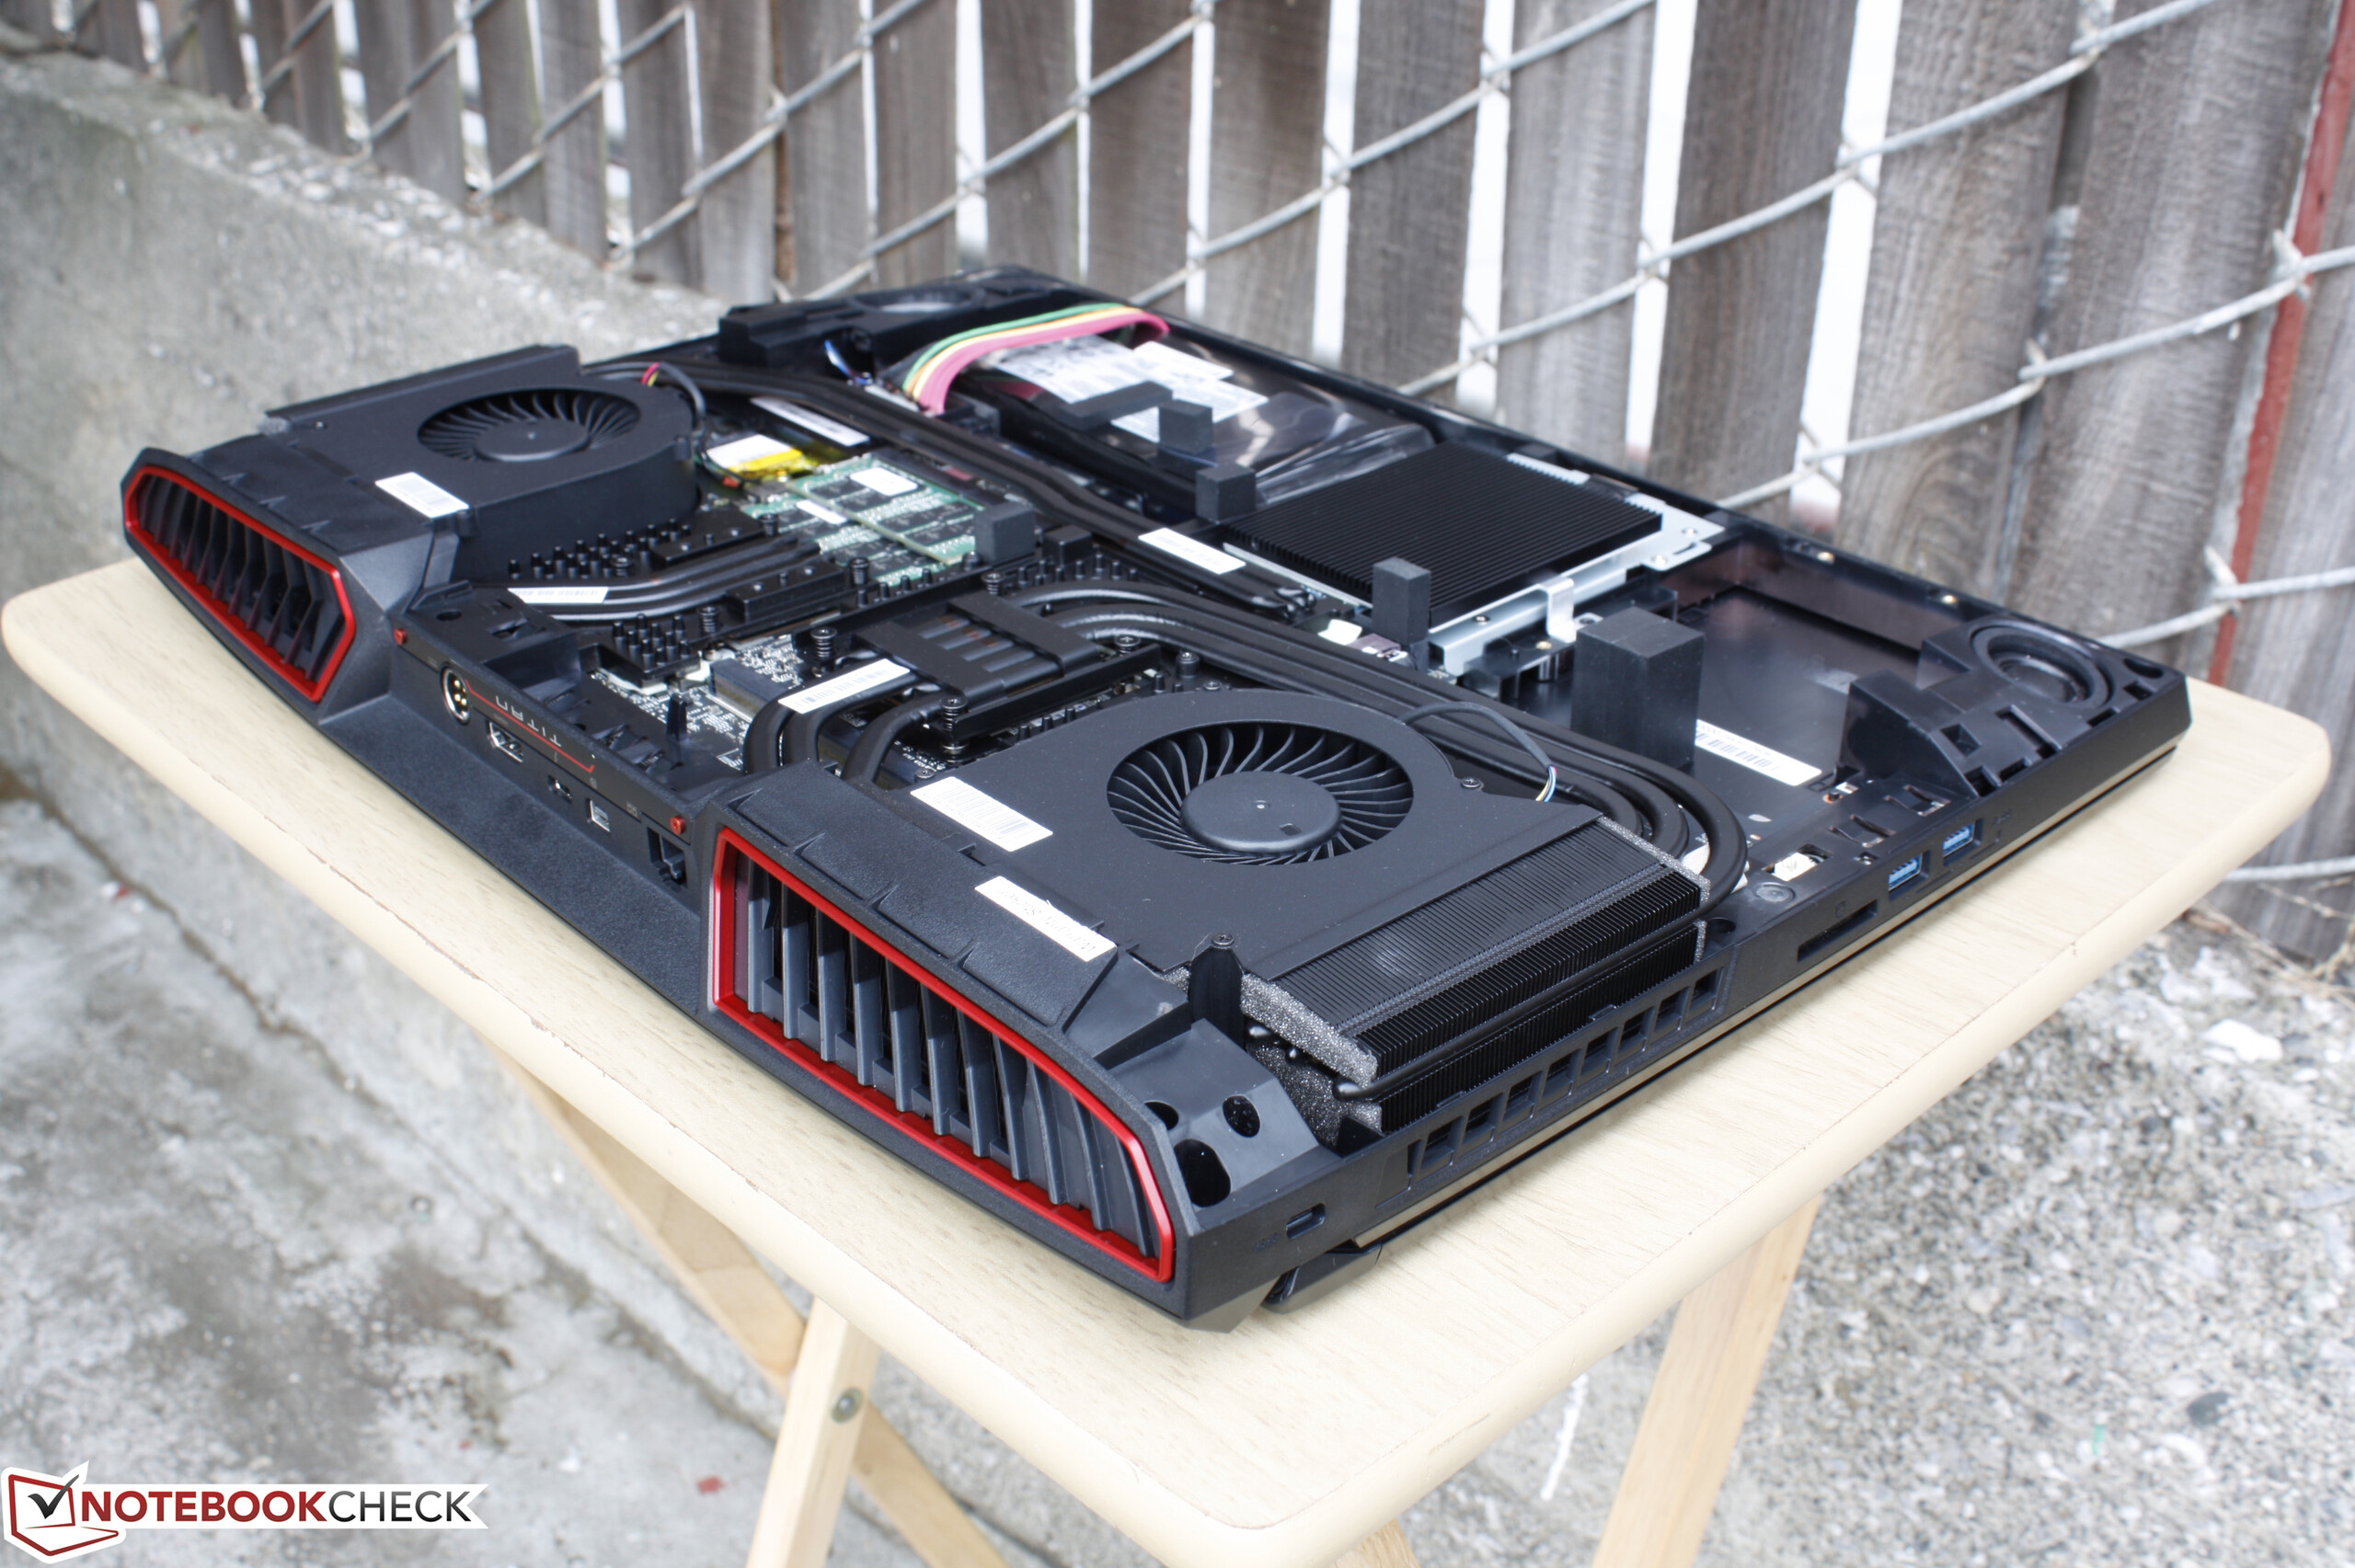
尽管如此GT73VR的机身依然是搭载GTX 1080的最好选择之一,它提供了丰富的功能和非常高效的散热系统。搭配同样显卡的更薄17寸笔记本电脑也已经上市,如Aorus X7 v6和镭蛇 Blade Pro,不过它们相比微星这台设备不太可能实现更低的温度和更低的噪音。
GT73VR是GT系列的一大进步,它在各个方面都优于前代的GT72。尽管更厚更重,但这带来了相应更好的游戏体验。
注:本文是基于完整评测的缩减版本,阅读完整的英文评测,请点击这里。
MSI GT73VR 6RF
- 11/04/2016 v5.1 (old)
Allen Ngo
Price comparison
