惠普 15z-ba000 笔记本电脑简短评测
| SD Card Reader | |
| average JPG Copy Test (av. of 3 runs) | |
| Toshiba Satellite C55-C-1NE | |
| Acer Aspire E5-574-53YZ | |
| HP 15z-ba000 | |
| HP 250 G4 T6P08ES | |
| Lenovo Ideapad 310-15ISK | |
| maximum AS SSD Seq Read Test (1GB) | |
| Toshiba Satellite C55-C-1NE | |
| HP 15z-ba000 | |
| Acer Aspire E5-574-53YZ | |
| Lenovo Ideapad 310-15ISK | |
| HP 250 G4 T6P08ES | |
| Networking | |
| iperf Server (receive) TCP 1 m | |
| Apple MacBook 12 (Early 2016) 1.1 GHz | |
| Lenovo Ideapad 310-15ISK | |
| HP 15z-ba000 | |
| iperf Client (transmit) TCP 1 m | |
| Apple MacBook 12 (Early 2016) 1.1 GHz | |
| Lenovo Ideapad 310-15ISK | |
| HP 15z-ba000 | |
| |||||||||||||||||||||||||
Brightness Distribution: 80 %
Center on Battery: 244.5 cd/m²
Contrast: 635:1 (Black: 0.385 cd/m²)
ΔE ColorChecker Calman: 8.62 | ∀{0.5-29.43 Ø4.73}
ΔE Greyscale Calman: 9.8 | ∀{0.09-98 Ø4.97}
57.71% sRGB (Argyll 1.6.3 3D)
39.86% AdobeRGB 1998 (Argyll 1.6.3 3D)
39.86% AdobeRGB 1998 (Argyll 3D)
57.7% sRGB (Argyll 3D)
38.58% Display P3 (Argyll 3D)
Gamma: 2.09
CCT: 11391 K
| HP 15z-ba000 BOE06A4, TN, 15.6", 1366x768 | Acer Aspire E5-574-53YZ AU Optronics AUO38ED / AUO B156HTN03.8, TN, 15.6", 1920x1080 | HP 250 G4 T6P08ES ChiMei, TN LED, 15.6", 1366x768 | Lenovo Ideapad 310-15ISK LG Philips LP156WHU-TPG1, TN LED, 15.6", 1366x768 | Toshiba Satellite C55-C-1NE 156AT37-T01 (SDC4141), TN, 15.6", 1366x768 | |
|---|---|---|---|---|---|
| Display | -4% | 13% | -4% | -5% | |
| Display P3 Coverage (%) | 38.58 | 37.21 -4% | 43.63 13% | 37.06 -4% | 36.7 -5% |
| sRGB Coverage (%) | 57.7 | 56 -3% | 65.1 13% | 55.8 -3% | 55.3 -4% |
| AdobeRGB 1998 Coverage (%) | 39.86 | 38.44 -4% | 45.1 13% | 38.29 -4% | 37.92 -5% |
| Response Times | 11% | 14% | 35% | 44% | |
| Response Time Grey 50% / Grey 80% * (ms) | 41.2 ? | 42.4 ? -3% | 42 ? -2% | 27 ? 34% | 22 ? 47% |
| Response Time Black / White * (ms) | 33.6 ? | 25.6 ? 24% | 24 ? 29% | 22 ? 35% | 20 ? 40% |
| PWM Frequency (Hz) | 595 ? | 806 ? | 50 ? | 200 ? | |
| Screen | -14% | -6% | -3% | -21% | |
| Brightness middle (cd/m²) | 244.5 | 213.4 -13% | 220 -10% | 200 -18% | 251 3% |
| Brightness (cd/m²) | 232 | 209 -10% | 203 -12% | 198 -15% | 236 2% |
| Brightness Distribution (%) | 80 | 86 8% | 83 4% | 83 4% | 85 6% |
| Black Level * (cd/m²) | 0.385 | 0.351 9% | 0.49 -27% | 0.28 27% | 0.44 -14% |
| Contrast (:1) | 635 | 608 -4% | 449 -29% | 714 12% | 570 -10% |
| Colorchecker dE 2000 * | 8.62 | 13.35 -55% | 8.95 -4% | 10.63 -23% | 14.58 -69% |
| Colorchecker dE 2000 max. * | 17.38 | 21.79 -25% | 15.89 9% | 15.69 10% | 24.59 -41% |
| Greyscale dE 2000 * | 9.8 | 13.59 -39% | 10.59 -8% | 11.19 -14% | 16.8 -71% |
| Gamma | 2.09 105% | 2.7 81% | 2.51 88% | 1.78 124% | 2.33 94% |
| CCT | 11391 57% | 18870 34% | 12049 54% | 11258 58% | 27039 24% |
| Color Space (Percent of AdobeRGB 1998) (%) | 39.86 | 38.44 -4% | 41 3% | 35 -12% | 35 -12% |
| Color Space (Percent of sRGB) (%) | 57.71 | 56.01 -3% | 65 13% | 56 -3% | 56 -3% |
| Total Average (Program / Settings) | -2% /
-8% | 7% /
0% | 9% /
2% | 6% /
-9% |
* ... smaller is better
Display Response Times
| ↔ Response Time Black to White | ||
|---|---|---|
| 33.6 ms ... rise ↗ and fall ↘ combined | ↗ 14.8 ms rise | 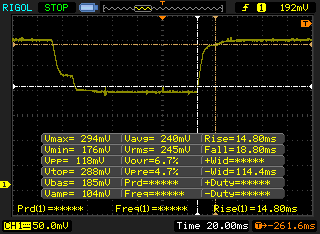 |
| ↘ 18.8 ms fall | ||
| The screen shows slow response rates in our tests and will be unsatisfactory for gamers. In comparison, all tested devices range from 0.1 (minimum) to 240 (maximum) ms. » 90 % of all devices are better. This means that the measured response time is worse than the average of all tested devices (19.9 ms). | ||
| ↔ Response Time 50% Grey to 80% Grey | ||
| 41.2 ms ... rise ↗ and fall ↘ combined | ↗ 18.4 ms rise | 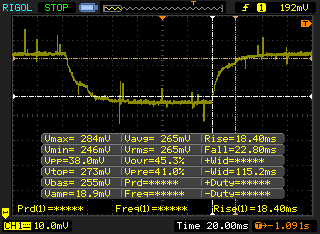 |
| ↘ 22.8 ms fall | ||
| The screen shows slow response rates in our tests and will be unsatisfactory for gamers. In comparison, all tested devices range from 0.165 (minimum) to 636 (maximum) ms. » 66 % of all devices are better. This means that the measured response time is worse than the average of all tested devices (31.1 ms). | ||
Screen Flickering / PWM (Pulse-Width Modulation)
| Screen flickering / PWM detected | 595 Hz | ≤ 99 % brightness setting | 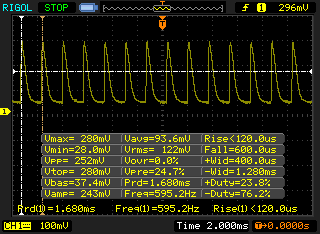 |
The display backlight flickers at 595 Hz (worst case, e.g., utilizing PWM) Flickering detected at a brightness setting of 99 % and below. There should be no flickering or PWM above this brightness setting. The frequency of 595 Hz is quite high, so most users sensitive to PWM should not notice any flickering. In comparison: 52 % of all tested devices do not use PWM to dim the display. If PWM was detected, an average of 7798 (minimum: 5 - maximum: 343500) Hz was measured. | |||
| Cinebench R10 | |
| Rendering Multiple CPUs 32Bit | |
| Acer Aspire E5-574-53YZ | |
| Lenovo Ideapad 310-15ISK | |
| HP 250 G4 T6P08ES | |
| Toshiba Satellite C55-C-1NE | |
| HP 15z-ba000 | |
| Rendering Single 32Bit | |
| Lenovo Ideapad 310-15ISK | |
| Acer Aspire E5-574-53YZ | |
| HP 250 G4 T6P08ES | |
| Toshiba Satellite C55-C-1NE | |
| HP 15z-ba000 | |
| Cinebench R11.5 | |
| CPU Single 64Bit | |
| Acer Aspire E5-574-53YZ | |
| HP 250 G4 T6P08ES | |
| Toshiba Satellite C55-C-1NE | |
| HP 15z-ba000 | |
| CPU Multi 64Bit | |
| Acer Aspire E5-574-53YZ | |
| HP 250 G4 T6P08ES | |
| Toshiba Satellite C55-C-1NE | |
| HP 15z-ba000 | |
| Cinebench R15 | |
| CPU Single 64Bit | |
| Lenovo Ideapad 310-15ISK | |
| Acer Aspire E5-574-53YZ | |
| HP 250 G4 T6P08ES | |
| Toshiba Satellite C55-C-1NE | |
| HP 15z-ba000 | |
| CPU Multi 64Bit | |
| Acer Aspire E5-574-53YZ | |
| Lenovo Ideapad 310-15ISK | |
| HP 250 G4 T6P08ES | |
| Toshiba Satellite C55-C-1NE | |
| HP 15z-ba000 | |
| Super Pi Mod 1.5 XS 32M - 32M | |
| HP 15z-ba000 | |
| Acer Aspire E5-574-53YZ | |
* ... smaller is better
| PCMark 8 | |
| Home Score Accelerated v2 | |
| Acer Aspire E5-574-53YZ | |
| Lenovo Ideapad 310-15ISK | |
| HP 250 G4 T6P08ES | |
| Toshiba Satellite C55-C-1NE | |
| Lenovo G70-80 80FF00H0GE | |
| HP 15z-ba000 | |
| Work Score Accelerated v2 | |
| Acer Aspire E5-574-53YZ | |
| Lenovo Ideapad 310-15ISK | |
| HP 250 G4 T6P08ES | |
| Toshiba Satellite C55-C-1NE | |
| Lenovo G70-80 80FF00H0GE | |
| HP 15z-ba000 | |
| Creative Score Accelerated v2 | |
| Acer Aspire E5-574-53YZ | |
| Lenovo Ideapad 310-15ISK | |
| HP 250 G4 T6P08ES | |
| Toshiba Satellite C55-C-1NE | |
| Lenovo G70-80 80FF00H0GE | |
| HP 15z-ba000 | |
| PCMark 7 Score | 3288 points | |
| PCMark 8 Home Score Accelerated v2 | 1960 points | |
| PCMark 8 Creative Score Accelerated v2 | 2104 points | |
| PCMark 8 Work Score Accelerated v2 | 2952 points | |
Help | ||
| HP 15z-ba000 Adata IM2S3138E-128GM-B | Acer Aspire E5-574-53YZ Toshiba MQ02ABD100H | HP 250 G4 T6P08ES HGST Travelstar 5K1000 HTS541010A9E680 | Lenovo Ideapad 310-15ISK WDC Scorpio Blue WD10JPCX-24UE4T0 | Toshiba Satellite C55-C-1NE Toshiba MQ01ABD100 | |
|---|---|---|---|---|---|
| CrystalDiskMark 3.0 | -89% | -85% | -82% | -87% | |
| Read Seq (MB/s) | 397.9 | 100.8 -75% | 101 -75% | 115.9 -71% | 105.6 -73% |
| Write Seq (MB/s) | 171.4 | 57.4 -67% | 99.6 -42% | 113.3 -34% | 93.4 -46% |
| Read 512 (MB/s) | 367.5 | 31.19 -92% | 38.12 -90% | 39.02 -89% | 31.7 -91% |
| Write 512 (MB/s) | 172.3 | 38.67 -78% | 42.22 -75% | 55.6 -68% | 27.54 -84% |
| Read 4k (MB/s) | 26.11 | 0.509 -98% | 0.522 -98% | 0.44 -98% | 0.374 -99% |
| Write 4k (MB/s) | 52.3 | 0.615 -99% | 1.29 -98% | 1.188 -98% | 0.72 -99% |
| Read 4k QD32 (MB/s) | 164.3 | 0.351 -100% | 1.116 -99% | 1.125 -99% | 0.694 -100% |
| Write 4k QD32 (MB/s) | 132.8 | 0.605 -100% | 1.287 -99% | 1.245 -99% | 0.646 -100% |

| 3DMark 11 | |
| 1280x720 Performance GPU | |
| Acer Aspire E5-574-53YZ | |
| Lenovo Ideapad 310-15ISK | |
| HP 250 G4 T6P08ES | |
| Toshiba Satellite C55-C-1NE | |
| HP 15z-ba000 | |
| Toshiba Portege Z30t-A-10X | |
| Lenovo G70-80 80FF00H0GE | |
| 1280x720 Performance Combined | |
| Acer Aspire E5-574-53YZ | |
| Lenovo Ideapad 310-15ISK | |
| HP 250 G4 T6P08ES | |
| Toshiba Satellite C55-C-1NE | |
| HP 15z-ba000 | |
| Lenovo G70-80 80FF00H0GE | |
| Toshiba Portege Z30t-A-10X | |
| 3DMark | |
| 1280x720 Cloud Gate Standard Graphics | |
| Acer Aspire E5-574-53YZ | |
| Toshiba Satellite C55-C-1NE | |
| HP 250 G4 T6P08ES | |
| Toshiba Portege Z30t-A-10X | |
| Lenovo G70-80 80FF00H0GE | |
| HP 15z-ba000 | |
| 1920x1080 Fire Strike Graphics | |
| Toshiba Satellite C55-C-1NE | |
| Acer Aspire E5-574-53YZ | |
| HP 250 G4 T6P08ES | |
| Toshiba Portege Z30t-A-10X | |
| HP 15z-ba000 | |
| Lenovo G70-80 80FF00H0GE | |
| 3DMark 11 Performance | 837 points | |
| 3DMark Cloud Gate Standard Score | 2459 points | |
| 3DMark Fire Strike Score | 493 points | |
Help | ||
| BioShock Infinite | |
| 1920x1080 Ultra Preset, DX11 (DDOF) (sort by value) | |
| HP 15z-ba000 | |
| Acer Aspire E5-574-53YZ | |
| Toshiba Portege Z30t-A-10X | |
| 1366x768 High Preset (sort by value) | |
| HP 15z-ba000 | |
| Acer Aspire E5-574-53YZ | |
| HP 250 G4 T6P08ES | |
| Lenovo Ideapad 310-15ISK | |
| Toshiba Satellite C55-C-1NE | |
| Toshiba Portege Z30t-A-10X | |
| 1366x768 Medium Preset (sort by value) | |
| HP 15z-ba000 | |
| Acer Aspire E5-574-53YZ | |
| HP 250 G4 T6P08ES | |
| Lenovo Ideapad 310-15ISK | |
| Toshiba Satellite C55-C-1NE | |
| Toshiba Portege Z30t-A-10X | |
| 1280x720 Very Low Preset (sort by value) | |
| HP 15z-ba000 | |
| Acer Aspire E5-574-53YZ | |
| HP 250 G4 T6P08ES | |
| Lenovo Ideapad 310-15ISK | |
| Toshiba Satellite C55-C-1NE | |
| Toshiba Portege Z30t-A-10X | |
| Tomb Raider | |
| 1920x1080 Ultra Preset AA:FX AF:16x (sort by value) | |
| HP 15z-ba000 | |
| Toshiba Portege Z30t-A-10X | |
| 1366x768 High Preset AA:FX AF:8x (sort by value) | |
| HP 15z-ba000 | |
| HP 250 G4 T6P08ES | |
| Toshiba Portege Z30t-A-10X | |
| 1366x768 Normal Preset AA:FX AF:4x (sort by value) | |
| HP 15z-ba000 | |
| HP 250 G4 T6P08ES | |
| Toshiba Portege Z30t-A-10X | |
| 1024x768 Low Preset (sort by value) | |
| HP 15z-ba000 | |
| HP 250 G4 T6P08ES | |
| Toshiba Portege Z30t-A-10X | |
| Rise of the Tomb Raider | |
| 1366x768 Medium Preset AF:2x (sort by value) | |
| HP 15z-ba000 | |
| HP 250 G4 T6P08ES | |
| 1024x768 Lowest Preset (sort by value) | |
| HP 15z-ba000 | |
| HP 250 G4 T6P08ES | |
| Metro: Last Light | |
| 1920x1080 Very High (DX11) AF:16x (sort by value) | |
| HP 15z-ba000 | |
| 1366x768 High (DX11) AF:16x (sort by value) | |
| HP 15z-ba000 | |
| Lenovo Ideapad 310-15ISK | |
| 1366x768 Medium (DX10) AF:4x (sort by value) | |
| HP 15z-ba000 | |
| Lenovo Ideapad 310-15ISK | |
| 1024x768 Low (DX10) AF:4x (sort by value) | |
| HP 15z-ba000 | |
| Lenovo Ideapad 310-15ISK | |
| Anno 2070 | |
| 1920x1080 Very High Preset AA:on AF:4x (sort by value) | |
| HP 15z-ba000 | |
| Toshiba Portege Z30t-A-10X | |
| 1366x768 High Preset AA:on AF:2x (sort by value) | |
| HP 15z-ba000 | |
| Toshiba Portege Z30t-A-10X | |
| 1366x768 Medium Preset AA:on (sort by value) | |
| HP 15z-ba000 | |
| Toshiba Portege Z30t-A-10X | |
| 1024x768 Low Preset (sort by value) | |
| HP 15z-ba000 | |
| Toshiba Portege Z30t-A-10X | |
| low | med. | high | ultra | |
|---|---|---|---|---|
| Anno 2070 (2011) | 47.2 | 20.9 | 13.2 | 5.1 |
| Tomb Raider (2013) | 35.7 | 18.7 | 13.9 | 6.2 |
| BioShock Infinite (2013) | 32.9 | 17.7 | 15 | 5.1 |
| Metro: Last Light (2013) | 26.3 | 11.3 | 8.2 | 4 |
| Rise of the Tomb Raider (2016) | 11.9 | 6.7 |
Noise level
| Idle |
| 31.6 / 31.6 / 31.6 dB(A) |
| Load |
| 37.2 / 38.2 dB(A) |
 | ||
30 dB silent 40 dB(A) audible 50 dB(A) loud |
||
min: | ||
| HP 15z-ba000 Radeon R4 (Beema), A6-7310, Adata IM2S3138E-128GM-B | Acer Aspire E5-574-53YZ Iris Graphics 550, 6267U, Toshiba MQ02ABD100H | HP 250 G4 T6P08ES Radeon R5 M330, 5200U, HGST Travelstar 5K1000 HTS541010A9E680 | Lenovo Ideapad 310-15ISK GeForce 920MX, 6500U, WDC Scorpio Blue WD10JPCX-24UE4T0 | Toshiba Satellite C55-C-1NE GeForce 920M, 5005U, Toshiba MQ01ABD100 | |
|---|---|---|---|---|---|
| Noise | -1% | -11% | -6% | -3% | |
| off / environment * (dB) | 28.6 | 28.8 -1% | 31.2 -9% | 31.2 -9% | 31.3 -9% |
| Idle Minimum * (dB) | 31.6 | 31 2% | 33.2 -5% | 32.6 -3% | 32.1 -2% |
| Idle Average * (dB) | 31.6 | 31 2% | 33.2 -5% | 32.6 -3% | 32.1 -2% |
| Idle Maximum * (dB) | 31.6 | 31 2% | 34.6 -9% | 33.8 -7% | 33.1 -5% |
| Load Average * (dB) | 37.2 | 39.1 -5% | 45 -21% | 40.2 -8% | 37.8 -2% |
| Load Maximum * (dB) | 38.2 | 41 -7% | 45.2 -18% | 40.4 -6% | 37.7 1% |
* ... smaller is better
(+) The maximum temperature on the upper side is 28.6 °C / 83 F, compared to the average of 36.8 °C / 98 F, ranging from 21 to 71 °C for the class Multimedia.
(±) The bottom heats up to a maximum of 43.2 °C / 110 F, compared to the average of 39.1 °C / 102 F
(+) In idle usage, the average temperature for the upper side is 23.1 °C / 74 F, compared to the device average of 31.3 °C / 88 F.
(+) The palmrests and touchpad are cooler than skin temperature with a maximum of 28.6 °C / 83.5 F and are therefore cool to the touch.
(±) The average temperature of the palmrest area of similar devices was 28.7 °C / 83.7 F (+0.1 °C / 0.2 F).
HP 15z-ba000 audio analysis
(±) | speaker loudness is average but good (72.8 dB)
Bass 100 - 315 Hz
(-) | nearly no bass - on average 23.2% lower than median
(±) | linearity of bass is average (12% delta to prev. frequency)
Mids 400 - 2000 Hz
(+) | balanced mids - only 4.5% away from median
(±) | linearity of mids is average (7.6% delta to prev. frequency)
Highs 2 - 16 kHz
(±) | higher highs - on average 7.1% higher than median
(±) | linearity of highs is average (9.7% delta to prev. frequency)
Overall 100 - 16.000 Hz
(-) | overall sound is not linear (30.3% difference to median)
Compared to same class
» 96% of all tested devices in this class were better, 2% similar, 3% worse
» The best had a delta of 5%, average was 17%, worst was 45%
Compared to all devices tested
» 89% of all tested devices were better, 3% similar, 9% worse
» The best had a delta of 4%, average was 24%, worst was 134%
Apple MacBook 12 (Early 2016) 1.1 GHz audio analysis
(+) | speakers can play relatively loud (83.6 dB)
Bass 100 - 315 Hz
(±) | reduced bass - on average 11.3% lower than median
(±) | linearity of bass is average (14.2% delta to prev. frequency)
Mids 400 - 2000 Hz
(+) | balanced mids - only 2.4% away from median
(+) | mids are linear (5.5% delta to prev. frequency)
Highs 2 - 16 kHz
(+) | balanced highs - only 2% away from median
(+) | highs are linear (4.5% delta to prev. frequency)
Overall 100 - 16.000 Hz
(+) | overall sound is linear (10.2% difference to median)
Compared to same class
» 7% of all tested devices in this class were better, 2% similar, 91% worse
» The best had a delta of 5%, average was 18%, worst was 53%
Compared to all devices tested
» 5% of all tested devices were better, 1% similar, 94% worse
» The best had a delta of 4%, average was 24%, worst was 134%
| Off / Standby | |
| Idle | |
| Load |
|
Key:
min: | |
| HP 15z-ba000 A6-7310, Radeon R4 (Beema), Adata IM2S3138E-128GM-B, TN, 1366x768, 15.6" | Acer Aspire E5-574-53YZ 6267U, Iris Graphics 550, Toshiba MQ02ABD100H, TN, 1920x1080, 15.6" | HP 250 G4 T6P08ES 5200U, Radeon R5 M330, HGST Travelstar 5K1000 HTS541010A9E680, TN LED, 1366x768, 15.6" | Lenovo Ideapad 310-15ISK 6500U, GeForce 920MX, WDC Scorpio Blue WD10JPCX-24UE4T0, TN LED, 1366x768, 15.6" | Toshiba Satellite C55-C-1NE 5005U, GeForce 920M, Toshiba MQ01ABD100, TN, 1366x768, 15.6" | |
|---|---|---|---|---|---|
| Power Consumption | -120% | -26% | -55% | -23% | |
| Idle Minimum * (Watt) | 5.22 | 11.84 -127% | 4 23% | 7 -34% | 4.2 20% |
| Idle Average * (Watt) | 5.67 | 14.16 -150% | 6.5 -15% | 8 -41% | 6.6 -16% |
| Idle Maximum * (Watt) | 7.82 | 14.46 -85% | 7 10% | 8.4 -7% | 7.5 4% |
| Load Average * (Watt) | 19.67 | 51.69 -163% | 36 -83% | 38.8 -97% | 36.3 -85% |
| Load Maximum * (Watt) | 26.72 | 46.56 -74% | 43.6 -63% | 52.8 -98% | 36.5 -37% |
* ... smaller is better
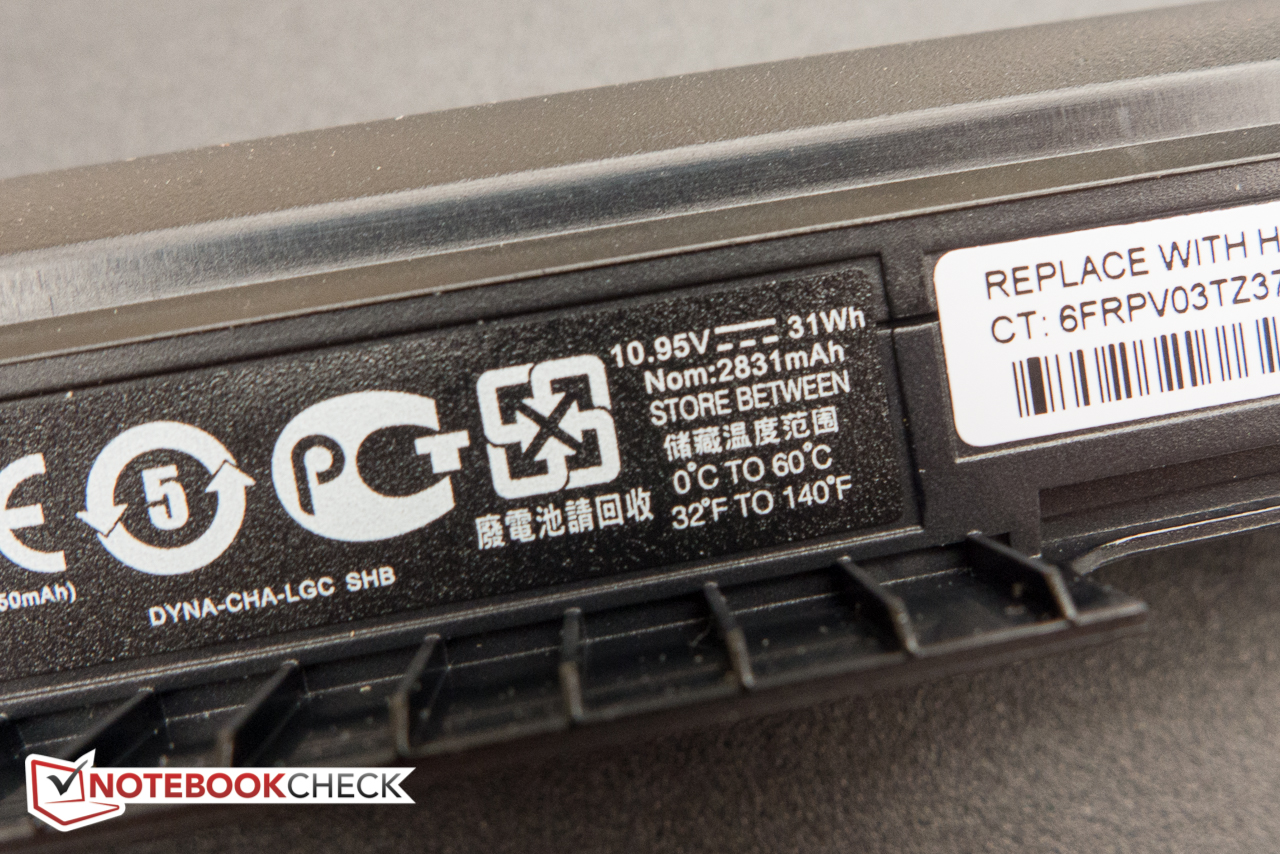
| HP 15z-ba000 A6-7310, Radeon R4 (Beema), 31 Wh | Acer Aspire E5-574-53YZ 6267U, Iris Graphics 550, 37 Wh | HP 250 G4 T6P08ES 5200U, Radeon R5 M330, 41 Wh | Lenovo Ideapad 310-15ISK 6500U, GeForce 920MX, 31 Wh | Toshiba Satellite C55-C-1NE 5005U, GeForce 920M, 44 Wh | |
|---|---|---|---|---|---|
| Battery runtime | -40% | 23% | 34% | 49% | |
| Reader / Idle (h) | 8.5 | 4.6 -46% | 11.1 31% | ||
| WiFi v1.3 (h) | 4.1 | 3 -27% | 5.7 39% | 5.5 34% | 6.1 49% |
| Load (h) | 1.9 | 1 -47% | 1.9 0% |
Pros
Cons

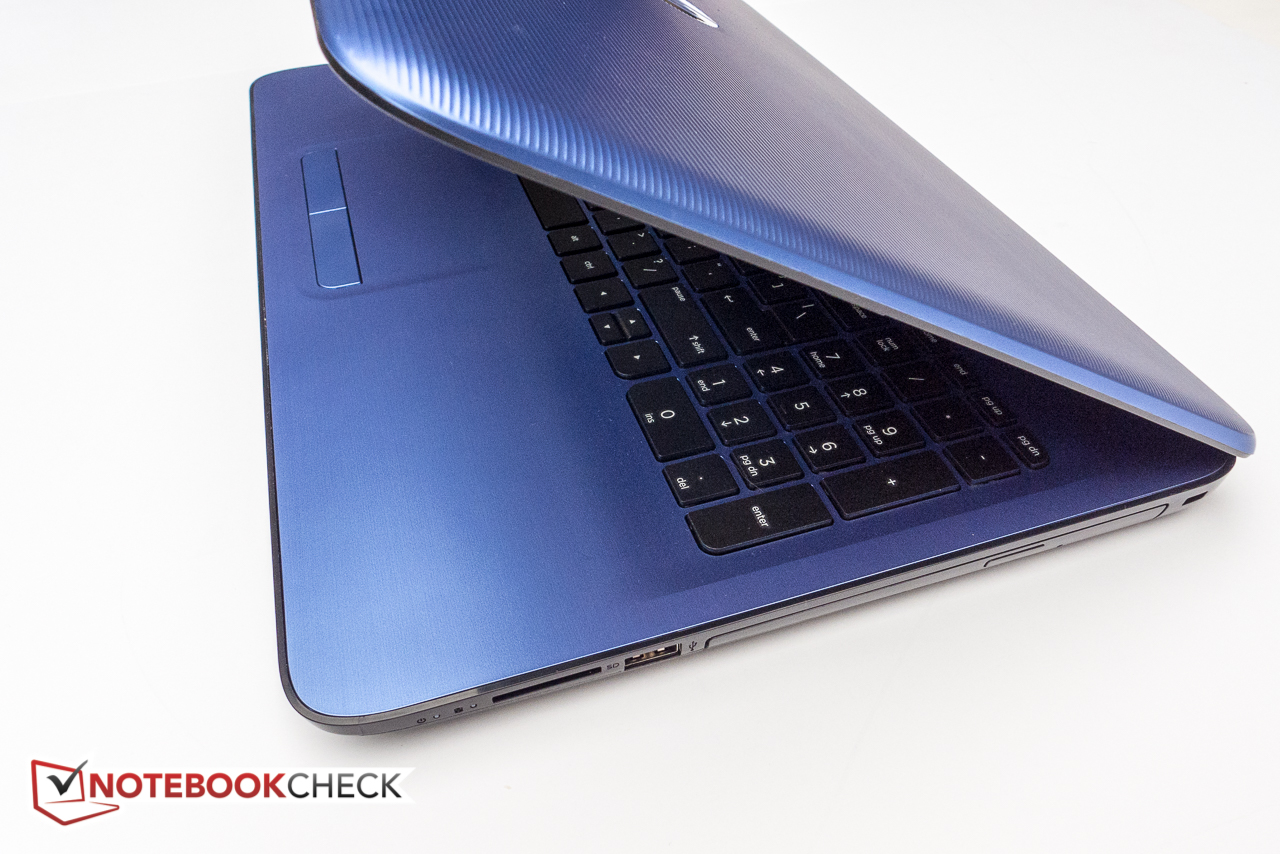
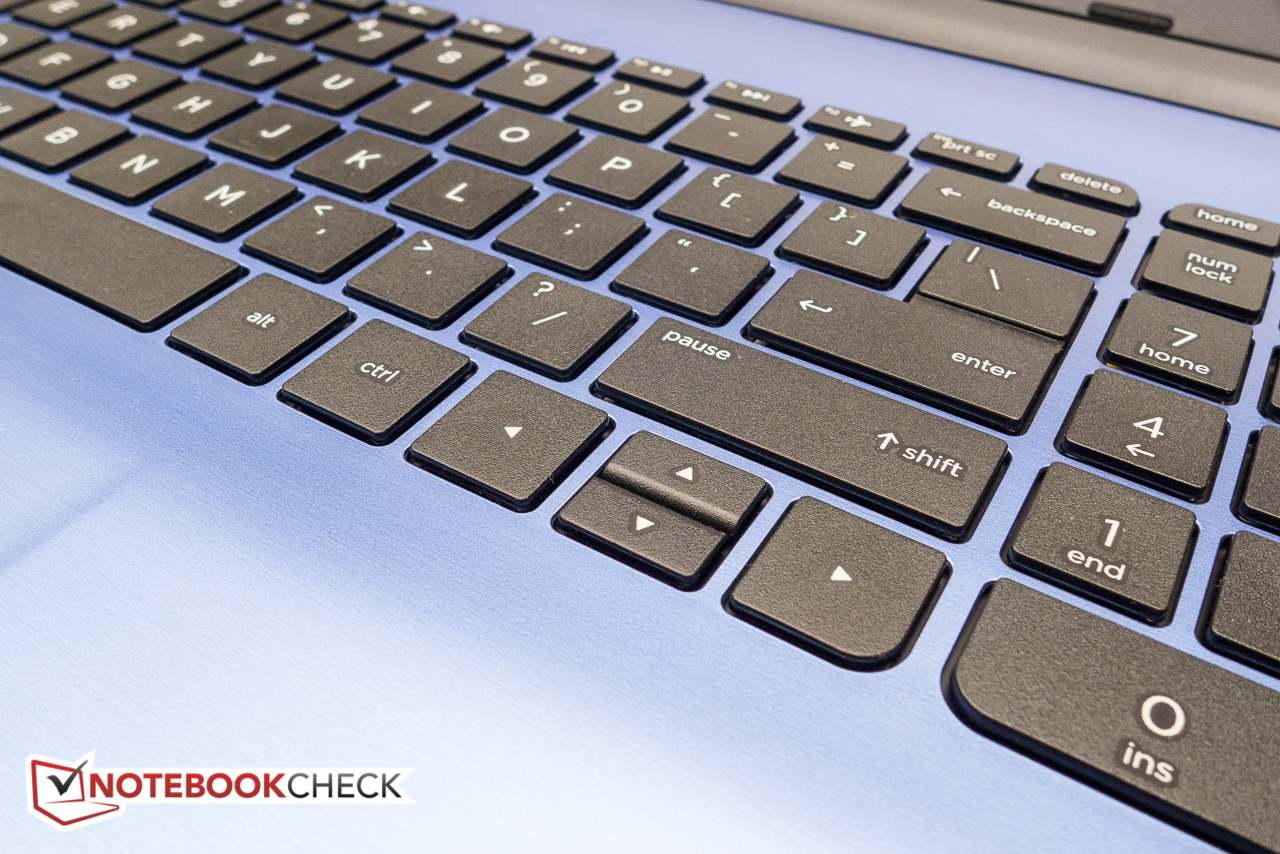
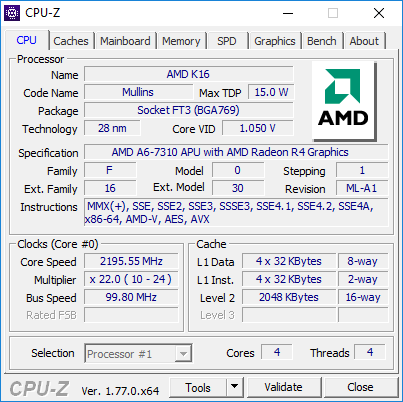
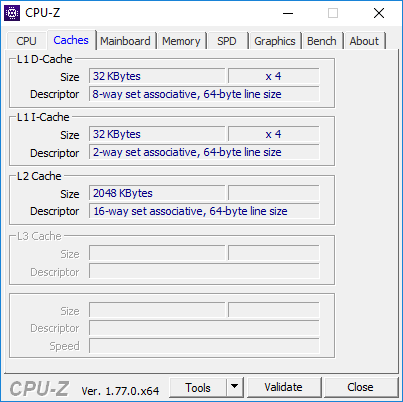
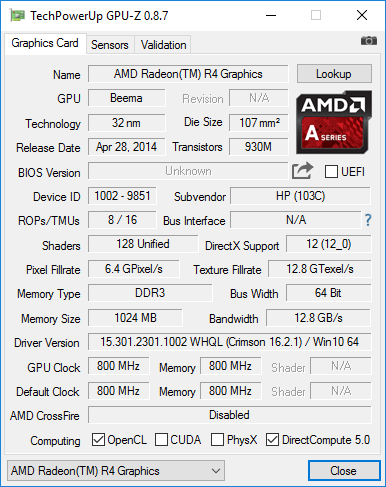
惠普15z外观诱人,运行冷静,一次充电可以坚持很长时间,同时由于搭配了固态硬盘,尽管性能测试成绩不算出色但实际使用十分流畅。它搭配的AMD APU速度不算快,不过搭配的8GB内存和固态硬盘也帮助改善了性能表现。它的TN屏幕很明亮,整体水平十分优秀。它的键盘也不会让人失望,但是触控版则需要一些时间适应。几乎所有的英特尔集成显卡都强于它的Radeon R4显卡,一些入门级独立显卡如东芝 Satellite C55-C-1NE中的GeForce 920M也可以提供几乎两倍于这块集成Radeon显卡的游戏运行帧数。
对于基本用途如文字处理或欣赏视频,惠普15z不是个坏选择。但需要更强性能或玩一玩游戏的用户则需要参考别的产品了。
我们刚刚测试过的Aspire E5-575G一些型号,搭配了酷睿i5-6200U处理器,8GB内存,1TB硬盘和GeForce 940MX独立显卡,售价约500美元(约3359人民币)。除非惠普或销售商大幅度降低15z的售价,否则它的性价比十分有限。
注:本文是基于完整评测的缩减版本,阅读完整的英文评测,请点击这里。
HP 15z-ba000
- 10/02/2016 v5.1 (old)
Bernhard Pechlaner
Price comparison
