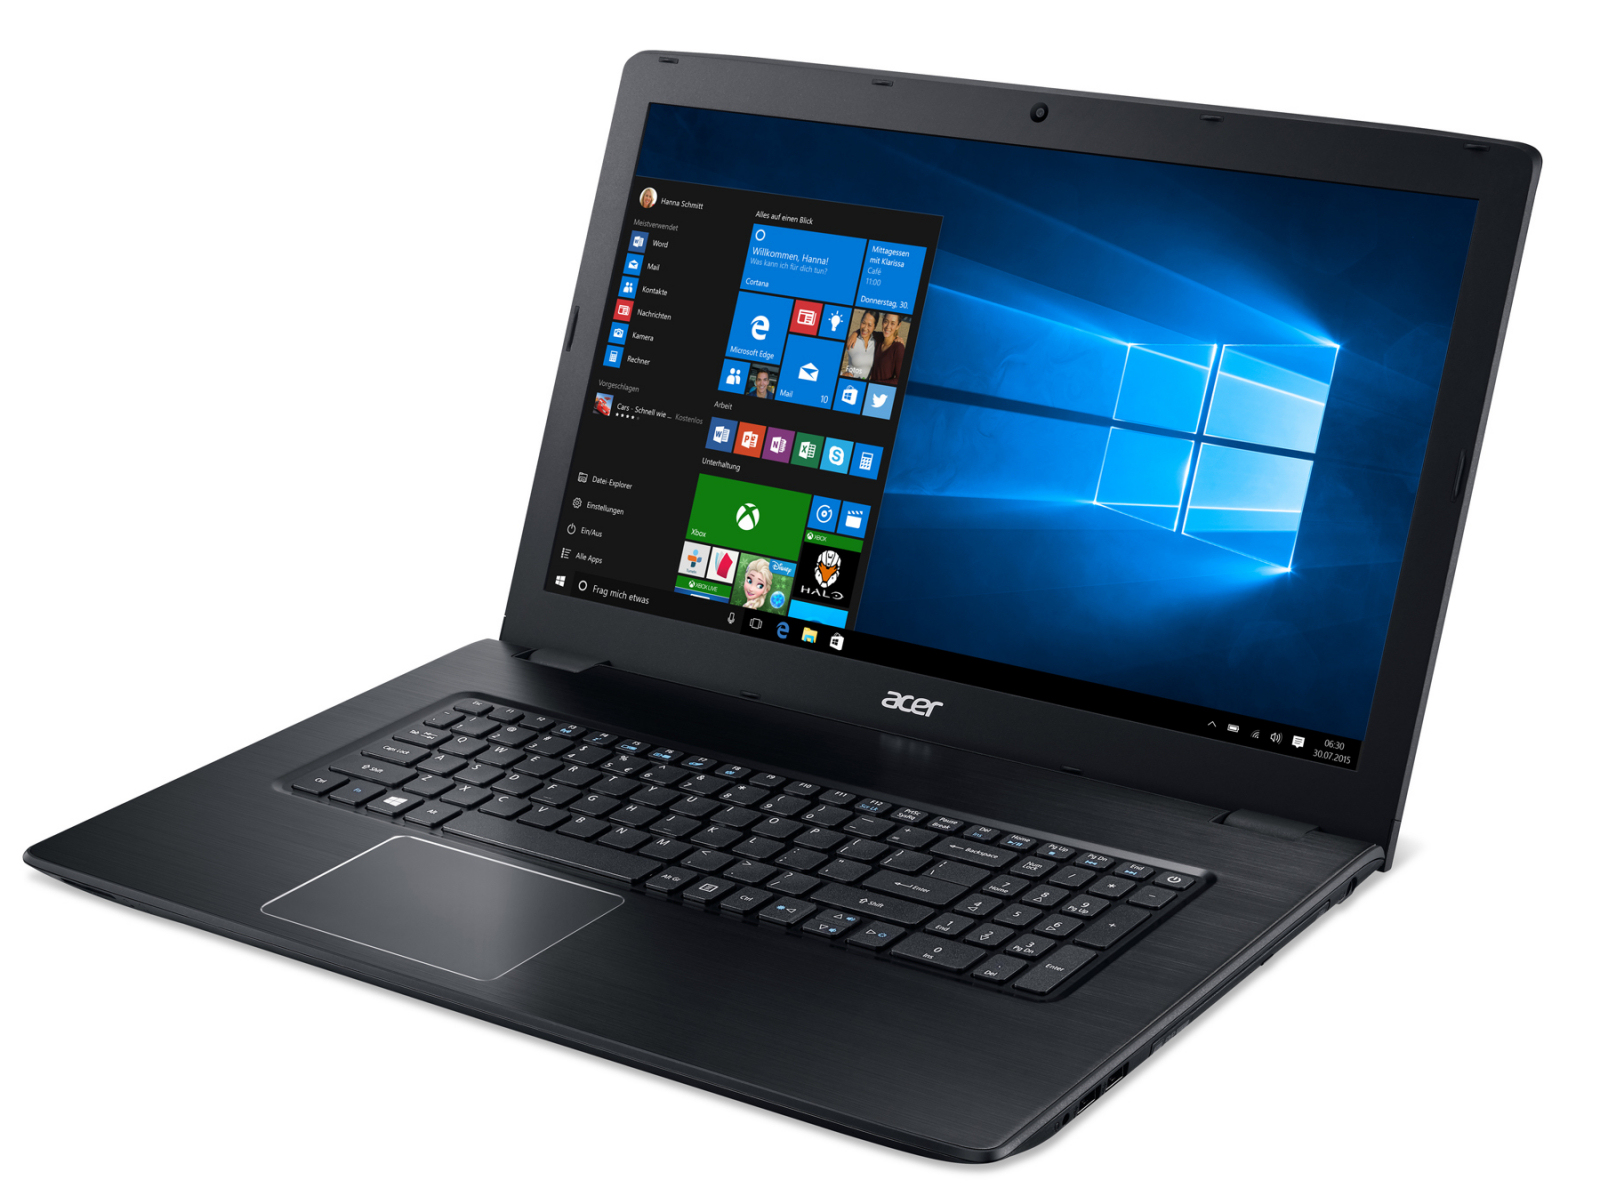
宏碁 Aspire E5-774-54HJ 笔记本电脑简短评测
| SD Card Reader | |
| average JPG Copy Test (av. of 3 runs) | |
| Acer Aspire E5-774-54HJ | |
| Acer Aspire E5-722-662J | |
| Acer Aspire E5-774G-78NA | |
| Dell Inspiron 17 5759-5118 | |
| Lenovo IdeaPad 300-17ISK 80QH001EGE | |
| maximum AS SSD Seq Read Test (1GB) | |
| Acer Aspire E5-774-54HJ | |
| Acer Aspire E5-722-662J | |
| Acer Aspire E5-774G-78NA | |
| Lenovo IdeaPad 300-17ISK 80QH001EGE | |
| Dell Inspiron 17 5759-5118 | |
| Networking | |
| iperf Server (receive) TCP 1 m | |
| Acer Aspire E5-774-54HJ (jseb) | |
| Acer Aspire E5-774G-78NA (seb) | |
| iperf Client (transmit) TCP 1 m | |
| Acer Aspire E5-774G-78NA (seb) | |
| Acer Aspire E5-774-54HJ (jseb) | |
| |||||||||||||||||||||||||
Brightness Distribution: 82 %
Center on Battery: 353 cd/m²
Contrast: 929:1 (Black: 0.38 cd/m²)
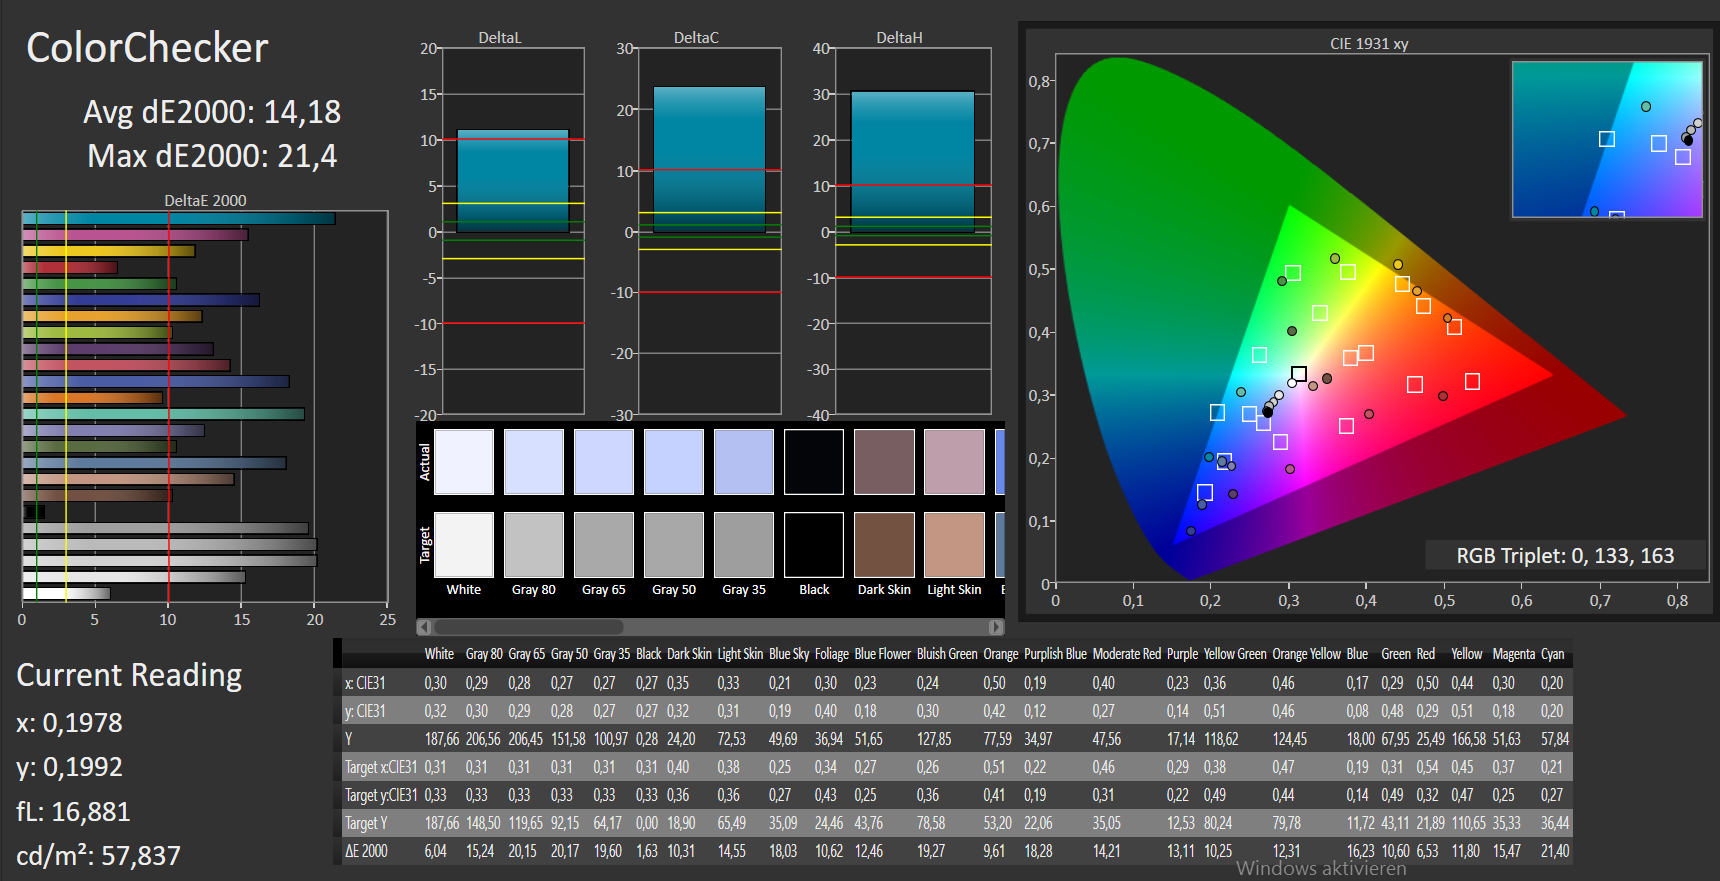
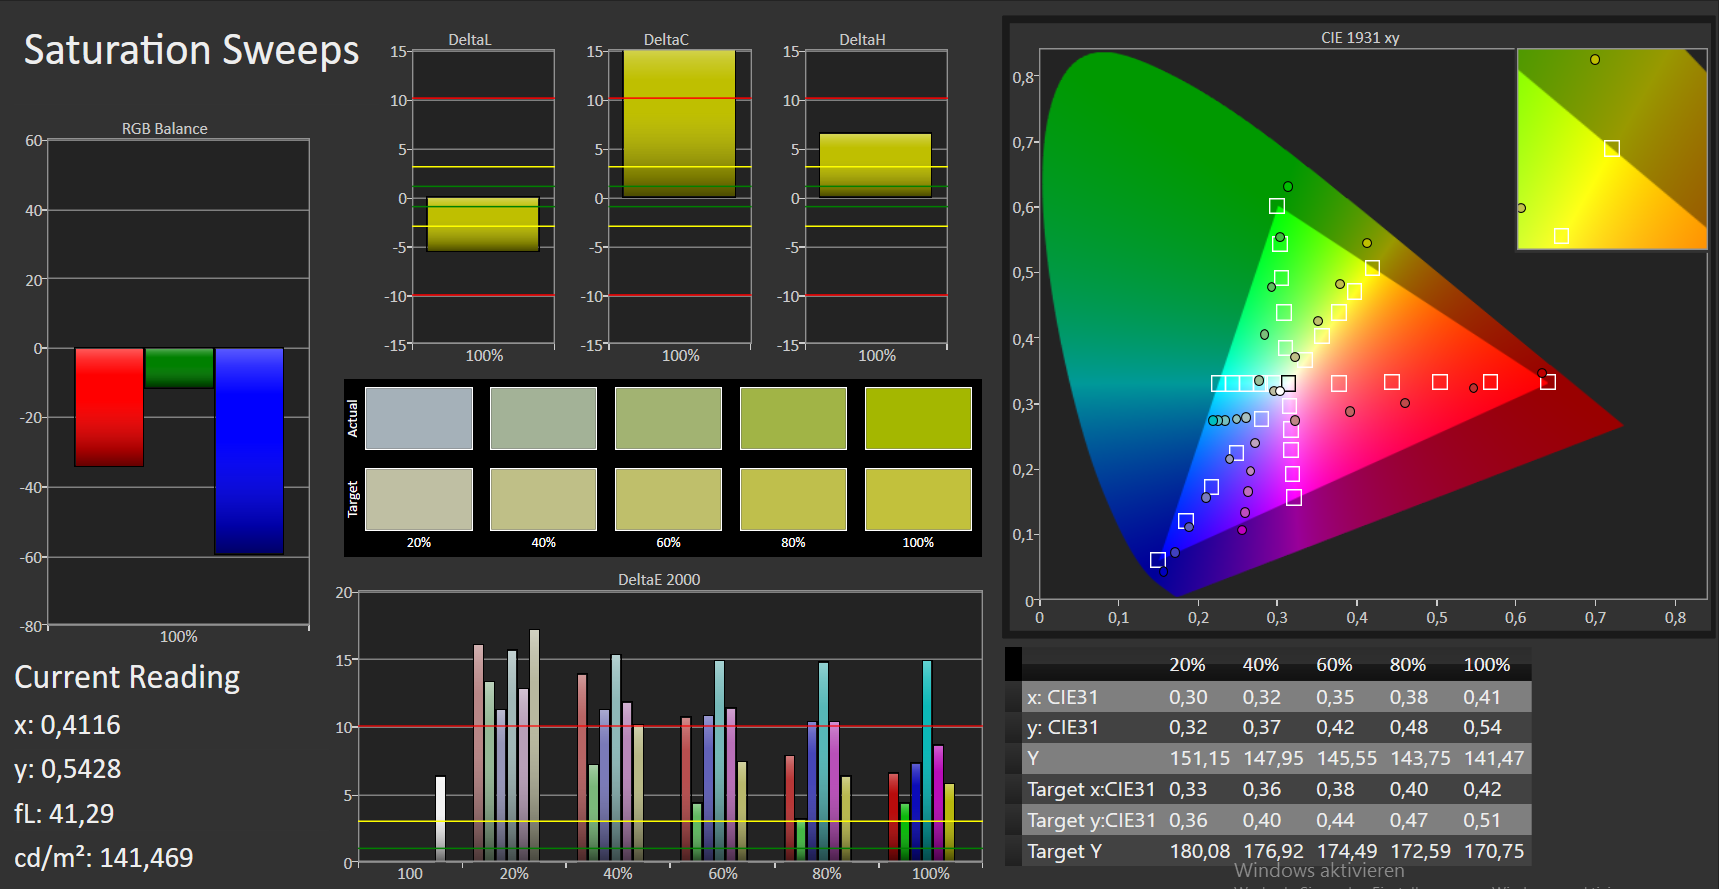
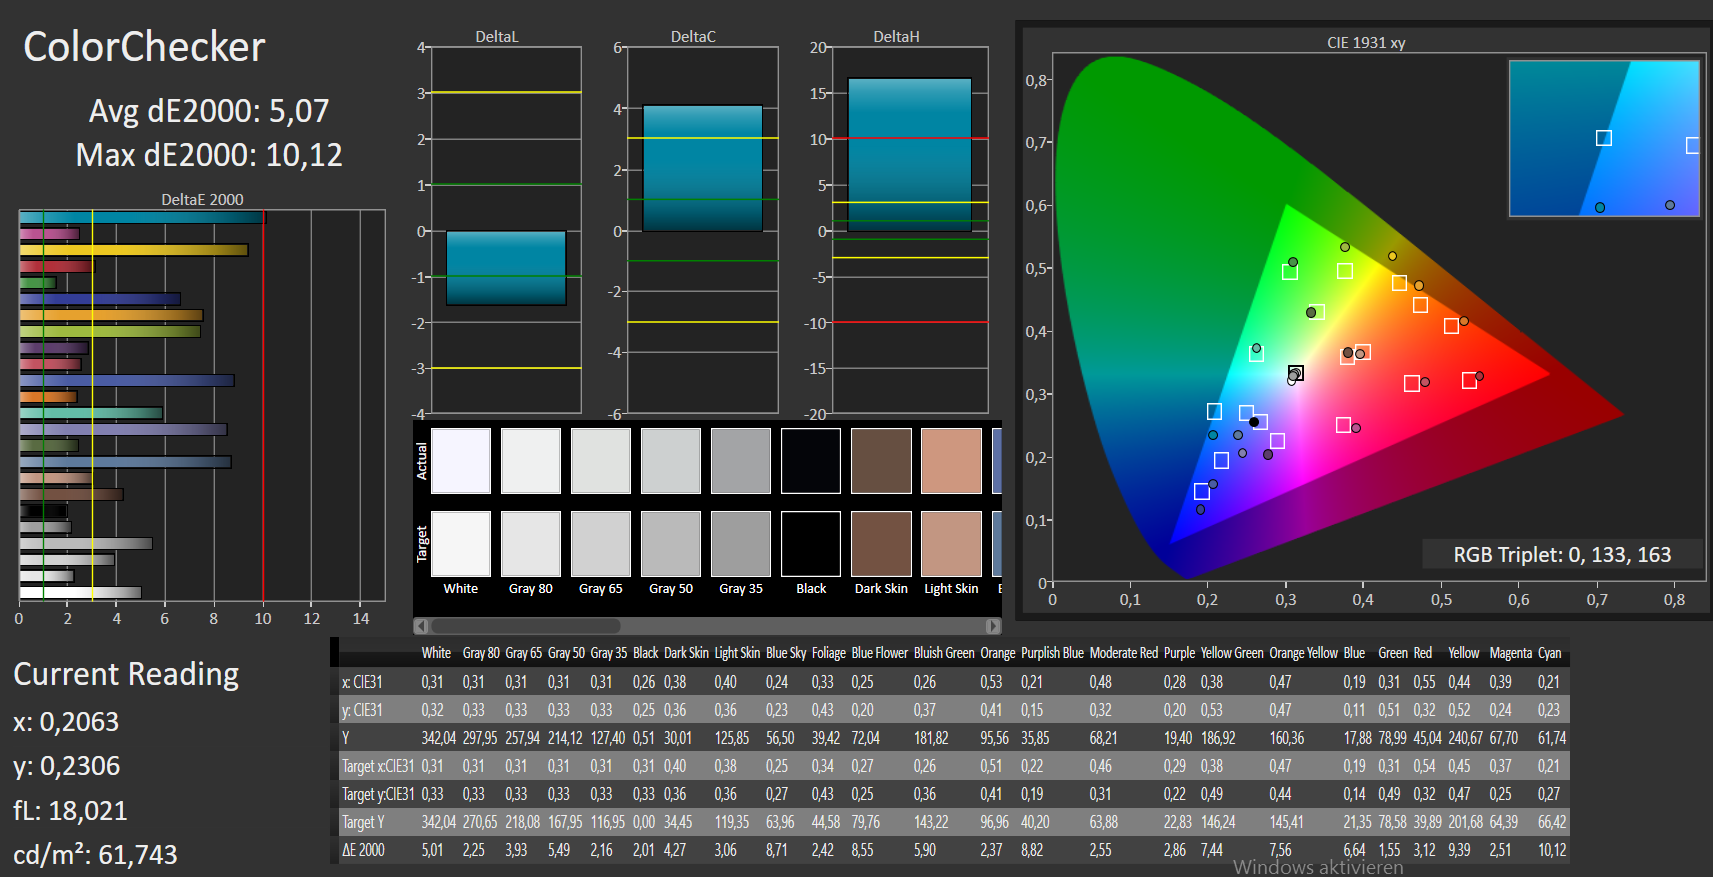
ΔE ColorChecker Calman: 5.07 | ∀{0.5-29.43 Ø4.71}
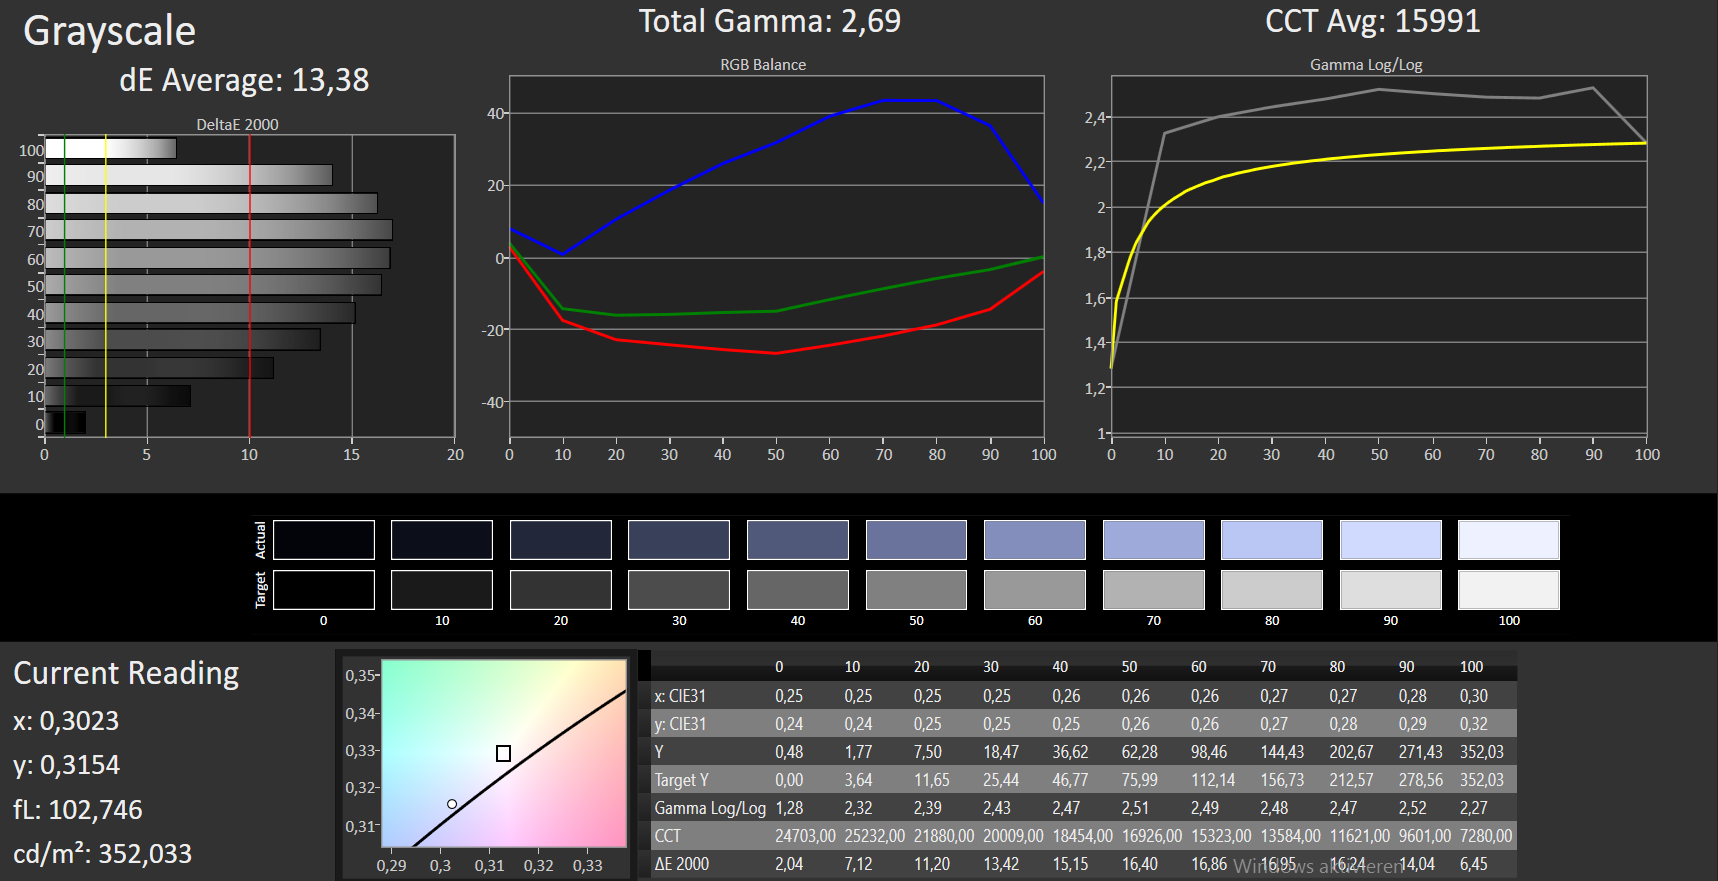
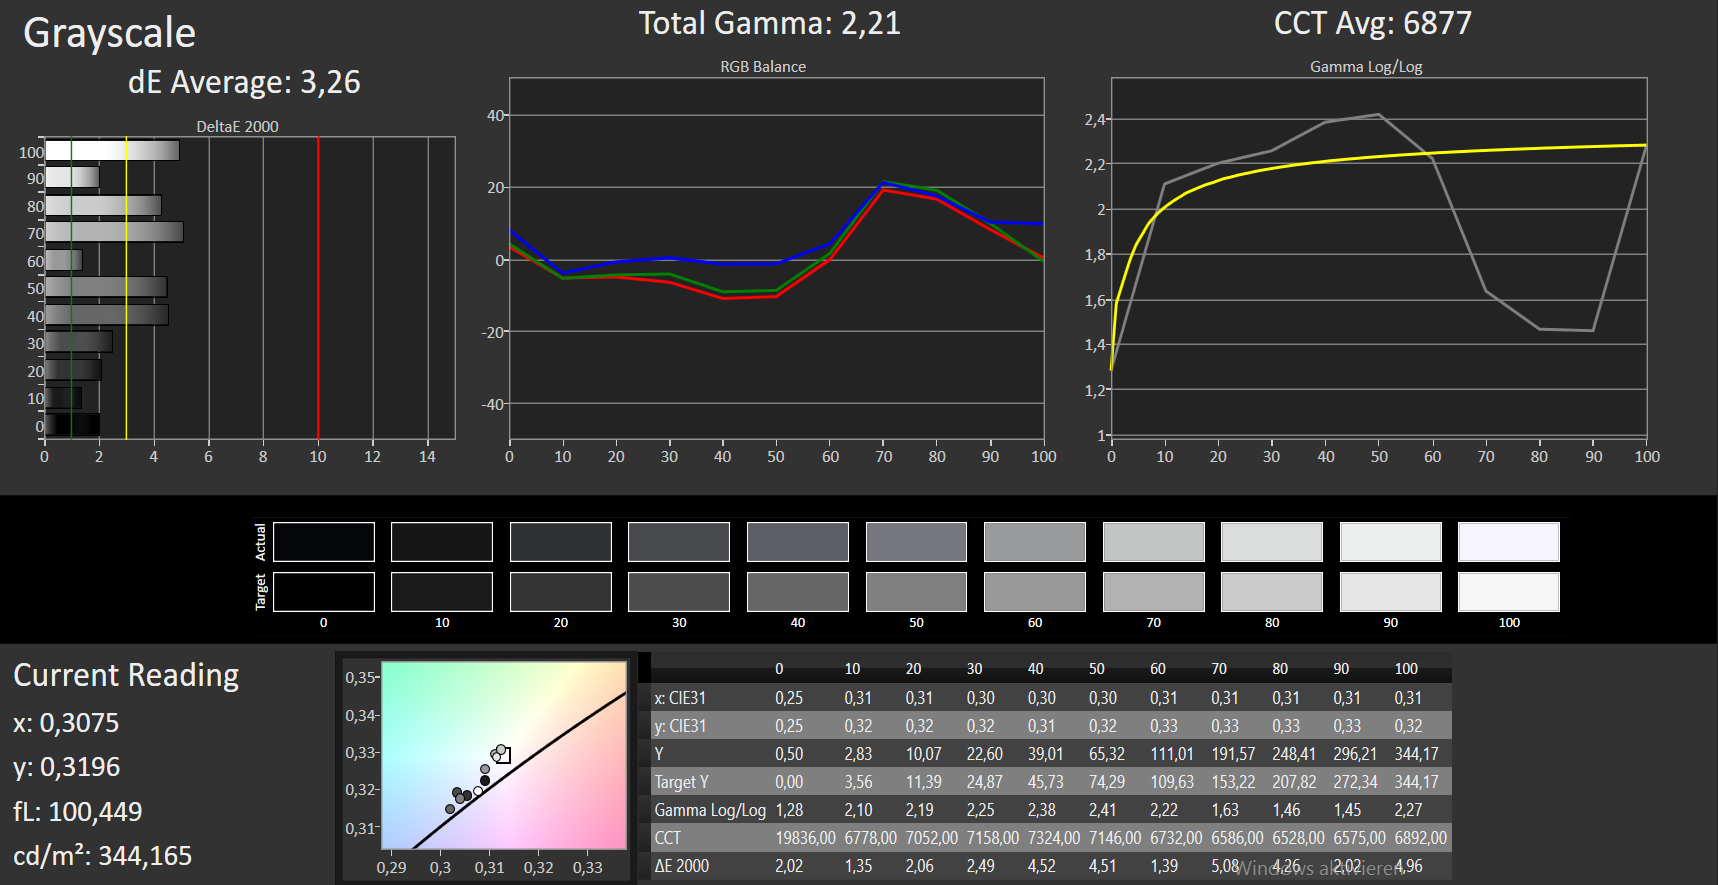
ΔE Greyscale Calman: 13.38 | ∀{0.09-98 Ø4.96}
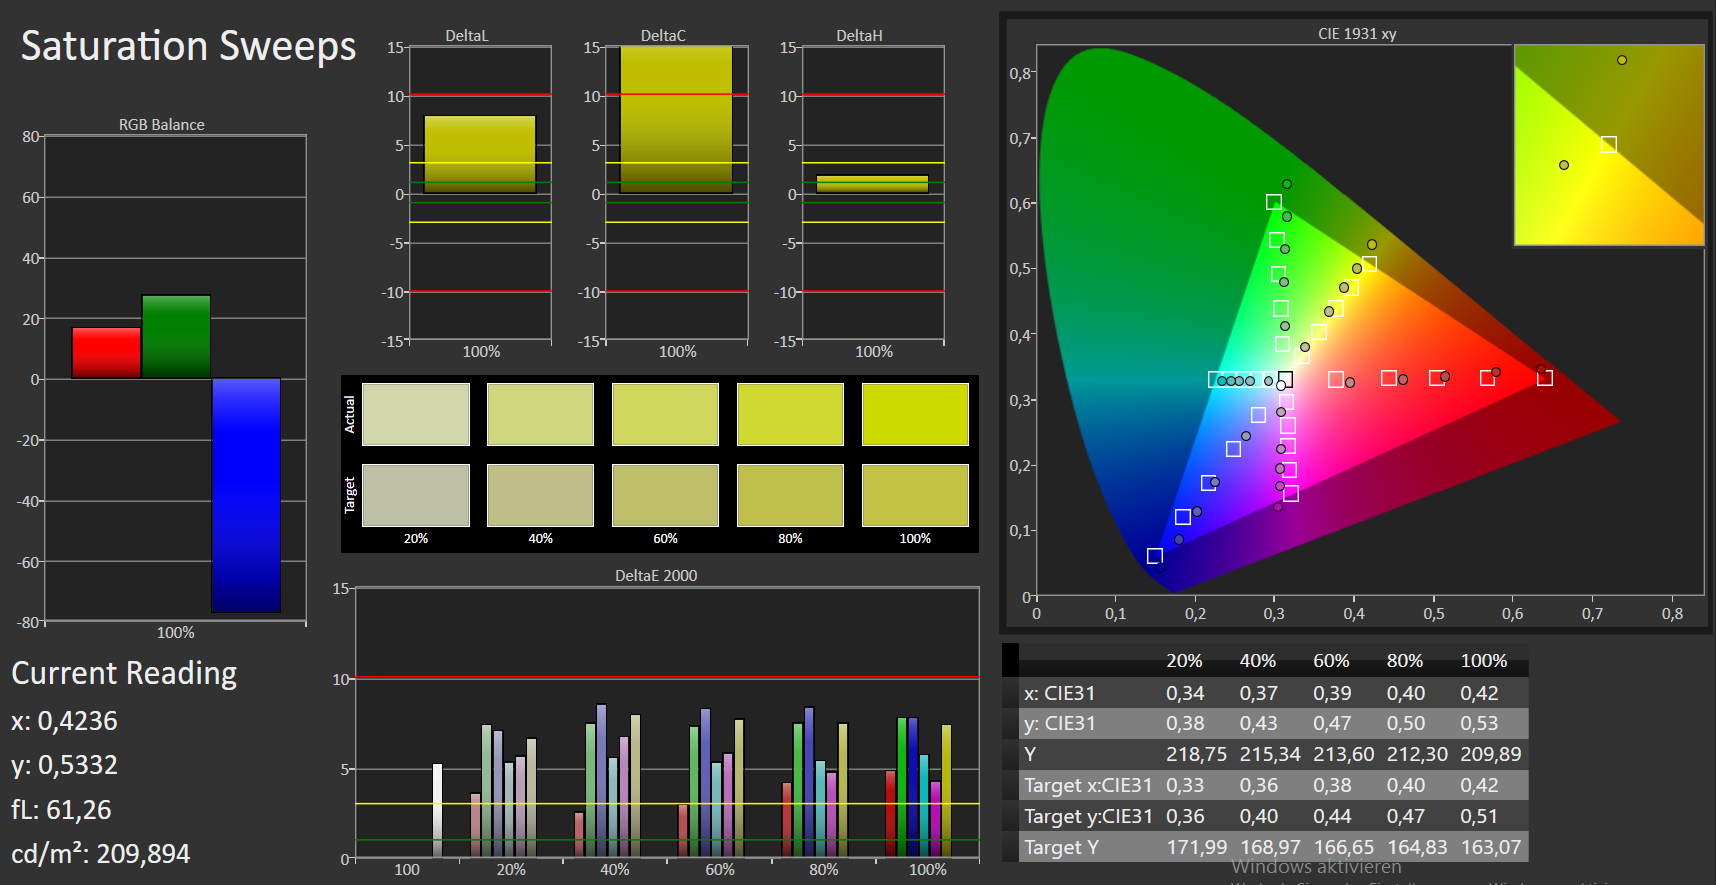
91.6% sRGB (Argyll 1.6.3 3D)
60.1% AdobeRGB 1998 (Argyll 1.6.3 3D)
67.1% AdobeRGB 1998 (Argyll 3D)
91.7% sRGB (Argyll 3D)
71.3% Display P3 (Argyll 3D)
Gamma: 2.69
CCT: 15991 K
| Acer Aspire E5-774-54HJ TN LED, 1920x1080, 17.3" | Acer Aspire E5-774G-78NA TN LED, 1920x1080, 17.3" | Lenovo IdeaPad 300-17ISK 80QH001EGE TN LED, 1600x900, 17.3" | Acer Aspire E5-722-662J TN LED, 1600x900, 17.3" | Dell Inspiron 17 5759-5118 TN LED, 1920x1080, 17.3" | |
|---|---|---|---|---|---|
| Display | 2% | -21% | -17% | -2% | |
| Display P3 Coverage (%) | 71.3 | 72.3 1% | 52.4 -27% | 54.5 -24% | 69.3 -3% |
| sRGB Coverage (%) | 91.7 | 94.8 3% | 76.1 -17% | 81.8 -11% | 90.6 -1% |
| AdobeRGB 1998 Coverage (%) | 67.1 | 69.3 3% | 54.2 -19% | 56.1 -16% | 66.3 -1% |
| Response Times | 1% | -2% | -9% | -55% | |
| Response Time Grey 50% / Grey 80% * (ms) | 42 ? | 43 ? -2% | 42 ? -0% | 48 ? -14% | 86 ? -105% |
| Response Time Black / White * (ms) | 23 ? | 22 ? 4% | 24 ? -4% | 24 ? -4% | 24 ? -4% |
| PWM Frequency (Hz) | 1000 ? | 1000 ? | 1042 ? | 200 ? | |
| Screen | -7% | -33% | -26% | -15% | |
| Brightness middle (cd/m²) | 353 | 320 -9% | 205 -42% | 216 -39% | 304 -14% |
| Brightness (cd/m²) | 320 | 302 -6% | 182 -43% | 199 -38% | 292 -9% |
| Brightness Distribution (%) | 82 | 86 5% | 77 -6% | 80 -2% | 84 2% |
| Black Level * (cd/m²) | 0.38 | 0.4 -5% | 0.43 -13% | 0.17 55% | 0.37 3% |
| Contrast (:1) | 929 | 800 -14% | 477 -49% | 1271 37% | 822 -12% |
| Colorchecker dE 2000 * | 5.07 | 7.78 -53% | 9.75 -92% | 12.2 -141% | 10.62 -109% |
| Colorchecker dE 2000 max. * | 10.12 | 12.74 -26% | 16.02 -58% | 20.4 -102% | |
| Greyscale dE 2000 * | 13.38 | 8.87 34% | 12.09 10% | 13.3 1% | 11.78 12% |
| Gamma | 2.69 82% | 2.27 97% | 2.62 84% | 2.15 102% | 2.39 92% |
| CCT | 15991 41% | 8979 72% | 12875 50% | 15963 41% | 12997 50% |
| Color Space (Percent of AdobeRGB 1998) (%) | 60.1 | 62 3% | 49 -18% | 52 -13% | 59 -2% |
| Color Space (Percent of sRGB) (%) | 91.6 | 95 4% | 76 -17% | 76 -17% | 90 -2% |
| Total Average (Program / Settings) | -1% /
-4% | -19% /
-26% | -17% /
-22% | -24% /
-18% |
* ... smaller is better
Screen Flickering / PWM (Pulse-Width Modulation)
| Screen flickering / PWM detected | 1000 Hz | ≤ 90 % brightness setting | 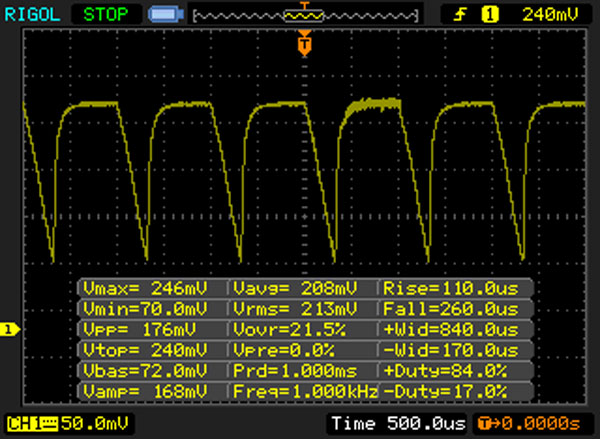 |
The display backlight flickers at 1000 Hz (worst case, e.g., utilizing PWM) Flickering detected at a brightness setting of 90 % and below. There should be no flickering or PWM above this brightness setting. The frequency of 1000 Hz is quite high, so most users sensitive to PWM should not notice any flickering. In comparison: 52 % of all tested devices do not use PWM to dim the display. If PWM was detected, an average of 7751 (minimum: 5 - maximum: 343500) Hz was measured. | |||
Display Response Times
| ↔ Response Time Black to White | ||
|---|---|---|
| 23 ms ... rise ↗ and fall ↘ combined | ↗ 6 ms rise | 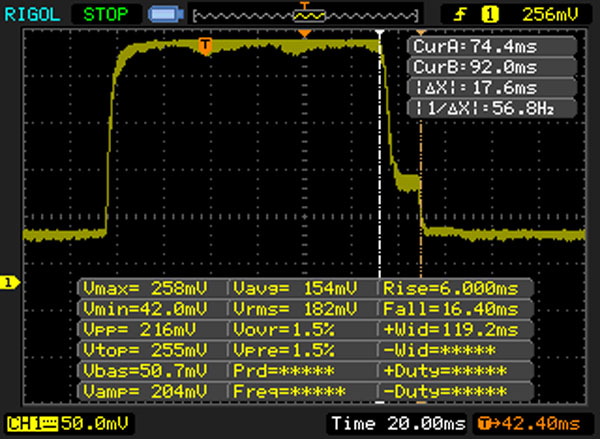 |
| ↘ 17 ms fall | ||
| The screen shows good response rates in our tests, but may be too slow for competitive gamers. In comparison, all tested devices range from 0.1 (minimum) to 240 (maximum) ms. » 52 % of all devices are better. This means that the measured response time is worse than the average of all tested devices (19.8 ms). | ||
| ↔ Response Time 50% Grey to 80% Grey | ||
| 42 ms ... rise ↗ and fall ↘ combined | ↗ 21 ms rise | 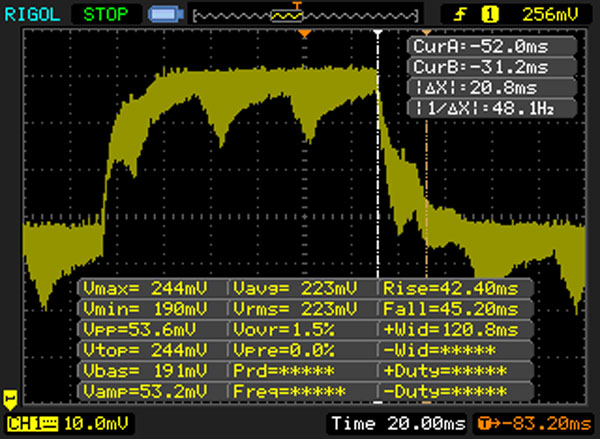 |
| ↘ 21 ms fall | ||
| The screen shows slow response rates in our tests and will be unsatisfactory for gamers. In comparison, all tested devices range from 0.165 (minimum) to 636 (maximum) ms. » 67 % of all devices are better. This means that the measured response time is worse than the average of all tested devices (31 ms). | ||
| Cinebench R15 | |
| CPU Single 64Bit | |
| Acer Aspire E5-774G-78NA | |
| Acer Aspire E5-774-54HJ | |
| Lenovo IdeaPad 300-17ISK 80QH001EGE | |
| Dell Inspiron 17 5759-5118 | |
| Acer Aspire E5-722-662J | |
| CPU Multi 64Bit | |
| Acer Aspire E5-774G-78NA | |
| Acer Aspire E5-774-54HJ | |
| Dell Inspiron 17 5759-5118 | |
| Lenovo IdeaPad 300-17ISK 80QH001EGE | |
| Acer Aspire E5-722-662J | |
| Geekbench 3 | |
| 32 Bit Single-Core Score | |
| Acer Aspire E5-774G-78NA | |
| Acer Aspire E5-774-54HJ | |
| Dell Inspiron 17 5759-5118 | |
| Lenovo IdeaPad 300-17ISK 80QH001EGE | |
| 32 Bit Multi-Core Score | |
| Acer Aspire E5-774G-78NA | |
| Acer Aspire E5-774-54HJ | |
| Dell Inspiron 17 5759-5118 | |
| Lenovo IdeaPad 300-17ISK 80QH001EGE | |
| Geekbench 4.0 | |
| 64 Bit Single-Core Score | |
| Acer Aspire E5-774-54HJ | |
| 64 Bit Multi-Core Score | |
| Acer Aspire E5-774-54HJ | |
| JetStream 1.1 - 1.1 Total | |
| Acer Aspire E5-774G-78NA | |
| Acer Aspire E5-774-54HJ | |
| Lenovo IdeaPad 300-17ISK 80QH001EGE | |
| Dell Inspiron 17 5759-5118 | |
| PCMark 8 Home Score Accelerated v2 | 2854 points | |
Help | ||
| PCMark 8 - Home Score Accelerated v2 | |
| Acer Aspire E5-774G-78NA | |
| Dell Inspiron 17 5759-5118 | |
| Lenovo IdeaPad 300-17ISK 80QH001EGE | |
| Acer Aspire E5-774-54HJ | |
| Acer Aspire E5-722-662J | |

| Acer Aspire E5-774-54HJ Western Digital Scorpio Blue WD5000LPCX-24C6HT0 | Acer Aspire E5-774G-78NA Lite-On CV1-8B256 | Lenovo IdeaPad 300-17ISK 80QH001EGE Toshiba MQ01ABD100 | Acer Aspire E5-722-662J WDC Scorpio Blue WD10JPVX-22JC3T0 | Dell Inspiron 17 5759-5118 Seagate Momentus SpinPoint M8 ST1000LM024 HN-M101MBB | |
|---|---|---|---|---|---|
| CrystalDiskMark 3.0 | 9156% | -10% | 18% | -22% | |
| Read Seq (MB/s) | 88.9 | 520 485% | 100.6 13% | 113.9 28% | 91.8 3% |
| Write Seq (MB/s) | 70.9 | 332.8 369% | 96.3 36% | 113.8 61% | 84.7 19% |
| Read 512 (MB/s) | 33.01 | 382.8 1060% | 28.15 -15% | 37.29 13% | 26.59 -19% |
| Write 512 (MB/s) | 51.6 | 357.7 593% | 43.34 -16% | 51.8 0% | 32.7 -37% |
| Read 4k (MB/s) | 0.381 | 32.31 8380% | 0.312 -18% | 0.425 12% | 0.288 -24% |
| Write 4k (MB/s) | 1.117 | 85.1 7519% | 0.792 -29% | 1.153 3% | 0.638 -43% |
| Read 4k QD32 (MB/s) | 0.891 | 277.7 31067% | 0.708 -21% | 1.095 23% | 0.59 -34% |
| Write 4k QD32 (MB/s) | 1.13 | 269.8 23776% | 0.764 -32% | 1.162 3% | 0.642 -43% |
| 3DMark 11 Performance | 1413 points | |
Help | ||
| 3DMark 11 - 1280x720 Performance GPU | |
| Acer Aspire E5-774G-78NA | |
| Dell Inspiron 17 5759-5118 | |
| Acer Aspire E5-774-54HJ | |
| Lenovo IdeaPad 300-17ISK 80QH001EGE | |
| Acer Aspire E5-774-54HJ | |
| Acer Aspire E5-722-662J | |
| low | med. | high | ultra | |
|---|---|---|---|---|
| BioShock Infinite (2013) | 35.6 | 20.1 | 16.6 | 5.4 |
| BioShock Infinite - 1280x720 Very Low Preset | |
| Acer Aspire E5-774G-78NA | |
| Acer Aspire E5-774-54HJ | |
| Dell Inspiron 17 5759-5118 | |
| Lenovo IdeaPad 300-17ISK 80QH001EGE | |
| Acer Aspire E5-774-54HJ | |
Noise level
| Idle |
| 30.8 / 30.8 / 30.8 dB(A) |
| HDD |
| 32.4 dB(A) |
| DVD |
| 35.6 / dB(A) |
| Load |
| 32.1 / 33.8 dB(A) |
 | ||
30 dB silent 40 dB(A) audible 50 dB(A) loud |
||
min: | ||
(+) The maximum temperature on the upper side is 30.4 °C / 87 F, compared to the average of 34.3 °C / 94 F, ranging from 21.2 to 62.5 °C for the class Office.
(+) The bottom heats up to a maximum of 30.6 °C / 87 F, compared to the average of 36.8 °C / 98 F
(+) In idle usage, the average temperature for the upper side is 24.9 °C / 77 F, compared to the device average of 29.5 °C / 85 F.
(+) The palmrests and touchpad are cooler than skin temperature with a maximum of 28.8 °C / 83.8 F and are therefore cool to the touch.
(±) The average temperature of the palmrest area of similar devices was 27.5 °C / 81.5 F (-1.3 °C / -2.3 F).
Acer Aspire E5-774-54HJ audio analysis
(±) | speaker loudness is average but good (79 dB)
Bass 100 - 315 Hz
(-) | nearly no bass - on average 24.9% lower than median
(±) | linearity of bass is average (10.6% delta to prev. frequency)
Mids 400 - 2000 Hz
(+) | balanced mids - only 4.4% away from median
(±) | linearity of mids is average (10.7% delta to prev. frequency)
Highs 2 - 16 kHz
(+) | balanced highs - only 4.4% away from median
(+) | highs are linear (5.1% delta to prev. frequency)
Overall 100 - 16.000 Hz
(±) | linearity of overall sound is average (24.7% difference to median)
Compared to same class
» 73% of all tested devices in this class were better, 7% similar, 20% worse
» The best had a delta of 7%, average was 21%, worst was 53%
Compared to all devices tested
» 75% of all tested devices were better, 5% similar, 19% worse
» The best had a delta of 4%, average was 23%, worst was 134%
Apple MacBook 12 (Early 2016) 1.1 GHz audio analysis
(+) | speakers can play relatively loud (83.6 dB)
Bass 100 - 315 Hz
(±) | reduced bass - on average 11.3% lower than median
(±) | linearity of bass is average (14.2% delta to prev. frequency)
Mids 400 - 2000 Hz
(+) | balanced mids - only 2.4% away from median
(+) | mids are linear (5.5% delta to prev. frequency)
Highs 2 - 16 kHz
(+) | balanced highs - only 2% away from median
(+) | highs are linear (4.5% delta to prev. frequency)
Overall 100 - 16.000 Hz
(+) | overall sound is linear (10.2% difference to median)
Compared to same class
» 7% of all tested devices in this class were better, 2% similar, 90% worse
» The best had a delta of 5%, average was 18%, worst was 53%
Compared to all devices tested
» 5% of all tested devices were better, 1% similar, 94% worse
» The best had a delta of 4%, average was 23%, worst was 134%
| Off / Standby | |
| Idle | |
| Load |
|
Key:
min: | |
| Battery Runtime - WiFi Websurfing | |
| Lenovo IdeaPad 300-17ISK 80QH001EGE | |
| Acer Aspire E5-774G-78NA | |
| Acer Aspire E5-774-54HJ | |
| Dell Inspiron 17 5759-5118 | |
| Acer Aspire E5-722-662J | |
Pros
Cons
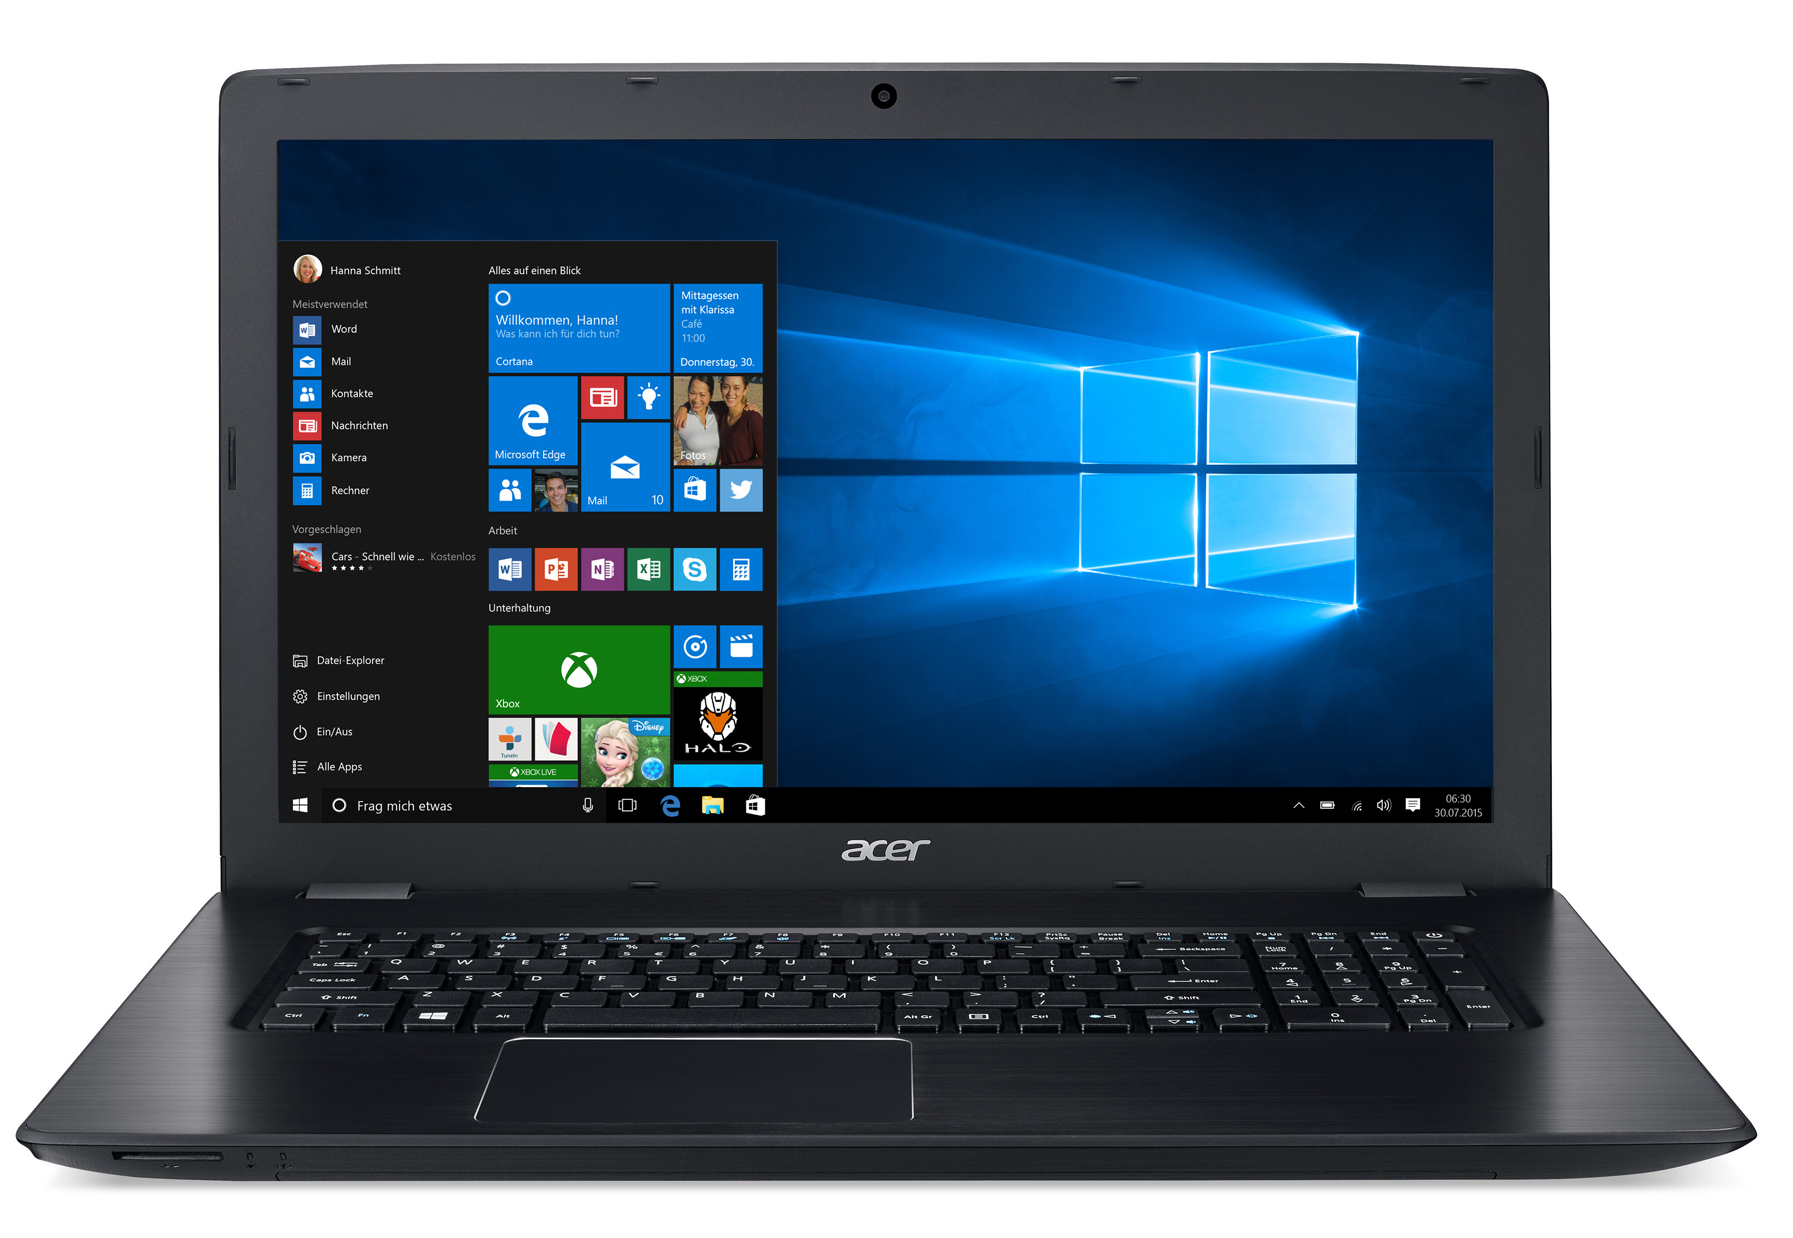
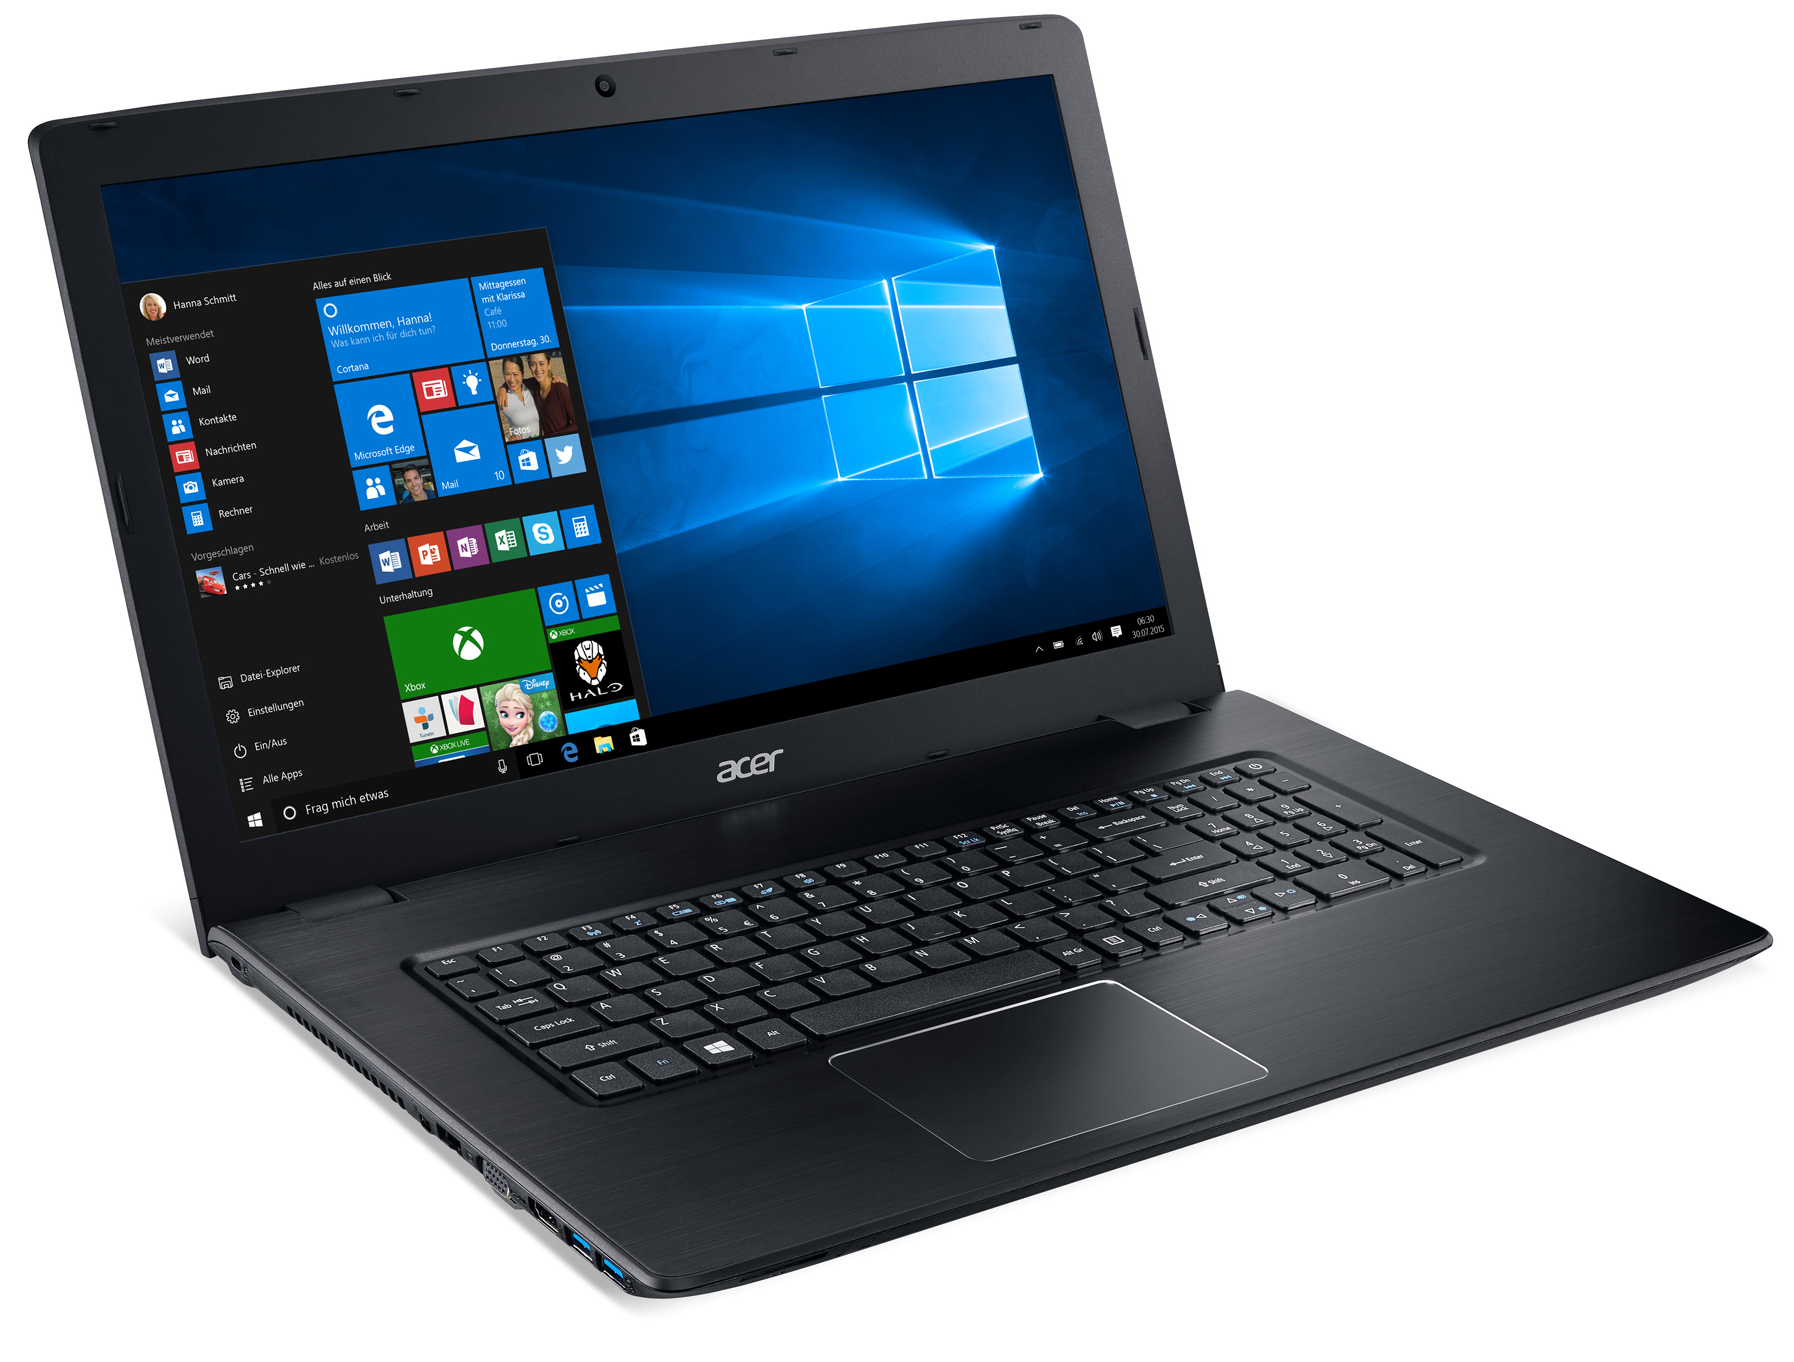
Kaby Lake架构的酷睿i5可以为日常使用带来足够的性能,而它的集成显卡也可以流畅运行很多(配置要求较低的)游戏。我们建议用户为它添加第二条内存来增强系统和图形性能。这台笔记本电脑在使用中可以保持安静,几乎不会变热。500GB的硬盘空间十分充裕,但我们建议为它增加一块M.2接口固态硬盘。由于它底盖设计有维护窗口,用户可以方便地对硬件更新升级。它的键盘也十分不错,作为一台17.3寸笔记本它的电池续航也算不错。磨砂的全高清屏幕亮度和对比度都很高,但由于采用TN技术可视角度范围较为有限。不过这应该算是品质最高的TN面板之一了,它的可视角度比普通的廉价TN面板宽广不少。遗憾的是,这仍然无法帮助它与IPS屏幕相提并论。
Aspire E5-774是一台设计优秀的家庭办公笔记本电脑。
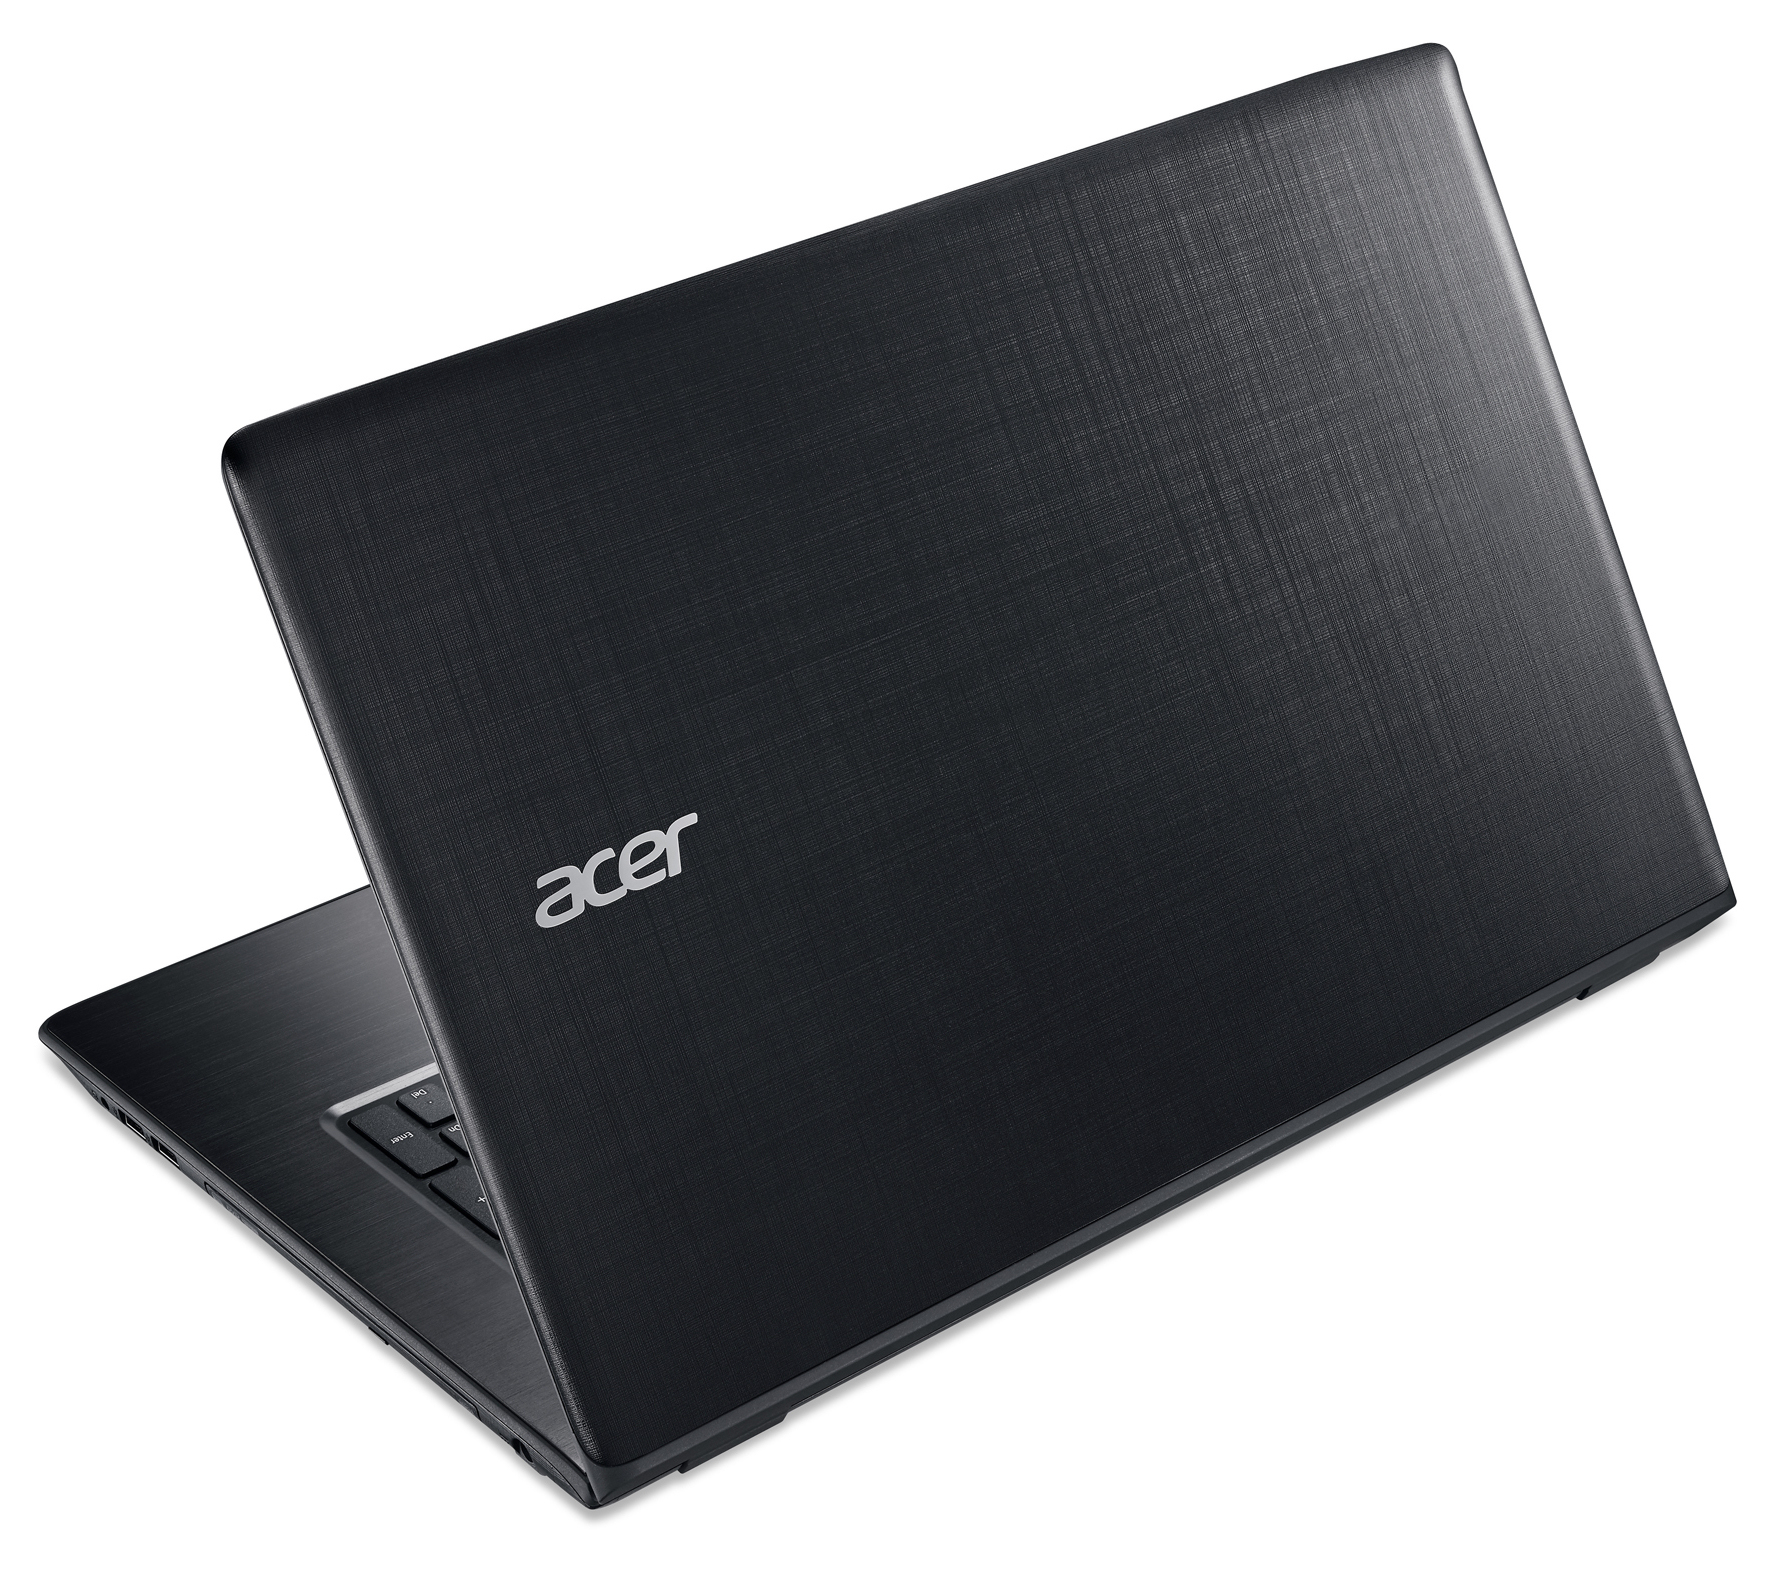
如果你喜欢这台笔记本电脑,但需要更高的显卡性能,我们建议你考虑一下Aspire E5-774G。E5-774G搭配了GDDR5显存GeForce 940MX独立显卡,它相比搭配GDDR3显存的GeForce 940MX显卡性能会高出20%至30%。
注:本文是基于完整评测的缩减版本,阅读完整的英文评测,请点击这里。
Acer Aspire E5-774-54HJ
- 11/20/2016 v5.1 (old)
Sascha Mölck