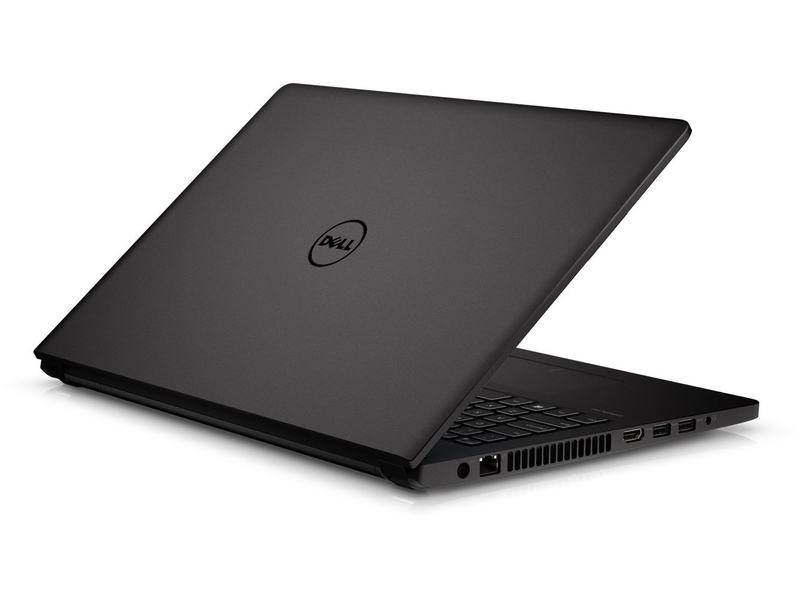
戴尔 Latitude 15 3570 笔记本电脑简短评测
Dell Latitude 15-3570 (Latitude 3000 Series)
Processor
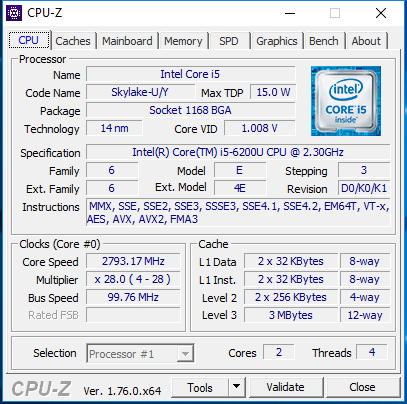
Intel Core i5-6200U 2c/4t 2 x 2.3 - 2.8 GHz, Skylake
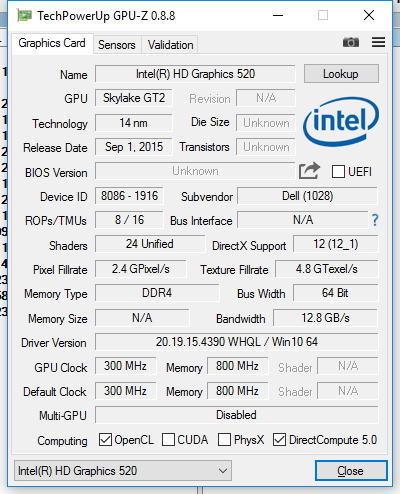
Graphics adapter
Intel HD Graphics 520, Core: 1050 MHz, 共享内存, 20.19.15.4390
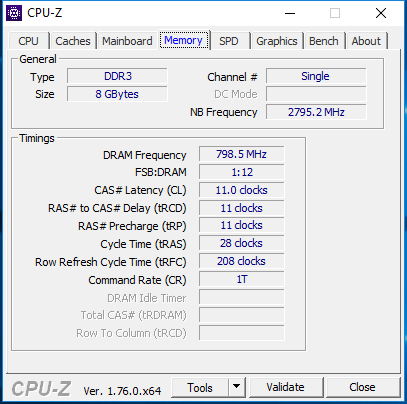
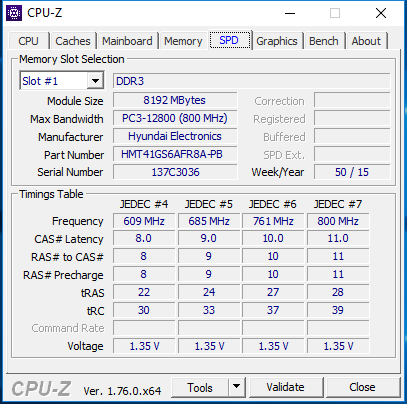
Memory
8 GB
, DDR3L, 1600 MHz, 单通道
Display
15.60 inch 16:9, 1366 x 768 pixel 101 PPI, LG Philips LGD04AF / 156WHU, TN LED, glossy: no
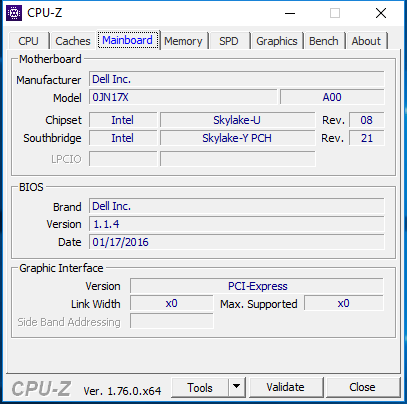
Mainboard
Intel Skylake-U Premium PCH
Storage
Samsung CM871 MZNLF128HCHP, 128 GB
Weight
2.06 kg, Power Supply: 236 g
Price
629 EUR
Note: The manufacturer may use components from different suppliers including display panels, drives or memory sticks with similar specifications.


| |||||||||||||||||||||||||
LG Philips LGD04AF / 156WHU tested with X-Rite i1Pro 2
Maximum: 225 cd/m² (Nits) Average: 210.9 cd/m² Minimum: 9.6 cd/m²Brightness Distribution: 88 %
Center on Battery: 206 cd/m²
Contrast: 326:1 (Black: 0.62 cd/m²)
ΔE ColorChecker Calman: 12.35 | ∀{0.5-29.43 Ø4.72}
ΔE Greyscale Calman: 13.46 | ∀{0.09-98 Ø4.97}
61% sRGB (Argyll 1.6.3 3D)
39% AdobeRGB 1998 (Argyll 1.6.3 3D)
41.96% AdobeRGB 1998 (Argyll 3D)
61.1% sRGB (Argyll 3D)
40.61% Display P3 (Argyll 3D)
Gamma: 2.44
CCT: 15217 K
| Dell Latitude 15-3570 | Lenovo ThinkPad L560-20F10026GE | HP ProBook 450 G3 | Lenovo ThinkPad E550-20DF00CNGE | |
|---|---|---|---|---|
| Display | -4% | -6% | -2% | |
| Display P3 Coverage (%) | 40.61 | 39 -4% | 38.1 -6% | 39.84 -2% |
| sRGB Coverage (%) | 61.1 | 58.3 -5% | 57.3 -6% | 59.3 -3% |
| AdobeRGB 1998 Coverage (%) | 41.96 | 40.33 -4% | 39.37 -6% | 41.2 -2% |
| Response Times | 9% | 7% | ||
| Response Time Grey 50% / Grey 80% * (ms) | 37 ? | 39.2 ? -6% | 41.2 ? -11% | |
| Response Time Black / White * (ms) | 37 ? | 28 ? 24% | 28 ? 24% | |
| PWM Frequency (Hz) | ||||
| Screen | 35% | 14% | 9% | |
| Brightness middle (cd/m²) | 202 | 262 30% | 211 4% | 195 -3% |
| Brightness (cd/m²) | 211 | 250 18% | 214 1% | 188 -11% |
| Brightness Distribution (%) | 88 | 92 5% | 91 3% | 90 2% |
| Black Level * (cd/m²) | 0.62 | 0.29 53% | 0.43 31% | 0.46 26% |
| Contrast (:1) | 326 | 903 177% | 491 51% | 424 30% |
| Colorchecker dE 2000 * | 12.35 | 8.49 31% | 9.25 25% | 9.92 20% |
| Colorchecker dE 2000 max. * | 19.9 | 17.99 10% | ||
| Greyscale dE 2000 * | 13.46 | 8.11 40% | 9.83 27% | 10.06 25% |
| Gamma | 2.44 90% | 2.37 93% | 2.82 78% | 2.37 93% |
| CCT | 15217 43% | 6300 103% | 10890 60% | 11552 56% |
| Color Space (Percent of AdobeRGB 1998) (%) | 39 | 37.07 -5% | 36.4 -7% | 38 -3% |
| Color Space (Percent of sRGB) (%) | 61 | 57.94 -5% | 57.3 -6% | 59.3 -3% |
| Total Average (Program / Settings) | 13% /
24% | 5% /
9% | 4% /
6% |
* ... smaller is better
Display Response Times
ℹ
Display response times show how fast the screen is able to change from one color to the next. Slow response times can lead to afterimages and can cause moving objects to appear blurry (ghosting). Gamers of fast-paced 3D titles should pay special attention to fast response times.| ↔ Response Time Black to White | ||
|---|---|---|
| 37 ms ... rise ↗ and fall ↘ combined | ↗ 20 ms rise | 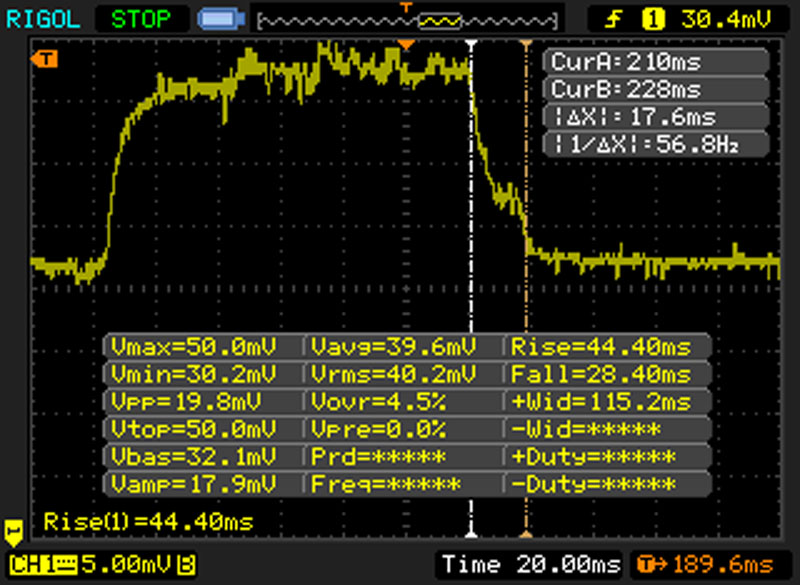 |
| ↘ 17 ms fall | ||
| The screen shows slow response rates in our tests and will be unsatisfactory for gamers. In comparison, all tested devices range from 0.1 (minimum) to 240 (maximum) ms. » 95 % of all devices are better. This means that the measured response time is worse than the average of all tested devices (19.8 ms). | ||
| ↔ Response Time 50% Grey to 80% Grey | ||
| 37 ms ... rise ↗ and fall ↘ combined | ↗ 13 ms rise |  |
| ↘ 24 ms fall | ||
| The screen shows slow response rates in our tests and will be unsatisfactory for gamers. In comparison, all tested devices range from 0.165 (minimum) to 636 (maximum) ms. » 53 % of all devices are better. This means that the measured response time is worse than the average of all tested devices (31 ms). | ||
Screen Flickering / PWM (Pulse-Width Modulation)
ℹ
To dim the screen, some notebooks will simply cycle the backlight on and off in rapid succession - a method called Pulse Width Modulation (PWM) . This cycling frequency should ideally be undetectable to the human eye. If said frequency is too low, users with sensitive eyes may experience strain or headaches or even notice the flickering altogether.| Screen flickering / PWM not detected | ||
In comparison: 52 % of all tested devices do not use PWM to dim the display. If PWM was detected, an average of 7781 (minimum: 5 - maximum: 343500) Hz was measured. | ||
| PCMark 8 | |
| Home Score Accelerated v2 | |
| Lenovo ThinkPad E550-20DF00CNGE | |
| Dell Latitude 15-3570 | |
| HP ProBook 450 G3 | |
| Lenovo ThinkPad L560-20F10026GE | |
| Work Score Accelerated v2 | |
| Dell Latitude 15-3570 | |
| Lenovo ThinkPad E550-20DF00CNGE | |
| HP ProBook 450 G3 | |
| Lenovo ThinkPad L560-20F10026GE | |
| PCMark 8 Home Score Accelerated v2 | 3337 points | |
| PCMark 8 Work Score Accelerated v2 | 4477 points | |
Help | ||
| Dell Latitude 15-3570 Samsung CM871 MZNLF128HCHP | Lenovo ThinkPad L560-20F10026GE WDC Slim WD10SPCX-21KHST0 | HP ProBook 450 G3 Seagate ST500LM021-1KJ15 | Lenovo ThinkPad E550-20DF00CNGE WDC Slim WD10SPCX-22HWST0 | |
|---|---|---|---|---|
| CrystalDiskMark 3.0 | -90% | -90% | -92% | |
| Read Seq (MB/s) | 453.2 | 113.6 -75% | 122.8 -73% | 101.9 -78% |
| Read 4k (MB/s) | 19.06 | 0.488 -97% | 0.341 -98% | 0.315 -98% |
| Read 4k QD32 (MB/s) | 93.5 | 1.367 -99% | 0.897 -99% | 0.967 -99% |
| AS SSD | ||||
| Seq Read (MB/s) | 489.1 | |||
| 4K Read (MB/s) | 17.25 | |||
| 4K-64 Read (MB/s) | 81.8 | |||
| Score Write (Points) | 54 | |||
| Total Average (Program / Settings) | -90% /
-90% | -90% /
-90% | -92% /
-92% |

Samsung CM871 MZNLF128HCHP
Sequential Read:
453.2 MB/s
Sequential Write:
137.7 MB/s
512K Read:
308.5 MB/s
512K Write:
134.1 MB/s
4K Read:
19.06 MB/s
4K Write:
21.31 MB/s
4K QD32 Read:
93.5 MB/s
4K QD32 Write:
23.3 MB/s
| 3DMark 11 - 1280x720 Performance GPU | |
| Lenovo ThinkPad E550-20DF00CNGE | |
| Dell Latitude 15-3570 | |
| Lenovo ThinkPad L560-20F10026GE | |
| HP ProBook 450 G3 | |
| 3DMark 11 Performance | 1363 points | |
| 3DMark Ice Storm Standard Score | 46457 points | |
| 3DMark Cloud Gate Standard Score | 4919 points | |
Help | ||
| low | med. | high | ultra | |
|---|---|---|---|---|
| BioShock Infinite (2013) | 36.5 | 20.8 | 16.8 | |
| Metro: Last Light (2013) | 17.7 | 15.3 | ||
| The Witcher 3 (2015) | 11.2 | 7 |
Noise level
| Idle |
| 31 / 31 / 31 dB(A) |
| Load |
| 34.2 / 34.3 dB(A) |
 | ||
30 dB silent 40 dB(A) audible 50 dB(A) loud |
||
min: | ||
(+) The average temperature for the upper side under maximal load is 31.2 °C / 88 F, compared to the average of 29.5 °C / 85 F for the devices in the class Office.
(+) The maximum temperature on the upper side is 36.1 °C / 97 F, compared to the average of 34.3 °C / 94 F, ranging from 21.2 to 62.5 °C for the class Office.
(-) The bottom heats up to a maximum of 47 °C / 117 F, compared to the average of 36.8 °C / 98 F
(+) In idle usage, the average temperature for the upper side is 29.5 °C / 85 F, compared to the device average of 29.5 °C / 85 F.
(+) The palmrests and touchpad are reaching skin temperature as a maximum (35.8 °C / 96.4 F) and are therefore not hot.
(-) The average temperature of the palmrest area of similar devices was 27.5 °C / 81.5 F (-8.3 °C / -14.9 F).
Power Consumption
| Off / Standby | |
| Idle | |
| Load |
|
Key:
min: | |
| Dell Latitude 15-3570 HD Graphics 520, 6200U, Samsung CM871 MZNLF128HCHP | Lenovo ThinkPad L560-20F10026GE HD Graphics 520, 6200U, WDC Slim WD10SPCX-21KHST0 | HP ProBook 450 G3 HD Graphics 520, 6200U, Seagate ST500LM021-1KJ15 | Lenovo ThinkPad E550-20DF00CNGE Radeon R7 M265, 5500U, WDC Slim WD10SPCX-22HWST0 | |
|---|---|---|---|---|
| Battery runtime | -29% | -43% | -42% | |
| Reader / Idle (h) | 17.1 | 11.6 -32% | 9.6 -44% | 11.1 -35% |
| WiFi v1.3 (h) | 9 | 6.8 -24% | 5.2 -42% | 4.9 -46% |
| Load (h) | 2.6 | 1.8 -31% | 1.5 -42% | 1.4 -46% |
Pros
+ 众多可选机型
+ 实惠(附加折扣)
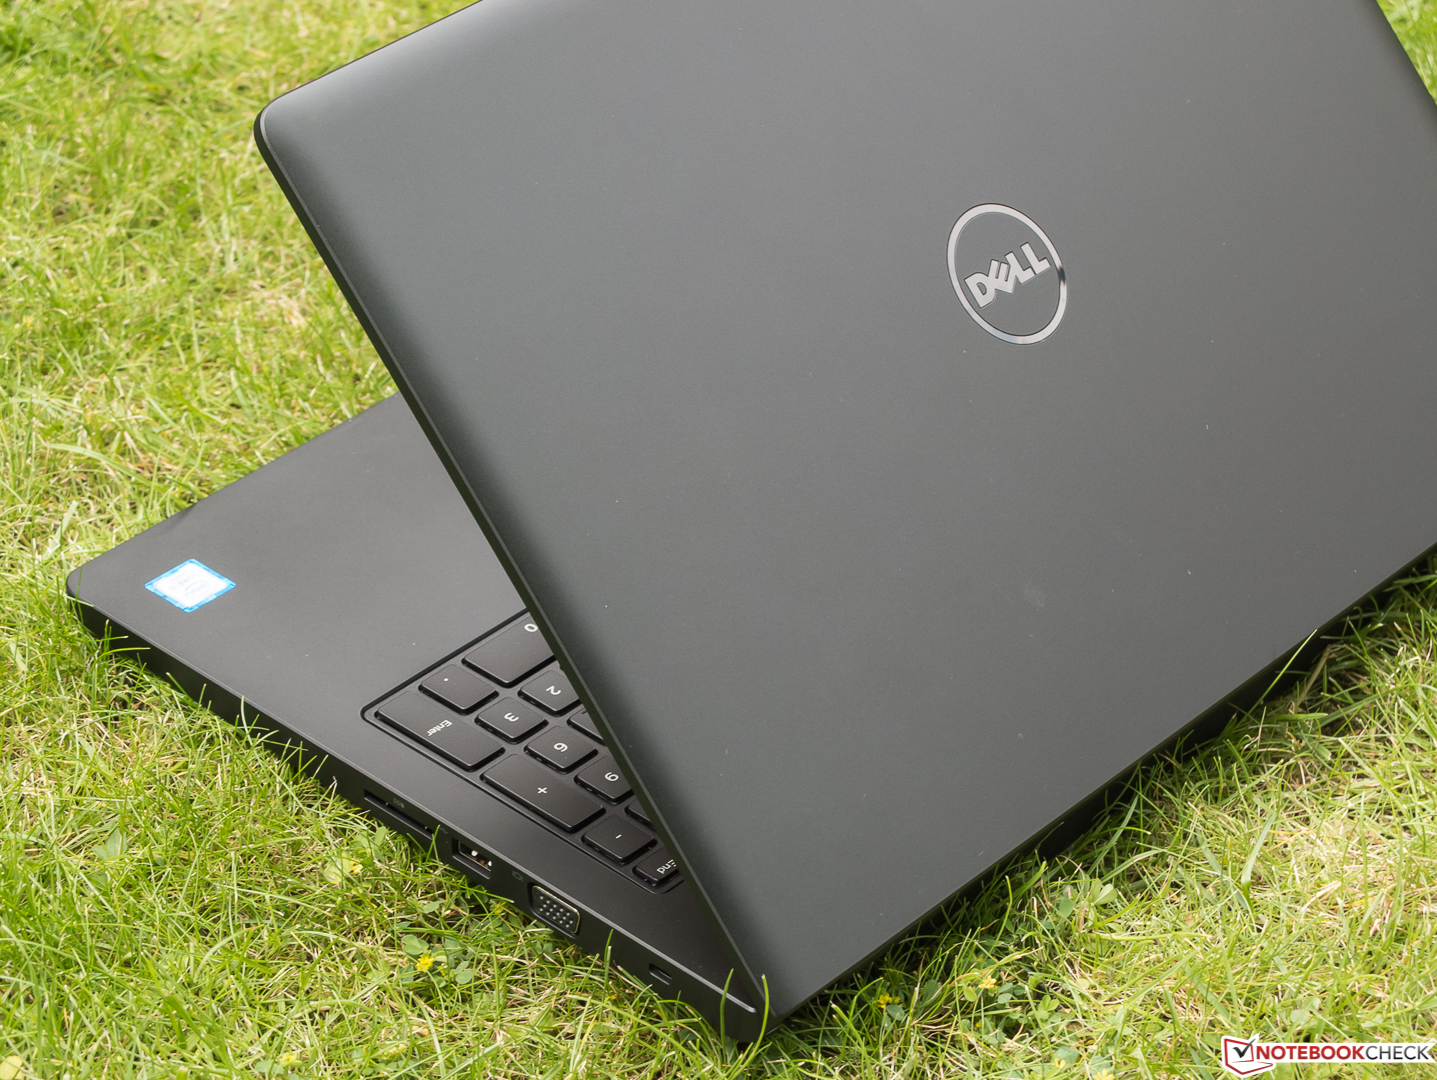
+ 设计合理的机身
+ 屏幕无闪烁
+ 支持TPM
+ 附带恢复盘
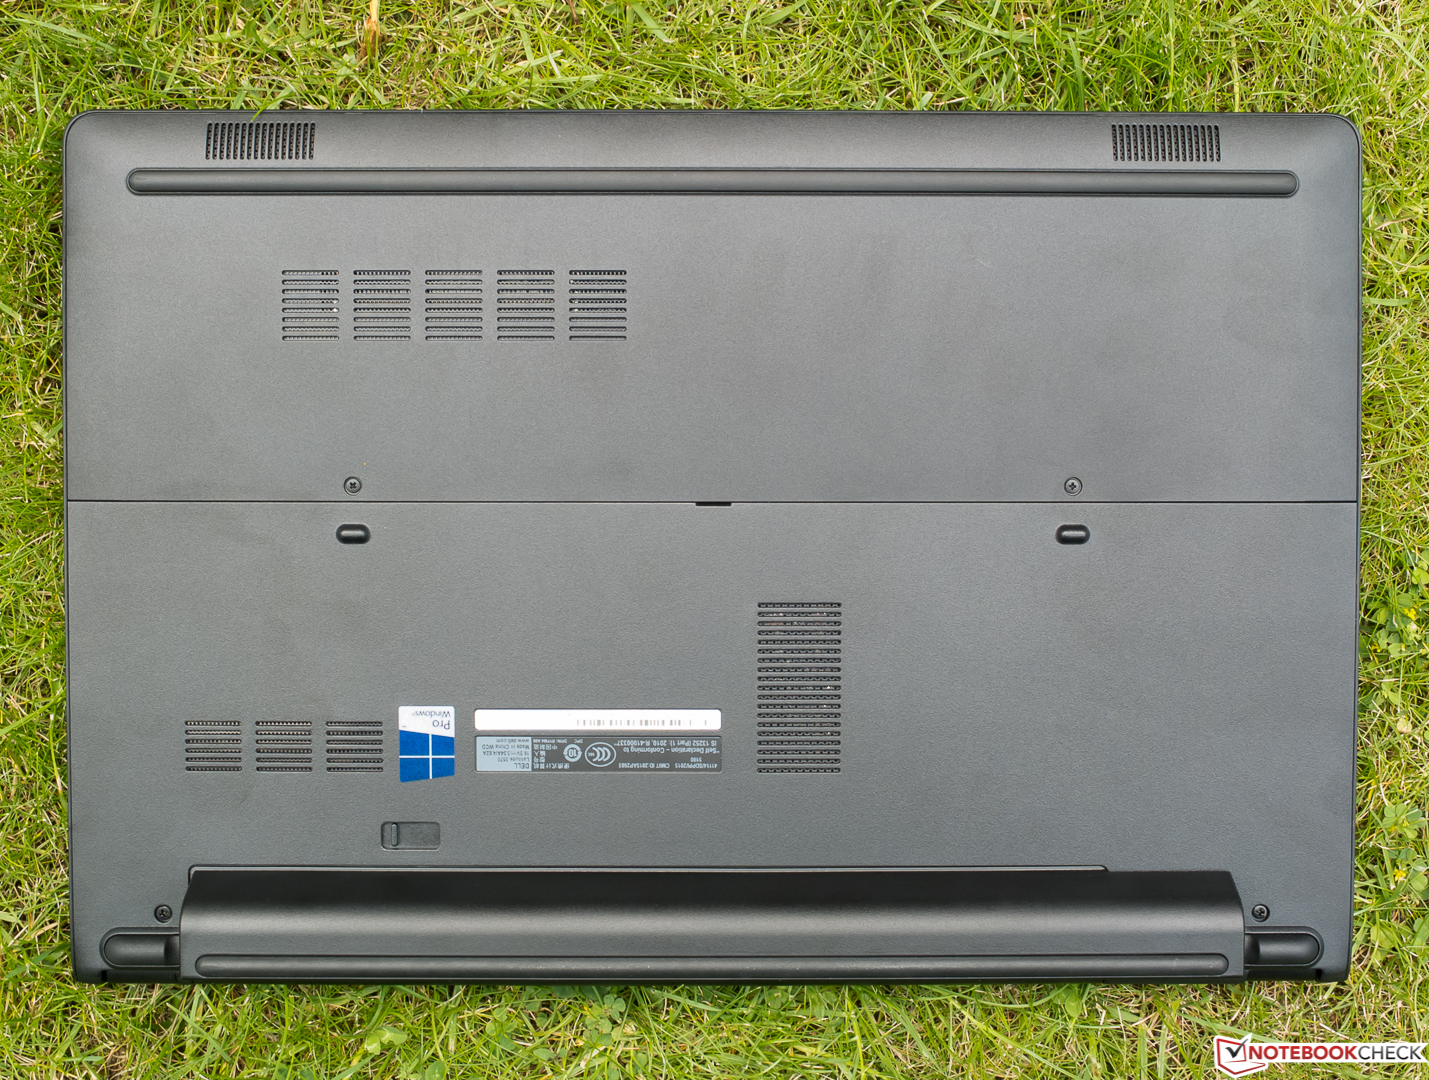
+ 易于维护升级
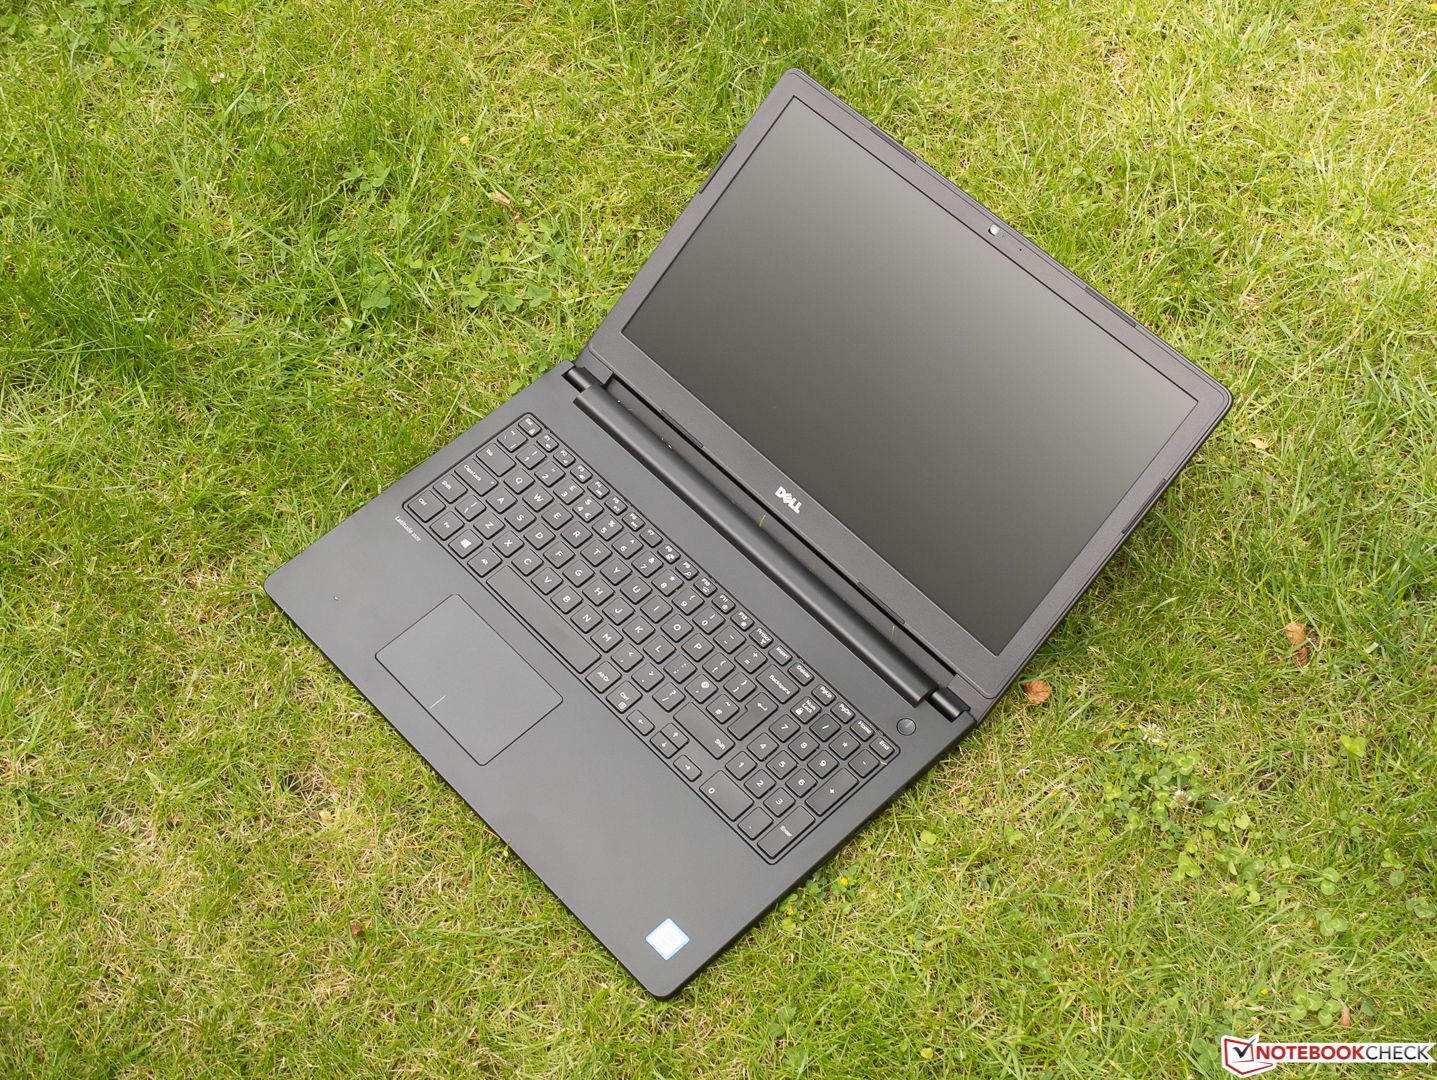
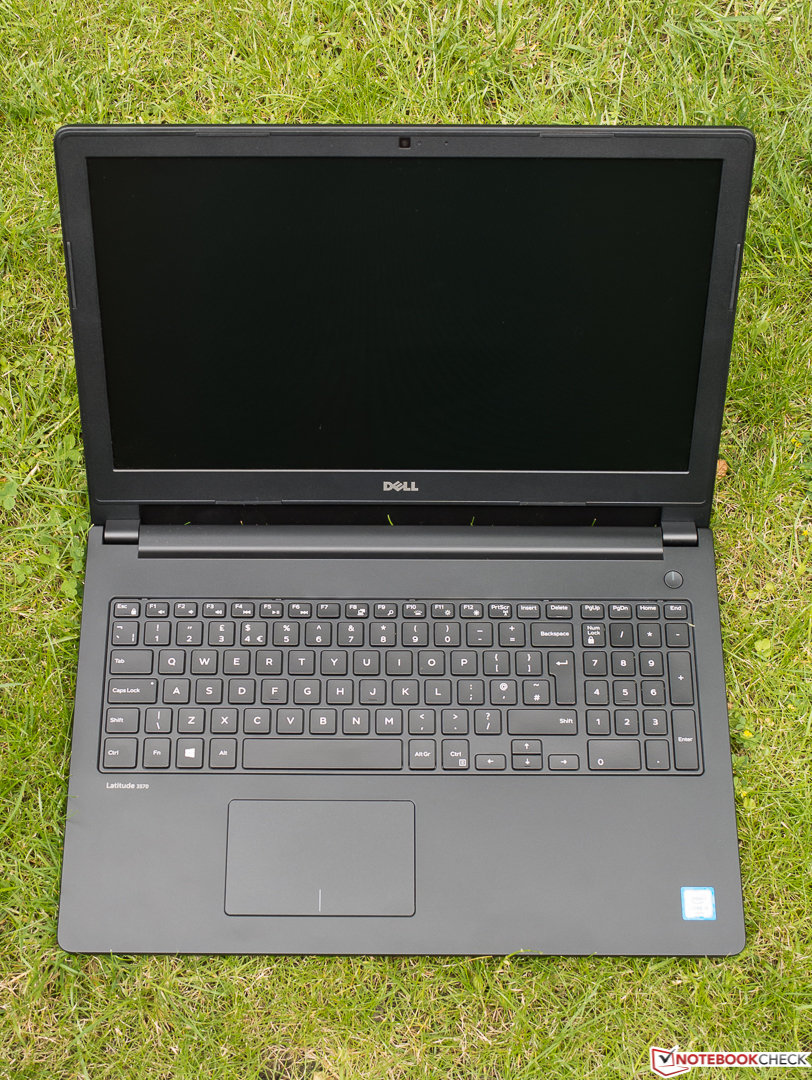
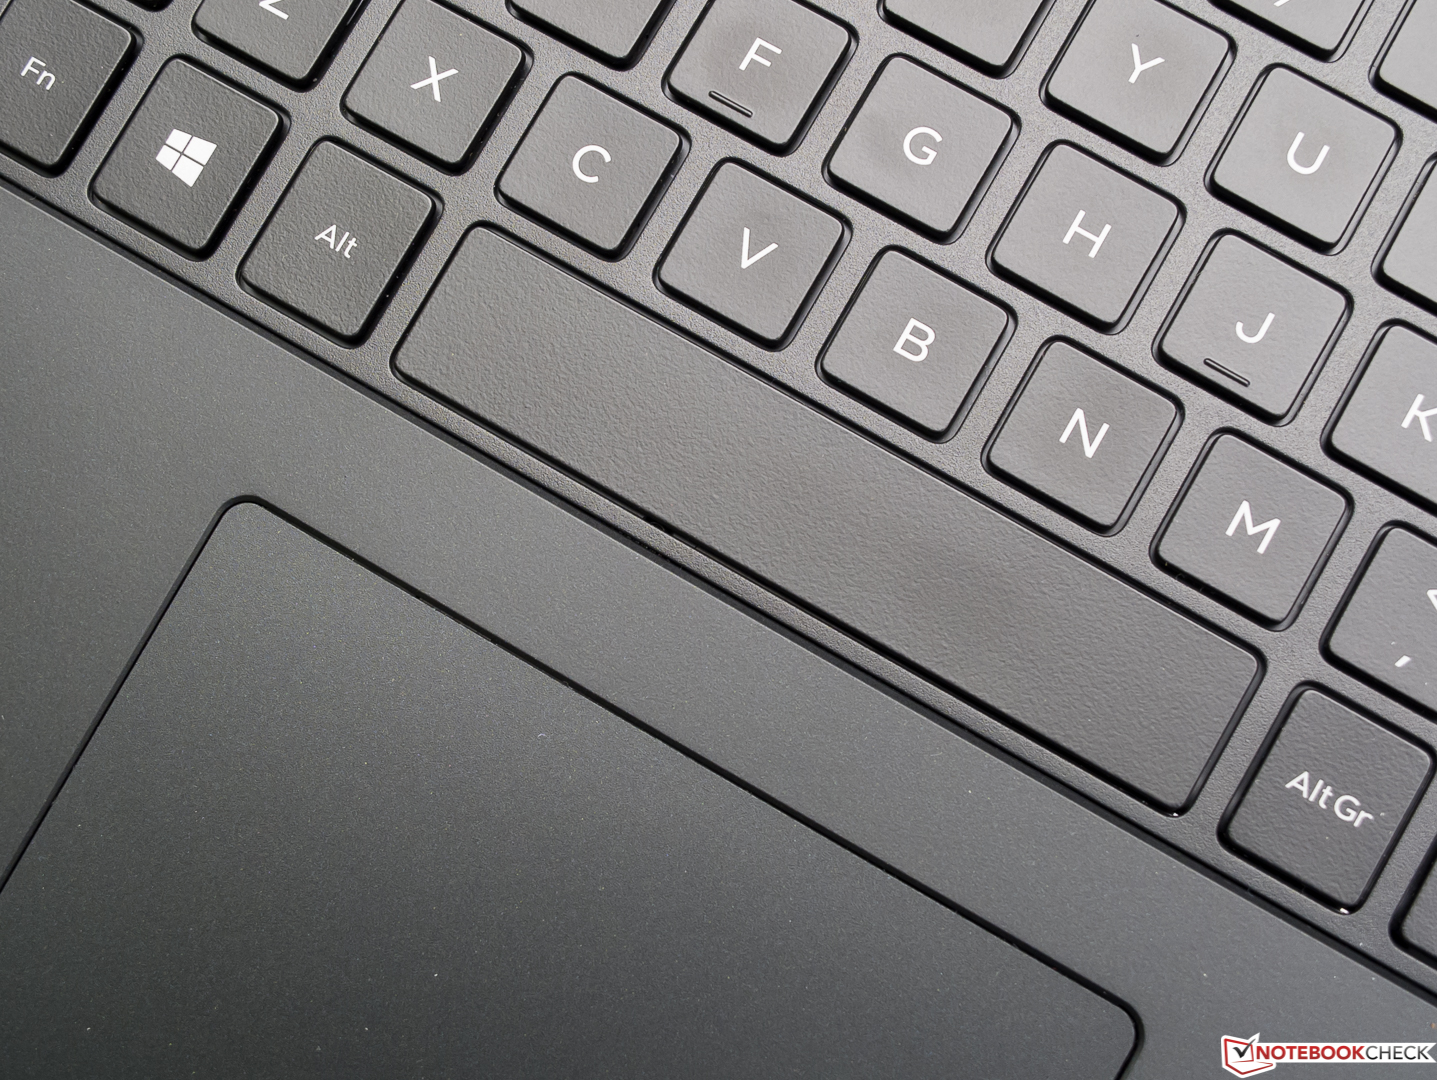
+ 不错的输入设备
+ 固态硬盘
+ 非常安静且发热量低
+ 超长电池续航(65瓦时电池尺寸略大)
Cons
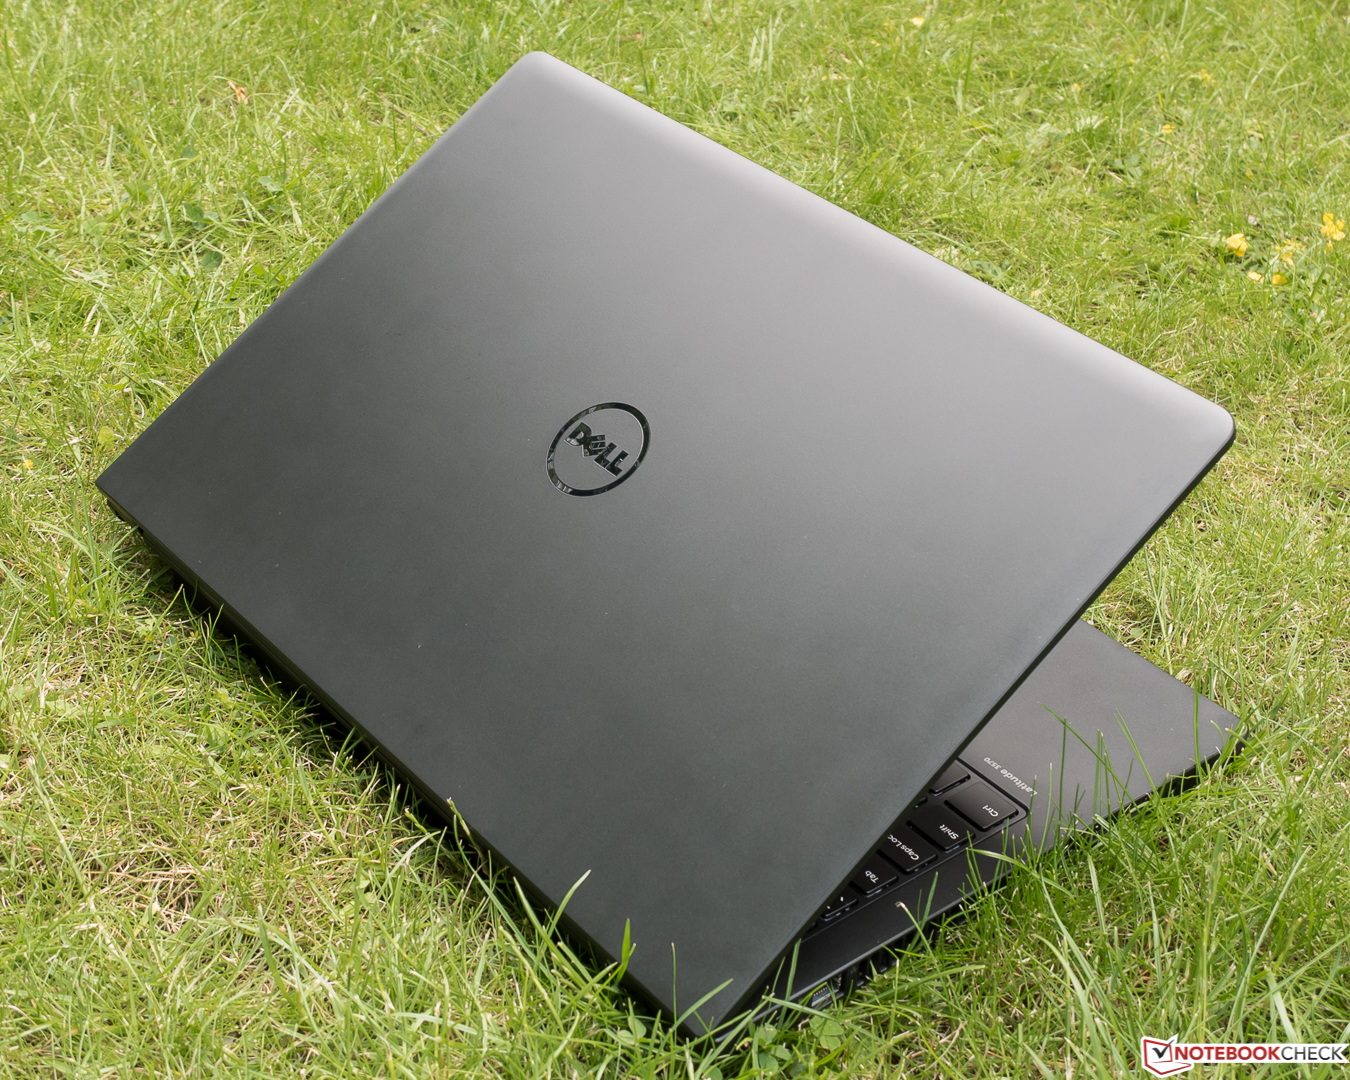
- 无法一只手打开屏幕上盖
- 仅一年质保
- 屏幕亮度和像素密度过低
- 黑值过高,对比度低
- 可视角度范围小
- 色彩还原差
- 屏幕过暗不适合户外使用
- 音响效果差
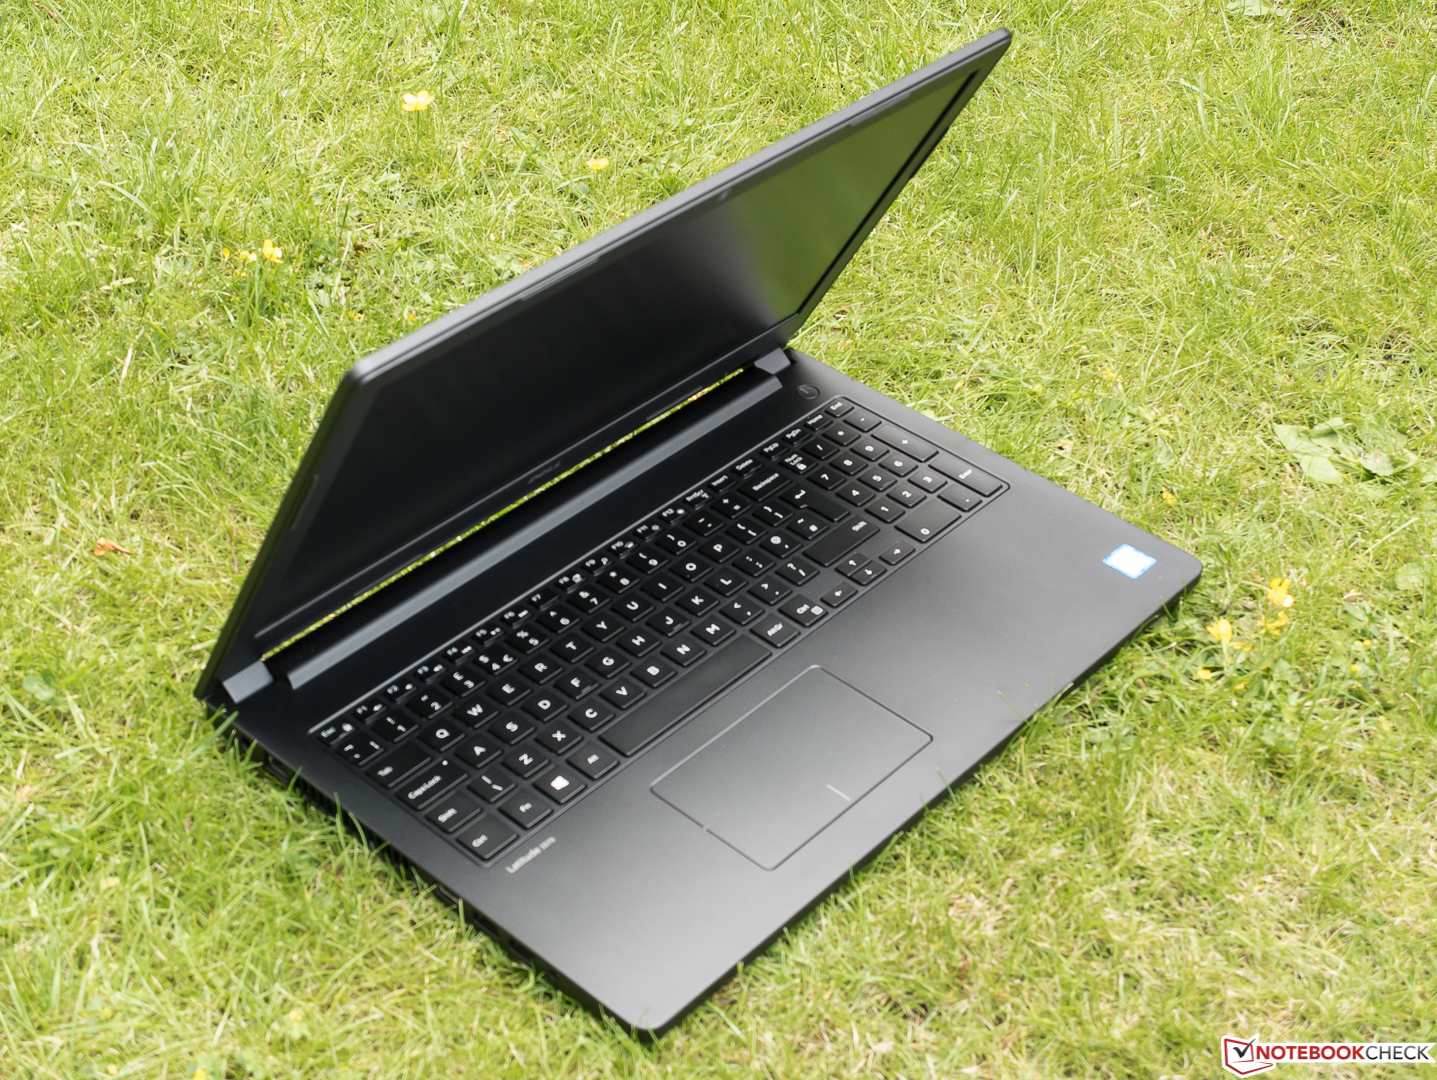
依然在销售中的戴尔Latitude 15-3570,特别是它的入门机型,性价比非常高。起售价419欧元(约3098人民币),它的优秀机身和不错输入设备都让人无可挑剔。不过,我们的测试机在屏幕和音响系统上弱点明显,因此多媒体爱好者应该另谋他就。另一方面,它的技术参数,安静清凉的运行都给了我们很深的印象。如果从机身突出的电池是个问题的话,用户可以选择48瓦时的电池。对安全功能比较重视的用户也会很满意它对TPM和可选指纹识别器的支持。
我们所测试的3570机型由于搭配了固态硬盘在使用流畅性上相比竞争对手优势明显。不过,它的屏幕无法让人满意,特别是较低的分辨率。
注:本文是基于完整评测的缩减版本,阅读完整的英文评测,请点击这里。
Dell Latitude 15-3570
- 07/01/2016 v5.1 (old)
Sven Kloevekorn
Office - Weighted Average