惠普 Pavilion 15t-bc200 X7P44AV (7700HQ, 超高清, GTX 1050) 笔记本电脑简短评测
| SD Card Reader | |
| average JPG Copy Test (av. of 3 runs) | |
| Dell XPS 15 9560 (i7-7700HQ, UHD) | |
| HP Pavilion 15t-X7P42AV | |
| HP Pavilion 15t-bc200 X7P44AV | |
| Lenovo ThinkPad E570-20H6S00000 | |
| Acer Aspire VN7-593G-73HP V15 Nitro BE | |
| maximum AS SSD Seq Read Test (1GB) | |
| Dell XPS 15 9560 (i7-7700HQ, UHD) | |
| HP Pavilion 15t-bc200 X7P44AV | |
| HP Pavilion 15t-X7P42AV | |
| Lenovo ThinkPad E570-20H6S00000 | |
| Acer Aspire VN7-593G-73HP V15 Nitro BE | |
| |||||||||||||||||||||||||
Brightness Distribution: 87 %
Center on Battery: 259 cd/m²
Contrast: 508:1 (Black: 0.51 cd/m²)
ΔE ColorChecker Calman: 3.9 | ∀{0.5-29.43 Ø4.71}
ΔE Greyscale Calman: 4.5 | ∀{0.09-98 Ø4.96}
94.1% sRGB (Calman 2D)
59.5% AdobeRGB 1998 (Argyll 1.6.3 3D)
64.8% AdobeRGB 1998 (Argyll 3D)
94.4% sRGB (Argyll 3D)
63% Display P3 (Argyll 3D)
Gamma: 2.43
CCT: 7257 K
| HP Pavilion 15t-bc200 X7P44AV LGD04D4, , 15.6", 3840x2160 | Dell XPS 15 9560 (i7-7700HQ, UHD) IGZO IPS, 15.6", 3840x2160 | HP Pavilion 15t-X7P42AV AU Optronics AUO41ED, IPS, 15.6", 1920x1080 | Acer Aspire VN7-593G-73HP V15 Nitro BE LG Display LP156WF6-SPP1, AH-IPS, Normally Black, Transmissive, 15.6", 1920x1080 | Lenovo ThinkPad E570-20H6S00000 AUO B156HAN04.4, IPS LED, 15.6", 1920x1080 | |
|---|---|---|---|---|---|
| Display | 34% | -40% | -3% | -39% | |
| Display P3 Coverage (%) | 63 | 89.7 42% | 38.03 -40% | 65.8 4% | 38.65 -39% |
| sRGB Coverage (%) | 94.4 | 100 6% | 56.5 -40% | 85.1 -10% | 58 -39% |
| AdobeRGB 1998 Coverage (%) | 64.8 | 100 54% | 39.29 -39% | 62.2 -4% | 39.94 -38% |
| Response Times | -73% | -28% | -36% | -25% | |
| Response Time Grey 50% / Grey 80% * (ms) | 30.4 ? | 57.2 ? -88% | 44.4 ? -46% | 41 ? -35% | 44.8 ? -47% |
| Response Time Black / White * (ms) | 24.8 ? | 39.2 ? -58% | 27.2 ? -10% | 34 ? -37% | 25.6 ? -3% |
| PWM Frequency (Hz) | 962 | ||||
| Screen | 19% | -36% | 12% | 6% | |
| Brightness middle (cd/m²) | 259 | 370.1 43% | 209.7 -19% | 322 24% | 242 -7% |
| Brightness (cd/m²) | 255 | 356 40% | 193 -24% | 297 16% | 243 -5% |
| Brightness Distribution (%) | 87 | 87 0% | 75 -14% | 86 -1% | 75 -14% |
| Black Level * (cd/m²) | 0.51 | 0.37 27% | 0.19 63% | 0.31 39% | 0.24 53% |
| Contrast (:1) | 508 | 1000 97% | 1104 117% | 1039 105% | 1008 98% |
| Colorchecker dE 2000 * | 3.9 | 5.3 -36% | 7.8 -100% | 4.73 -21% | 4.65 -19% |
| Colorchecker dE 2000 max. * | 6.9 | 9.9 -43% | 24.1 -249% | 12.37 -79% | 9.64 -40% |
| Greyscale dE 2000 * | 4.5 | 4.6 -2% | 7.3 -62% | 2.99 34% | 3.39 25% |
| Gamma | 2.43 91% | 2.31 95% | 2.39 92% | 2.32 95% | 2.7 81% |
| CCT | 7257 90% | 6284 103% | 5771 113% | 6905 94% | 6246 104% |
| Color Space (Percent of AdobeRGB 1998) (%) | 59.5 | 88.3 48% | 39.3 -34% | 56 -6% | 36.69 -38% |
| Color Space (Percent of sRGB) (%) | 100 | 56.5 | 85 | 57.66 | |
| Total Average (Program / Settings) | -7% /
9% | -35% /
-36% | -9% /
2% | -19% /
-8% |
* ... smaller is better
Display Response Times
| ↔ Response Time Black to White | ||
|---|---|---|
| 24.8 ms ... rise ↗ and fall ↘ combined | ↗ 10 ms rise | 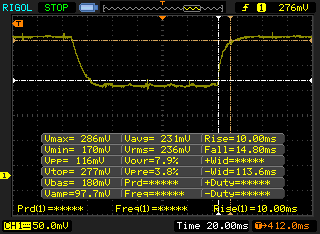 |
| ↘ 14.8 ms fall | ||
| The screen shows good response rates in our tests, but may be too slow for competitive gamers. In comparison, all tested devices range from 0.1 (minimum) to 240 (maximum) ms. » 58 % of all devices are better. This means that the measured response time is worse than the average of all tested devices (19.8 ms). | ||
| ↔ Response Time 50% Grey to 80% Grey | ||
| 30.4 ms ... rise ↗ and fall ↘ combined | ↗ 12.4 ms rise | 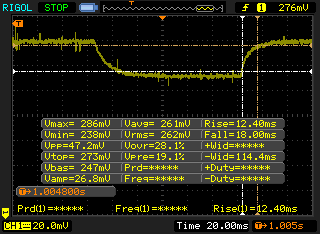 |
| ↘ 18 ms fall | ||
| The screen shows slow response rates in our tests and will be unsatisfactory for gamers. In comparison, all tested devices range from 0.165 (minimum) to 636 (maximum) ms. » 41 % of all devices are better. This means that the measured response time is similar to the average of all tested devices (31 ms). | ||
Screen Flickering / PWM (Pulse-Width Modulation)
| Screen flickering / PWM not detected | 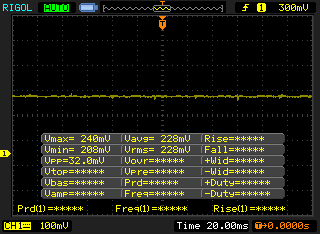 | ||
In comparison: 52 % of all tested devices do not use PWM to dim the display. If PWM was detected, an average of 7754 (minimum: 5 - maximum: 343500) Hz was measured. | |||
| Cinebench R11.5 - CPU Multi 64Bit | |
| Dell XPS 15 9560 (i7-7700HQ, UHD) | |
| HP Pavilion 15t-bc200 X7P44AV | |
| HP Pavilion 15t-X7P42AV | |
| wPrime 2.10 - 1024m | |
| HP Pavilion 15t-bc200 X7P44AV | |
| HP Pavilion 15t-X7P42AV | |
| Dell XPS 15 9560 (i7-7700HQ, UHD) | |
* ... smaller is better
| PCMark 8 | |
| Home Score Accelerated v2 | |
| HP Pavilion 15t-X7P42AV | |
| Dell XPS 15 9560 (i7-7700HQ, UHD) | |
| Lenovo ThinkPad E570-20H6S00000 | |
| HP Pavilion 15t-bc200 X7P44AV | |
| Work Score Accelerated v2 | |
| Lenovo ThinkPad E570-20H6S00000 | |
| Dell XPS 15 9560 (i7-7700HQ, UHD) | |
| HP Pavilion 15t-X7P42AV | |
| HP Pavilion 15t-bc200 X7P44AV | |
| Creative Score Accelerated v2 | |
| HP Pavilion 15t-X7P42AV | |
| Dell XPS 15 9560 (i7-7700HQ, UHD) | |
| HP Pavilion 15t-bc200 X7P44AV | |
| PCMark 8 Home Score Accelerated v2 | 3502 points | |
| PCMark 8 Creative Score Accelerated v2 | 5007 points | |
| PCMark 8 Work Score Accelerated v2 | 2351 points | |
Help | ||
| HP Pavilion 15t-bc200 X7P44AV Intel SSD 600p SSDPEKKW256G7 | Dell XPS 15 9560 (i7-7700HQ, UHD) Lite-On CX2-8B512-Q11 | HP Pavilion 15t-X7P42AV Samsung CM871a MZNTY128HDHP | Acer Aspire VN7-593G-73HP V15 Nitro BE Seagate Mobile HDD 1TB ST1000LM035 | Lenovo ThinkPad E570-20H6S00000 Toshiba THNSF5256GPUK | |
|---|---|---|---|---|---|
| CrystalDiskMark 3.0 | 75% | -20% | -92% | 14% | |
| Read Seq (MB/s) | 1115 | 1684 51% | 522 -53% | 120.9 -89% | 1140 2% |
| Write Seq (MB/s) | 311 | 1106 256% | 476.6 53% | 101.8 -67% | 468.1 51% |
| Read 512 (MB/s) | 706 | 977 38% | 399.7 -43% | 37.83 -95% | 759 8% |
| Write 512 (MB/s) | 472.3 | 1119 137% | 185.4 -61% | 84.4 -82% | 414 -12% |
| Read 4k (MB/s) | 31.97 | 45.14 41% | 33.12 4% | 0.473 -99% | 34.3 7% |
| Write 4k (MB/s) | 135.1 | 134.1 -1% | 89.8 -34% | 0.313 -100% | 123.4 -9% |
| Read 4k QD32 (MB/s) | 288.3 | 509 77% | 400.9 39% | 1.133 -100% | 530 84% |
| Write 4k QD32 (MB/s) | 405.5 | 398.1 -2% | 140.2 -65% | 0.274 -100% | 319.2 -21% |

| 3DMark 11 | |
| 1280x720 Performance GPU | |
| Acer Aspire VN7-593G-73HP V15 Nitro BE | |
| HP Pavilion 15t-bc200 X7P44AV | |
| HP Pavilion 15t-X7P42AV | |
| Lenovo ThinkPad E570-20H6S00000 | |
| 1280x720 Performance Combined | |
| Acer Aspire VN7-593G-73HP V15 Nitro BE | |
| HP Pavilion 15t-X7P42AV | |
| HP Pavilion 15t-bc200 X7P44AV | |
| Lenovo ThinkPad E570-20H6S00000 | |
| 3DMark 06 Standard Score | 27237 points | |
| 3DMark 11 Performance | 7735 points | |
| 3DMark Ice Storm Standard Score | 35025 points | |
| 3DMark Cloud Gate Standard Score | 15911 points | |
| 3DMark Fire Strike Score | 5373 points | |
Help | ||
| Doom - 3840x2160 High Preset AA:FX (sort by value) | |
| HP Pavilion 15t-bc200 X7P44AV | |
| Dell XPS 15 9560 (i7-7700HQ, UHD) | |
| Rise of the Tomb Raider - 3840x2160 High Preset AA:FX AF:4x (sort by value) | |
| HP Pavilion 15t-bc200 X7P44AV | |
| Dell XPS 15 9560 (i7-7700HQ, UHD) | |
| Batman: Arkham Knight - 3840x2160 High / On (Interactive Smoke & Paper Debris Off) AA:SM AF:8x (sort by value) | |
| HP Pavilion 15t-bc200 X7P44AV | |
| Dell XPS 15 9560 (i7-7700HQ, UHD) | |
| low | med. | high | ultra | 4K | |
|---|---|---|---|---|---|
| Batman: Arkham Knight (2015) | 16 | ||||
| Rise of the Tomb Raider (2016) | 14 | ||||
| Doom (2016) | 18 |
Noise level
| Idle |
| 32.3 / 32.3 / 32.3 dB(A) |
| Load |
| 43.2 / 45.2 dB(A) |
 | ||
30 dB silent 40 dB(A) audible 50 dB(A) loud |
||
min: | ||
| HP Pavilion 15t-bc200 X7P44AV GeForce GTX 1050 Mobile, i7-7700HQ, Intel SSD 600p SSDPEKKW256G7 | Dell XPS 15 9560 (i7-7700HQ, UHD) GeForce GTX 1050 Mobile, i7-7700HQ, Lite-On CX2-8B512-Q11 | HP Pavilion 15t-X7P42AV GeForce GTX 1050 Mobile, i7-7700HQ, Samsung CM871a MZNTY128HDHP | Acer Aspire VN7-593G-73HP V15 Nitro BE GeForce GTX 1060 Mobile, i7-7700HQ, Seagate Mobile HDD 1TB ST1000LM035 | Lenovo ThinkPad E570-20H6S00000 GeForce GTX 950M, i5-7200U, Toshiba THNSF5256GPUK | |
|---|---|---|---|---|---|
| Noise | 2% | -2% | 2% | 10% | |
| off / environment * (dB) | 28.9 | 28.4 2% | 29.3 -1% | 30.4 -5% | 29 -0% |
| Idle Minimum * (dB) | 32.3 | 29 10% | 32.3 -0% | 30.9 4% | 29 10% |
| Idle Average * (dB) | 32.3 | 29 10% | 32.3 -0% | 30.9 4% | 29 10% |
| Idle Maximum * (dB) | 32.3 | 32.2 -0% | 32.4 -0% | 31.5 2% | 29 10% |
| Load Average * (dB) | 43.2 | 47.1 -9% | 44.4 -3% | 40.7 6% | 34.3 21% |
| Load Maximum * (dB) | 45.2 | 47.1 -4% | 49.2 -9% | 43.9 3% | 40.1 11% |
| Witcher 3 ultra * (dB) | 52 | 45.5 |
* ... smaller is better
(±) The maximum temperature on the upper side is 42 °C / 108 F, compared to the average of 36.8 °C / 98 F, ranging from 21 to 71 °C for the class Multimedia.
(+) The bottom heats up to a maximum of 34.8 °C / 95 F, compared to the average of 39.1 °C / 102 F
(+) In idle usage, the average temperature for the upper side is 22.7 °C / 73 F, compared to the device average of 31.3 °C / 88 F.
(±) The palmrests and touchpad can get very hot to the touch with a maximum of 37.2 °C / 99 F.
(-) The average temperature of the palmrest area of similar devices was 28.7 °C / 83.7 F (-8.5 °C / -15.3 F).
HP Pavilion 15t-bc200 X7P44AV audio analysis
(±) | speaker loudness is average but good (74.1 dB)
Bass 100 - 315 Hz
(-) | nearly no bass - on average 19.5% lower than median
(±) | linearity of bass is average (8.9% delta to prev. frequency)
Mids 400 - 2000 Hz
(±) | higher mids - on average 5.6% higher than median
(±) | linearity of mids is average (11% delta to prev. frequency)
Highs 2 - 16 kHz
(+) | balanced highs - only 3.4% away from median
(±) | linearity of highs is average (8.8% delta to prev. frequency)
Overall 100 - 16.000 Hz
(-) | overall sound is not linear (32.1% difference to median)
Compared to same class
» 97% of all tested devices in this class were better, 1% similar, 2% worse
» The best had a delta of 5%, average was 17%, worst was 45%
Compared to all devices tested
» 91% of all tested devices were better, 2% similar, 7% worse
» The best had a delta of 4%, average was 23%, worst was 134%
Dell XPS 15 9560 (i7-7700HQ, UHD) audio analysis
(-) | not very loud speakers (70.9 dB)
Bass 100 - 315 Hz
(±) | reduced bass - on average 12.9% lower than median
(±) | linearity of bass is average (14.3% delta to prev. frequency)
Mids 400 - 2000 Hz
(+) | balanced mids - only 3.5% away from median
(±) | linearity of mids is average (8.9% delta to prev. frequency)
Highs 2 - 16 kHz
(+) | balanced highs - only 2.3% away from median
(±) | linearity of highs is average (7.3% delta to prev. frequency)
Overall 100 - 16.000 Hz
(±) | linearity of overall sound is average (16.2% difference to median)
Compared to same class
» 41% of all tested devices in this class were better, 7% similar, 51% worse
» The best had a delta of 5%, average was 17%, worst was 45%
Compared to all devices tested
» 26% of all tested devices were better, 6% similar, 68% worse
» The best had a delta of 4%, average was 23%, worst was 134%
| Off / Standby | |
| Idle | |
| Load |
|
Key:
min: | |
| HP Pavilion 15t-bc200 X7P44AV i7-7700HQ, GeForce GTX 1050 Mobile, Intel SSD 600p SSDPEKKW256G7, , 3840x2160, 15.6" | Dell XPS 15 9560 (i7-7700HQ, UHD) i7-7700HQ, GeForce GTX 1050 Mobile, Lite-On CX2-8B512-Q11, IGZO IPS, 3840x2160, 15.6" | HP Pavilion 15t-X7P42AV i7-7700HQ, GeForce GTX 1050 Mobile, Samsung CM871a MZNTY128HDHP, IPS, 1920x1080, 15.6" | Acer Aspire VN7-593G-73HP V15 Nitro BE i7-7700HQ, GeForce GTX 1060 Mobile, Seagate Mobile HDD 1TB ST1000LM035, AH-IPS, Normally Black, Transmissive, 1920x1080, 15.6" | Lenovo ThinkPad E570-20H6S00000 i5-7200U, GeForce GTX 950M, Toshiba THNSF5256GPUK, IPS LED, 1920x1080, 15.6" | |
|---|---|---|---|---|---|
| Power Consumption | -11% | 19% | 7% | 54% | |
| Idle Minimum * (Watt) | 11.4 | 11.9 -4% | 8.29 27% | 7.2 37% | 2.8 75% |
| Idle Average * (Watt) | 14.3 | 17.1 -20% | 8.9 38% | 10.5 27% | 6.3 56% |
| Idle Maximum * (Watt) | 14.3 | 17.3 -21% | 10.2 29% | 16 -12% | 6.9 52% |
| Load Average * (Watt) | 82.7 | 94.7 -15% | 77.1 7% | 82 1% | 51.6 38% |
| Load Maximum * (Watt) | 131.1 | 122 7% | 136.6 -4% | 155 -18% | 69.7 47% |
| Witcher 3 ultra * (Watt) | 104.8 | 124 |
* ... smaller is better
| HP Pavilion 15t-bc200 X7P44AV i7-7700HQ, GeForce GTX 1050 Mobile, 63.3 Wh | Dell XPS 15 9560 (i7-7700HQ, UHD) i7-7700HQ, GeForce GTX 1050 Mobile, 97 Wh | HP Pavilion 15t-X7P42AV i7-7700HQ, GeForce GTX 1050 Mobile, 63.3 Wh | Acer Aspire VN7-593G-73HP V15 Nitro BE i7-7700HQ, GeForce GTX 1060 Mobile, 69 Wh | Lenovo ThinkPad E570-20H6S00000 i5-7200U, GeForce GTX 950M, 41 Wh | |
|---|---|---|---|---|---|
| Battery runtime | 41% | 48% | 28% | 59% | |
| Reader / Idle (h) | 9.2 | 13.9 51% | 16 74% | 8.4 -9% | 14.7 60% |
| WiFi v1.3 (h) | 4.5 | 7.2 60% | 6.5 44% | 6 33% | 7.7 71% |
| Load (h) | 1.5 | 1.7 13% | 1.9 27% | 2.4 60% | 2.2 47% |
Pros
Cons

尽管它的显卡性能不错(这要归功于GTX 1050),处理器的性能也十分优秀。我们在上个月评测的惠普Pavilion 15t仍然有一些尚待解决的弱点,特别是奇怪的硬件驱动带来的不稳定处理器性能,时高时低的运行频率,和脆弱的机身材质。它也搭配了一块十分平庸的屏幕,它色彩平淡且亮度昏暗。不过,在一定程度上,这些问题可以在实惠的定价和不错的电池续航方面得到补偿。
今天的Pavilion 15t(在一定程度上)解决了我们所不满的弱点,包括为它搭配一块色彩绚丽而准确的明亮超高清屏幕。它看起来更加养眼,不过亮度水平依然低于平均水平,对比度也不是特别出色。不过,相比前代机型这仍然是有了长足进步。遗憾的是,这个新特性也有两个新弱点:更短的电池续航和更高的价位。从我们的测试结果来看,它的续航时间缩短了整整两小时到4小时30分(全高清机型为6小时29分),而性价比较高的800美元定价也上涨到了1141美元。更高的价位将会让它和如Dell XPS 15 9560(或无独立显卡的惠普 Spectre x360 15-bl002xx)等机型竞争——它们在对比中占据明显优势。
Pavilion 15t UHD相比同价位机型和同类设备的独特优势屈指可数,而弱点却较多。除此之外,我们所提到的它前代机型的问题仍然存在。脆弱的机身,炙热的温度,一般的输入设备,不便的维护操作等缺陷仍然存在。不过最严重的,可能还是不稳定的处理器性能,惠普仍然需要推出BIOS更新来解决这个问题。
因此,我们并不确定Pavilion 15t UHD适合什么样的用户。相比同类设备它的优势较少,而缺点较多。我们建议读者考虑其他的相似设备;在这个价位上如戴尔 XPS 15,惠普 Spectre,或联想Yoga 720都有更高的性价比。
注:本文是基于完整评测的缩减版本,阅读完整的英文评测,请点击这里。
HP Pavilion 15t-bc200 X7P44AV
- 04/15/2017 v6 (old)
Steve Schardein
Price comparison
