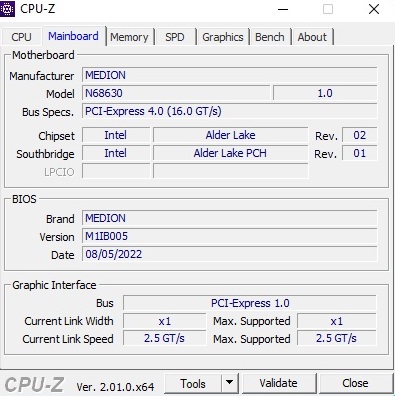
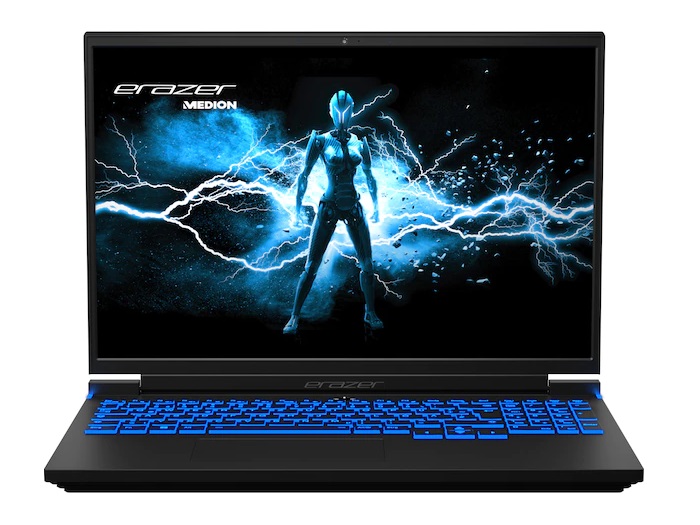
Medion Erazer Major X10笔记本电脑评测。英特尔A730M的首次亮相
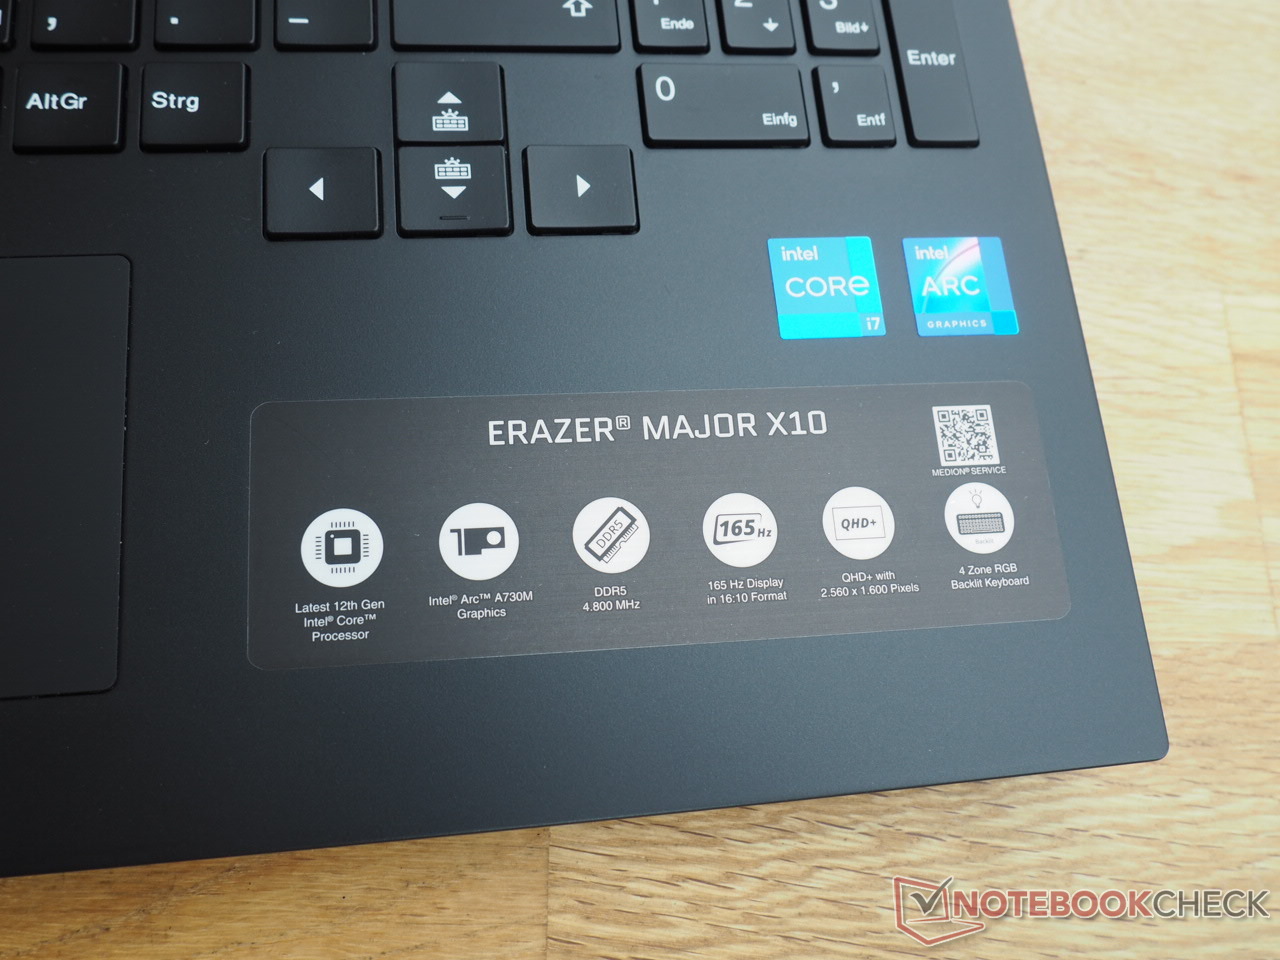
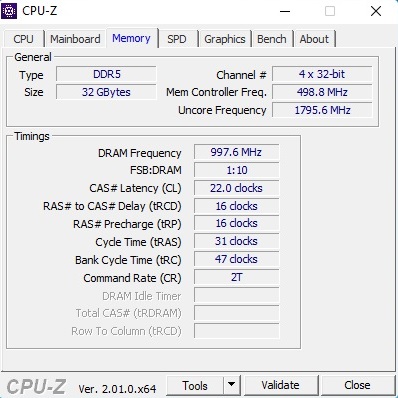
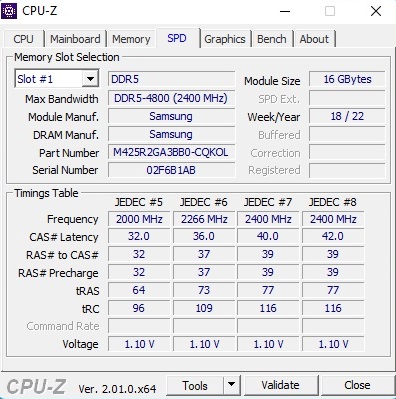
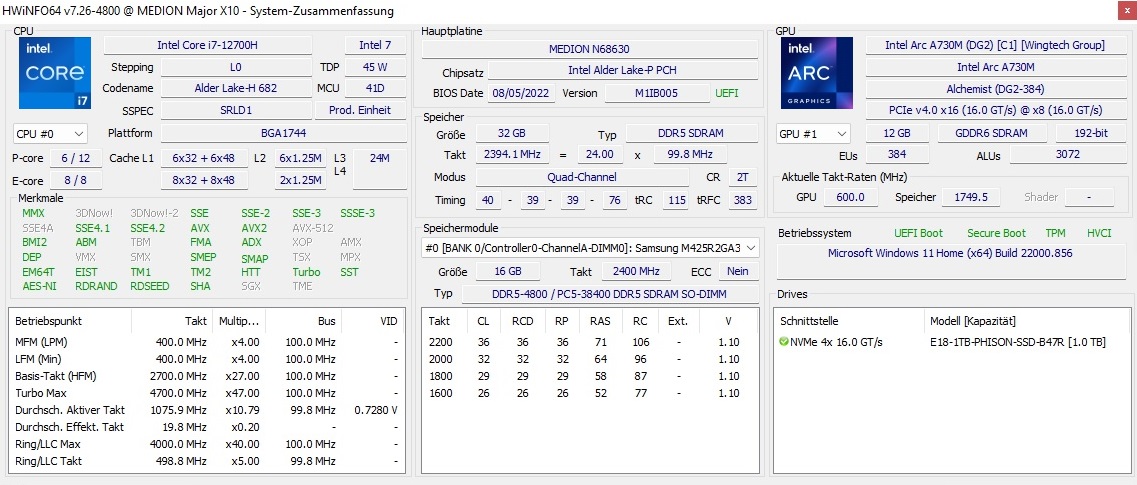
Erazer Major X10的价格约为1,700欧元(1,728美元),可在Medion的在线商店购买。.对于这个价格,你得到的不仅仅是32GB的双通道内存(2 x 16GB DDR5-4800),还有1TB的NVMe存储。这款笔记本电脑采用酷睿i7-12700H,这是一款在游戏笔记本电脑中非常受欢迎的14核处理器。正如一开始提到的,苛刻的图形处理是由英特尔的Arc A730M处理的--一个中档的GPU,主要是为了与 GeForce RTX 3060和 Radeon RX 6600M.这款笔记本电脑还配备了哑光165Hz显示屏,长宽比为16:10,分辨率为2,560 x 1,600。Windows 11家庭版使整个软件包更加完善。
Major X10正在与其他中端游戏笔记本电脑竞争,如华硕TUF F17 FX707Z-HX011W,Acer Nitro 5 AN517-55-738R(两者都有RTX 3060;一个有较高的TGP,另一个有平均的TGP)和HP Omen 16-c0077ng(RX 6600M)。据称较慢的 戴尔 Inspiron 16 Plus 7620配有GeForce RTX 3050 Ti的戴尔Inspiron 16 Plus 7620也同样被列入对比表。我们将在后面的评论中解释原因。
潜在的竞争对手比较
Rating | Date | Model | Weight | Height | Size | Resolution | Price |
|---|---|---|---|---|---|---|---|
| 85 % v7 (old) | 09 / 2022 | Medion Erazer Major X10 i7-12700H, A730M | 2.5 kg | 31 mm | 16.00" | 2560x1600 | |
| 84.1 % v7 (old) | 04 / 2022 | Asus TUF Gaming F17 FX707Z-HX011W i7-12700H, GeForce RTX 3060 Laptop GPU | 2.5 kg | 25 mm | 17.30" | 1920x1080 | |
| 83.9 % v7 (old) | 08 / 2022 | Acer Nitro 5 AN517-55-738R i7-12700H, GeForce RTX 3060 Laptop GPU | 3.1 kg | 28.6 mm | 17.30" | 1920x1080 | |
| 87.4 % v7 (old) | 08 / 2022 | Dell Inspiron 16 Plus 7620 i7-12700H, GeForce RTX 3050 Ti Laptop GPU | 2.1 kg | 18.99 mm | 16.00" | 3072x1920 | |
| 86 % v7 (old) | 04 / 2022 | HP Omen 16-c0077ng R7 5800H, Radeon RX 6600M | 2.3 kg | 26 mm | 16.10" | 2560x1440 |
底盘
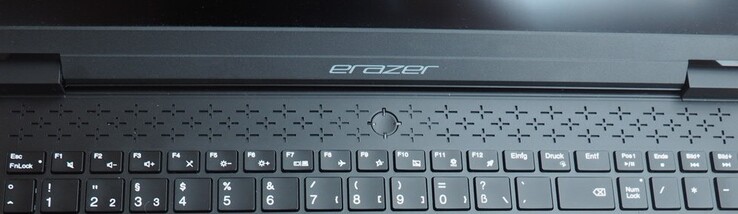
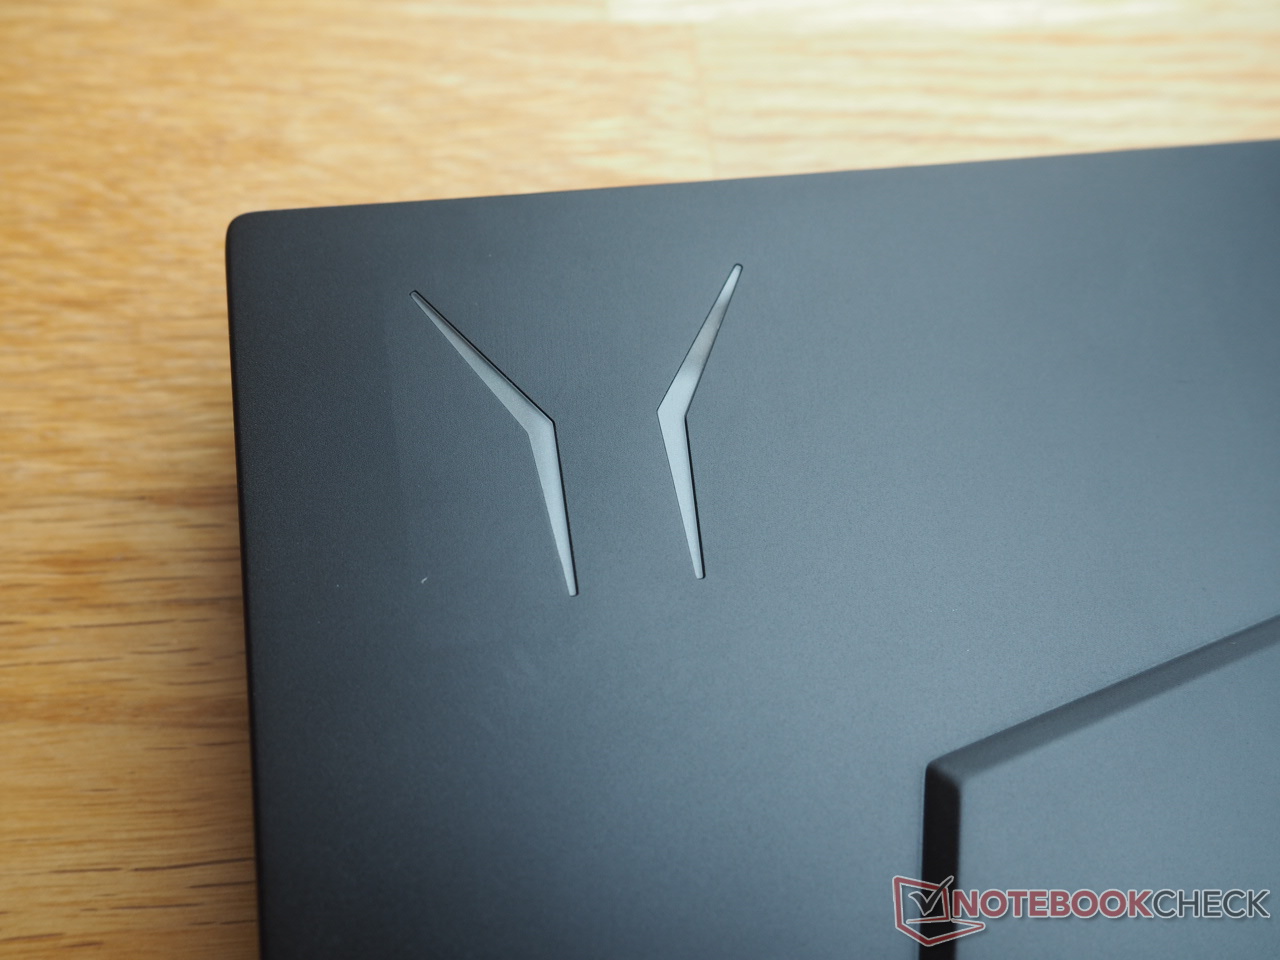
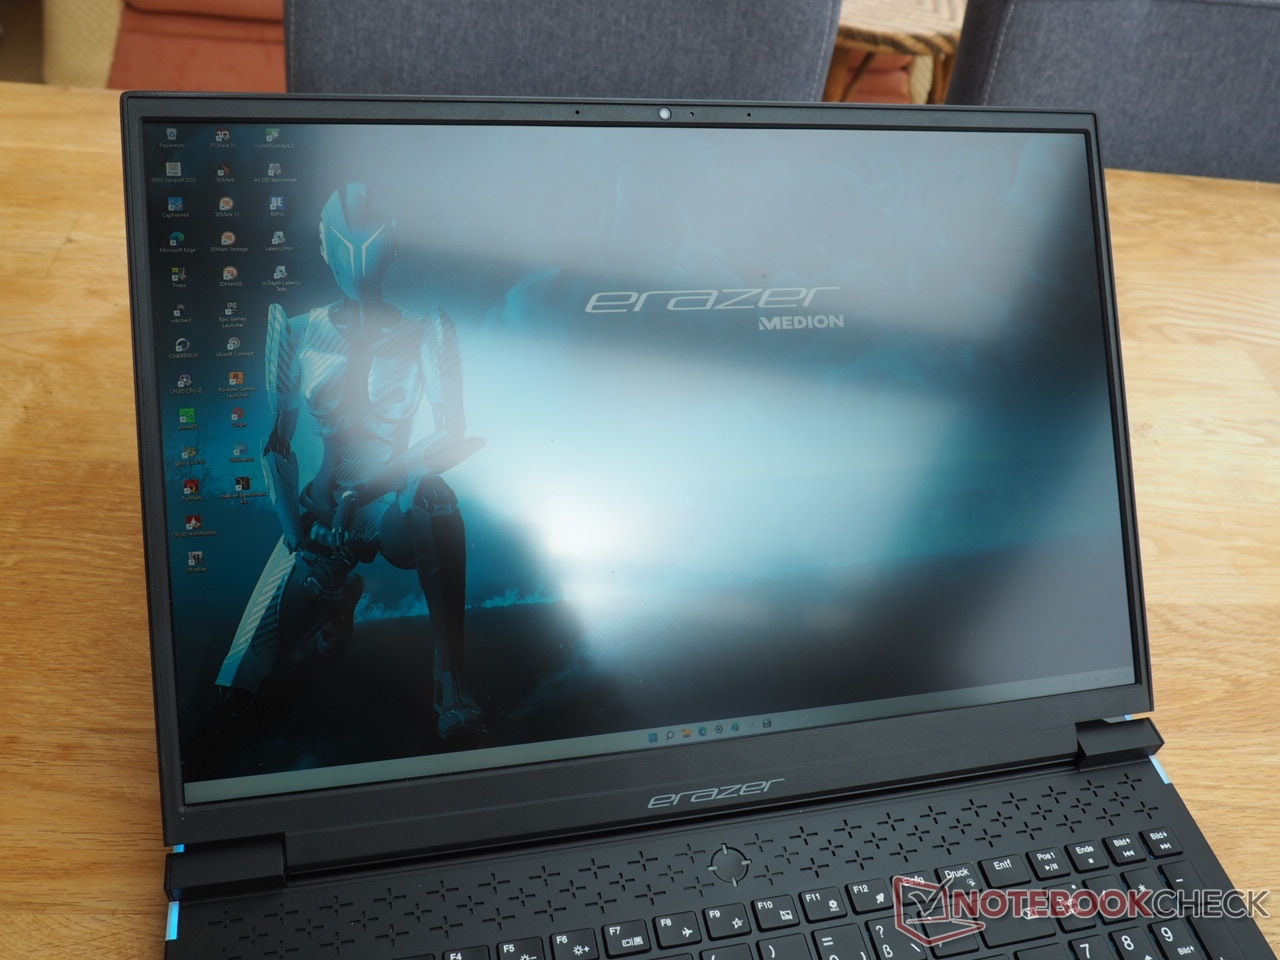
从外观上看,Major X10让我们想起了联想的Legion 系列。Medion公司选择使用哑光的黑色底盘和铝制的盖子。在我们看来,机箱感觉很结实,尽管当你用力时,底座部分肯定会在某些地方弯曲,而且盖子可以更结实一些(就像大多数笔记本电脑的情况一样)。显示器可以打开到180°,这对笔记本电脑来说是相当不寻常的。铰链的工作没有任何问题。例如,该设备可以用一只手轻松打开。Medion公司为这台笔记本电脑配备了许多照明元素,使其对游戏玩家具有吸引力。除了键盘之外,盖子上的标志和两侧后部的十字线在视觉上也很突出。键盘上方的通风口采用了十字线设计,以补充整体的美感。
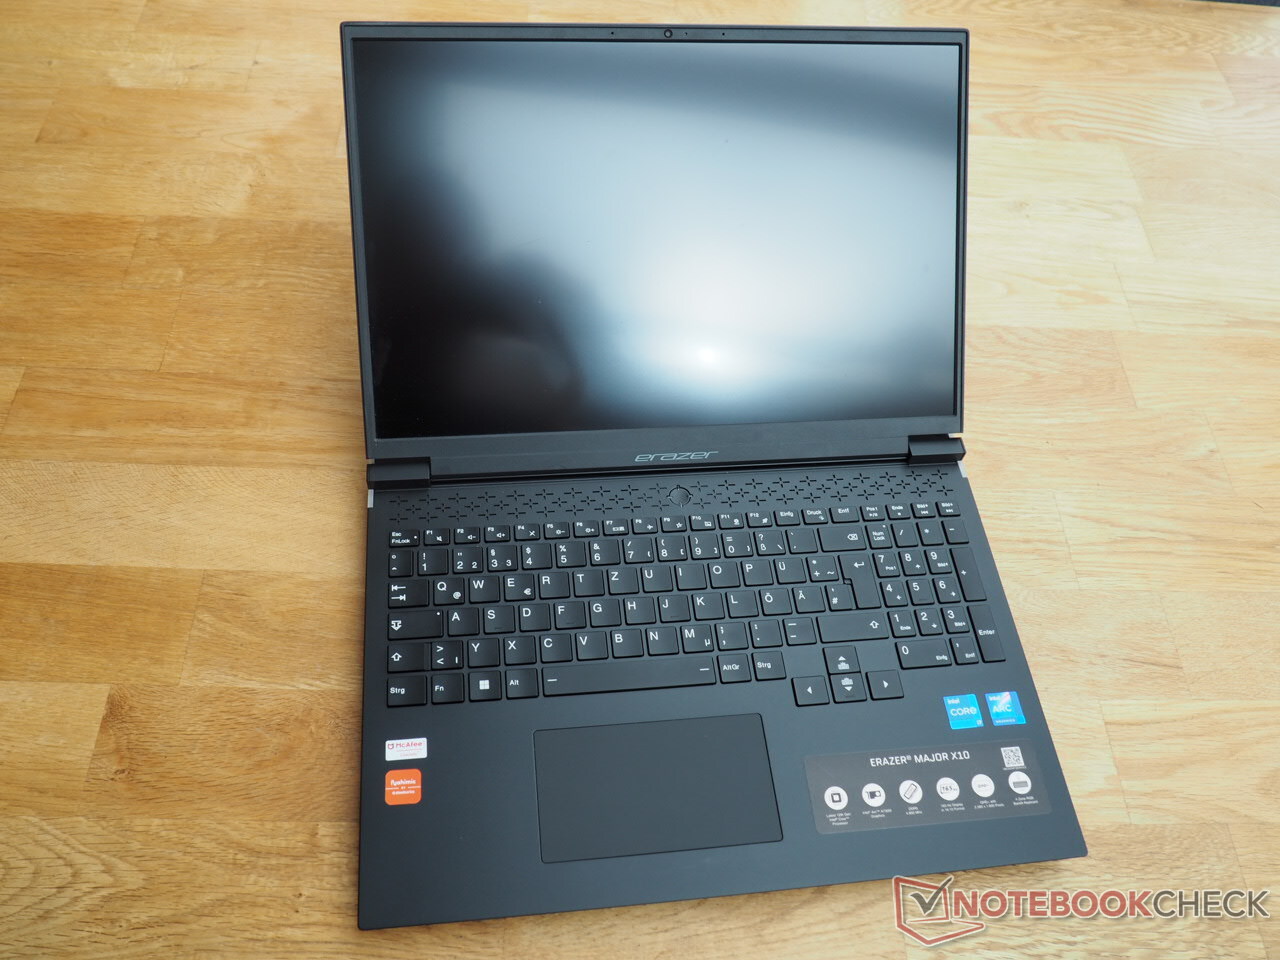
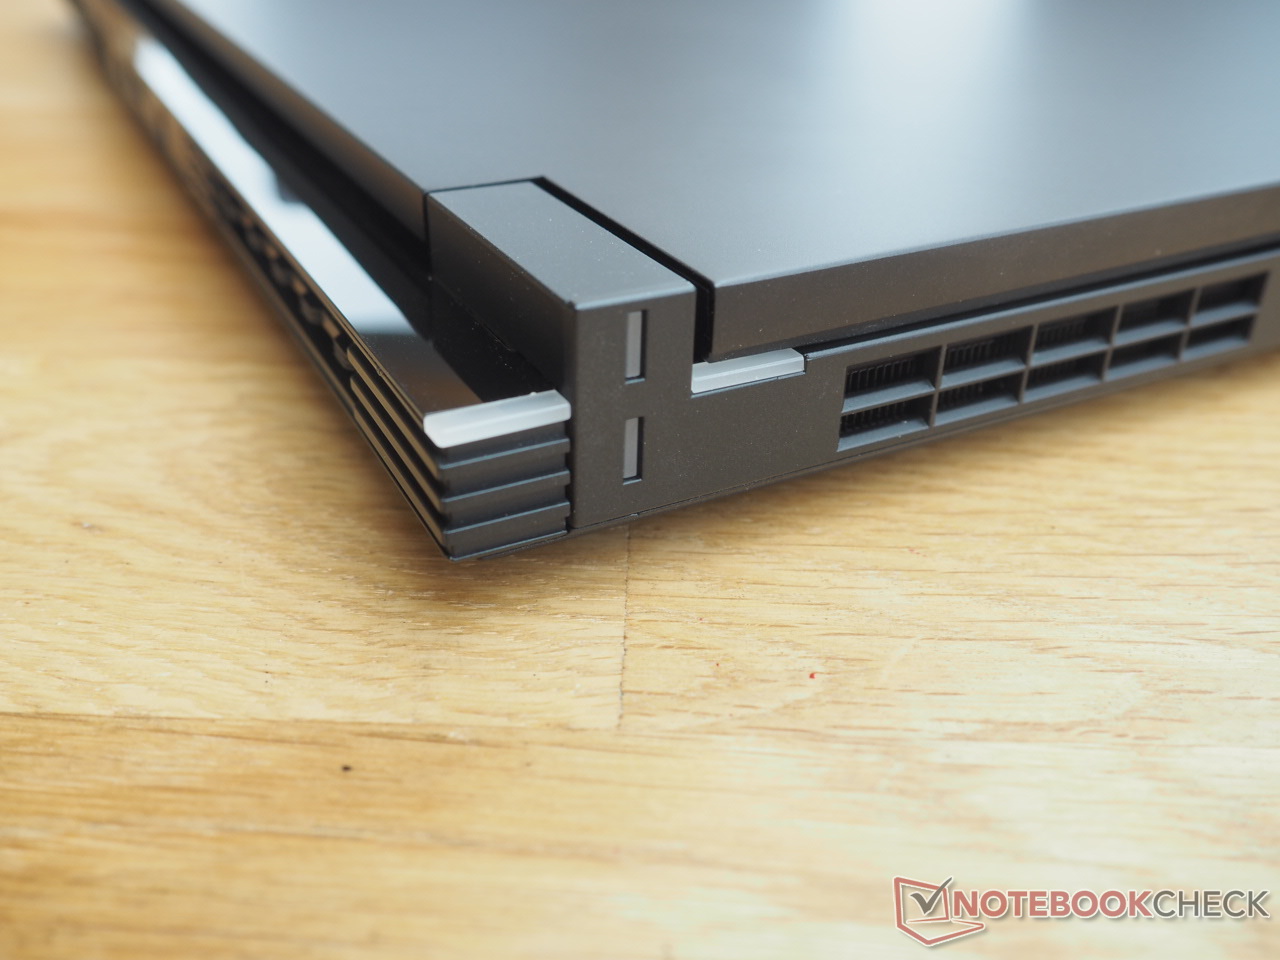
Major X10有一个非常好的配合和完成。在我们的评测单元上,所有的表面都整齐地连接在一起。在2.5公斤(5.5磅),这个16英寸的设备对于游戏笔记本电脑来说既不轻也不特别重。作为比较,稍大的华硕TUF F17和宏碁Nitro 5 AN517分别重2.5公斤(5.5磅)和3.1公斤(6.8磅),而16英寸的竞争对手Omen 16和Inspiron 16 Plus则稍轻一些,分别为2.3公斤(5.1磅)和2.1公斤(4.6磅)。根据制造商的说法,Major X10的厚度为2.7厘米(1.06英寸),不含脚垫,3.1厘米(1.22英寸)。
特点
接口
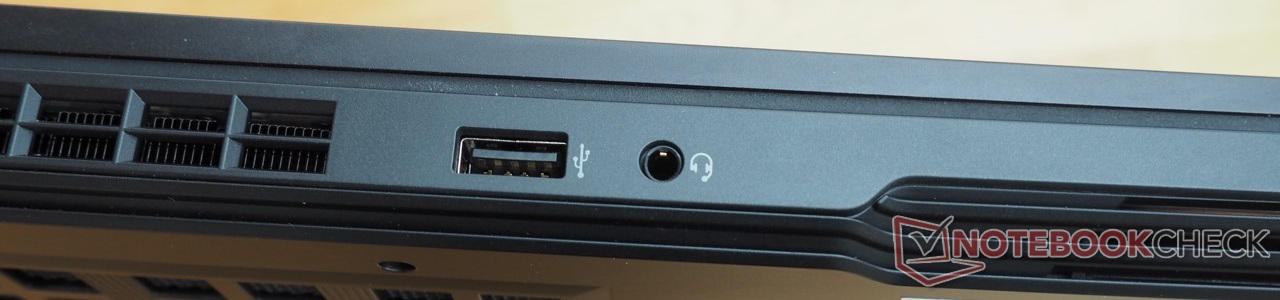
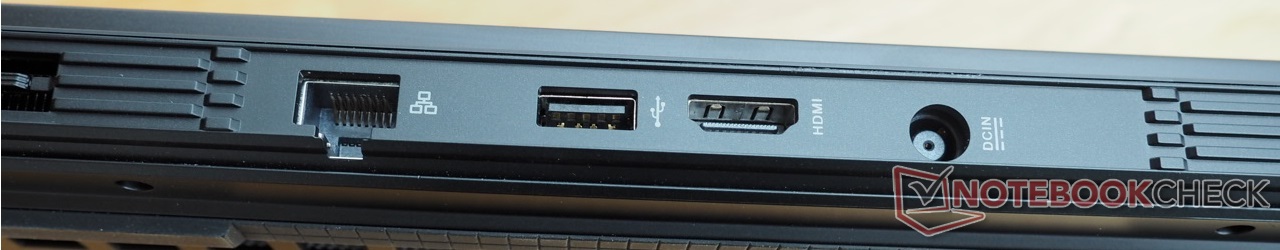
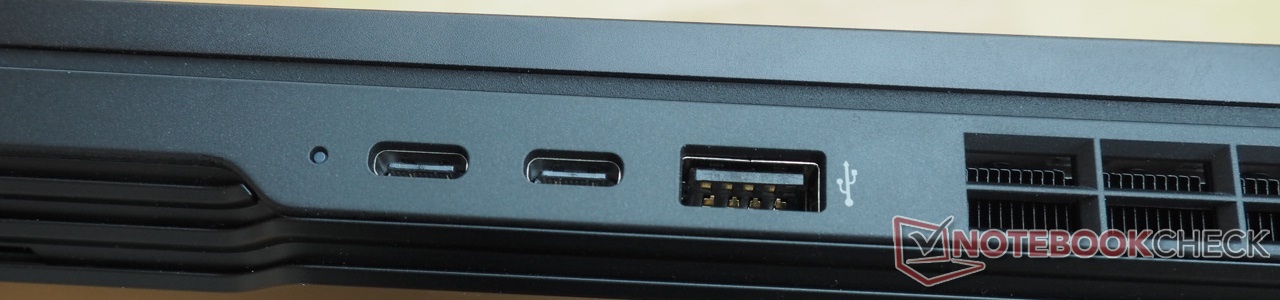
如果你不介意没有Thunderbolt端口和读卡器,你会对笔记本的端口选择感到满意。有三个USB A型接口和两个C型接口(与DisplayPort兼容),除了一个以外,都支持3.2 Gen 2标准。这款笔记本电脑还配备了一个组合音频插孔(耳机和麦克风),一个RJ45以太网端口和一个HDMI 2.0输出。由于最重要的端口位于笔记本电脑的背面,你不必担心在使用外部鼠标进行游戏时,你的行动会受到很大限制。
连接性
在我们的Wi-Fi测试中,没有任何惊喜(笔记本电脑距离我们的参考路由器华硕AXE11000 1米)。该设备内部的英特尔Wi-Fi 6 AX201模块提供了高传输速度,符合预期。
| Networking | |
| iperf3 receive AXE11000 | |
| Medion Erazer Major X10 | |
| Average of class Gaming (680 - 1745, n=94, last 2 years) | |
| Average Intel Wi-Fi 6 AX201 (390 - 1734, n=79) | |
| iperf3 transmit AXE11000 | |
| Medion Erazer Major X10 | |
| Average Intel Wi-Fi 6 AX201 (438 - 1715, n=74) | |
| Average of class Gaming (560 - 1862, n=94, last 2 years) | |
网络摄像头
Medion可以做一个更好的网络摄像头。尽管网络摄像头比许多竞争对手略微清晰和快速,但它在色彩准确性方面有所欠缺,这与许多笔记本电脑上的内置网络摄像头很相似。


辅料
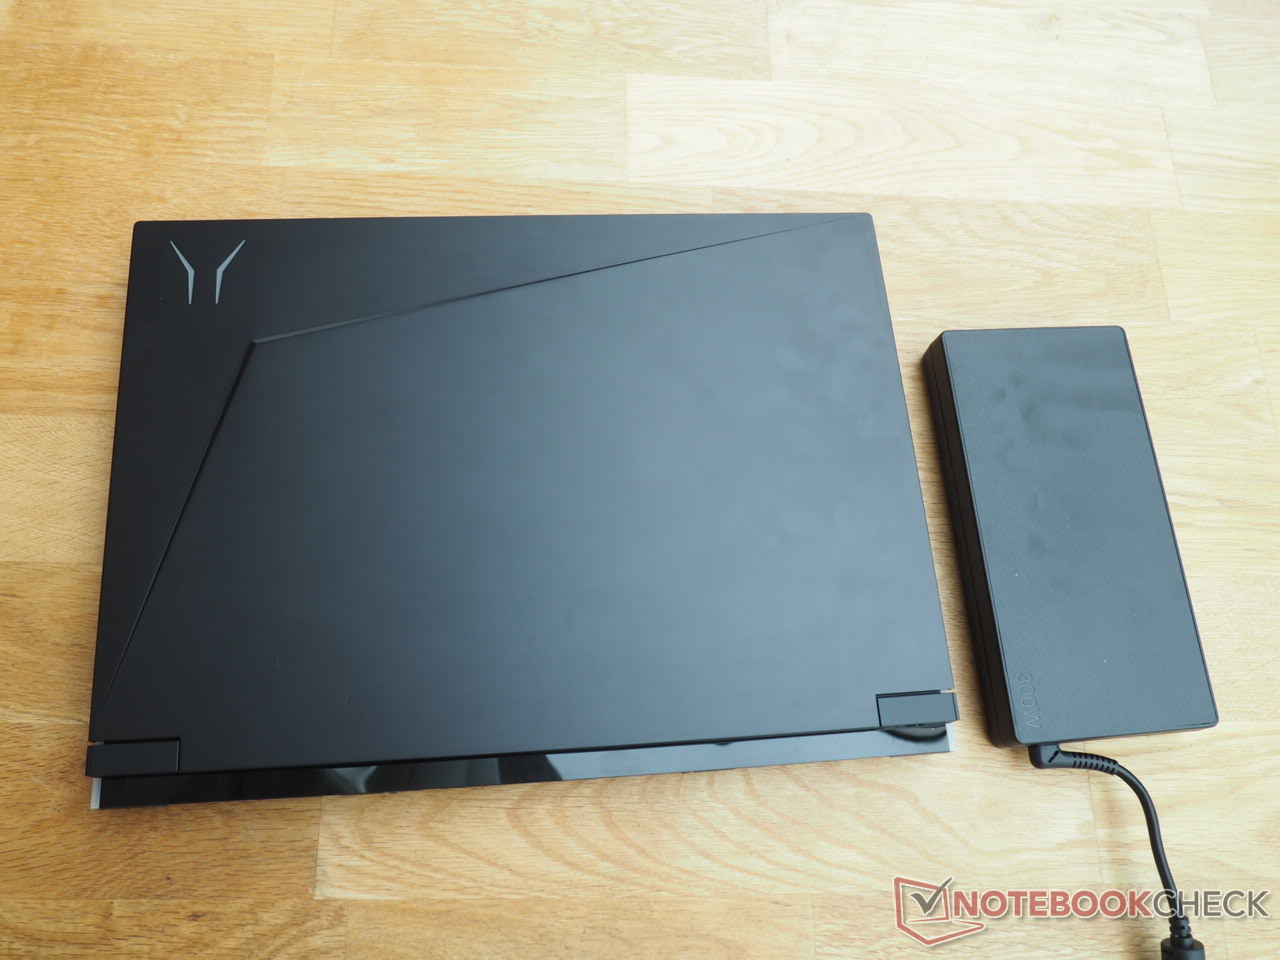
我们的评测装置只配备了一个300瓦的电源,尺寸约为20 x 9 x 2厘米(7.9 x 3.5 x 0.8英寸)。
维护
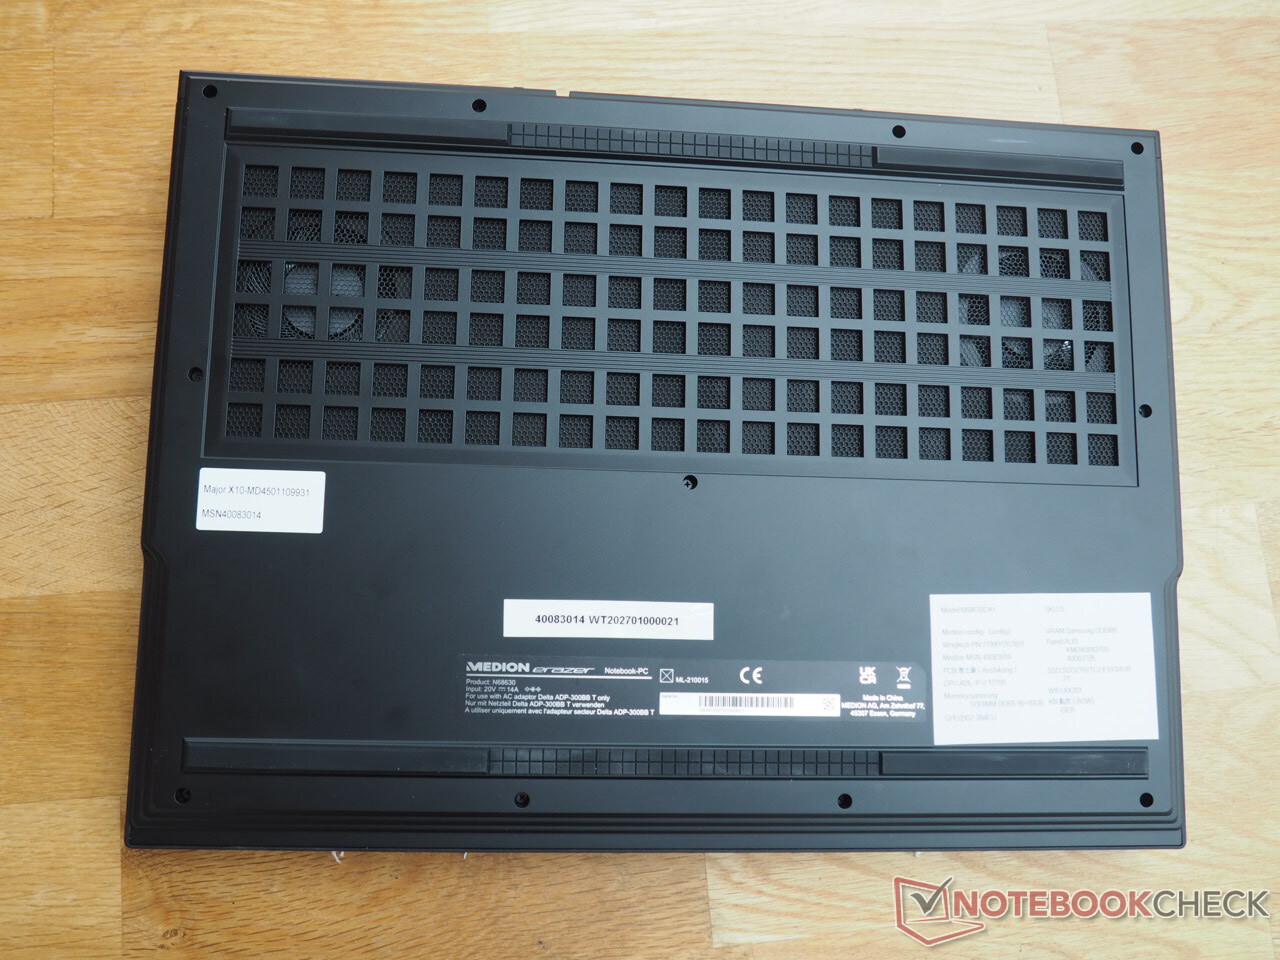
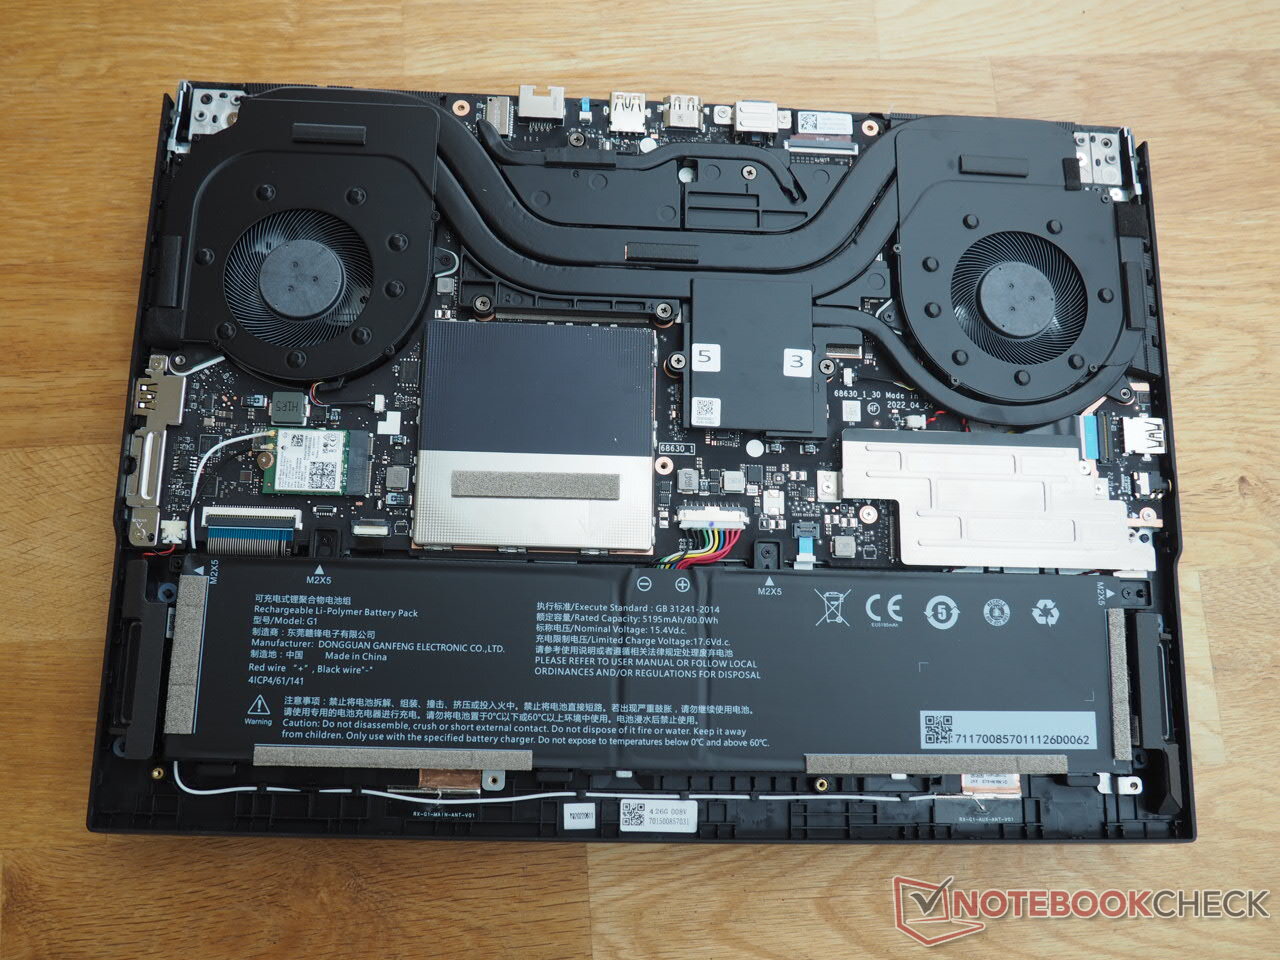
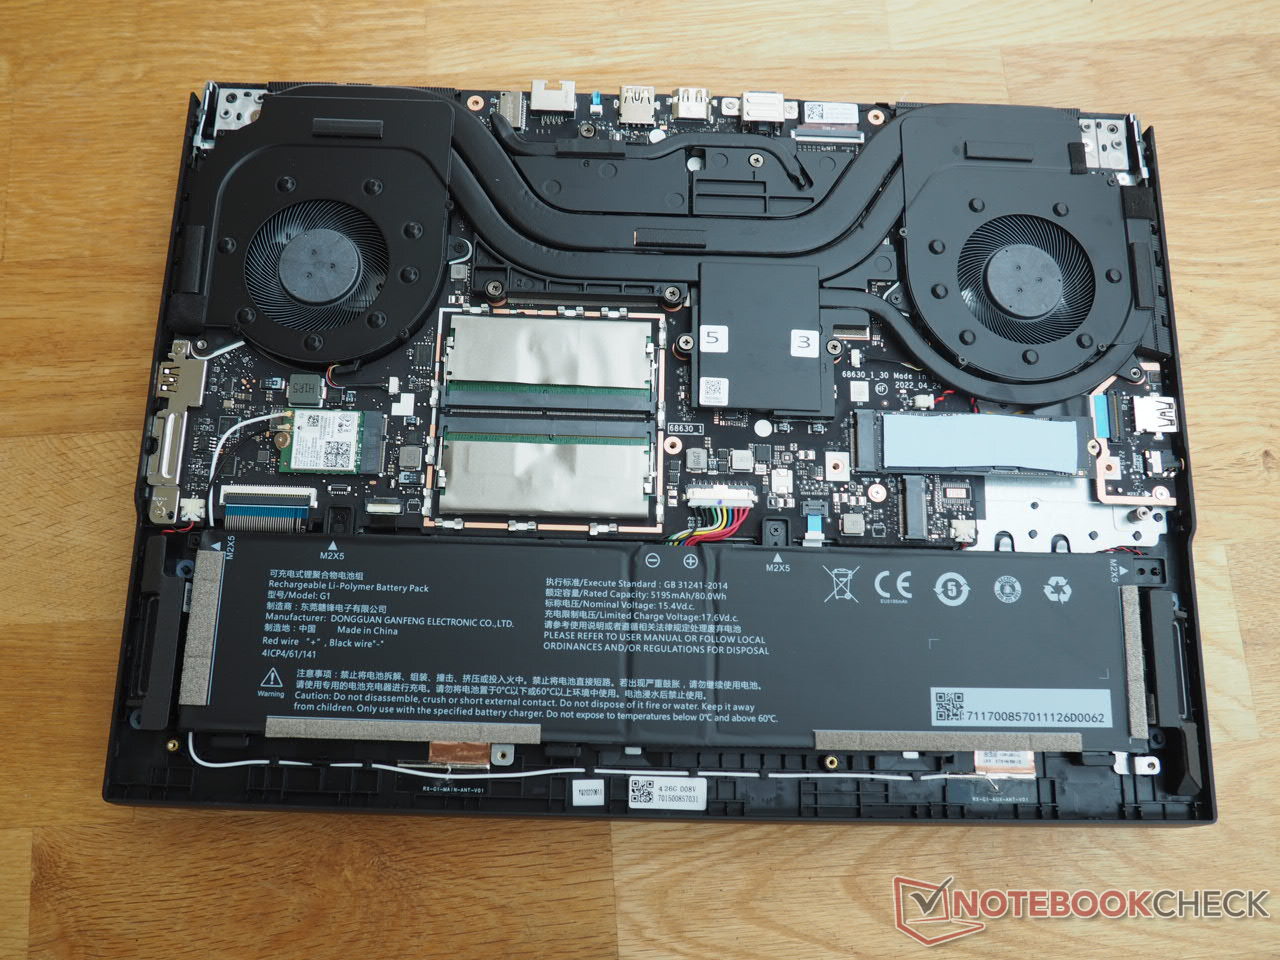
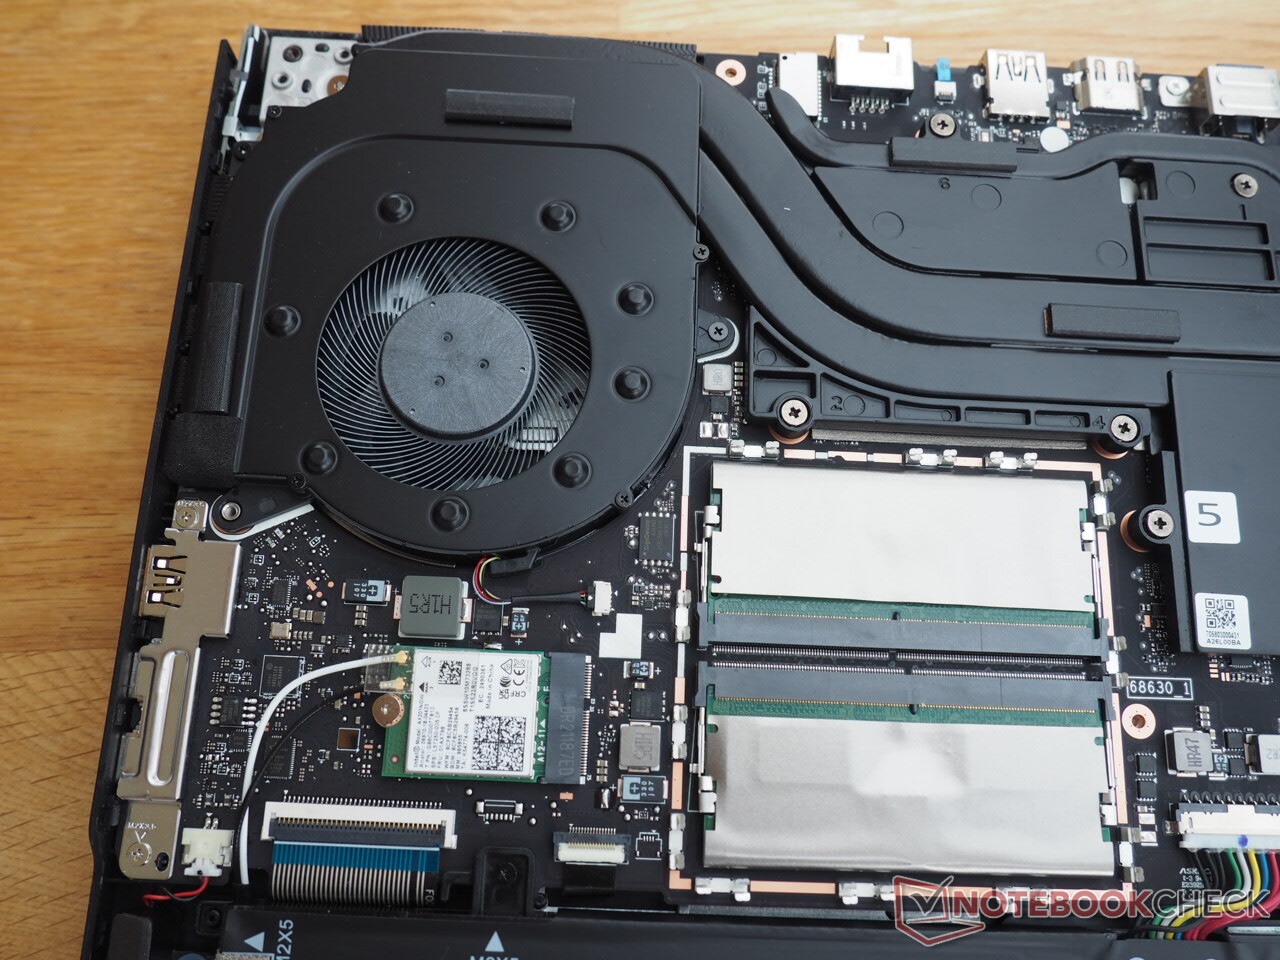
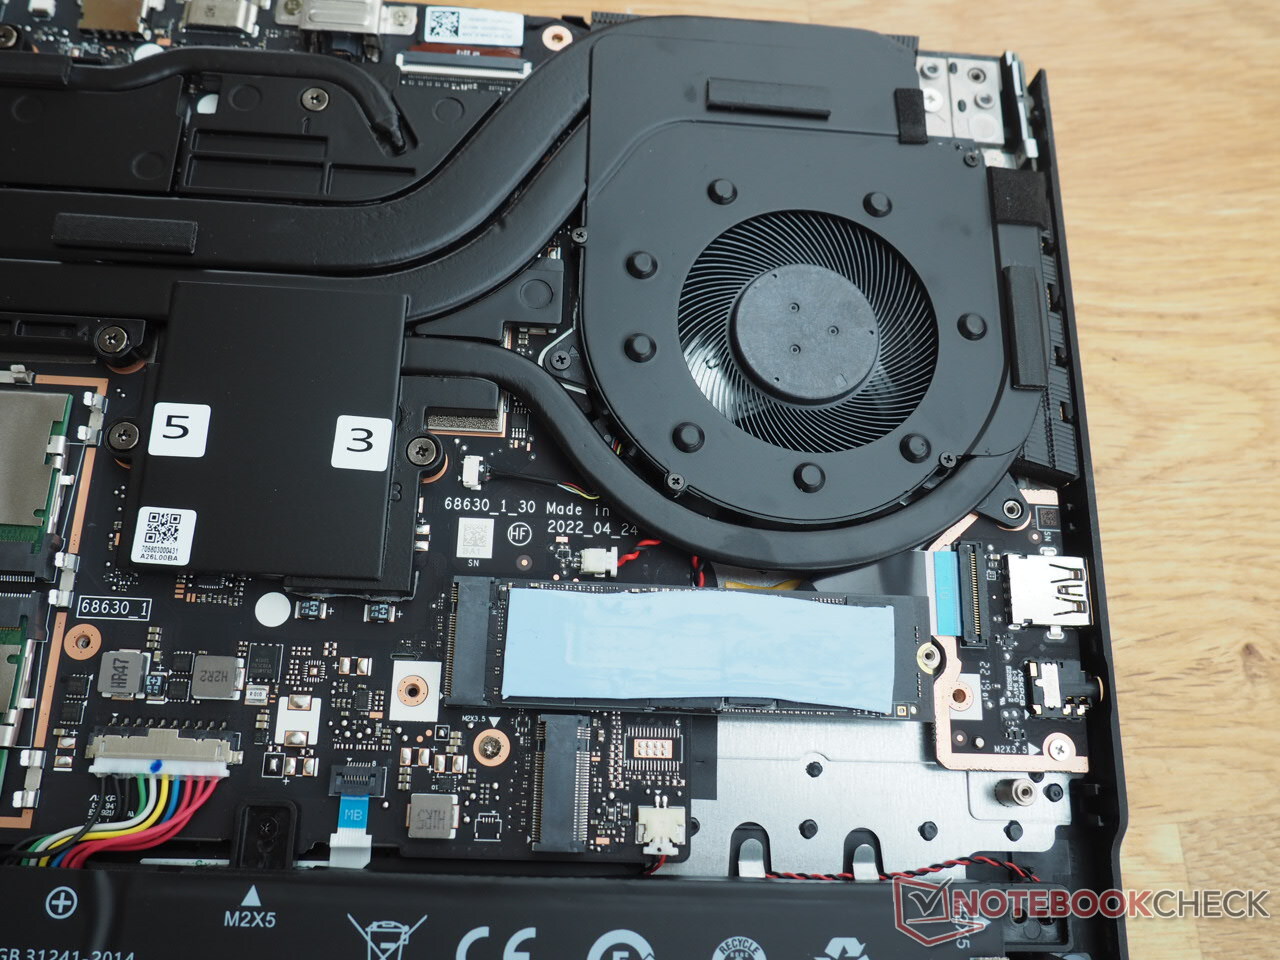
该设备的内部可以以与大多数游戏笔记本电脑相同的方式进行维护。从底部卸下11颗十字螺丝后,你可以将底盖从笔记本上抬起来。因为有夹子将盖子固定住,所以你需要用一个平坦的工具施加很大的力量来做。在机箱内部,你会发现两个SODIMM插槽,两个M.2插槽(都位于盖子下面),无线模块和电池。冷却系统由两个风扇组成,共用几根热管。
担保
Erazer Major X10有24个月的保修期。
输入设备
键盘
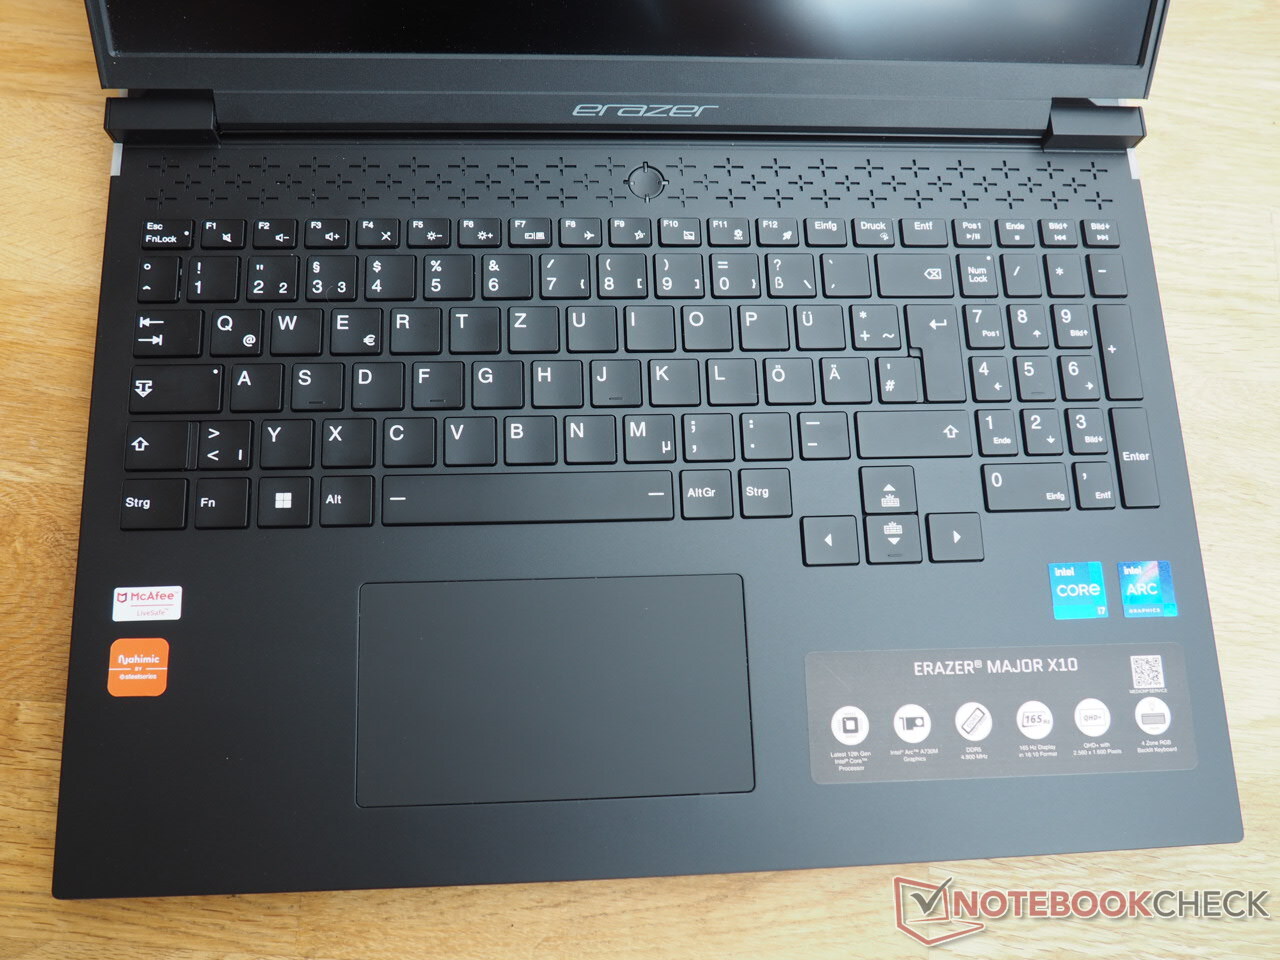
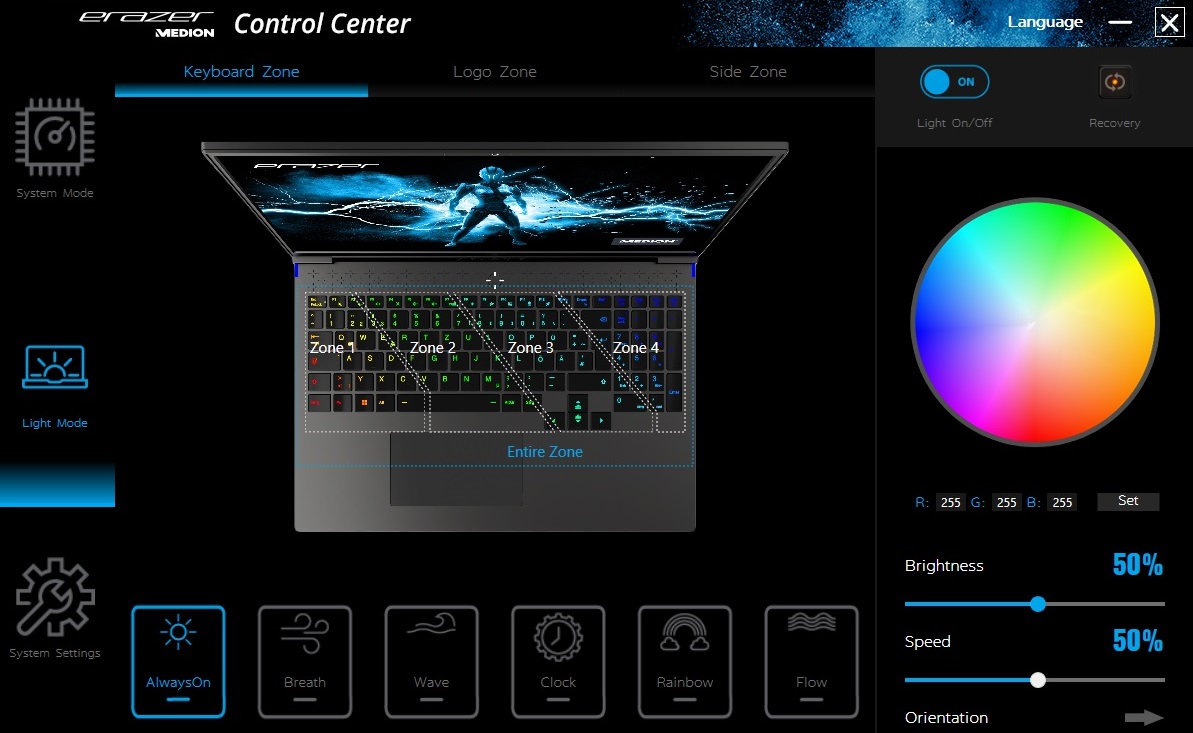
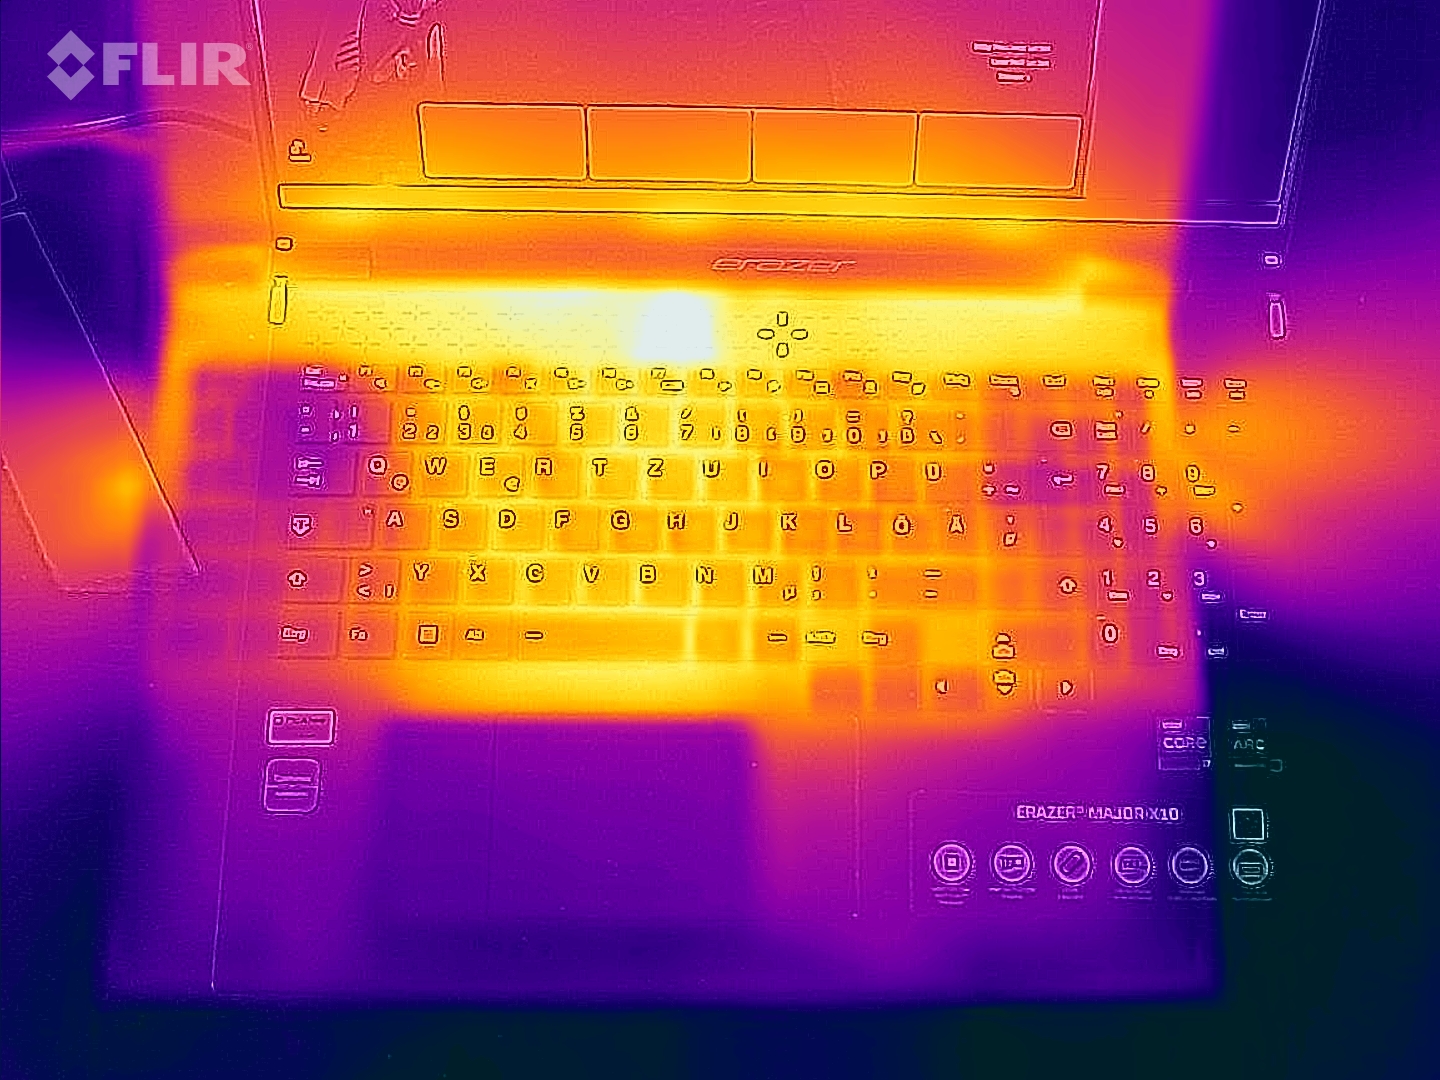
这款16英寸的笔记本电脑采用了一个带有完整数字键盘的小圆盘,其按键比其他地方略窄。与许多其他制造商不同,Medion决定使用大小合适的方向键,而不是那些小的方向键--一些游戏玩家会对此感到高兴。我们也喜欢这款键盘的布局,它主要坚持了标准的QWERTZ设计。亮点之一是具有可调亮度水平的四区RGB照明。有几种模式可供选择,让你定制照明。对于游戏笔记本来说,键盘的打字感觉很好,也就是说,它给你足够的反馈。
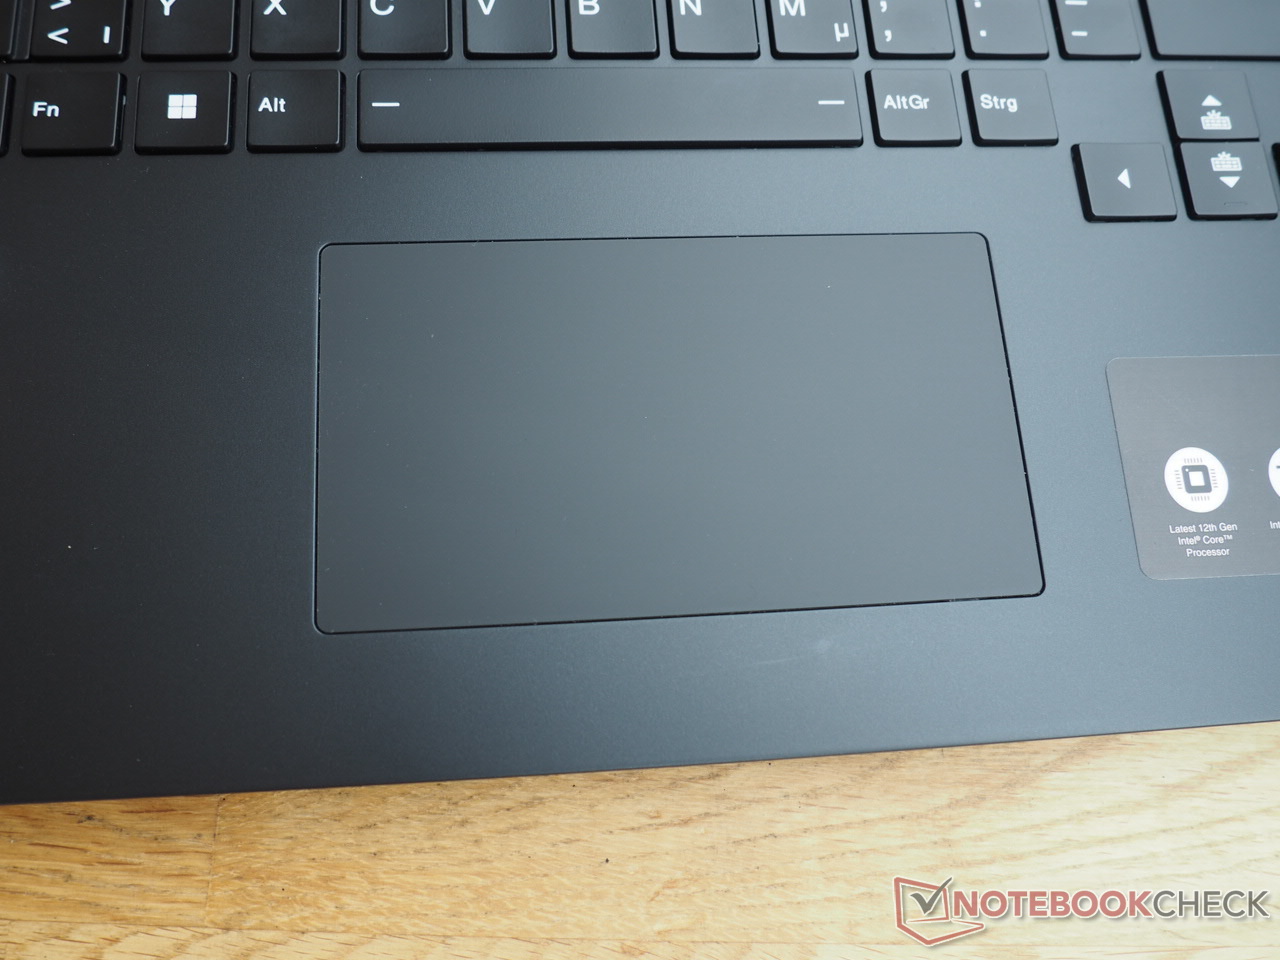
触摸板
对触摸板也没有什么可抱怨的。尺寸约为12 x 6.5厘米(4.7 x 2.6英寸),由于其相当光滑的表面,它可以让手指毫不费力地滑过,也没有表现出任何问题(例如,在精确度和手势方面)。只有底部的点击区域对我们来说有点太脆弱了,尽管足够结实。
显示
一流的显示屏是该设备的一个突出特点。现在,16:10面板在游戏笔记本中也越来越受欢迎。而Medion也在顺应这一趋势。
| |||||||||||||||||||||||||
Brightness Distribution: 82 %
Center on Battery: 489 cd/m²
Contrast: 1223:1 (Black: 0.4 cd/m²)
ΔE ColorChecker Calman: 2.08 | ∀{0.5-29.43 Ø4.73}
calibrated: 1.27
ΔE Greyscale Calman: 2.6 | ∀{0.09-98 Ø4.97}
72.5% AdobeRGB 1998 (Argyll 3D)
98% sRGB (Argyll 3D)
70.4% Display P3 (Argyll 3D)
Gamma: 2.205
CCT: 6797 K
| Medion Erazer Major X10 AUO B160QAN03.H, IPS, 2560x1600, 16" | Asus TUF Gaming F17 FX707Z-HX011W AU Optronics B173HAN04.9 (AUO4B9D), IPS, 1920x1080, 17.3" | Acer Nitro 5 AN517-55-738R B173HAN04.0, IPS, 1920x1080, 17.3" | Dell Inspiron 16 Plus 7620 BOE NE16N41, IPS, 3072x1920, 16" | HP Omen 16-c0077ng BOE09E5, IPS, 2560x1440, 16.1" | |
|---|---|---|---|---|---|
| Display | -42% | -15% | 1% | -2% | |
| Display P3 Coverage (%) | 70.4 | 40.2 -43% | 58.9 -16% | 70.8 1% | 68.8 -2% |
| sRGB Coverage (%) | 98 | 59.7 -39% | 86.4 -12% | 99.5 2% | 96.9 -1% |
| AdobeRGB 1998 Coverage (%) | 72.5 | 41.5 -43% | 60.5 -17% | 73.2 1% | 71.1 -2% |
| Response Times | -273% | 16% | -256% | -25% | |
| Response Time Grey 50% / Grey 80% * (ms) | 13.9 ? | 39.2 ? -182% | 6 ? 57% | 38 ? -173% | 13 ? 6% |
| Response Time Black / White * (ms) | 6.4 ? | 29.6 ? -363% | 8 ? -25% | 28 ? -338% | 10 ? -56% |
| PWM Frequency (Hz) | |||||
| Screen | -66% | -36% | 9% | -30% | |
| Brightness middle (cd/m²) | 489 | 287 -41% | 286 -42% | 288.9 -41% | 297 -39% |
| Brightness (cd/m²) | 436 | 268 -39% | 278 -36% | 276 -37% | 283 -35% |
| Brightness Distribution (%) | 82 | 89 9% | 89 9% | 92 12% | 91 11% |
| Black Level * (cd/m²) | 0.4 | 0.17 57% | 0.32 20% | 0.26 35% | 0.22 45% |
| Contrast (:1) | 1223 | 1688 38% | 894 -27% | 1111 -9% | 1350 10% |
| Colorchecker dE 2000 * | 2.08 | 5.1 -145% | 3.05 -47% | 1.88 10% | 3.25 -56% |
| Colorchecker dE 2000 max. * | 4.27 | 8.72 -104% | 5.83 -37% | 4.37 -2% | 6.33 -48% |
| Colorchecker dE 2000 calibrated * | 1.27 | 5.1 -302% | 3.13 -146% | 0.42 67% | 1.11 13% |
| Greyscale dE 2000 * | 2.6 | 4.24 -63% | 3.17 -22% | 1.4 46% | 6.97 -168% |
| Gamma | 2.205 100% | 2.44 90% | 2.29 96% | 2.3 96% | 2.3 96% |
| CCT | 6797 96% | 6008 108% | 6916 94% | 6634 98% | 6050 107% |
| Total Average (Program / Settings) | -127% /
-90% | -12% /
-24% | -82% /
-30% | -19% /
-23% |
* ... smaller is better
友达制造的165Hz显示屏(型号B160QAN03.H)几乎在所有方面都很出色。首先,在峰值亮度方面,它超过了竞争对手。该面板的平均峰值亮度为436cd/m²,从而使Major X10相当适合在户外使用。作为比较,竞争对手甚至不能达到300cd/m²。
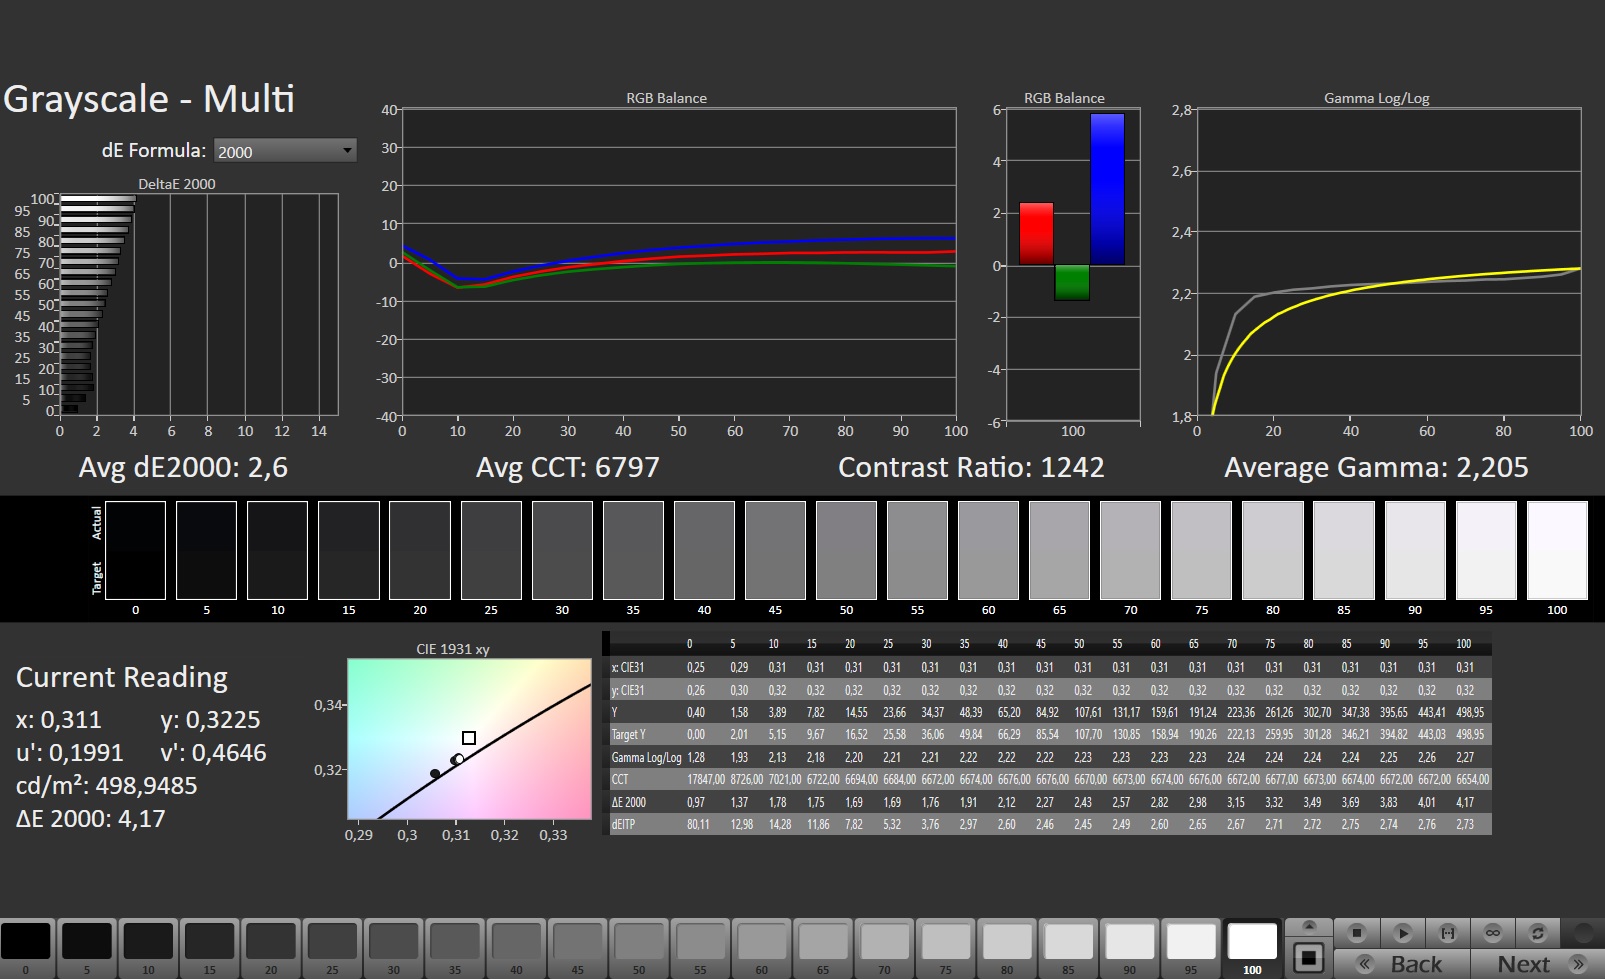
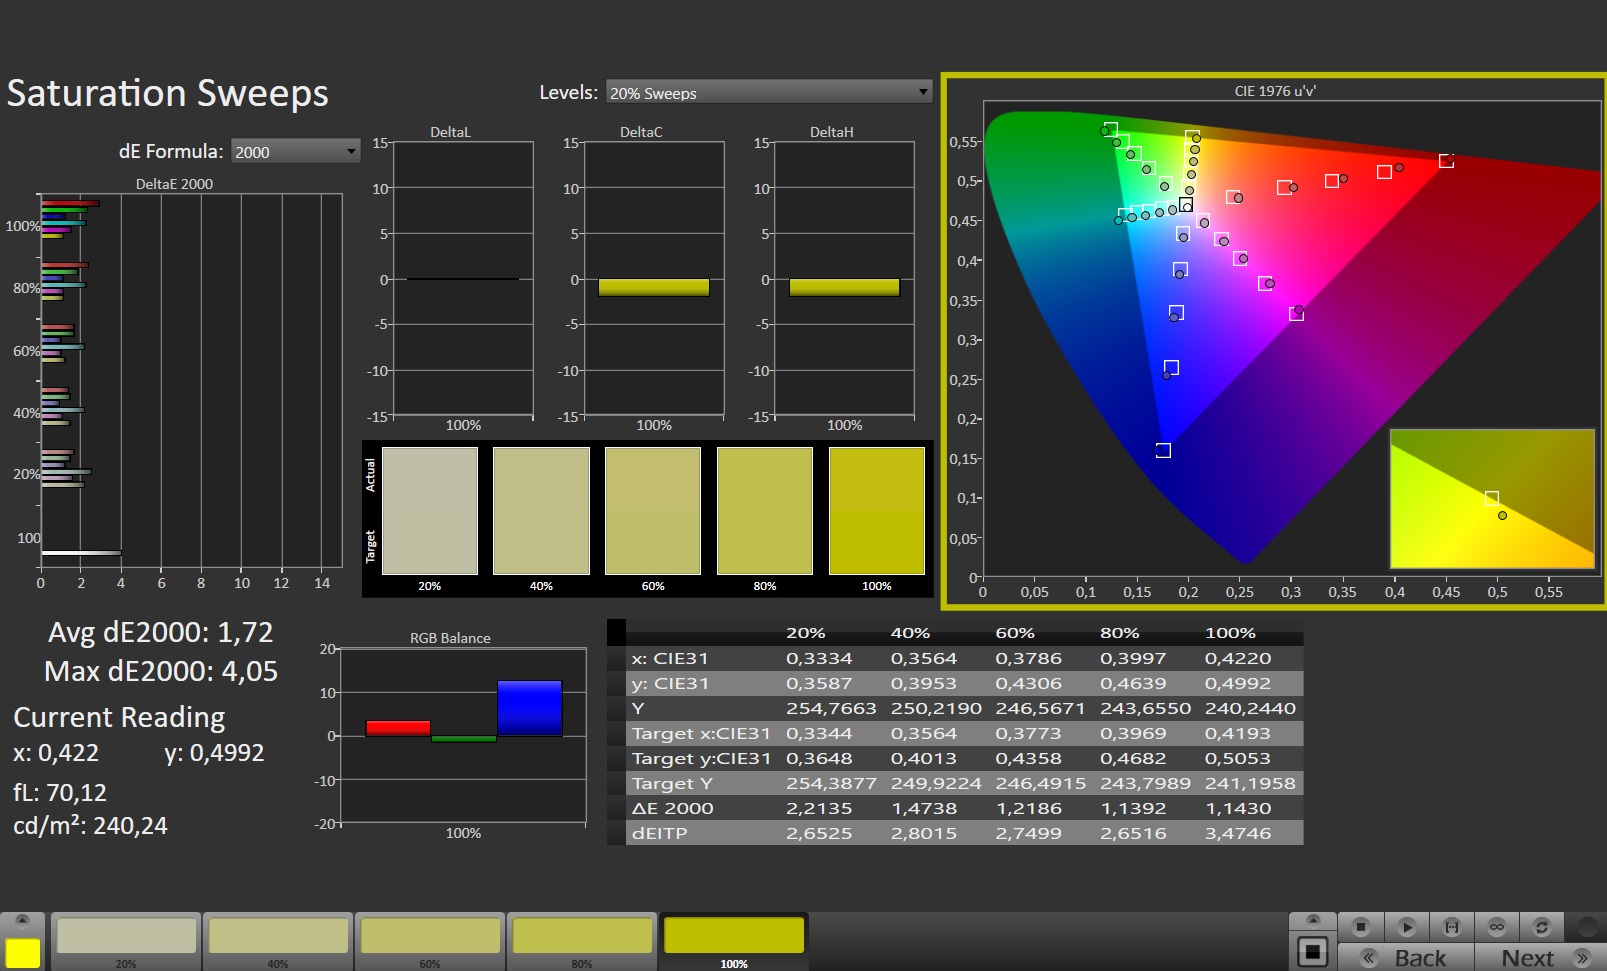
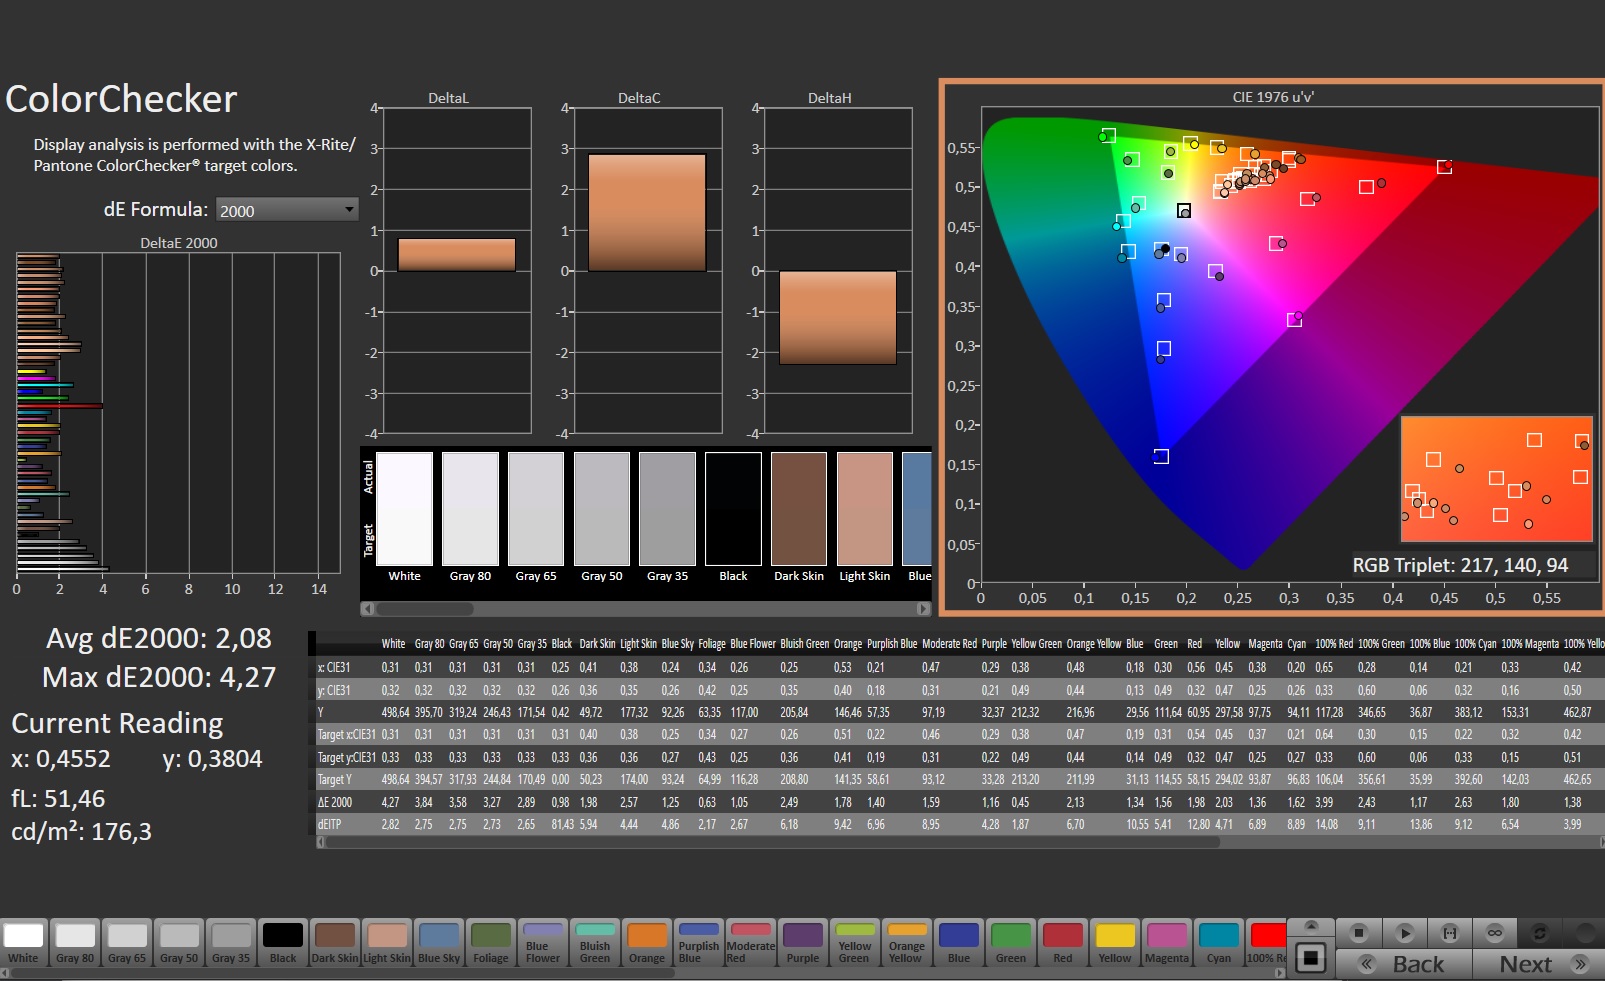
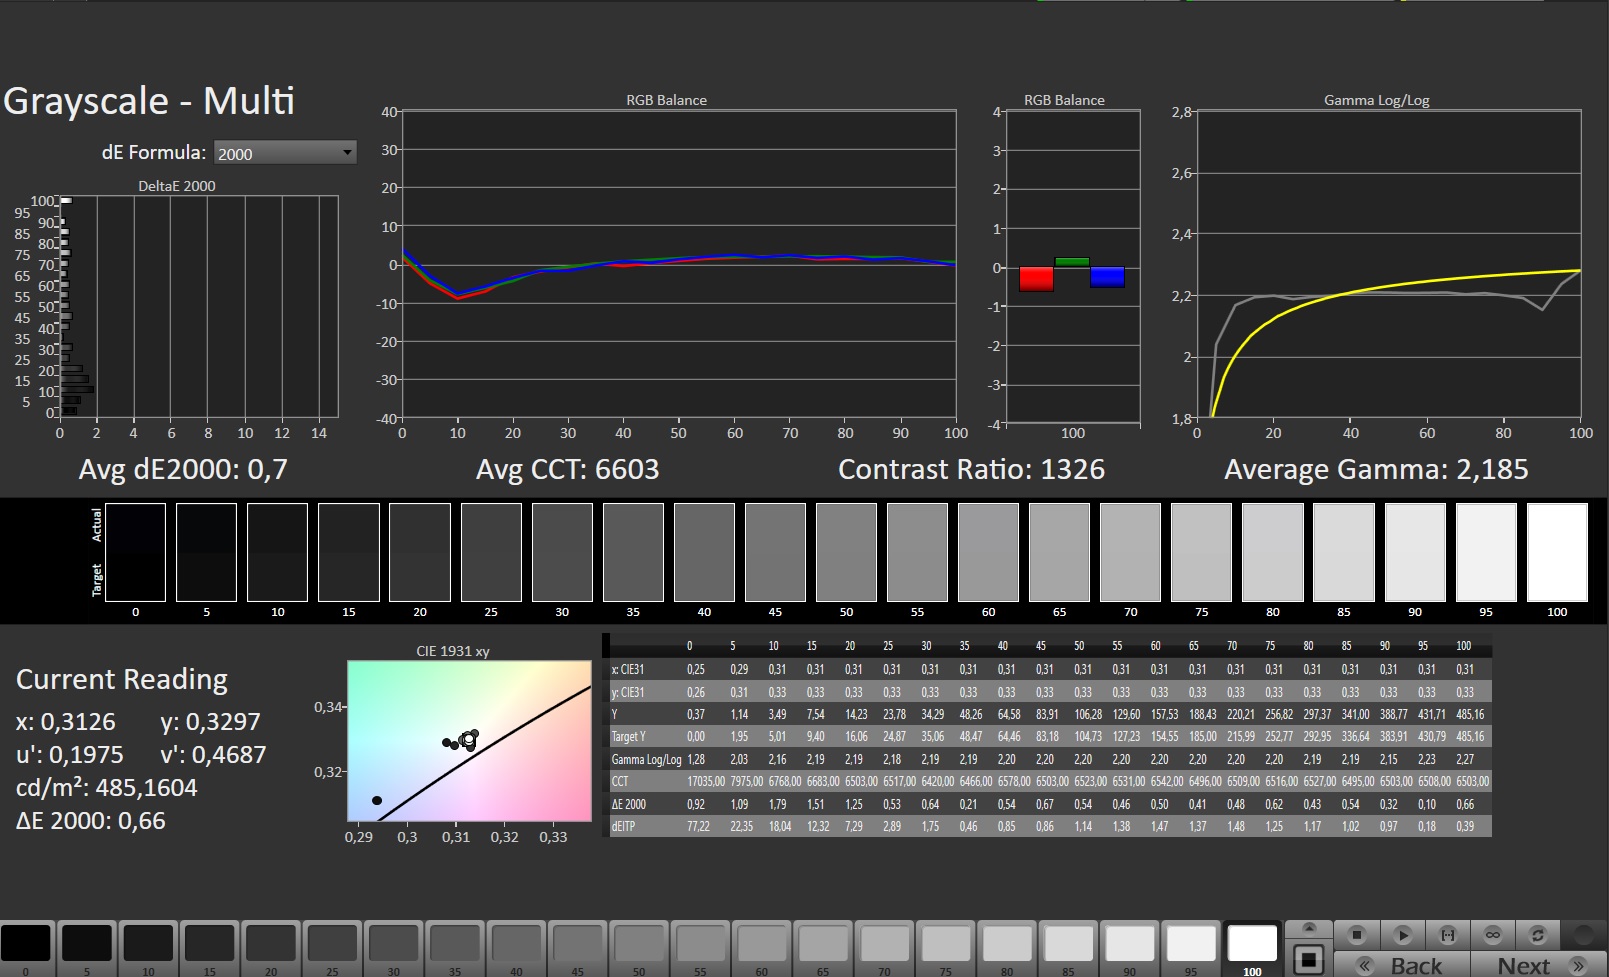
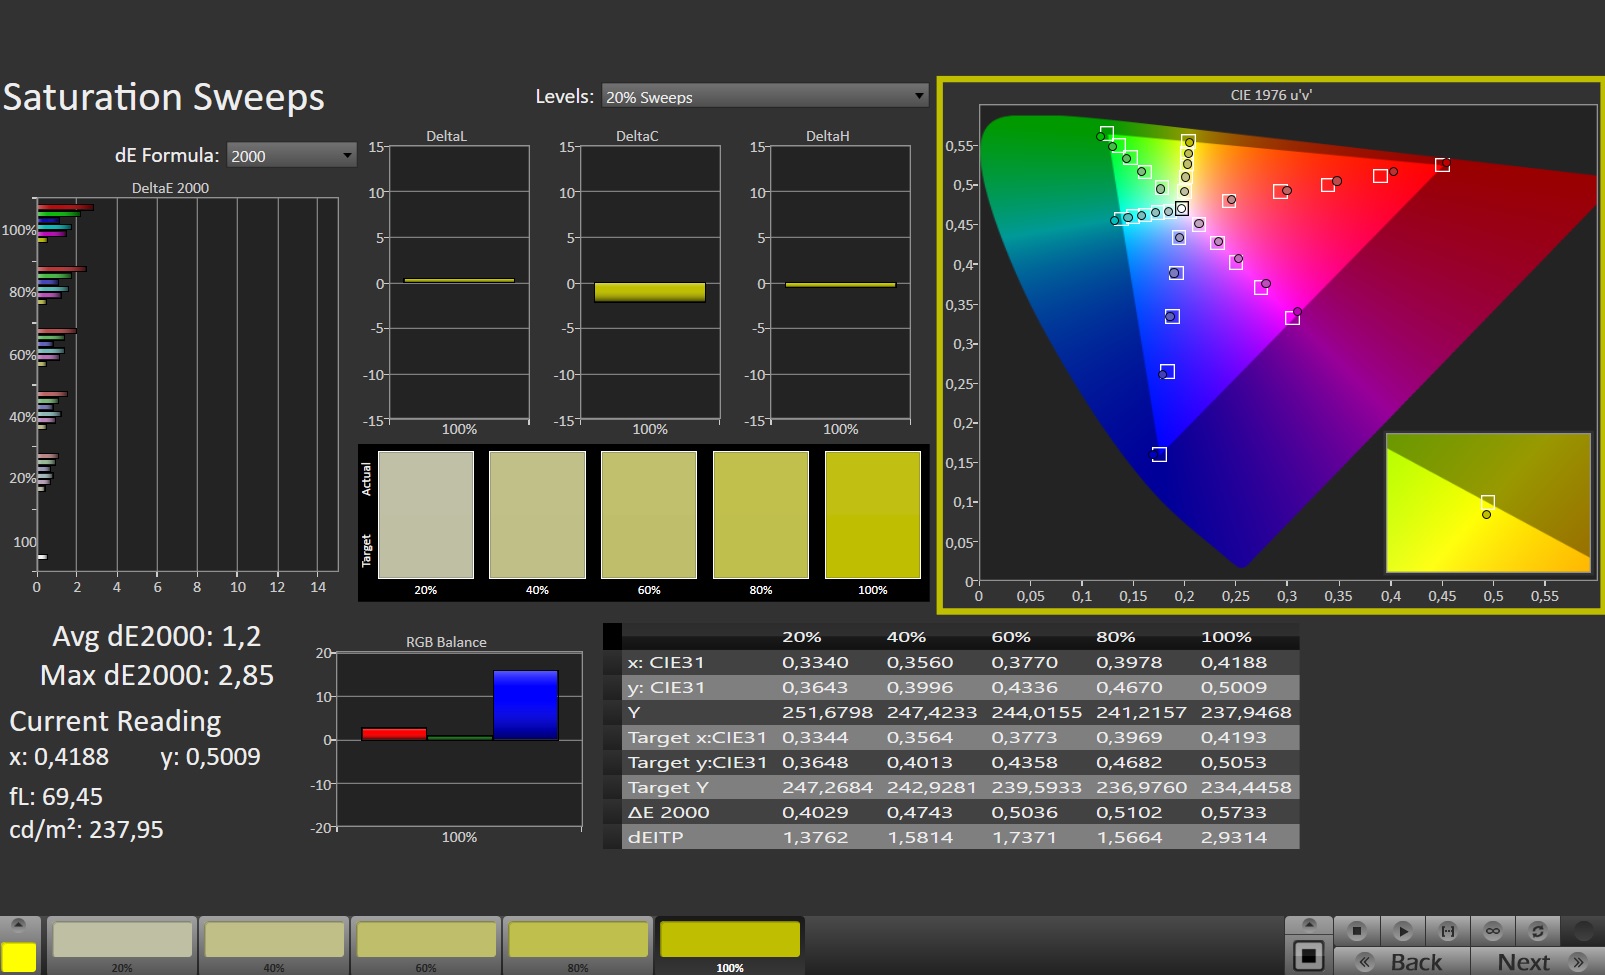
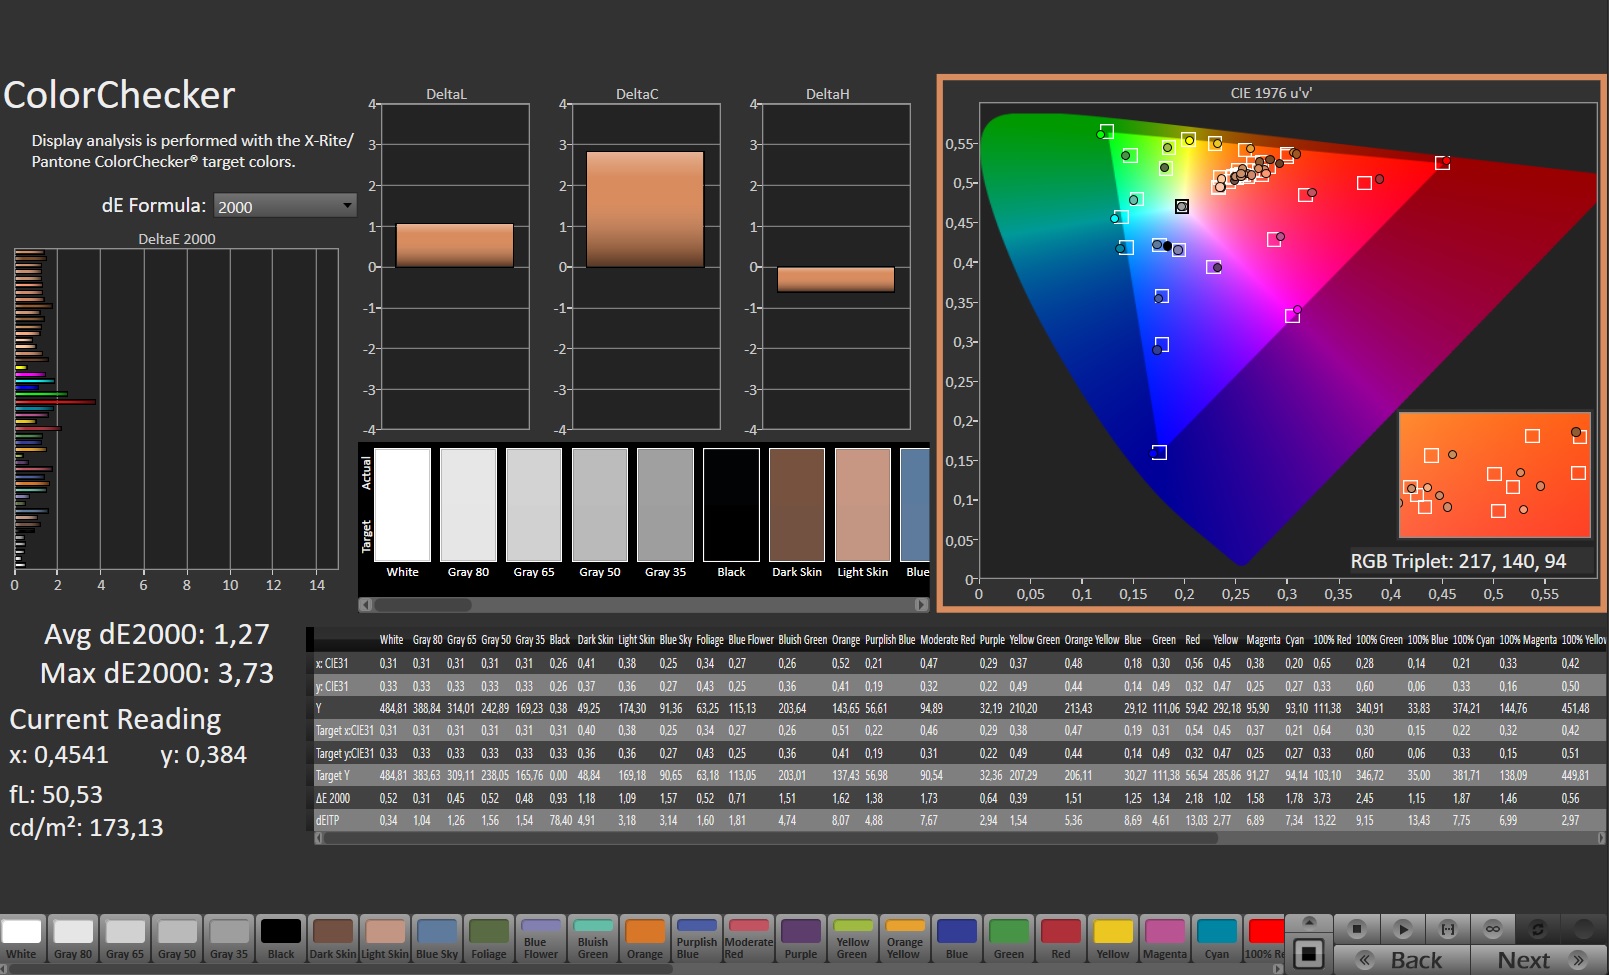
第二,1,233:1的对比度对于IPS面板来说是非常好的。然而,这只足以使该笔记本电脑在我们的比较组中处于中间位置。也就是说,正如我们使用CalMan进行的测量所显示的那样(见截图),该显示器开箱后就已经有了相当的色彩准确性。它的色彩覆盖率应该能够满足大多数消费者--98%的sRGB覆盖率对于一台游戏笔记本来说是绰绰有余的。而且屏幕能够覆盖73%的AdobeRGB和70%的P3色彩空间。
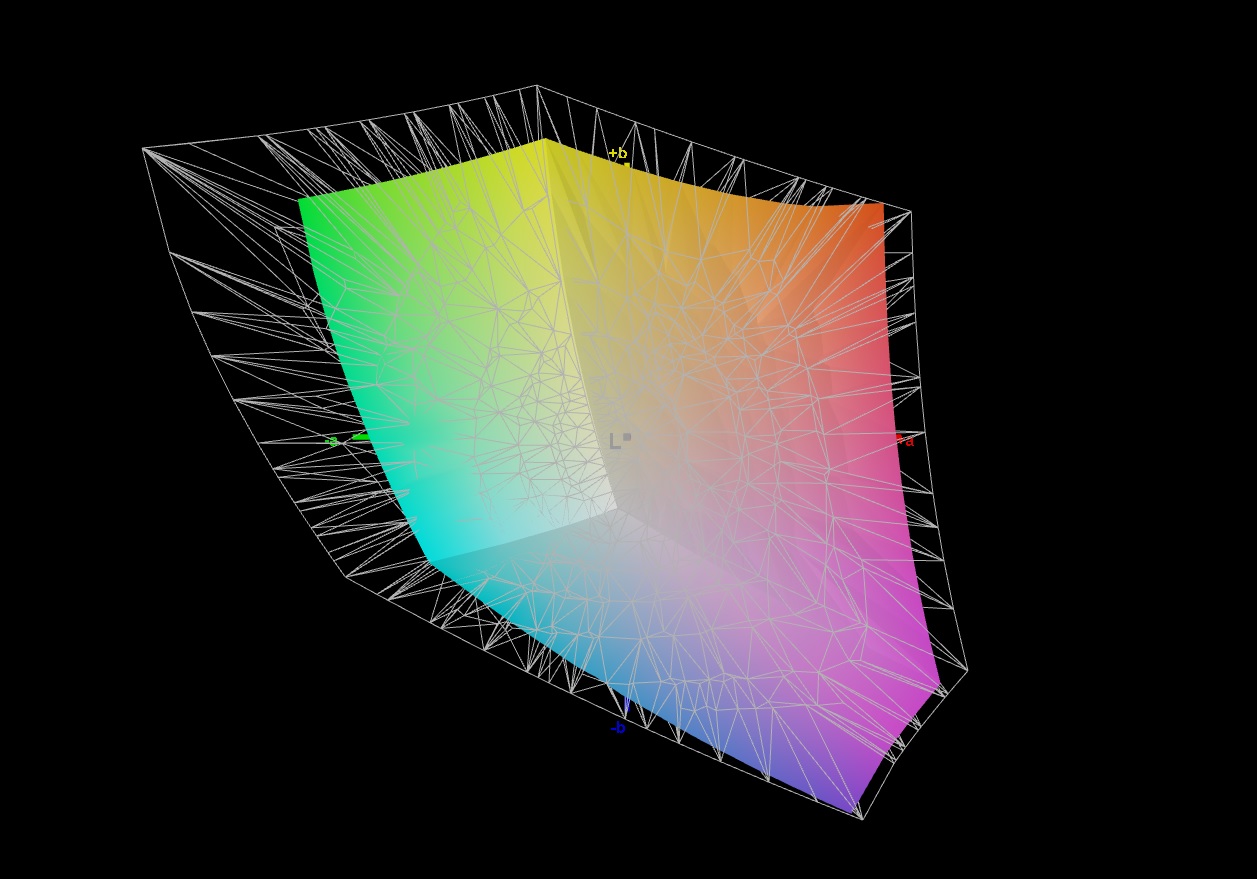
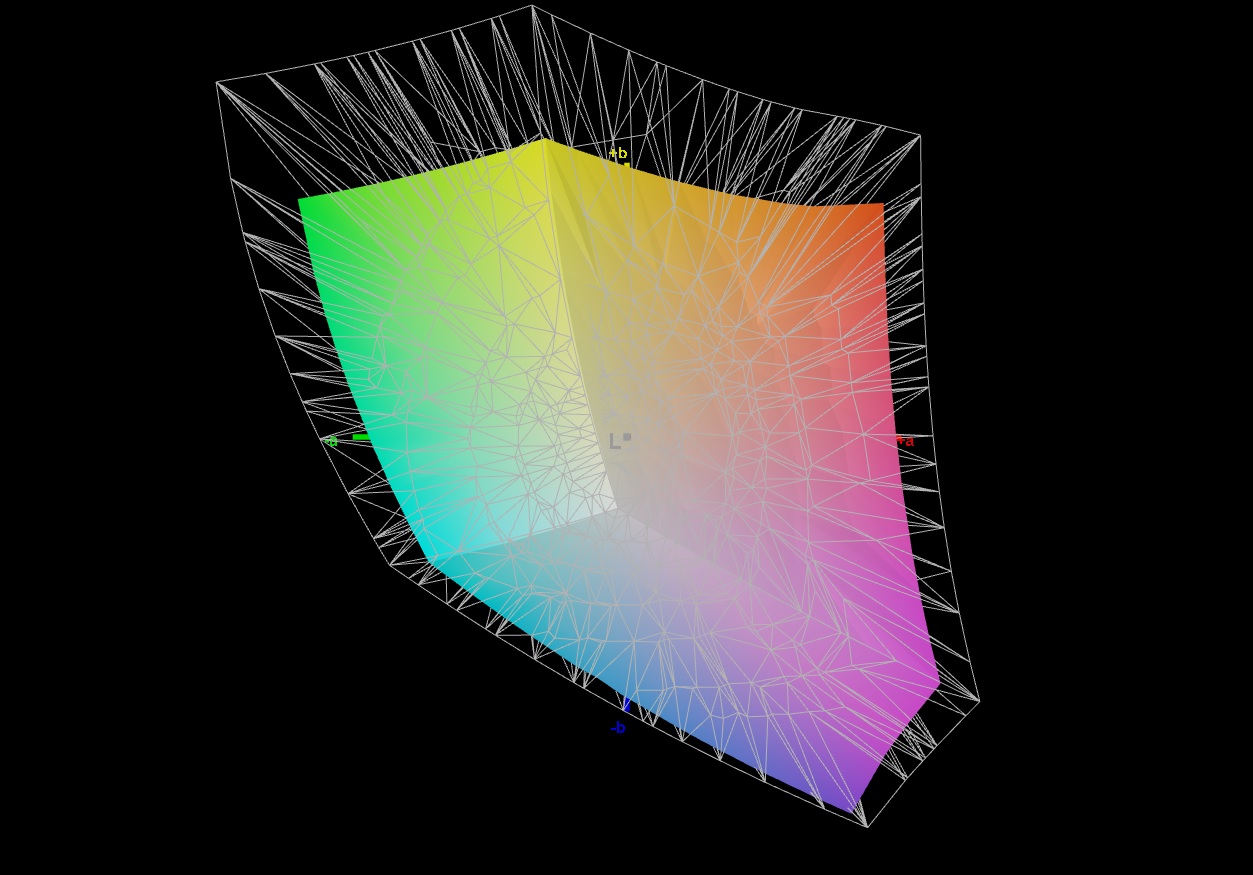
视角是典型的IPS面板。我们的测量设备报告的响应时间为6毫秒(黑到白)和14毫秒(灰到灰),相对于我们比较中的其他笔记本电脑,这同样不坏。然而,有点遗憾的是,在边缘有一些明显的IPS光晕。我们的评测单元的亮度分布仅为82%。

Display Response Times
| ↔ Response Time Black to White | ||
|---|---|---|
| 6.4 ms ... rise ↗ and fall ↘ combined | ↗ 2 ms rise | 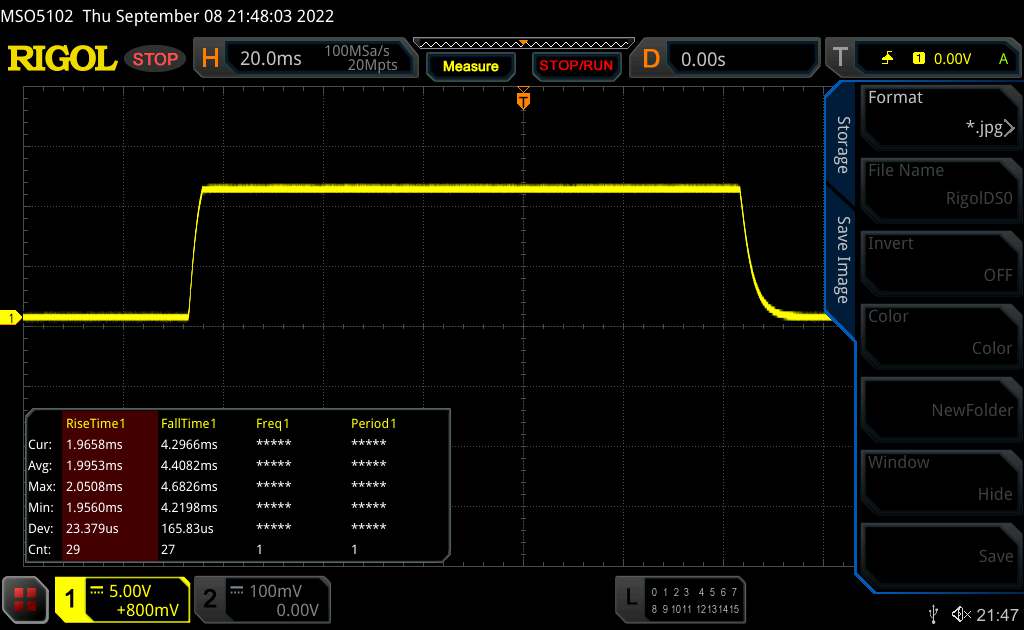 |
| ↘ 4.4 ms fall | ||
| The screen shows very fast response rates in our tests and should be very well suited for fast-paced gaming. In comparison, all tested devices range from 0.1 (minimum) to 240 (maximum) ms. » 20 % of all devices are better. This means that the measured response time is better than the average of all tested devices (19.9 ms). | ||
| ↔ Response Time 50% Grey to 80% Grey | ||
| 13.9 ms ... rise ↗ and fall ↘ combined | ↗ 6.5 ms rise | 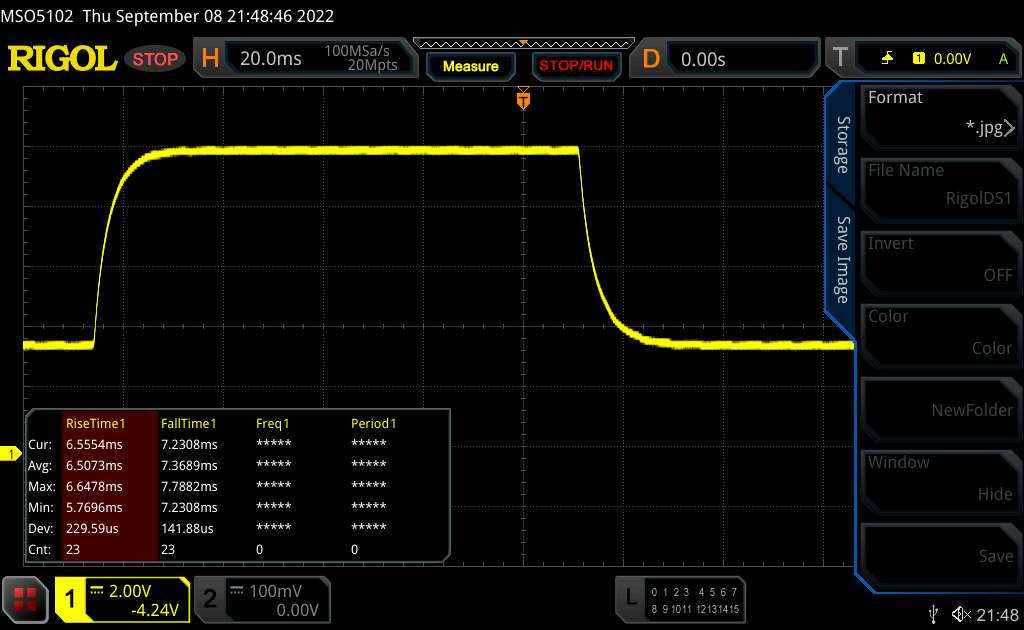 |
| ↘ 7.4 ms fall | ||
| The screen shows good response rates in our tests, but may be too slow for competitive gamers. In comparison, all tested devices range from 0.165 (minimum) to 636 (maximum) ms. » 28 % of all devices are better. This means that the measured response time is better than the average of all tested devices (31.1 ms). | ||
Screen Flickering / PWM (Pulse-Width Modulation)
| Screen flickering / PWM not detected |  | ||
In comparison: 52 % of all tested devices do not use PWM to dim the display. If PWM was detected, an average of 7784 (minimum: 5 - maximum: 343500) Hz was measured. | |||
业绩
虽然拥有32GB的内存和12GB的VRAM叫作高端,但由于Major X10的图形性能不甚理想,我们只能将其归类为中端机器(后面有更深入的分析)。以1,700欧元(1,728美元)的价格,整体包装不能真正被认为是一个伟大的交易。

测试条件
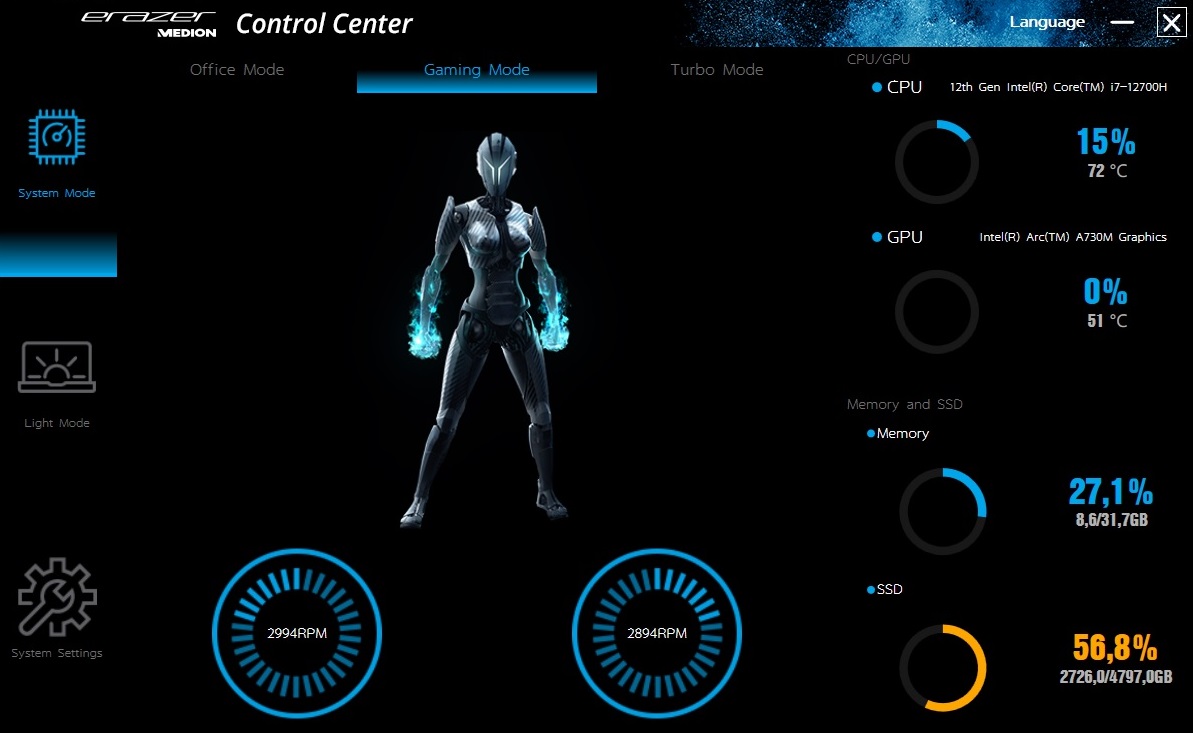
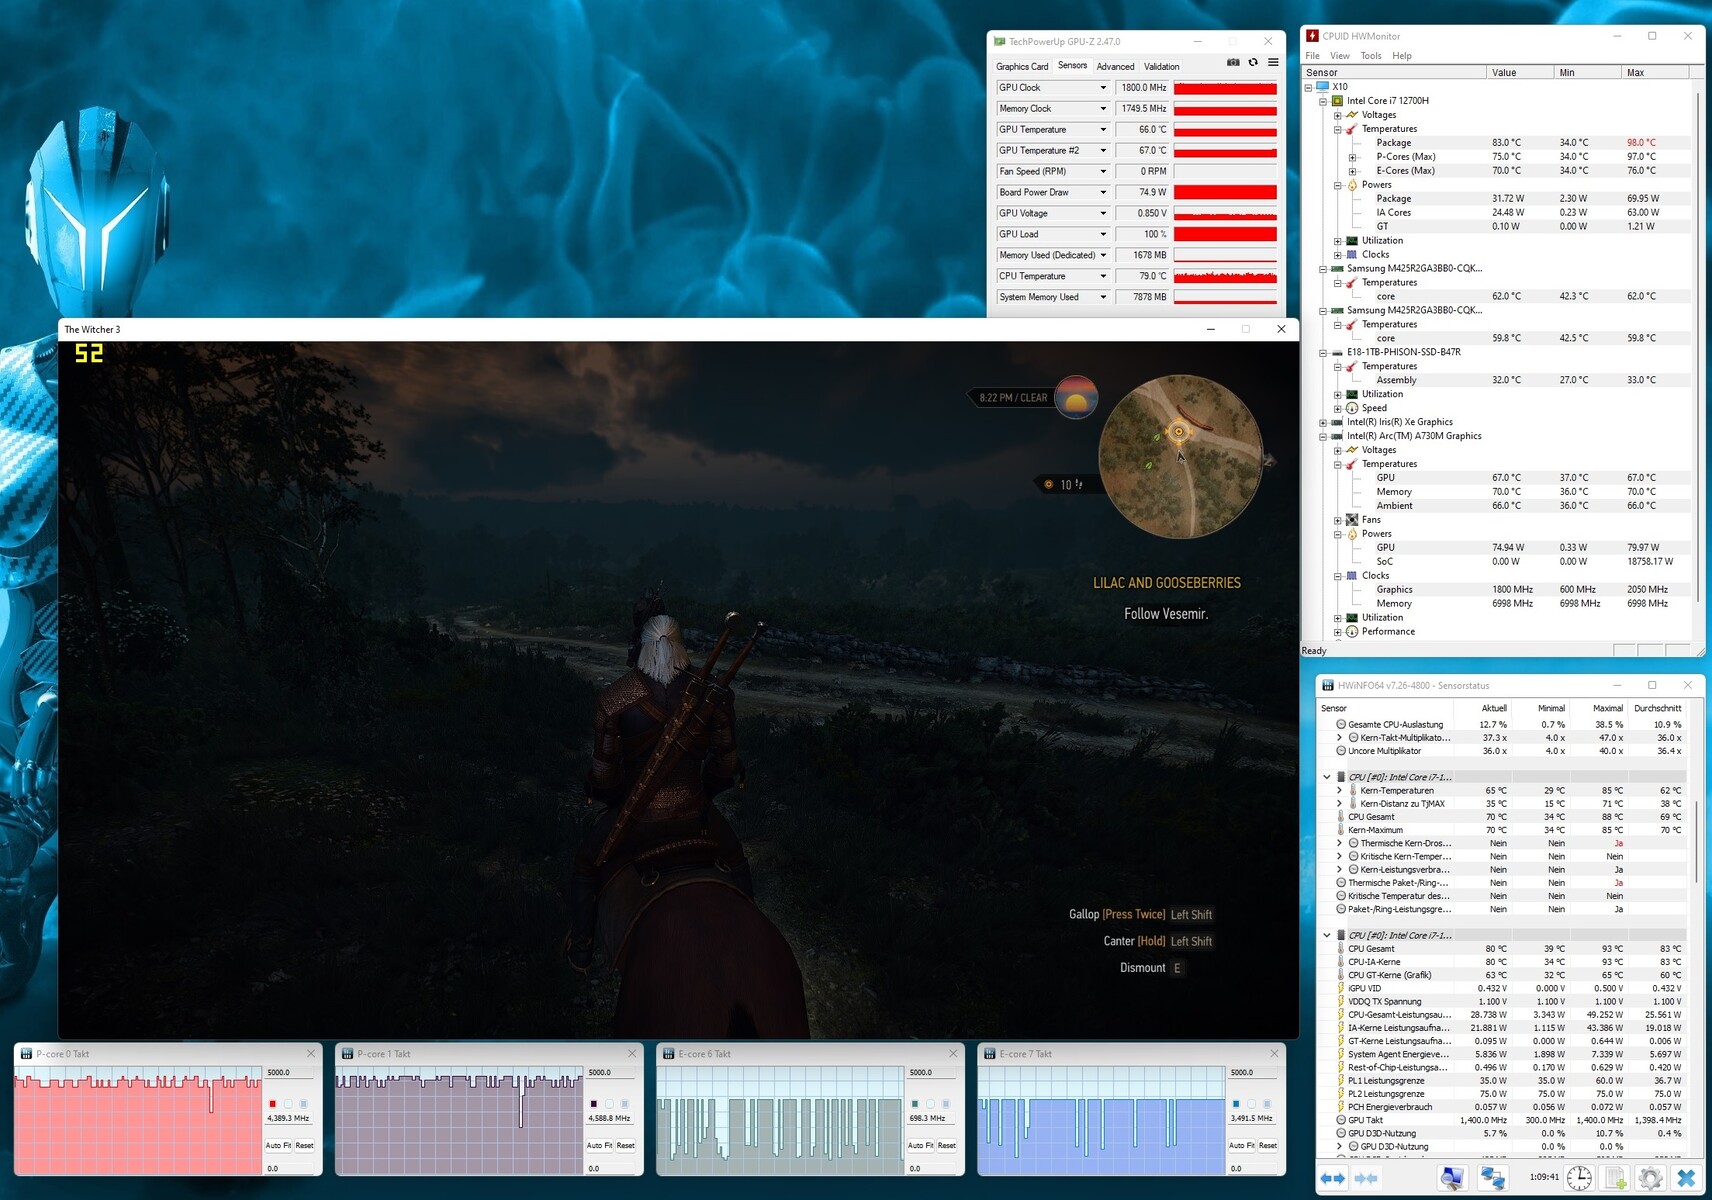
你可以在预装的控制中心软件中选择三个配置文件。除非另有说明,测量是在Major X10的游戏模式下进行的,这应该与其他笔记本电脑的性能模式相似。你可以在下表中找到各种配置文件的PL1和PL2设置。
处理器
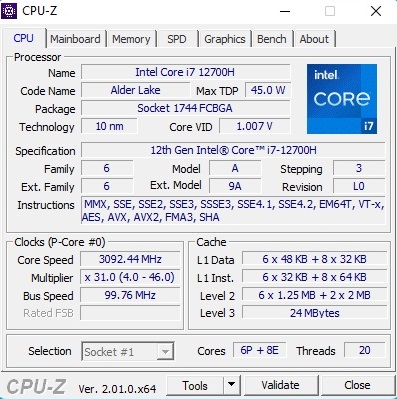
这台Medion笔记本电脑中的酷睿i7-12700H是英特尔Alder Lake系列中的最新一代10纳米处理器。这个高端选项提供6个性能和8个效率核心,并能使用超线程处理多达20个线程的并行运算。在我们一系列的CPU测试中,Major X10即使没有激活Turbo模式也表现良好。在Cinebench R15循环测试中,其性能稳定在一个相当稳定的水平,略高于12700H的竞争对手所能达到的水平。甚至 Ryzen 7 5800H在惠普Omen 16中也不能与这个性能水平相提并论。
Cinebench R15 Multi Sustained Load
* ... smaller is better
AIDA64: FP32 Ray-Trace | FPU Julia | CPU SHA3 | CPU Queen | FPU SinJulia | FPU Mandel | CPU AES | CPU ZLib | FP64 Ray-Trace | CPU PhotoWorxx
| Performance rating | |
| Average of class Gaming | |
| HP Omen 16-c0077ng | |
| Dell Inspiron 16 Plus 7620 | |
| Average Intel Core i7-12700H | |
| Medion Erazer Major X10 | |
| Acer Nitro 5 AN517-55-738R | |
| Asus TUF Gaming F17 FX707Z-HX011W | |
| AIDA64 / FP32 Ray-Trace | |
| Average of class Gaming (10227 - 85542, n=107, last 2 years) | |
| HP Omen 16-c0077ng | |
| Dell Inspiron 16 Plus 7620 | |
| Average Intel Core i7-12700H (2585 - 17957, n=64) | |
| Acer Nitro 5 AN517-55-738R | |
| Medion Erazer Major X10 | |
| Asus TUF Gaming F17 FX707Z-HX011W | |
| AIDA64 / FPU Julia | |
| Average of class Gaming (51376 - 238426, n=107, last 2 years) | |
| HP Omen 16-c0077ng | |
| Dell Inspiron 16 Plus 7620 | |
| Average Intel Core i7-12700H (12439 - 90760, n=64) | |
| Acer Nitro 5 AN517-55-738R | |
| Medion Erazer Major X10 | |
| Asus TUF Gaming F17 FX707Z-HX011W | |
| AIDA64 / CPU SHA3 | |
| Average of class Gaming (2180 - 9817, n=107, last 2 years) | |
| HP Omen 16-c0077ng | |
| Average Intel Core i7-12700H (833 - 4242, n=64) | |
| Dell Inspiron 16 Plus 7620 | |
| Acer Nitro 5 AN517-55-738R | |
| Medion Erazer Major X10 | |
| Asus TUF Gaming F17 FX707Z-HX011W | |
| AIDA64 / CPU Queen | |
| Average of class Gaming (49785 - 173351, n=98, last 2 years) | |
| Asus TUF Gaming F17 FX707Z-HX011W | |
| HP Omen 16-c0077ng | |
| Acer Nitro 5 AN517-55-738R | |
| Medion Erazer Major X10 | |
| Average Intel Core i7-12700H (57923 - 103202, n=63) | |
| Dell Inspiron 16 Plus 7620 | |
| AIDA64 / FPU SinJulia | |
| Average of class Gaming (4424 - 33636, n=107, last 2 years) | |
| HP Omen 16-c0077ng | |
| Medion Erazer Major X10 | |
| Acer Nitro 5 AN517-55-738R | |
| Average Intel Core i7-12700H (3249 - 9939, n=64) | |
| Dell Inspiron 16 Plus 7620 | |
| Asus TUF Gaming F17 FX707Z-HX011W | |
| AIDA64 / FPU Mandel | |
| Average of class Gaming (25115 - 128721, n=107, last 2 years) | |
| HP Omen 16-c0077ng | |
| Dell Inspiron 16 Plus 7620 | |
| Average Intel Core i7-12700H (7135 - 44760, n=64) | |
| Acer Nitro 5 AN517-55-738R | |
| Medion Erazer Major X10 | |
| Asus TUF Gaming F17 FX707Z-HX011W | |
| AIDA64 / CPU AES | |
| HP Omen 16-c0077ng | |
| Average of class Gaming (39258 - 247074, n=107, last 2 years) | |
| Average Intel Core i7-12700H (31839 - 144360, n=64) | |
| Dell Inspiron 16 Plus 7620 | |
| Acer Nitro 5 AN517-55-738R | |
| Medion Erazer Major X10 | |
| Asus TUF Gaming F17 FX707Z-HX011W | |
| AIDA64 / CPU ZLib | |
| Average of class Gaming (574 - 2531, n=107, last 2 years) | |
| Dell Inspiron 16 Plus 7620 | |
| Average Intel Core i7-12700H (305 - 1171, n=64) | |
| Medion Erazer Major X10 | |
| Acer Nitro 5 AN517-55-738R | |
| HP Omen 16-c0077ng | |
| Asus TUF Gaming F17 FX707Z-HX011W | |
| AIDA64 / FP64 Ray-Trace | |
| Average of class Gaming (5509 - 45446, n=107, last 2 years) | |
| HP Omen 16-c0077ng | |
| Dell Inspiron 16 Plus 7620 | |
| Average Intel Core i7-12700H (1437 - 9692, n=64) | |
| Acer Nitro 5 AN517-55-738R | |
| Medion Erazer Major X10 | |
| Asus TUF Gaming F17 FX707Z-HX011W | |
| AIDA64 / CPU PhotoWorxx | |
| Average of class Gaming (12271 - 89891, n=107, last 2 years) | |
| Medion Erazer Major X10 | |
| Dell Inspiron 16 Plus 7620 | |
| Average Intel Core i7-12700H (12863 - 52207, n=64) | |
| Asus TUF Gaming F17 FX707Z-HX011W | |
| HP Omen 16-c0077ng | |
| Acer Nitro 5 AN517-55-738R | |
系统性能
在系统性能方面,这台16英寸笔记本电脑在我们的比较中获得了第三名,在PCMark中获得了6830分的优异成绩。根据我们的主观印象,操作系统的反应速度和流畅性。
CrossMark: Overall | Productivity | Creativity | Responsiveness
| PCMark 10 / Score | |
| Average of class Gaming (5828 - 11574, n=94, last 2 years) | |
| HP Omen 16-c0077ng | |
| Dell Inspiron 16 Plus 7620 | |
| Average Intel Core i7-12700H, Intel Arc A730M (6830 - 6845, n=2) | |
| Medion Erazer Major X10 | |
| Acer Nitro 5 AN517-55-738R | |
| Asus TUF Gaming F17 FX707Z-HX011W | |
| PCMark 10 / Essentials | |
| Medion Erazer Major X10 | |
| Average Intel Core i7-12700H, Intel Arc A730M (10529 - 11116, n=2) | |
| Average of class Gaming (8810 - 12600, n=98, last 2 years) | |
| HP Omen 16-c0077ng | |
| Dell Inspiron 16 Plus 7620 | |
| Acer Nitro 5 AN517-55-738R | |
| Asus TUF Gaming F17 FX707Z-HX011W | |
| PCMark 10 / Productivity | |
| Average of class Gaming (6845 - 18766, n=96, last 2 years) | |
| HP Omen 16-c0077ng | |
| Acer Nitro 5 AN517-55-738R | |
| Dell Inspiron 16 Plus 7620 | |
| Medion Erazer Major X10 | |
| Average Intel Core i7-12700H, Intel Arc A730M (7070 - 7260, n=2) | |
| Asus TUF Gaming F17 FX707Z-HX011W | |
| PCMark 10 / Digital Content Creation | |
| Average of class Gaming (7602 - 19657, n=96, last 2 years) | |
| Average Intel Core i7-12700H, Intel Arc A730M (10714 - 11691, n=2) | |
| Medion Erazer Major X10 | |
| HP Omen 16-c0077ng | |
| Asus TUF Gaming F17 FX707Z-HX011W | |
| Dell Inspiron 16 Plus 7620 | |
| Acer Nitro 5 AN517-55-738R | |
| CrossMark / Overall | |
| Average of class Gaming (1366 - 2409, n=96, last 2 years) | |
| Average Intel Core i7-12700H, Intel Arc A730M (n=1) | |
| Acer Nitro 5 AN517-55-738R | |
| Dell Inspiron 16 Plus 7620 | |
| Asus TUF Gaming F17 FX707Z-HX011W | |
| CrossMark / Productivity | |
| Average of class Gaming (1386 - 2254, n=96, last 2 years) | |
| Average Intel Core i7-12700H, Intel Arc A730M (n=1) | |
| Acer Nitro 5 AN517-55-738R | |
| Dell Inspiron 16 Plus 7620 | |
| Asus TUF Gaming F17 FX707Z-HX011W | |
| CrossMark / Creativity | |
| Average of class Gaming (1343 - 2729, n=96, last 2 years) | |
| Asus TUF Gaming F17 FX707Z-HX011W | |
| Average Intel Core i7-12700H, Intel Arc A730M (n=1) | |
| Dell Inspiron 16 Plus 7620 | |
| Acer Nitro 5 AN517-55-738R | |
| CrossMark / Responsiveness | |
| Average Intel Core i7-12700H, Intel Arc A730M (n=1) | |
| Acer Nitro 5 AN517-55-738R | |
| Average of class Gaming (1226 - 2334, n=96, last 2 years) | |
| Dell Inspiron 16 Plus 7620 | |
| Asus TUF Gaming F17 FX707Z-HX011W | |
| PCMark 10 Score | 6830 points | |
Help | ||
| AIDA64 / Memory Copy | |
| Average of class Gaming (21750 - 129946, n=107, last 2 years) | |
| Medion Erazer Major X10 | |
| Dell Inspiron 16 Plus 7620 | |
| Average Intel Core i7-12700H (25615 - 80511, n=64) | |
| Asus TUF Gaming F17 FX707Z-HX011W | |
| Acer Nitro 5 AN517-55-738R | |
| HP Omen 16-c0077ng | |
| AIDA64 / Memory Read | |
| Average of class Gaming (22956 - 118858, n=107, last 2 years) | |
| Medion Erazer Major X10 | |
| Asus TUF Gaming F17 FX707Z-HX011W | |
| Dell Inspiron 16 Plus 7620 | |
| Average Intel Core i7-12700H (25586 - 79442, n=64) | |
| HP Omen 16-c0077ng | |
| Acer Nitro 5 AN517-55-738R | |
| AIDA64 / Memory Write | |
| Average of class Gaming (22297 - 135096, n=107, last 2 years) | |
| Medion Erazer Major X10 | |
| Asus TUF Gaming F17 FX707Z-HX011W | |
| Dell Inspiron 16 Plus 7620 | |
| Average Intel Core i7-12700H (23679 - 88660, n=64) | |
| Acer Nitro 5 AN517-55-738R | |
| HP Omen 16-c0077ng | |
| AIDA64 / Memory Latency | |
| Average of class Gaming (75.3 - 259, n=107, last 2 years) | |
| Dell Inspiron 16 Plus 7620 | |
| HP Omen 16-c0077ng | |
| Average Intel Core i7-12700H (76.2 - 133.9, n=62) | |
| Asus TUF Gaming F17 FX707Z-HX011W | |
| Acer Nitro 5 AN517-55-738R | |
* ... smaller is better
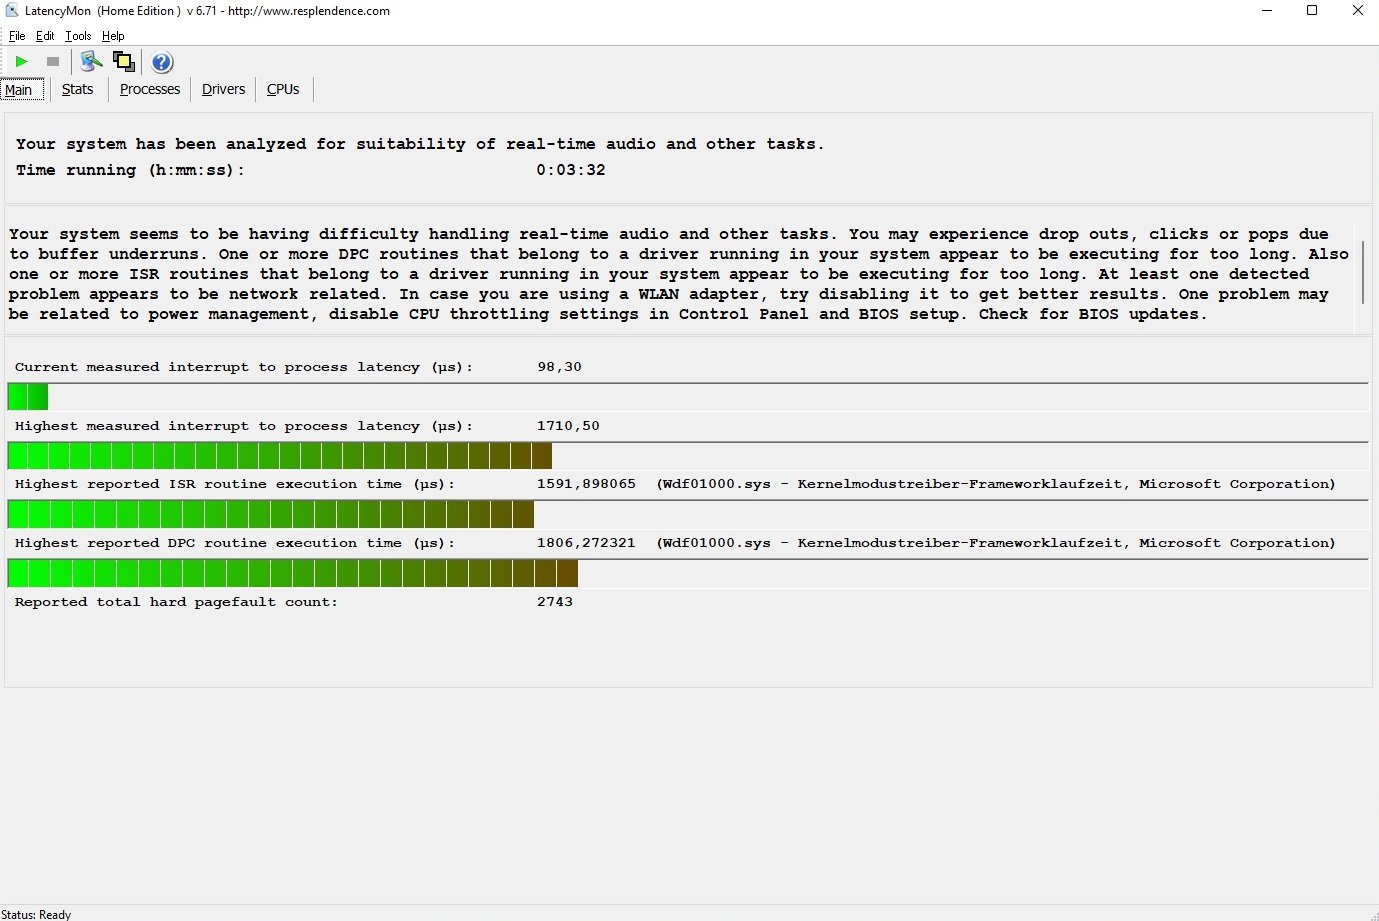
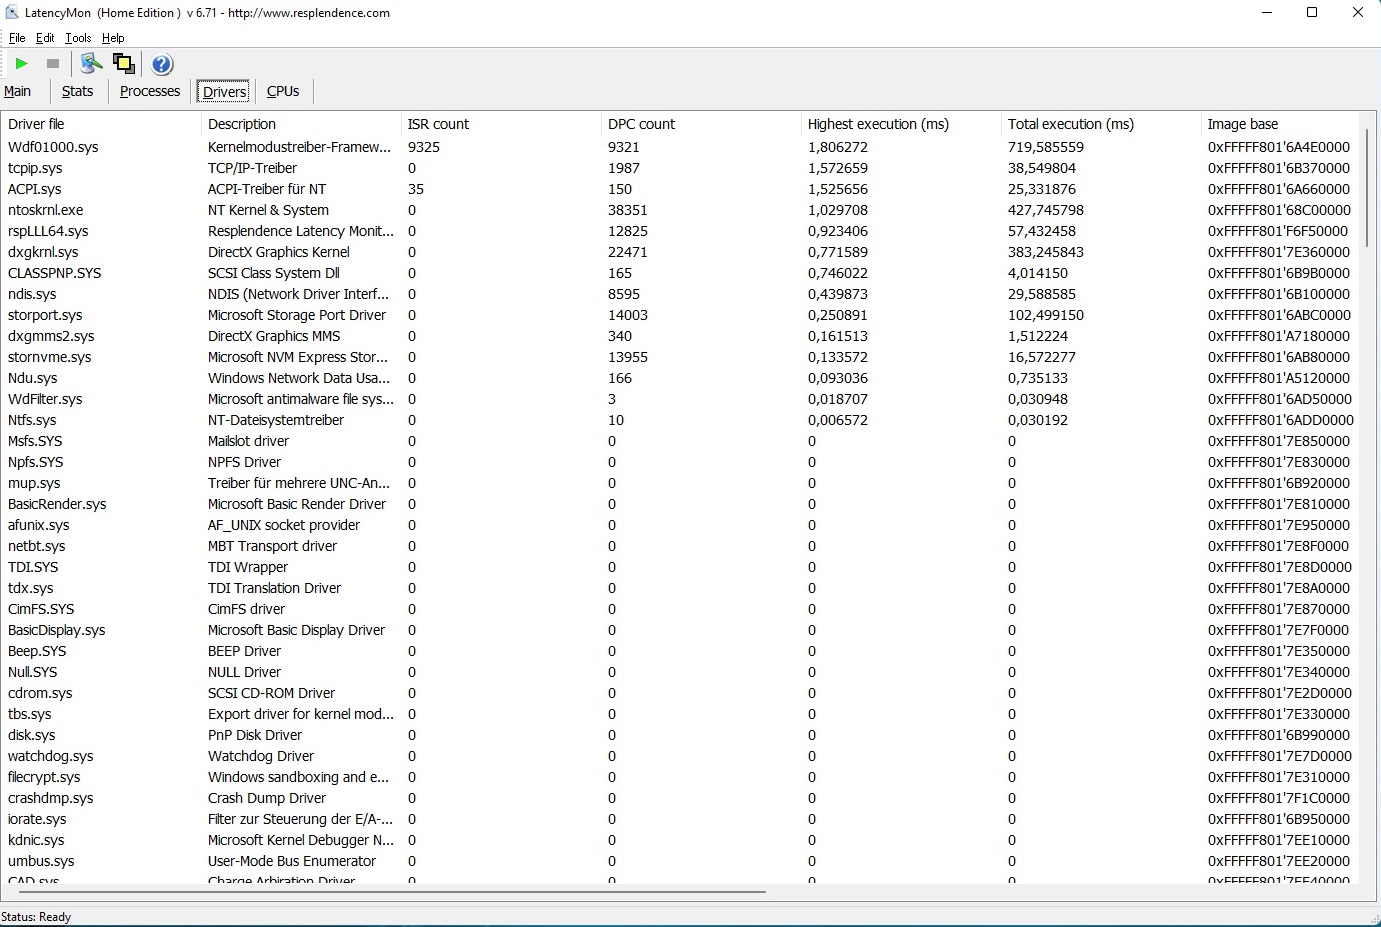
DPC延时
正如笔记本电脑经常出现的情况一样,Major X10在延迟方面有一些问题。根据LatencyMon,该笔记本电脑只适合在有限的范围内进行实时音频和视频处理。
| DPC Latencies / LatencyMon - interrupt to process latency (max), Web, Youtube, Prime95 | |
| Asus TUF Gaming F17 FX707Z-HX011W | |
| HP Omen 16-c0077ng | |
| Medion Erazer Major X10 | |
| Acer Nitro 5 AN517-55-738R | |
| Dell Inspiron 16 Plus 7620 | |
* ... smaller is better
大容量存储
Major X10内置的NVMe固态硬盘具有高于平均水平的速度,会让竞争对手感到紧张。它具有出色的连续读取和写入速度,分别超过5,000 MB/s和4,000 MB/s(使用AS SSD Benchmark获得)。还有第二个PCIe M.2插槽,如果将来需要,你可以方便地扩展存储。

| Drive Performance rating - Percent | |
| Medion Erazer Major X10 | |
| Average of class Gaming | |
| Acer Nitro 5 AN517-55-738R | |
| HP Omen 16-c0077ng | |
| Asus TUF Gaming F17 FX707Z-HX011W | |
| Dell Inspiron 16 Plus 7620 | |
* ... smaller is better
Sustained Performance Read: DiskSpd Read Loop, Queue Depth 8
图形卡
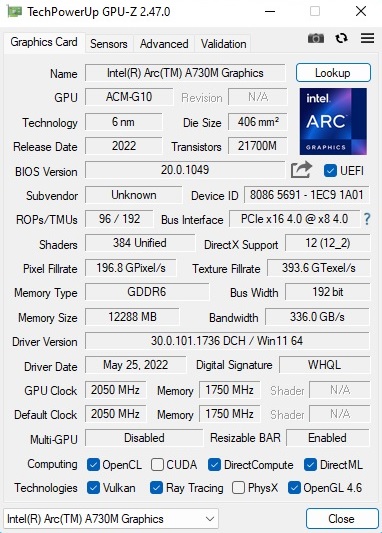
我们已经来到了Major X10最有趣的部分:它的显卡。这是英特尔Arc A730M(24个Xe核心和24个光线追踪单元)首次出现在我们的测试平台上。当涉及到合成图形基准时,英特尔GPU是一个出色的表现者。在3DMark测试中,它明显超过了GeForce RTX 3050 Ti,与GeForce RTX 3060和Radeon RX 6600M处于同一水平。启用Turbo模式后,Medion笔记本电脑能够从GPU中获得多出近20%的性能,并在我们的比较中加速超过其他设备。更多基准测试结果可以在 我们关于Arc A730M的页面.
| 3DMark Performance rating - Percent | |
| Average of class Gaming | |
| Medion Erazer Major X10 Turbo Mode | |
| HP Omen 16-c0077ng -1! | |
| Asus TUF Gaming F17 FX707Z-HX011W -1! | |
| Average Intel Arc A730M | |
| Acer Nitro 5 AN517-55-738R | |
| Medion Erazer Major X10 | |
| Dell Inspiron 16 Plus 7620 -1! | |
| 3DMark 11 - 1280x720 Performance GPU | |
| Average of class Gaming (21841 - 80022, n=106, last 2 years) | |
| HP Omen 16-c0077ng | |
| Medion Erazer Major X10 Turbo Mode | |
| Asus TUF Gaming F17 FX707Z-HX011W | |
| Average Intel Arc A730M (24928 - 31551, n=4) | |
| Acer Nitro 5 AN517-55-738R | |
| Medion Erazer Major X10 | |
| Dell Inspiron 16 Plus 7620 | |
| 3DMark | |
| 1920x1080 Fire Strike Graphics | |
| Average of class Gaming (12242 - 62849, n=118, last 2 years) | |
| HP Omen 16-c0077ng | |
| Asus TUF Gaming F17 FX707Z-HX011W | |
| Medion Erazer Major X10 Turbo Mode | |
| Acer Nitro 5 AN517-55-738R | |
| Average Intel Arc A730M (19850 - 22620, n=4) | |
| Medion Erazer Major X10 | |
| Dell Inspiron 16 Plus 7620 | |
| 2560x1440 Time Spy Graphics | |
| Average of class Gaming (5012 - 26212, n=117, last 2 years) | |
| Medion Erazer Major X10 Turbo Mode | |
| Asus TUF Gaming F17 FX707Z-HX011W | |
| Average Intel Arc A730M (7212 - 10352, n=4) | |
| Medion Erazer Major X10 | |
| Acer Nitro 5 AN517-55-738R | |
| HP Omen 16-c0077ng | |
| Dell Inspiron 16 Plus 7620 | |
| 2560x1440 Port Royal Graphics | |
| Average of class Gaming (4395 - 17286, n=70, last 2 years) | |
| Medion Erazer Major X10 Turbo Mode | |
| Acer Nitro 5 AN517-55-738R | |
| Average Intel Arc A730M (3758 - 5678, n=3) | |
| Medion Erazer Major X10 | |
| 3DMark 06 Standard Score | 46579 points | |
| 3DMark Vantage P Result | 63844 points | |
| 3DMark 11 Performance | 24223 points | |
| 3DMark Ice Storm Standard Score | 119799 points | |
| 3DMark Cloud Gate Standard Score | 44757 points | |
| 3DMark Fire Strike Score | 18543 points | |
| 3DMark Time Spy Score | 9041 points | |
Help | ||
游戏性能
相比之下,GPU在游戏基准测试中的情况非常复杂。即使A730M有时能够挑战RTX 3060和RX 6600M,但它经常只是徘徊在GeForce RTX 3050 Ti的性能水平,这通常出现在更便宜的游戏笔记本电脑中。在最坏的情况下,A730M甚至比RTX 3050 Ti还慢。考虑到GPU的价格和规格(12GB对4GB的VRAM),这是相当令人失望的。英特尔真的应该继续改善驱动支持。与我们在iGPU中看到的情况类似,一些游戏运行时出现了视觉伪影或其他杂项问题。我们还不得不处理偶尔的崩溃问题。也就是说,图形切换似乎工作良好。我们测试中使用的所有游戏都是直接分配给dGPU的。从根本上说,Arc A730M或多或少是为全高清显示器设计的。在1,920 x 1,080的分辨率下,几乎所有游戏在细节设置为高或非常高的情况下都能顺利运行。同时,更高的分辨率(如原生的2,560 x 1,600)使英特尔GPU达到极限。关于更多的GPU比较,你可以查看我们的游戏列表.
| The Witcher 3 | |
| 1920x1080 High Graphics & Postprocessing (Nvidia HairWorks Off) | |
| Average of class Gaming (181 - 341, n=3, last 2 years) | |
| Asus TUF Gaming F17 FX707Z-HX011W | |
| Acer Nitro 5 AN517-55-738R | |
| HP Omen 16-c0077ng | |
| Medion Erazer Major X10 | |
| Dell Inspiron 16 Plus 7620 | |
| 1920x1080 Ultra Graphics & Postprocessing (HBAO+) | |
| Average of class Gaming (95 - 240, n=8, last 2 years) | |
| Asus TUF Gaming F17 FX707Z-HX011W | |
| HP Omen 16-c0077ng | |
| Acer Nitro 5 AN517-55-738R | |
| Dell Inspiron 16 Plus 7620 | |
| Medion Erazer Major X10 | |
我们运行 在笔记本电脑上运行了Witcher 3在笔记本电脑上运行了一个小时,以检查3D性能在较长时间内的保持情况。结果是:没有出现性能下降或任何类似问题。
Witcher 3 FPS graph
| low | med. | high | ultra | QHD | |
|---|---|---|---|---|---|
| GTA V (2015) | 165.9 | 100.3 | 42.8 | ||
| The Witcher 3 (2015) | 212 | 114 | 49.4 | ||
| Dota 2 Reborn (2015) | 109.3 | 94.2 | 90.4 | 80.4 | |
| Final Fantasy XV Benchmark (2018) | 71 | 49.7 | |||
| X-Plane 11.11 (2018) | 57.3 | 47.1 | 38.6 | ||
| Far Cry 5 (2018) | 92 | 83 | 78 | ||
| Strange Brigade (2018) | 178.2 | 148.8 | 124.1 | ||
| Hunt Showdown (2020) | 88.2 | 72.3 | 50.1 | ||
| Doom Eternal (2020) | 112.4 | 104.2 | 101.7 | 70.9 | |
| Gears Tactics (2020) | 147 | 99.2 | 79.7 | 52 | |
| Death Stranding (2020) | 89.8 | 82.9 | 81.9 | 60 | |
| Crysis Remastered (2020) | 125.4 | 60.7 | 50.1 | 34.8 | |
| Serious Sam 4 (2020) | 72.7 | 54.8 | 42.5 | 34.7 | |
| Mafia Definitive Edition (2020) | 55.4 | 52.7 | 36.9 | ||
| Star Wars Squadrons (2020) | 167.1 | 149.4 | 140.6 | 97.4 | |
| Watch Dogs Legion (2020) | 85 | 75 | 48 | 35 | |
| Dirt 5 (2020) | 80.6 | 64.5 | 54 | 44.2 | |
| Assassin´s Creed Valhalla (2020) | 64 | 54 | 48 | 37 | |
| Yakuza Like a Dragon (2020) | 51.3 | 47.3 | 46.1 | 39.4 | |
| Hitman 3 (2021) | 123 | 109 | 102 | 65 | |
| Outriders (2021) | 90 | 76.1 | 69 | 43.9 | |
| Resident Evil Village (2021) | 119.9 | 107.8 | 93.3 | 61.1 | |
| Mass Effect Legendary Edition (2021) | 88.5 | 81.9 | |||
| Days Gone (2021) | 80.2 | 76 | 58.2 | 42 | |
| Deathloop (2021) | 76.2 | 65.5 | 54.6 | 37 | |
| Alan Wake Remastered (2021) | 116.7 | 98.6 | 67.5 | ||
| Far Cry 6 (2021) | 87 | 75 | 65 | 47 | |
| Back 4 Blood (2021) | 132.9 | 115.4 | 105.9 | 68.3 | |
| Guardians of the Galaxy (2021) | 81 | 76 | 73 | 52 | |
| Riders Republic (2021) | 60 | 51 | 47 | 34 | |
| Forza Horizon 5 (2021) | 86 | 80 | 50 | 41 | |
| Farming Simulator 22 (2021) | 136.6 | 110.8 | 107.2 | 80.5 | |
| Halo Infinite (2021) | 67.2 | 59.8 | 56.2 | 42.3 | |
| God of War (2022) | 53.1 | 44.9 | 36.9 | 30.7 | |
| Rainbow Six Extraction (2022) | 103 | 99 | 83 | 55 | |
| Dying Light 2 (2022) | 60.9 | 51.2 | 35.6 | ||
| GRID Legends (2022) | 109 | 91 | 71 | 56.9 | |
| Elden Ring (2022) | 59.9 | 59.7 | 56.9 | 46.2 | |
| Cyberpunk 2077 1.6 (2022) | 71 | 57.5 | 57.4 | 30.9 | |
| Elex 2 (2022) | 49.7 | 48.8 | 43.3 | 36.5 | |
| Ghostwire Tokyo (2022) | 85.4 | 83.6 | 83.3 | 52.3 | |
| Tiny Tina's Wonderlands (2022) | 86.6 | 64.6 | 52 | 35.5 | |
| Vampire Bloodhunt (2022) | 135.8 | 121.5 | 111.9 | 71.4 | |
| F1 22 (2022) | 124 | 104 | 35 | 23.4 | |
| The Quarry (2022) | 58.9 | 47.5 | 38.1 | 24.8 |
排放
噪声排放
当Major X10在游戏模式下运行时,可以明显听到声音。负载下的噪音水平可以达到49至51 dB(A),许多用户可能会认为这很烦人。也就是说,其他游戏笔记本也可以和Major X10一样响,甚至比它更响。我们肯定会建议使用耳机。在空闲状态下,你可以预期该设备会产生30至31 dB(A)的噪音,这相当明显,但不是特别安静。16英寸笔记本很少完全安静,因为风扇通常在运行。
Noise level
| Idle |
| 25 / 30 / 31 dB(A) |
| Load |
| 49 / 51 dB(A) |
 | ||
30 dB silent 40 dB(A) audible 50 dB(A) loud |
||
min: | ||
| Medion Erazer Major X10 i7-12700H, A730M | Asus TUF Gaming F17 FX707Z-HX011W i7-12700H, GeForce RTX 3060 Laptop GPU | Acer Nitro 5 AN517-55-738R i7-12700H, GeForce RTX 3060 Laptop GPU | Dell Inspiron 16 Plus 7620 i7-12700H, GeForce RTX 3050 Ti Laptop GPU | HP Omen 16-c0077ng R7 5800H, Radeon RX 6600M | |
|---|---|---|---|---|---|
| Noise | 11% | -3% | 4% | -6% | |
| off / environment * (dB) | 25 | 24 4% | 25.5 -2% | 23.3 7% | 25 -0% |
| Idle Minimum * (dB) | 25 | 24 4% | 25.5 -2% | 25.7 -3% | 25 -0% |
| Idle Average * (dB) | 30 | 24 20% | 25.5 15% | 26.1 13% | 31.2 -4% |
| Idle Maximum * (dB) | 31 | 24 23% | 27 13% | 30.6 1% | 33.8 -9% |
| Load Average * (dB) | 49 | 42.6 13% | 52.6 -7% | 46.2 6% | 55.4 -13% |
| Witcher 3 ultra * (dB) | 50 | 46.84 6% | 49.2 2% | ||
| Load Maximum * (dB) | 51 | 46.84 8% | 68.2 -34% | 49.4 3% | 56 -10% |
* ... smaller is better
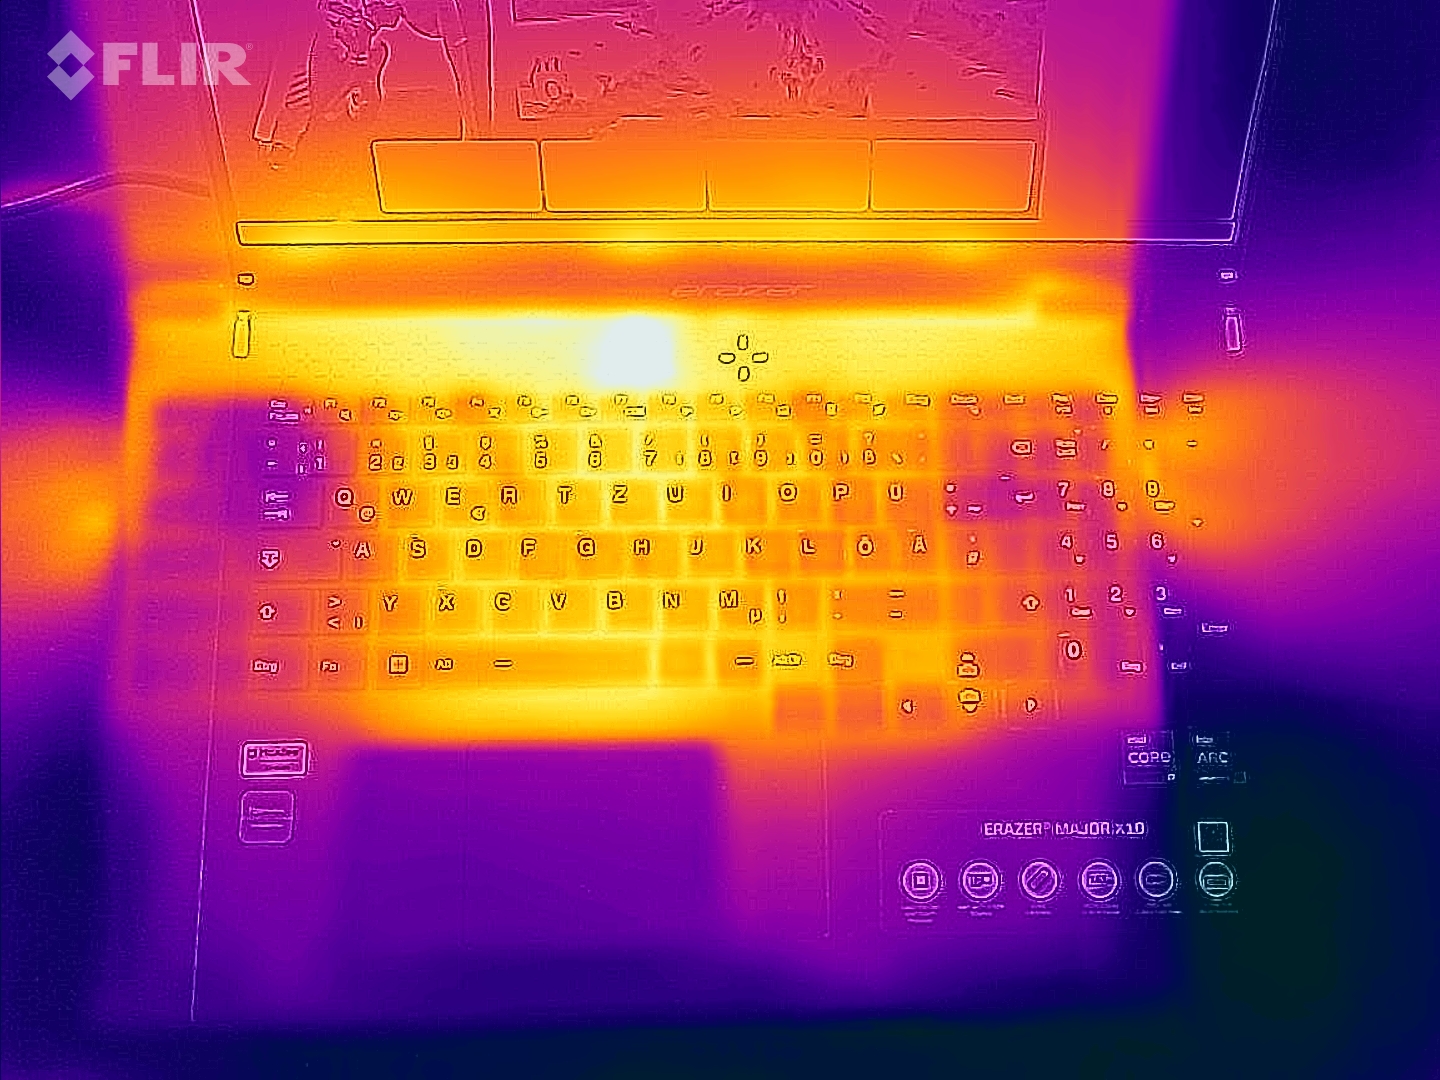
温度
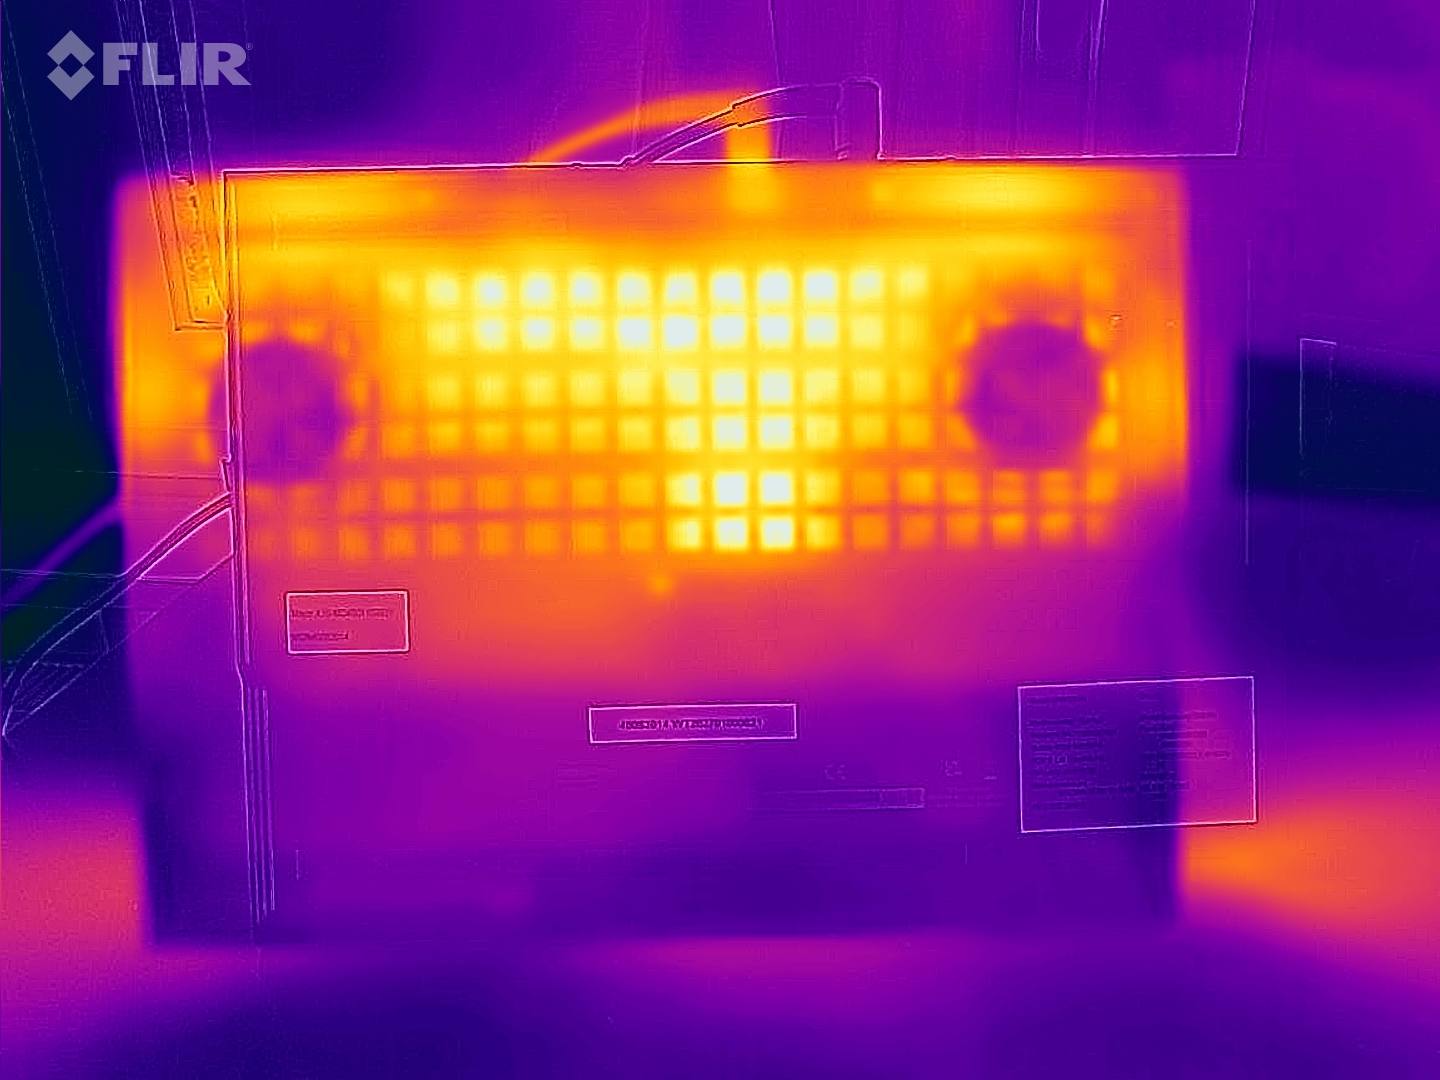
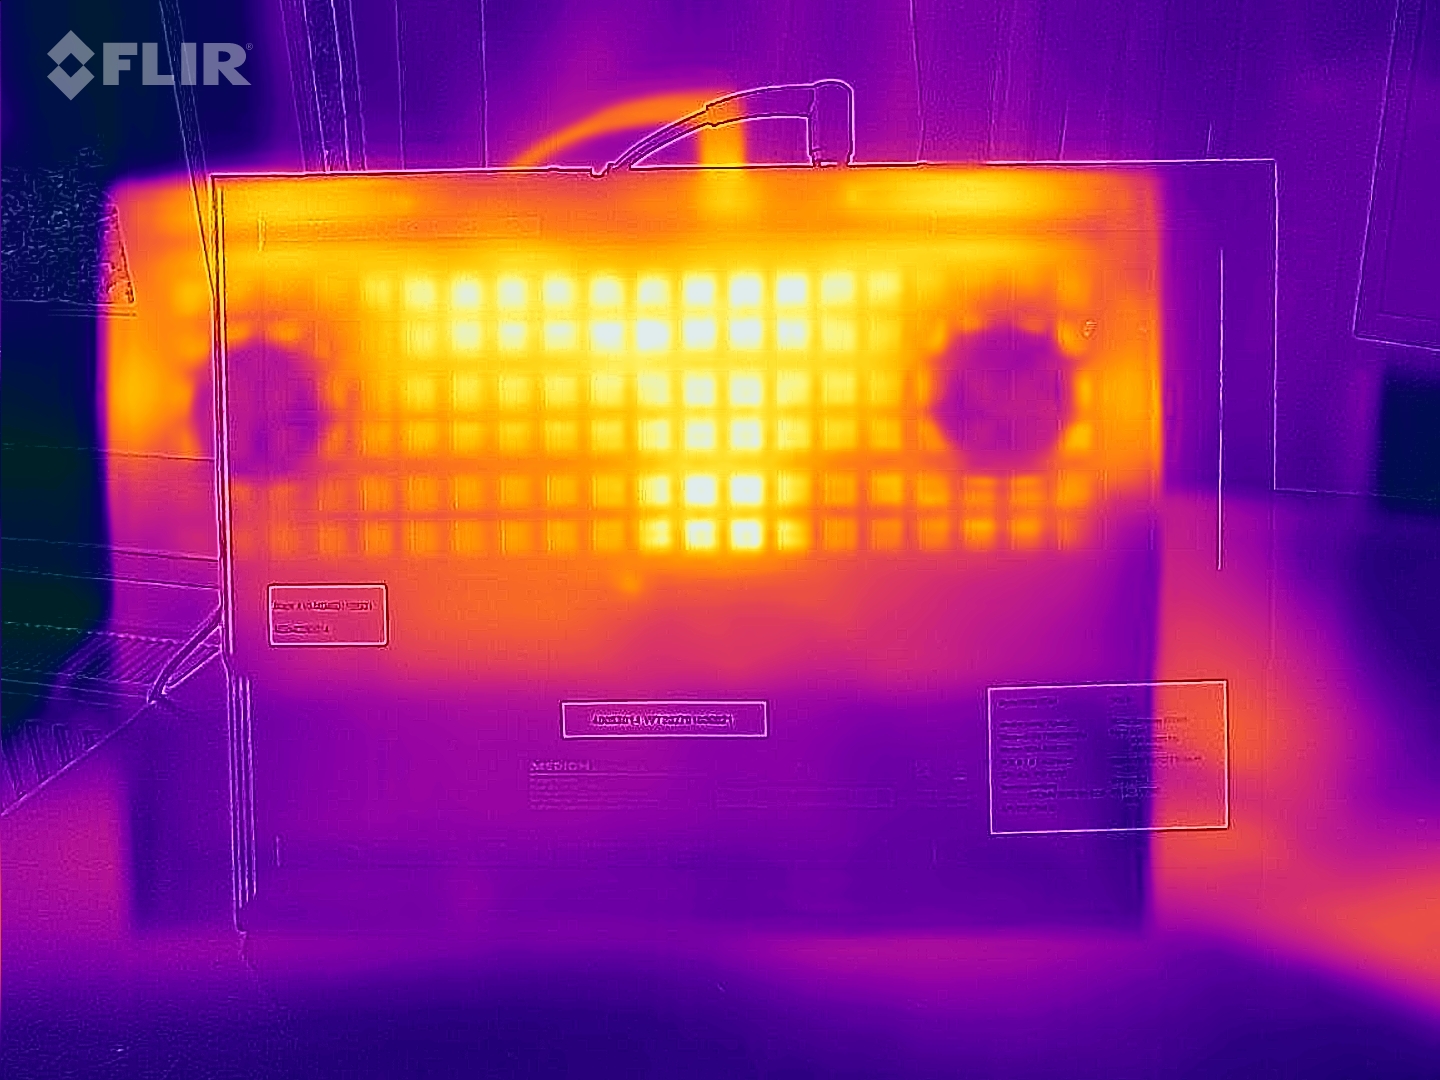
底盘温度给我们留下了复杂的感觉。一方面,机箱在闲置时比其竞争对手更热,顶部温度高达45°C(113°F),底部温度为48°C(118°F)。另一方面,当设备满负荷运行时,它不会变得太热。尽管如此,在游戏过程中,你可能仍然不应该把设备放在你的膝盖上。
(±) The maximum temperature on the upper side is 45 °C / 113 F, compared to the average of 40.4 °C / 105 F, ranging from 21.2 to 68.8 °C for the class Gaming.
(-) The bottom heats up to a maximum of 48 °C / 118 F, compared to the average of 43.2 °C / 110 F
(±) In idle usage, the average temperature for the upper side is 32.7 °C / 91 F, compared to the device average of 33.9 °C / 93 F.
(-) Playing The Witcher 3, the average temperature for the upper side is 40.9 °C / 106 F, compared to the device average of 33.9 °C / 93 F.
(±) The palmrests and touchpad can get very hot to the touch with a maximum of 38 °C / 100.4 F.
(-) The average temperature of the palmrest area of similar devices was 28.8 °C / 83.8 F (-9.2 °C / -16.6 F).
| Medion Erazer Major X10 i7-12700H, A730M | Asus TUF Gaming F17 FX707Z-HX011W i7-12700H, GeForce RTX 3060 Laptop GPU | Acer Nitro 5 AN517-55-738R i7-12700H, GeForce RTX 3060 Laptop GPU | Dell Inspiron 16 Plus 7620 i7-12700H, GeForce RTX 3050 Ti Laptop GPU | HP Omen 16-c0077ng R7 5800H, Radeon RX 6600M | |
|---|---|---|---|---|---|
| Heat | 6% | 1% | 12% | 15% | |
| Maximum Upper Side * (°C) | 45 | 52 -16% | 48.3 -7% | 46 -2% | 40.6 10% |
| Maximum Bottom * (°C) | 48 | 47 2% | 52 -8% | 45.8 5% | 36 25% |
| Idle Upper Side * (°C) | 38 | 31 18% | 34.5 9% | 29.2 23% | 31.3 18% |
| Idle Bottom * (°C) | 39 | 31 21% | 35.8 8% | 31 21% | 36 8% |
* ... smaller is better
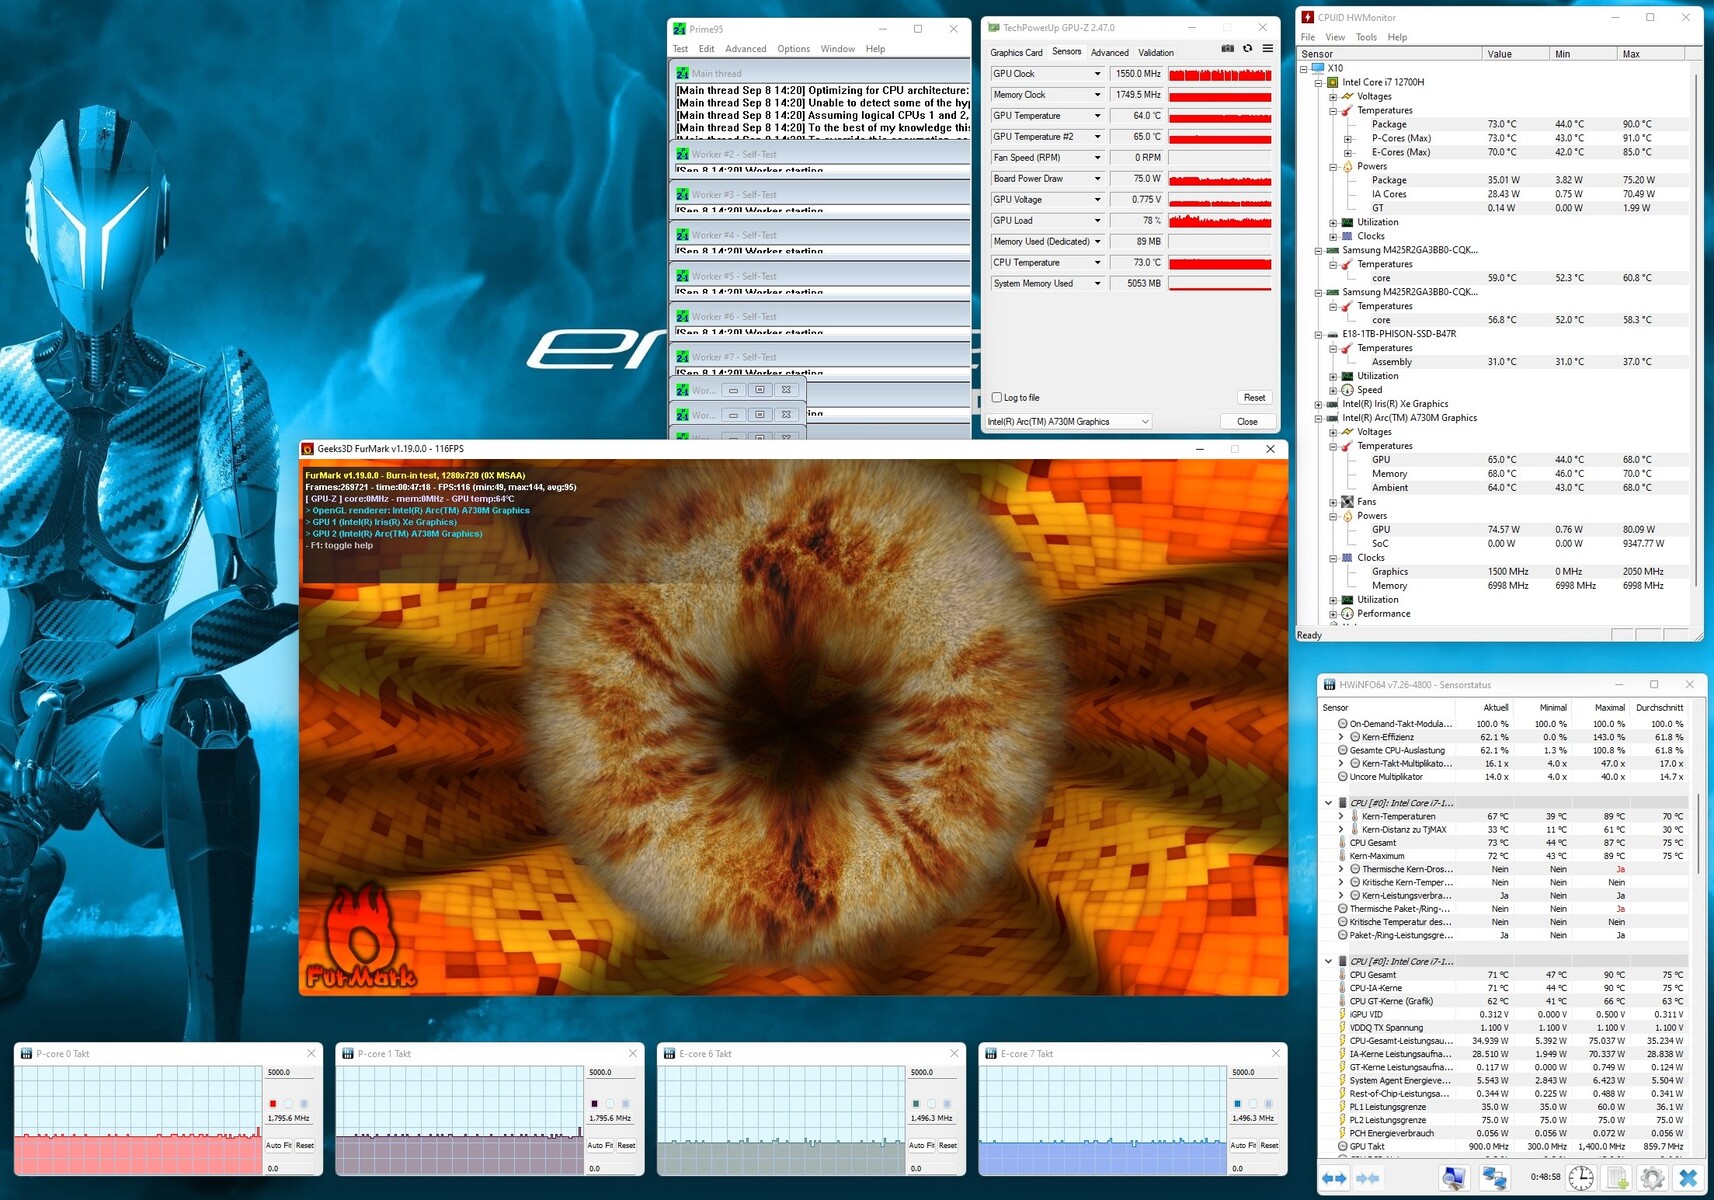
压力测试
与Witcher 3 ,Arc A730M完成了一小时的压力测试(运行FurMark和Prime95),平均温度约为65℃(149℉)。同时,酷睿i7-12700H轻而易举地通过了测试,运行温度略高于70°C(158°F),这对CPU来说也是绝对安全的。
Medion Erazer Major X10 audio analysis
(+) | speakers can play relatively loud (82 dB)
Bass 100 - 315 Hz
(-) | nearly no bass - on average 16.1% lower than median
(±) | linearity of bass is average (12.9% delta to prev. frequency)
Mids 400 - 2000 Hz
(±) | higher mids - on average 6.9% higher than median
(+) | mids are linear (4.3% delta to prev. frequency)
Highs 2 - 16 kHz
(+) | balanced highs - only 3.2% away from median
(+) | highs are linear (6.7% delta to prev. frequency)
Overall 100 - 16.000 Hz
(±) | linearity of overall sound is average (17.5% difference to median)
Compared to same class
» 49% of all tested devices in this class were better, 12% similar, 40% worse
» The best had a delta of 6%, average was 18%, worst was 132%
Compared to all devices tested
» 34% of all tested devices were better, 8% similar, 58% worse
» The best had a delta of 4%, average was 24%, worst was 134%
Asus TUF Gaming F17 FX707Z-HX011W audio analysis
(±) | speaker loudness is average but good (79.5 dB)
Bass 100 - 315 Hz
(±) | reduced bass - on average 13.1% lower than median
(±) | linearity of bass is average (9% delta to prev. frequency)
Mids 400 - 2000 Hz
(±) | higher mids - on average 9.1% higher than median
(±) | linearity of mids is average (7.8% delta to prev. frequency)
Highs 2 - 16 kHz
(+) | balanced highs - only 3.9% away from median
(±) | linearity of highs is average (9.1% delta to prev. frequency)
Overall 100 - 16.000 Hz
(±) | linearity of overall sound is average (20.4% difference to median)
Compared to same class
» 72% of all tested devices in this class were better, 6% similar, 22% worse
» The best had a delta of 6%, average was 18%, worst was 132%
Compared to all devices tested
» 53% of all tested devices were better, 8% similar, 39% worse
» The best had a delta of 4%, average was 24%, worst was 134%
发言人
Major X10的音质在游戏笔记本中属于平均水平。正如通常的情况一样,扬声器主要缺乏低音。因此,如果你想真正享受笔记本上的音乐和视频,你应该尽可能地拿一副耳机。
电源管理
消耗功率
很难理解为什么Medion将一个笨重的300瓦的电源与笔记本放在一起。在我们的压力测试中,Major X10使用的功率不超过220瓦,这表明一个更紧凑的230瓦的充电器会更合理。在负载情况下,该设备消耗122至220瓦的电力,这与配备RTX 3060的笔记本电脑相似。然而,其24至36瓦的高空闲功耗使其在对比组中稳居榜首。
| Off / Standby | |
| Idle | |
| Load |
|
Key:
min: | |
| Medion Erazer Major X10 i7-12700H, A730M | Asus TUF Gaming F17 FX707Z-HX011W i7-12700H, GeForce RTX 3060 Laptop GPU | Acer Nitro 5 AN517-55-738R i7-12700H, GeForce RTX 3060 Laptop GPU | Dell Inspiron 16 Plus 7620 i7-12700H, GeForce RTX 3050 Ti Laptop GPU | HP Omen 16-c0077ng R7 5800H, Radeon RX 6600M | Average of class Gaming | |
|---|---|---|---|---|---|---|
| Power Consumption | 33% | 23% | 43% | 13% | 20% | |
| Idle Minimum * (Watt) | 24 | 6.6 73% | 9.7 60% | 6.8 72% | 12 50% | 13.2 ? 45% |
| Idle Average * (Watt) | 26 | 8.3 68% | 14.6 44% | 9.6 63% | 12.8 51% | 18.9 ? 27% |
| Idle Maximum * (Watt) | 36 | 11.8 67% | 16.7 54% | 17 53% | 18.5 49% | 24.3 ? 32% |
| Load Average * (Watt) | 122 | 119 2% | 166 -36% | 117.5 4% | 190 -56% | 108.3 ? 11% |
| Witcher 3 ultra * (Watt) | 155.6 | 169 -9% | 113.1 27% | 194 -25% | ||
| Load Maximum * (Watt) | 220 | 222 -1% | 235 -7% | 137.4 38% | 200 9% | 254 ? -15% |
* ... smaller is better
Power consumption Witcher 3 / Stress test
Power consumption with external monitor
电池寿命
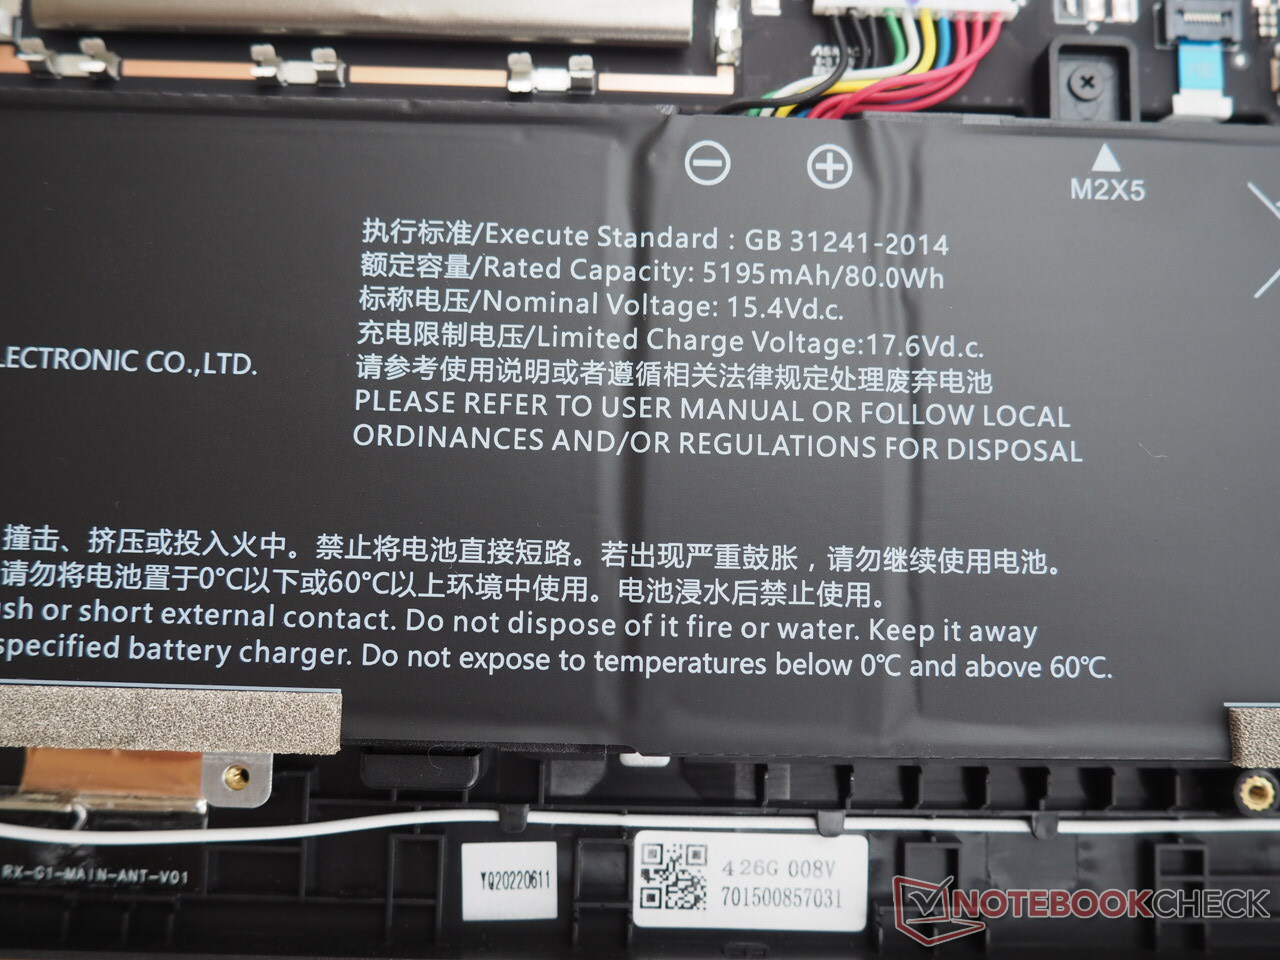
尽管Major X10的电池容量不错(80Wh),但它并不完全具备强大的耐力,在这方面经常落后于竞争对手。然而,当我们用它在中等屏幕亮度下通过Wi-Fi浏览互联网时,它的续航能力相当可观,达到6.5小时。
| Medion Erazer Major X10 i7-12700H, A730M, 80 Wh | Asus TUF Gaming F17 FX707Z-HX011W i7-12700H, GeForce RTX 3060 Laptop GPU, 90 Wh | Acer Nitro 5 AN517-55-738R i7-12700H, GeForce RTX 3060 Laptop GPU, 90.61 Wh | Dell Inspiron 16 Plus 7620 i7-12700H, GeForce RTX 3050 Ti Laptop GPU, 86 Wh | HP Omen 16-c0077ng R7 5800H, Radeon RX 6600M, 70 Wh | Average of class Gaming | |
|---|---|---|---|---|---|---|
| Battery runtime | 109% | 59% | 73% | -9% | 32% | |
| Reader / Idle (h) | 8.2 | 11.7 43% | 18.6 127% | 8.71 ? 6% | ||
| WiFi v1.3 (h) | 6.7 | 8.7 30% | 6.5 -3% | 9.6 43% | 6.1 -9% | 7.04 ? 5% |
| Load (h) | 0.8 | 2.3 187% | 1.9 137% | 1.2 50% | 1.47 ? 84% | |
| H.264 (h) | 7.7 | 5.3 | 7 | 8.26 ? | ||
| Witcher 3 ultra (h) | 1.4 |
Pros
Cons
判决书
对于它所提供的游戏性能来说太昂贵了:这就是Medion Erazer Major X10可以被概括的方式。
虽然英特尔Arc A730M 在合成基准中表现相对较好,并在与GeForce RTX 3060 和Radeon RX 6600M 的竞争中表现出色,但其各种弱点和性能异常在实际游戏中变得明显,其性能水平与GeForce RTX 3050 Ti 相当甚至更差。因此,就性价比而言,很难推荐Arc A730M,特别是考虑到其电源效率仍有待提高。
否则,Major X10在大多数情况下是相当令人印象深刻的。特别是16英寸的屏幕,由于其16:10的长宽比、高分辨率(2,560 x 1,600)、高峰值亮度和出色的色彩再现,为购买该笔记本电脑提供了一个令人信服的理由。
总的来说,我们只向铁杆英特尔粉丝或那些对显示器极为挑剔的人推荐Major X10。所有其他需要或想要注意预算的游戏玩家可能应该看看带有RTX 3060或具有类似性能的GPU的笔记本电脑。Medion目前提供了一些具有这种规格的设备(更不用说它们通常更便宜)。
价格和可用性
Erazer Major X10配备酷睿i7-12700H、Arc A730M、32GB内存和1TB固态硬盘存储,价格约为1700欧元(1728美元),可从Medion的德国在线商店购买。.在本评论发表时,这款笔记本电脑还没有在其他地区上市。
Medion Erazer Major X10
- 09/12/2022 v7 (old)
Florian Glaser
Price comparison

