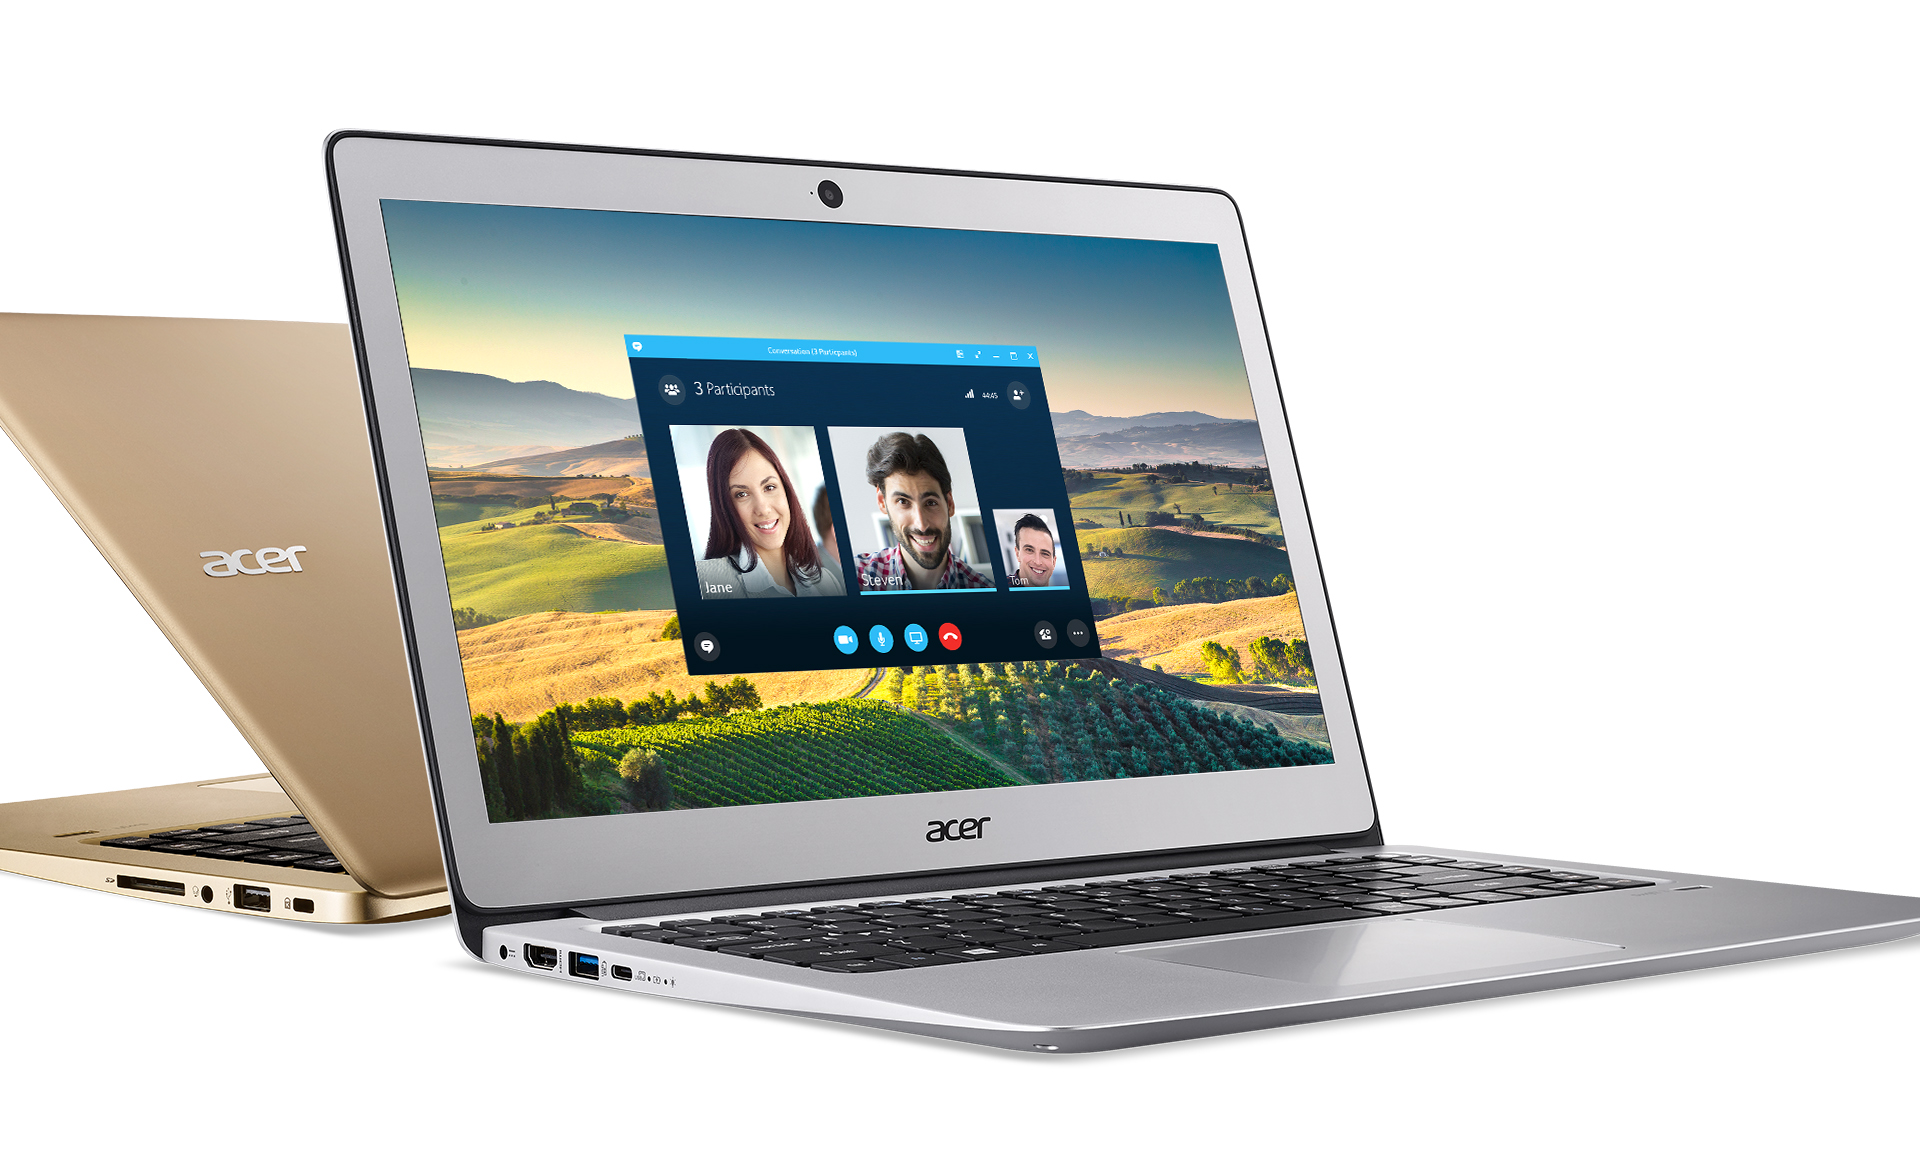
宏碁 Swift 3 SF314-51-731X 笔记本电脑简短评测

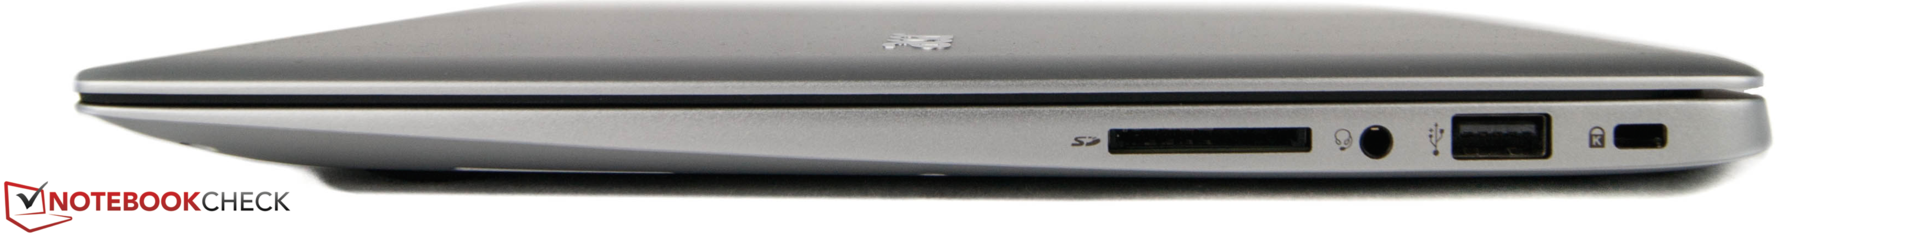

| SD Card Reader | |
| average JPG Copy Test (av. of 3 runs) | |
| Acer Aspire S 13 S5-371-71QZ | |
| Lenovo Ideapad 500s-14ISK | |
| Asus Zenbook UX330UA-FC059T | |
| Acer Swift 3 SF314-51-731X | |
| Acer TravelMate X3 X349-M-7261 | |
| maximum AS SSD Seq Read Test (1GB) | |
| Lenovo Ideapad 500s-14ISK | |
| Acer Aspire S 13 S5-371-71QZ | |
| Asus Zenbook UX330UA-FC059T | |
| Acer Swift 3 SF314-51-731X | |
| Acer TravelMate X3 X349-M-7261 | |
| Networking | |
| iperf Server (receive) TCP 1 m (sort by value) | |
| Acer Swift 3 SF314-51-731X (jseb) | |
| Asus Zenbook UX330UA-FC059T | |
| Acer Aspire S 13 S5-371-71QZ | |
| Acer TravelMate X3 X349-M-7261 (jseb) | |
| Dell XPS 13 2016 9350 (FHD, i7-6560U) | |
| iperf Client (transmit) TCP 1 m (sort by value) | |
| Acer Swift 3 SF314-51-731X (jseb) | |
| Asus Zenbook UX330UA-FC059T (jseb) | |
| Acer Aspire S 13 S5-371-71QZ | |
| Acer TravelMate X3 X349-M-7261 (jseb) | |
| Dell XPS 13 2016 9350 (FHD, i7-6560U) | |
| |||||||||||||||||||||||||
Brightness Distribution: 91 %
Center on Battery: 215 cd/m²
Contrast: 694:1 (Black: 0.31 cd/m²)
ΔE ColorChecker Calman: 5.6 | ∀{0.5-29.43 Ø4.71}
ΔE Greyscale Calman: 4.2 | ∀{0.09-98 Ø4.96}
55% sRGB (Argyll 1.6.3 3D)
35% AdobeRGB 1998 (Argyll 1.6.3 3D)
37.81% AdobeRGB 1998 (Argyll 3D)
55% sRGB (Argyll 3D)
36.59% Display P3 (Argyll 3D)
Gamma: 2.46
CCT: 6564 K
| Acer Swift 3 SF314-51-731X AU Optronics AUO213D B140HAN02.1, , 1920x1080, 14" | Dell XPS 13 2016 9350 (FHD, i7-6560U) Sharp SHP1449 LQ133M1, , 1920x1080, 13.3" | Asus Zenbook UX330UA-FC059T AU Optronics AUO272D / B133HAN02.7, , 1920x1080, 13.3" | Acer Aspire S 13 S5-371-71QZ AUO B133HAN04.1, , 1920x1080, 13.3" | Acer TravelMate X3 X349-M-7261 AU Optronics B140HAN02.1, , 1920x1080, 14" | Lenovo Ideapad 500s-14ISK Chi Mei CMN14A7, , 1920x1080, 14" | |
|---|---|---|---|---|---|---|
| Display | 50% | 71% | 1% | 11% | ||
| Display P3 Coverage (%) | 36.59 | 54.8 50% | 64.2 75% | 36.97 1% | 40.74 11% | |
| sRGB Coverage (%) | 55 | 82.3 50% | 90.6 65% | 55.6 1% | 60.6 10% | |
| AdobeRGB 1998 Coverage (%) | 37.81 | 56.6 50% | 65.3 73% | 38.2 1% | 42.15 11% | |
| Response Times | -3% | 10% | -21% | -9% | 1% | |
| Response Time Grey 50% / Grey 80% * (ms) | 42 ? | 42.8 ? -2% | 32 ? 24% | 50 ? -19% | 42 ? -0% | 43 ? -2% |
| Response Time Black / White * (ms) | 24 ? | 24.8 ? -3% | 25 ? -4% | 29.6 ? -23% | 28 ? -17% | 23 ? 4% |
| PWM Frequency (Hz) | 200 ? | |||||
| Screen | 60% | 40% | 33% | 15% | -27% | |
| Brightness middle (cd/m²) | 215 | 385 79% | 360 67% | 375 74% | 230 7% | 249 16% |
| Brightness (cd/m²) | 208 | 350 68% | 337 62% | 358 72% | 226 9% | 235 13% |
| Brightness Distribution (%) | 91 | 86 -5% | 86 -5% | 87 -4% | 86 -5% | 87 -4% |
| Black Level * (cd/m²) | 0.31 | 0.17 45% | 0.22 29% | 0.39 -26% | 0.2 35% | 0.44 -42% |
| Contrast (:1) | 694 | 2265 226% | 1636 136% | 962 39% | 1150 66% | 566 -18% |
| Colorchecker dE 2000 * | 5.6 | 4.17 26% | 5.21 7% | 4.6 18% | 5.07 9% | 9.47 -69% |
| Colorchecker dE 2000 max. * | 11.29 | 7.61 33% | 8.85 22% | 8.8 22% | 10.07 11% | 15.41 -36% |
| Greyscale dE 2000 * | 4.2 | 5.39 -28% | 6.23 -48% | 4 5% | 3.64 13% | 10.22 -143% |
| Gamma | 2.46 89% | 2.12 104% | 2.5 88% | 2.34 94% | 2.46 89% | 2.34 94% |
| CCT | 6564 99% | 7404 88% | 6506 100% | 7304 89% | 6521 100% | 11451 57% |
| Color Space (Percent of AdobeRGB 1998) (%) | 35 | 62.7 79% | 59 69% | 57.9 65% | 35 0% | 39 11% |
| Color Space (Percent of sRGB) (%) | 55 | 99.8 81% | 90 64% | 88.7 61% | 55 0% | 57 4% |
| Total Average (Program / Settings) | 36% /
50% | 40% /
42% | 6% /
24% | 2% /
9% | -5% /
-16% |
* ... smaller is better
Display Response Times
| ↔ Response Time Black to White | ||
|---|---|---|
| 24 ms ... rise ↗ and fall ↘ combined | ↗ 8 ms rise | 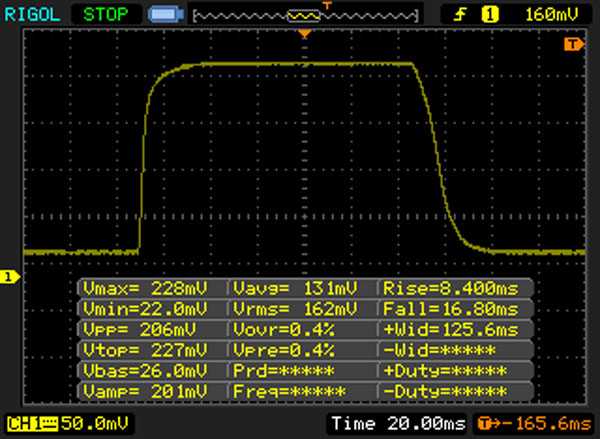 |
| ↘ 16 ms fall | ||
| The screen shows good response rates in our tests, but may be too slow for competitive gamers. In comparison, all tested devices range from 0.1 (minimum) to 240 (maximum) ms. » 54 % of all devices are better. This means that the measured response time is worse than the average of all tested devices (19.8 ms). | ||
| ↔ Response Time 50% Grey to 80% Grey | ||
| 42 ms ... rise ↗ and fall ↘ combined | ↗ 18 ms rise | 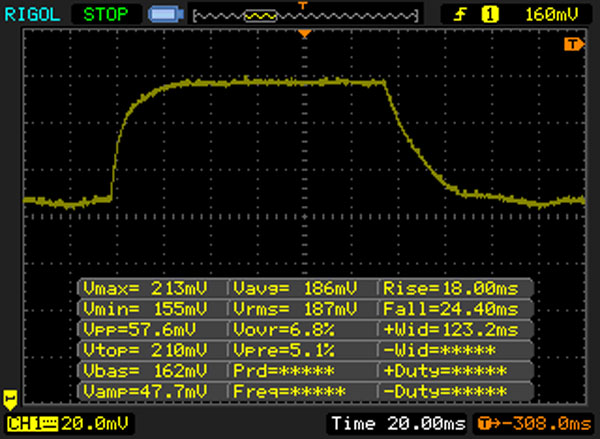 |
| ↘ 24 ms fall | ||
| The screen shows slow response rates in our tests and will be unsatisfactory for gamers. In comparison, all tested devices range from 0.165 (minimum) to 636 (maximum) ms. » 67 % of all devices are better. This means that the measured response time is worse than the average of all tested devices (31 ms). | ||
Screen Flickering / PWM (Pulse-Width Modulation)
| Screen flickering / PWM not detected | ||
In comparison: 52 % of all tested devices do not use PWM to dim the display. If PWM was detected, an average of 7754 (minimum: 5 - maximum: 343500) Hz was measured. | ||
| PCMark 8 Home Score Accelerated v2 | 3503 points | |
| PCMark 8 Work Score Accelerated v2 | 4385 points | |
Help | ||
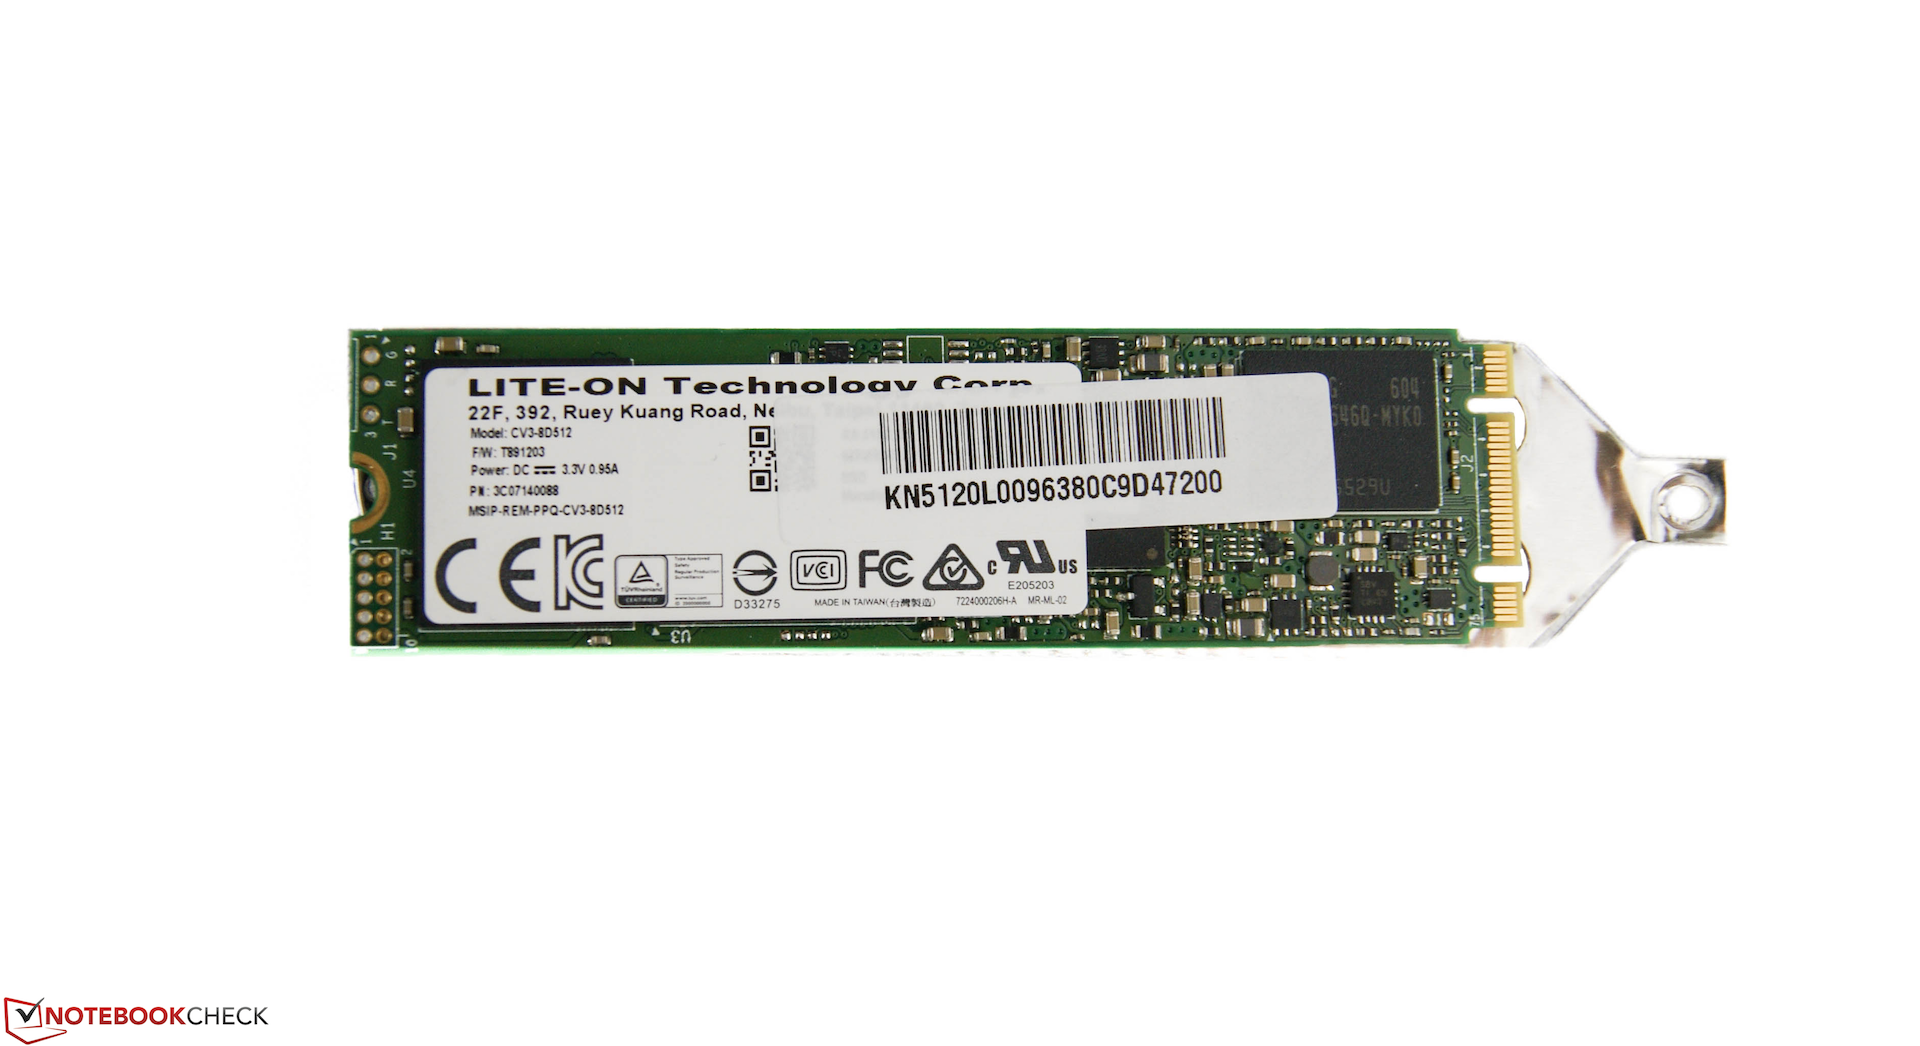
| Acer Swift 3 SF314-51-731X Liteonit CV3-8D512 | Asus Zenbook UX330UA-FC059T SanDisk SD8SNAT256G1002 | Acer Aspire S 13 S5-371-71QZ LiteOn CV1-8B512 | Acer TravelMate X3 X349-M-7261 Liteonit CV3-8D512 | Lenovo Ideapad 500s-14ISK Samsung PM871 MZYLN256HCHP | Dell XPS 13 2016 9350 (FHD, i7-6560U) Samsung PM951 NVMe MZ-VLV256D | |
|---|---|---|---|---|---|---|
| CrystalDiskMark 3.0 | -14% | 14% | 19% | 20% | 56% | |
| Read Seq (MB/s) | 471 | 447.6 -5% | 502 7% | 484.1 3% | 507 8% | 1131 140% |
| Write Seq (MB/s) | 398.3 | 309.4 -22% | 418.9 5% | 449.8 13% | 309.5 -22% | 311.4 -22% |
| Read 512 (MB/s) | 295.1 | 265.9 -10% | 341.3 16% | 399.1 35% | 409.5 39% | 685 132% |
| Write 512 (MB/s) | 283.3 | 275.2 -3% | 389.7 38% | 355.1 25% | 308.3 9% | 276.3 -2% |
| Read 4k (MB/s) | 24.14 | 18.89 -22% | 29.69 23% | 33.44 39% | 36.24 50% | 39.63 64% |
| Write 4k (MB/s) | 66 | 75.1 14% | 86.8 32% | 67.5 2% | 93.3 41% | 133.9 103% |
| Read 4k QD32 (MB/s) | 284.3 | 142.2 -50% | 301.3 6% | 368.5 30% | 394.5 39% | 399.7 41% |
| Write 4k QD32 (MB/s) | 260.2 | 228.9 -12% | 211.2 -19% | 280.6 8% | 241.6 -7% | 245.6 -6% |

| 3DMark | |
| 1280x720 Cloud Gate Standard Graphics | |
| Dell XPS 13 2016 9350 (FHD, i7-6560U) | |
| Lenovo Ideapad 500s-14ISK | |
| Asus Zenbook UX330UA-FC059T | |
| Acer TravelMate X3 X349-M-7261 | |
| Acer Swift 3 SF314-51-731X | |
| 1920x1080 Fire Strike Graphics | |
| Lenovo Ideapad 500s-14ISK | |
| Dell XPS 13 2016 9350 (FHD, i7-6560U) | |
| Acer Aspire S 13 S5-371-71QZ | |
| Acer TravelMate X3 X349-M-7261 | |
| 3DMark 11 Performance | 1643 points | |
| 3DMark Cloud Gate Standard Score | 5839 points | |
Help | ||
| BioShock Infinite - 1366x768 Medium Preset | |
| Asus Zenbook UX330UA-FC059T | |
| Acer Aspire S 13 S5-371-71QZ | |
| Acer Swift 3 SF314-51-731X | |
| Acer TravelMate X3 X349-M-7261 | |
| The Witcher 3 - 1024x768 Low Graphics & Postprocessing | |
| Lenovo Ideapad 500s-14ISK | |
| Dell XPS 13 2016 9350 (FHD, i7-6560U) | |
| Acer Aspire S 13 S5-371-71QZ | |
| Asus Zenbook UX330UA-FC059T | |
| Acer Swift 3 SF314-51-731X | |
| Rise of the Tomb Raider - 1024x768 Lowest Preset | |
| Lenovo Ideapad 500s-14ISK | |
| Acer Swift 3 SF314-51-731X | |
| low | med. | high | ultra | |
|---|---|---|---|---|
| BioShock Infinite (2013) | 57.2 | 28.7 | 24 | 7.1 |
| The Witcher 3 (2015) | 11.2 | 8 | 3.8 | |
| Rise of the Tomb Raider (2016) | 18.9 | 11.6 | 4.7 |
Noise level
| Idle |
| 31.4 / 31.4 / 31.4 dB(A) |
| Load |
| 31.5 / 31.3 dB(A) |
 | ||
30 dB silent 40 dB(A) audible 50 dB(A) loud |
||
min: | ||
(±) The maximum temperature on the upper side is 44.3 °C / 112 F, compared to the average of 35.9 °C / 97 F, ranging from 21.4 to 59 °C for the class Subnotebook.
(±) The bottom heats up to a maximum of 41.1 °C / 106 F, compared to the average of 39.2 °C / 103 F
(+) In idle usage, the average temperature for the upper side is 23.9 °C / 75 F, compared to the device average of 30.8 °C / 87 F.
(+) The palmrests and touchpad are reaching skin temperature as a maximum (32.4 °C / 90.3 F) and are therefore not hot.
(-) The average temperature of the palmrest area of similar devices was 28.2 °C / 82.8 F (-4.2 °C / -7.5 F).
Apple MacBook 12 (Early 2016) 1.1 GHz audio analysis
(+) | speakers can play relatively loud (83.6 dB)
Bass 100 - 315 Hz
(±) | reduced bass - on average 11.3% lower than median
(±) | linearity of bass is average (14.2% delta to prev. frequency)
Mids 400 - 2000 Hz
(+) | balanced mids - only 2.4% away from median
(+) | mids are linear (5.5% delta to prev. frequency)
Highs 2 - 16 kHz
(+) | balanced highs - only 2% away from median
(+) | highs are linear (4.5% delta to prev. frequency)
Overall 100 - 16.000 Hz
(+) | overall sound is linear (10.2% difference to median)
Compared to same class
» 7% of all tested devices in this class were better, 2% similar, 90% worse
» The best had a delta of 5%, average was 18%, worst was 53%
Compared to all devices tested
» 5% of all tested devices were better, 1% similar, 94% worse
» The best had a delta of 4%, average was 23%, worst was 134%
Asus Zenbook UX330UA-FC059T audio analysis
(±) | speaker loudness is average but good (77 dB)
Bass 100 - 315 Hz
(±) | reduced bass - on average 12.3% lower than median
(+) | bass is linear (5.7% delta to prev. frequency)
Mids 400 - 2000 Hz
(+) | balanced mids - only 2.6% away from median
(+) | mids are linear (5.7% delta to prev. frequency)
Highs 2 - 16 kHz
(±) | higher highs - on average 8.8% higher than median
(+) | highs are linear (6.2% delta to prev. frequency)
Overall 100 - 16.000 Hz
(±) | linearity of overall sound is average (17.6% difference to median)
Compared to same class
» 49% of all tested devices in this class were better, 7% similar, 45% worse
» The best had a delta of 5%, average was 18%, worst was 53%
Compared to all devices tested
» 35% of all tested devices were better, 8% similar, 57% worse
» The best had a delta of 4%, average was 23%, worst was 134%
Lenovo Ideapad 500s-14ISK audio analysis
(-) | not very loud speakers (68 dB)
Analysis not possible as minimum curve is missing or too high
Dell XPS 13 2016 9350 (FHD, i7-6560U) audio analysis
(+) | speakers can play relatively loud (83.8 dB)
Bass 100 - 315 Hz
(-) | nearly no bass - on average 19.4% lower than median
(-) | bass is not linear (15.4% delta to prev. frequency)
Mids 400 - 2000 Hz
(+) | balanced mids - only 4.7% away from median
(±) | linearity of mids is average (9.1% delta to prev. frequency)
Highs 2 - 16 kHz
(+) | balanced highs - only 3.5% away from median
(±) | linearity of highs is average (7.6% delta to prev. frequency)
Overall 100 - 16.000 Hz
(±) | linearity of overall sound is average (18.8% difference to median)
Compared to same class
» 56% of all tested devices in this class were better, 7% similar, 37% worse
» The best had a delta of 5%, average was 18%, worst was 53%
Compared to all devices tested
» 43% of all tested devices were better, 8% similar, 49% worse
» The best had a delta of 4%, average was 23%, worst was 134%
| Off / Standby | |
| Idle | |
| Load |
|
Key:
min: | |
| Acer Swift 3 SF314-51-731X 6500U, HD Graphics 520, Liteonit CV3-8D512, IPS, 1920x1080, 14" | Asus Zenbook UX330UA-FC059T 6500U, HD Graphics 520, SanDisk SD8SNAT256G1002, IPS, 1920x1080, 13.3" | Acer Aspire S 13 S5-371-71QZ 6500U, HD Graphics 520, LiteOn CV1-8B512, IPS, 1920x1080, 13.3" | Acer TravelMate X3 X349-M-7261 6500U, HD Graphics 520, Liteonit CV3-8D512, IPS, 1920x1080, 14" | Lenovo Ideapad 500s-14ISK 6500U, GeForce 940M, Samsung PM871 MZYLN256HCHP, TN, 1920x1080, 14" | Dell XPS 13 2016 9350 (FHD, i7-6560U) 6560U, Iris Graphics 540, Samsung PM951 NVMe MZ-VLV256D, IPS, 1920x1080, 13.3" | |
|---|---|---|---|---|---|---|
| Power Consumption | 14% | 10% | 2% | -7% | 0% | |
| Idle Minimum * (Watt) | 4.9 | 3 39% | 4.1 16% | 4.9 -0% | 3.8 22% | 5.8 -18% |
| Idle Average * (Watt) | 7.4 | 6.3 15% | 6.7 9% | 7.3 1% | 7.2 3% | 7.3 1% |
| Idle Maximum * (Watt) | 9.2 | 7.5 18% | 7.4 20% | 9.4 -2% | 7.6 17% | 8.5 8% |
| Load Average * (Watt) | 34 | 36 -6% | 32.4 5% | 26 24% | 40 -18% | 30.6 10% |
| Load Maximum * (Watt) | 32.2 | 31.5 2% | 32.4 -1% | 36 -12% | 52 -61% | 32.5 -1% |
* ... smaller is better
| Acer Swift 3 SF314-51-731X 6500U, HD Graphics 520, 48.9 Wh | Asus Zenbook UX330UA-FC059T 6500U, HD Graphics 520, 57 Wh | Acer Aspire S 13 S5-371-71QZ 6500U, HD Graphics 520, 45 Wh | Acer TravelMate X3 X349-M-7261 6500U, HD Graphics 520, 48.9 Wh | Lenovo Ideapad 500s-14ISK 6500U, GeForce 940M, 30 Wh | Dell XPS 13 2016 9350 (FHD, i7-6560U) 6560U, Iris Graphics 540, 56 Wh | |
|---|---|---|---|---|---|---|
| Battery runtime | 55% | 28% | 9% | -34% | 36% | |
| Reader / Idle (h) | 11.8 | 20.4 73% | 17.1 45% | 11.3 -4% | 5.8 -51% | 15.7 33% |
| H.264 (h) | 5.7 | 6.7 18% | 4.1 -28% | |||
| WiFi v1.3 (h) | 5.9 | 10.2 73% | 7.9 34% | 6.5 10% | 4.3 -27% | 7.3 24% |
| Load (h) | 1.6 | 1.9 19% | 1.7 6% | 1.8 13% | 1.1 -31% | 2.4 50% |
Pros
Cons
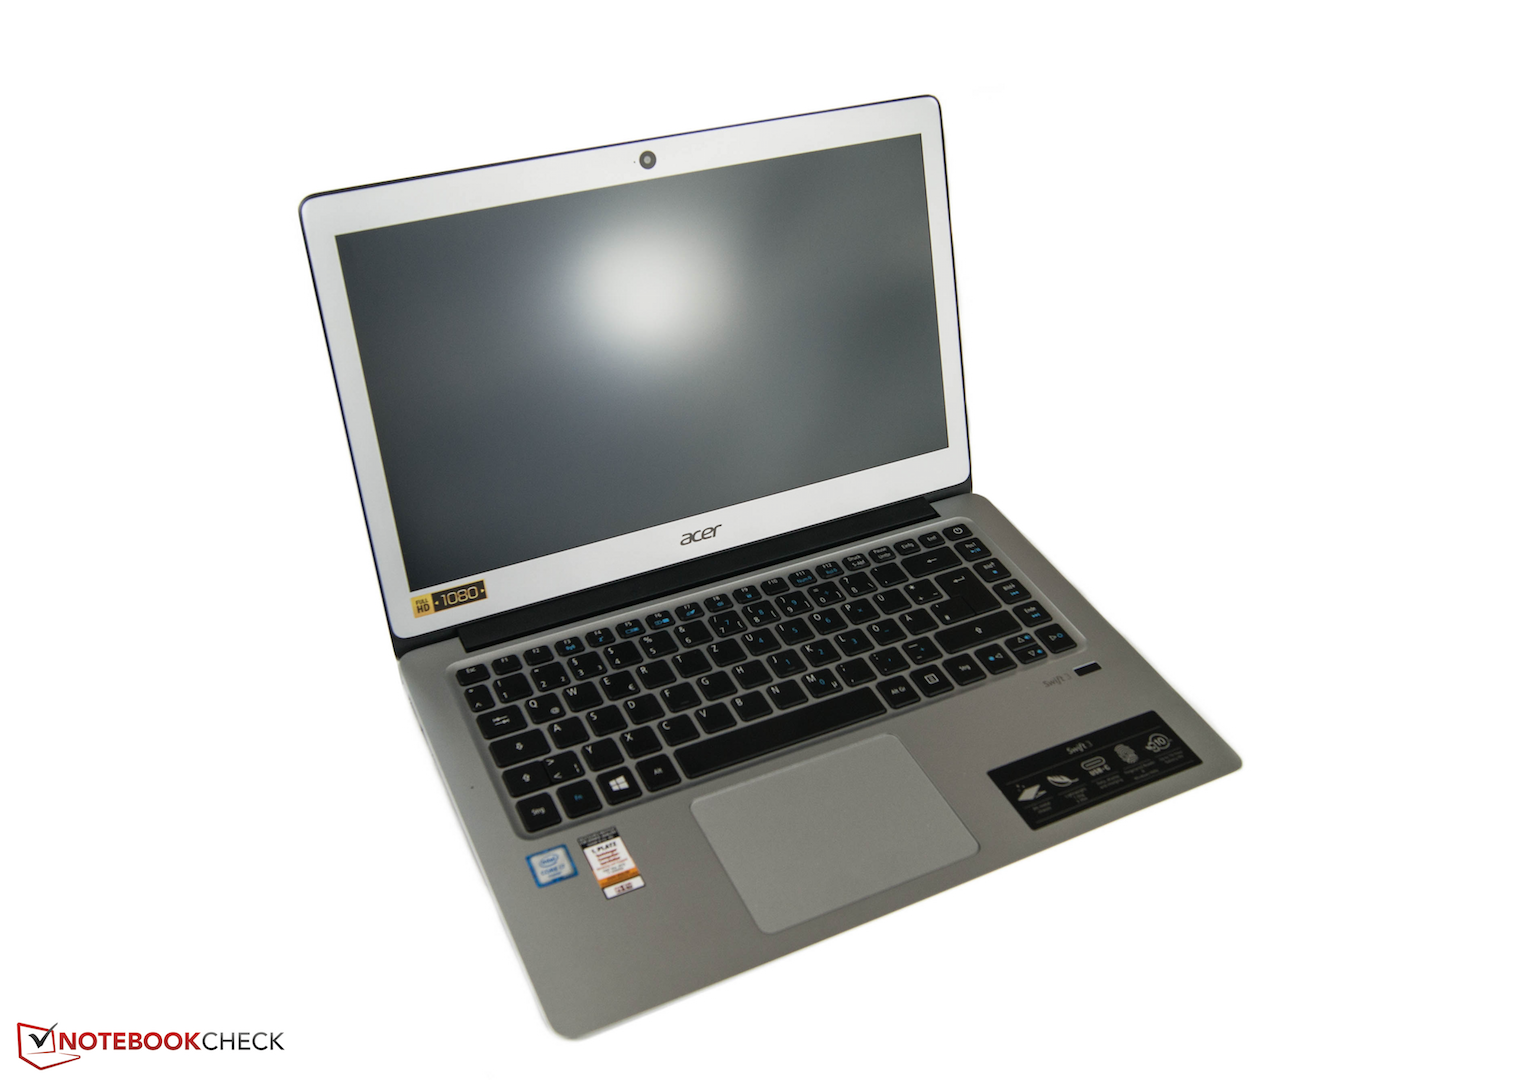
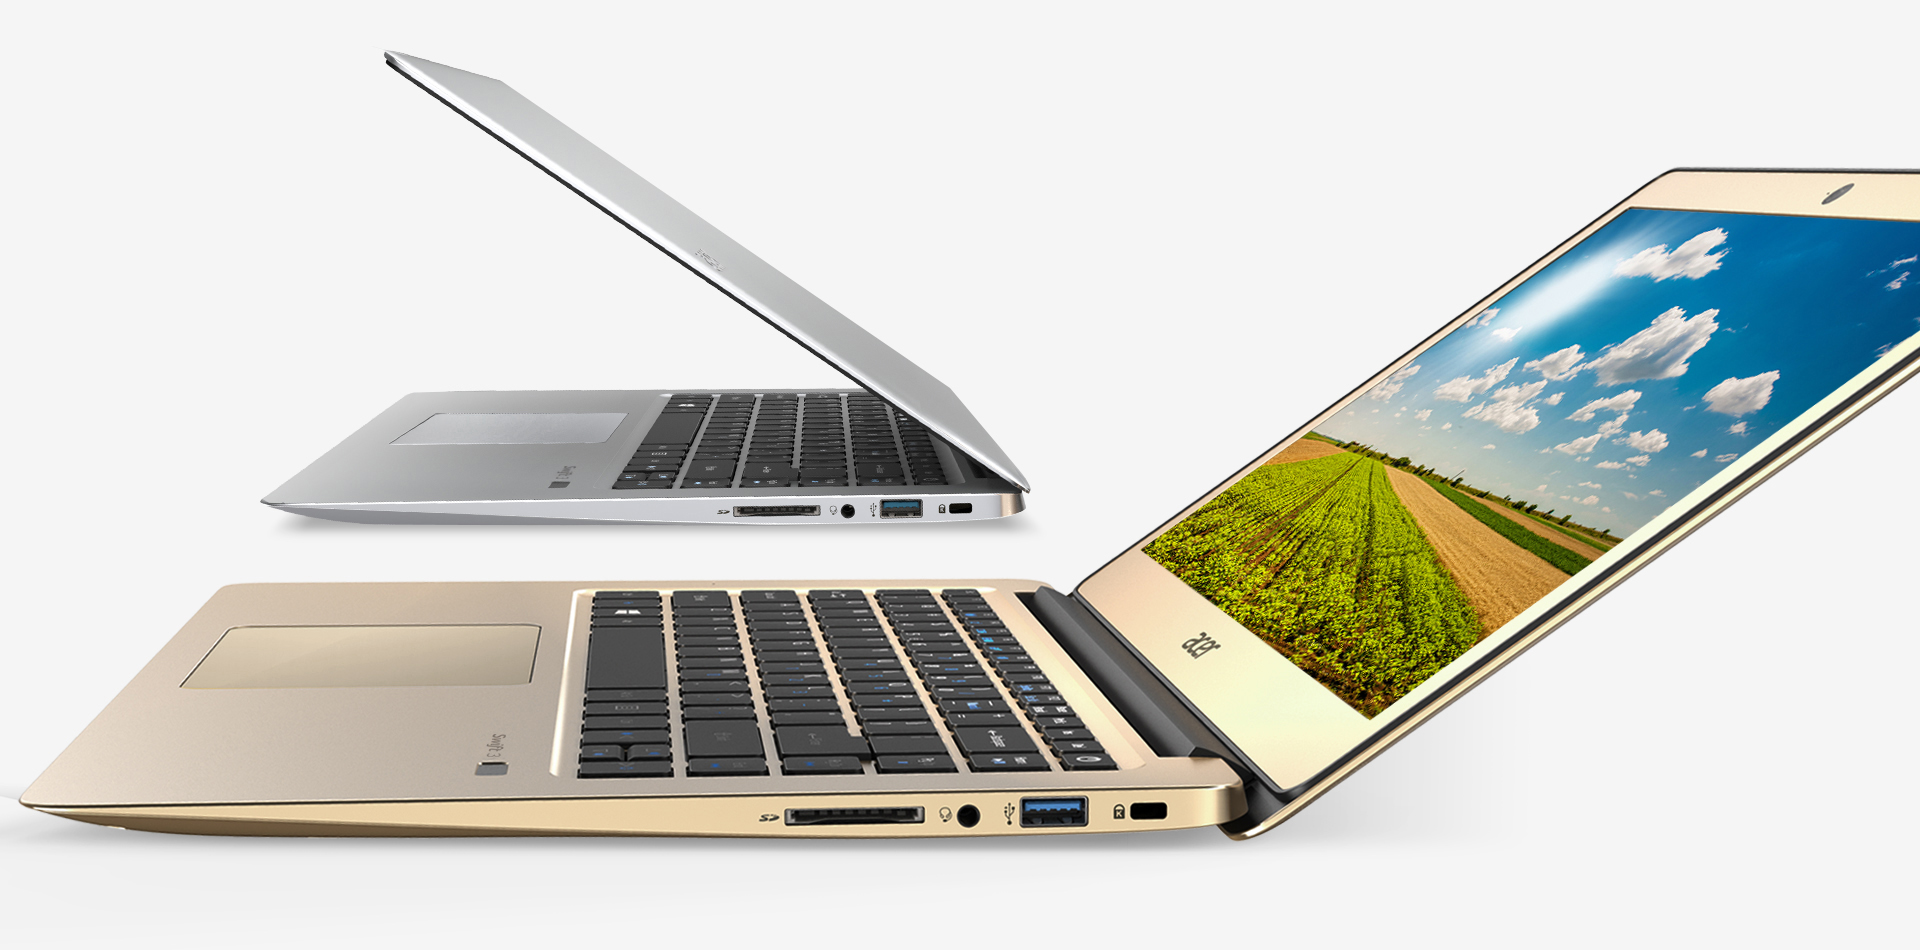
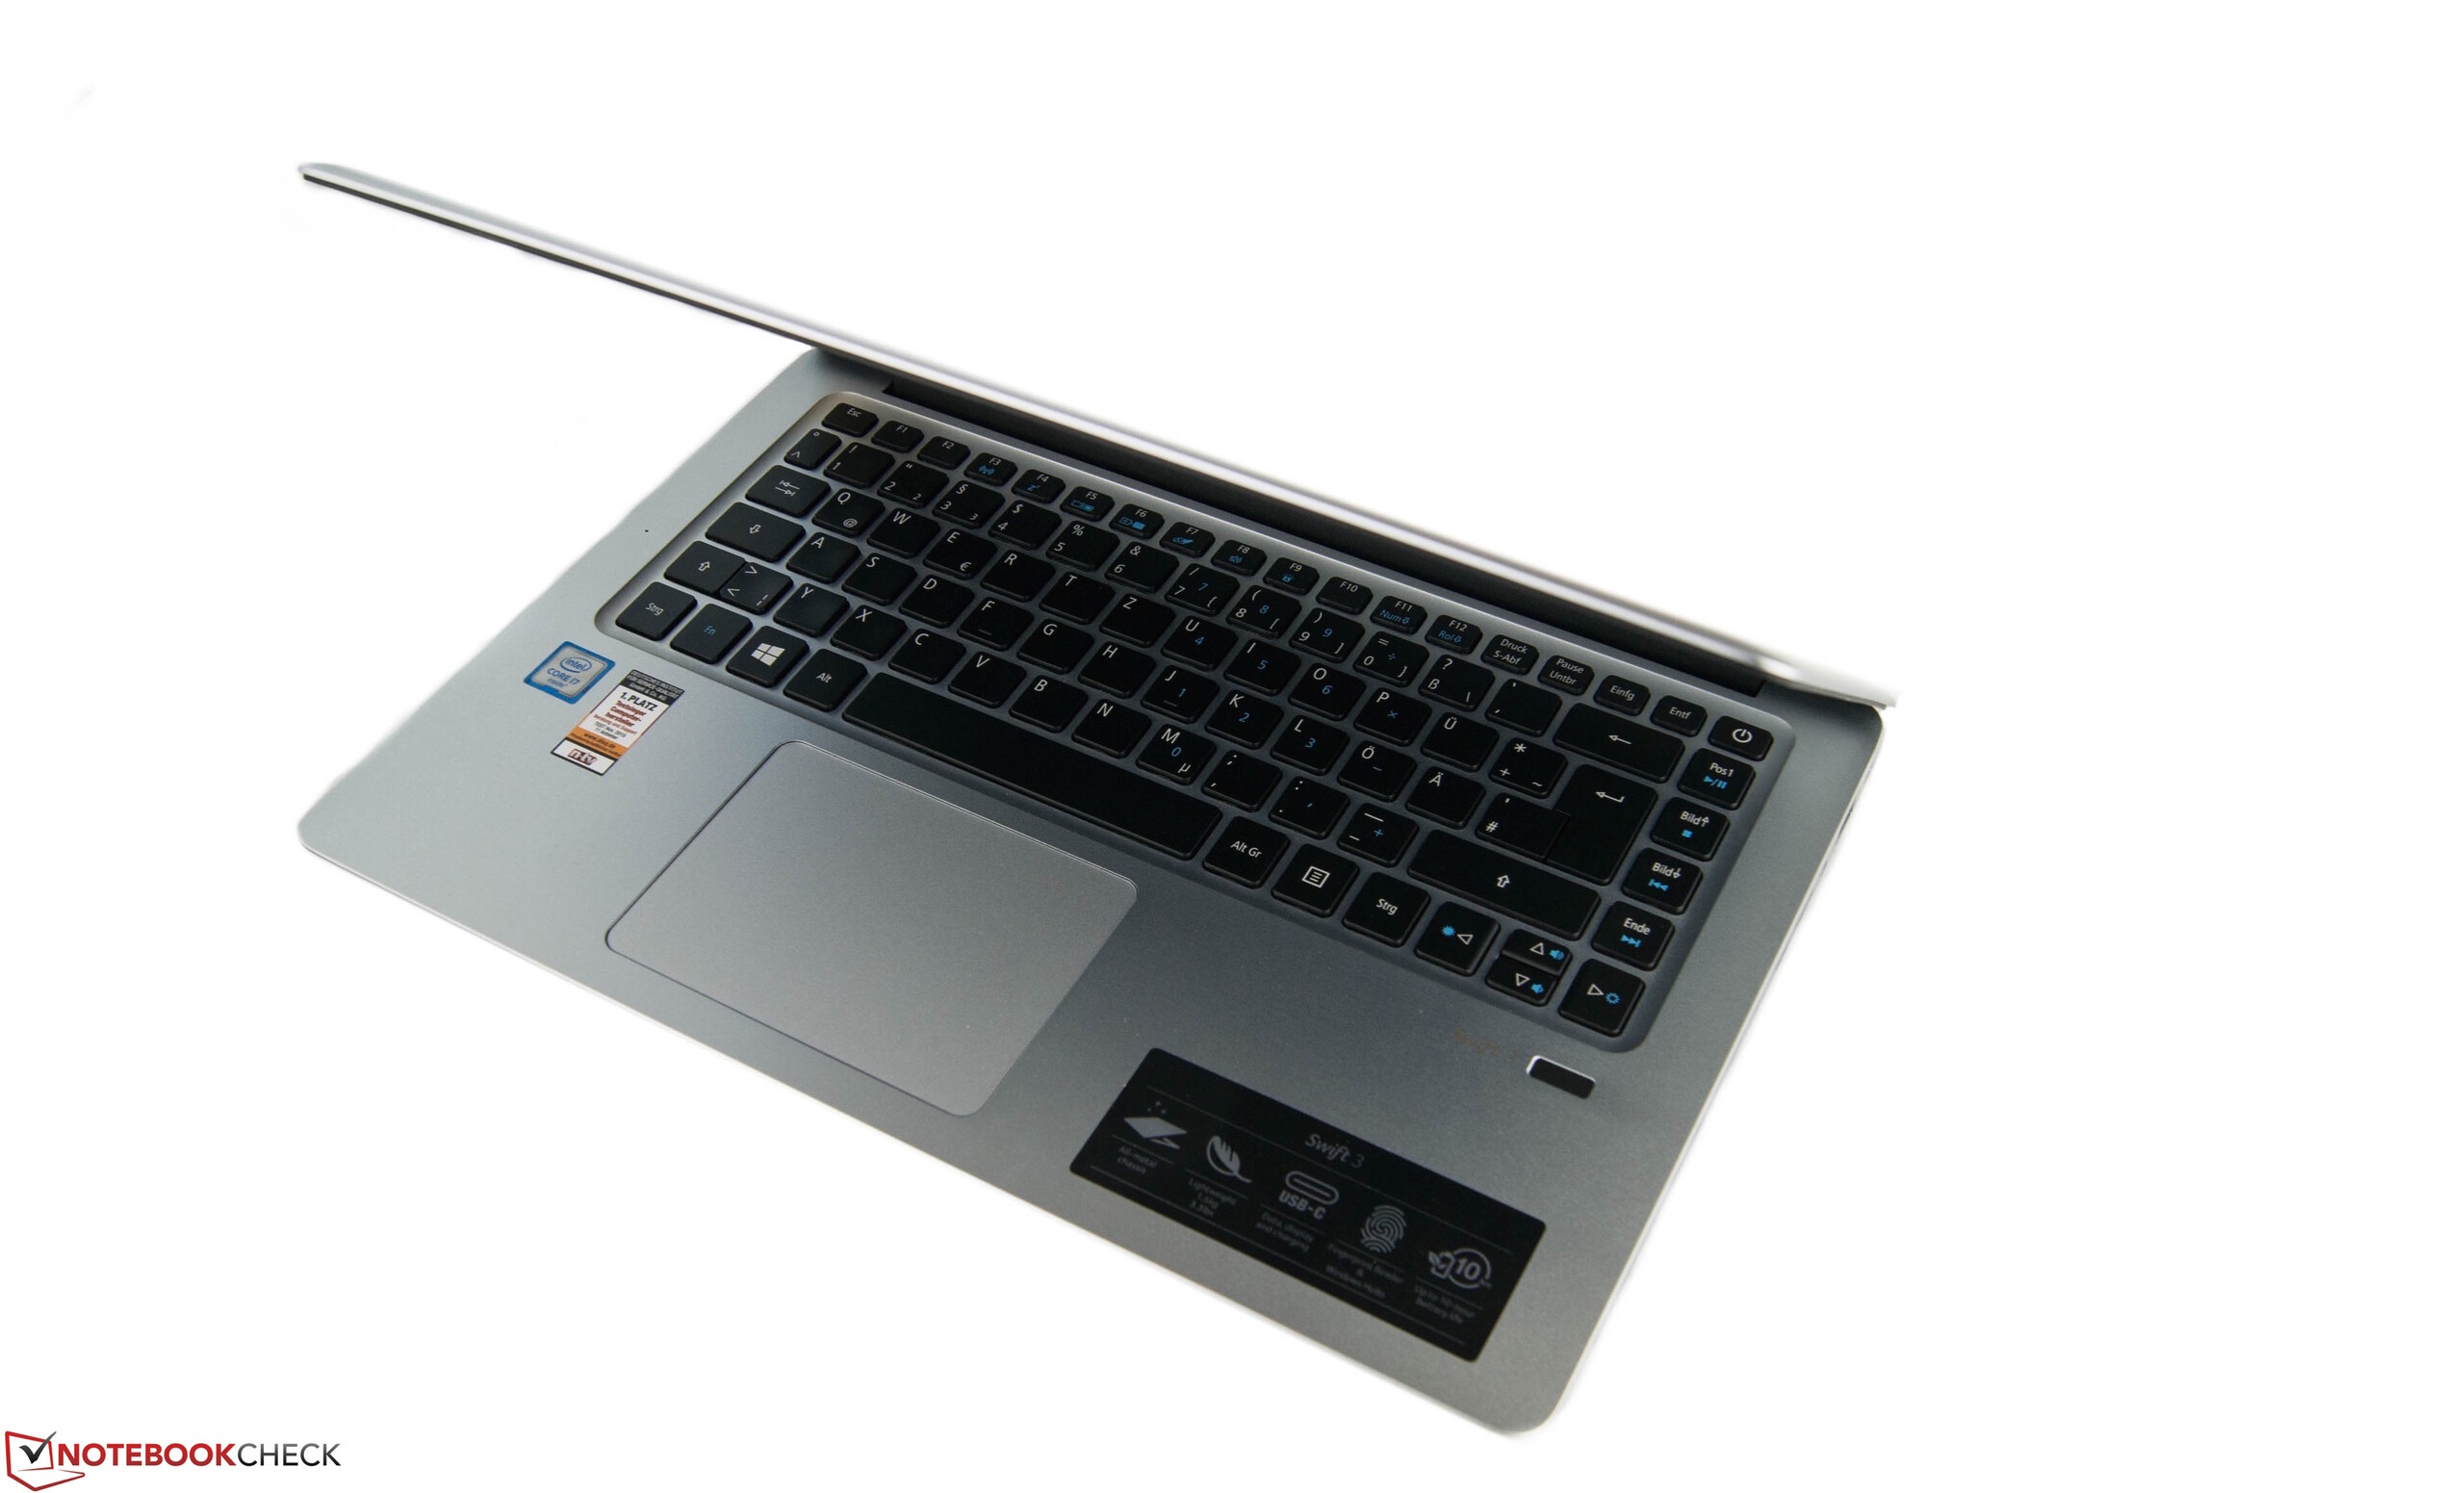
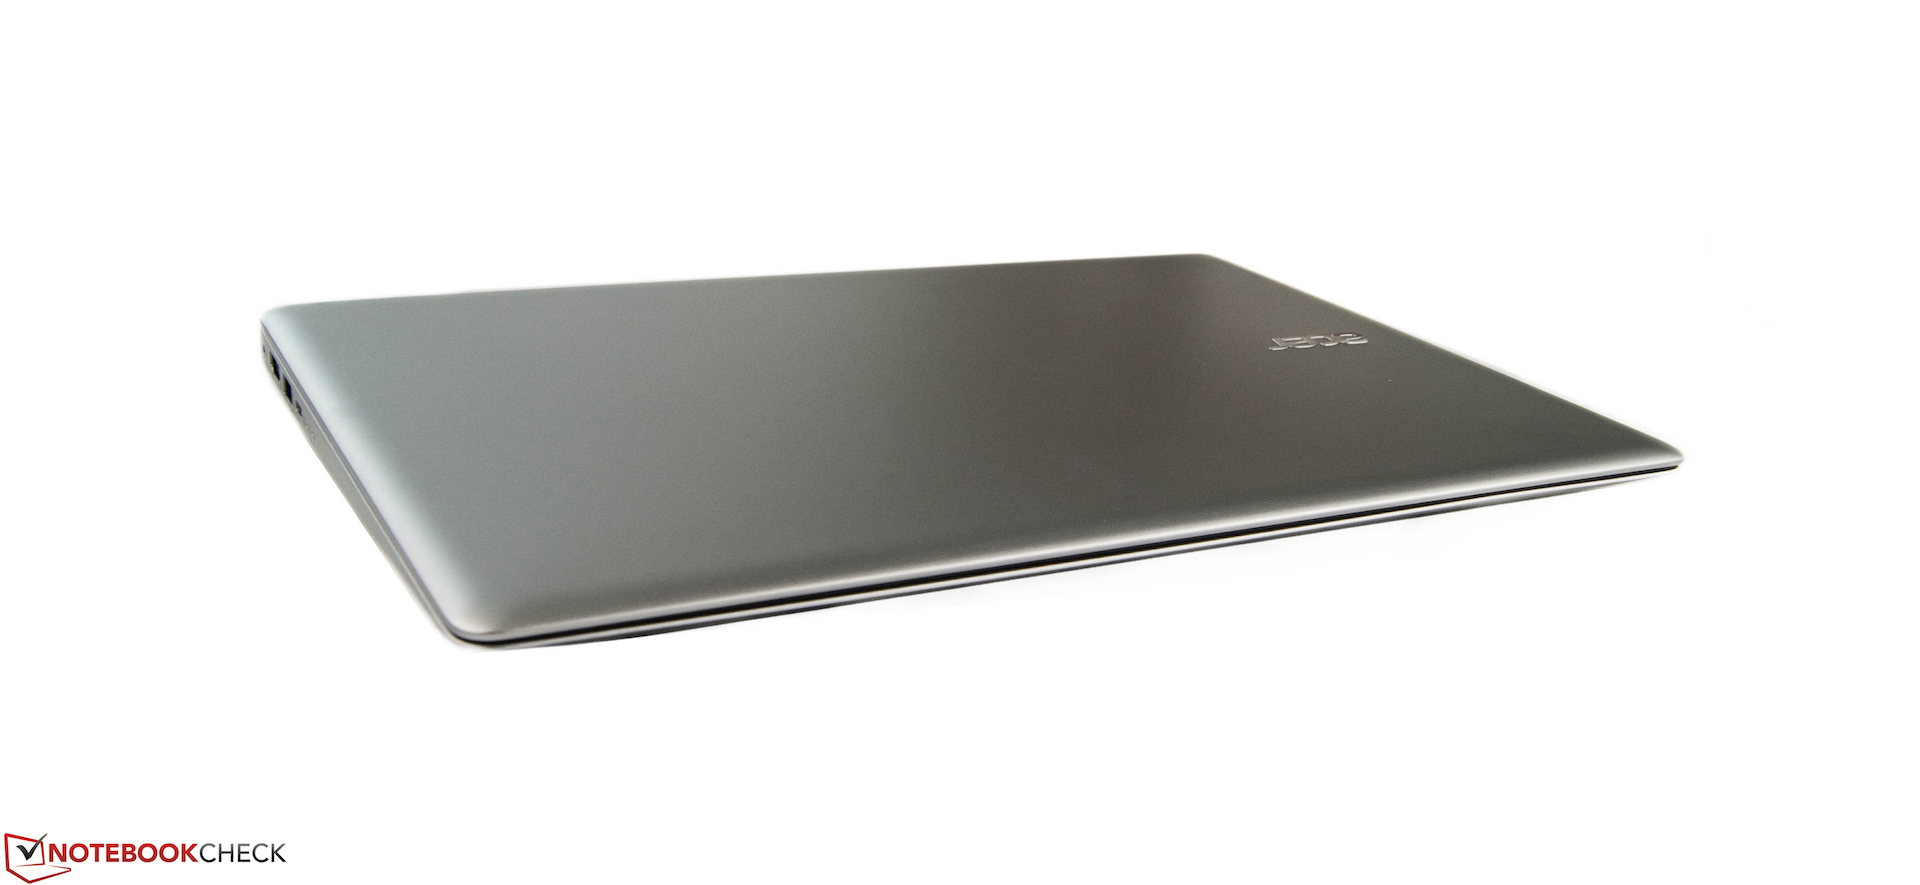
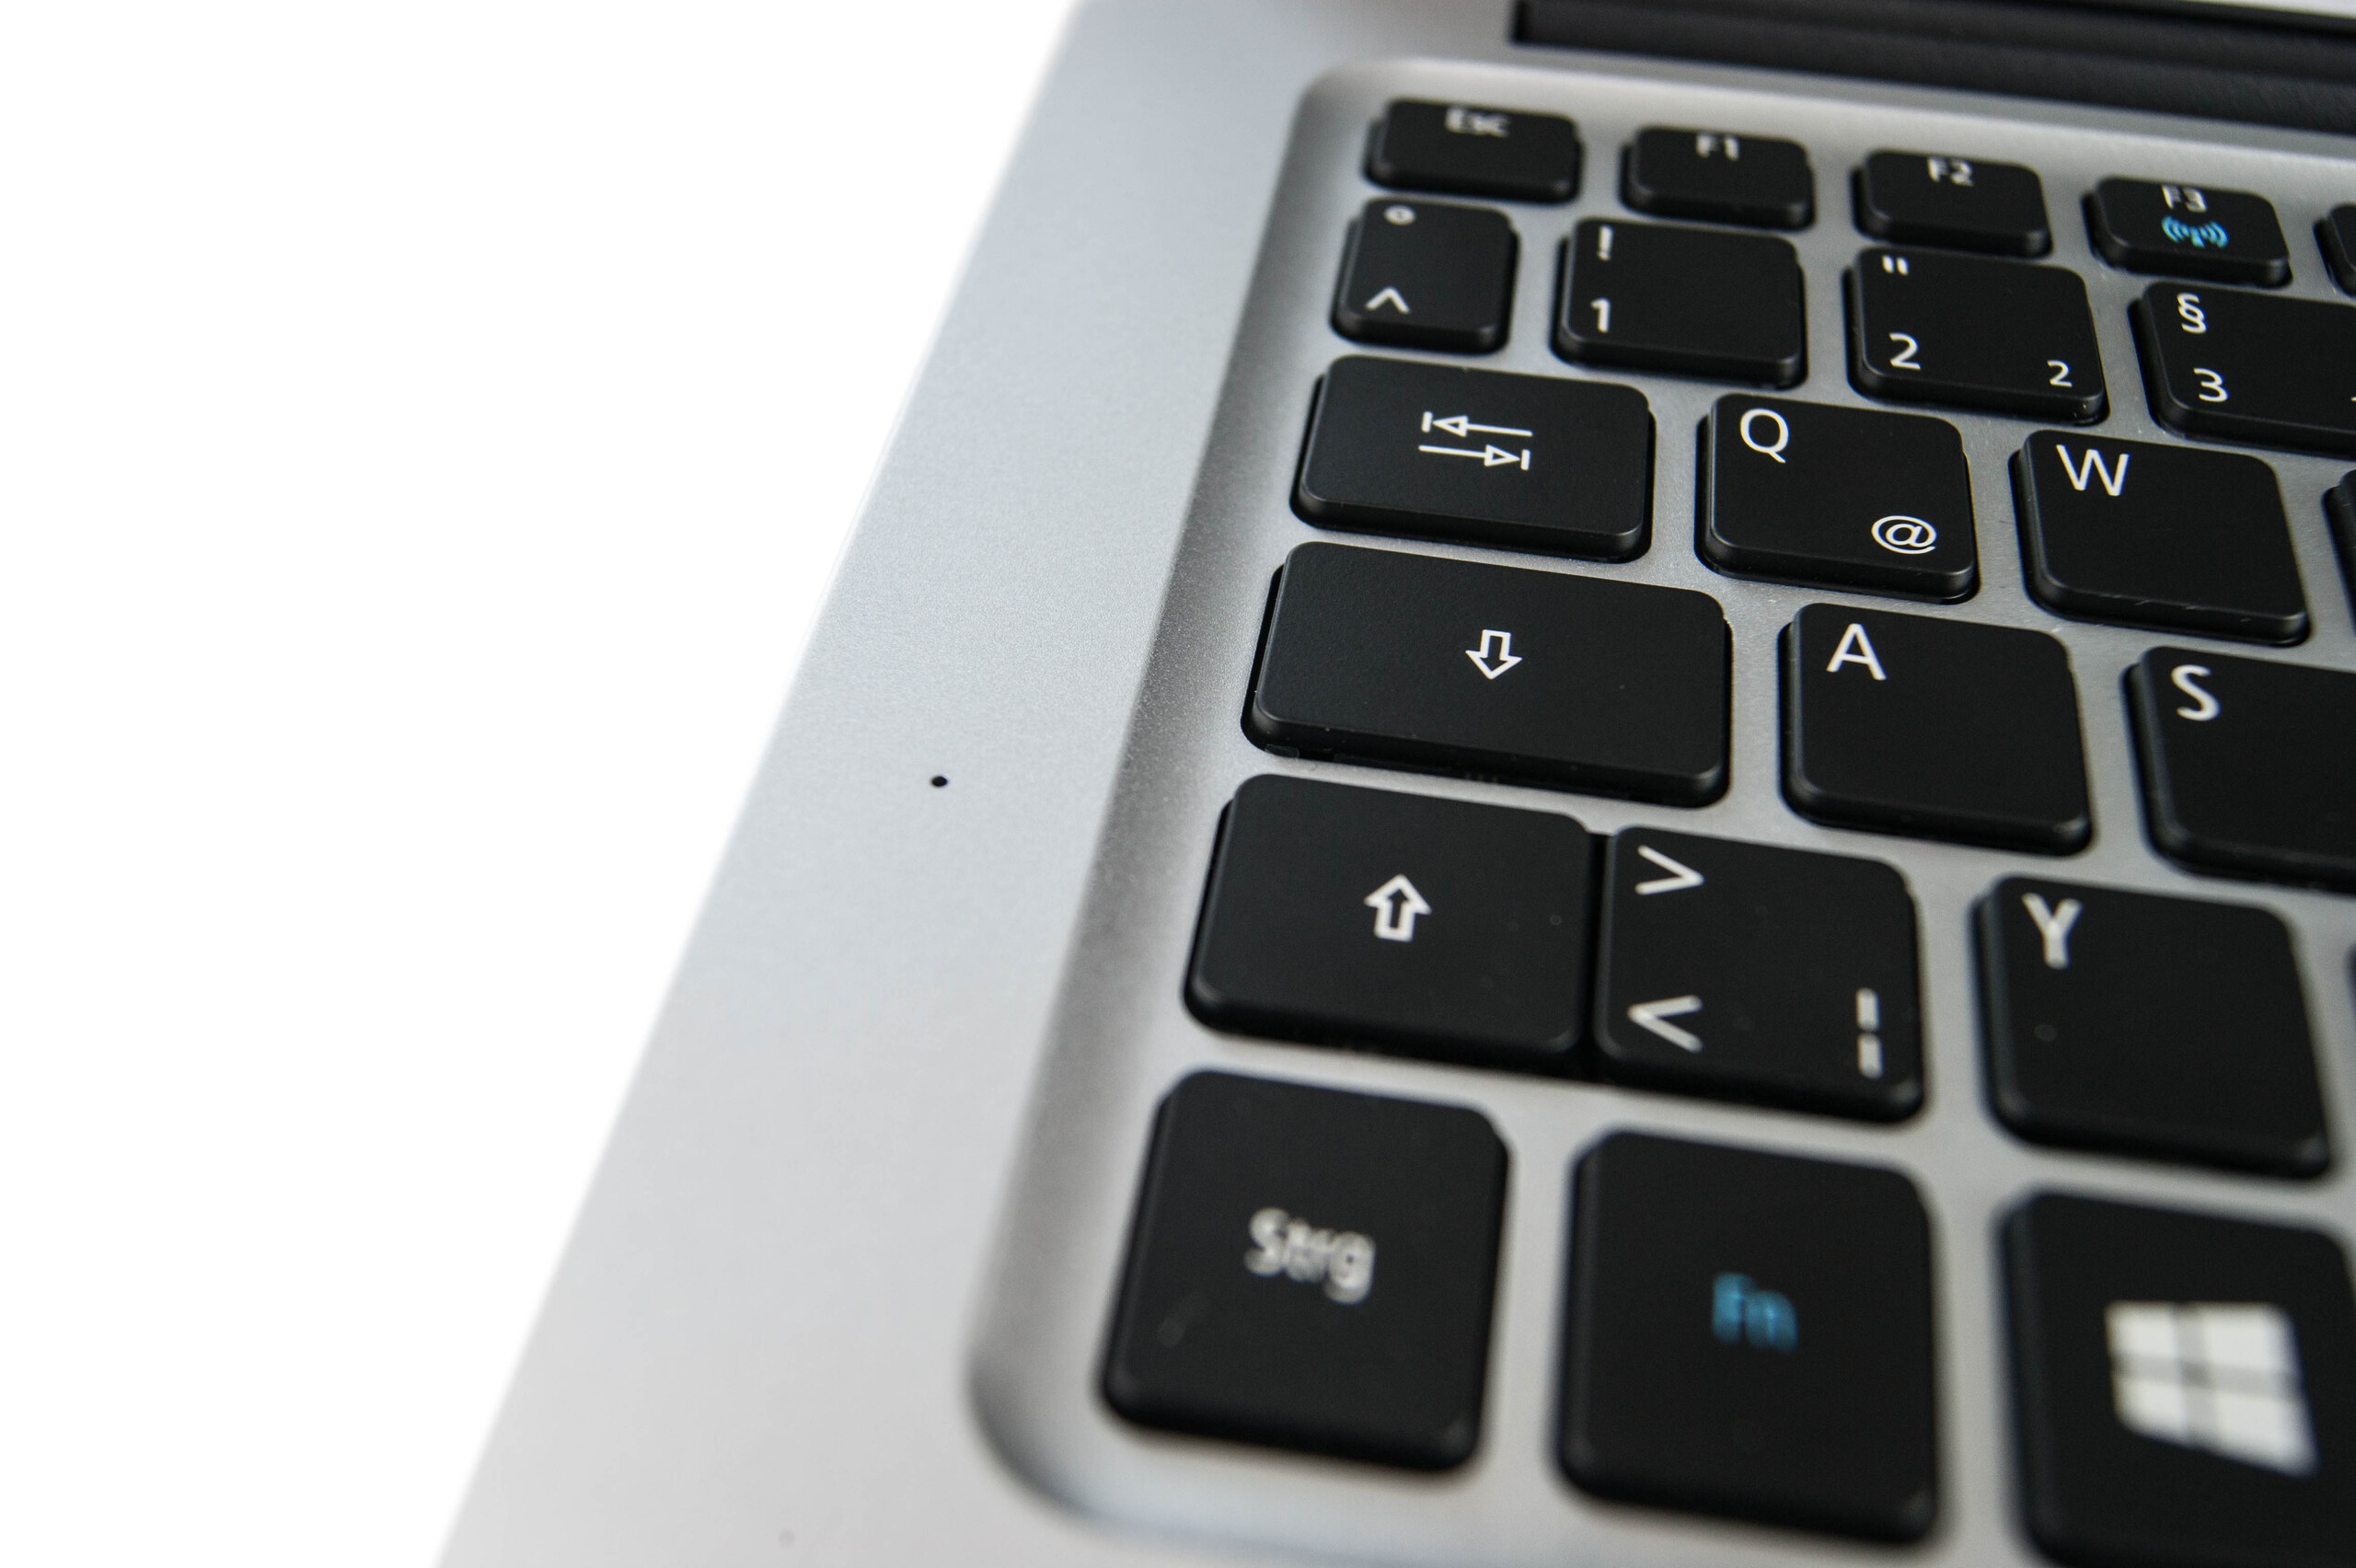
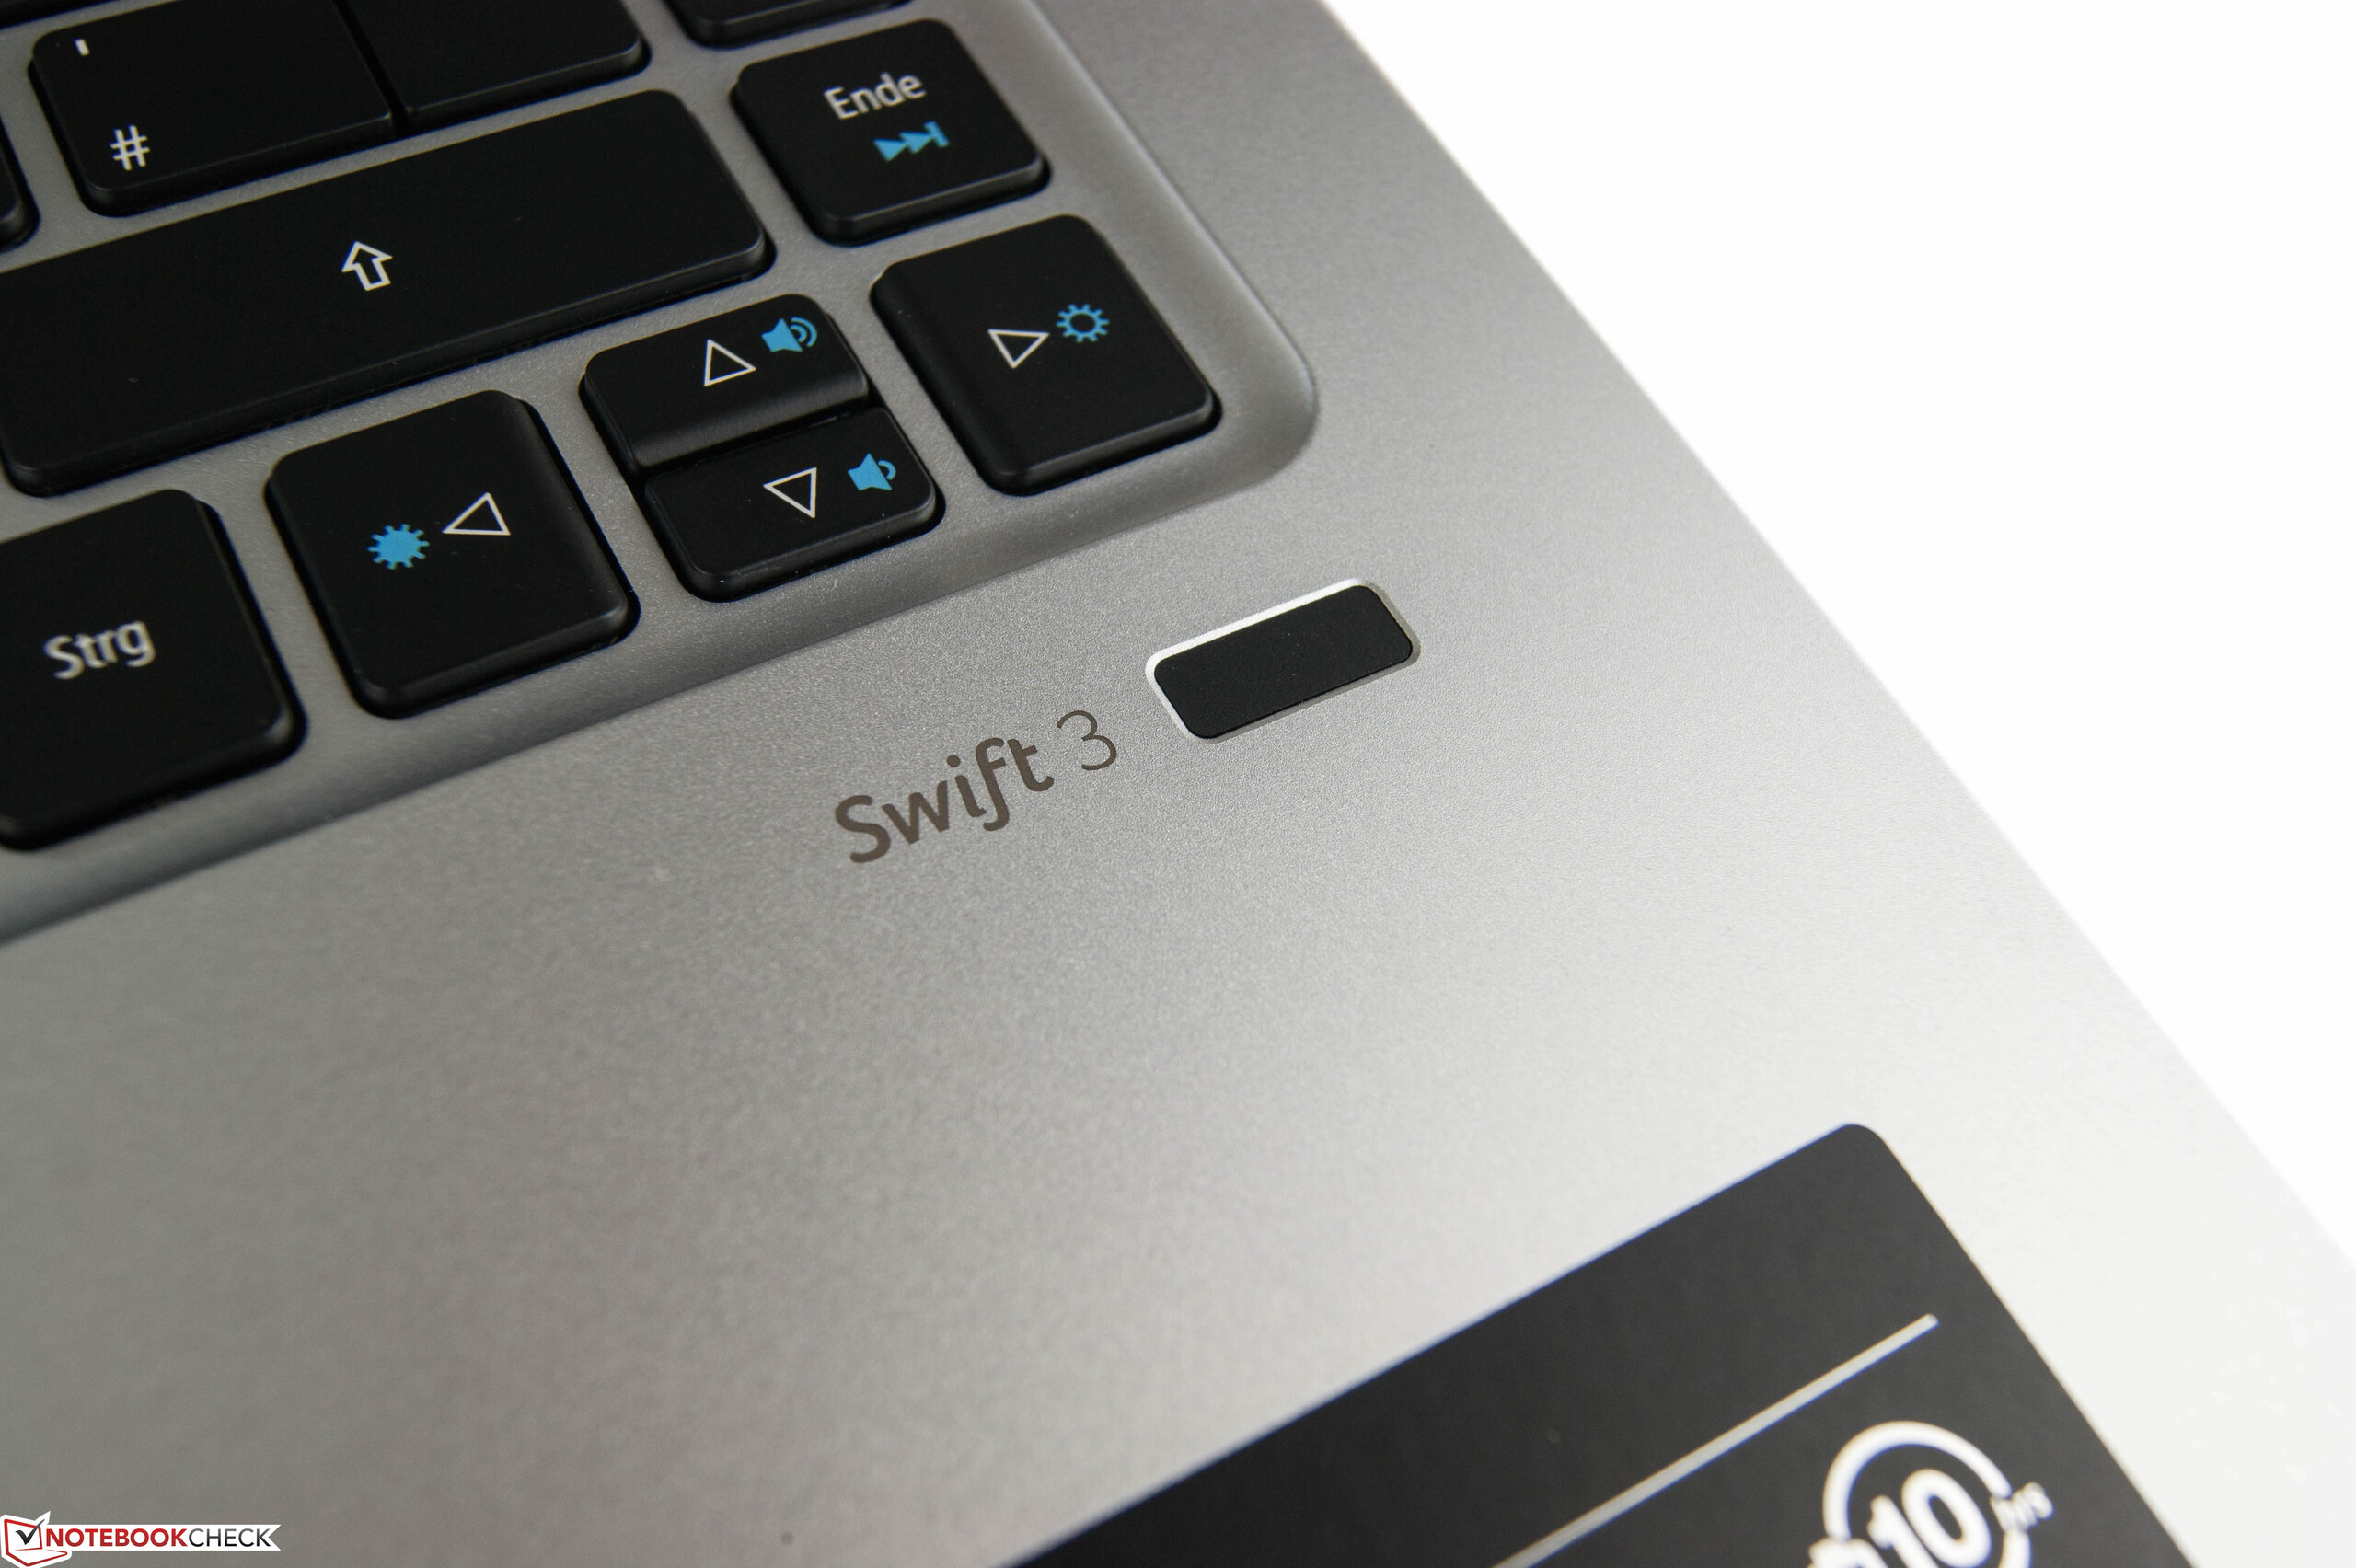
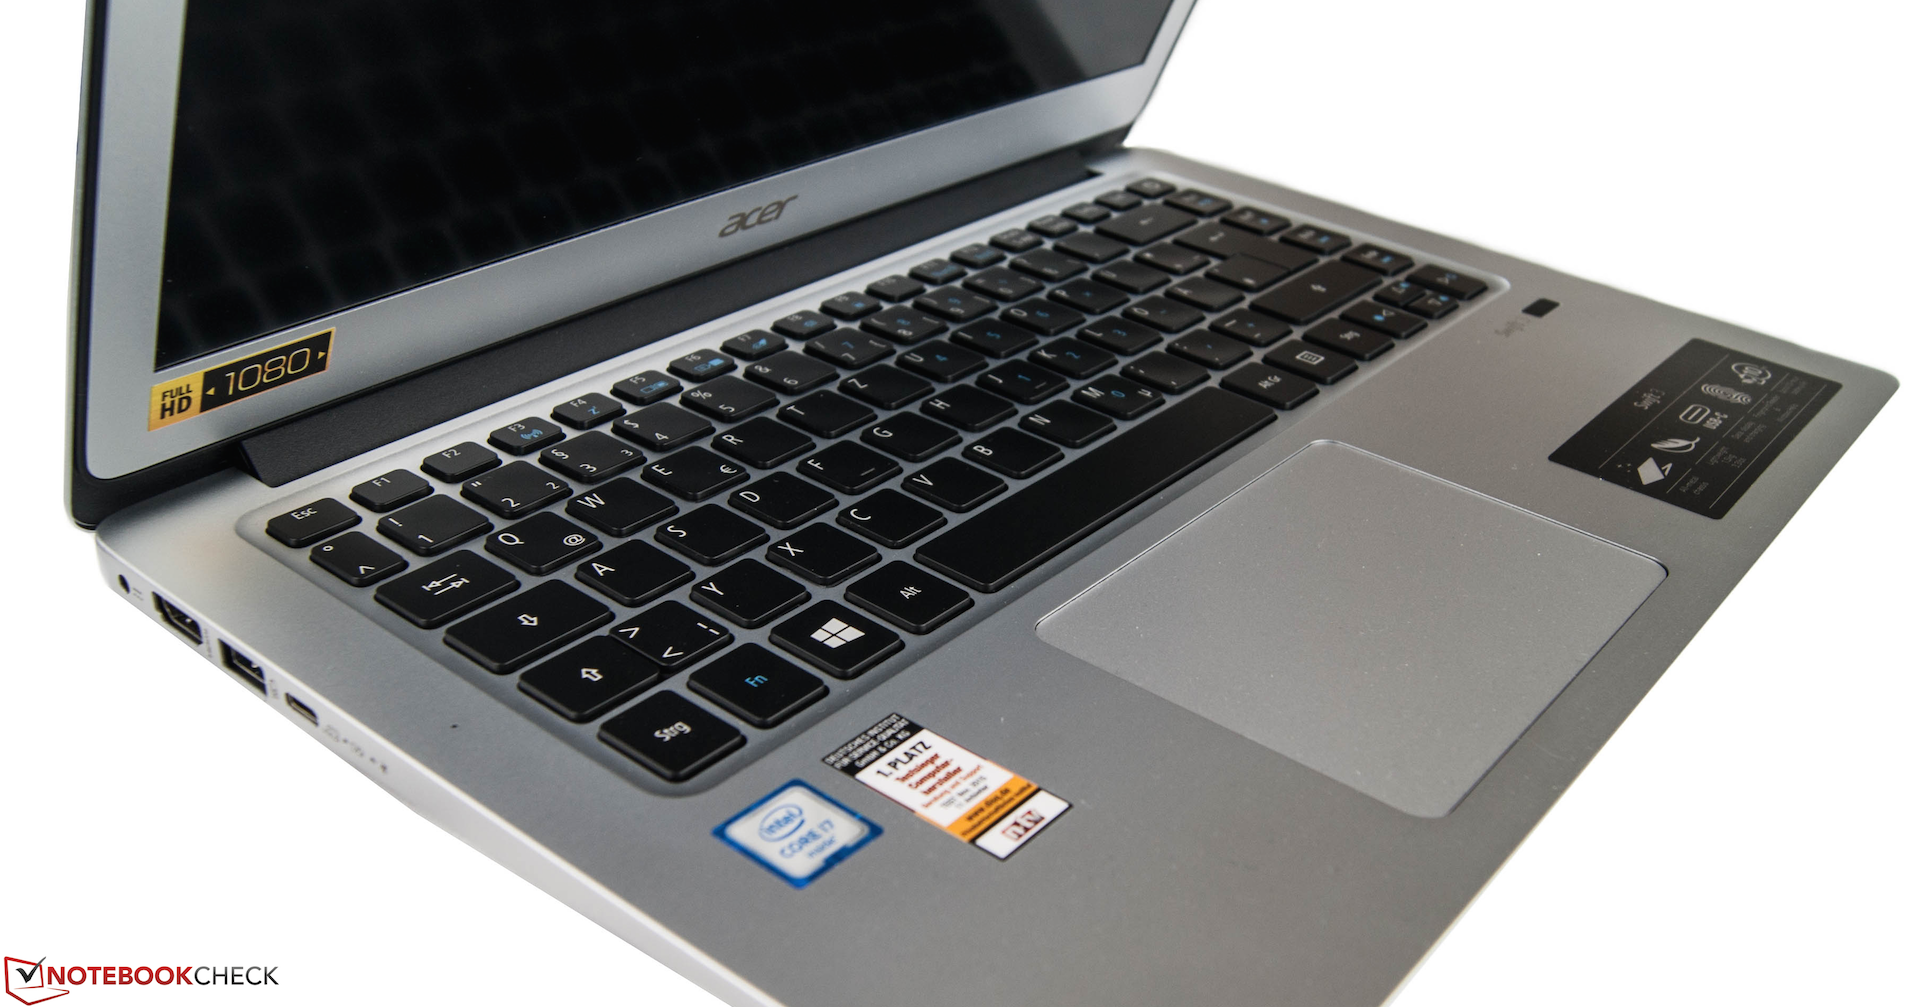
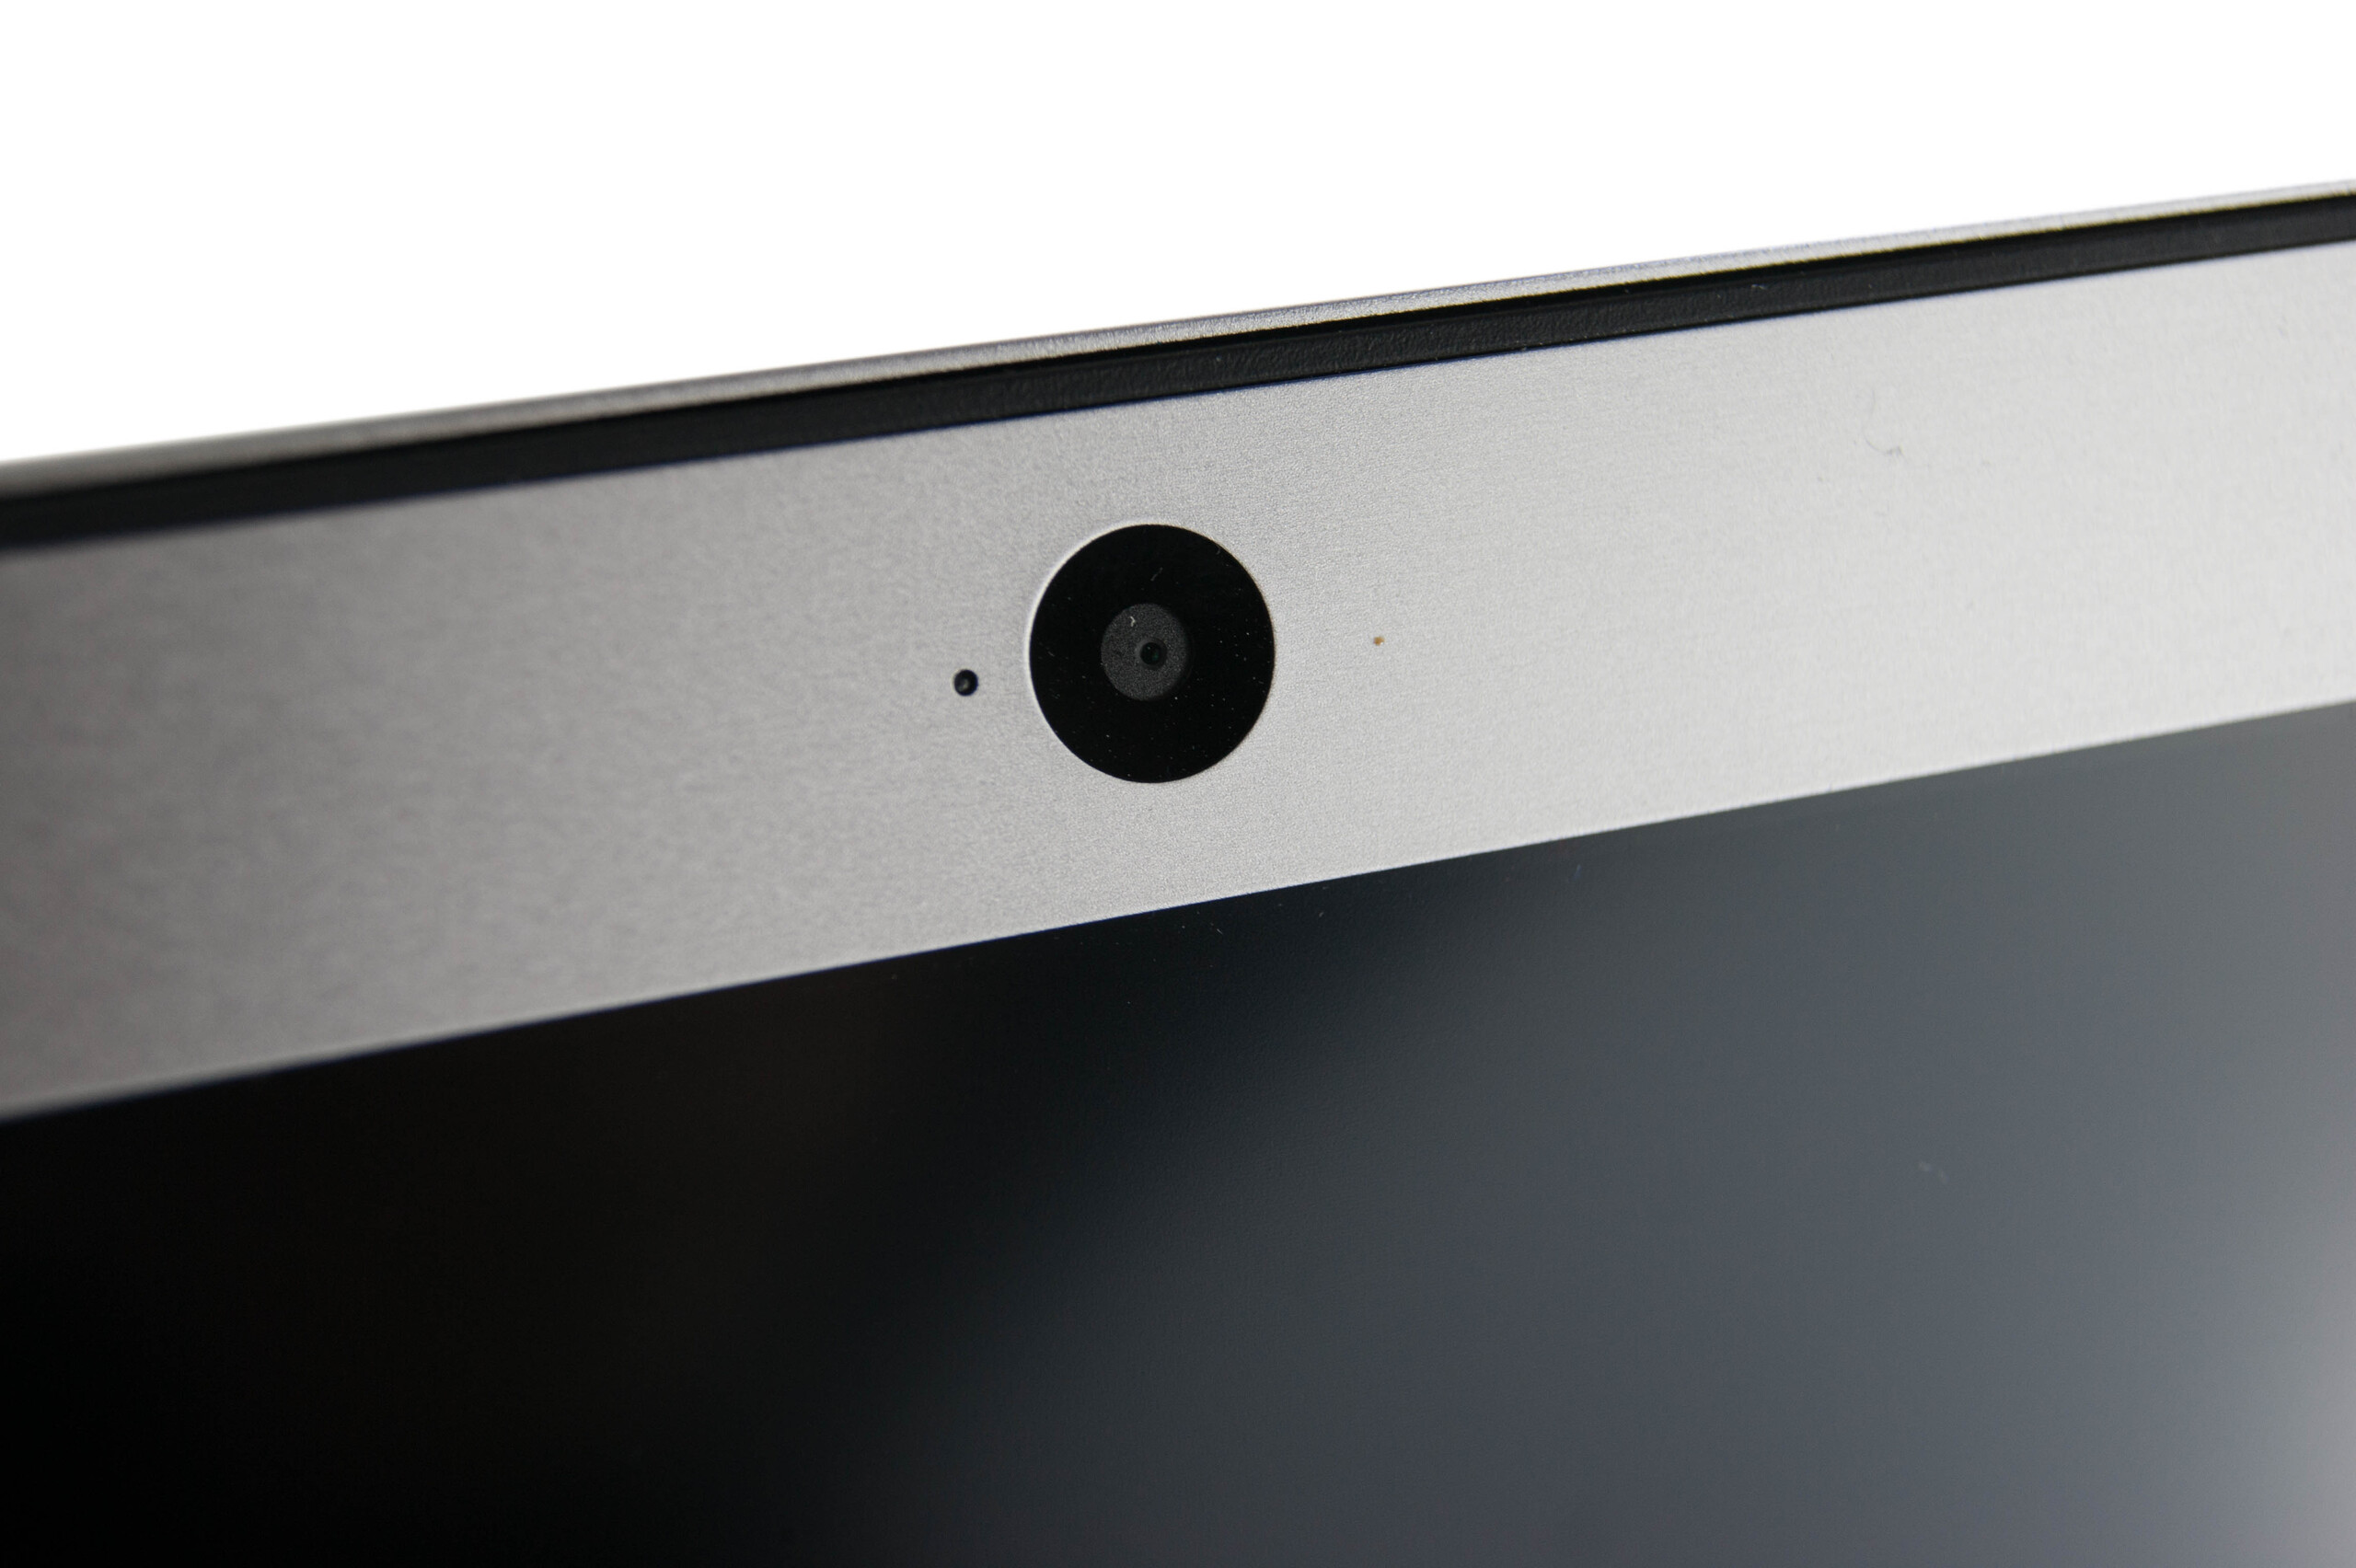
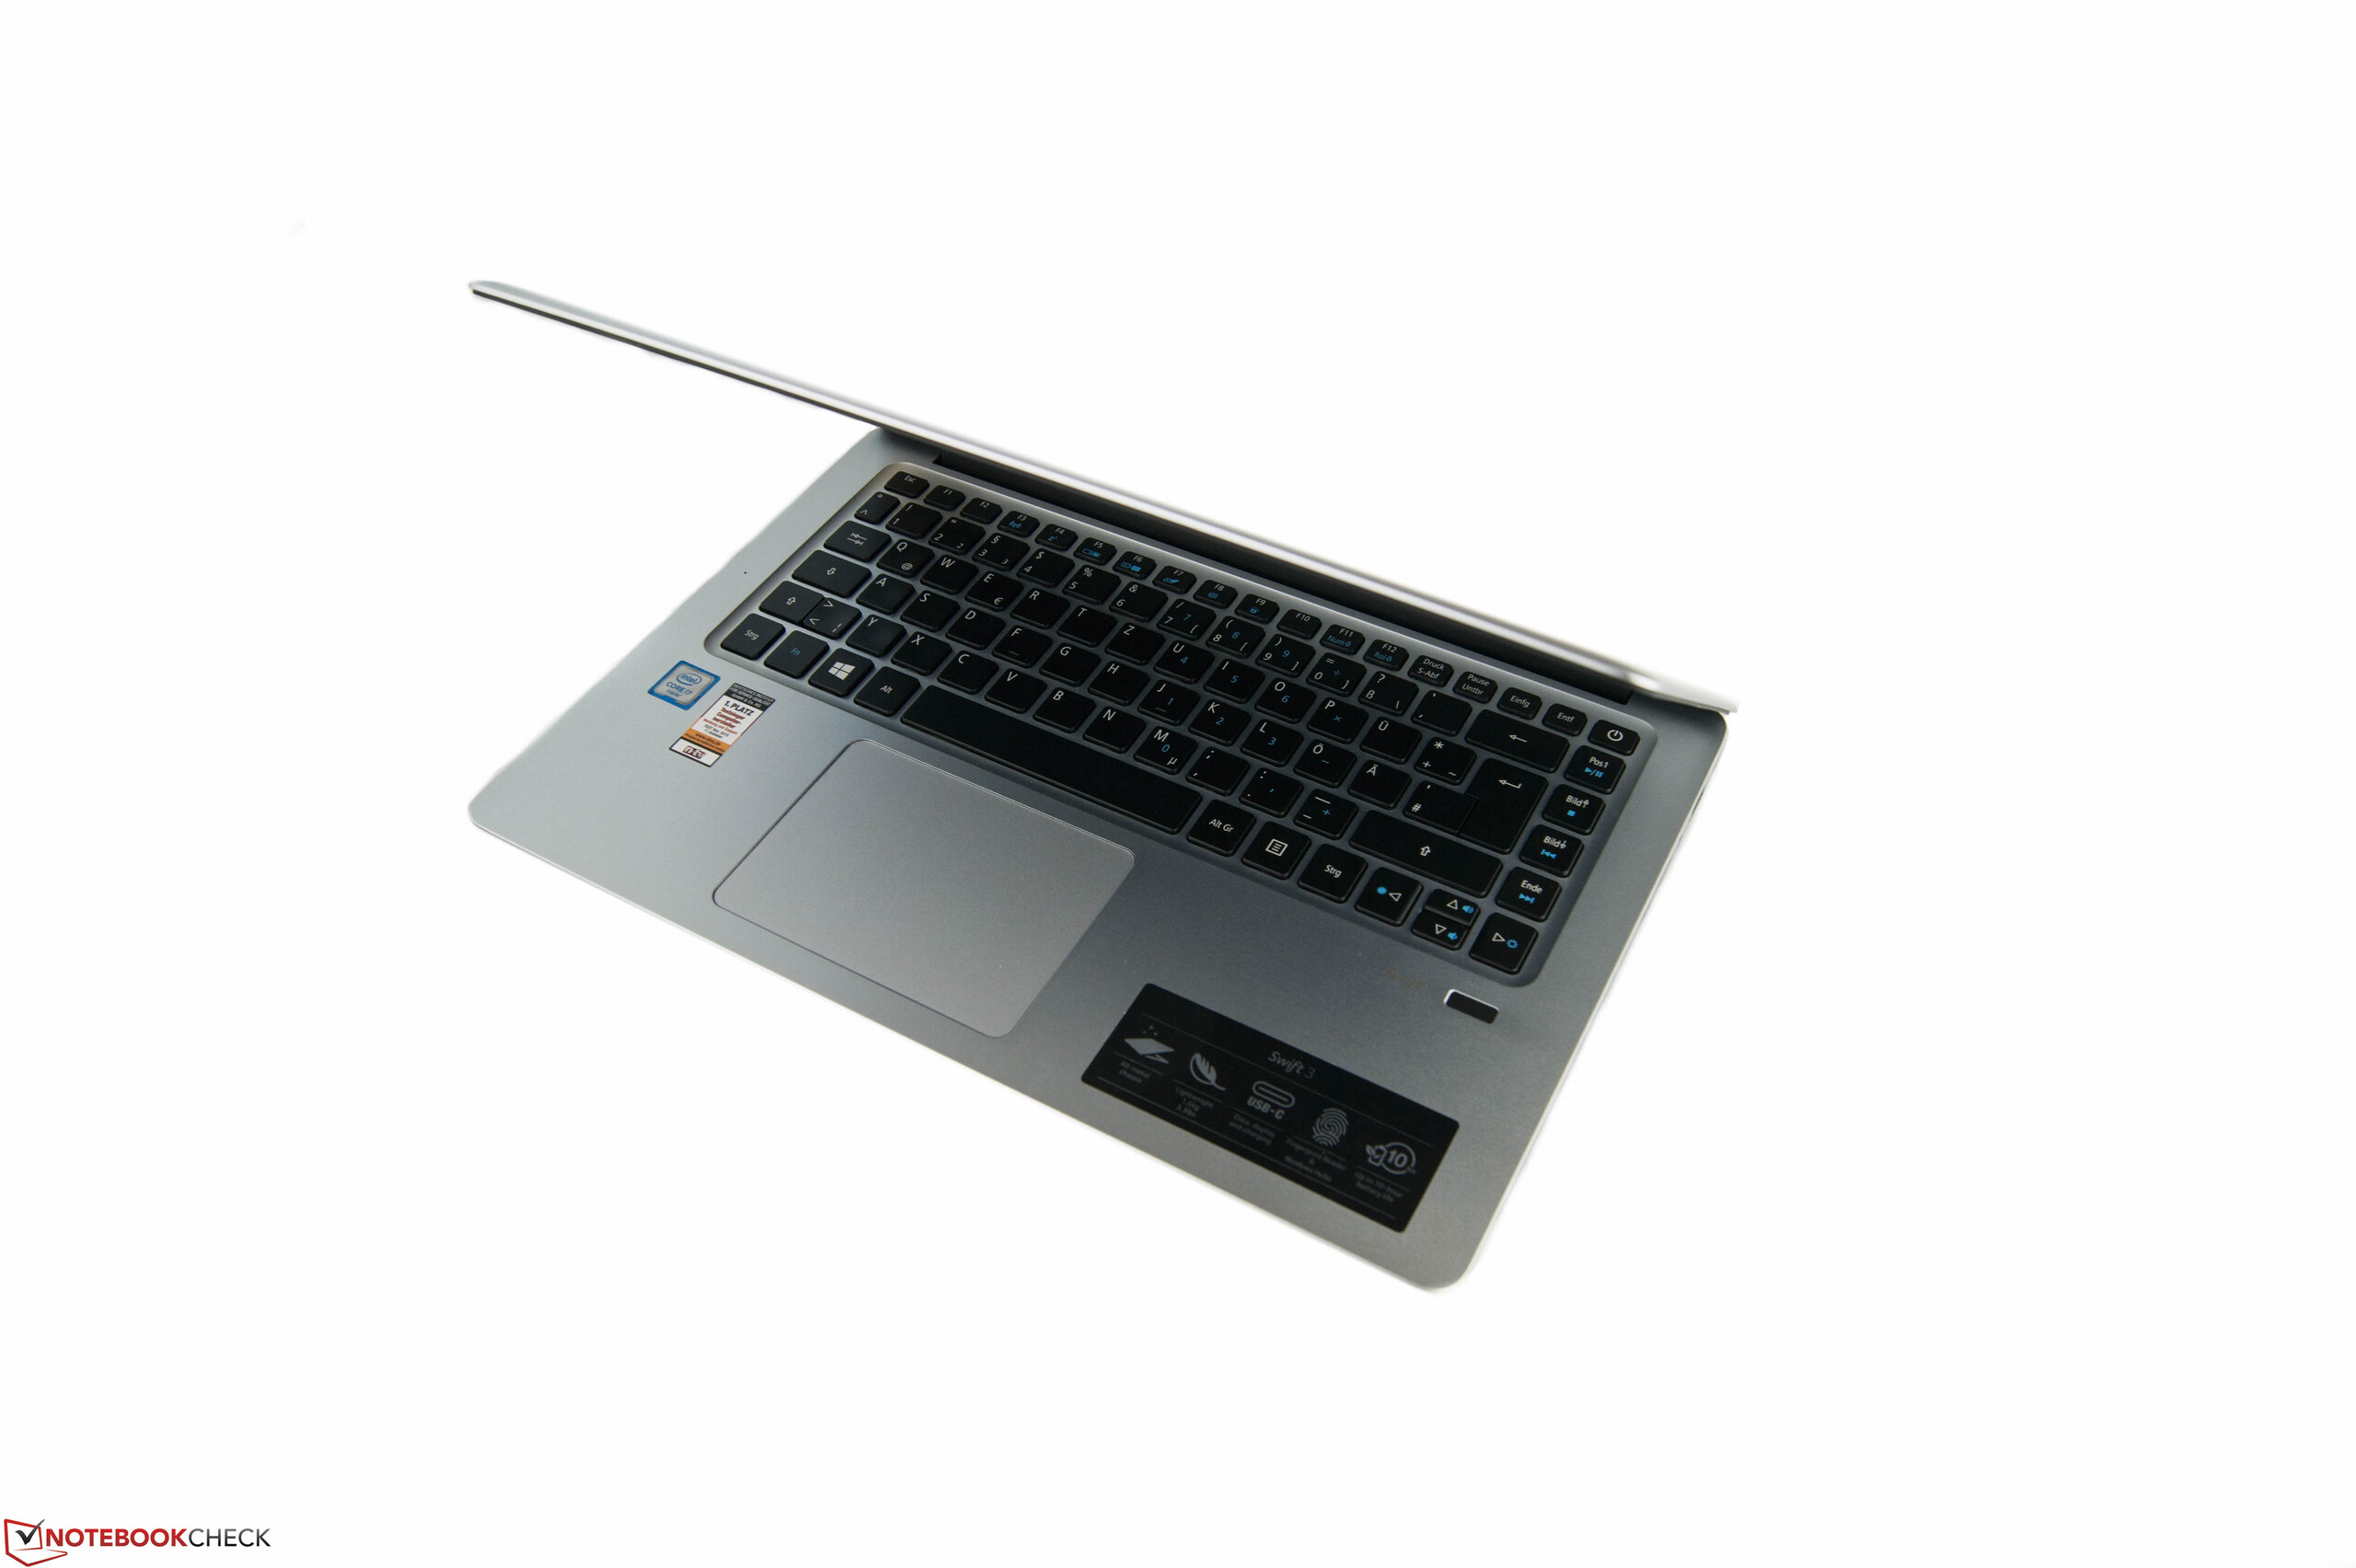
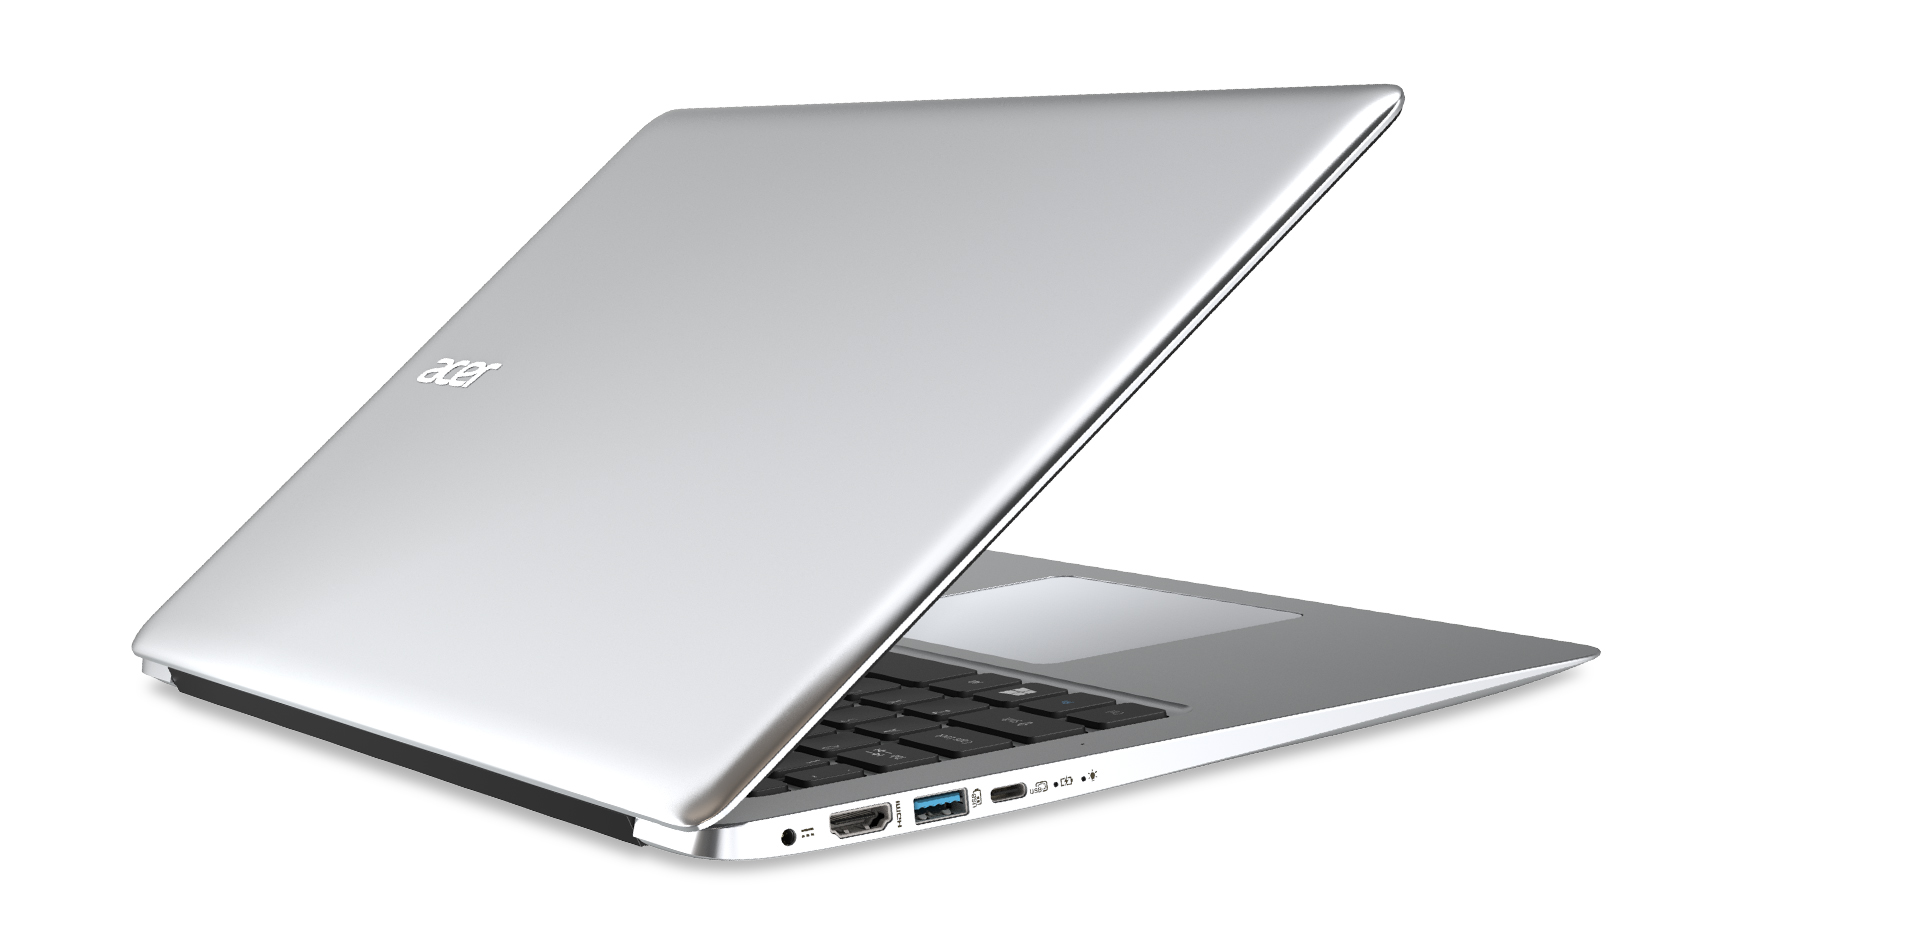
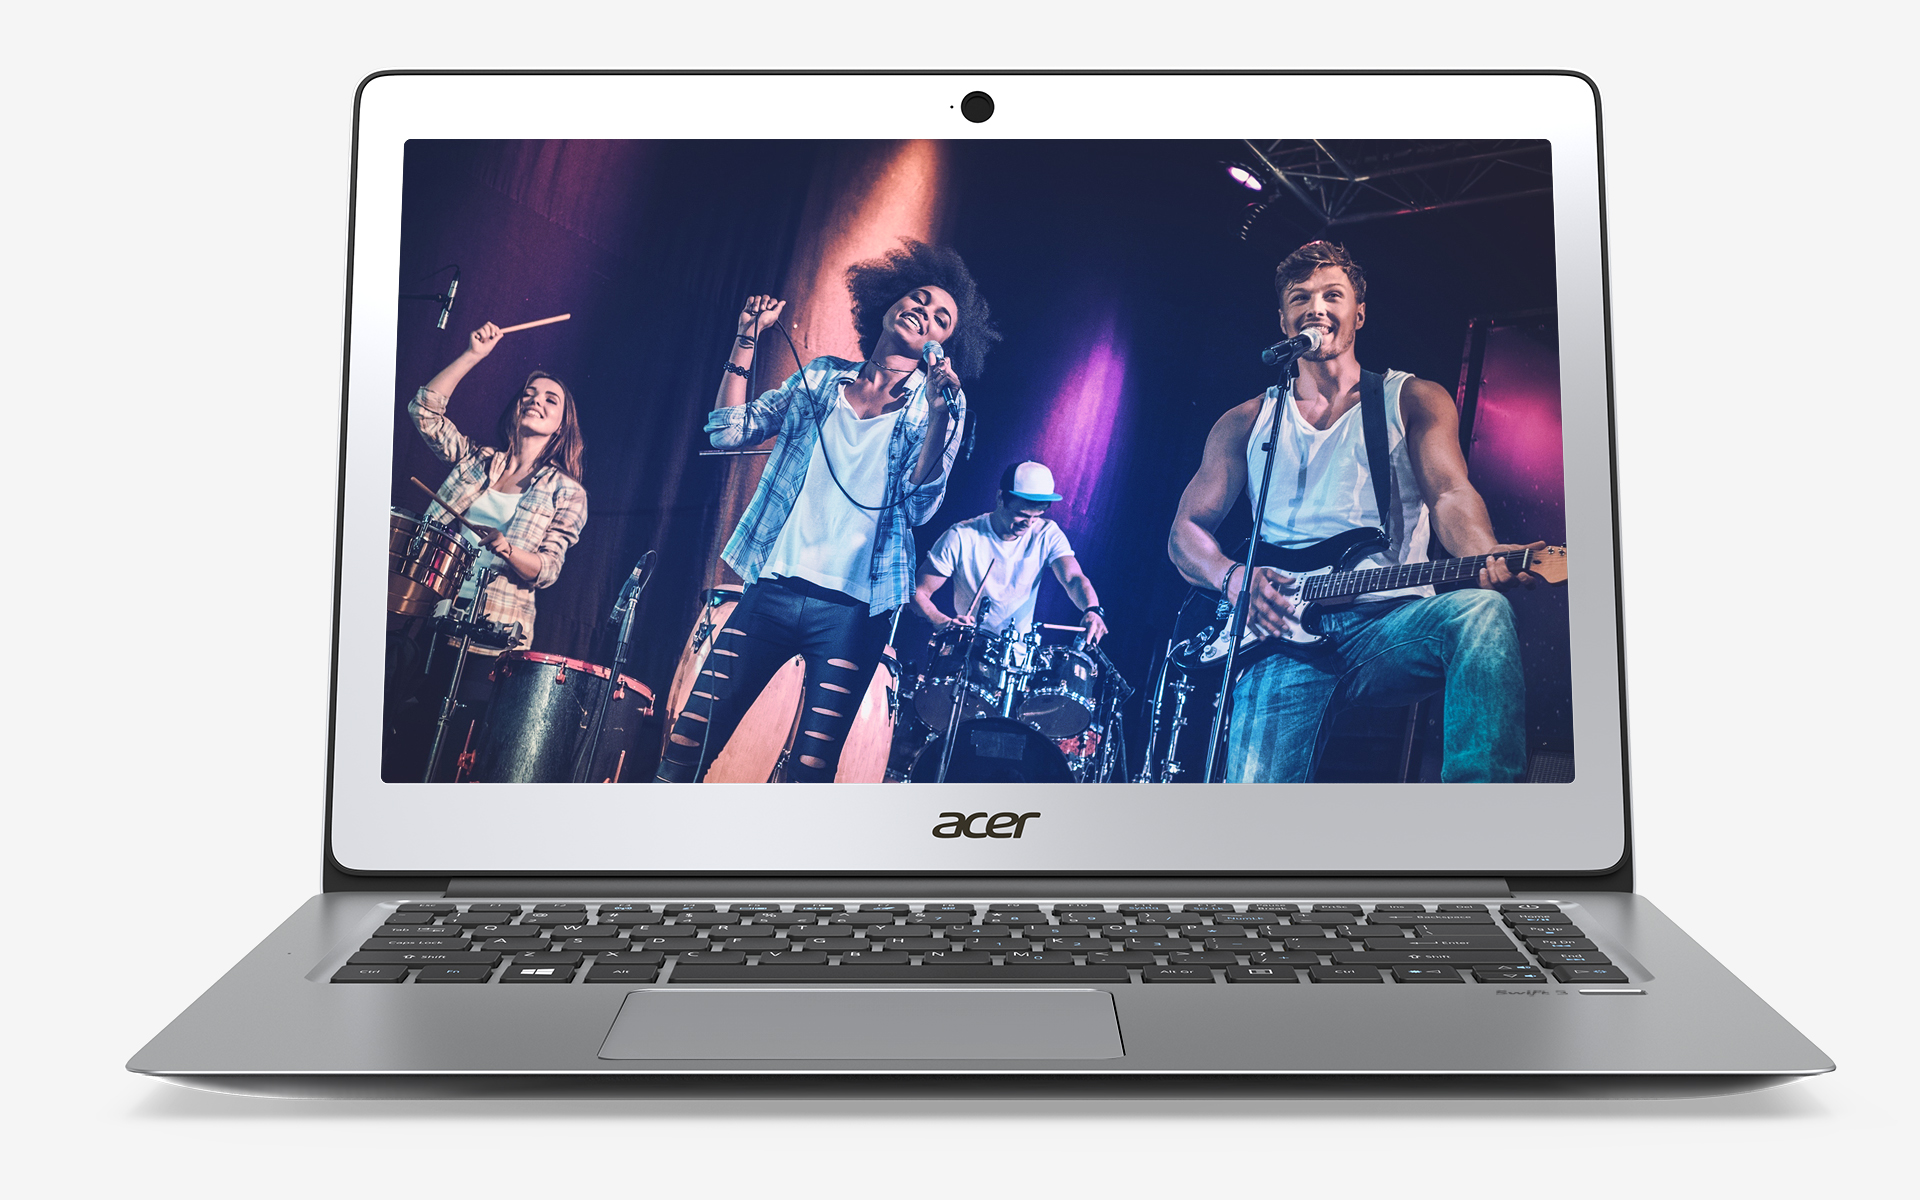
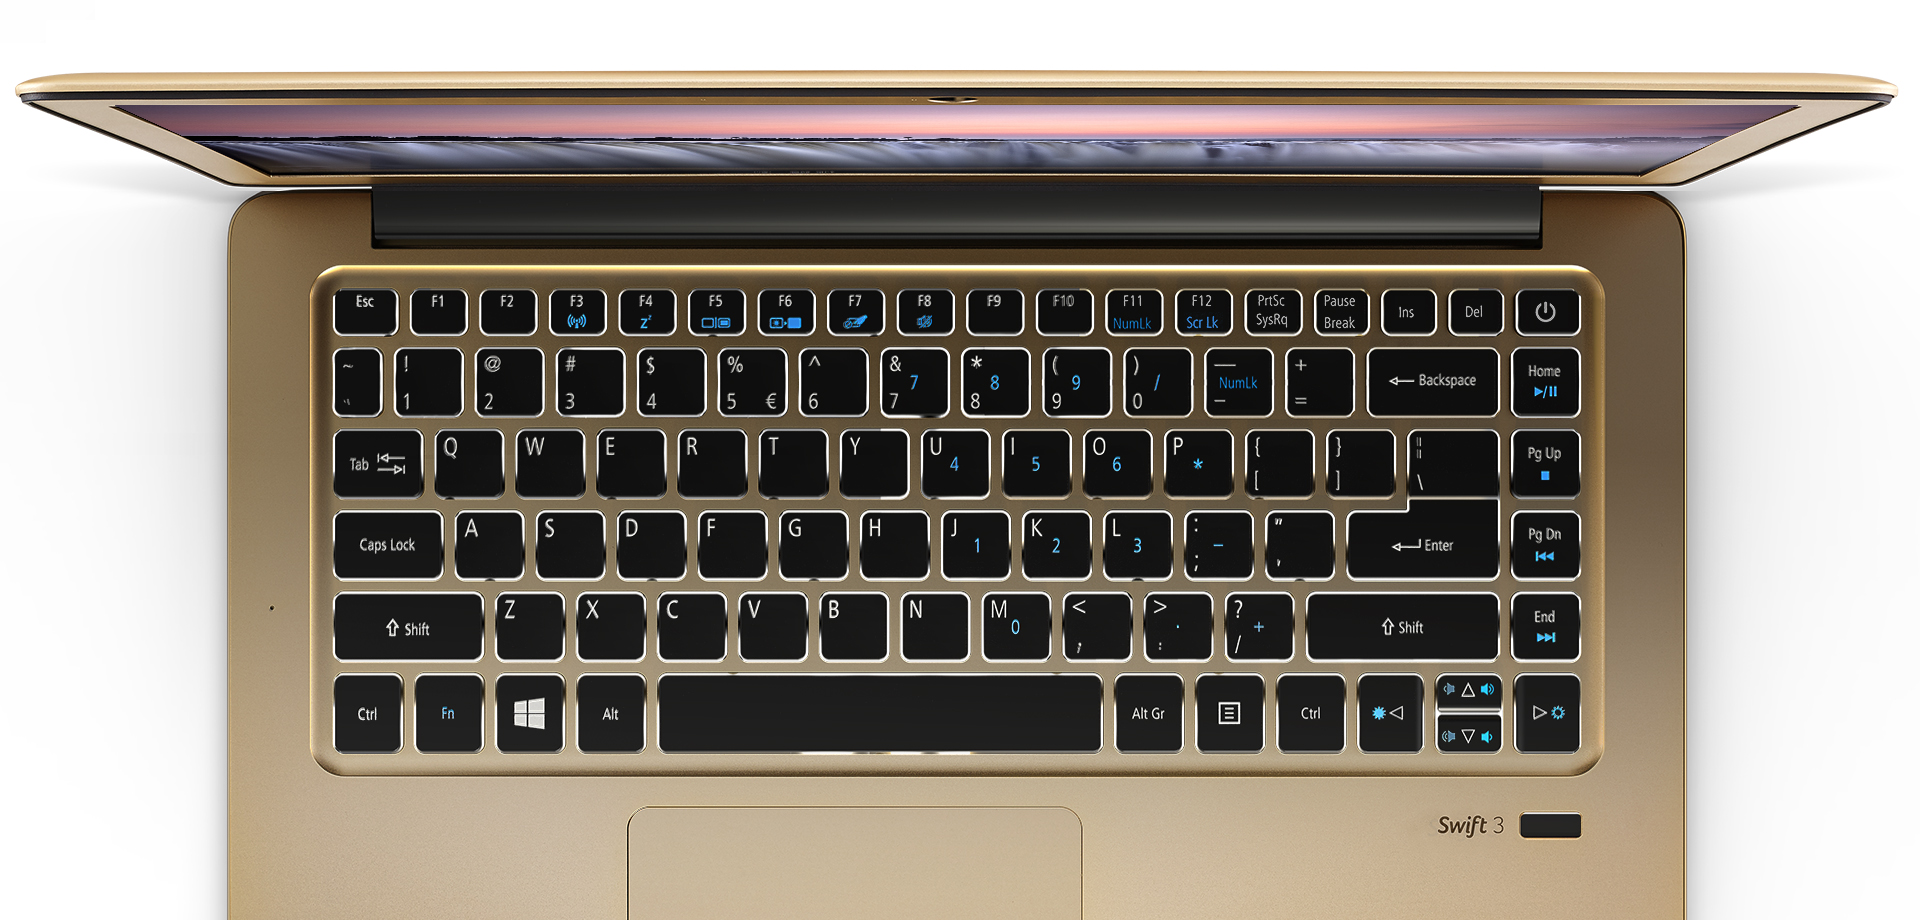
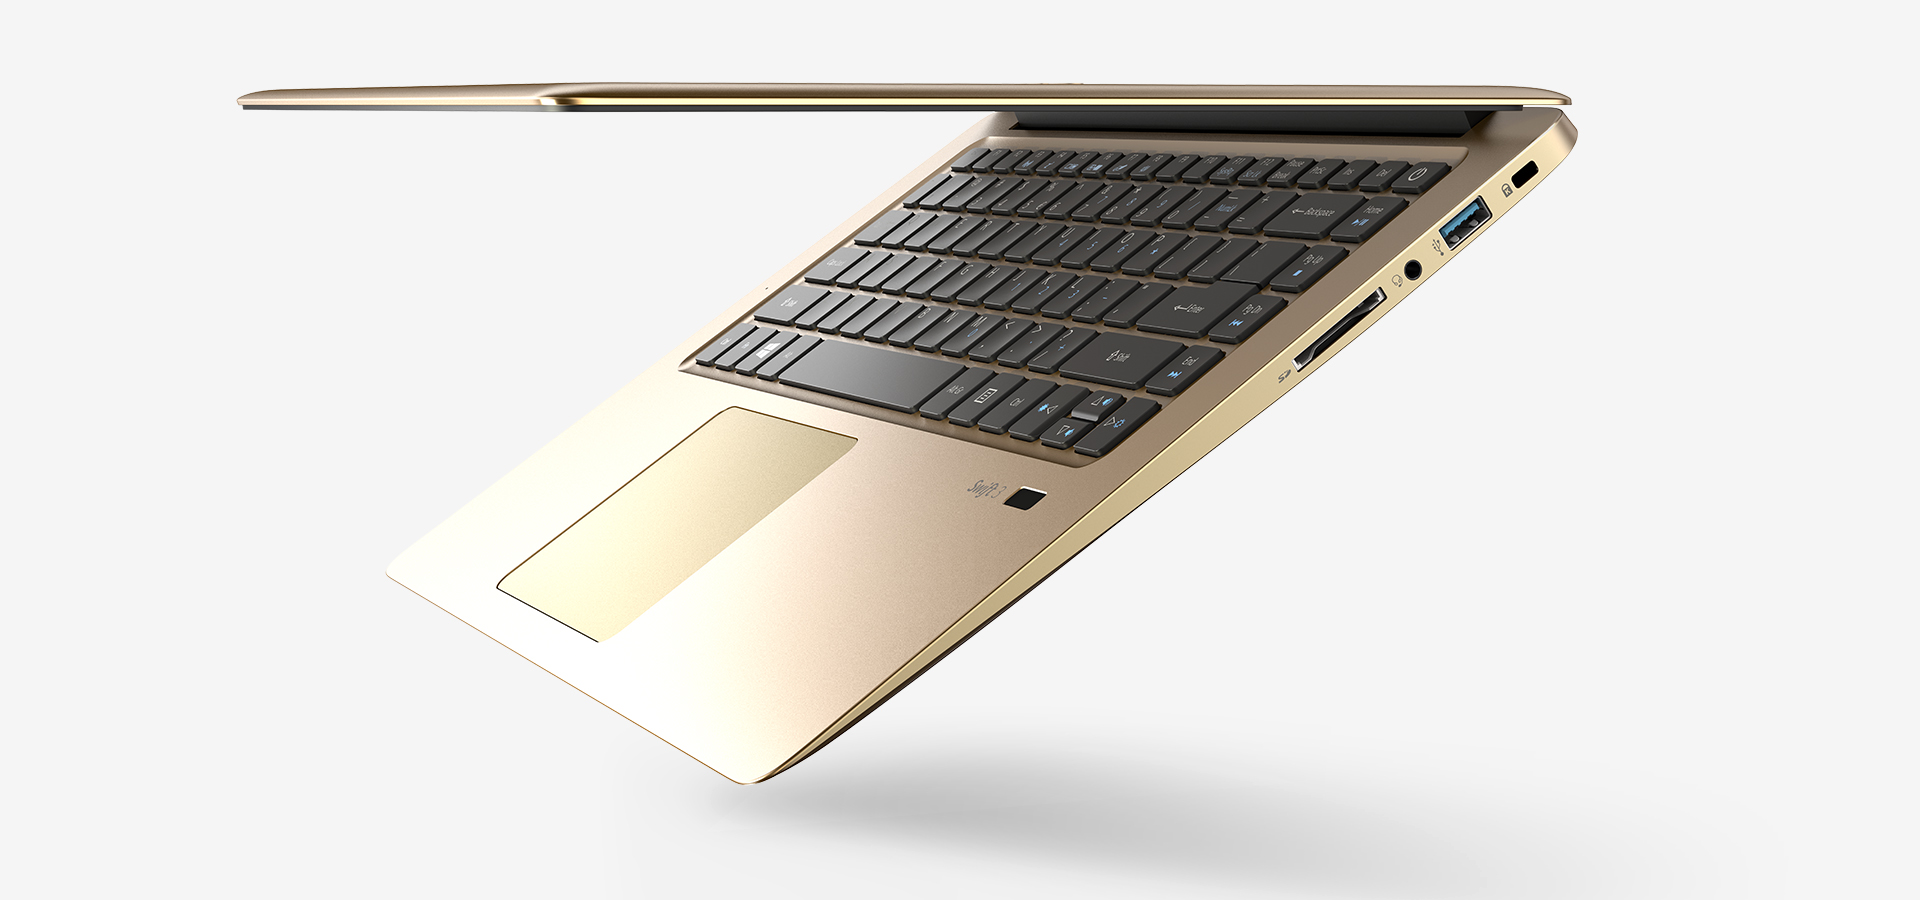
宏碁Swift 3是一台十分成功的亚笔记本电脑设备。它采用了精致的铝合金机身,在工艺上几乎无可挑剔。只有维护升级所需的拆机比较困难。它的输入设备出人意料的优秀,特别是触控版可以顺畅地识别多点触控手势。这让这台14寸设备十分适合办公用途。它的缺点主要在于屏幕,我们认为它的亮度略显不足。如果对比一下来自华硕的同类机型的话,它们都搭配了更明亮的屏幕面板。而我们很喜欢Swift 3的全方位性能。甚至是繁重的负载也无法难倒这台测试机。它的散热控制和噪音控制都属于合理的水平。只有电池续航相比竞争机型略显落后。
不算完美,但仍然出众:宏碁Swift 3是一台可以让人满意的办公和多媒体设备。
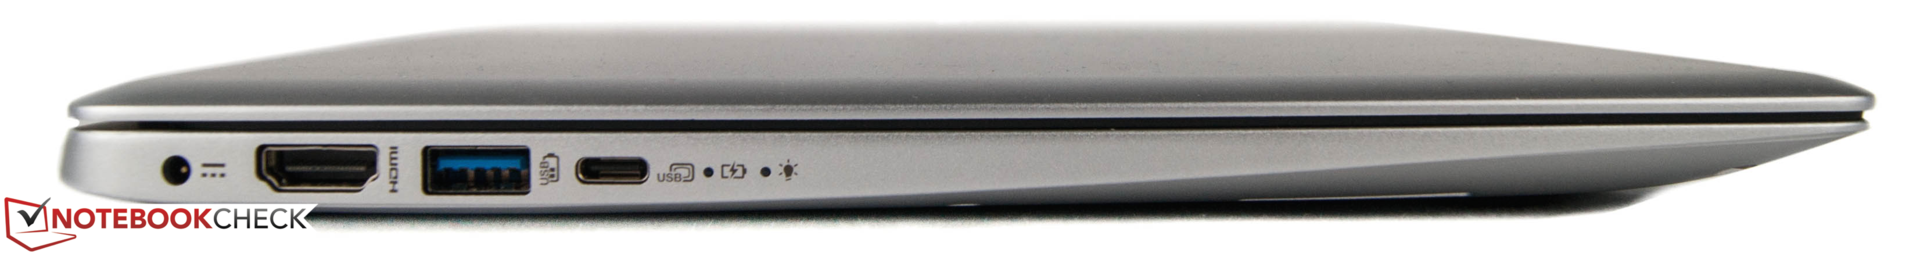
如果你可以投入更多预算的话,可以考虑一下戴尔 XPS 13。由于屏幕更为出色,电池续航更长以及图形性能更高,它是一台整体表现更好的设备。额外的Thunderbolt 3接口的高带宽PCIe支持也会为带来更大的扩展空间,略为弥补接口数量较少的不足。华硕ZenBook是个适合经常需要携带笔记本电脑出门用户的选择。除了更长的续航,它还提供了更明亮的屏幕。
刚刚提到的华硕ZenBook的优势在同样来自宏碁的Aspire S 13身上也不一而足,它们的售价也十分相近。
注:本文是基于完整评测的缩减版本,阅读完整的英文评测,请点击这里。
Acer Swift 3 SF314-51-731X
- 12/14/2016 v6 (old)
Nino Ricchizzi
Price comparison
