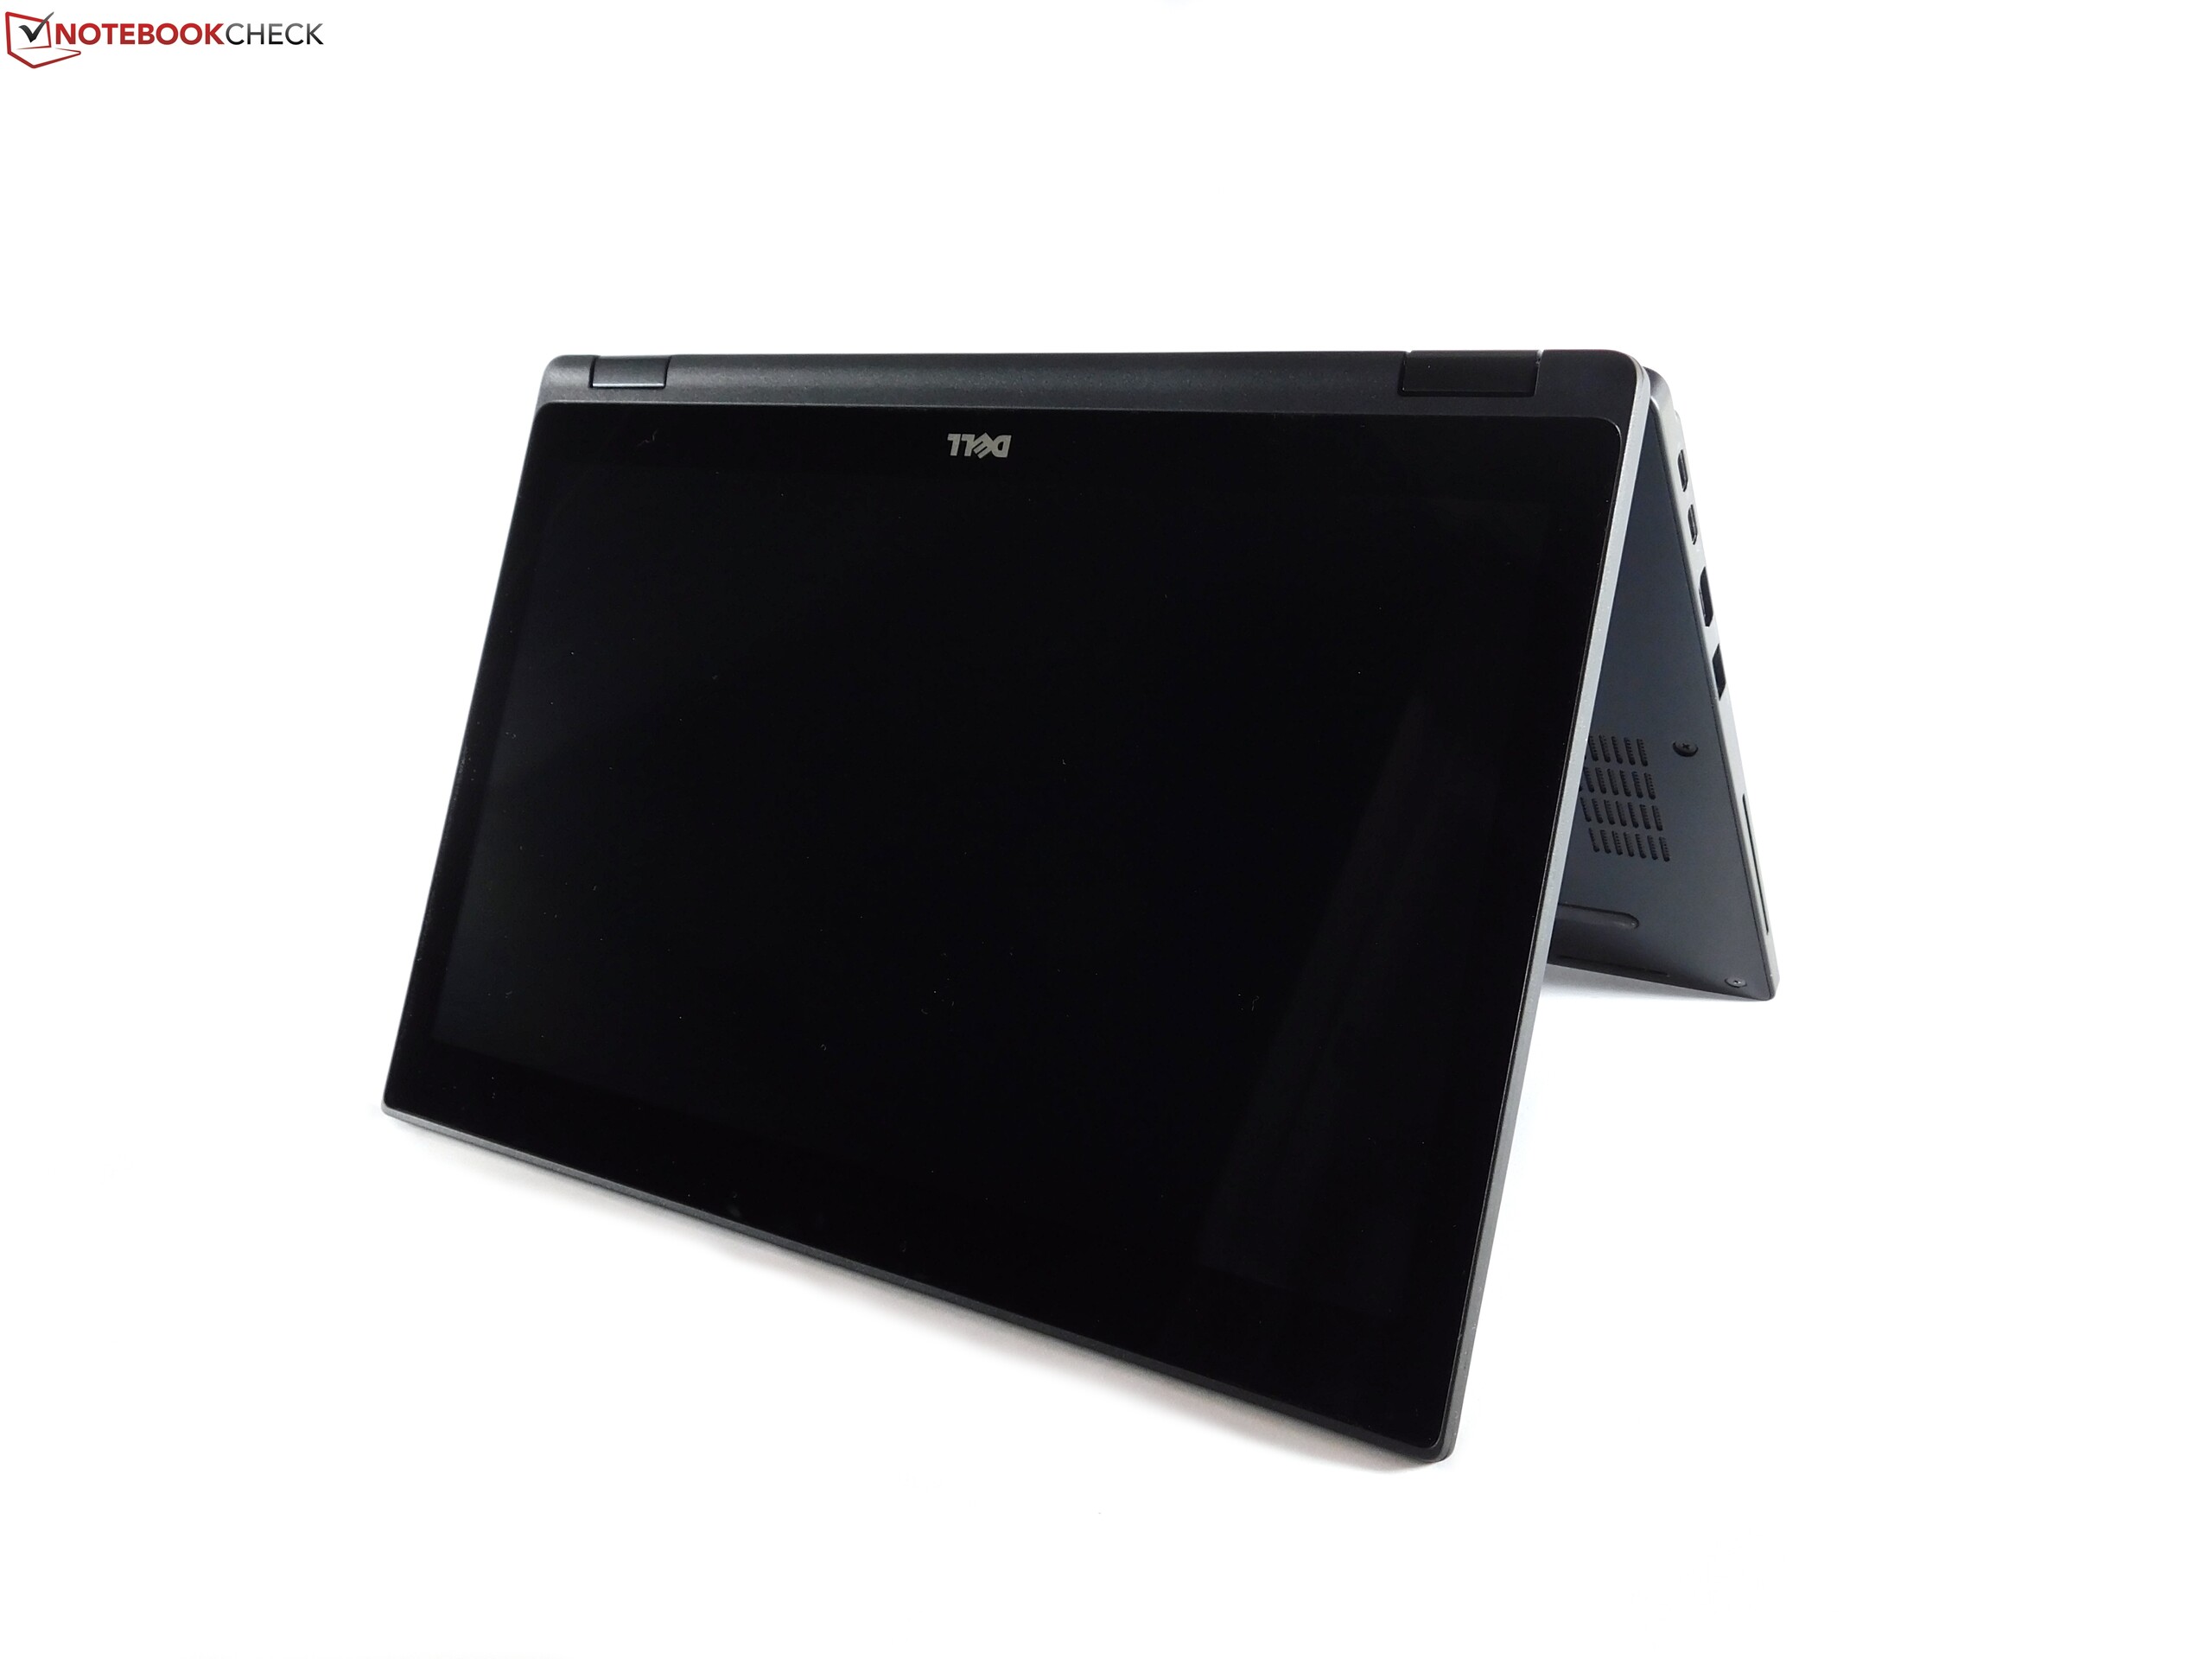
戴尔 Latitude 5289 (i5, 256GB, 8GB) 变形本简短评测
| Networking | |
| iperf3 transmit AX12 | |
| Lenovo ThinkPad Yoga 370-20JJS00100 | |
| Dell Latitude 5289 | |
| HP EliteBook x360 1030 G2 | |
| iperf3 receive AX12 | |
| Lenovo ThinkPad Yoga 370-20JJS00100 | |
| HP EliteBook x360 1030 G2 | |
| Dell Latitude 5289 | |
| |||||||||||||||||||||||||
Brightness Distribution: 90 %
Center on Battery: 336 cd/m²
Contrast: 988:1 (Black: 0.34 cd/m²)
ΔE ColorChecker Calman: 3.45 | ∀{0.5-29.43 Ø4.71}
ΔE Greyscale Calman: 1.68 | ∀{0.09-98 Ø4.96}
64% sRGB (Argyll 1.6.3 3D)
41% AdobeRGB 1998 (Argyll 1.6.3 3D)
44.21% AdobeRGB 1998 (Argyll 3D)
64.3% sRGB (Argyll 3D)
42.79% Display P3 (Argyll 3D)
Gamma: 2.49
CCT: 6782 K
| Dell Latitude 5289 BOE NV12N51, , 1920x1080, 12.5" | Lenovo ThinkPad Yoga 370-20JJS00100 Sharp LQ133M1JX15, , 1920x1080, 13.3" | HP EliteBook x360 1030 G2 CMN1374, , 1920x1080, 13.3" | Dell XPS 13-9365 2-in-1 1920x1080, 13.3" | HP Spectre x360 13-w023dx Chi Mei CMN1367, , 1920x1080, 13.3" | Lenovo Yoga 910-13IKB-80VF004CGE AU Optronics AUO323D / B139HAN03.2, , 3840x2160, 13.9" | |
|---|---|---|---|---|---|---|
| Display | 56% | 46% | 11% | 48% | 43% | |
| Display P3 Coverage (%) | 42.79 | 67.9 59% | 65.5 53% | 47.32 11% | 65.4 53% | 62.2 45% |
| sRGB Coverage (%) | 64.3 | 97.3 51% | 88.8 38% | 71.1 11% | 90.4 41% | 90.1 40% |
| AdobeRGB 1998 Coverage (%) | 44.21 | 69.9 58% | 64.9 47% | 48.83 10% | 65.8 49% | 63.5 44% |
| Response Times | -3% | -10% | -10% | 16% | 7% | |
| Response Time Grey 50% / Grey 80% * (ms) | 42 ? | 42 ? -0% | 55.2 ? -31% | 48 ? -14% | 33.2 ? 21% | 46 ? -10% |
| Response Time Black / White * (ms) | 31 ? | 32.8 ? -6% | 27.2 ? 12% | 32.8 ? -6% | 28 ? 10% | 24 ? 23% |
| PWM Frequency (Hz) | 531 ? | 217.4 ? | 1042 ? | |||
| Screen | -20% | -28% | -41% | -40% | -45% | |
| Brightness middle (cd/m²) | 336 | 374 11% | 262 -22% | 322.6 -4% | 334.6 0% | 348 4% |
| Brightness (cd/m²) | 320 | 356 11% | 256 -20% | 306 -4% | 319 0% | 310 -3% |
| Brightness Distribution (%) | 90 | 87 -3% | 83 -8% | 91 1% | 90 0% | 80 -11% |
| Black Level * (cd/m²) | 0.34 | 0.33 3% | 0.25 26% | 0.19 44% | 0.336 1% | 0.25 26% |
| Contrast (:1) | 988 | 1133 15% | 1048 6% | 1698 72% | 996 1% | 1392 41% |
| Colorchecker dE 2000 * | 3.45 | 4.7 -36% | 5.13 -49% | 7.7 -123% | 6.21 -80% | 7.86 -128% |
| Colorchecker dE 2000 max. * | 7.95 | 9.5 -19% | 9.46 -19% | 11.1 -40% | 12 -51% | 13.43 -69% |
| Greyscale dE 2000 * | 1.68 | 6.5 -287% | 6.23 -271% | 7.9 -370% | 7.71 -359% | 8.25 -391% |
| Gamma | 2.49 88% | 2.19 100% | 2.45 90% | 2.88 76% | 2.36 93% | 2.05 107% |
| CCT | 6782 96% | 7086 92% | 6413 101% | 7044 92% | 6458 101% | 6834 95% |
| Color Space (Percent of AdobeRGB 1998) (%) | 41 | 63.1 54% | 57.84 41% | 44.1 8% | 58.6 43% | 58 41% |
| Color Space (Percent of sRGB) (%) | 64 | 97.2 52% | 88.57 38% | 69.9 9% | 90 41% | 90 41% |
| Total Average (Program / Settings) | 11% /
-2% | 3% /
-11% | -13% /
-26% | 8% /
-15% | 2% /
-20% |
* ... smaller is better
Display Response Times
| ↔ Response Time Black to White | ||
|---|---|---|
| 31 ms ... rise ↗ and fall ↘ combined | ↗ 18 ms rise | 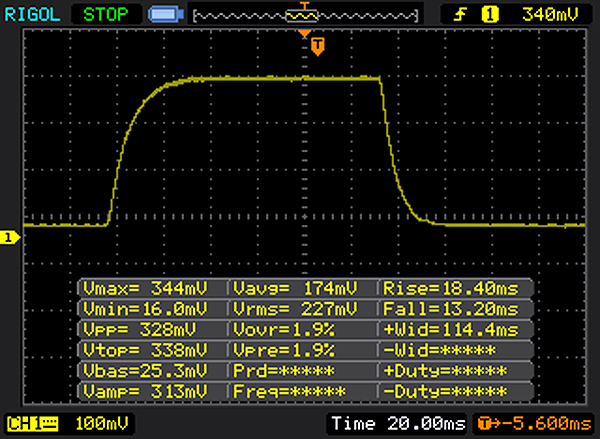 |
| ↘ 13 ms fall | ||
| The screen shows slow response rates in our tests and will be unsatisfactory for gamers. In comparison, all tested devices range from 0.1 (minimum) to 240 (maximum) ms. » 84 % of all devices are better. This means that the measured response time is worse than the average of all tested devices (19.8 ms). | ||
| ↔ Response Time 50% Grey to 80% Grey | ||
| 42 ms ... rise ↗ and fall ↘ combined | ↗ 22 ms rise | 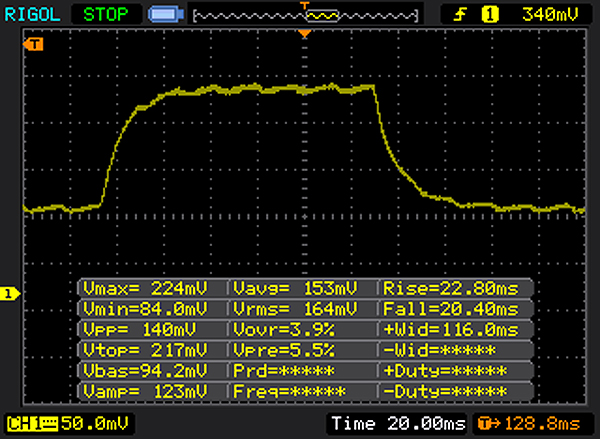 |
| ↘ 20 ms fall | ||
| The screen shows slow response rates in our tests and will be unsatisfactory for gamers. In comparison, all tested devices range from 0.165 (minimum) to 636 (maximum) ms. » 67 % of all devices are better. This means that the measured response time is worse than the average of all tested devices (30.9 ms). | ||
Screen Flickering / PWM (Pulse-Width Modulation)
| Screen flickering / PWM detected | 531 Hz | ≤ 90 % brightness setting | 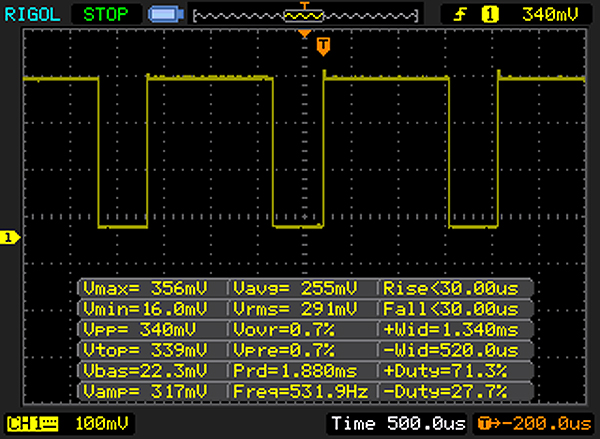 |
The display backlight flickers at 531 Hz (worst case, e.g., utilizing PWM) Flickering detected at a brightness setting of 90 % and below. There should be no flickering or PWM above this brightness setting. The frequency of 531 Hz is quite high, so most users sensitive to PWM should not notice any flickering. In comparison: 52 % of all tested devices do not use PWM to dim the display. If PWM was detected, an average of 7748 (minimum: 5 - maximum: 343500) Hz was measured. | |||

| PCMark 8 Home Score Accelerated v2 | 3554 points | |
| PCMark 8 Work Score Accelerated v2 | 4681 points | |
Help | ||
| Dell Latitude 5289 SanDisk X400 256GB, SATA (SD8SB8U-256G) | Lenovo ThinkPad Yoga 370-20JJS00100 Toshiba NVMe THNSF5512GPUK | HP EliteBook x360 1030 G2 Sandisk SD8TN8U-256G-1006 | Dell XPS 13-9365 2-in-1 Toshiba NVMe THNSN5256GPUK | HP Spectre x360 13-w023dx Samsung PM951 NVMe MZVLV512 | Lenovo Yoga 910-13IKB-80VF004CGE Samsung PM951 NVMe MZVLV512 | |
|---|---|---|---|---|---|---|
| CrystalDiskMark 3.0 | 128% | 33% | 130% | 154% | 179% | |
| Read Seq (MB/s) | 423.7 | 1070 153% | 467.1 10% | 1206 185% | 1376 225% | 1412 233% |
| Write Seq (MB/s) | 406.4 | 484.5 19% | 443.6 9% | 629 55% | 571 41% | 578 42% |
| Read 512 (MB/s) | 260.8 | 680 161% | 312.3 20% | 966 270% | 679 160% | 701 169% |
| Write 512 (MB/s) | 255.6 | 483.1 89% | 372.5 46% | 410.7 61% | 571 123% | 580 127% |
| Read 4k (MB/s) | 22.73 | 30.55 34% | 29.43 29% | 32.93 45% | 42.66 88% | 43.5 91% |
| Write 4k (MB/s) | 27.92 | 127.3 356% | 56.5 102% | 121.2 334% | 137.9 394% | 159.7 472% |
| Read 4k QD32 (MB/s) | 306.2 | 460.8 50% | 311.3 2% | 411 34% | 535 75% | 570 86% |
| Write 4k QD32 (MB/s) | 158.8 | 414.5 161% | 225.2 42% | 250.2 58% | 361.2 127% | 488.7 208% |

| 3DMark 11 - 1280x720 Performance GPU | |
| Dell Latitude 5289 | |
| Lenovo Yoga 910-13IKB-80VF004CGE | |
| HP Spectre x360 13-w023dx | |
| HP EliteBook x360 1030 G2 | |
| Dell XPS 13-9365 2-in-1 | |
| Lenovo ThinkPad Yoga 370-20JJS00100 | |
| 3DMark 11 Performance | 1787 points | |
| 3DMark Cloud Gate Standard Score | 6359 points | |
| 3DMark Fire Strike Score | 931 points | |
Help | ||
| low | med. | high | ultra | |
|---|---|---|---|---|
| BioShock Infinite (2013) | 53.6 | 32.6 | 27.7 | 8.6 |
| Company of Heroes 2 (2013) | 22.6 | |||
| Rise of the Tomb Raider (2016) | 20.8 |
Noise level
| Idle |
| 30.5 / 30.5 / 30.5 dB(A) |
| Load |
| 36 / 34.6 dB(A) |
 | ||
30 dB silent 40 dB(A) audible 50 dB(A) loud |
||
min: | ||
(-) The maximum temperature on the upper side is 49 °C / 120 F, compared to the average of 35.4 °C / 96 F, ranging from 19.6 to 60 °C for the class Convertible.
(±) The bottom heats up to a maximum of 44.4 °C / 112 F, compared to the average of 36.9 °C / 98 F
(+) In idle usage, the average temperature for the upper side is 26.4 °C / 80 F, compared to the device average of 30.3 °C / 87 F.
(+) The palmrests and touchpad are cooler than skin temperature with a maximum of 30.2 °C / 86.4 F and are therefore cool to the touch.
(-) The average temperature of the palmrest area of similar devices was 28 °C / 82.4 F (-2.2 °C / -4 F).
Dell Latitude 5289 audio analysis
(-) | not very loud speakers (69 dB)
Bass 100 - 315 Hz
(-) | nearly no bass - on average 19.6% lower than median
(±) | linearity of bass is average (11.1% delta to prev. frequency)
Mids 400 - 2000 Hz
(+) | balanced mids - only 3.2% away from median
(±) | linearity of mids is average (7.7% delta to prev. frequency)
Highs 2 - 16 kHz
(±) | higher highs - on average 5.2% higher than median
(±) | linearity of highs is average (9.5% delta to prev. frequency)
Overall 100 - 16.000 Hz
(±) | linearity of overall sound is average (23.2% difference to median)
Compared to same class
» 70% of all tested devices in this class were better, 5% similar, 25% worse
» The best had a delta of 6%, average was 20%, worst was 57%
Compared to all devices tested
» 70% of all tested devices were better, 5% similar, 25% worse
» The best had a delta of 4%, average was 23%, worst was 134%
Apple MacBook 12 (Early 2016) 1.1 GHz audio analysis
(+) | speakers can play relatively loud (83.6 dB)
Bass 100 - 315 Hz
(±) | reduced bass - on average 11.3% lower than median
(±) | linearity of bass is average (14.2% delta to prev. frequency)
Mids 400 - 2000 Hz
(+) | balanced mids - only 2.4% away from median
(+) | mids are linear (5.5% delta to prev. frequency)
Highs 2 - 16 kHz
(+) | balanced highs - only 2% away from median
(+) | highs are linear (4.5% delta to prev. frequency)
Overall 100 - 16.000 Hz
(+) | overall sound is linear (10.2% difference to median)
Compared to same class
» 7% of all tested devices in this class were better, 2% similar, 90% worse
» The best had a delta of 5%, average was 18%, worst was 53%
Compared to all devices tested
» 5% of all tested devices were better, 1% similar, 94% worse
» The best had a delta of 4%, average was 23%, worst was 134%
| Off / Standby | |
| Idle | |
| Load |
|
Key:
min: | |
| Dell Latitude 5289 i5-7300U, HD Graphics 620, SanDisk X400 256GB, SATA (SD8SB8U-256G), IPS LED, 1920x1080, 12.5" | Lenovo ThinkPad Yoga 370-20JJS00100 i5-7200U, HD Graphics 620, Toshiba NVMe THNSF5512GPUK, IPS LED, 1920x1080, 13.3" | HP EliteBook x360 1030 G2 i5-7300U, HD Graphics 620, Sandisk SD8TN8U-256G-1006, IPS, 1920x1080, 13.3" | Dell XPS 13-9365 2-in-1 i7-7Y75, HD Graphics 615, Toshiba NVMe THNSN5256GPUK, IPS, 1920x1080, 13.3" | HP Spectre x360 13-w023dx i7-7500U, HD Graphics 620, Samsung PM951 NVMe MZVLV512, IPS, 1920x1080, 13.3" | Lenovo Yoga 910-13IKB-80VF004CGE i7-7500U, HD Graphics 620, Samsung PM951 NVMe MZVLV512, IPS, 3840x2160, 13.9" | |
|---|---|---|---|---|---|---|
| Power Consumption | -17% | -9% | 17% | -30% | -20% | |
| Idle Minimum * (Watt) | 2.7 | 3.6 -33% | 3.2 -19% | 3.1 -15% | 5.5 -104% | 4.3 -59% |
| Idle Average * (Watt) | 5.1 | 7.2 -41% | 5.5 -8% | 4.3 16% | 6.7 -31% | 6.3 -24% |
| Idle Maximum * (Watt) | 7.6 | 8.4 -11% | 6.5 14% | 4.9 36% | 7.1 7% | 9 -18% |
| Load Average * (Watt) | 33 | 29.9 9% | 29.7 10% | 24.3 26% | 33.1 -0% | 32.7 1% |
| Load Maximum * (Watt) | 29 | 32.2 -11% | 41.3 -42% | 22.8 21% | 35.2 -21% | 28.8 1% |
* ... smaller is better
| Dell Latitude 5289 i5-7300U, HD Graphics 620, 60 Wh | Lenovo ThinkPad Yoga 370-20JJS00100 i5-7200U, HD Graphics 620, 51 Wh | HP EliteBook x360 1030 G2 i5-7300U, HD Graphics 620, 57 Wh | Dell XPS 13-9365 2-in-1 i7-7Y75, HD Graphics 615, 46 Wh | HP Spectre x360 13-w023dx i7-7500U, HD Graphics 620, 57.8 Wh | Lenovo Yoga 910-13IKB-80VF004CGE i7-7500U, HD Graphics 620, 78 Wh | |
|---|---|---|---|---|---|---|
| Battery runtime | -24% | 16% | -7% | -21% | -7% | |
| Reader / Idle (h) | 28.8 | 19.4 -33% | 23.1 -20% | 16.2 -44% | 20.6 -28% | 17.8 -38% |
| WiFi v1.3 (h) | 11.8 | 8.1 -31% | 10.5 -11% | 11.4 -3% | 9.3 -21% | 10.7 -9% |
| Load (h) | 2.3 | 2.1 -9% | 4.1 78% | 2.9 26% | 2 -13% | 2.9 26% |
| H.264 (h) | 9.6 | 11 |
Pros
Cons
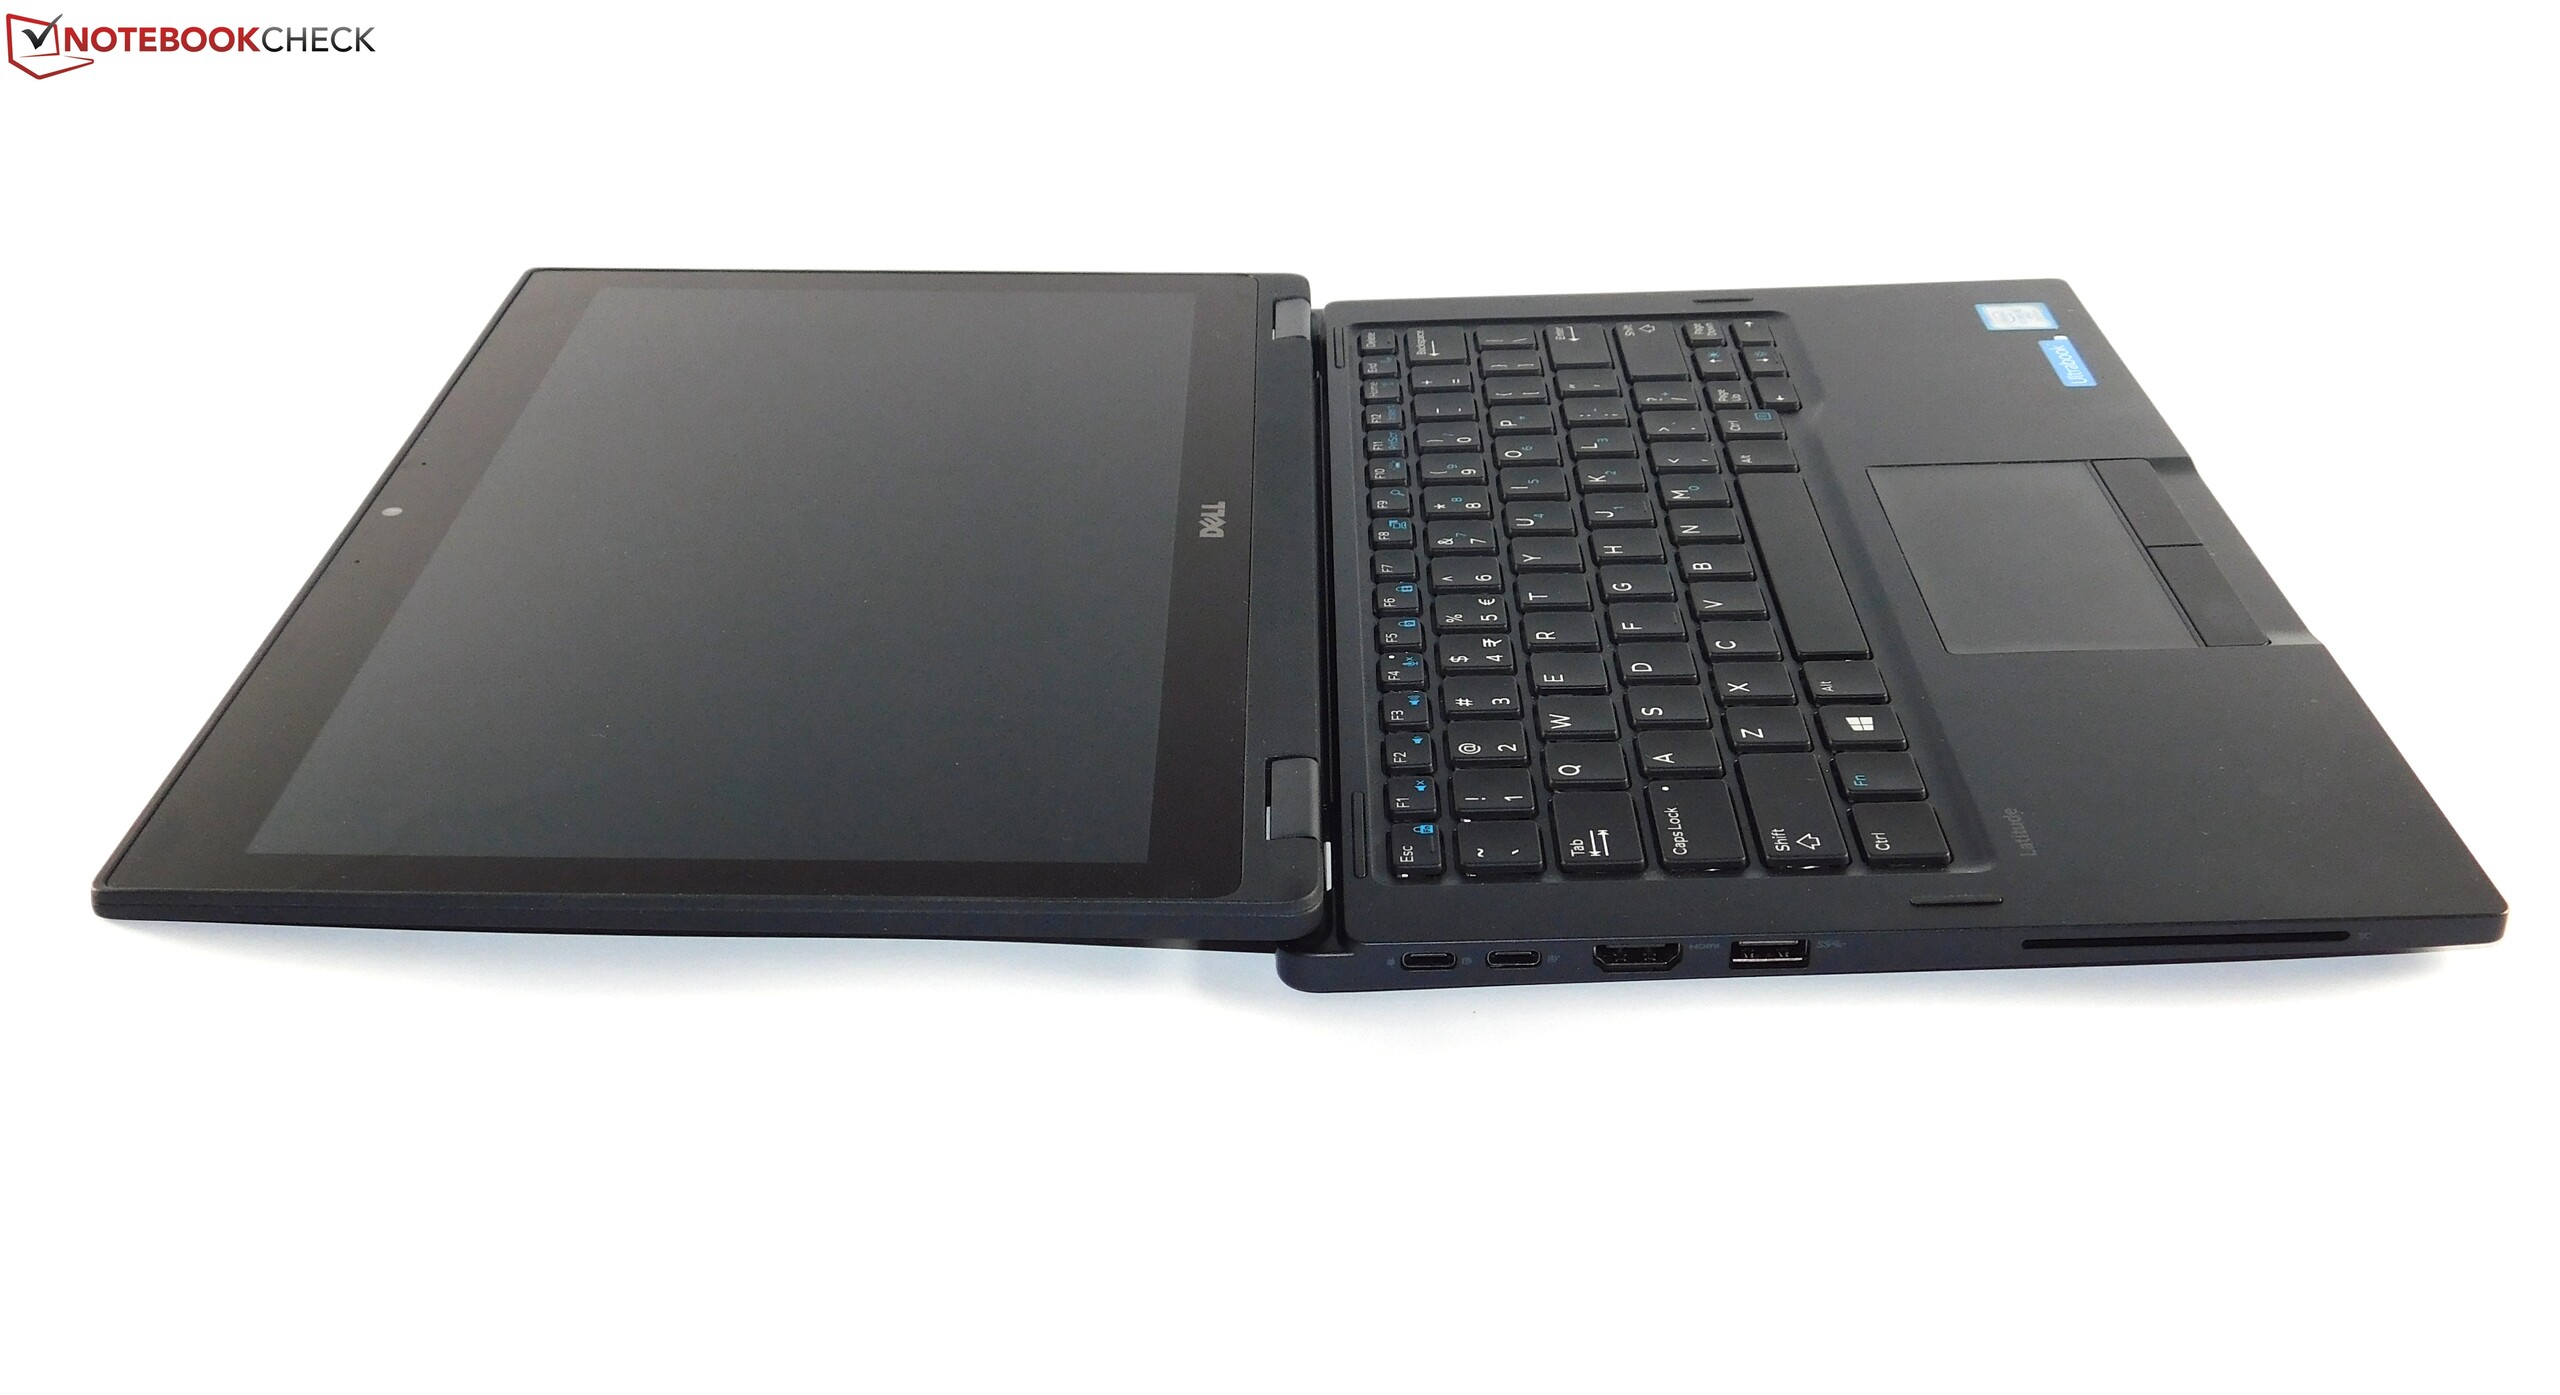
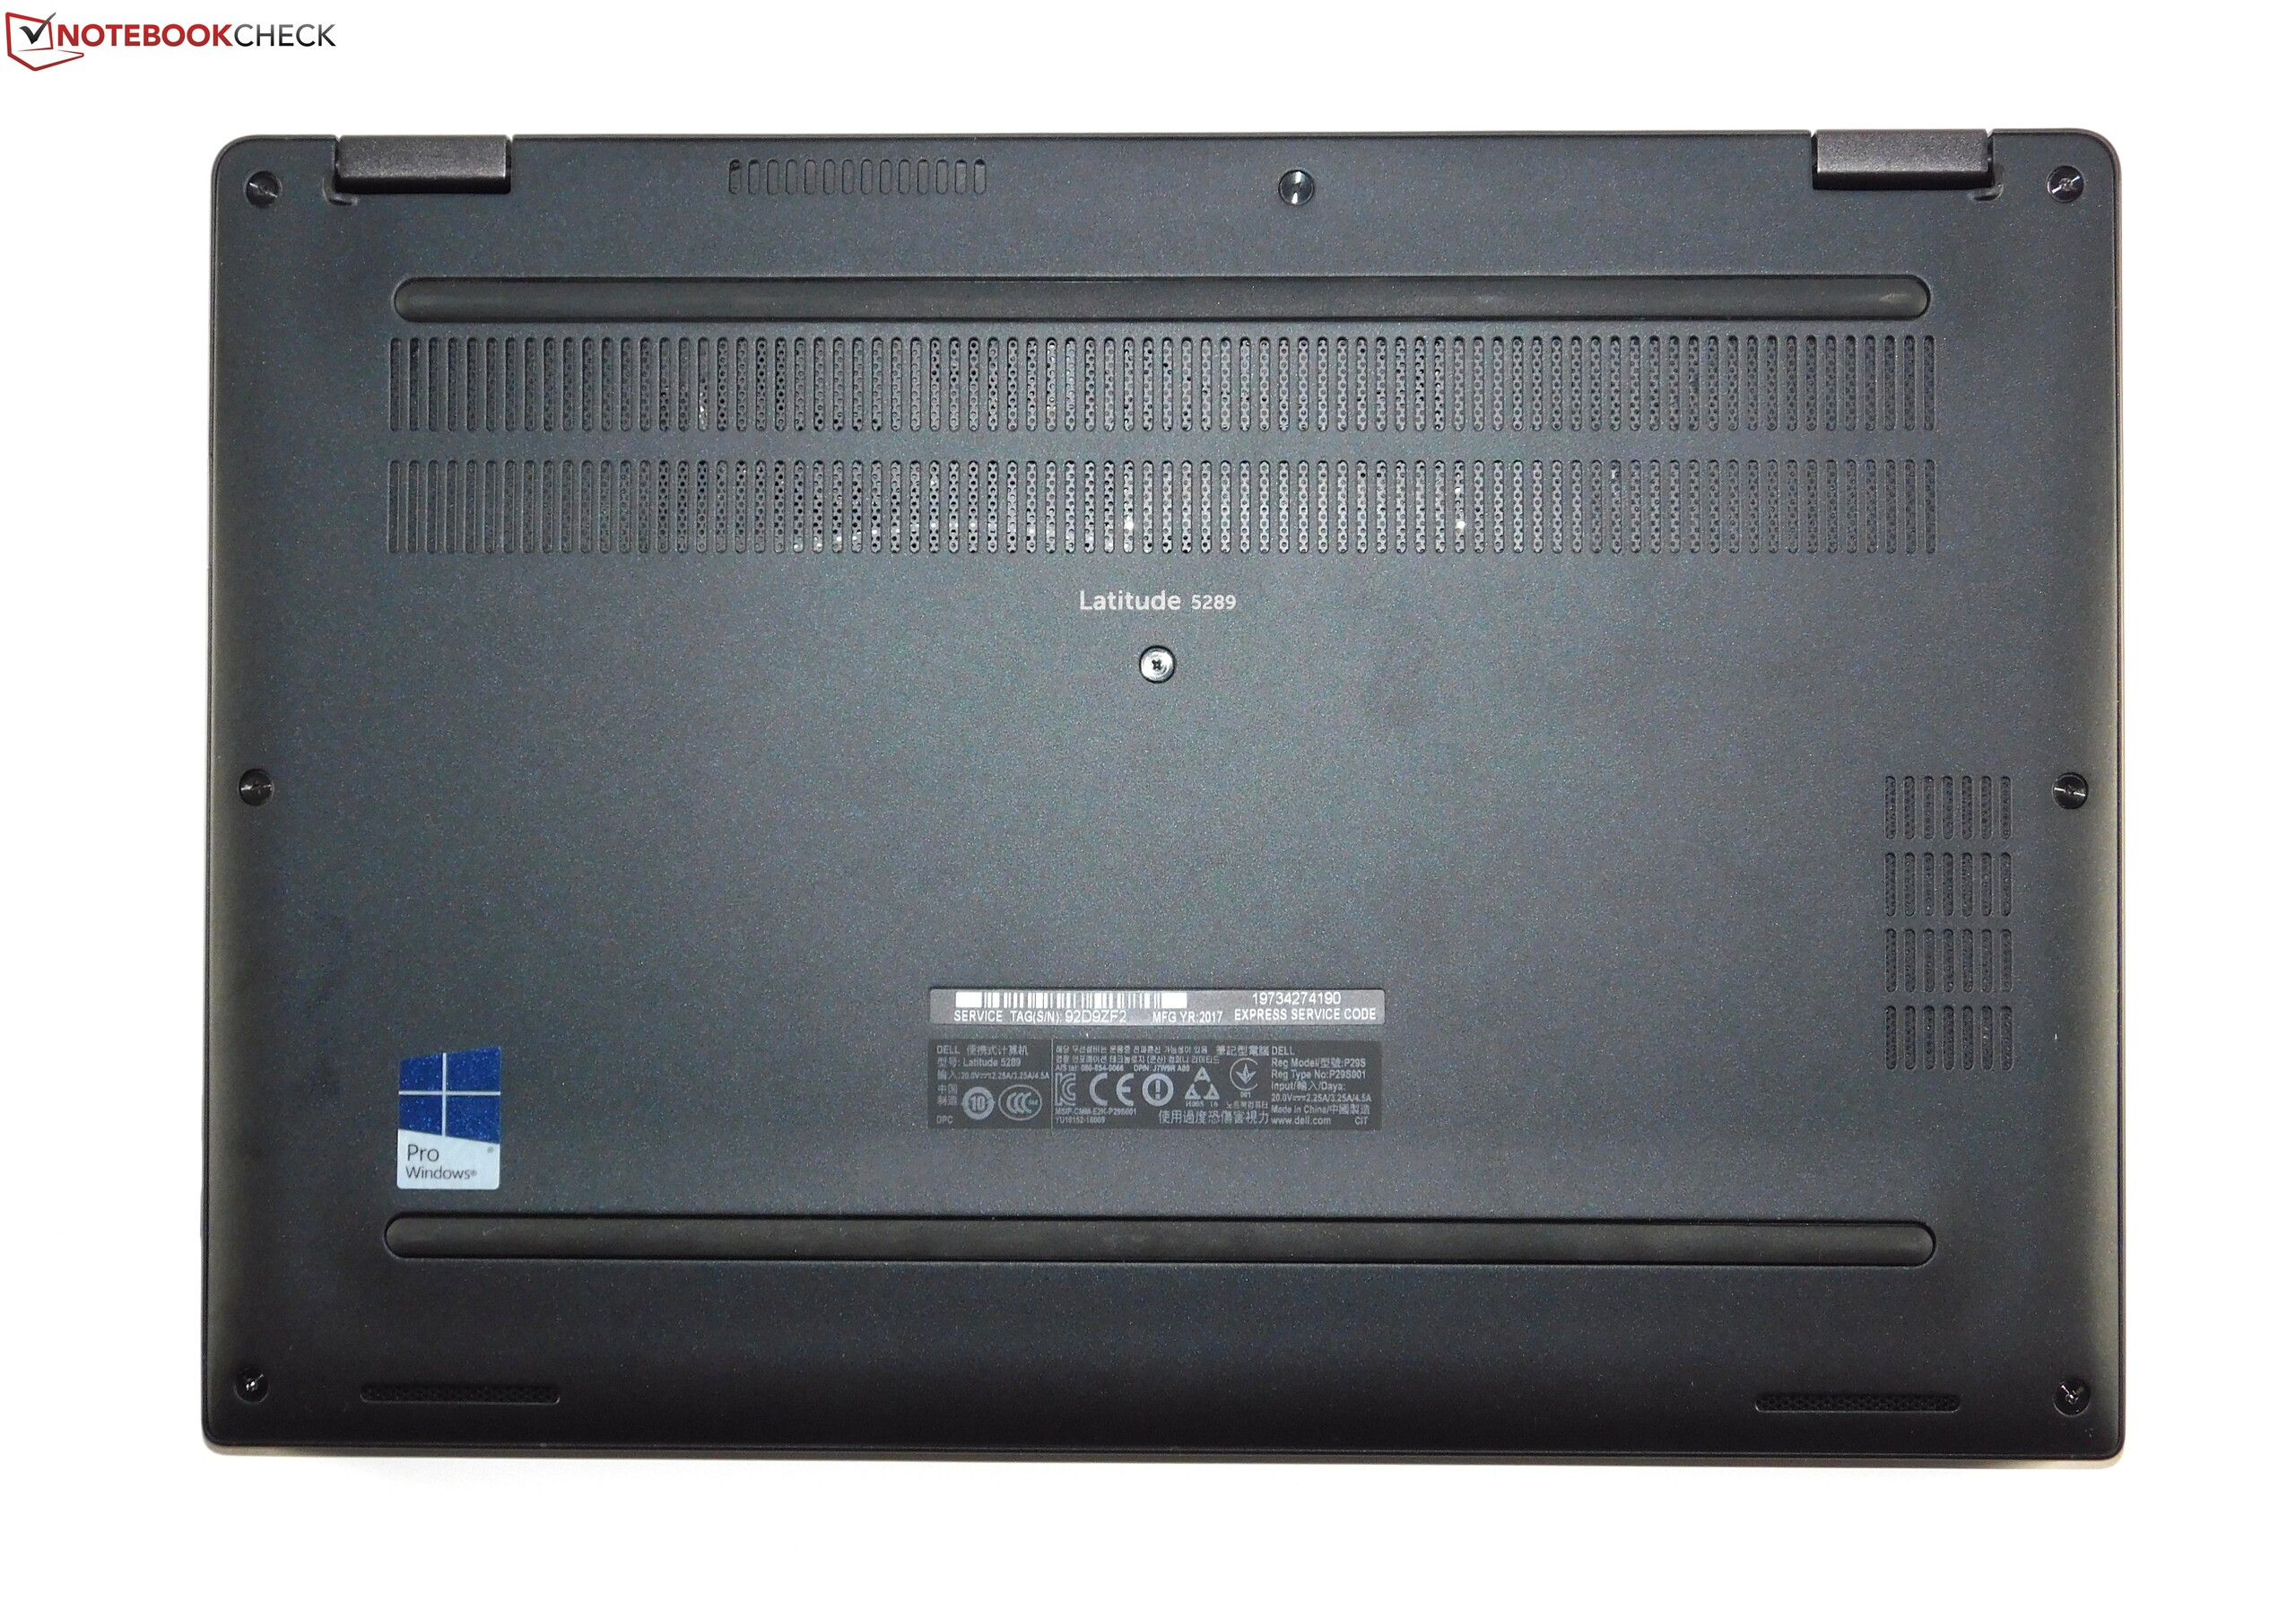
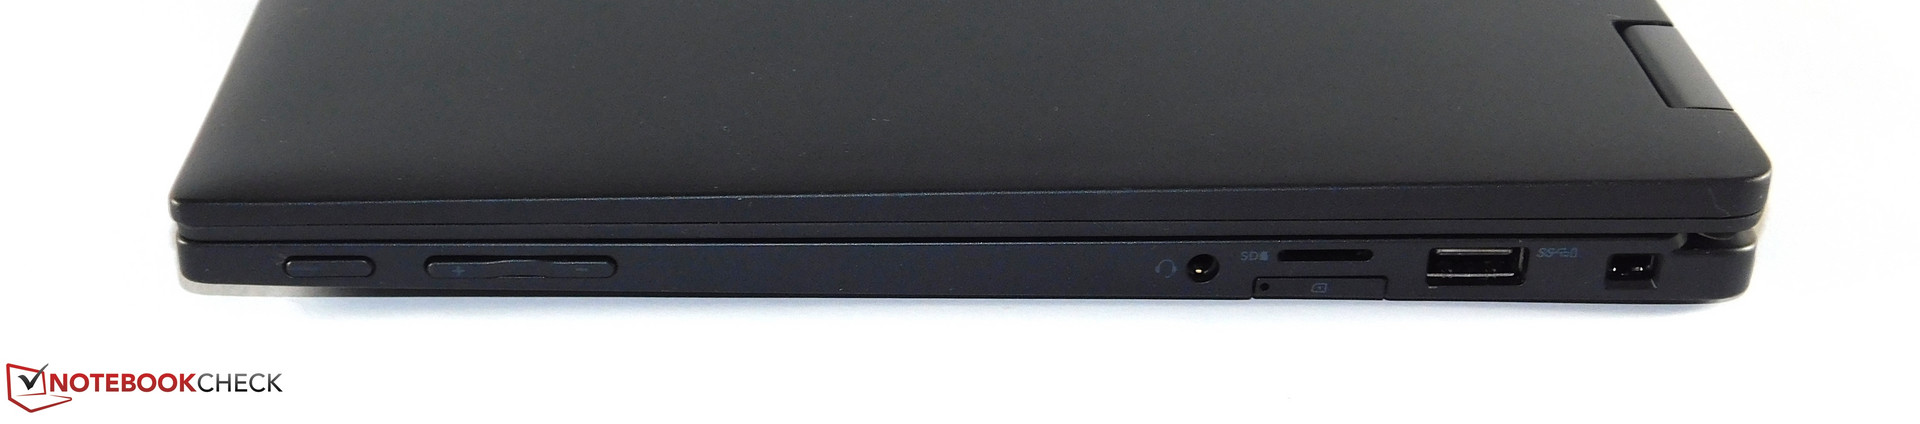
商务变形本的选择并不简单。总体来说,ThinkPad Yoga 370以及EliteBook X360是两台出色的竞品。而戴尔 Latitude 5289是一台有趣的竞品。这台测试样机最大的优势在于其电池续航时间。由于低功耗及超大容量电池,Latitude是这个方面最强的笔记本。坚固的外壳以及舒适键盘都值得考虑。得益于其搭载的ULC CPU,Latitude 5289的散热风扇能够很安静的运行。接口的选择符合它的商务定位。接下来我们会看看它的缺点。
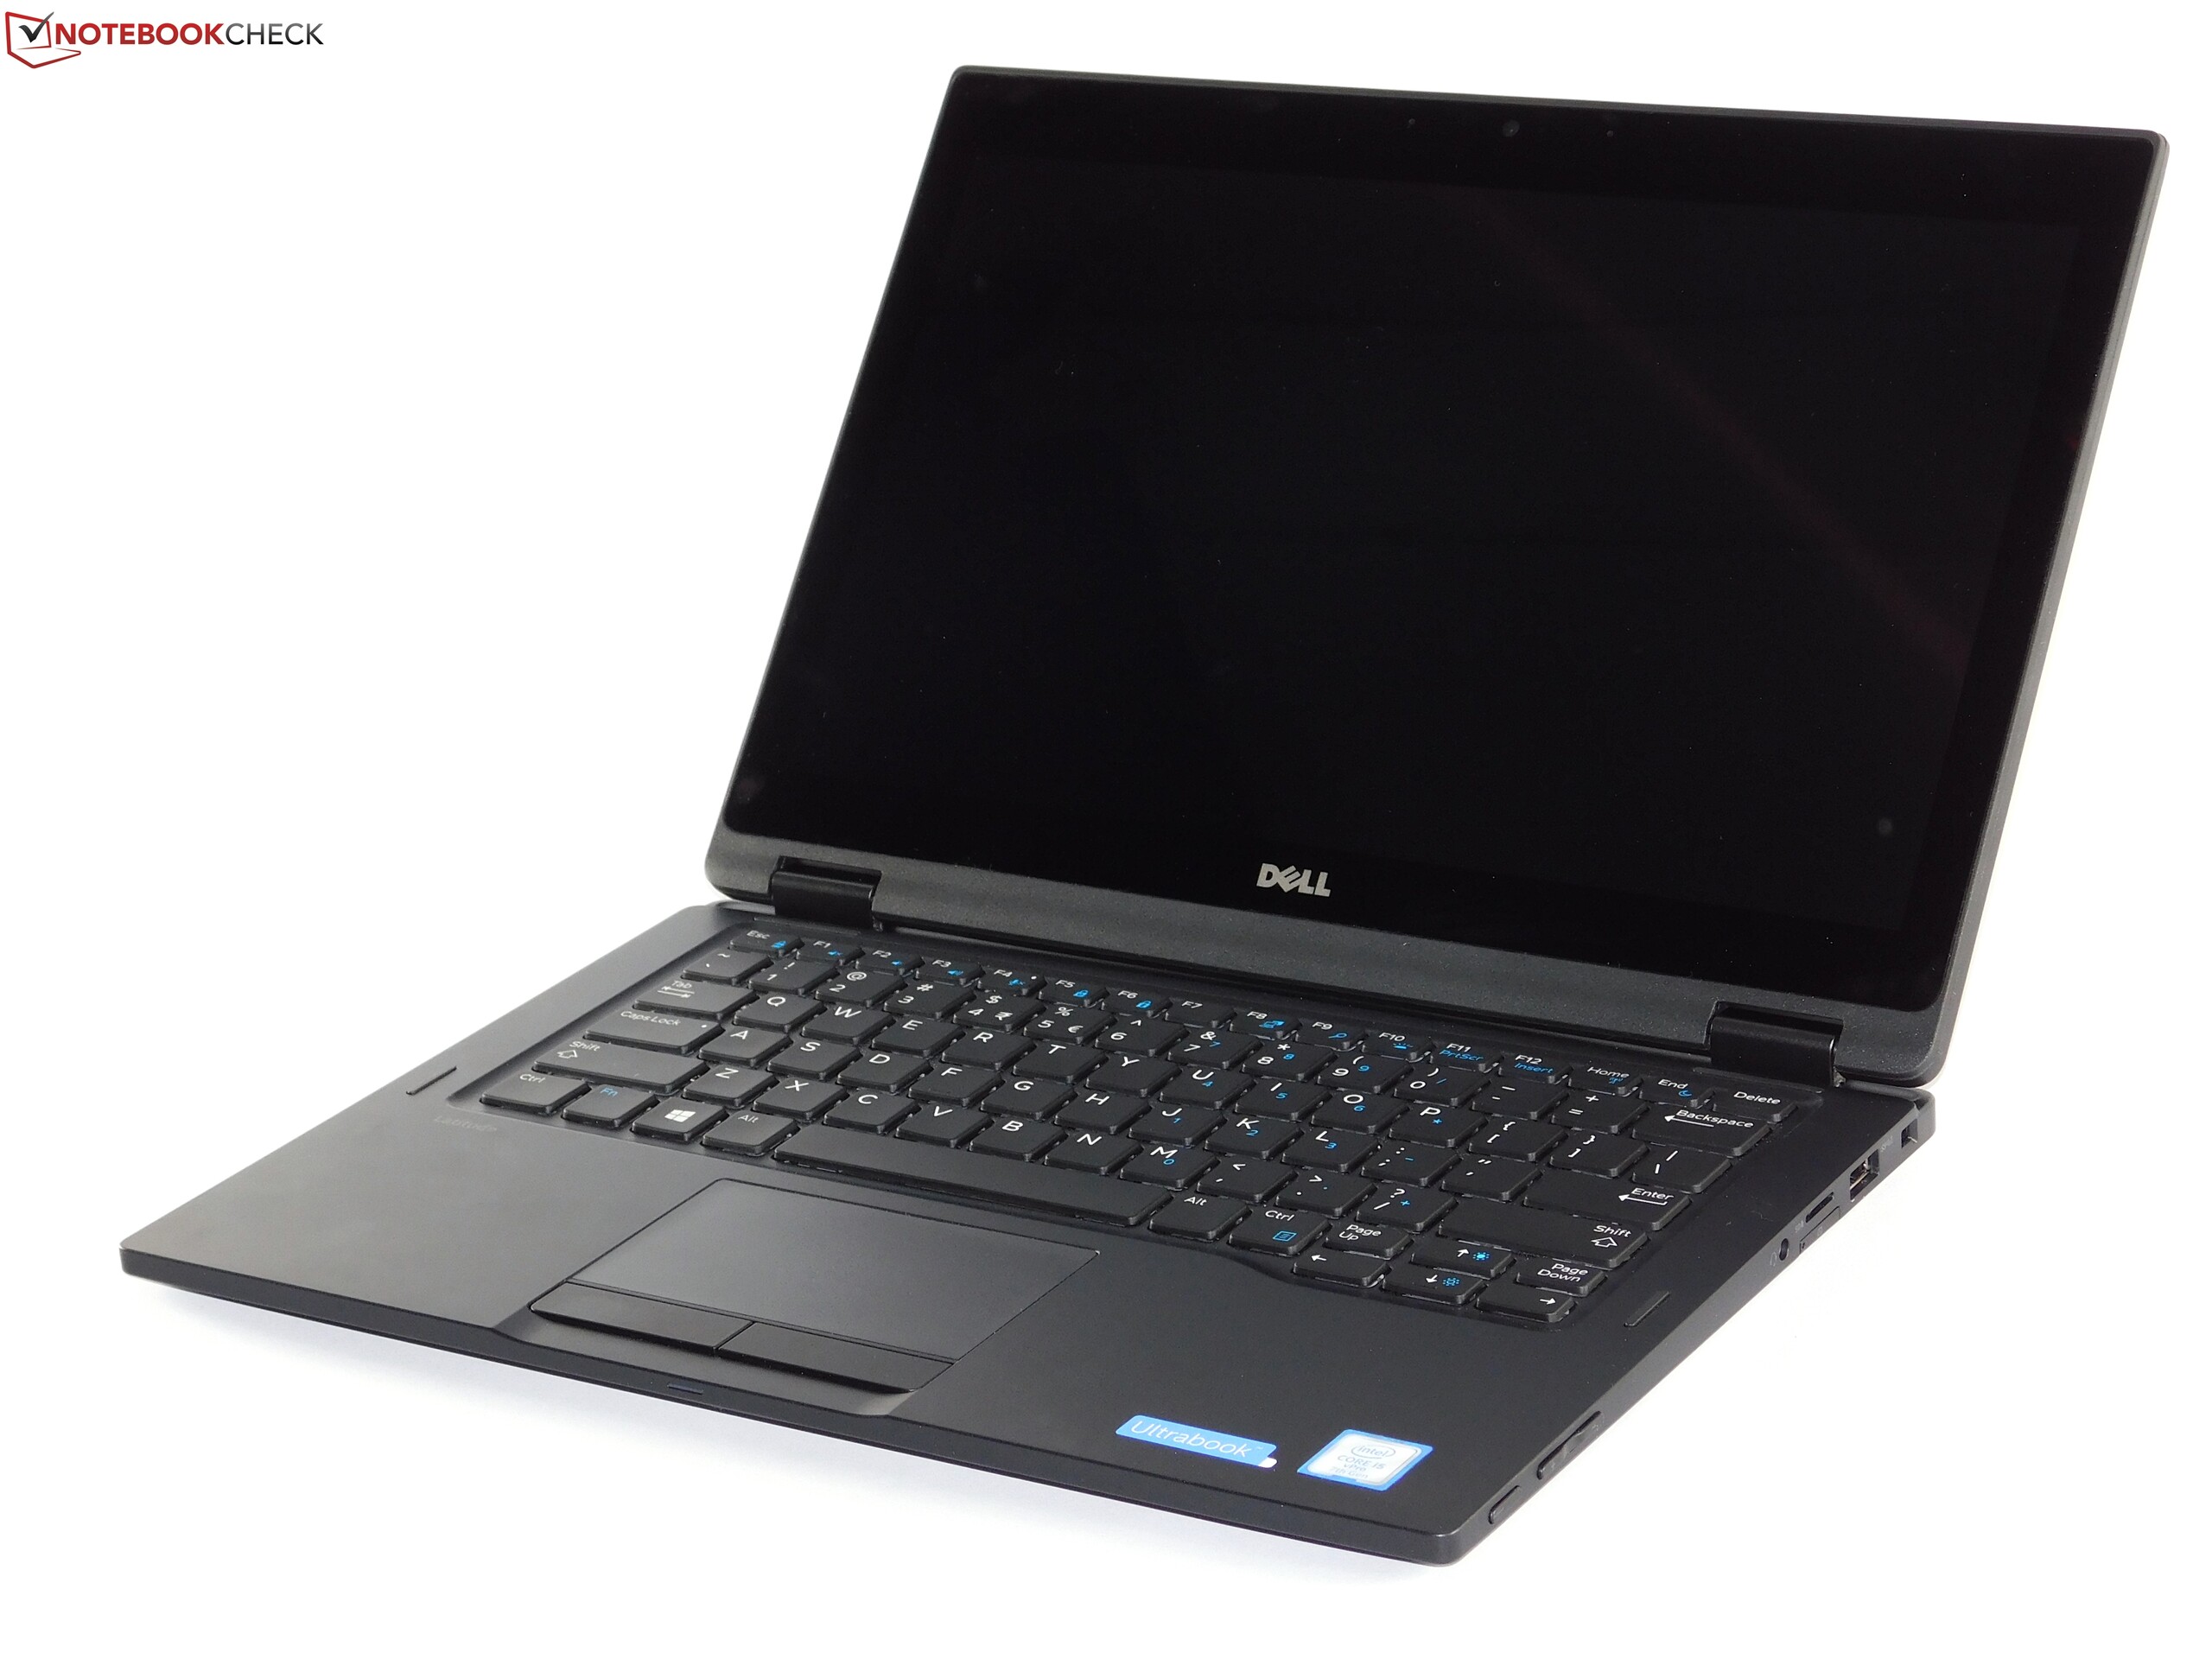
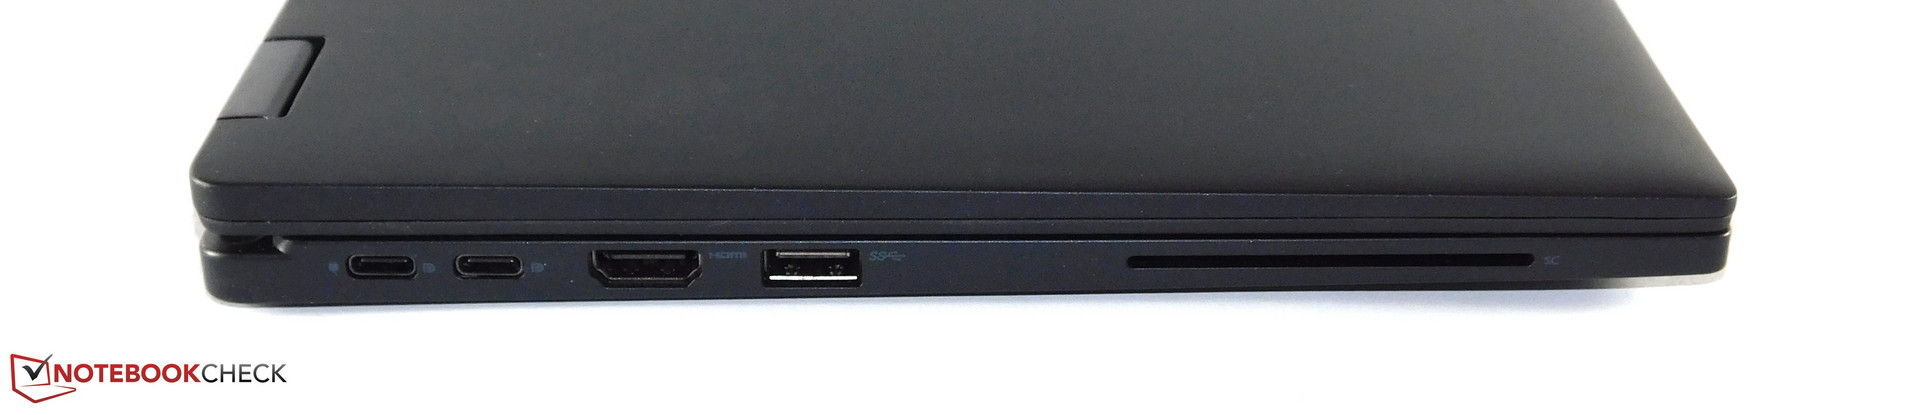
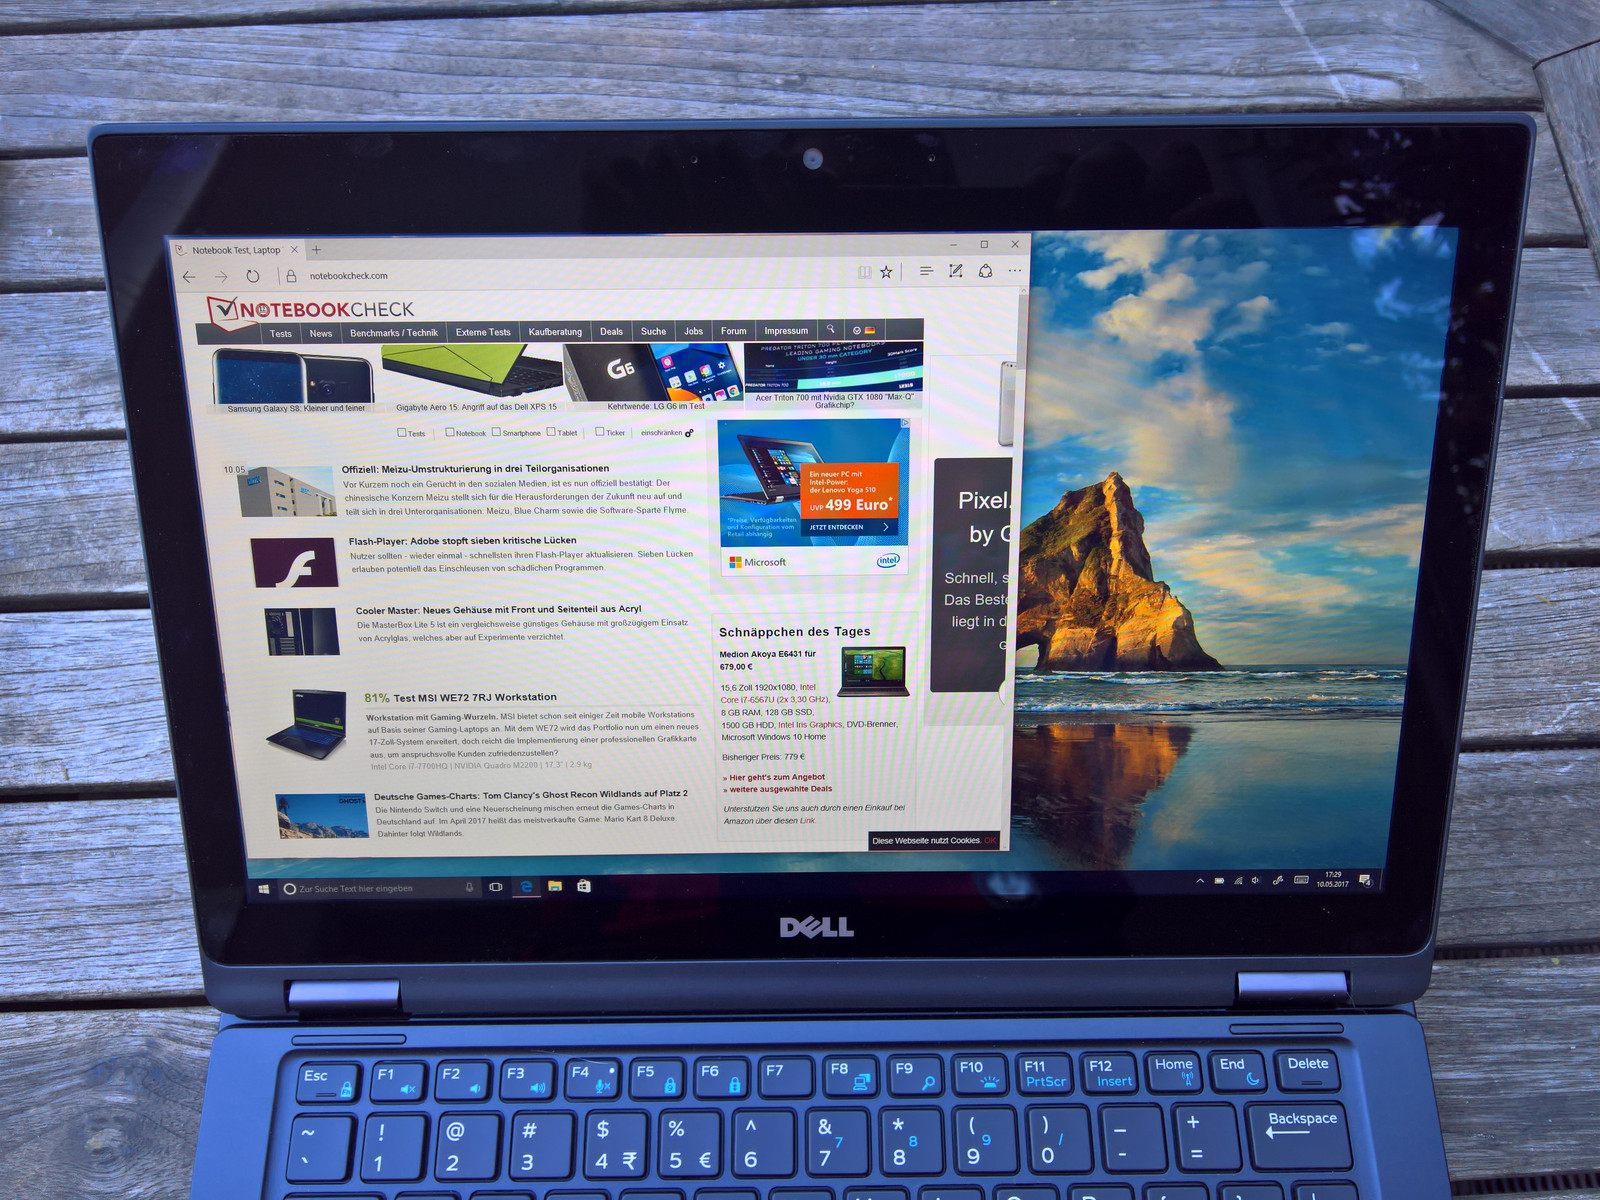
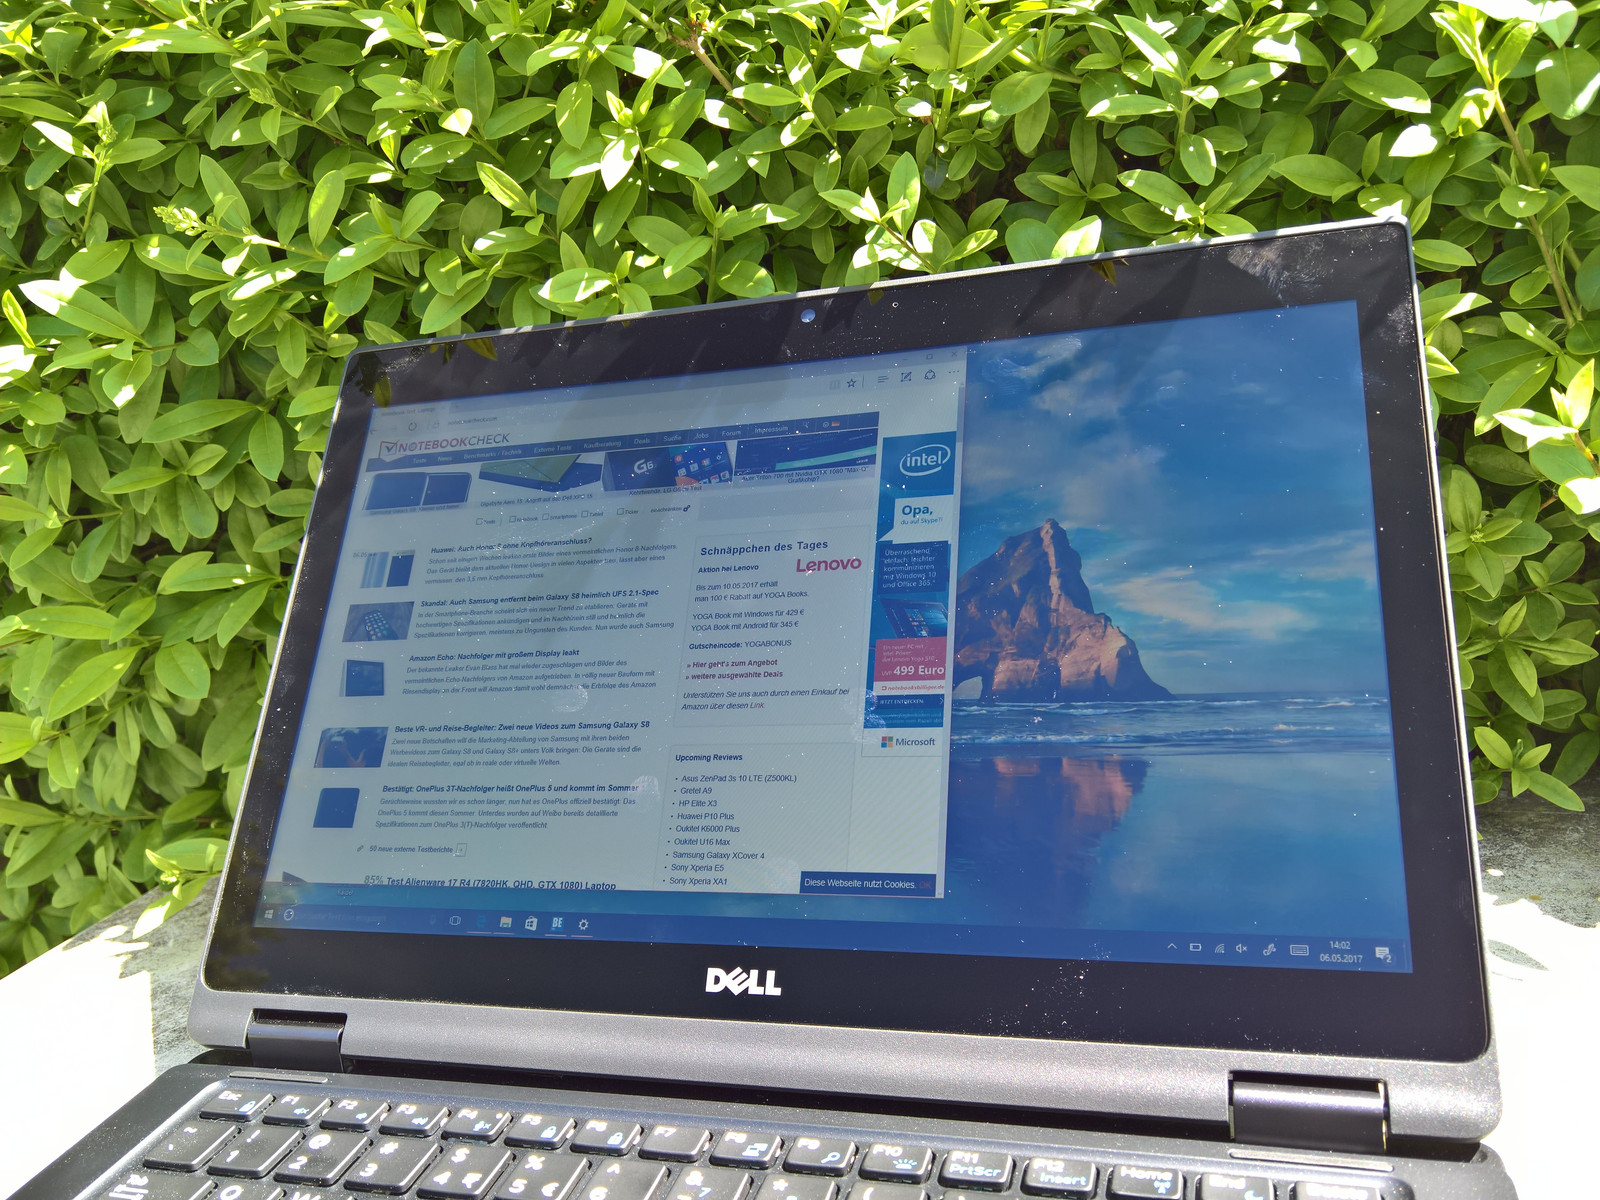
超过1000美元的设备显然应该带有其竞品都带有的Thunderbolt 3接口。散热风扇的确是不经常运行,但戴尔并没能成功去掉烦人的高频啸叫。键盘不错,但是触摸板并没有给我们留下很深的印象,特别是当和来自惠普和联想的竞品相比,戴尔所选择的触摸板并不出色。不像联想或惠普,戴尔依旧选择了12.5寸的屏幕尺寸。这可以成为一个有点亦或是缺点,更少的工作空间和更轻的重量。12.5寸屏幕的一个通病是色域覆盖不佳。再者,漏光现象十分严重。但最少它的亮度能够支持户外使用。
戴尔带来了一台不错的变形本,它超长的电池续航时间特别吸引人。但它依旧很难在这个竞争激烈的市场上生存下来,而且戴尔的确在设计上犯了一些错误。
Latitude 5289事实上是一台不错的变形本。如果你在寻找一台拥有最长续航时间的变形本,那么它将成为一台值得推荐的设备。但是,它的竞品。ThinkPad Yoga 370和EliteBook X360也有着它们的强项。Latitude的入门机型号的确更便宜,但也仅提供更糟糕的仅仅只有4GB板载内存的配置。总体上来说,Latitude将很难跟它的竞品竞争。如果它有一块更好的13.3寸屏幕和改进的触摸板,也许能够打败它的竞品。就算它有着极出色的电池续航时间,它依旧只能排到第三名,特别是当考虑到联想和惠普的竞品续航时间也不差的情况下。
注:本文是基于完整评测的缩减版本,阅读完整的英文评测,请点击这里。
Dell Latitude 5289
- 05/16/2017 v6 (old)
Benjamin Herzig