戴尔 Latitude 15 E5570 笔记本电脑简短评测
| SD Card Reader | |
| average JPG Copy Test (av. of 3 runs) | |
| Dell Latitude 15 E5570 | |
| Lenovo ThinkPad L560-20F10026GE | |
| HP EliteBook 850 G3 | |
| Toshiba Tecra A50-C-1G0 | |
| maximum AS SSD Seq Read Test (1GB) | |
| HP EliteBook 850 G3 | |
| Lenovo ThinkPad L560-20F10026GE | |
| Toshiba Tecra A50-C-1G0 | |
| |||||||||||||||||||||||||
Brightness Distribution: 90 %
Center on Battery: 228 cd/m²
Contrast: 407:1 (Black: 0.56 cd/m²)
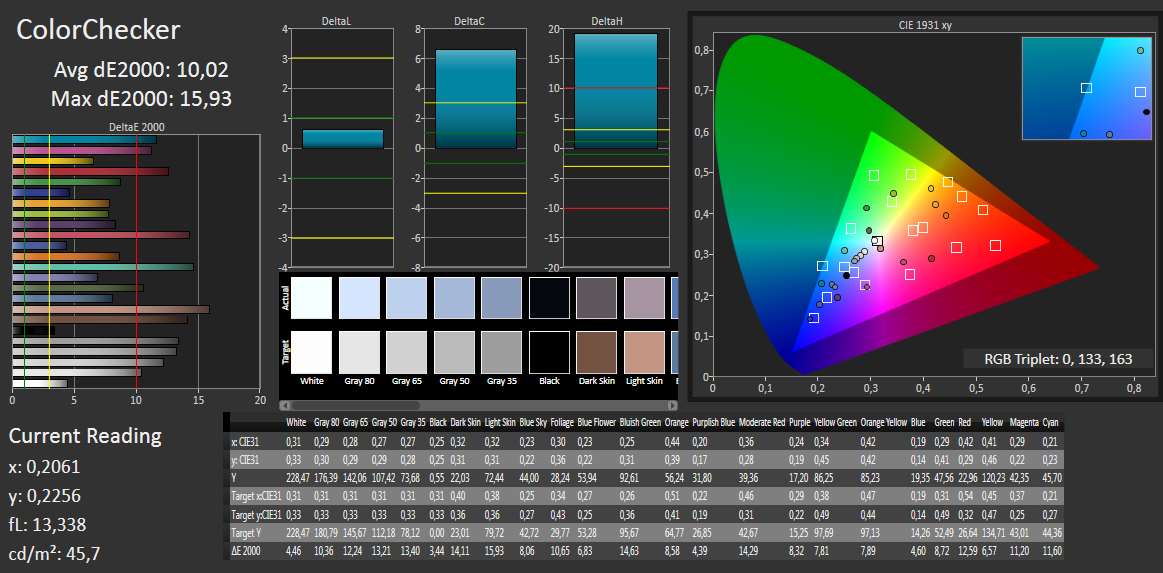
ΔE ColorChecker Calman: 10.02 | ∀{0.5-29.43 Ø4.71}
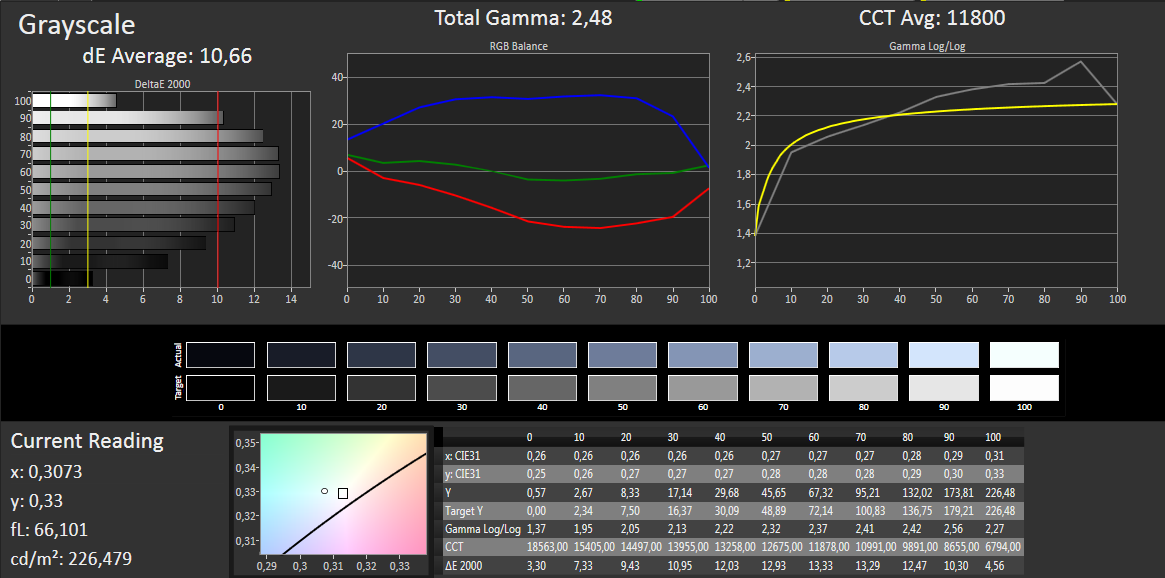
ΔE Greyscale Calman: 10.66 | ∀{0.09-98 Ø4.96}
61% sRGB (Argyll 1.6.3 3D)
39% AdobeRGB 1998 (Argyll 1.6.3 3D)
41.82% AdobeRGB 1998 (Argyll 3D)
60.9% sRGB (Argyll 3D)
40.48% Display P3 (Argyll 3D)
Gamma: 2.48
CCT: 11800 K
Screen Flickering / PWM (Pulse-Width Modulation)
| Screen flickering / PWM not detected | ||
In comparison: 52 % of all tested devices do not use PWM to dim the display. If PWM was detected, an average of 7754 (minimum: 5 - maximum: 343500) Hz was measured. | ||
Display Response Times
| ↔ Response Time Black to White | ||
|---|---|---|
| 27 ms ... rise ↗ and fall ↘ combined | ↗ 10 ms rise | 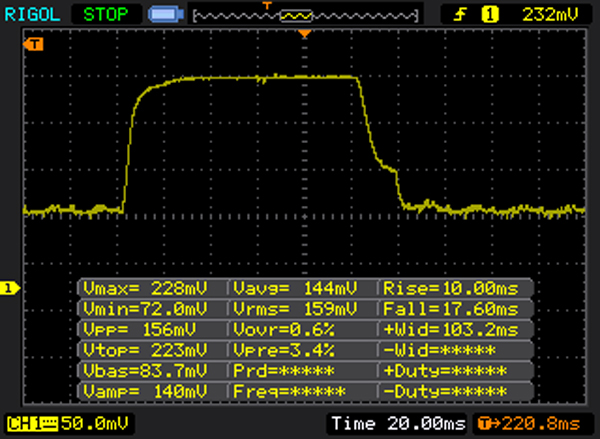 |
| ↘ 17 ms fall | ||
| The screen shows relatively slow response rates in our tests and may be too slow for gamers. In comparison, all tested devices range from 0.1 (minimum) to 240 (maximum) ms. » 67 % of all devices are better. This means that the measured response time is worse than the average of all tested devices (19.8 ms). | ||
| ↔ Response Time 50% Grey to 80% Grey | ||
| 47 ms ... rise ↗ and fall ↘ combined | ↗ 22 ms rise |  |
| ↘ 25 ms fall | ||
| The screen shows slow response rates in our tests and will be unsatisfactory for gamers. In comparison, all tested devices range from 0.165 (minimum) to 636 (maximum) ms. » 81 % of all devices are better. This means that the measured response time is worse than the average of all tested devices (31 ms). | ||
| Dell Latitude 15 E5570 TN LED, 1366x768 | Dell Latitude E5550 Broadwell IPS, 1920x1080 | HP EliteBook 850 G3 TN LED, 1920x1080 | Lenovo ThinkPad L560-20F10026GE AH-IPS, 1920x1080 | Toshiba Tecra A50-C-1G0 IPS, 1920x1080 | |
|---|---|---|---|---|---|
| Display | 60% | 33% | -4% | 49% | |
| Display P3 Coverage (%) | 40.48 | 65.6 62% | 54.2 34% | 39 -4% | 65.6 62% |
| sRGB Coverage (%) | 60.9 | 95.3 56% | 79.3 30% | 58.3 -4% | 84 38% |
| AdobeRGB 1998 Coverage (%) | 41.82 | 67.6 62% | 56 34% | 40.33 -4% | 61.5 47% |
| Response Times | 0% | 7% | 18% | ||
| Response Time Grey 50% / Grey 80% * (ms) | 47 ? | 46.4 ? 1% | 39.2 ? 17% | 27 ? 43% | |
| Response Time Black / White * (ms) | 27 ? | 27.2 ? -1% | 28 ? -4% | 29 ? -7% | |
| PWM Frequency (Hz) | 200 ? | 50 ? | |||
| Screen | 33% | 15% | 21% | 50% | |
| Brightness middle (cd/m²) | 228 | 312 37% | 290 27% | 262 15% | 345 51% |
| Brightness (cd/m²) | 236 | 295 25% | 287 22% | 250 6% | 318 35% |
| Brightness Distribution (%) | 90 | 77 -14% | 85 -6% | 92 2% | 81 -10% |
| Black Level * (cd/m²) | 0.56 | 0.53 5% | 0.54 4% | 0.29 48% | 0.35 38% |
| Contrast (:1) | 407 | 589 45% | 537 32% | 903 122% | 986 142% |
| Colorchecker dE 2000 * | 10.02 | 4.32 57% | 9.7 3% | 8.49 15% | 4.04 60% |
| Colorchecker dE 2000 max. * | 15.93 | 14.39 10% | 17.99 -13% | 10.35 35% | |
| Greyscale dE 2000 * | 10.66 | 5.34 50% | 10.83 -2% | 8.11 24% | 3.18 70% |
| Gamma | 2.48 89% | 2.71 81% | 2.91 76% | 2.37 93% | 2.45 90% |
| CCT | 11800 55% | 6998 93% | 12761 51% | 6300 103% | 6206 105% |
| Color Space (Percent of AdobeRGB 1998) (%) | 39 | 62 59% | 51.15 31% | 37.07 -5% | 55 41% |
| Color Space (Percent of sRGB) (%) | 61 | 78.96 29% | 57.94 -5% | 84 38% | |
| Total Average (Program / Settings) | 47% /
40% | 16% /
17% | 8% /
14% | 39% /
46% |
* ... smaller is better
| Cinebench R15 | |
| CPU Single 64Bit | |
| Dell Latitude E5570 N026LE557015EMEA | |
| HP EliteBook 850 G3 | |
| Dell Latitude 15 E5570 | |
| Dell Latitude E5550 Broadwell | |
| Lenovo ThinkPad L560-20F10026GE | |
| Toshiba Tecra A50-C-1G0 | |
| CPU Multi 64Bit | |
| Dell Latitude E5570 N026LE557015EMEA | |
| HP EliteBook 850 G3 | |
| Dell Latitude 15 E5570 | |
| Lenovo ThinkPad L560-20F10026GE | |
| Toshiba Tecra A50-C-1G0 | |
| Dell Latitude E5550 Broadwell | |
| Cinebench R11.5 | |
| CPU Multi 64Bit | |
| Dell Latitude E5570 N026LE557015EMEA | |
| HP EliteBook 850 G3 | |
| Dell Latitude 15 E5570 | |
| Lenovo ThinkPad L560-20F10026GE | |
| Dell Latitude E5550 Broadwell | |
| Toshiba Tecra A50-C-1G0 | |
| CPU Single 64Bit | |
| Dell Latitude E5570 N026LE557015EMEA | |
| HP EliteBook 850 G3 | |
| Dell Latitude 15 E5570 | |
| Dell Latitude E5550 Broadwell | |
| Lenovo ThinkPad L560-20F10026GE | |
| Toshiba Tecra A50-C-1G0 | |
| Cinebench R10 | |
| Rendering Multiple CPUs 32Bit | |
| Dell Latitude E5570 N026LE557015EMEA | |
| HP EliteBook 850 G3 | |
| Dell Latitude 15 E5570 | |
| Lenovo ThinkPad L560-20F10026GE | |
| Dell Latitude E5550 Broadwell | |
| Rendering Single 32Bit | |
| Dell Latitude E5570 N026LE557015EMEA | |
| HP EliteBook 850 G3 | |
| Dell Latitude 15 E5570 | |
| Dell Latitude E5550 Broadwell | |
| Lenovo ThinkPad L560-20F10026GE | |
| Geekbench 3 | |
| 32 Bit Single-Core Score | |
| HP EliteBook 850 G3 | |
| Dell Latitude 15 E5570 | |
| Dell Latitude E5550 Broadwell | |
| 32 Bit Multi-Core Score | |
| HP EliteBook 850 G3 | |
| Dell Latitude 15 E5570 | |
| Dell Latitude E5550 Broadwell | |
| JetStream 1.1 - 1.1 Total | |
| HP EliteBook 850 G3 | |
| Dell Latitude 15 E5570 | |
| Lenovo ThinkPad L560-20F10026GE | |
| Mozilla Kraken 1.1 - Total | |
| Lenovo ThinkPad L560-20F10026GE | |
| Dell Latitude E5550 Broadwell | |
| Dell Latitude 15 E5570 | |
| HP EliteBook 850 G3 | |
| Octane V2 - Total Score | |
| HP EliteBook 850 G3 | |
| Dell Latitude 15 E5570 | |
| Lenovo ThinkPad L560-20F10026GE | |
| Dell Latitude E5550 Broadwell | |
| Peacekeeper - --- | |
| HP EliteBook 850 G3 | |
| Dell Latitude 15 E5570 | |
| Dell Latitude E5550 Broadwell | |
* ... smaller is better
| PCMark 7 Score | 4566 points | |
| PCMark 8 Home Score Accelerated v2 | 3282 points | |
| PCMark 8 Creative Score Accelerated v2 | 3591 points | |
| PCMark 8 Work Score Accelerated v2 | 4301 points | |
Help | ||
| PCMark 8 - Home Score Accelerated v2 | |
| Dell Latitude 15 E5570 | |
| HP EliteBook 850 G3 | |
| Lenovo ThinkPad T460p | |
| Lenovo ThinkPad L560-20F10026GE | |
| Dell Latitude E5550 Broadwell | |
| PCMark 7 - Score | |
| HP EliteBook 850 G3 | |
| Dell Latitude E5550 Broadwell | |
| Dell Latitude 15 E5570 | |
| Toshiba Tecra A50-C-1G0 | |
| Lenovo ThinkPad T460p | |
| Lenovo ThinkPad L560-20F10026GE | |
| Dell Latitude 15 E5570 HD Graphics 520, 6300U, Samsung SSD PM871 MZ7LN128HCHP | Dell Latitude E5550 Broadwell HD Graphics 5500, 5300U, Samsung SSD PM851 128 GB MZ7TE128HMGR | HP EliteBook 850 G3 HD Graphics 520, 6500U, Sandisk X300 SD7SN6S-256G-1006 | Lenovo ThinkPad L560-20F10026GE HD Graphics 520, 6200U, WDC Slim WD10SPCX-21KHST0 | Dell Latitude E5570 N026LE557015EMEA Radeon R7 M370, 6440HQ, Samsung SSD 850 EVO 250GB | |
|---|---|---|---|---|---|
| CrystalDiskMark 3.0 | 7% | 38% | -81% | 56% | |
| Read Seq (MB/s) | 474.7 | 524 10% | 466.3 -2% | 113.6 -76% | 525 11% |
| Write Seq (MB/s) | 155 | 139.7 -10% | 426.1 175% | 111.7 -28% | 507 227% |
| Read 512 (MB/s) | 393.6 | 426.6 8% | 295.3 -25% | 39.65 -90% | 477.7 21% |
| Write 512 (MB/s) | 119.7 | 139.5 17% | 282.1 136% | 55.3 -54% | 375.6 214% |
| Read 4k (MB/s) | 34 | 28.32 -17% | 30.42 -11% | 0.488 -99% | 45.85 35% |
| Write 4k (MB/s) | 96.6 | 105.3 9% | 80.1 -17% | 1.022 -99% | 86.4 -11% |
| Read 4k QD32 (MB/s) | 383.3 | 376.7 -2% | 326.1 -15% | 1.367 -100% | 253.2 -34% |
| Write 4k QD32 (MB/s) | 100.2 | 139.7 39% | 162.1 62% | 1.036 -99% | 84.8 -15% |

| 3DMark 11 Performance | 1438 points | |
| 3DMark Ice Storm Standard Score | 51106 points | |
| 3DMark Cloud Gate Standard Score | 5456 points | |
| 3DMark Fire Strike Score | 720 points | |
Help | ||
| 3DMark 11 - 1280x720 Performance | |
| Dell Latitude E5570 N026LE557015EMEA | |
| HP EliteBook 850 G3 | |
| Dell Latitude 15 E5570 | |
| Lenovo ThinkPad L560-20F10026GE | |
| Toshiba Tecra A50-C-1G0 | |
| Dell Latitude E5550 Broadwell | |
| low | med. | high | ultra | |
|---|---|---|---|---|
| Tomb Raider (2013) | 67.1 | 35.3 | 21.5 | |
| BioShock Infinite (2013) | 44.1 | 24.3 | 20 | |
| Rise of the Tomb Raider (2016) | 14.5 | 9.4 |
Noise level
| Idle |
| 31.2 / 33.2 / 34.3 dB(A) |
| Load |
| 36.6 / 34.7 dB(A) |
 | ||
30 dB silent 40 dB(A) audible 50 dB(A) loud |
||
min: | ||
| Dell Latitude 15 E5570 6300U, HD Graphics 520 | Dell Latitude E5550 Broadwell 5300U, HD Graphics 5500 | HP EliteBook 850 G3 6500U, HD Graphics 520 | Lenovo ThinkPad L560-20F10026GE 6200U, HD Graphics 520 | Toshiba Tecra A50-C-1G0 5200U, HD Graphics 520 | Dell Latitude E5570 N026LE557015EMEA 6440HQ, Radeon R7 M370 | |
|---|---|---|---|---|---|---|
| Noise | -2% | 9% | 7% | 3% | -9% | |
| off / environment * (dB) | 31.2 | 29 7% | 29.4 6% | 31.3 -0% | ||
| Idle Minimum * (dB) | 31.2 | 29.6 5% | 29 7% | 30.1 4% | 32 -3% | 30.3 3% |
| Idle Average * (dB) | 33.2 | 29.6 11% | 29 13% | 30.1 9% | 32 4% | 30.3 9% |
| Idle Maximum * (dB) | 34.3 | 29.6 14% | 29 15% | 30.1 12% | 32 7% | 30.3 12% |
| Load Average * (dB) | 36.6 | 38.1 -4% | 32.6 11% | 33.4 9% | 33.8 8% | 47.8 -31% |
| Load Maximum * (dB) | 34.7 | 46.4 -34% | 34.6 -0% | 34.7 -0% | 33.8 3% | 48.5 -40% |
* ... smaller is better
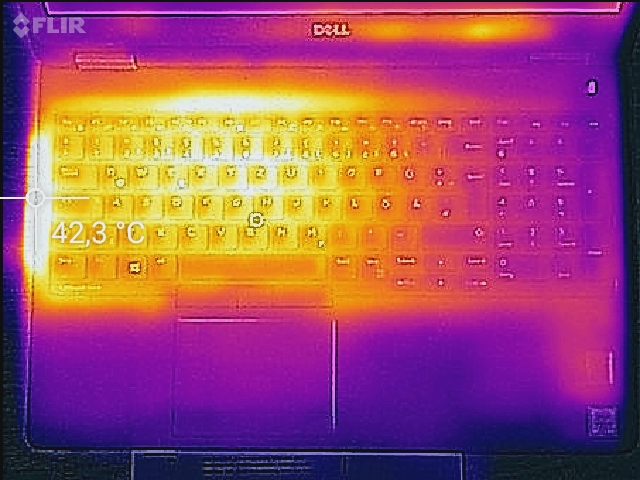
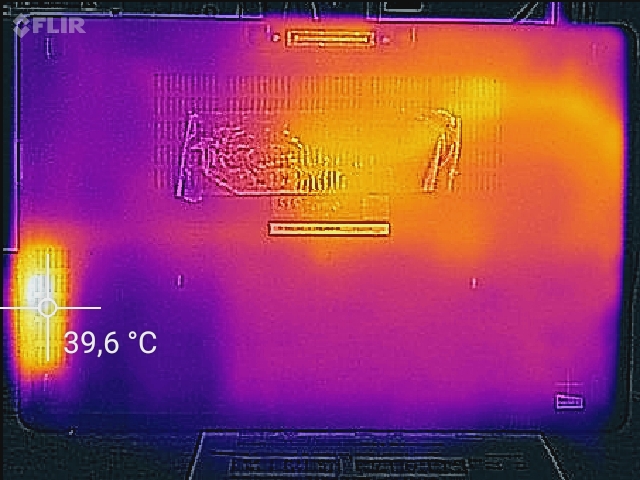
(+) The maximum temperature on the upper side is 37.3 °C / 99 F, compared to the average of 34.3 °C / 94 F, ranging from 21.2 to 62.5 °C for the class Office.
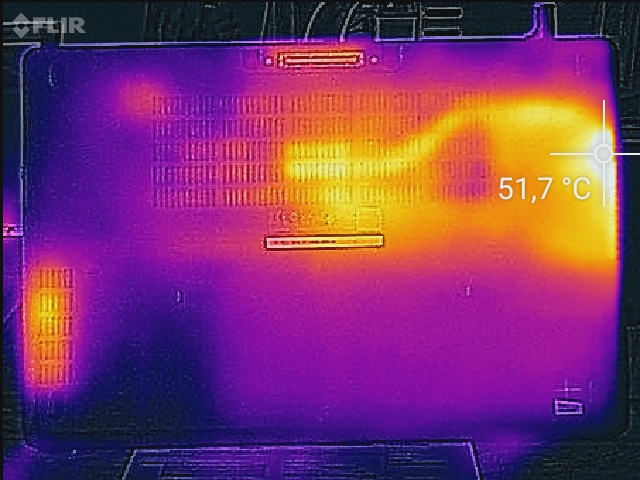
(±) The bottom heats up to a maximum of 41.5 °C / 107 F, compared to the average of 36.8 °C / 98 F
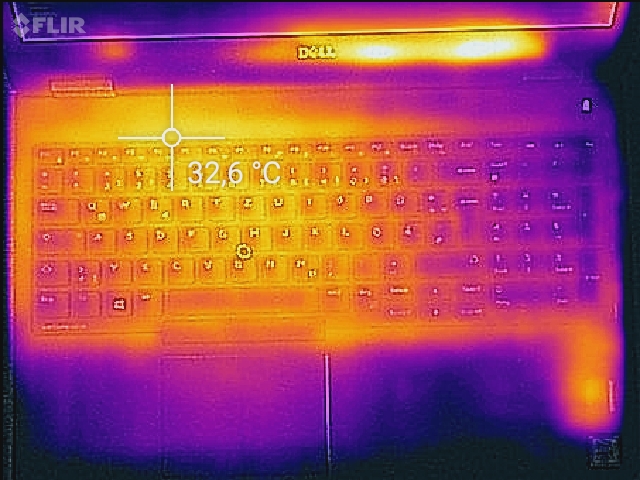
(+) In idle usage, the average temperature for the upper side is 29.3 °C / 85 F, compared to the device average of 29.5 °C / 85 F.
(+) The palmrests and touchpad are cooler than skin temperature with a maximum of 27.5 °C / 81.5 F and are therefore cool to the touch.
(±) The average temperature of the palmrest area of similar devices was 27.5 °C / 81.5 F (0 °C / 0 F).
| Dell Latitude 15 E5570 6300U, HD Graphics 520 | Dell Latitude E5550 Broadwell 5300U, HD Graphics 5500 | HP EliteBook 850 G3 6500U, HD Graphics 520 | Lenovo ThinkPad L560-20F10026GE 6200U, HD Graphics 520 | Toshiba Tecra A50-C-1G0 5200U, HD Graphics 520 | Dell Latitude E5570 N026LE557015EMEA 6440HQ, Radeon R7 M370 | |
|---|---|---|---|---|---|---|
| Heat | -3% | 13% | 10% | 8% | -11% | |
| Maximum Upper Side * (°C) | 37.3 | 42.3 -13% | 33.4 10% | 37.2 -0% | 37.4 -0% | 58.9 -58% |
| Maximum Bottom * (°C) | 41.5 | 48 -16% | 36.4 12% | 36 13% | 50.2 -21% | 57.4 -38% |
| Idle Upper Side * (°C) | 34.2 | 33.5 2% | 31.4 8% | 30.7 10% | 26.4 23% | 26.4 23% |
| Idle Bottom * (°C) | 38.8 | 33.1 15% | 30.2 22% | 32.8 15% | 27 30% | 27.8 28% |
* ... smaller is better
| Off / Standby | |
| Idle | |
| Load |
|
Key:
min: | |
| Dell Latitude 15 E5570 6300U, HD Graphics 520 | Dell Latitude E5550 Broadwell 5300U, HD Graphics 5500 | HP EliteBook 850 G3 6500U, HD Graphics 520 | Lenovo ThinkPad L560-20F10026GE 6200U, HD Graphics 520 | Toshiba Tecra A50-C-1G0 5200U, HD Graphics 520 | Dell Latitude E5570 N026LE557015EMEA 6440HQ, Radeon R7 M370 | |
|---|---|---|---|---|---|---|
| Power Consumption | -23% | -12% | -5% | -8% | -138% | |
| Idle Minimum * (Watt) | 4.5 | 4.7 -4% | 5 -11% | 5 -11% | 4.9 -9% | 4.6 -2% |
| Idle Average * (Watt) | 7.6 | 8 -5% | 7.8 -3% | 7.9 -4% | 8.7 -14% | 12.5 -64% |
| Idle Maximum * (Watt) | 8.7 | 10.3 -18% | 8.4 3% | 8.6 1% | 9 -3% | 17.7 -103% |
| Load Average * (Watt) | 28.5 | 40.3 -41% | 28.8 -1% | 27.5 4% | 30.4 -7% | 99.3 -248% |
| Load Maximum * (Watt) | 29.2 | 43.5 -49% | 43 -47% | 33.7 -15% | 31 -6% | 108.7 -272% |
* ... smaller is better
| Dell Latitude 15 E5570 62 Wh | Dell Latitude E5550 Broadwell 51 Wh | HP EliteBook 850 G3 46 Wh | Lenovo ThinkPad L560-20F10026GE 48 Wh | Toshiba Tecra A50-C-1G0 45 Wh | Dell Latitude E5570 N026LE557015EMEA 62 Wh | |
|---|---|---|---|---|---|---|
| Battery runtime | -43% | -22% | -40% | -67% | -35% | |
| Reader / Idle (h) | 20.5 | 12 -41% | 15.3 -25% | 11.6 -43% | 13.3 -35% | |
| H.264 (h) | 9.5 | 6.5 -32% | 7.2 -24% | 4.6 -52% | ||
| WiFi v1.3 (h) | 10.5 | 7 -33% | 6.8 -35% | 3.5 -67% | ||
| Load (h) | 2.5 | 1.1 -56% | 2.4 -4% | 1.8 -28% | ||
| WiFi (h) | 6.4 | 5 |
Pros
Cons
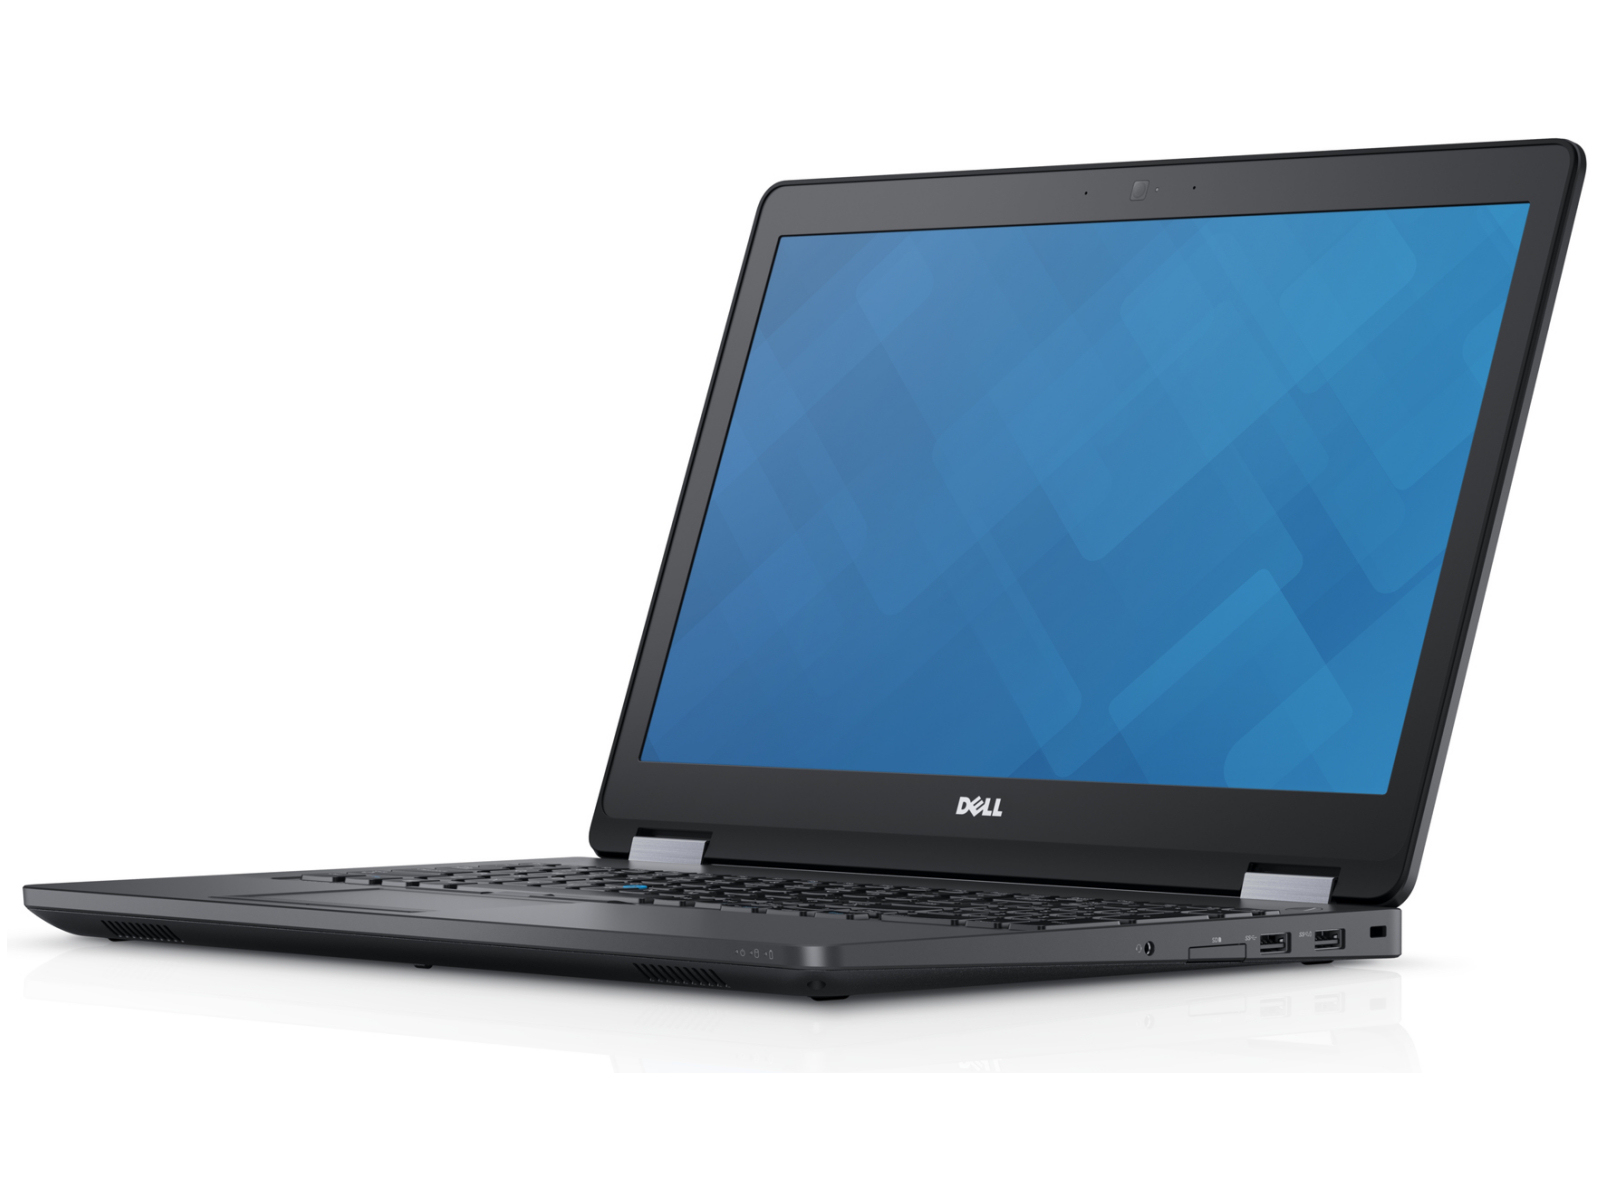
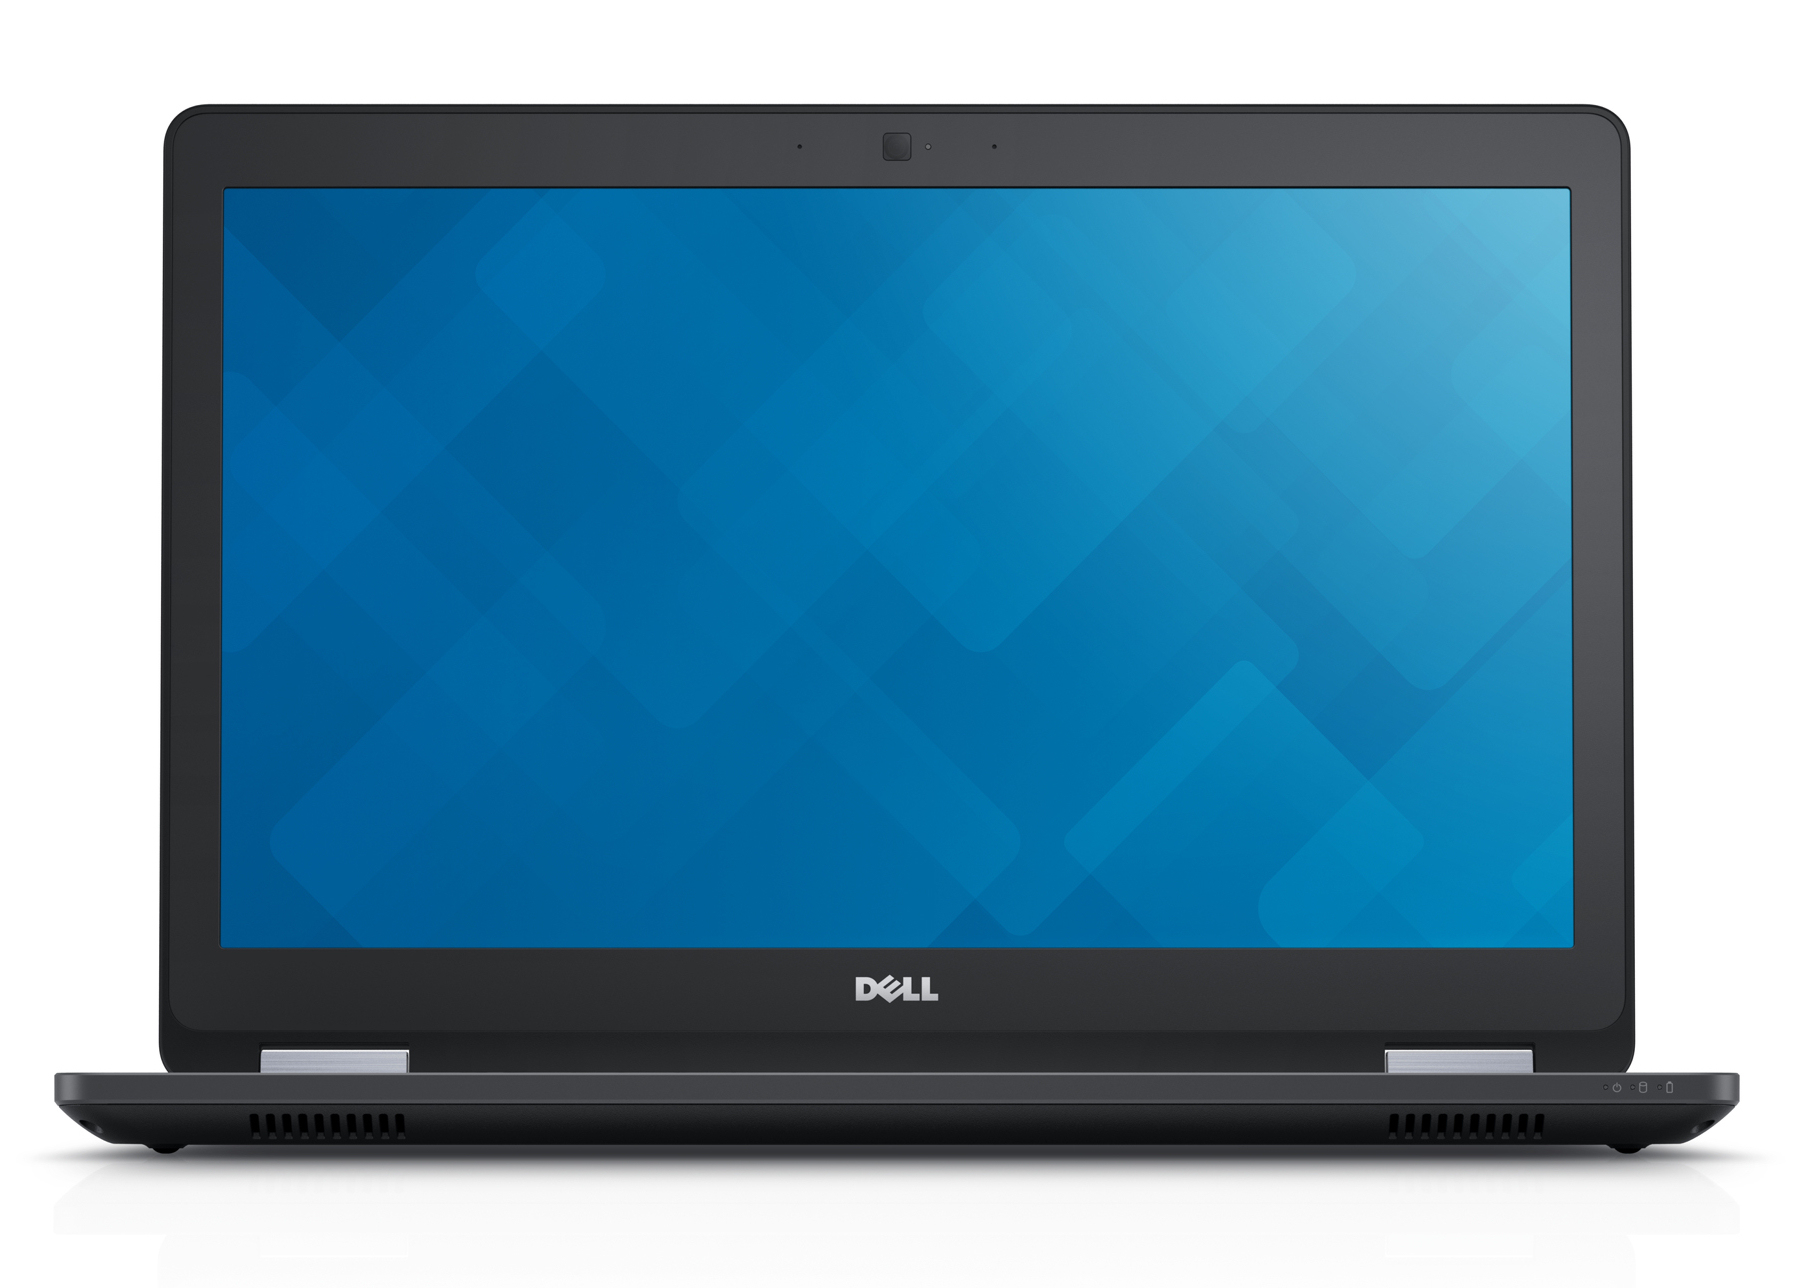
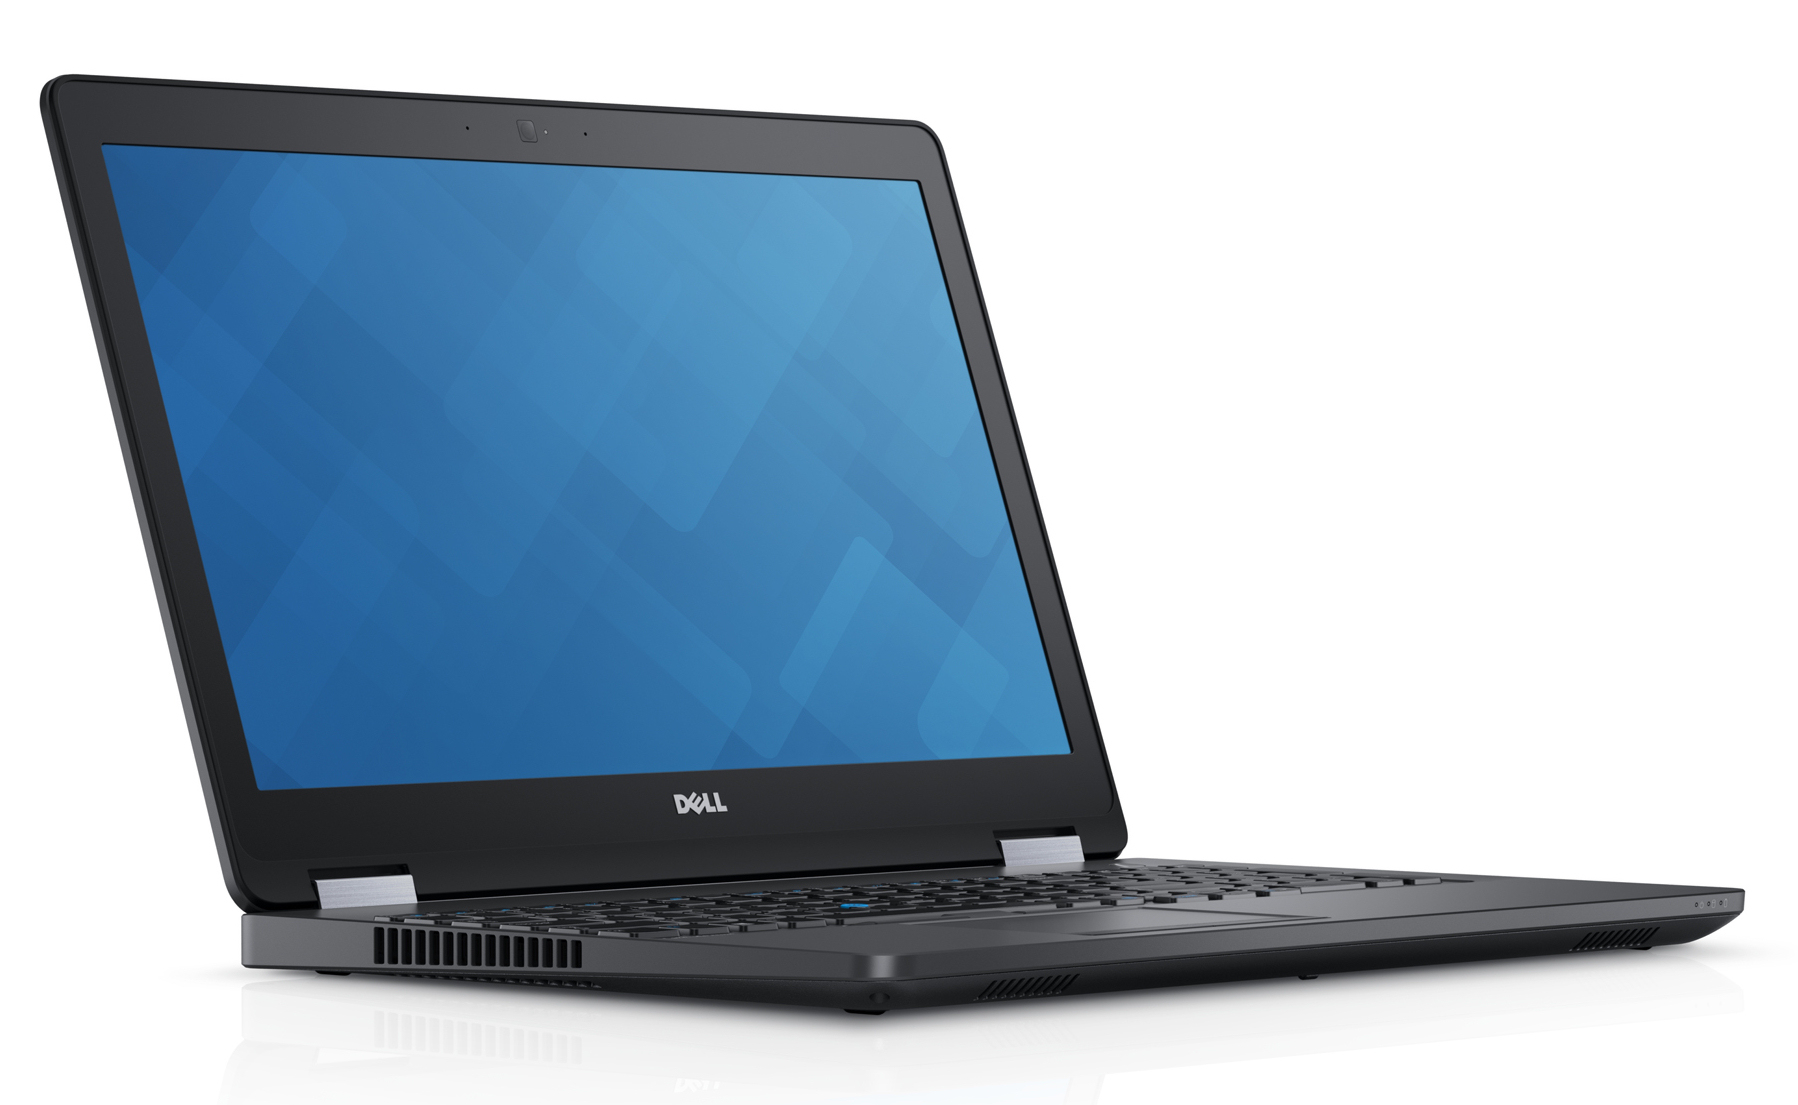
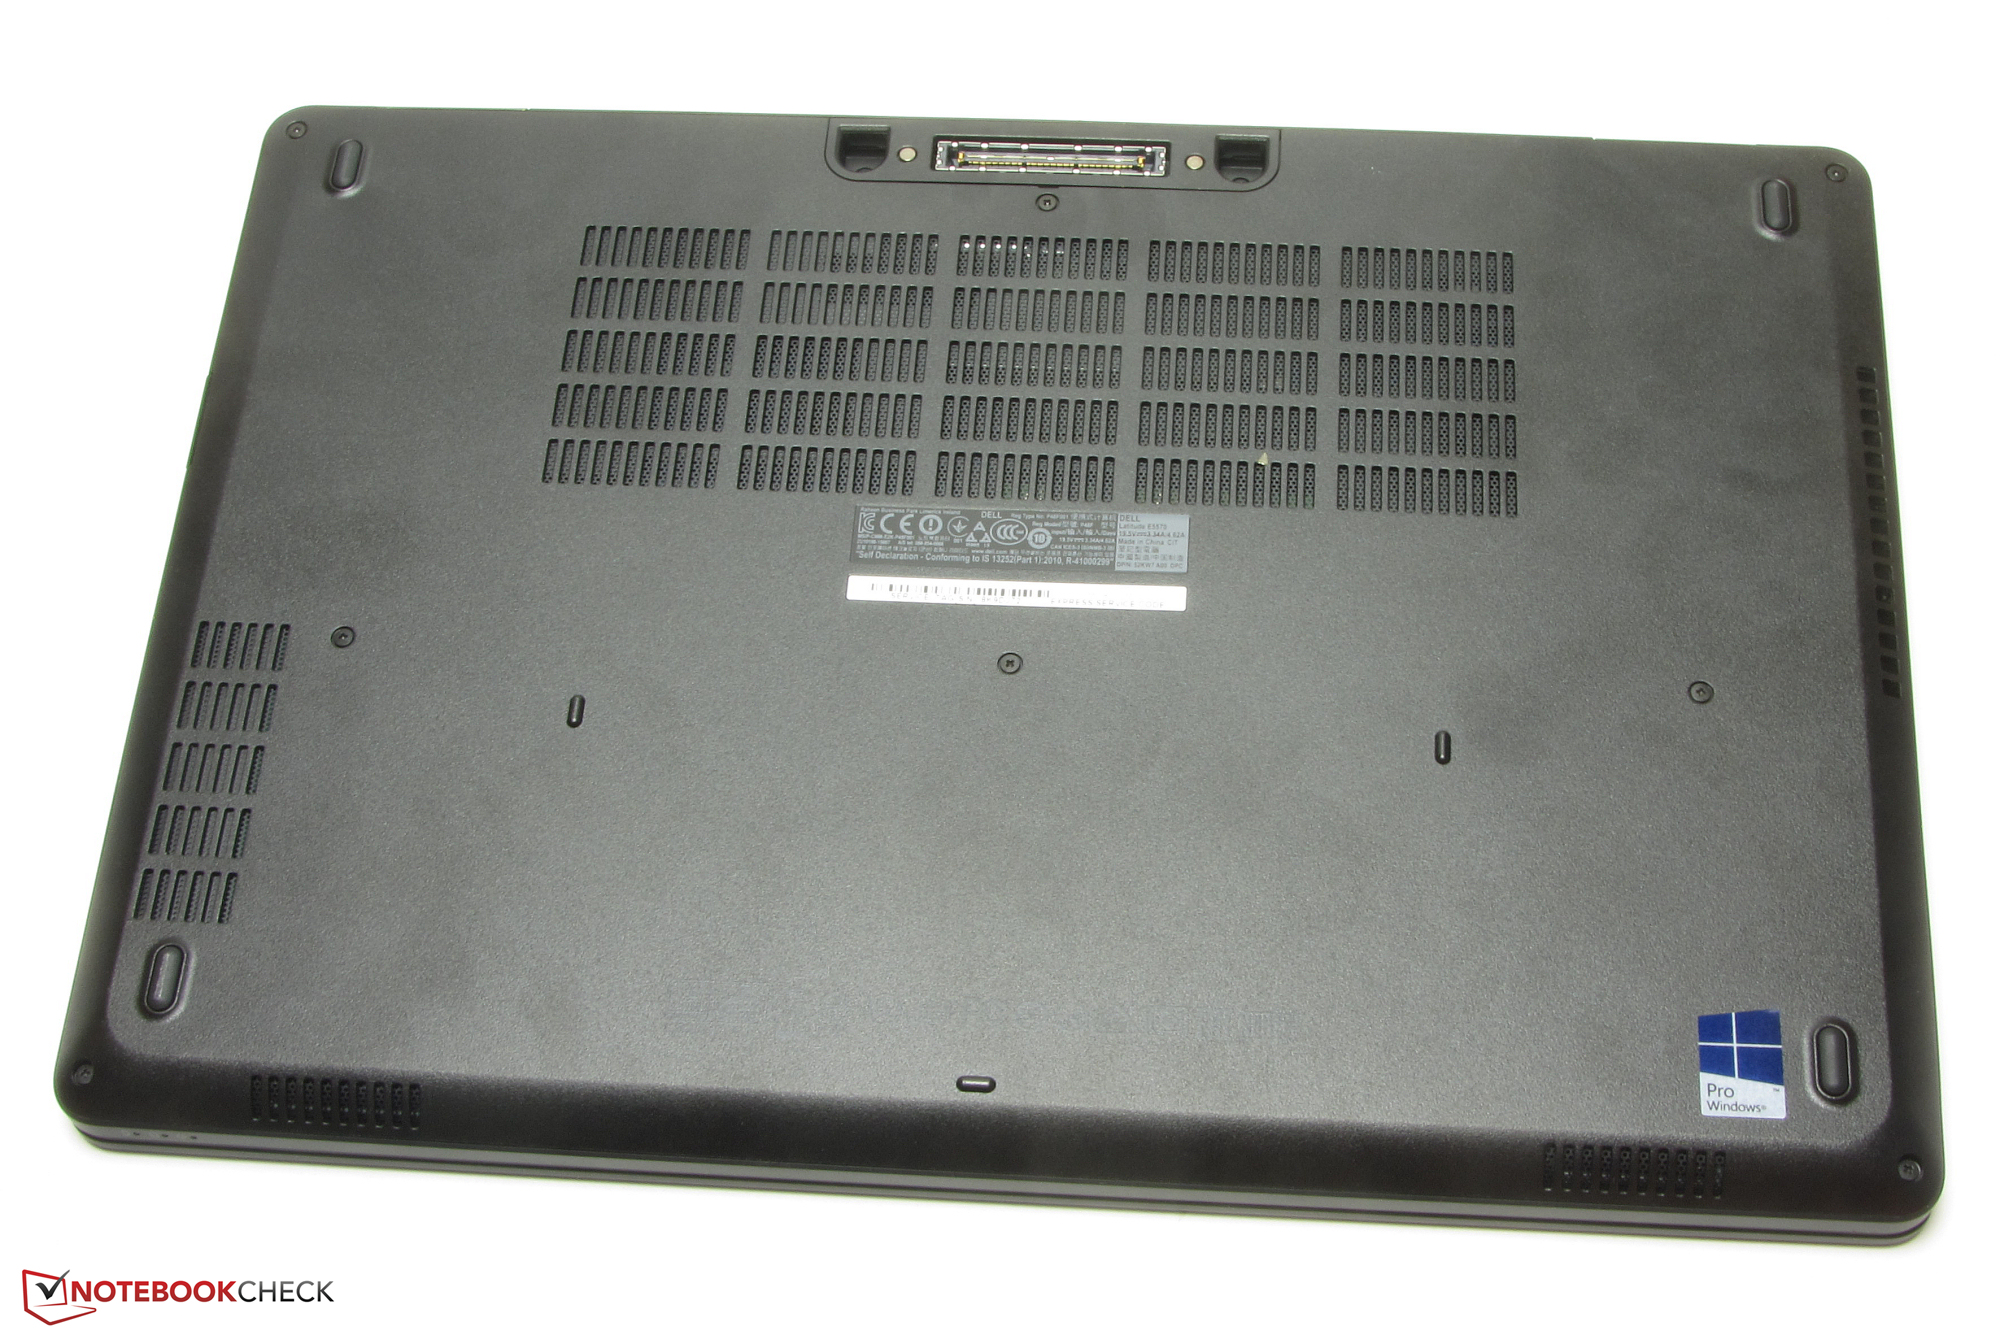
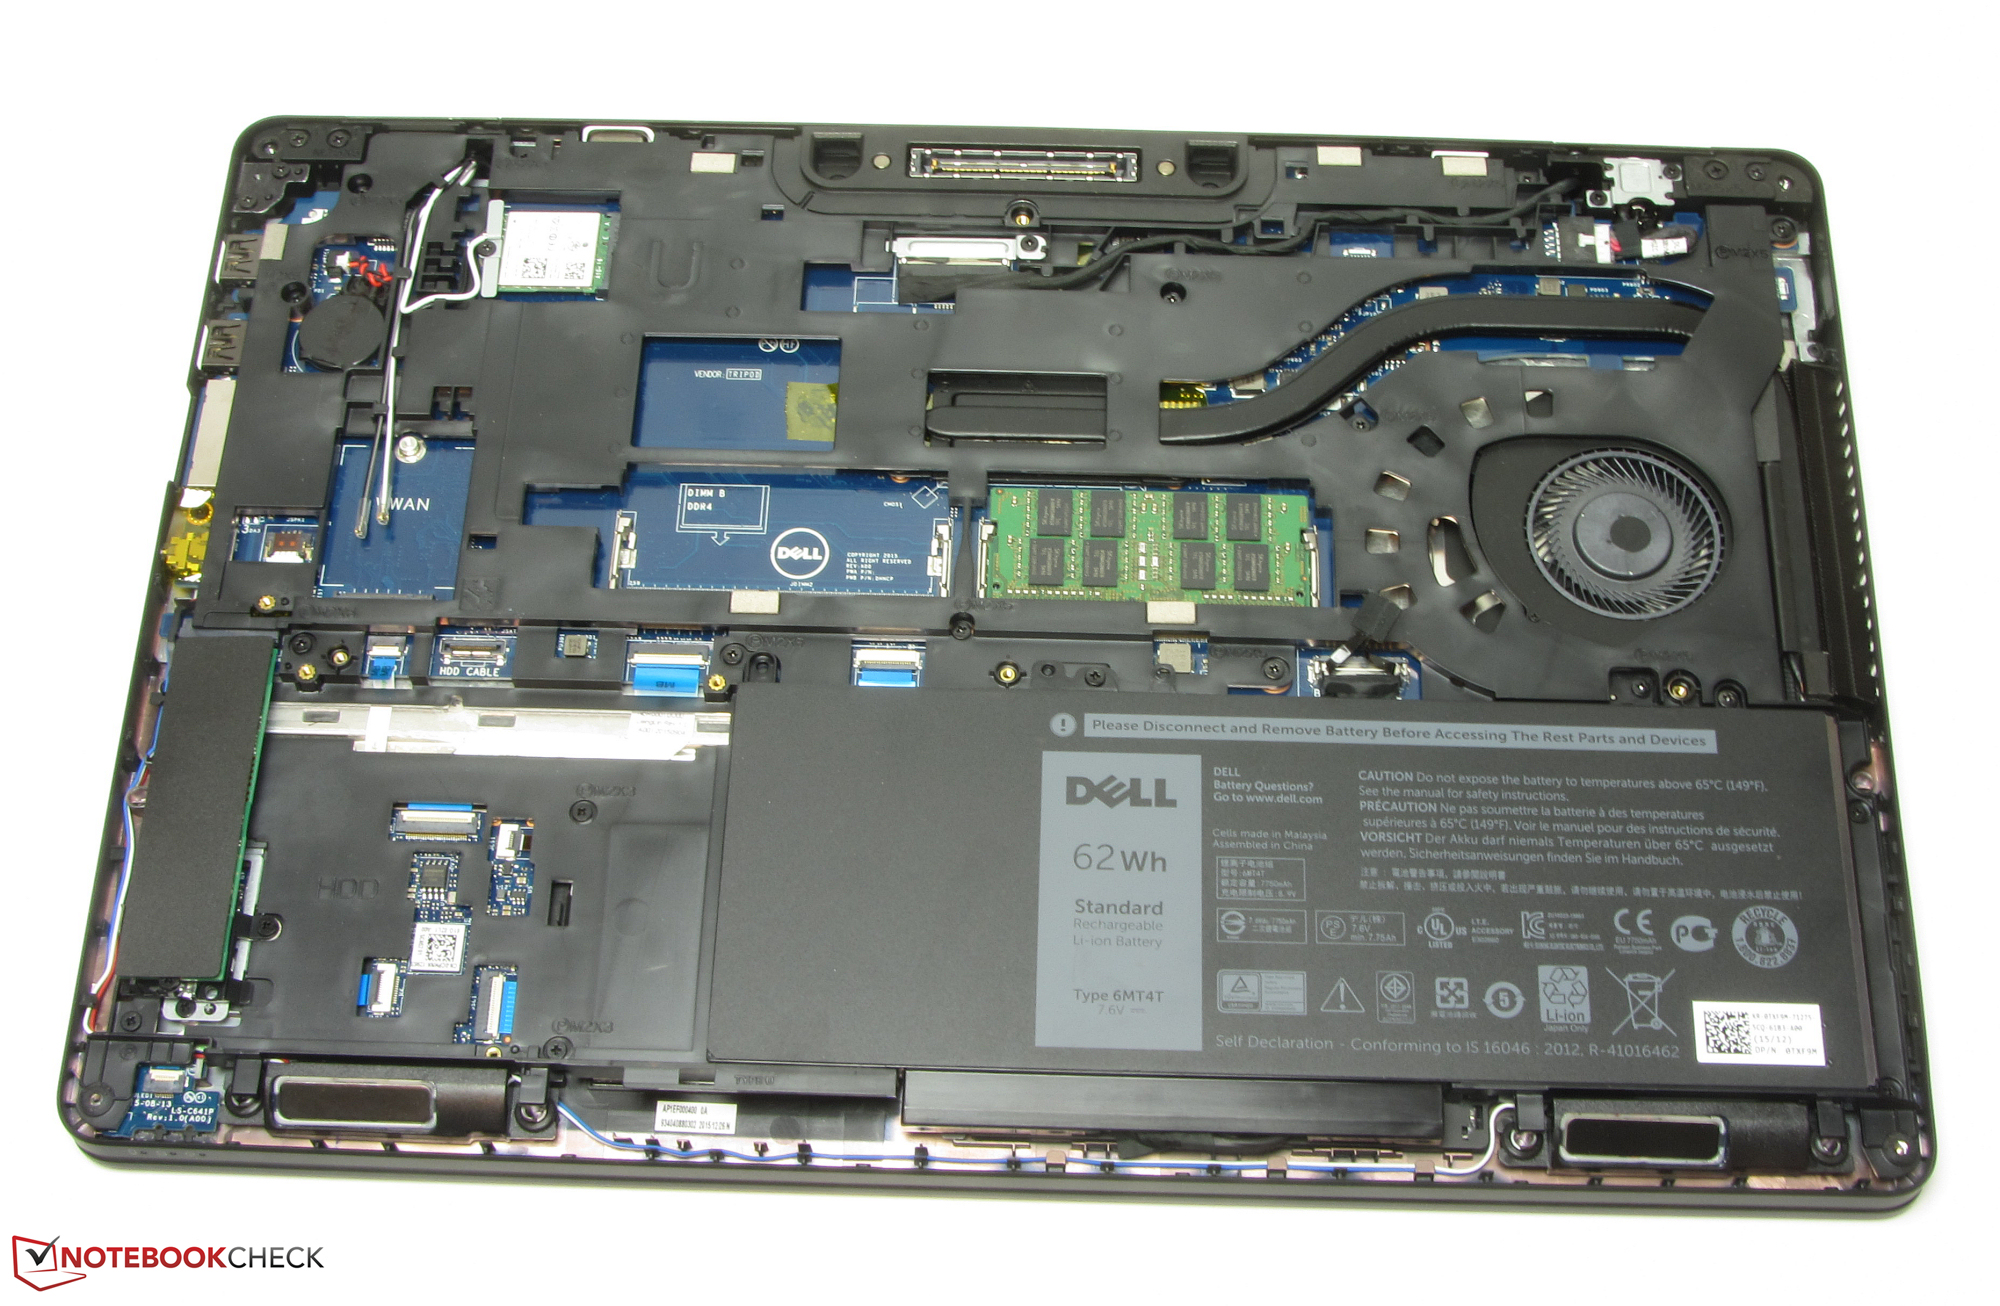
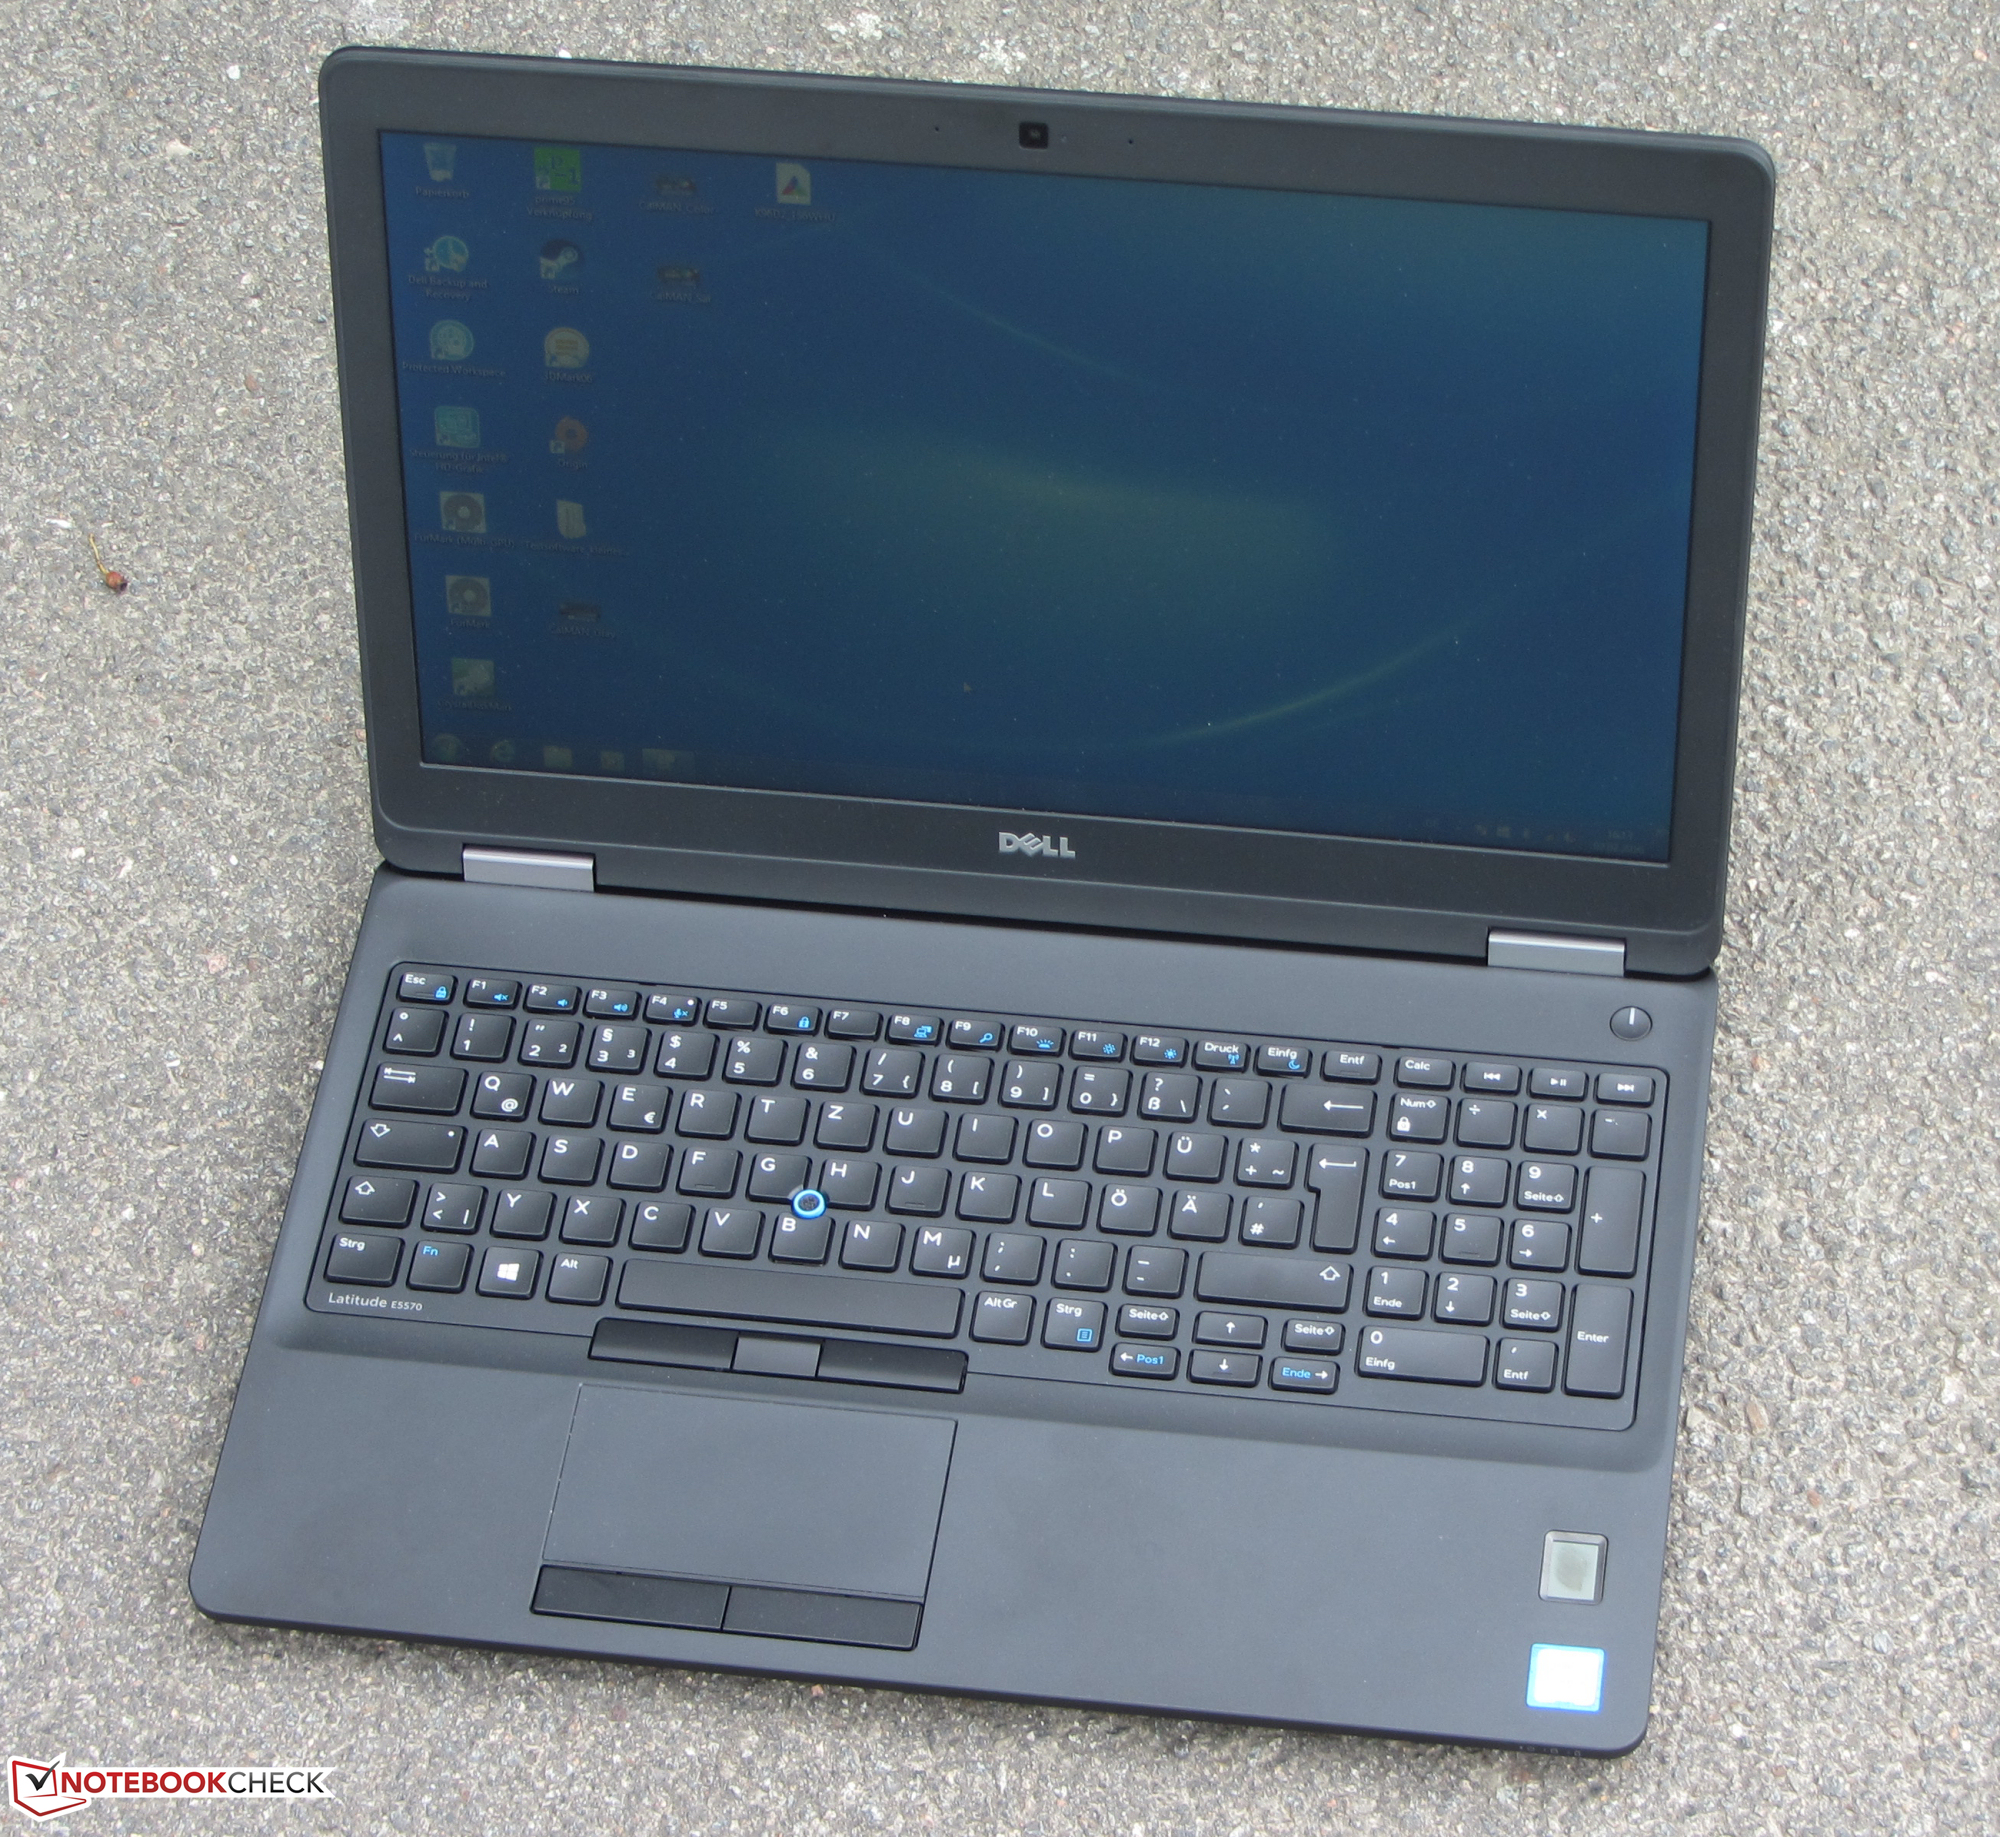
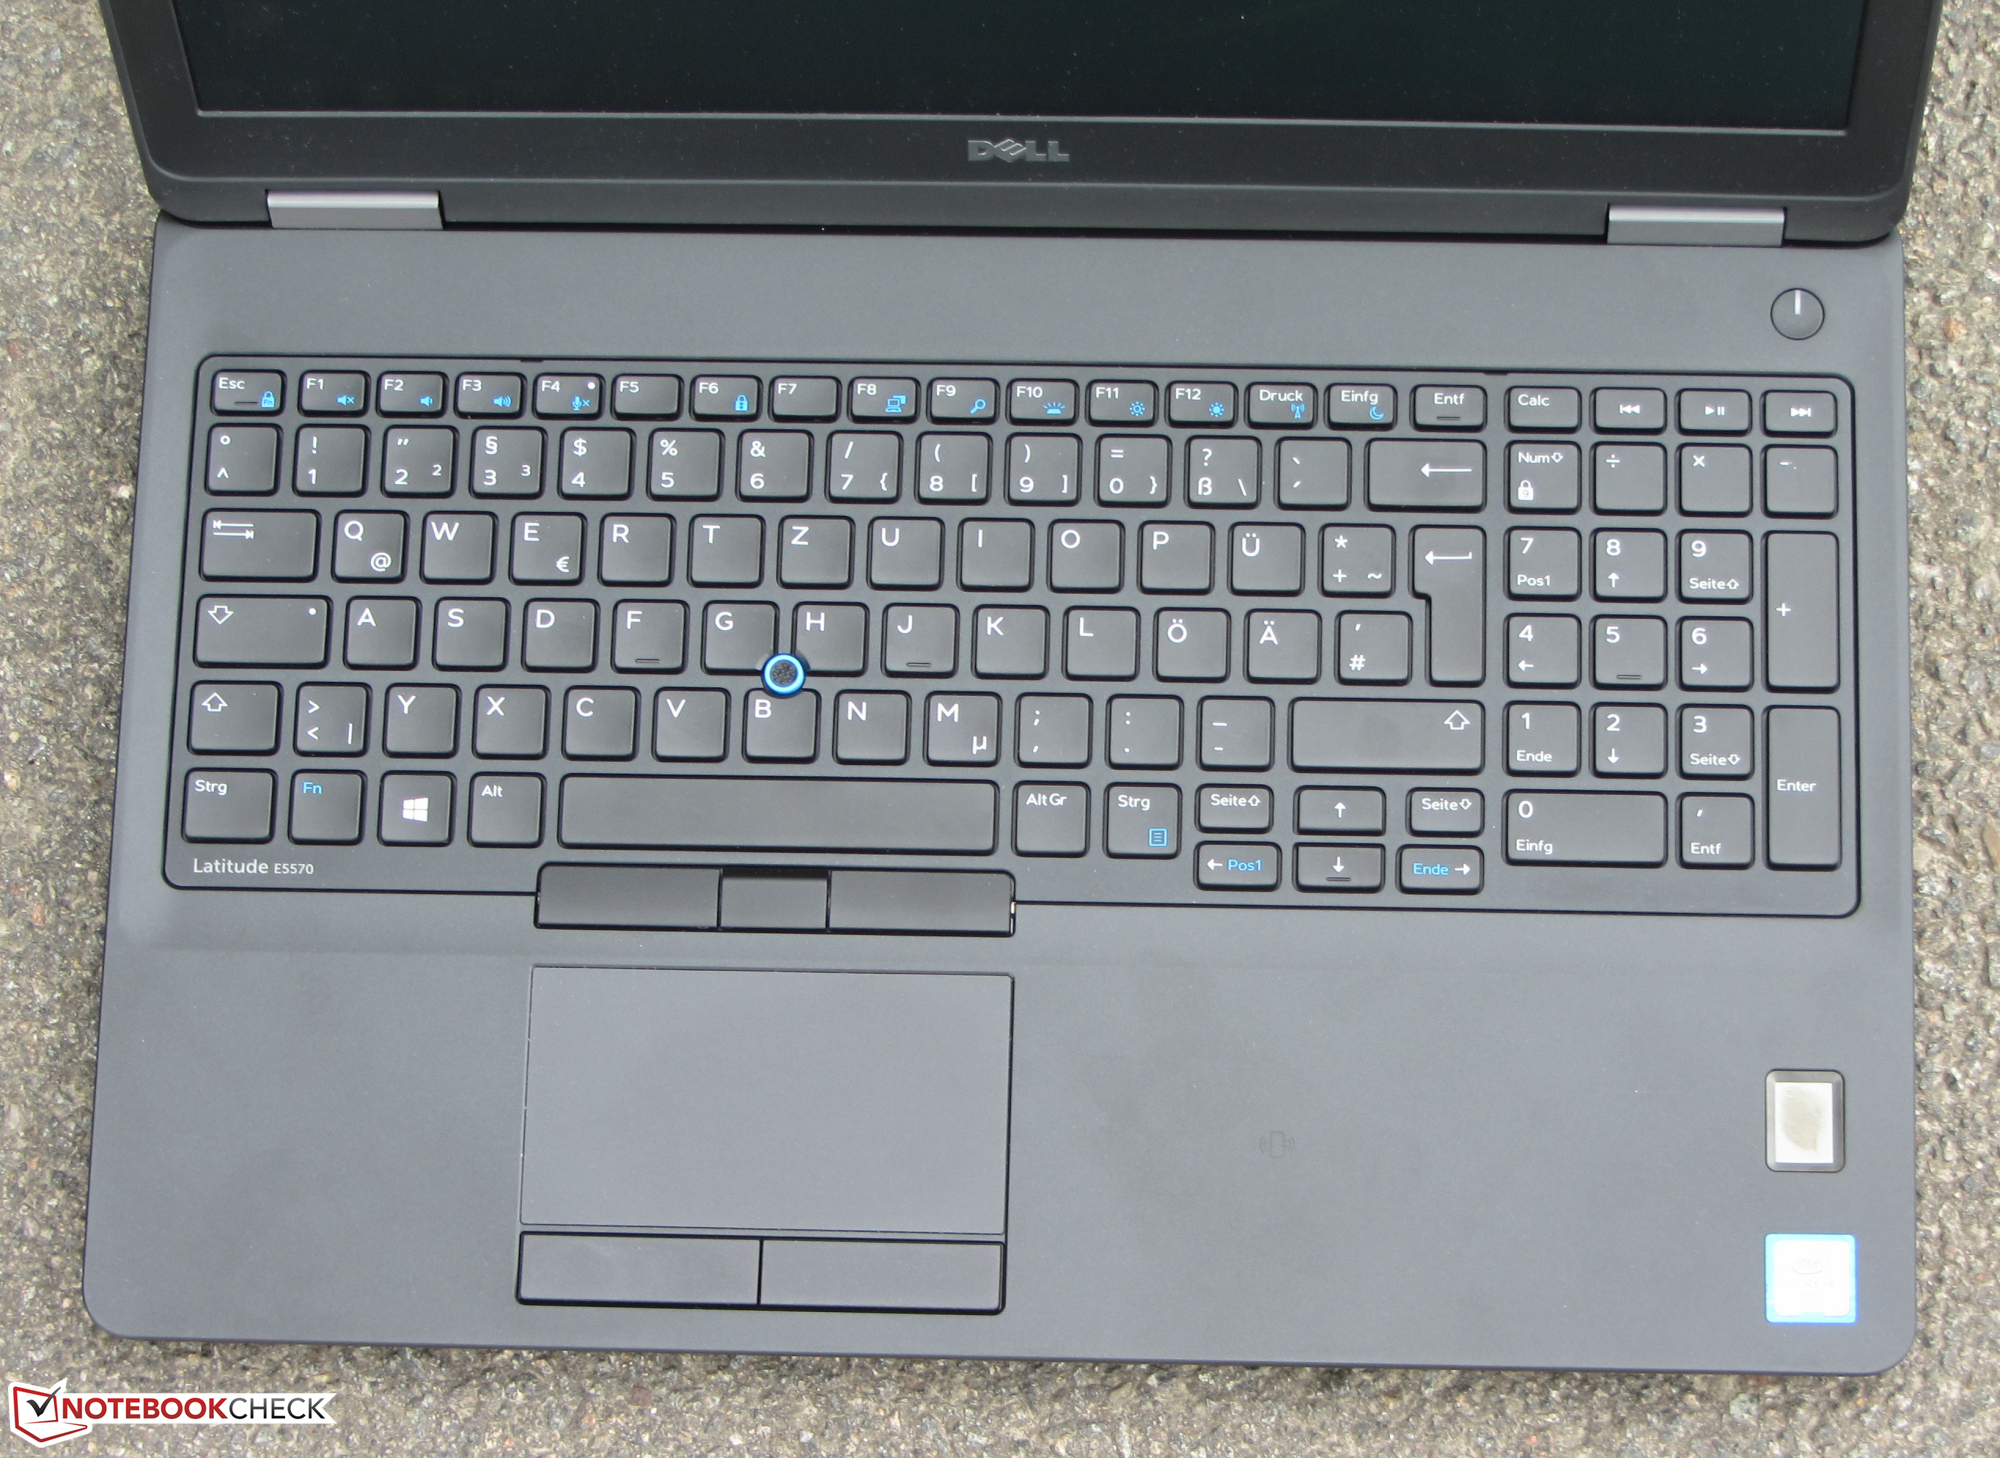
戴尔Latitude 15 E5570是一台搭配15.6寸屏幕的纯粹商务笔记本电脑。它的设计相比前代机型变化很小,但内部配置则大有改观。Skylake架构超低电压处理器为日常应用提供了充足的动力。如果你需要更高的性能,可以考虑选择搭配酷睿i5四核处理器的机型。这台设备十分安静,几乎不会变烫。一块固态硬盘让系统响应迅速,你也可以进一步升级它。这需要打开底盖,不过并不繁琐。与现代机型相似的是,它的键盘十分易用,电池续航时间也十分优秀。
来自戴尔的这台Latitude在很多方面都非常实用,不过也有一些缺点。
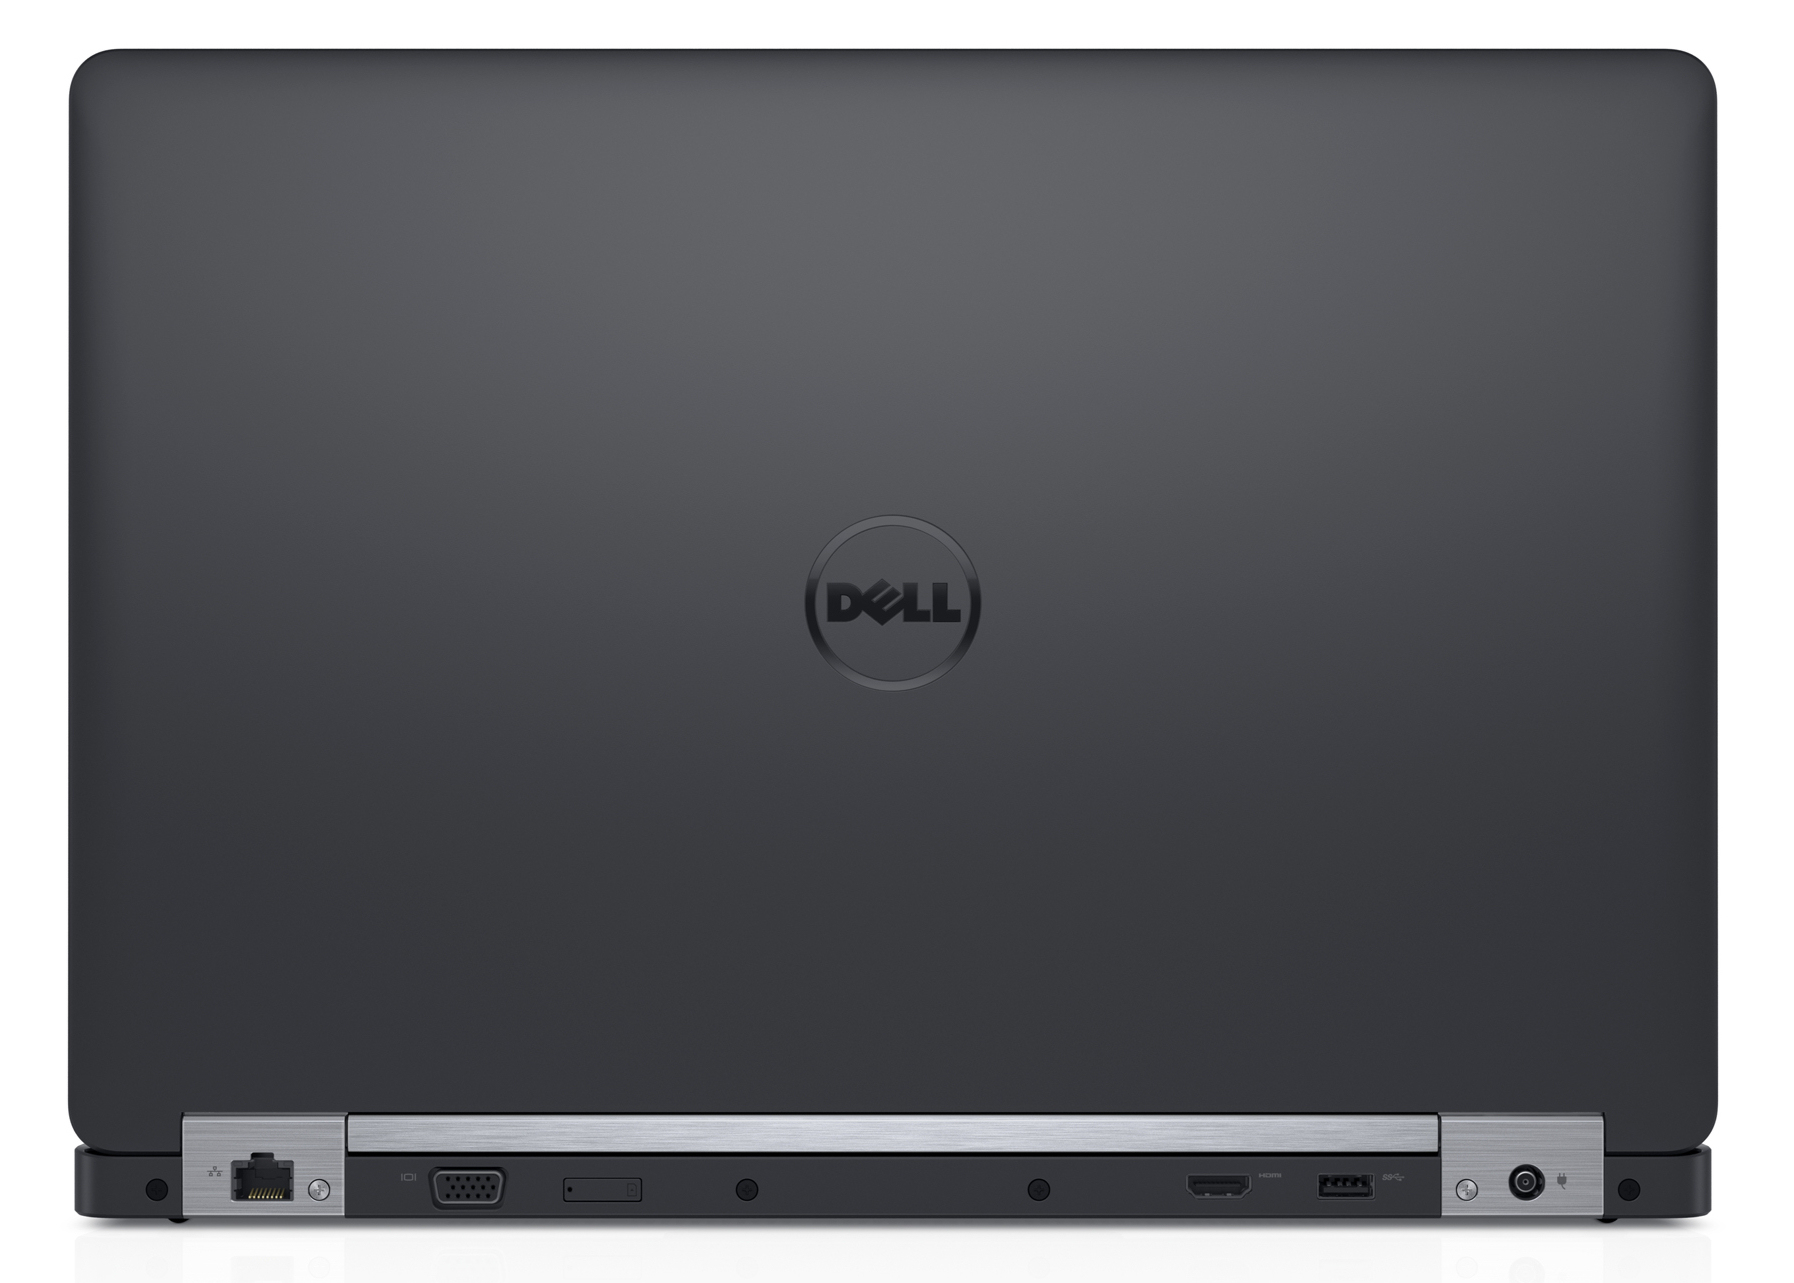
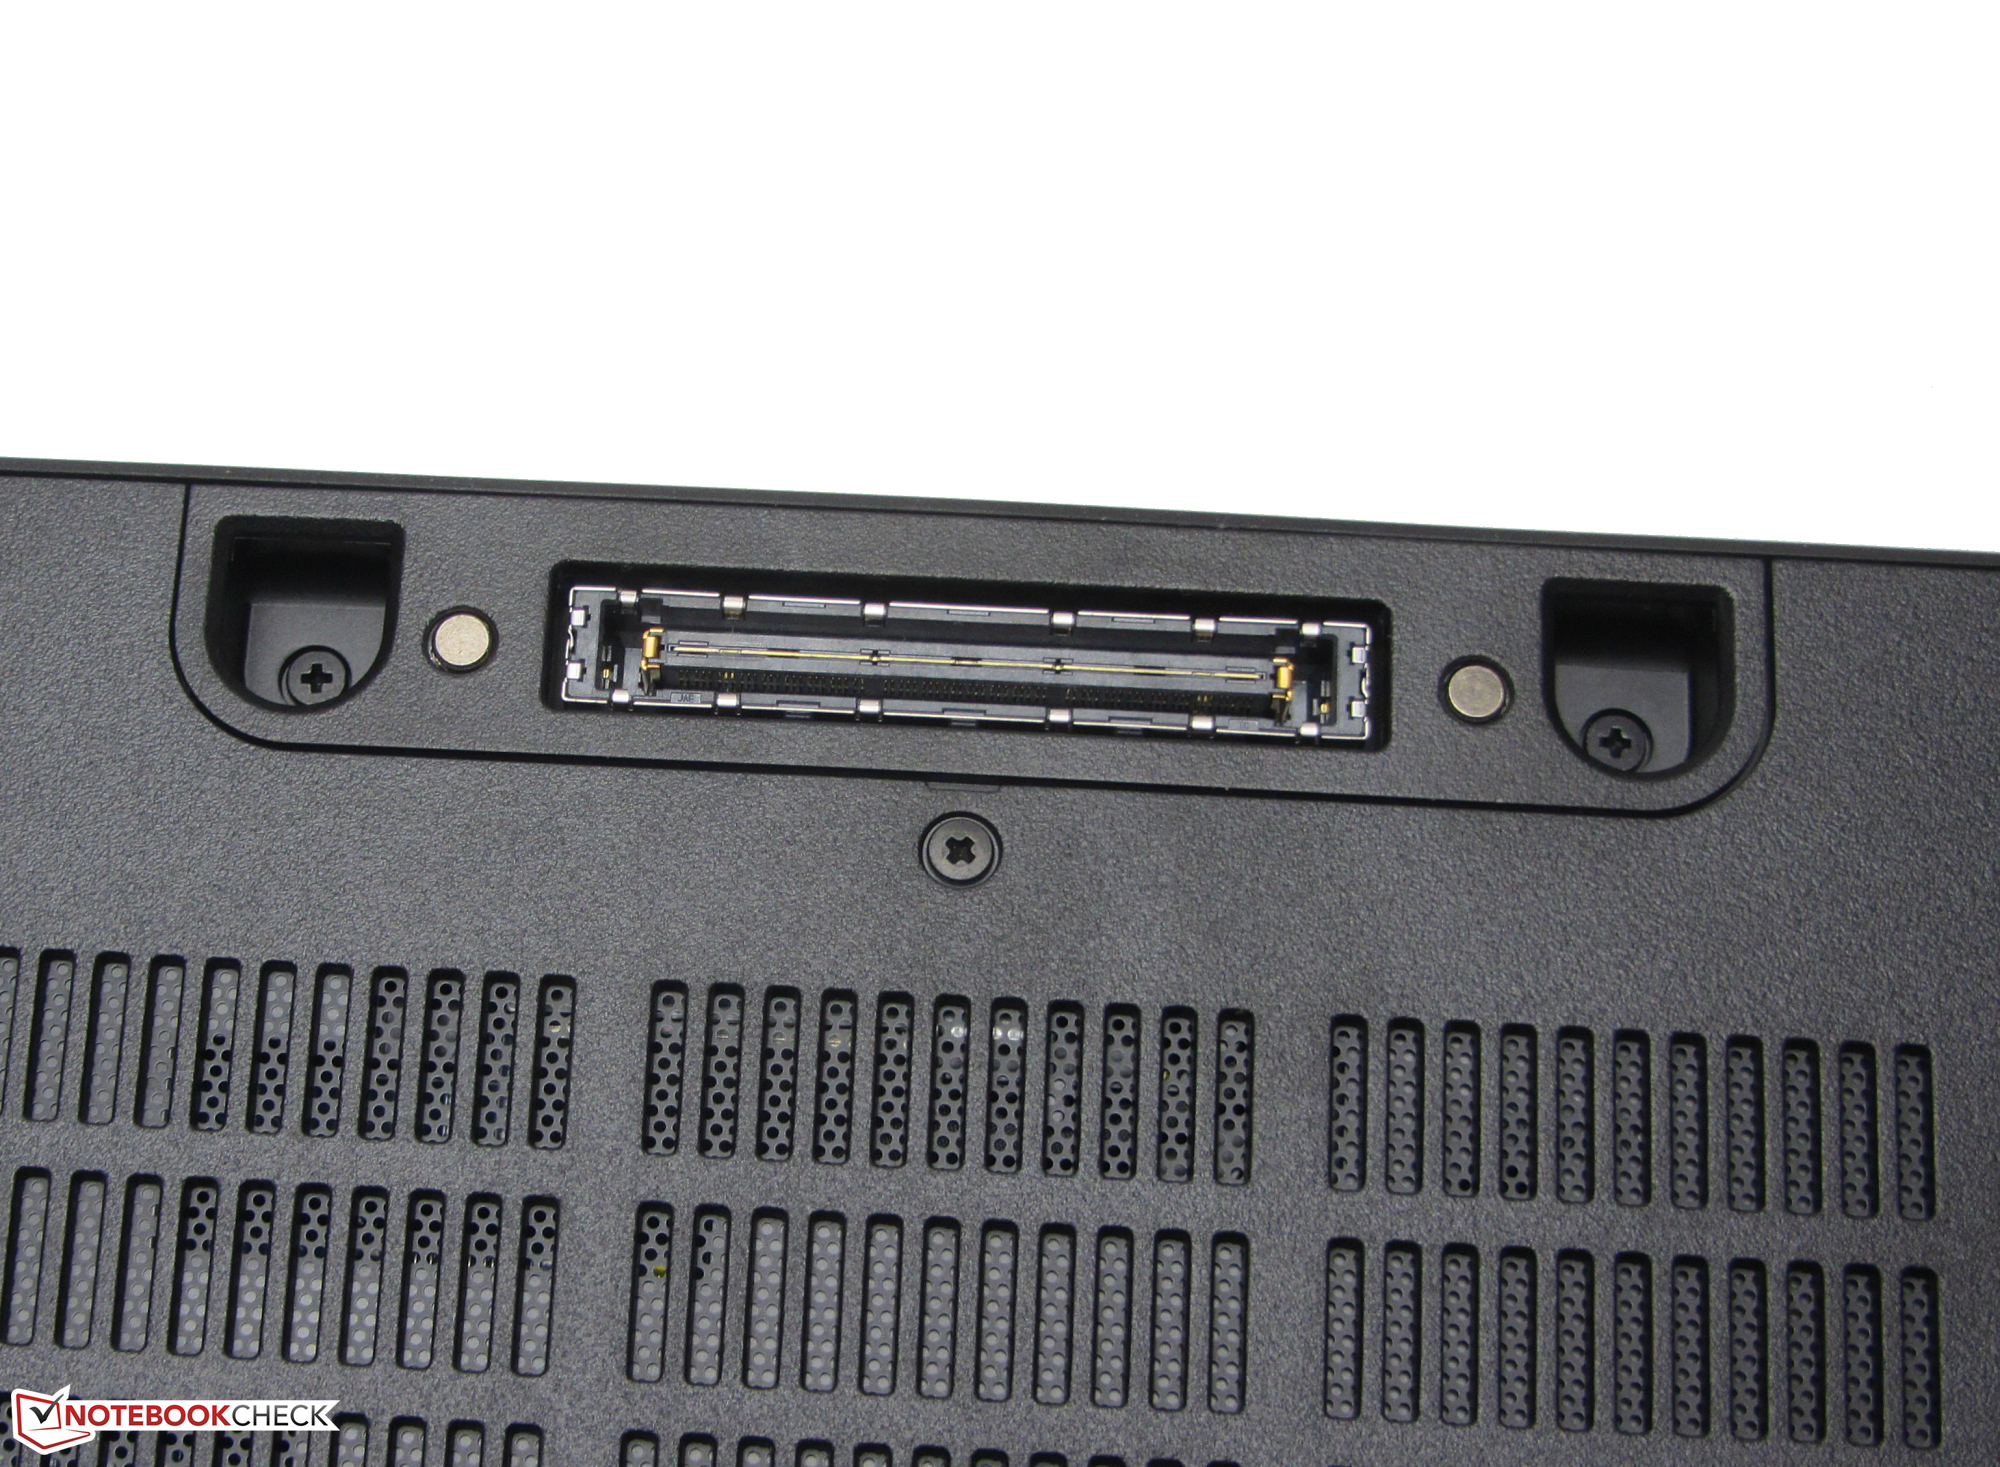
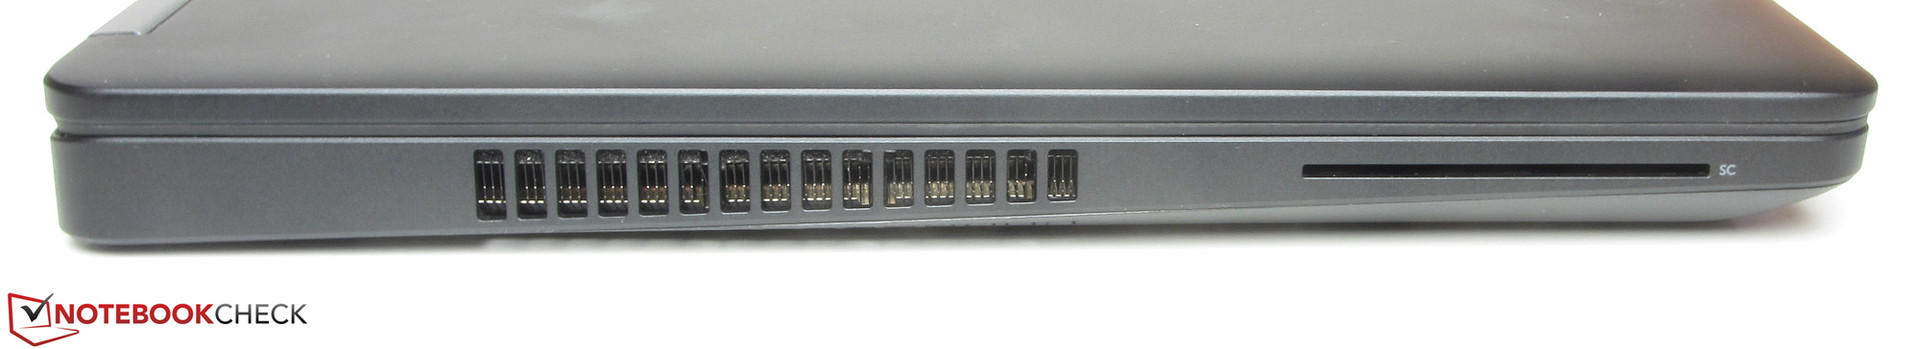
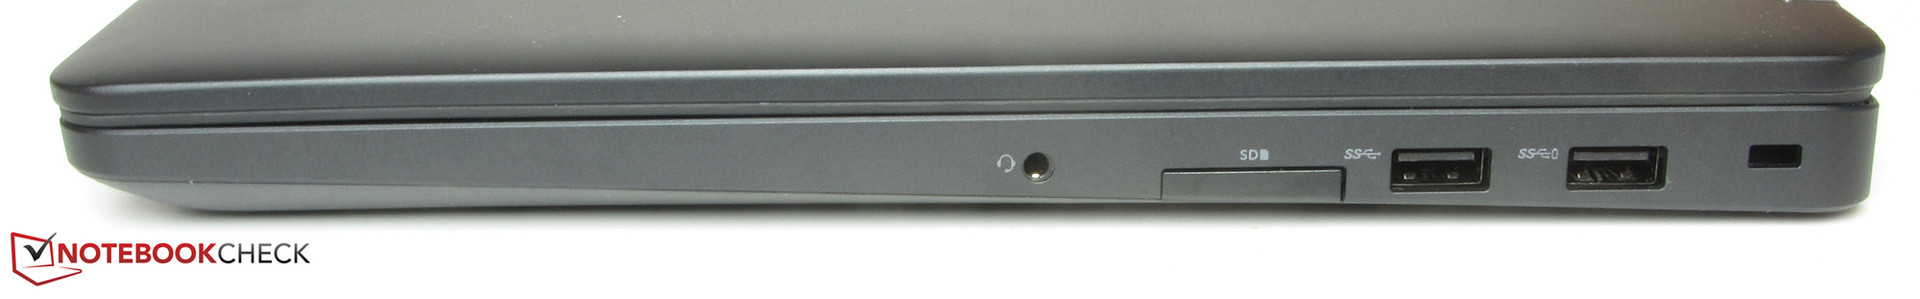
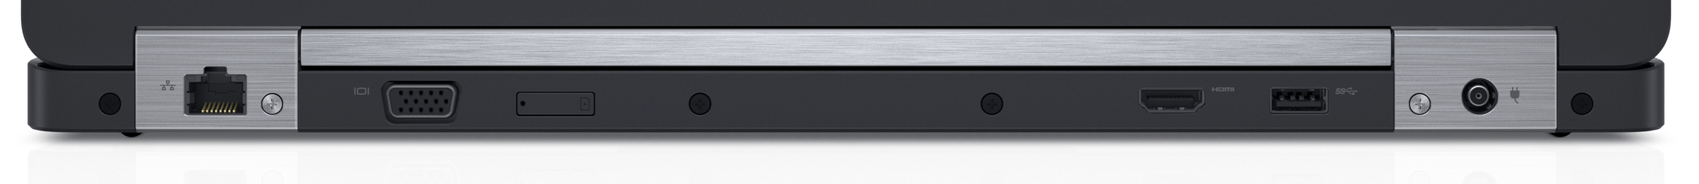
这台设备提供了常见的商务功能如指纹识别器,扩展坞接口,智能卡读卡器(可选),不过戴尔去掉了它对TPM的支持,改而搭配了ControlVault技术。它的屏幕可能也不会让任何人惊喜。戴尔为它搭配了一块低对比度的昏暗屏幕,可视角度范围也十分有限。我们期待一台售价达1000欧元(约7343人民币)的设备能够有更好的屏幕,同时作为Latitude也应该支持USB-C型接口。
注:本文是基于完整评测的缩减版本,阅读完整的英文评测,请点击这里。
Dell Latitude 15 E5570
- 07/05/2016 v5.1 (old)
Sascha Mölck
Price comparison
