Jumper EZBook 3 (N3350, 全高清) 笔记本电脑简短评测
| SD Card Reader | |
| average JPG Copy Test (av. of 3 runs) | |
| HP Pavilion x360 11t T5M27AV | |
| HP 250 G5 Y1V08UT | |
| Acer Swift 1 SF114-31-P6F6 | |
| Jumper EZbook 3 | |
| Acer Aspire ES1-332-P91H | |
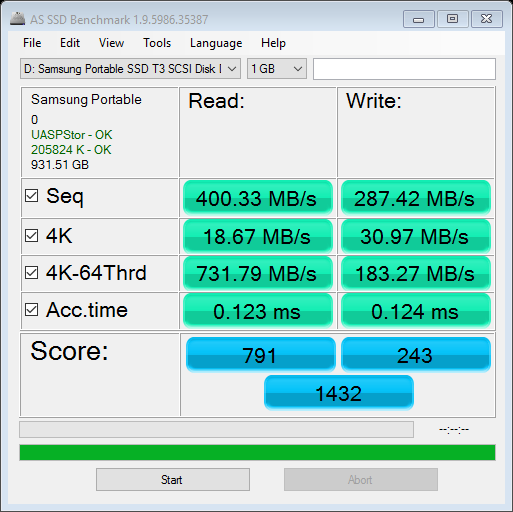
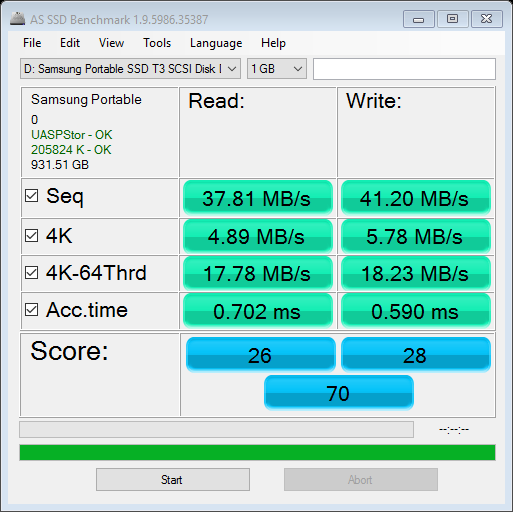
| maximum AS SSD Seq Read Test (1GB) | |
| HP Pavilion x360 11t T5M27AV | |
| Acer Aspire ES1-332-P91H | |
| Acer Swift 1 SF114-31-P6F6 | |
| Jumper EZbook 3 | |
| HP 250 G5 Y1V08UT | |
| Networking | |
| iperf3 transmit AX12 | |
| Asus Zenbook UX3410UA | |
| Chuwi LapBook 14 inch 2017 | |
| Jumper EZbook 3 | |
| Acer Swift 1 SF114-31-P6F6 (jseb) | |
| Chuwi Hi10 Pro | |
| iperf3 receive AX12 | |
| Chuwi LapBook 14 inch 2017 | |
| Asus Zenbook UX3410UA | |
| Jumper EZbook 3 | |
| Acer Swift 1 SF114-31-P6F6 (jseb) | |
| Chuwi Hi10 Pro | |
| |||||||||||||||||||||||||
Brightness Distribution: 76 %
Center on Battery: 384 cd/m²
Contrast: 300:1 (Black: 1.28 cd/m²)
ΔE ColorChecker Calman: 8.7 | ∀{0.5-29.43 Ø4.71}
ΔE Greyscale Calman: 11.1 | ∀{0.09-98 Ø4.96}
53% AdobeRGB 1998 (Argyll 3D)
77.3% sRGB (Argyll 3D)
51.6% Display P3 (Argyll 3D)
Gamma: 2.2
CCT: 12445 K
| Jumper EZbook 3 MS_9003, TN LED, 1920x1080, 14.1" | Acer Swift 1 SF114-31-P6F6 Chi Mei N140BGA-EA3, TN LED, 1366x768, 14" | Apple MacBook 12 (Early 2016) 1.1 GHz APPA027, IPS, 2304x1440, 12" | Teclast Tbook 10s LCD, IPS, 1920x1200, 10.1" | VOYO VBook V3 Chi Mei N116HSE, IPS LED, 1920x1080, 13.3" | Cube i7 Book CDK09 Samsung LTN140W1-L01, IPS, 1920x1080, 10.6" | |
|---|---|---|---|---|---|---|
| Display | -20% | 27% | ||||
| Display P3 Coverage (%) | 51.6 | 40.97 -21% | 66.8 29% | |||
| sRGB Coverage (%) | 77.3 | 61.5 -20% | 95.4 23% | |||
| AdobeRGB 1998 Coverage (%) | 53 | 42.35 -20% | 68 28% | |||
| Response Times | -65% | -76% | -58% | -126% | ||
| Response Time Grey 50% / Grey 80% * (ms) | 46 ? | 32 ? 30% | 41.2 ? 10% | 40 ? 13% | 49 ? -7% | |
| Response Time Black / White * (ms) | 11.6 ? | 30 ? -159% | 30.4 ? -162% | 26.4 ? -128% | 40 ? -245% | |
| PWM Frequency (Hz) | 200 ? | 200 ? | ||||
| Screen | 22% | 64% | 45% | 36% | 51% | |
| Brightness middle (cd/m²) | 384 | 270 -30% | 387 1% | 279 -27% | 195 -49% | 384 0% |
| Brightness (cd/m²) | 341 | 247 -28% | 358 5% | 280 -18% | 200 -41% | 370 9% |
| Brightness Distribution (%) | 76 | 80 5% | 88 16% | 82 8% | 72 -5% | 89 17% |
| Black Level * (cd/m²) | 1.28 | 0.57 55% | 0.47 63% | 0.29 77% | 0.24 81% | 0.37 71% |
| Contrast (:1) | 300 | 474 58% | 823 174% | 962 221% | 813 171% | 1038 246% |
| Colorchecker dE 2000 * | 8.7 | 3.01 65% | 1.6 82% | 6.7 23% | 5 43% | 5.8 33% |
| Colorchecker dE 2000 max. * | 16.7 | 6.33 62% | 4 76% | 10.8 35% | 9.31 44% | 19.8 -19% |
| Greyscale dE 2000 * | 11.1 | 12.73 -15% | 1 91% | 6.8 39% | 5.98 46% | 5.1 54% |
| Gamma | 2.2 100% | 2.36 93% | 2.26 97% | 2.27 97% | 2.17 101% | 2.4 92% |
| CCT | 12445 52% | 14629 44% | 6680 97% | 8466 77% | 6764 96% | 7125 91% |
| Color Space (Percent of AdobeRGB 1998) (%) | 39 | 61.6 | ||||
| Color Space (Percent of sRGB) (%) | 62 | 82.2 | ||||
| Total Average (Program / Settings) | -21% /
-1% | 5% /
34% | -7% /
24% | -45% /
4% | 51% /
51% |
* ... smaller is better
Display Response Times
| ↔ Response Time Black to White | ||
|---|---|---|
| 11.6 ms ... rise ↗ and fall ↘ combined | ↗ 7.7 ms rise | 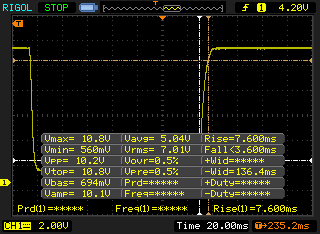 |
| ↘ 3.8 ms fall | ||
| The screen shows good response rates in our tests, but may be too slow for competitive gamers. In comparison, all tested devices range from 0.1 (minimum) to 240 (maximum) ms. » 31 % of all devices are better. This means that the measured response time is better than the average of all tested devices (19.8 ms). | ||
| ↔ Response Time 50% Grey to 80% Grey | ||
| 46 ms ... rise ↗ and fall ↘ combined | ↗ 25 ms rise | 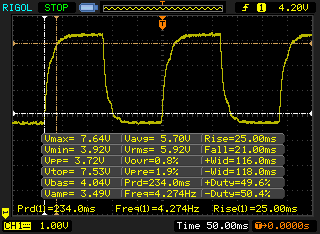 |
| ↘ 21 ms fall | ||
| The screen shows slow response rates in our tests and will be unsatisfactory for gamers. In comparison, all tested devices range from 0.165 (minimum) to 636 (maximum) ms. » 79 % of all devices are better. This means that the measured response time is worse than the average of all tested devices (30.9 ms). | ||
Screen Flickering / PWM (Pulse-Width Modulation)
| Screen flickering / PWM detected | 200 Hz | ≤ 99 % brightness setting | 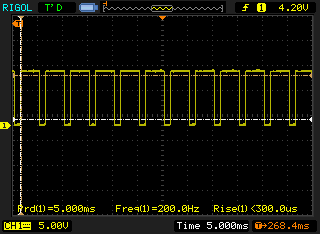 |
The display backlight flickers at 200 Hz (worst case, e.g., utilizing PWM) Flickering detected at a brightness setting of 99 % and below. There should be no flickering or PWM above this brightness setting. The frequency of 200 Hz is relatively low, so sensitive users will likely notice flickering and experience eyestrain at the stated brightness setting and below. In comparison: 52 % of all tested devices do not use PWM to dim the display. If PWM was detected, an average of 7744 (minimum: 5 - maximum: 343500) Hz was measured. | |||
| Cinebench R15 | |
| CPU Single 64Bit | |
| Apple MacBook 12 (Early 2016) 1.1 GHz | |
| Apple MacBook 12 (Early 2016) 1.1 GHz | |
| Cube i7 Book CDK09 | |
| Acer Aspire ES1-332-P91H | |
| Jumper EZbook 3 | |
| Acer Swift 1 SF114-31-P6F6 | |
| HP Pavilion 11-k103ng x360 | |
| CPU Multi 64Bit | |
| Apple MacBook 12 (Early 2016) 1.1 GHz | |
| Cube i7 Book CDK09 | |
| Acer Aspire ES1-332-P91H | |
| Acer Swift 1 SF114-31-P6F6 | |
| Jumper EZbook 3 | |
| HP Pavilion 11-k103ng x360 | |
| PCMark 8 Home Score Accelerated v2 | 1592 points | |
| PCMark 8 Work Score Accelerated v2 | 2207 points | |
| PCMark 10 Score | 1195 points | |
Help | ||
| Jumper EZbook 3 Toshiba 064G93 64 GB eMMC | Apple MacBook 12 (Early 2016) 1.3 GHz Apple SSD AP0256 | Asus TransformerBook T302CA-FL010T Samsung CM871 MZNLF128HCHP | Acer Swift 1 SF114-31-P6F6 128 GB eMMC Flash | Chuwi Hi12 Hynix HCG8E 64 GB | Acer Aspire ES1-521-87DN Western Digital Scorpio Blue WD5000LPVX | HP Pavilion 11-k103ng x360 Hitachi Travelstar Z5K500 HTS545050A7E680 | |
|---|---|---|---|---|---|---|---|
| CrystalDiskMark 3.0 | 1814% | 265% | 155% | 134% | -32% | -38% | |
| Read Seq (MB/s) | 151 | 821 444% | 428 183% | 166.5 10% | 141 -7% | 109.6 -27% | 106 -30% |
| Write Seq (MB/s) | 50 | 660 1220% | 124.2 148% | 85 70% | 50 0% | 107.5 115% | 106.1 112% |
| Read 512 (MB/s) | 133 | 672 405% | 283.9 113% | 153.8 16% | 132 -1% | 36.63 -72% | 33.53 -75% |
| Write 512 (MB/s) | 41.3 | 737 1685% | 41.49 0% | 75.6 83% | 44.8 8% | 49.35 19% | 39.03 -5% |
| Read 4k (MB/s) | 5.07 | 16.28 221% | 15.95 215% | 13.2 160% | 17.9 253% | 0.419 -92% | 0.407 -92% |
| Write 4k (MB/s) | 2.47 | 24.87 907% | 14.67 494% | 13.04 428% | 11.4 362% | 1.171 -53% | 1.026 -58% |
| Read 4k QD32 (MB/s) | 16.4 | 271.9 1558% | 98.9 503% | 35.12 114% | 35.3 115% | 1.03 -94% | 0.898 -95% |
| Write 4k QD32 (MB/s) | 2.74 | 223.9 8072% | 15.41 462% | 12.66 362% | 12.1 342% | 1.239 -55% | 1.003 -63% |

| 3DMark 11 - 1280x720 Performance GPU | |
| Asus TransformerBook T302CA-FL010T | |
| Asus Vivobook F556UQ-XO626D | |
| Acer Aspire ES1-332-P91H | |
| Acer Swift 1 SF114-31-P6F6 | |
| HP Pavilion x360 11t T5M27AV | |
| Jumper EZbook 3 | |
| Acer Switch One 10 SW1-011-14UQ | |
| 3DMark 06 Standard Score | 3393 points | |
| 3DMark 11 Performance | 505 points | |
| 3DMark Cloud Gate Standard Score | 2074 points | |
Help | ||
| World of Warships - 1366x768 Low Preset AF:Trilinear | |
| MSI CX61 2QC 2970M MS-16GD | |
| Acer Aspire ES1-521-87DN | |
| Jumper EZbook 3 | |
| Acer Extensa 2519-C7DC | |
| Chuwi Hi12 | |
| low | med. | high | ultra | |
|---|---|---|---|---|
| World of Warcraft (2005) | 46 | |||
| Diablo III (2012) | 12.7 | |||
| Counter-Strike: GO (2012) | 14 | |||
| Dota 2 Reborn (2015) | 15.9 | |||
| World of Warships (2015) | 19.1 | |||
| Team Fortress 2 (2017) | 21.2 | |||
| X-Plane 11.11 (2018) | 5.3 | |||
| World of Tanks enCore (2018) | 34 (error at the end) | 4 (error at the end) | ||
| Strange Brigade (2018) | 0 game wont start | |||
| League of Legends (2019) | 28.2 | 20.2 | 13.9 | 12.6 |
| Hearthstone (2020) | 23.9 | 24 | 11.2 | |
| Valorant (2020) | 9.09 |
(±) The maximum temperature on the upper side is 41 °C / 106 F, compared to the average of 35.9 °C / 97 F, ranging from 21.4 to 59 °C for the class Subnotebook.
(±) The bottom heats up to a maximum of 42 °C / 108 F, compared to the average of 39.2 °C / 103 F
(+) In idle usage, the average temperature for the upper side is 24.2 °C / 76 F, compared to the device average of 30.8 °C / 87 F.
(+) The palmrests and touchpad are reaching skin temperature as a maximum (32 °C / 89.6 F) and are therefore not hot.
(-) The average temperature of the palmrest area of similar devices was 28.2 °C / 82.8 F (-3.8 °C / -6.8 F).
Jumper EZbook 3 audio analysis
(±) | speaker loudness is average but good (80.4 dB)
Bass 100 - 315 Hz
(-) | nearly no bass - on average 25.1% lower than median
(±) | linearity of bass is average (10.6% delta to prev. frequency)
Mids 400 - 2000 Hz
(±) | higher mids - on average 7.2% higher than median
(±) | linearity of mids is average (10.8% delta to prev. frequency)
Highs 2 - 16 kHz
(±) | higher highs - on average 5% higher than median
(+) | highs are linear (4.4% delta to prev. frequency)
Overall 100 - 16.000 Hz
(±) | linearity of overall sound is average (27.3% difference to median)
Compared to same class
» 89% of all tested devices in this class were better, 3% similar, 9% worse
» The best had a delta of 5%, average was 18%, worst was 53%
Compared to all devices tested
» 83% of all tested devices were better, 4% similar, 13% worse
» The best had a delta of 4%, average was 23%, worst was 134%
Apple MacBook 12 (Early 2016) 1.1 GHz audio analysis
(+) | speakers can play relatively loud (83.6 dB)
Bass 100 - 315 Hz
(±) | reduced bass - on average 11.3% lower than median
(±) | linearity of bass is average (14.2% delta to prev. frequency)
Mids 400 - 2000 Hz
(+) | balanced mids - only 2.4% away from median
(+) | mids are linear (5.5% delta to prev. frequency)
Highs 2 - 16 kHz
(+) | balanced highs - only 2% away from median
(+) | highs are linear (4.5% delta to prev. frequency)
Overall 100 - 16.000 Hz
(+) | overall sound is linear (10.2% difference to median)
Compared to same class
» 7% of all tested devices in this class were better, 2% similar, 90% worse
» The best had a delta of 5%, average was 18%, worst was 53%
Compared to all devices tested
» 5% of all tested devices were better, 1% similar, 94% worse
» The best had a delta of 4%, average was 23%, worst was 134%
| Off / Standby | |
| Idle | |
| Load |
|
Key:
min: | |
| Jumper EZbook 3 Celeron N3350, HD Graphics 500, Toshiba 064G93 64 GB eMMC, TN LED, 1920x1080, 14.1" | Chuwi Hi10 Pro Z8300, HD Graphics (Cherry Trail), 64 GB eMMC Flash, IPS, 1920x1200, 10.1" | HP 250 G5 Y1V08UT N3060, HD Graphics 400 (Braswell), Samsung CM871 MZNLF128HCHP, TN LED, 1366x768, 15.6" | Apple MacBook 12 (Early 2016) 1.3 GHz 6Y75, HD Graphics 515, Apple SSD AP0256, IPS, 2304x1440, 12" | Acer Swift 1 SF114-31-P6F6 N3710, HD Graphics 405 (Braswell), 128 GB eMMC Flash, TN LED, 1366x768, 14" | Acer Aspire ES1-332-P91H Pentium N4200, HD Graphics 505, WDC Slim WD10SPCX-21KHST0, TN LED, 1366x768, 13.3" | HP Pavilion 11-k103ng x360 N3050, HD Graphics (Braswell), Hitachi Travelstar Z5K500 HTS545050A7E680, IPS, 1366x768, 11.6" | |
|---|---|---|---|---|---|---|---|
| Power Consumption | 23% | -3% | -11% | -21% | -32% | -33% | |
| Idle Minimum * (Watt) | 3.18 | 1.4 56% | 3.9 -23% | 2 37% | 4.1 -29% | 4.5 -42% | 5.3 -67% |
| Idle Average * (Watt) | 6.14 | 4.82 21% | 6.4 -4% | 2.06 66% | 8.3 -35% | 7.6 -24% | 7.1 -16% |
| Idle Maximum * (Watt) | 6.4 | 5.43 15% | 6.5 -2% | 6.94 -8% | 8.6 -34% | 8.5 -33% | 8.2 -28% |
| Load Average * (Watt) | 13.3 | 11.61 13% | 11.1 17% | 22.52 -69% | 13.5 -2% | 17.4 -31% | 15.5 -17% |
| Load Maximum * (Watt) | 13.6 | 12.48 8% | 13.8 -1% | 24.87 -83% | 14.5 -7% | 17.6 -29% | 18.9 -39% |
* ... smaller is better
| Battery Runtime - WiFi Websurfing | |
| Acer Swift 1 SF114-31-P6F6 | |
| Apple MacBook Air 13 inch 2015-03 | |
| Apple MacBook 12 (Early 2016) 1.3 GHz | |
| Jumper EZbook 3 | |
| Xiaomi Mi Notebook Air 13.3 2016 | |
| Acer Swift 3 SF314-51-731X | |
| VOYO VBook V3 | |
Pros
Cons
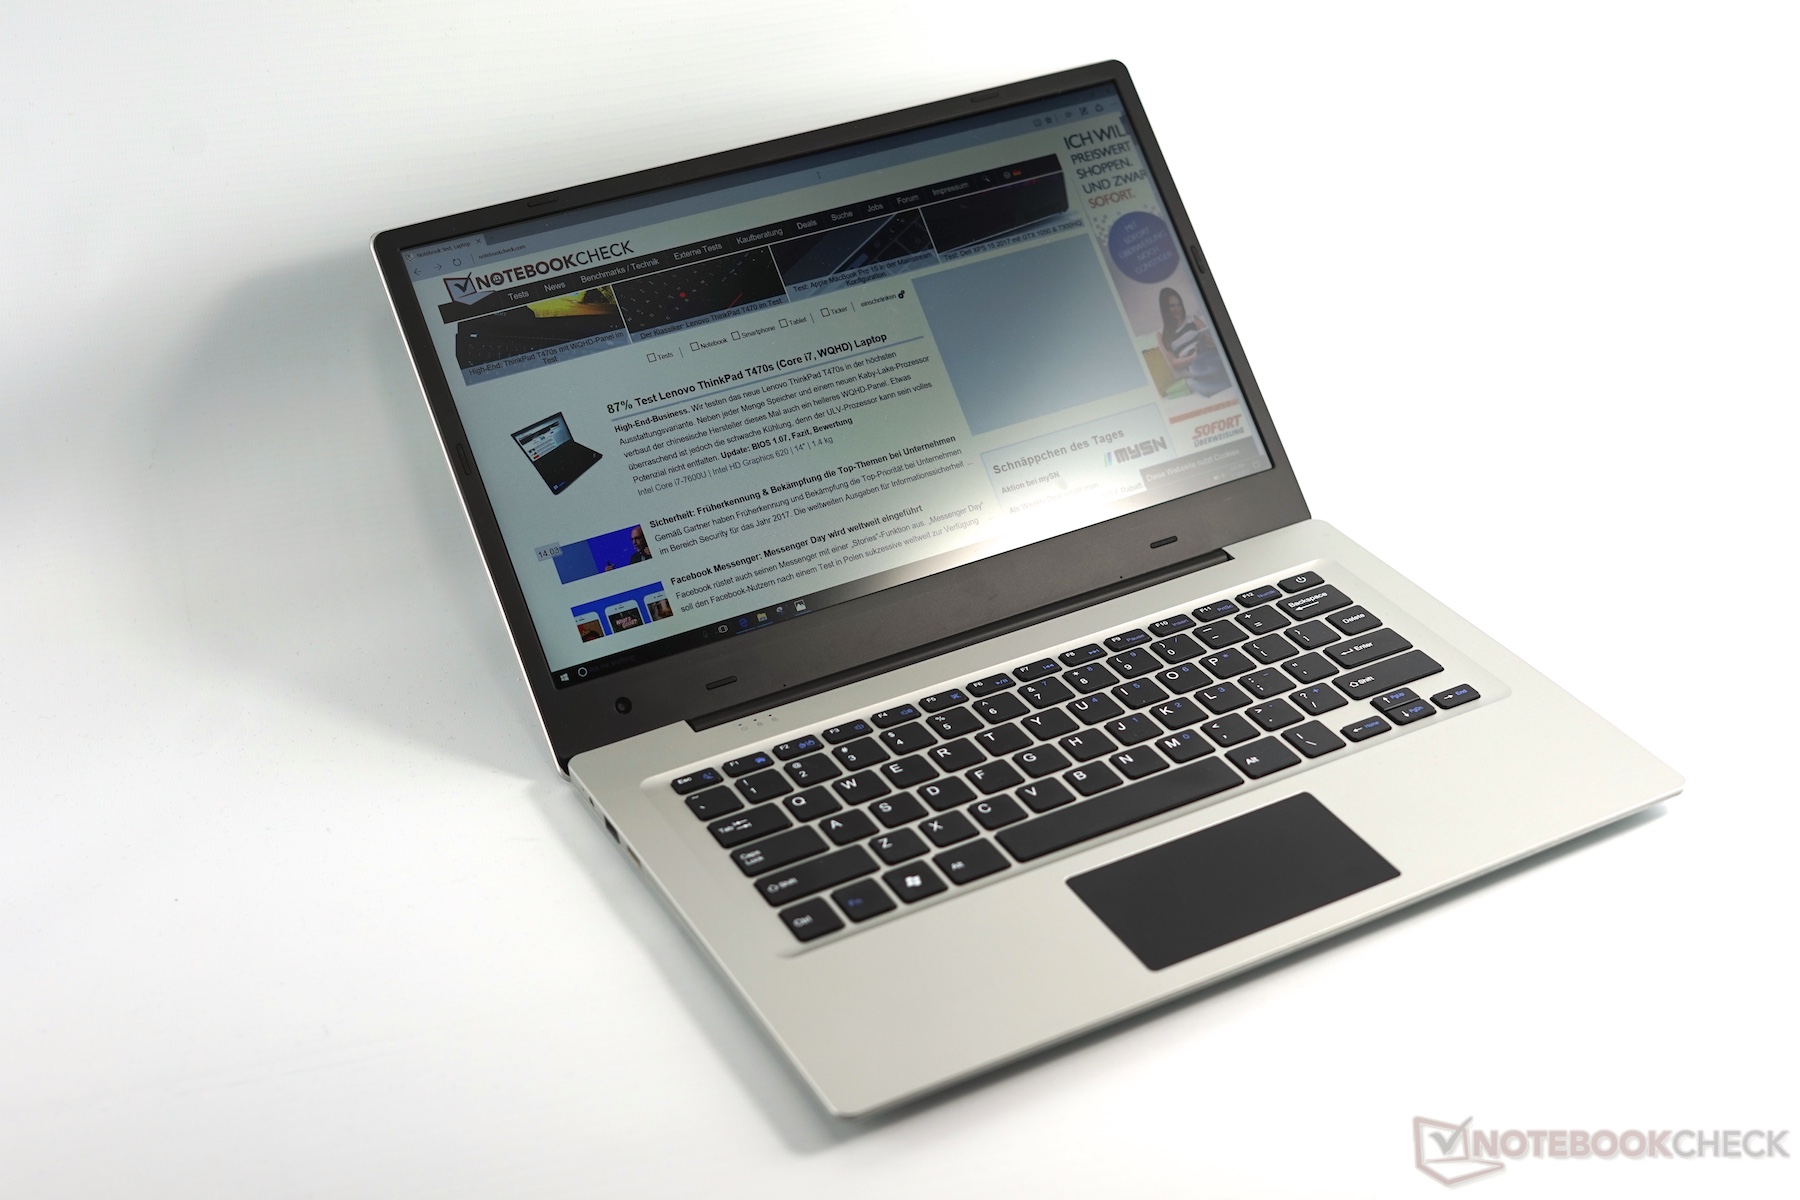
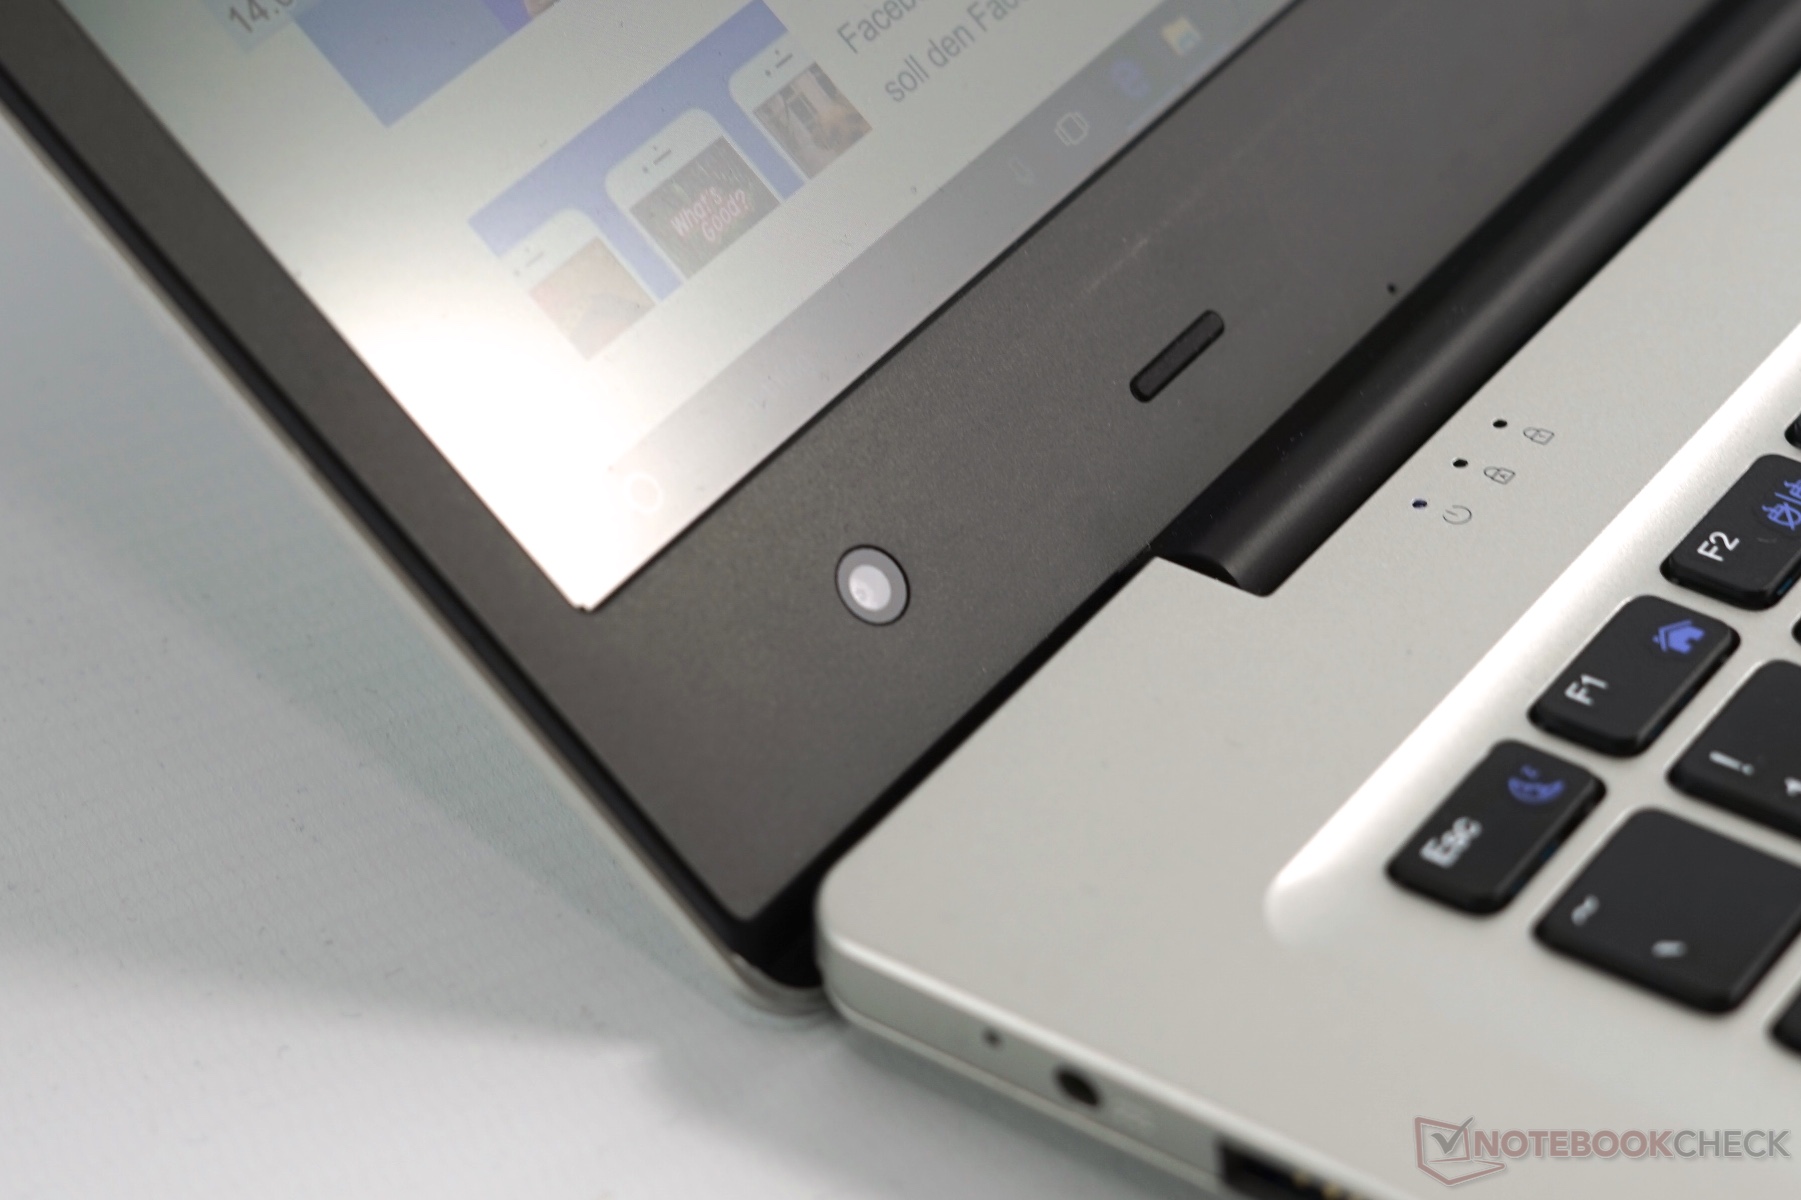
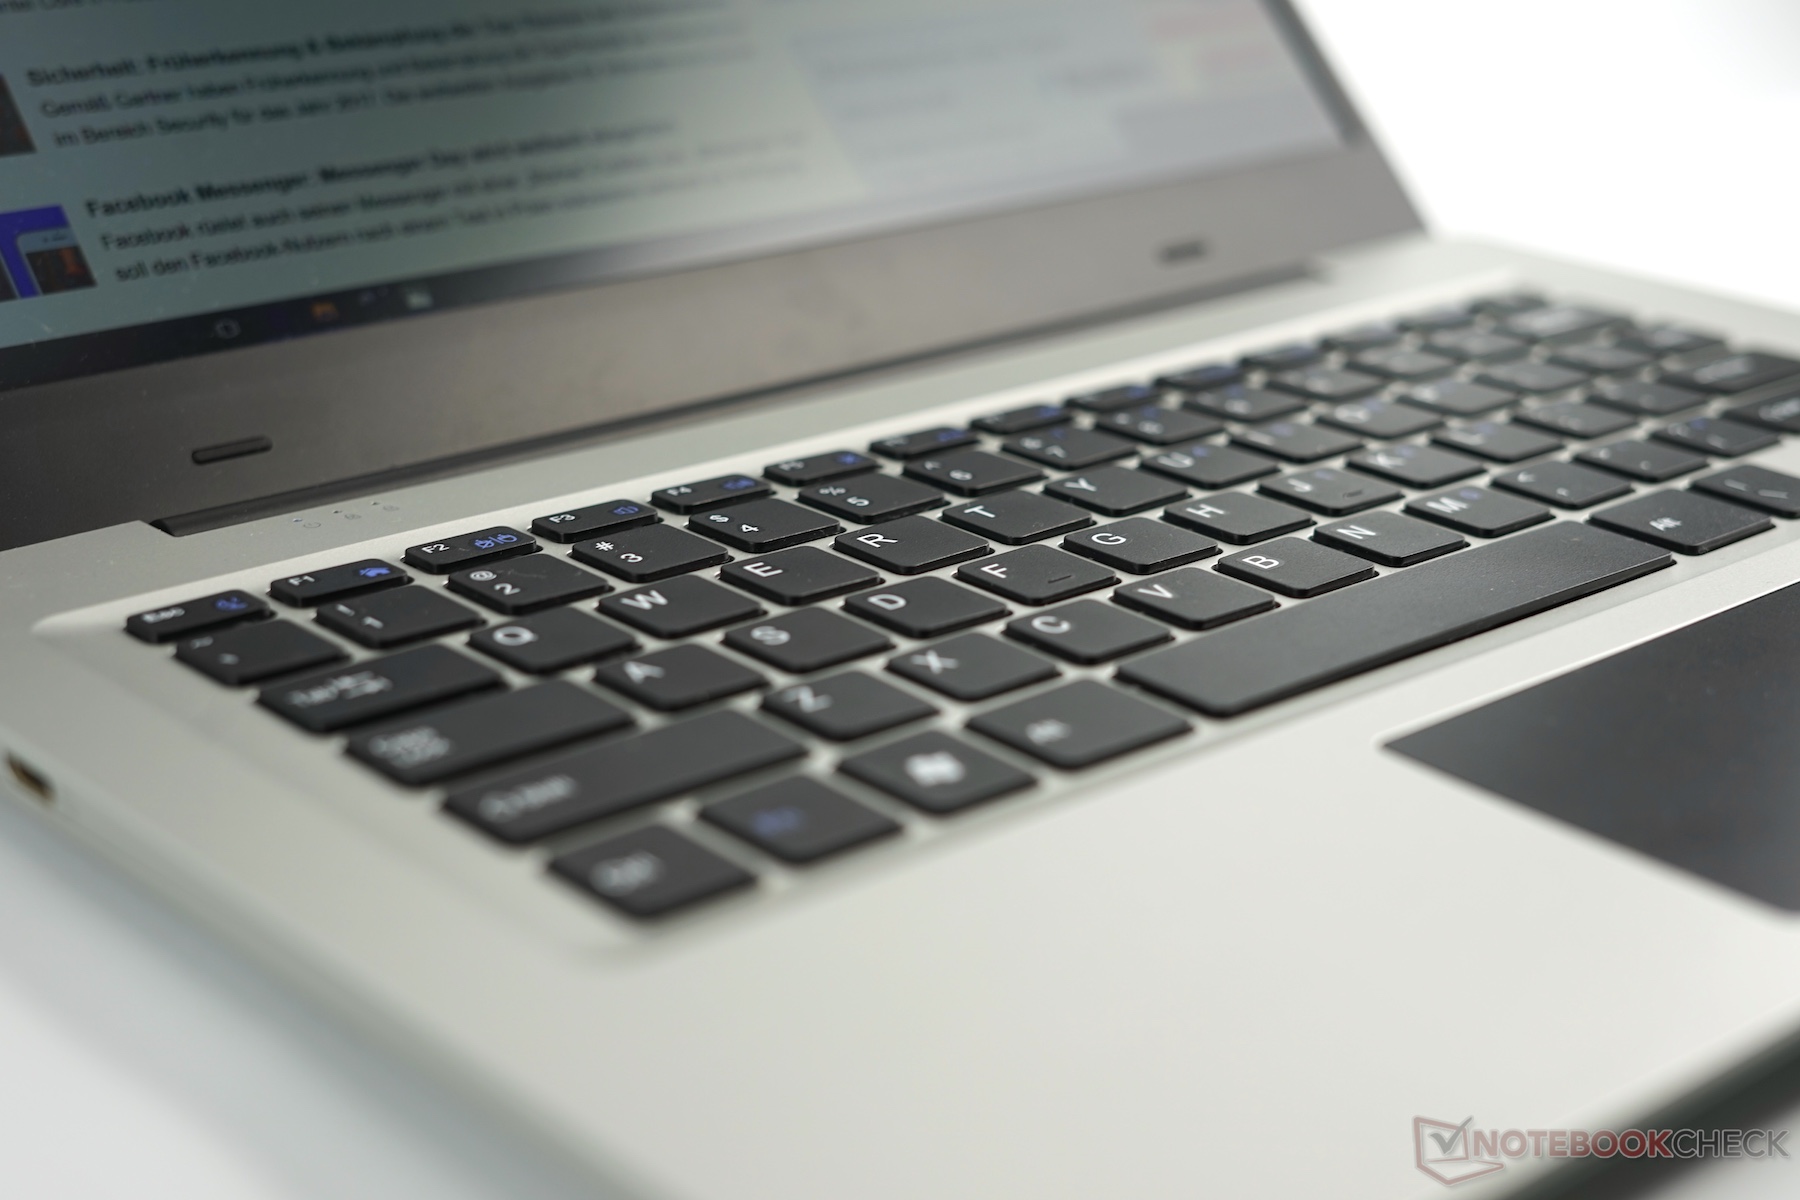
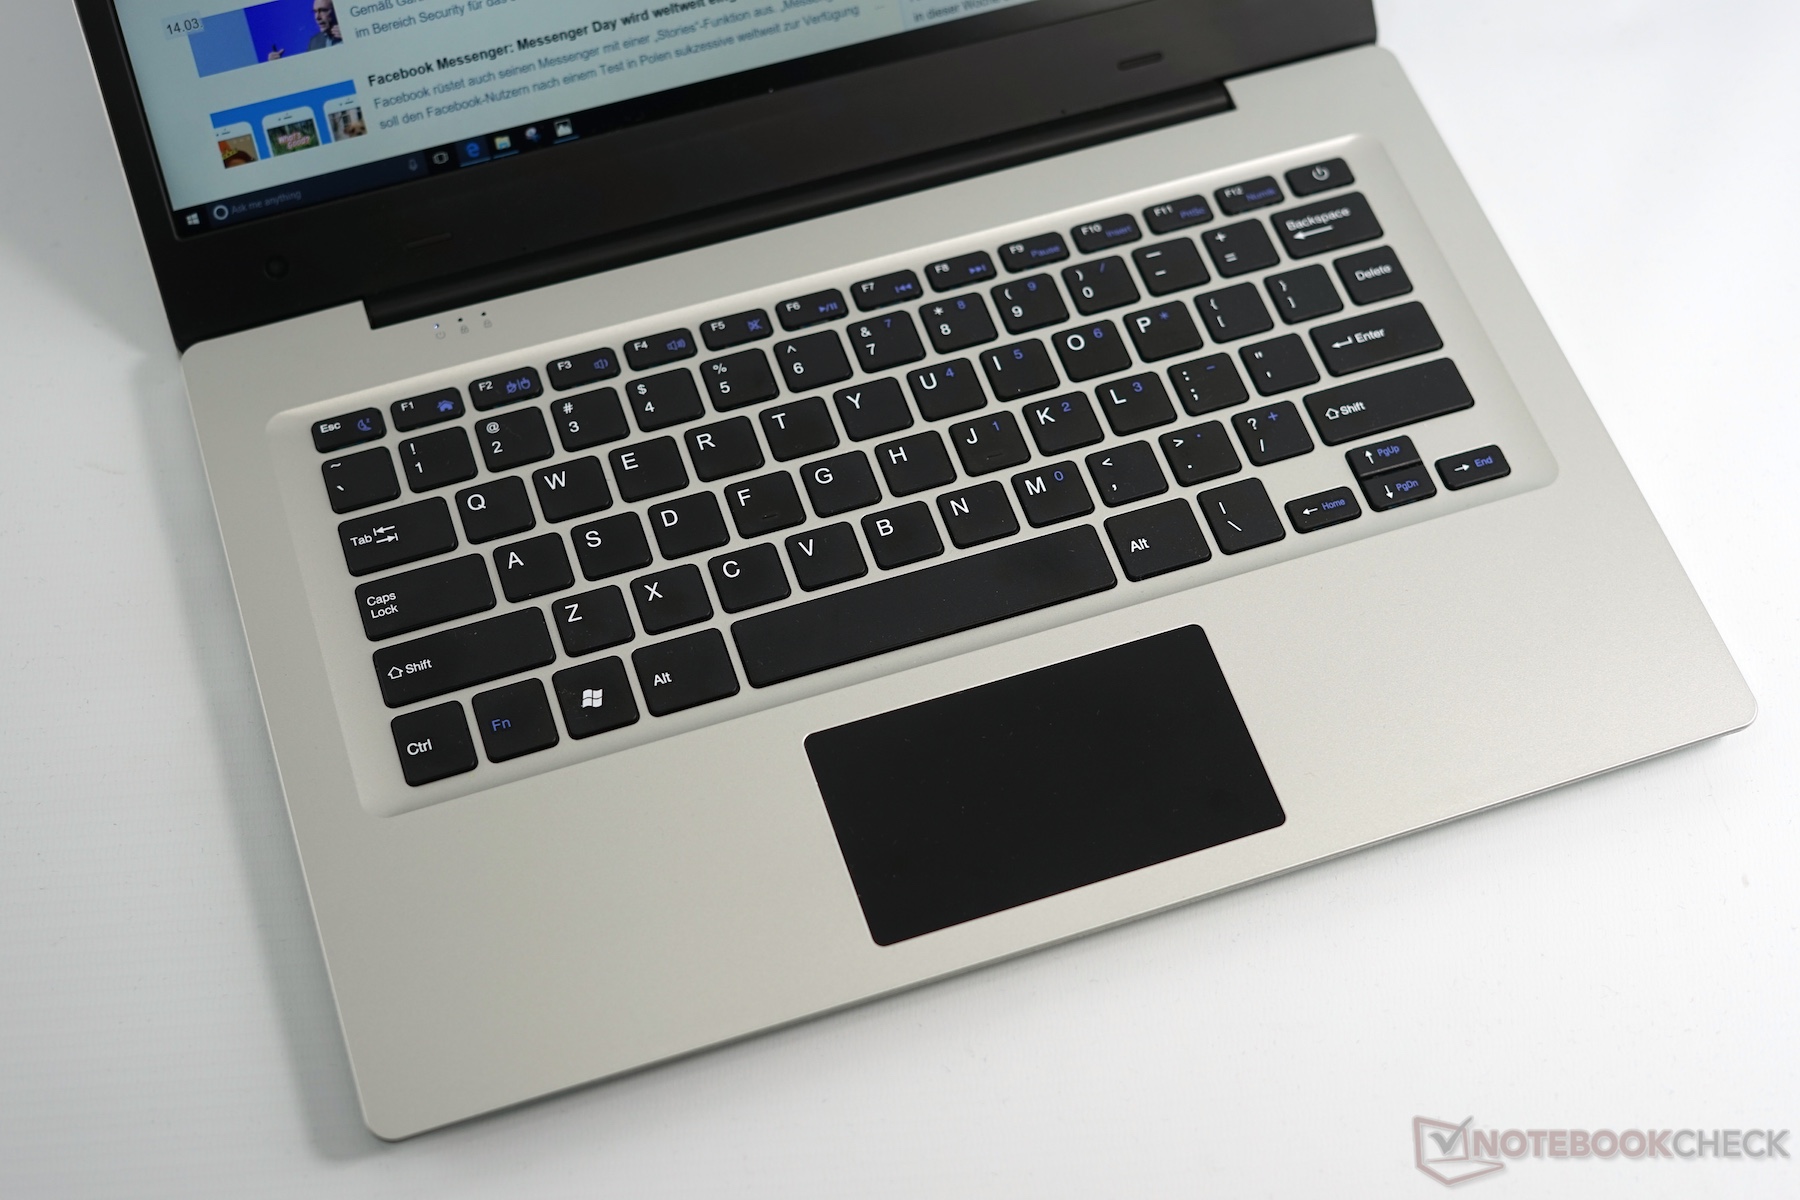
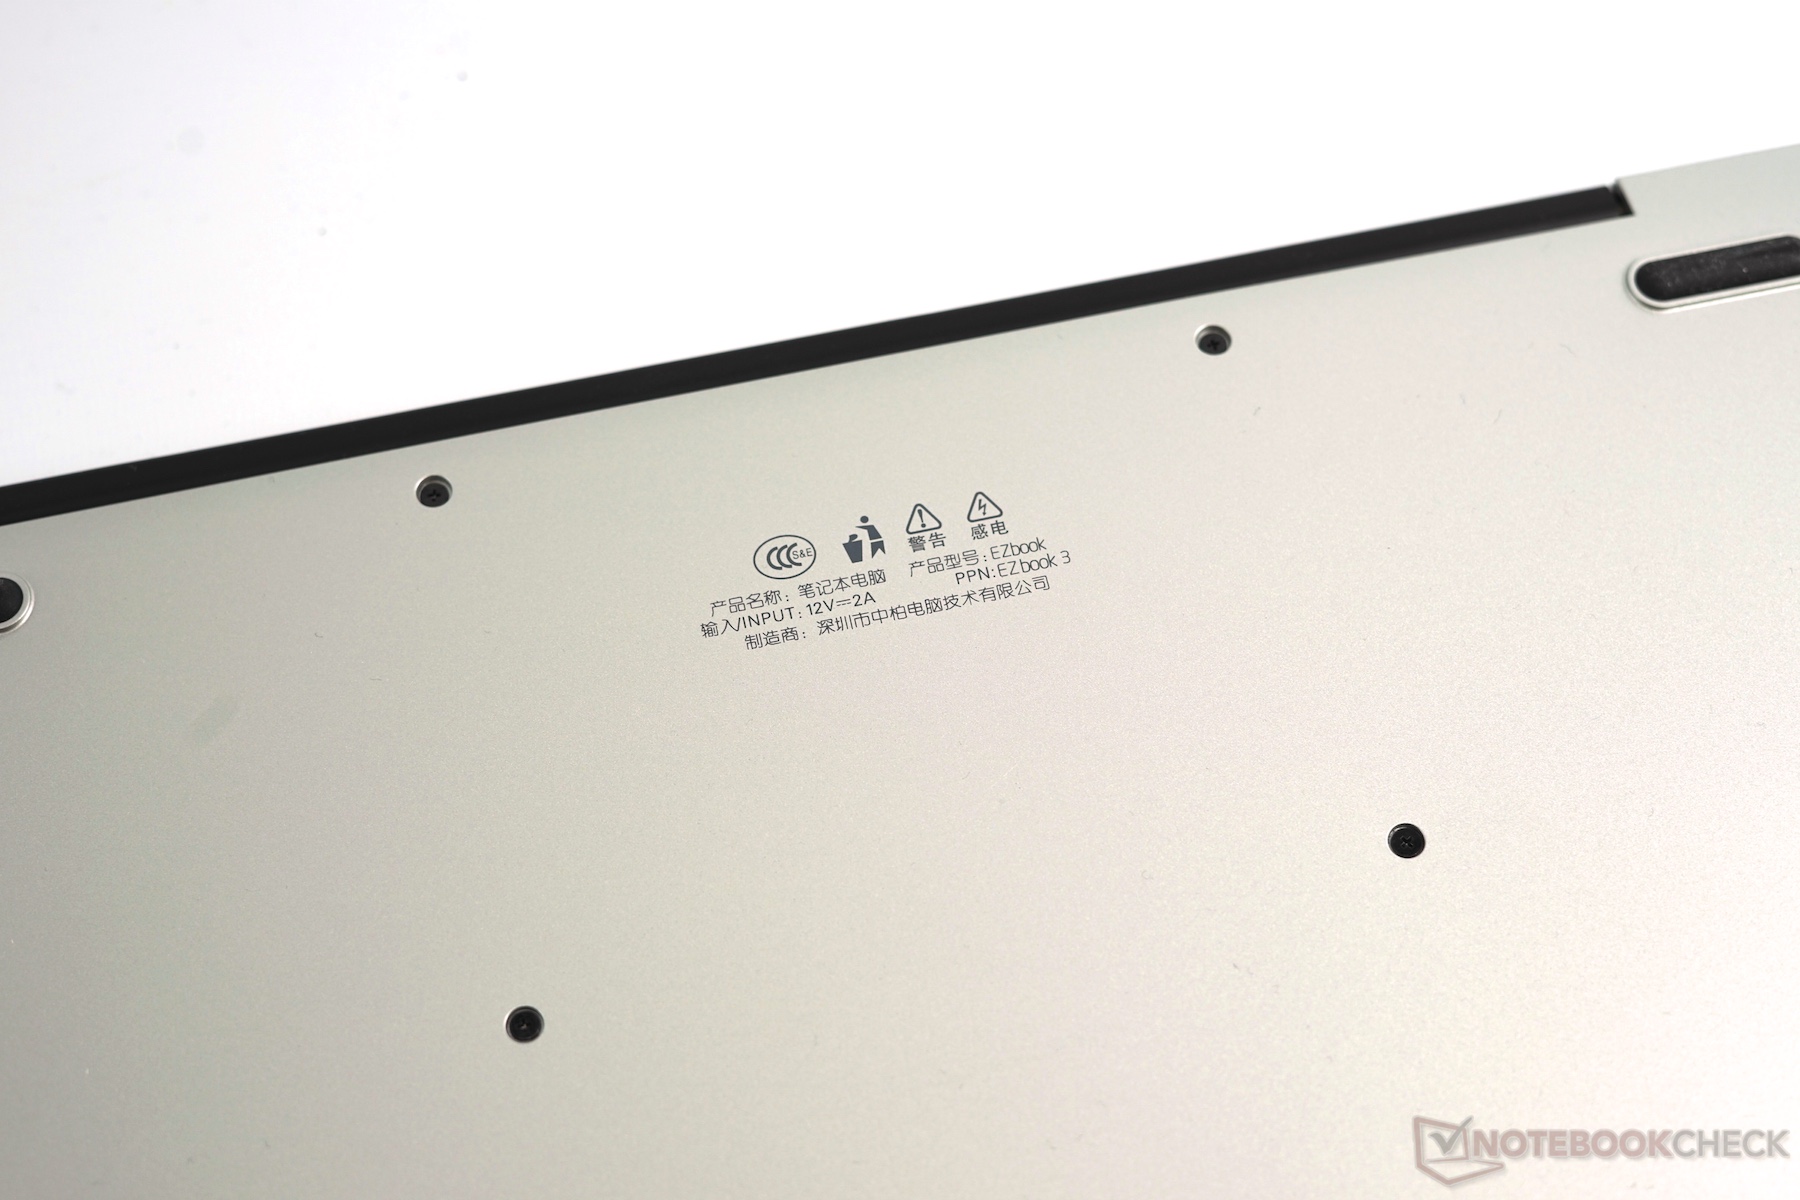
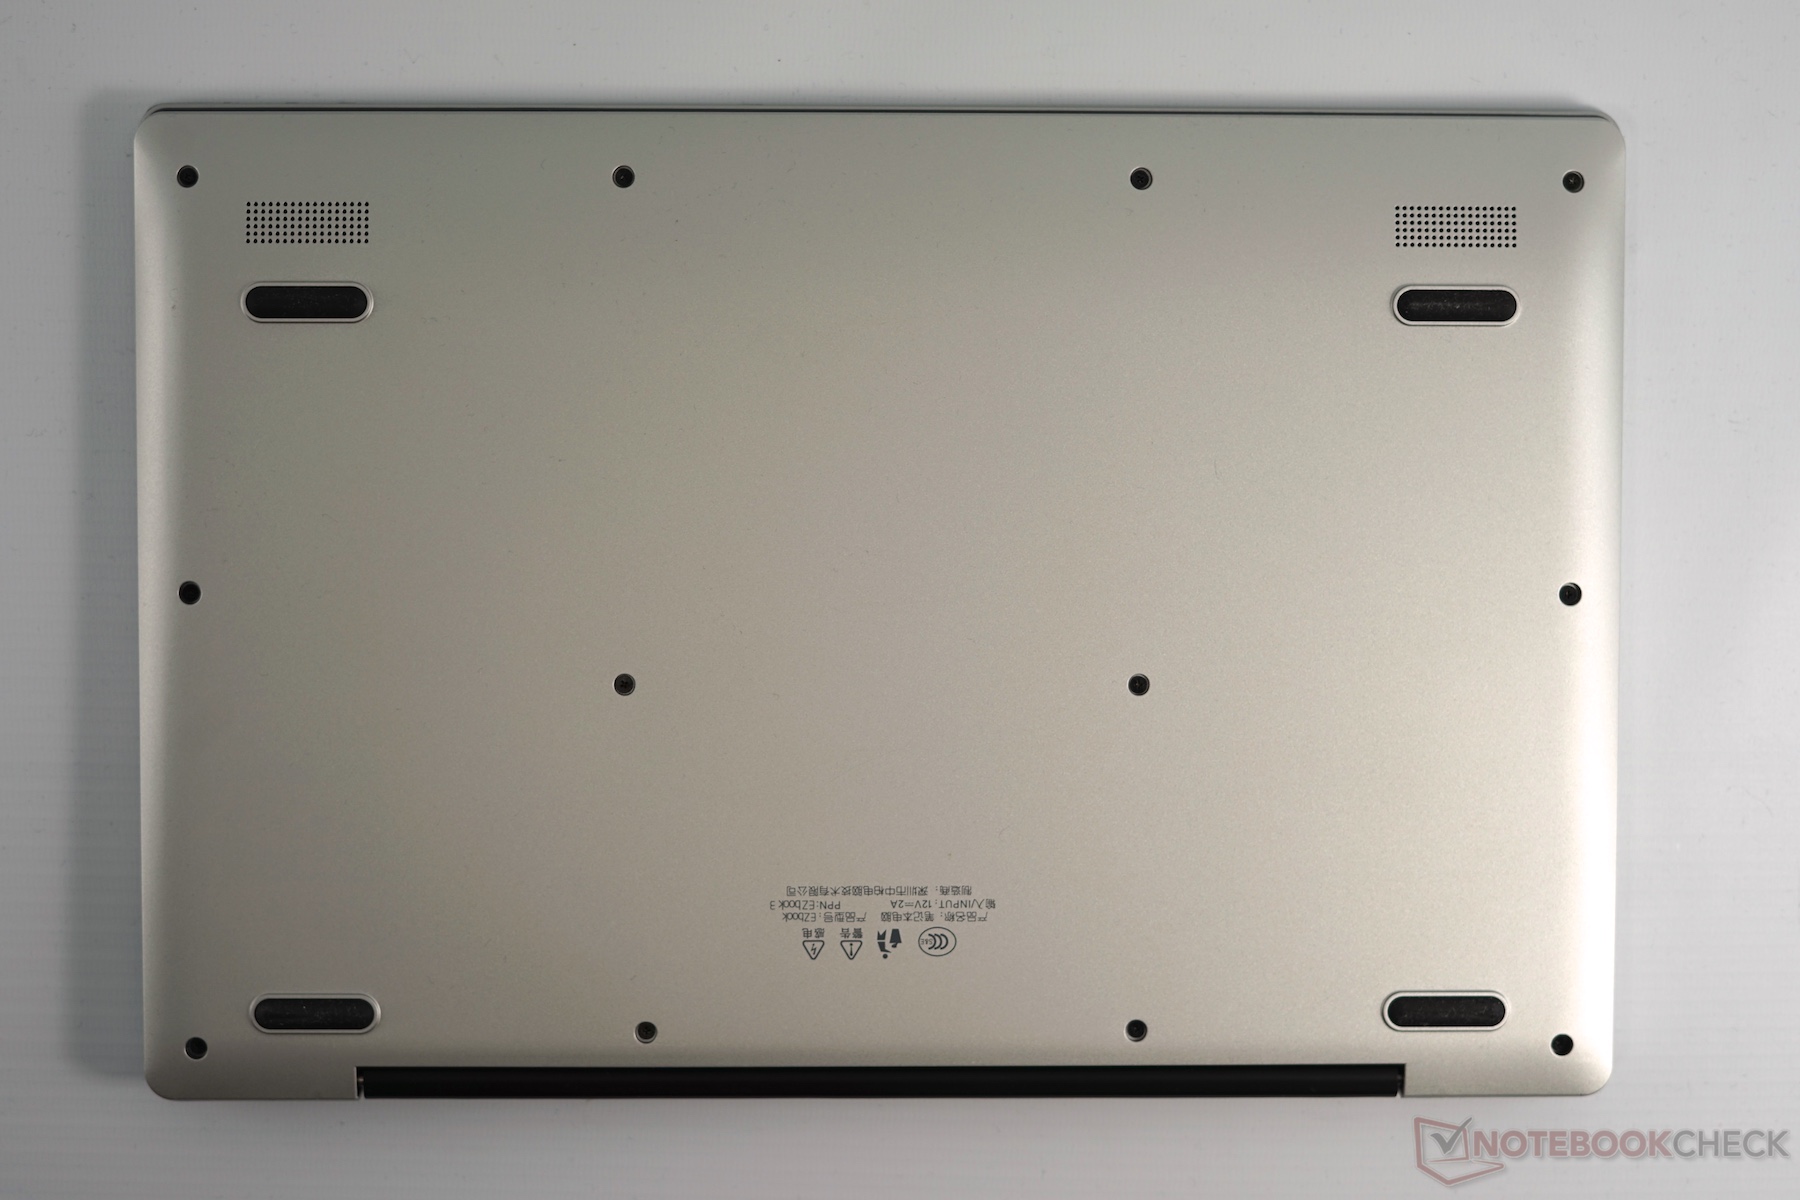
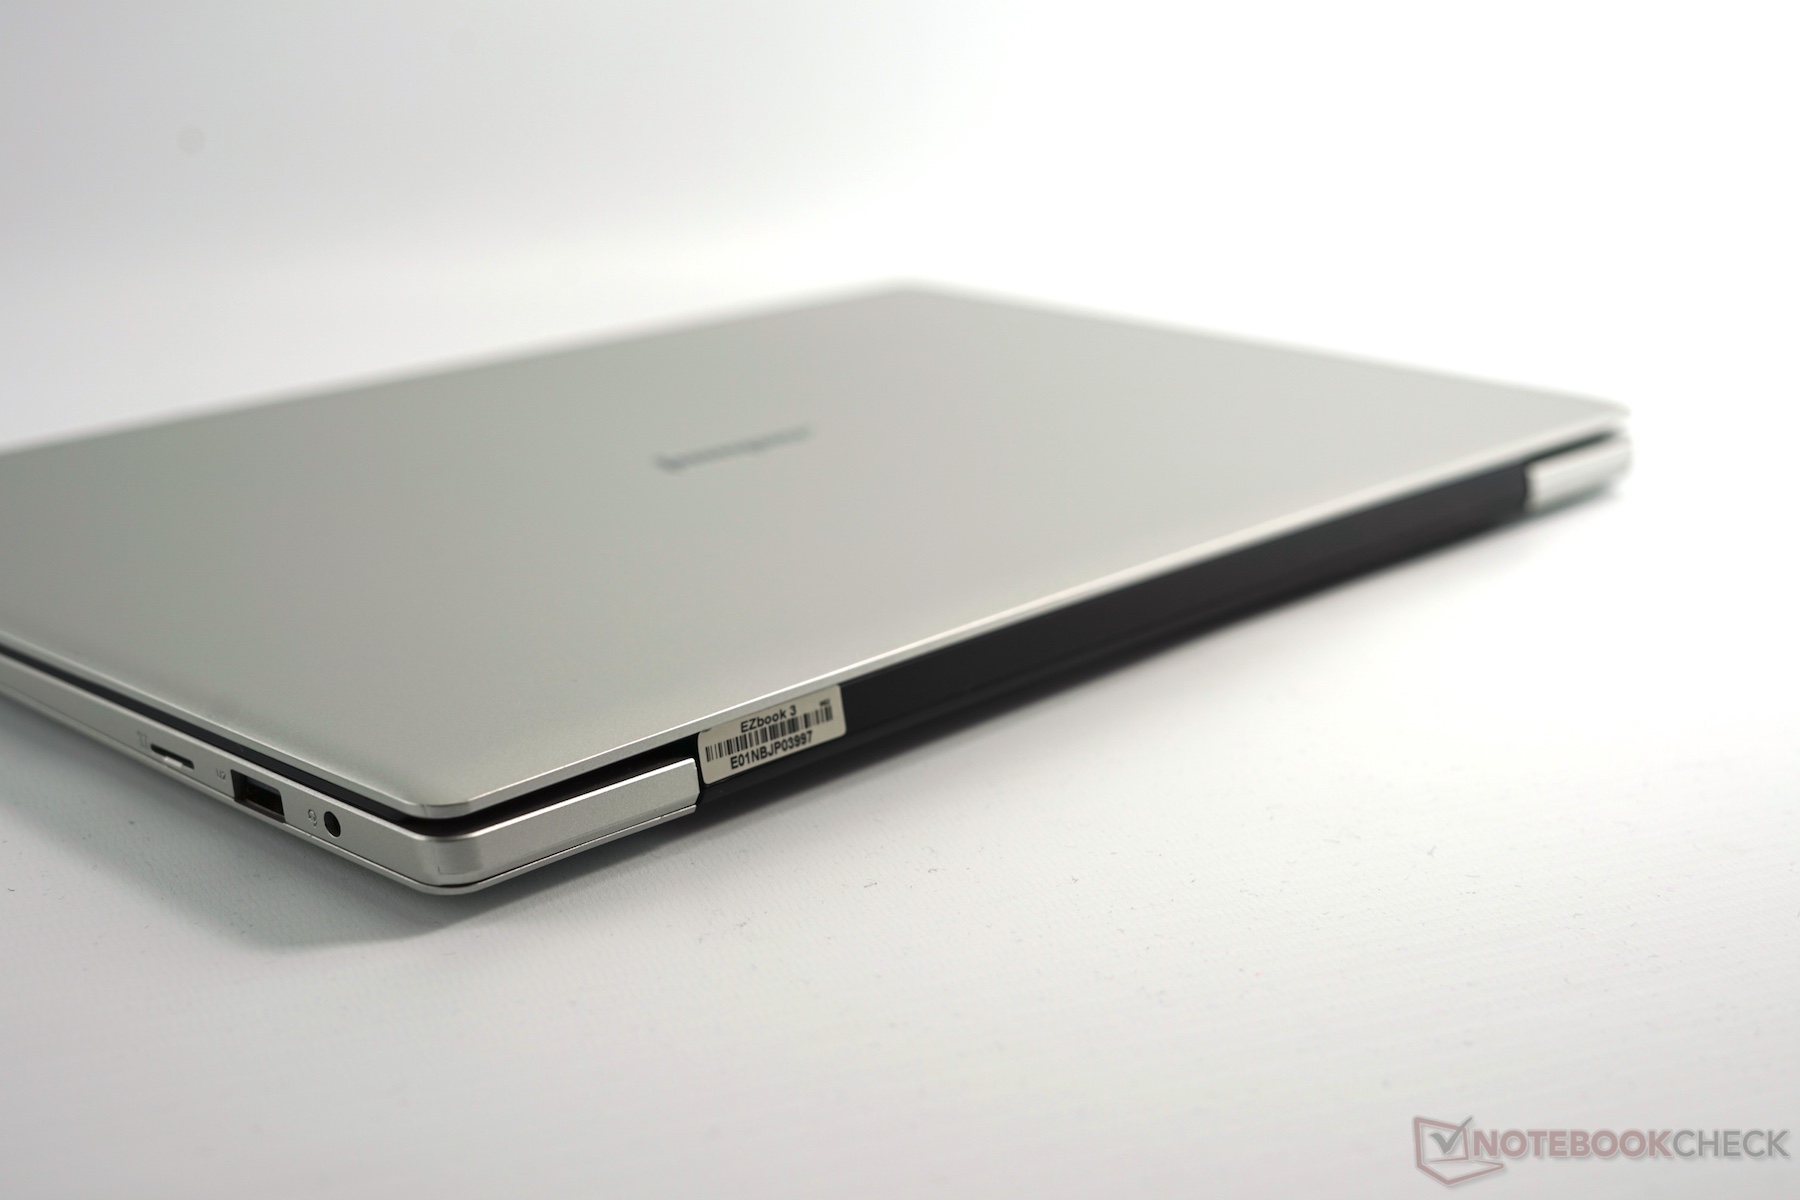
EZBook 3是一台廉价的轻盈笔记本电脑,它搭配了明亮的雾面屏幕,无噪音(被动式)散热系统,和时尚的外观。和其他同价位设备相似,它也需要在一些方面节省成本。这台设备的弱点包括:使用的机身材质一般,屏幕可视角度窄同时有200赫兹的闪烁,系统性能低,电池续航也不算优秀。尽管它的触控版都和它模仿的对象相去甚远,但可以满足偶尔的工作需要。类似于其他很多中国厂商的设备,EZBook 3目前没有得到CE认证,因此它的质保根据购买店铺的情况不同而会有所不同。同时生产商也没有提供驱动支持。不过,英特尔显卡的驱动可以直接从官网找到。
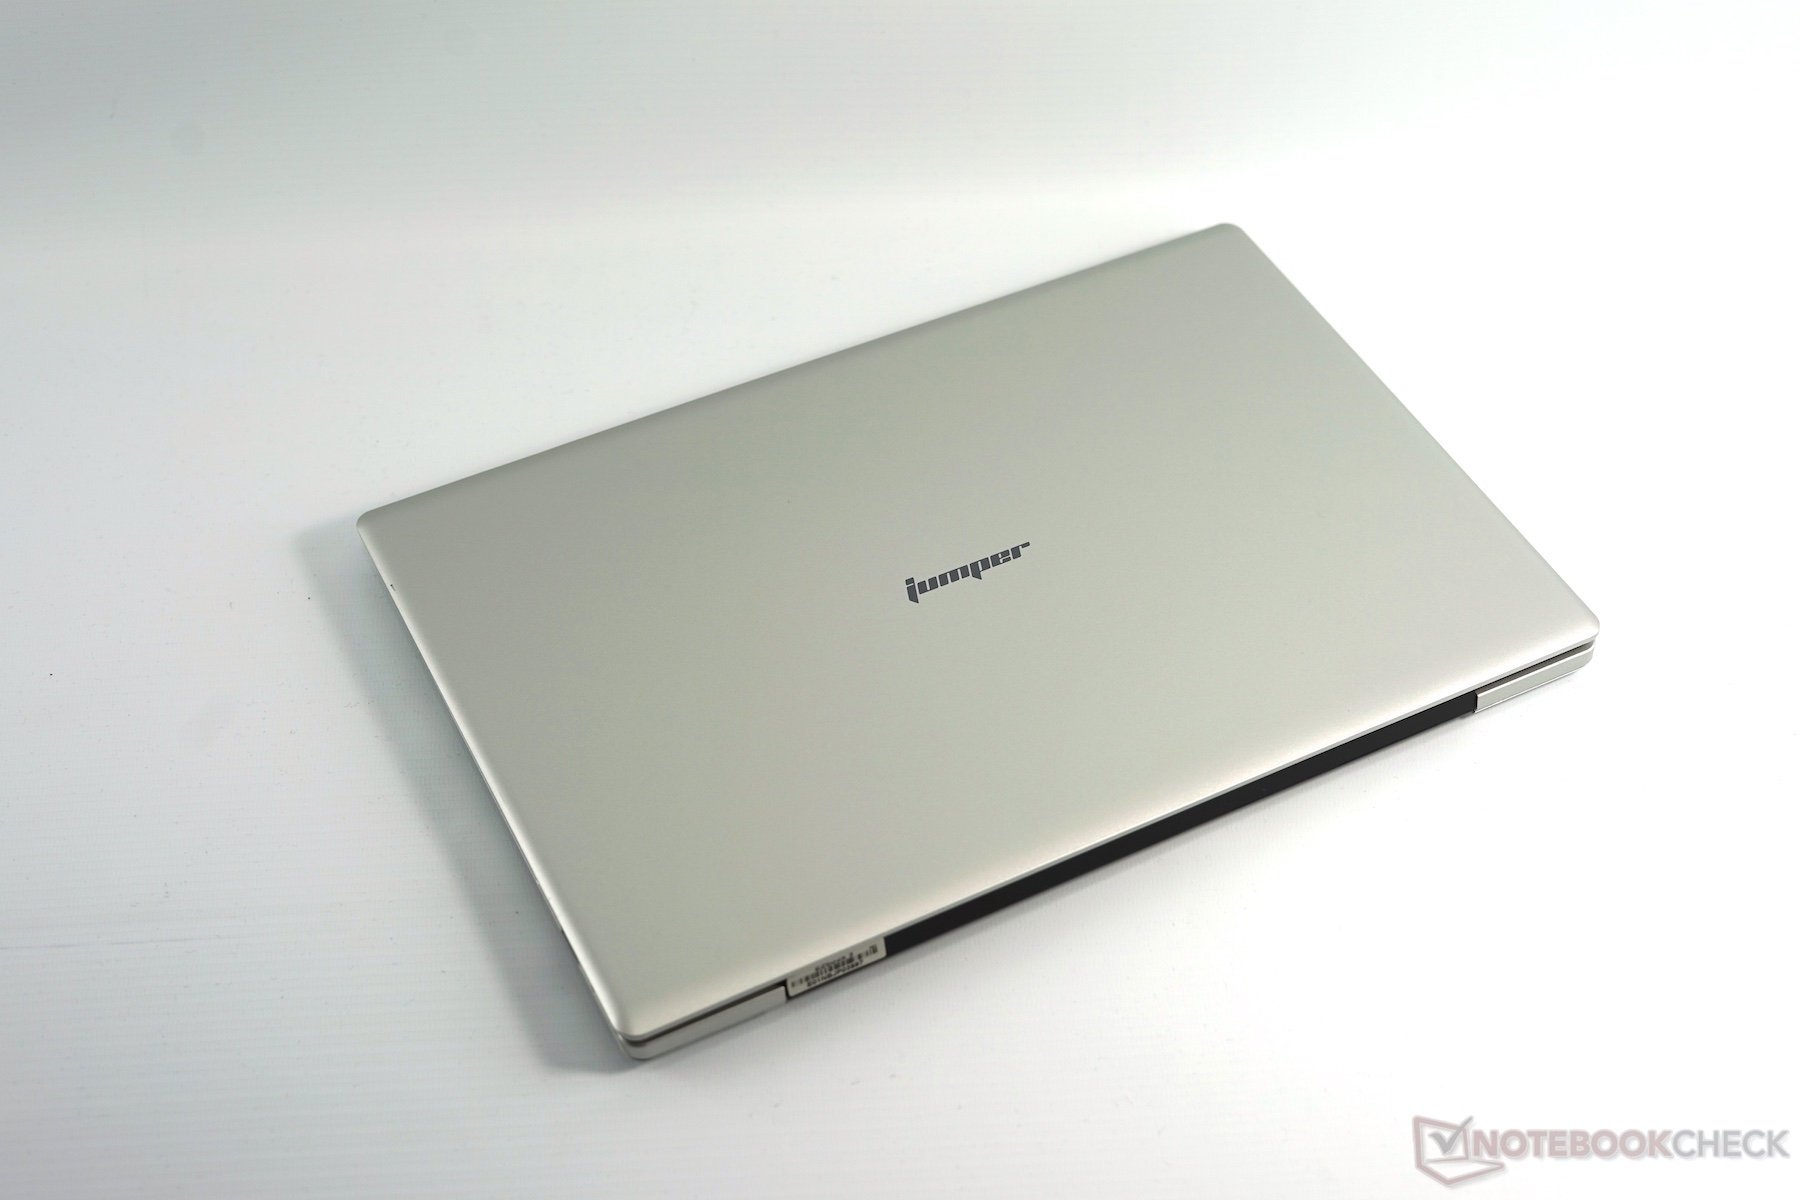
银色的Jumper EZBook 3目前在Gearbest售价194.25欧元欧洲仓库有货(建议零售价343欧元,约2518人民币)。它的实惠价位可能对能够接受我们所提到的缺点的用户十分有吸引力。
注:本文是基于完整评测的缩减版本,阅读完整的英文评测,请点击这里。
Jumper EZbook 3
- 03/24/2017 v6 (old)
Klaus Hinum