华硕 Transformer Book T302CA-FL010T 变形本简短评测


| SD Card Reader | |
| maximum SDCardreader Maximum Transfer Rate | |
| average SDCardreader Average Transfer Rate |
| Networking | |
| iperf Server (receive) TCP 1 m | |
| Asus TransformerBook T302CA-FL010T | |
| Huawei MateBook m5-6Y54 | |
| HP Spectre x2 12-a001ng | |
| iperf Client (transmit) TCP 1 m | |
| Asus TransformerBook T302CA-FL010T | |
| Huawei MateBook m5-6Y54 | |
| HP Spectre x2 12-a001ng | |
| |||||||||||||||||||||||||
Brightness Distribution: 88 %
Center on Battery: 379 cd/m²
Contrast: 1184:1 (Black: 0.32 cd/m²)
ΔE ColorChecker Calman: 4.78 | ∀{0.5-29.43 Ø4.71}
ΔE Greyscale Calman: 4.27 | ∀{0.09-98 Ø4.96}
65% sRGB (Argyll 1.6.3 3D)
42% AdobeRGB 1998 (Argyll 1.6.3 3D)
45.38% AdobeRGB 1998 (Argyll 3D)
65.7% sRGB (Argyll 3D)
43.9% Display P3 (Argyll 3D)
Gamma: 2.34
CCT: 7376 K
| Asus TransformerBook T302CA-FL010T AU Optronics AUO106D B125HANO1.0, , 1920x1080, 12.5" | HP Pavilion x2 12-b000ng LG Philips LGD04A5, , 1920x1280, 12" | HP Spectre x2 12-a001ng LGD04A5, , 1920x1280, 12" | Acer Aspire Switch 12S SW7-272-M3A0 AU Optronics B125HAN01.0, , 1920x1080, 12.5" | Asus Transformer Book T300 Chi Sharp, ID: SHP142C, Monitor name: LQ125T1JX03, , 2560x1440, 12.5" | Huawei MateBook m5-6Y54 TMA 1200 Unknown Vendor, , 2160x1440, 12" | |
|---|---|---|---|---|---|---|
| Display | 16% | 15% | -2% | 64% | 48% | |
| Display P3 Coverage (%) | 43.9 | 53.2 21% | 52.9 21% | 43.2 -2% | 77.4 76% | 65.8 50% |
| sRGB Coverage (%) | 65.7 | 72.4 10% | 71.8 9% | 64 -3% | 97.5 48% | 96.2 46% |
| AdobeRGB 1998 Coverage (%) | 45.38 | 52.9 17% | 52.6 16% | 44.63 -2% | 75.8 67% | 66.8 47% |
| Response Times | -39% | -57% | 8% | 11% | ||
| Response Time Grey 50% / Grey 80% * (ms) | 28 ? | 38 ? -36% | 51 ? -82% | 25 ? 11% | 25 ? 11% | |
| Response Time Black / White * (ms) | 19 ? | 27 ? -42% | 25 ? -32% | 18 ? 5% | 17 ? 11% | |
| PWM Frequency (Hz) | ||||||
| Screen | -20% | -15% | 2% | 5% | -21% | |
| Brightness middle (cd/m²) | 379 | 314 -17% | 353 -7% | 383 1% | 368.1 -3% | 451 19% |
| Brightness (cd/m²) | 364 | 308 -15% | 347 -5% | 378 4% | 375 3% | 425 17% |
| Brightness Distribution (%) | 88 | 93 6% | 91 3% | 92 5% | 92 5% | 80 -9% |
| Black Level * (cd/m²) | 0.32 | 0.48 -50% | 0.44 -38% | 0.34 -6% | 0.458 -43% | 0.37 -16% |
| Contrast (:1) | 1184 | 654 -45% | 802 -32% | 1126 -5% | 804 -32% | 1219 3% |
| Colorchecker dE 2000 * | 4.78 | 6.12 -28% | 6.09 -27% | 4.8 -0% | 4.36 9% | 11.04 -131% |
| Colorchecker dE 2000 max. * | 8.28 | 10.92 -32% | 8.77 -6% | 14.92 -80% | ||
| Greyscale dE 2000 * | 4.27 | 6.1 -43% | 6.24 -46% | 2.8 34% | 2.63 38% | 10.45 -145% |
| Gamma | 2.34 94% | 2.35 94% | 2.41 91% | 2.25 98% | 2.08 106% | 2 110% |
| CCT | 7376 88% | 7391 88% | 7238 90% | 6676 97% | 6743 96% | 8849 73% |
| Color Space (Percent of AdobeRGB 1998) (%) | 42 | 46.81 11% | 46 10% | 41 -2% | 66.94 59% | 74 76% |
| Color Space (Percent of sRGB) (%) | 65 | 71.74 10% | 71 9% | 64 -2% | 100 54% | |
| Total Average (Program / Settings) | -14% /
-16% | -19% /
-14% | 3% /
2% | 35% /
21% | 13% /
-3% |
* ... smaller is better
Display Response Times
| ↔ Response Time Black to White | ||
|---|---|---|
| 19 ms ... rise ↗ and fall ↘ combined | ↗ 5 ms rise | |
| ↘ 14 ms fall | ||
| The screen shows good response rates in our tests, but may be too slow for competitive gamers. In comparison, all tested devices range from 0.1 (minimum) to 240 (maximum) ms. » 42 % of all devices are better. This means that the measured response time is similar to the average of all tested devices (19.8 ms). | ||
| ↔ Response Time 50% Grey to 80% Grey | ||
| 28 ms ... rise ↗ and fall ↘ combined | ↗ 9 ms rise | |
| ↘ 19 ms fall | ||
| The screen shows relatively slow response rates in our tests and may be too slow for gamers. In comparison, all tested devices range from 0.165 (minimum) to 636 (maximum) ms. » 38 % of all devices are better. This means that the measured response time is similar to the average of all tested devices (31 ms). | ||
Screen Flickering / PWM (Pulse-Width Modulation)
| Screen flickering / PWM not detected | ||
In comparison: 52 % of all tested devices do not use PWM to dim the display. If PWM was detected, an average of 7754 (minimum: 5 - maximum: 343500) Hz was measured. | ||
| PCMark 8 Home Score Accelerated v2 | 2767 points | |
| PCMark 8 Creative Score Accelerated v2 | 3149 points | |
| PCMark 8 Work Score Accelerated v2 | 3699 points | |
Help | ||
| Asus TransformerBook T302CA-FL010T Samsung CM871 MZNLF128HCHP | HP Pavilion x2 12-b000ng SanDisk Z400s SD8SNAT-128G | Huawei MateBook m5-6Y54 SanDisk SD8SN8U256G1027 | HP Spectre x2 12-a001ng Liteon L8H-256V2G | Acer Aspire Switch 12S SW7-272-M3A0 Lite-On CV1-8B128 | Asus Transformer Book T300 Chi SanDisk SSD i110 128GB | |
|---|---|---|---|---|---|---|
| CrystalDiskMark 3.0 | 219% | 326% | 293% | 130% | -5% | |
| Read Seq (MB/s) | 428 | 477.3 12% | 512 20% | 517 21% | 445.2 4% | 453.6 6% |
| Write Seq (MB/s) | 124.2 | 184.3 48% | 462.1 272% | 270.1 117% | 179.9 45% | 217.3 75% |
| Read 512 (MB/s) | 283.9 | 226.2 -20% | 376 32% | 369.2 30% | 330.6 16% | 245.2 -14% |
| Write 512 (MB/s) | 41.49 | 176.2 325% | 295.2 611% | 264.6 538% | 181.6 338% | 25.57 -38% |
| Read 4k (MB/s) | 15.95 | 21.12 32% | 31.83 100% | 23.48 47% | 12.17 -24% | 12.35 -23% |
| Write 4k (MB/s) | 14.67 | 57.9 295% | 64.5 340% | 57.4 291% | 19.09 30% | 16.23 11% |
| Read 4k QD32 (MB/s) | 98.9 | 136.4 38% | 269.6 173% | 223.4 126% | 137.9 39% | 32.06 -68% |
| Write 4k QD32 (MB/s) | 15.41 | 173.2 1024% | 178.2 1056% | 195.8 1171% | 106.5 591% | 16.83 9% |

| 3DMark - 1280x720 Cloud Gate Standard Graphics | |
| HP Pavilion x2 12-b000ng | |
| Lenovo ThinkPad X1 Tablet | |
| Huawei MateBook m5-6Y54 | |
| Asus TransformerBook T302CA-FL010T | |
| Acer Aspire Switch 12S SW7-272-M3A0 | |
| 3DMark 11 Performance | 1084 points | |
| 3DMark Cloud Gate Standard Score | 3923 points | |
Help | ||
| Tomb Raider | |
| 1024x768 Low Preset | |
| Asus TransformerBook T302CA-FL010T | |
| Acer Aspire Switch 12S SW7-272-M3A0 | |
| 1366x768 Normal Preset AA:FX AF:4x | |
| Asus TransformerBook T302CA-FL010T | |
| Acer Aspire Switch 12S SW7-272-M3A0 | |
| BioShock Infinite | |
| 1280x720 Very Low Preset | |
| HP Pavilion x2 12-b000ng | |
| Asus TransformerBook T302CA-FL010T | |
| Huawei MateBook m5-6Y54 | |
| Acer Aspire Switch 12S SW7-272-M3A0 | |
| 1366x768 Medium Preset | |
| HP Pavilion x2 12-b000ng | |
| Huawei MateBook m5-6Y54 | |
| Asus TransformerBook T302CA-FL010T | |
| Acer Aspire Switch 12S SW7-272-M3A0 | |
| Battlefield 4 | |
| 1024x768 Low Preset | |
| HP Pavilion x2 12-b000ng | |
| Asus TransformerBook T302CA-FL010T | |
| Acer Aspire Switch 12S SW7-272-M3A0 | |
| 1366x768 Medium Preset | |
| HP Pavilion x2 12-b000ng | |
| Asus TransformerBook T302CA-FL010T | |
| Acer Aspire Switch 12S SW7-272-M3A0 | |
| low | med. | high | ultra | |
|---|---|---|---|---|
| Tomb Raider (2013) | 49.4 | 26 | 17.8 | 7.4 |
| BioShock Infinite (2013) | 38.9 | 20 | 15.9 | 4.9 |
| Battlefield 4 (2013) | 26.4 | 16 | 8.4 | 2.9 |
Noise level
| Idle |
| 31.6 / 31.6 / 31.6 dB(A) |
| Load |
| 31.6 / 31.6 dB(A) |
 | ||
30 dB silent 40 dB(A) audible 50 dB(A) loud |
||
min: | ||
(+) The maximum temperature on the upper side is 39.4 °C / 103 F, compared to the average of 35.4 °C / 96 F, ranging from 19.6 to 60 °C for the class Convertible.
(+) The bottom heats up to a maximum of 35.7 °C / 96 F, compared to the average of 36.9 °C / 98 F
(+) In idle usage, the average temperature for the upper side is 23.4 °C / 74 F, compared to the device average of 30.3 °C / 87 F.
(±) The palmrests and touchpad can get very hot to the touch with a maximum of 39.4 °C / 102.9 F.
(-) The average temperature of the palmrest area of similar devices was 28 °C / 82.4 F (-11.4 °C / -20.5 F).
Asus TransformerBook T302CA-FL010T audio analysis
(-) | not very loud speakers (66 dB)
Bass 100 - 315 Hz
(±) | reduced bass - on average 10.7% lower than median
(±) | linearity of bass is average (7.4% delta to prev. frequency)
Mids 400 - 2000 Hz
(+) | balanced mids - only 3.1% away from median
(+) | mids are linear (6.2% delta to prev. frequency)
Highs 2 - 16 kHz
(±) | higher highs - on average 6.7% higher than median
(±) | linearity of highs is average (9.6% delta to prev. frequency)
Overall 100 - 16.000 Hz
(±) | linearity of overall sound is average (19.7% difference to median)
Compared to same class
» 49% of all tested devices in this class were better, 6% similar, 45% worse
» The best had a delta of 6%, average was 20%, worst was 57%
Compared to all devices tested
» 50% of all tested devices were better, 7% similar, 43% worse
» The best had a delta of 4%, average was 23%, worst was 134%
Apple MacBook 12 (Early 2016) 1.1 GHz audio analysis
(+) | speakers can play relatively loud (83.6 dB)
Bass 100 - 315 Hz
(±) | reduced bass - on average 11.3% lower than median
(±) | linearity of bass is average (14.2% delta to prev. frequency)
Mids 400 - 2000 Hz
(+) | balanced mids - only 2.4% away from median
(+) | mids are linear (5.5% delta to prev. frequency)
Highs 2 - 16 kHz
(+) | balanced highs - only 2% away from median
(+) | highs are linear (4.5% delta to prev. frequency)
Overall 100 - 16.000 Hz
(+) | overall sound is linear (10.2% difference to median)
Compared to same class
» 7% of all tested devices in this class were better, 2% similar, 90% worse
» The best had a delta of 5%, average was 18%, worst was 53%
Compared to all devices tested
» 5% of all tested devices were better, 1% similar, 94% worse
» The best had a delta of 4%, average was 23%, worst was 134%
| Off / Standby | |
| Idle | |
| Load |
|
Key:
min: | |
| Asus TransformerBook T302CA-FL010T 6Y30, HD Graphics 515, Samsung CM871 MZNLF128HCHP, IPS, 1920x1080, 12.5" | HP Pavilion x2 12-b000ng 6Y30, HD Graphics 515, SanDisk Z400s SD8SNAT-128G, IPS, 1920x1280, 12" | Huawei MateBook m5-6Y54 6Y54, HD Graphics 515, SanDisk SD8SN8U256G1027, IPS, 2160x1440, 12" | HP Spectre x2 12-a001ng 6Y30, HD Graphics 515, Liteon L8H-256V2G, IPS, 1920x1280, 12" | Acer Aspire Switch 12S SW7-272-M3A0 6Y30, HD Graphics 515, Lite-On CV1-8B128, IPS, 1920x1080, 12.5" | Asus Transformer Book T300 Chi 5Y71, HD Graphics 5300, SanDisk SSD i110 128GB, IPS, 2560x1440, 12.5" | |
|---|---|---|---|---|---|---|
| Power Consumption | -20% | -40% | -29% | -32% | ||
| Idle Minimum * (Watt) | 3.7 | 5.3 -43% | 7.4 -100% | 6 -62% | 6.3 -70% | |
| Idle Average * (Watt) | 7.4 | 8.2 -11% | 11.6 -57% | 8 -8% | 9.4 -27% | |
| Idle Maximum * (Watt) | 8.2 | 9 -10% | 11.6 -41% | 10.6 -29% | 12.3 -50% | |
| Load Average * (Watt) | 17 | 20.7 -22% | 16.8 1% | 21.5 -26% | 18.6 -9% | |
| Load Maximum * (Watt) | 18.6 | 21.4 -15% | 19.1 -3% | 22 -18% | 19 -2% |
* ... smaller is better
| Asus TransformerBook T302CA-FL010T 6Y30, HD Graphics 515, 38 Wh | HP Pavilion x2 12-b000ng 6Y30, HD Graphics 515, 33 Wh | Huawei MateBook m5-6Y54 6Y54, HD Graphics 515, 33 Wh | HP Spectre x2 12-a001ng 6Y30, HD Graphics 515, 43 Wh | Acer Aspire Switch 12S SW7-272-M3A0 6Y30, HD Graphics 515, 34 Wh | Asus Transformer Book T300 Chi 5Y71, HD Graphics 5300, 32 Wh | |
|---|---|---|---|---|---|---|
| Battery runtime | -61% | -64% | -48% | -55% | -54% | |
| Reader / Idle (h) | 17.9 | 7.9 -56% | 8 -55% | 11.4 -36% | 8.8 -51% | 12 -33% |
| H.264 (h) | 11.6 | 5.2 -55% | 5.6 -52% | |||
| WiFi v1.3 (h) | 13.4 | 4.8 -64% | 4.4 -67% | 6.1 -54% | 5.7 -57% | 3.9 -71% |
| Load (h) | 6 | 1.8 -70% | 1.8 -70% | 2.7 -55% | 2.4 -60% | 2.5 -58% |
Pros
Cons
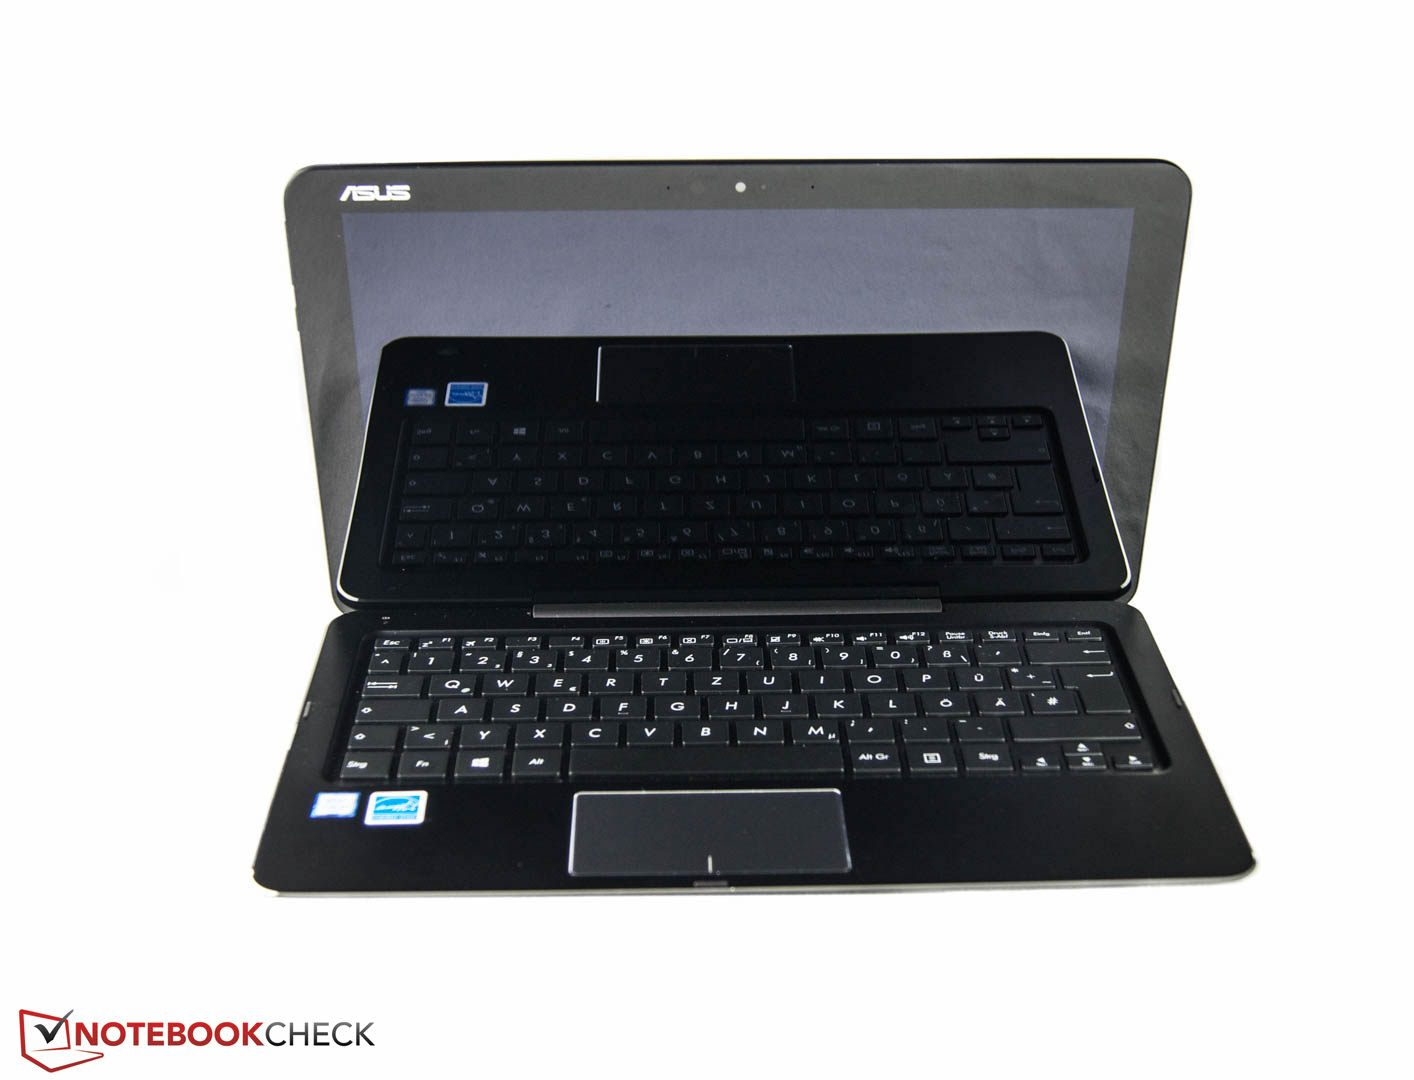
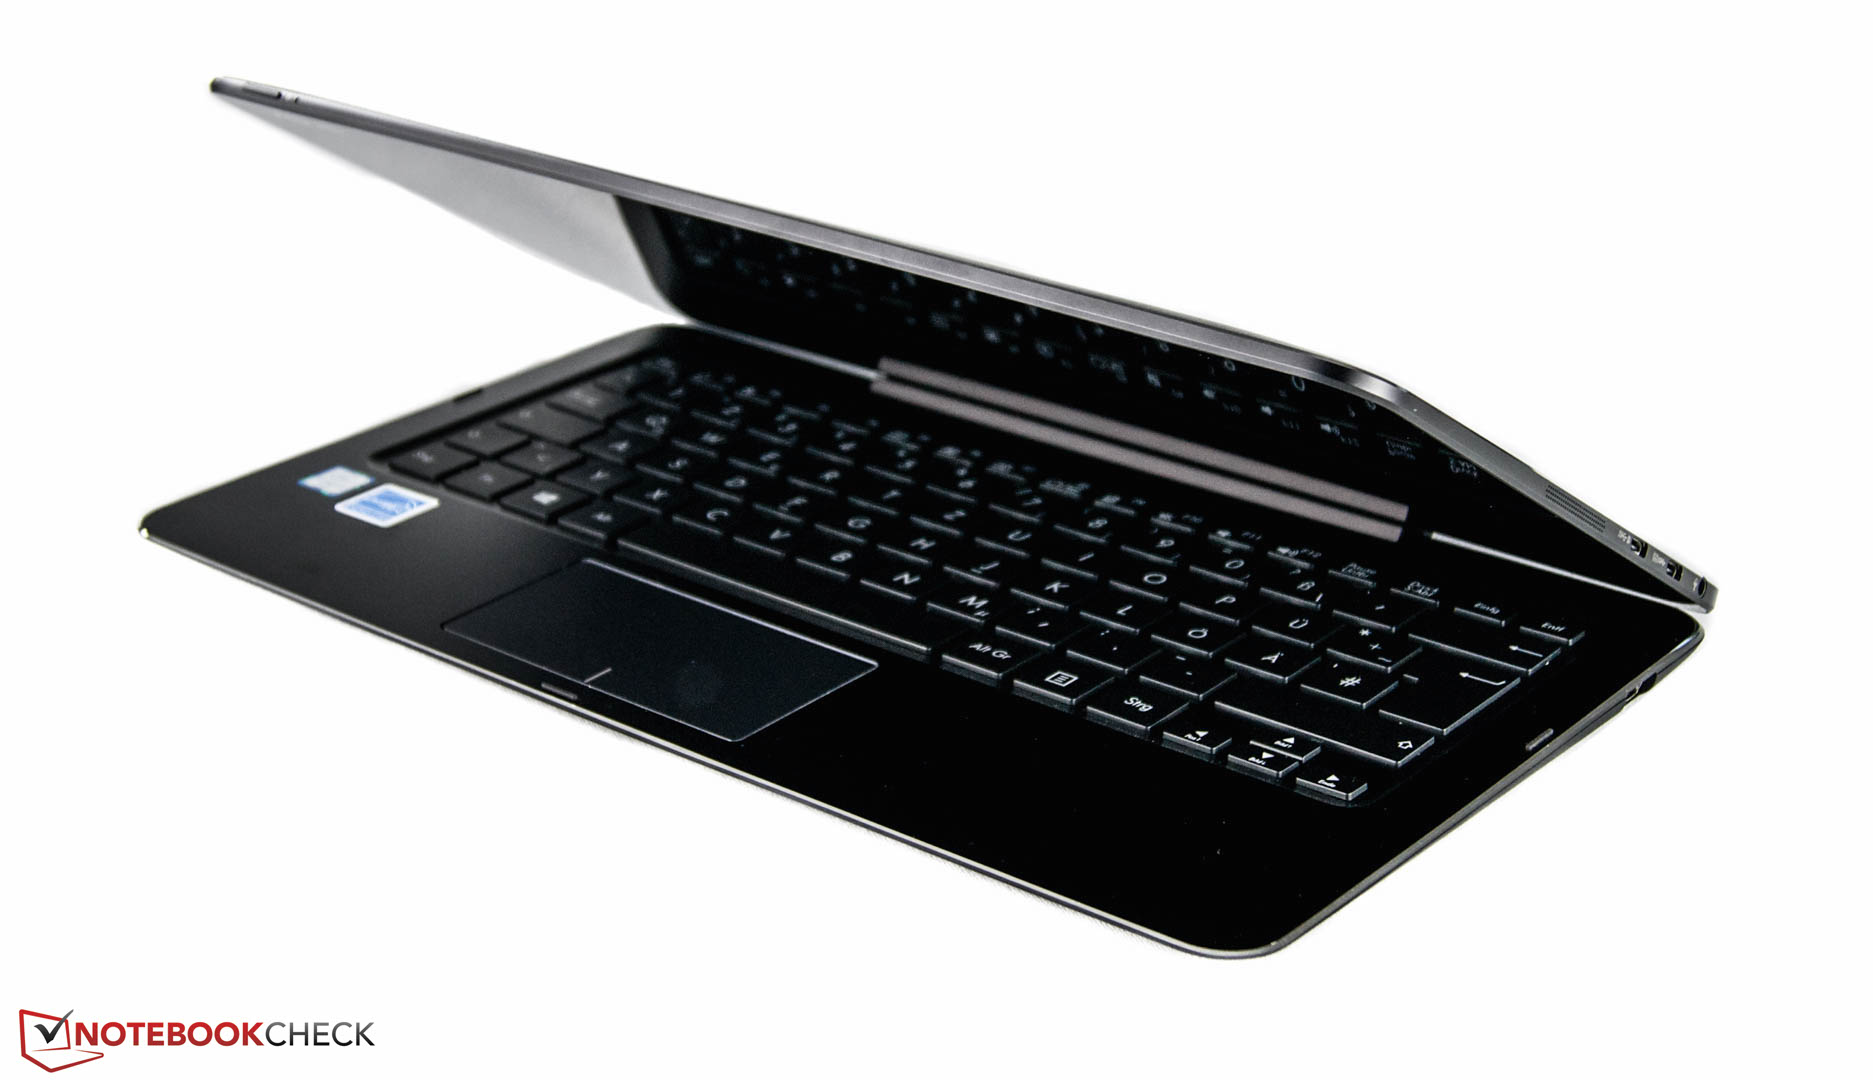
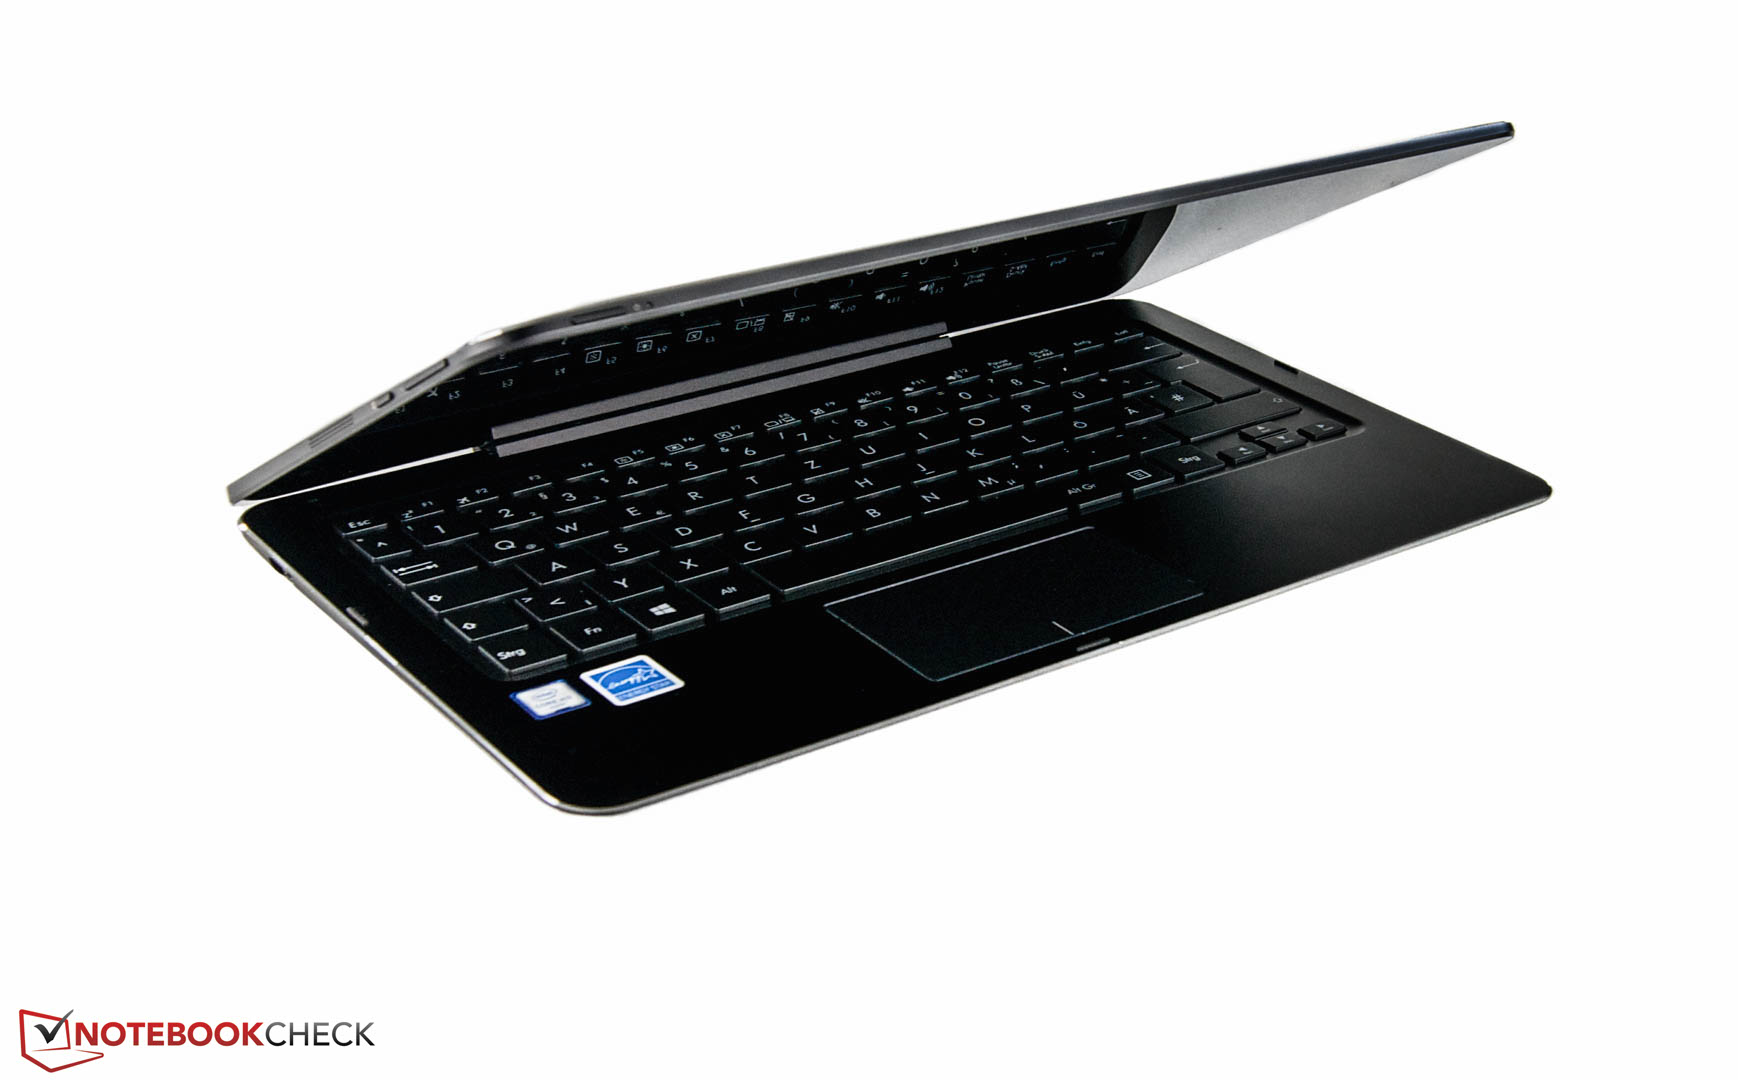
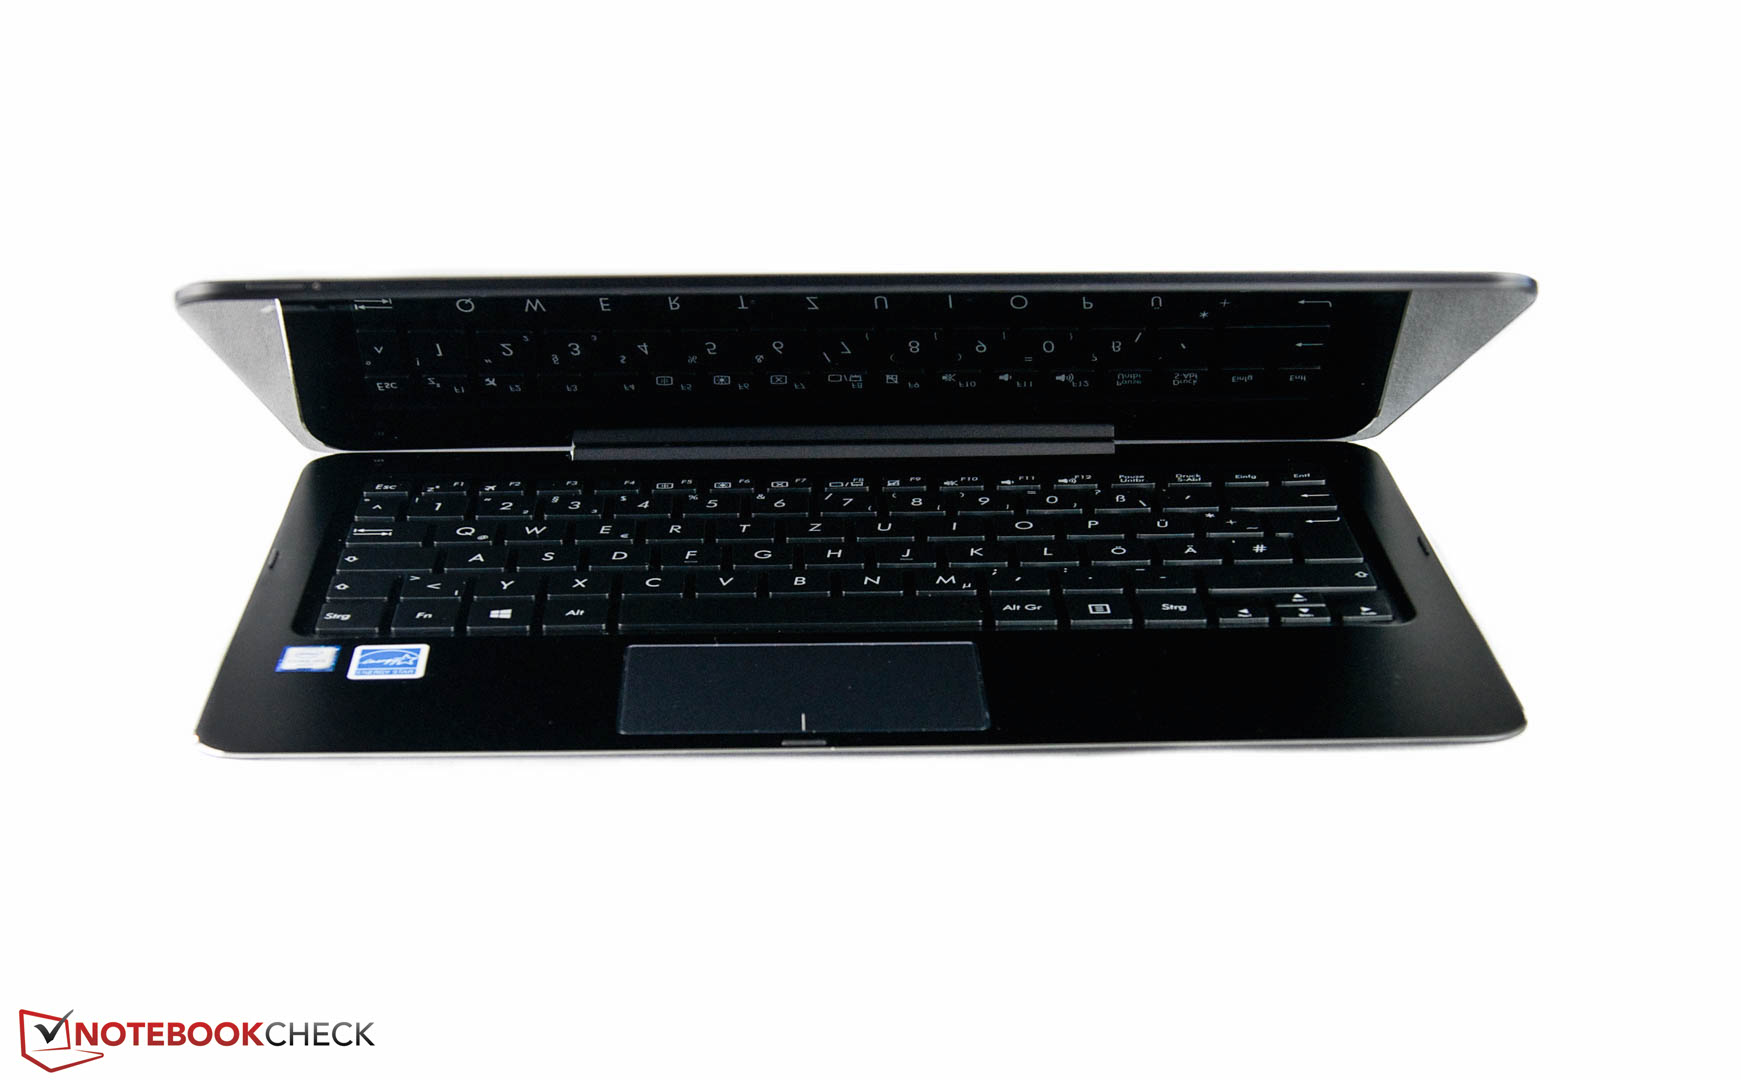
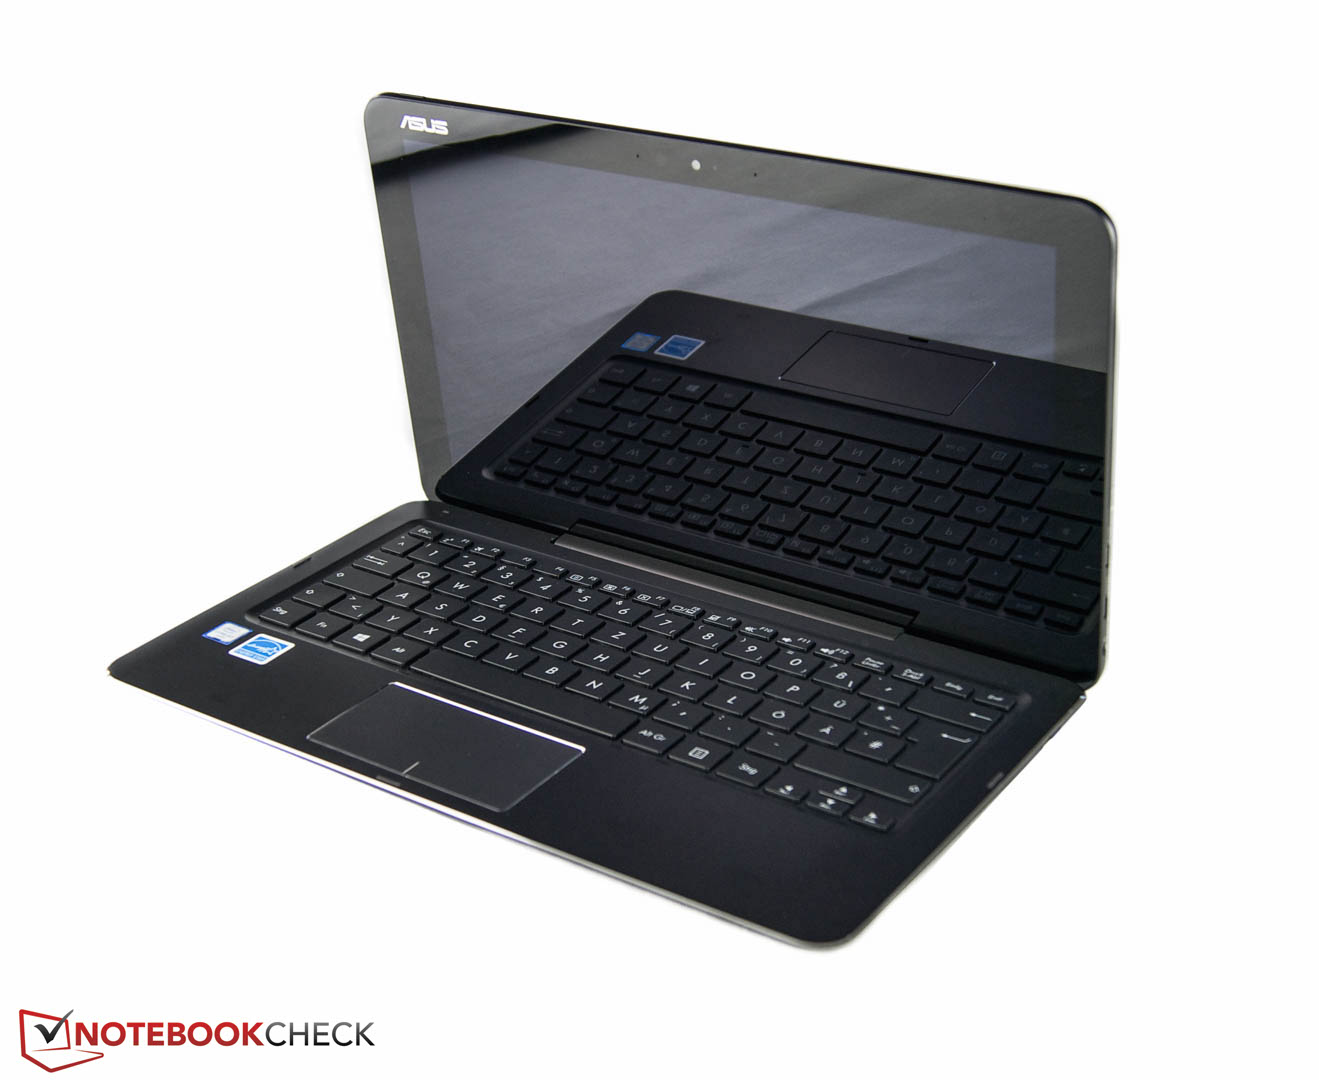
华硕推出了成熟的Transformer系列的新机型Transformer Book T302CA。它的主要变化在于更新到英特尔Skylake架构和键盘底座中增加的第二块电池。
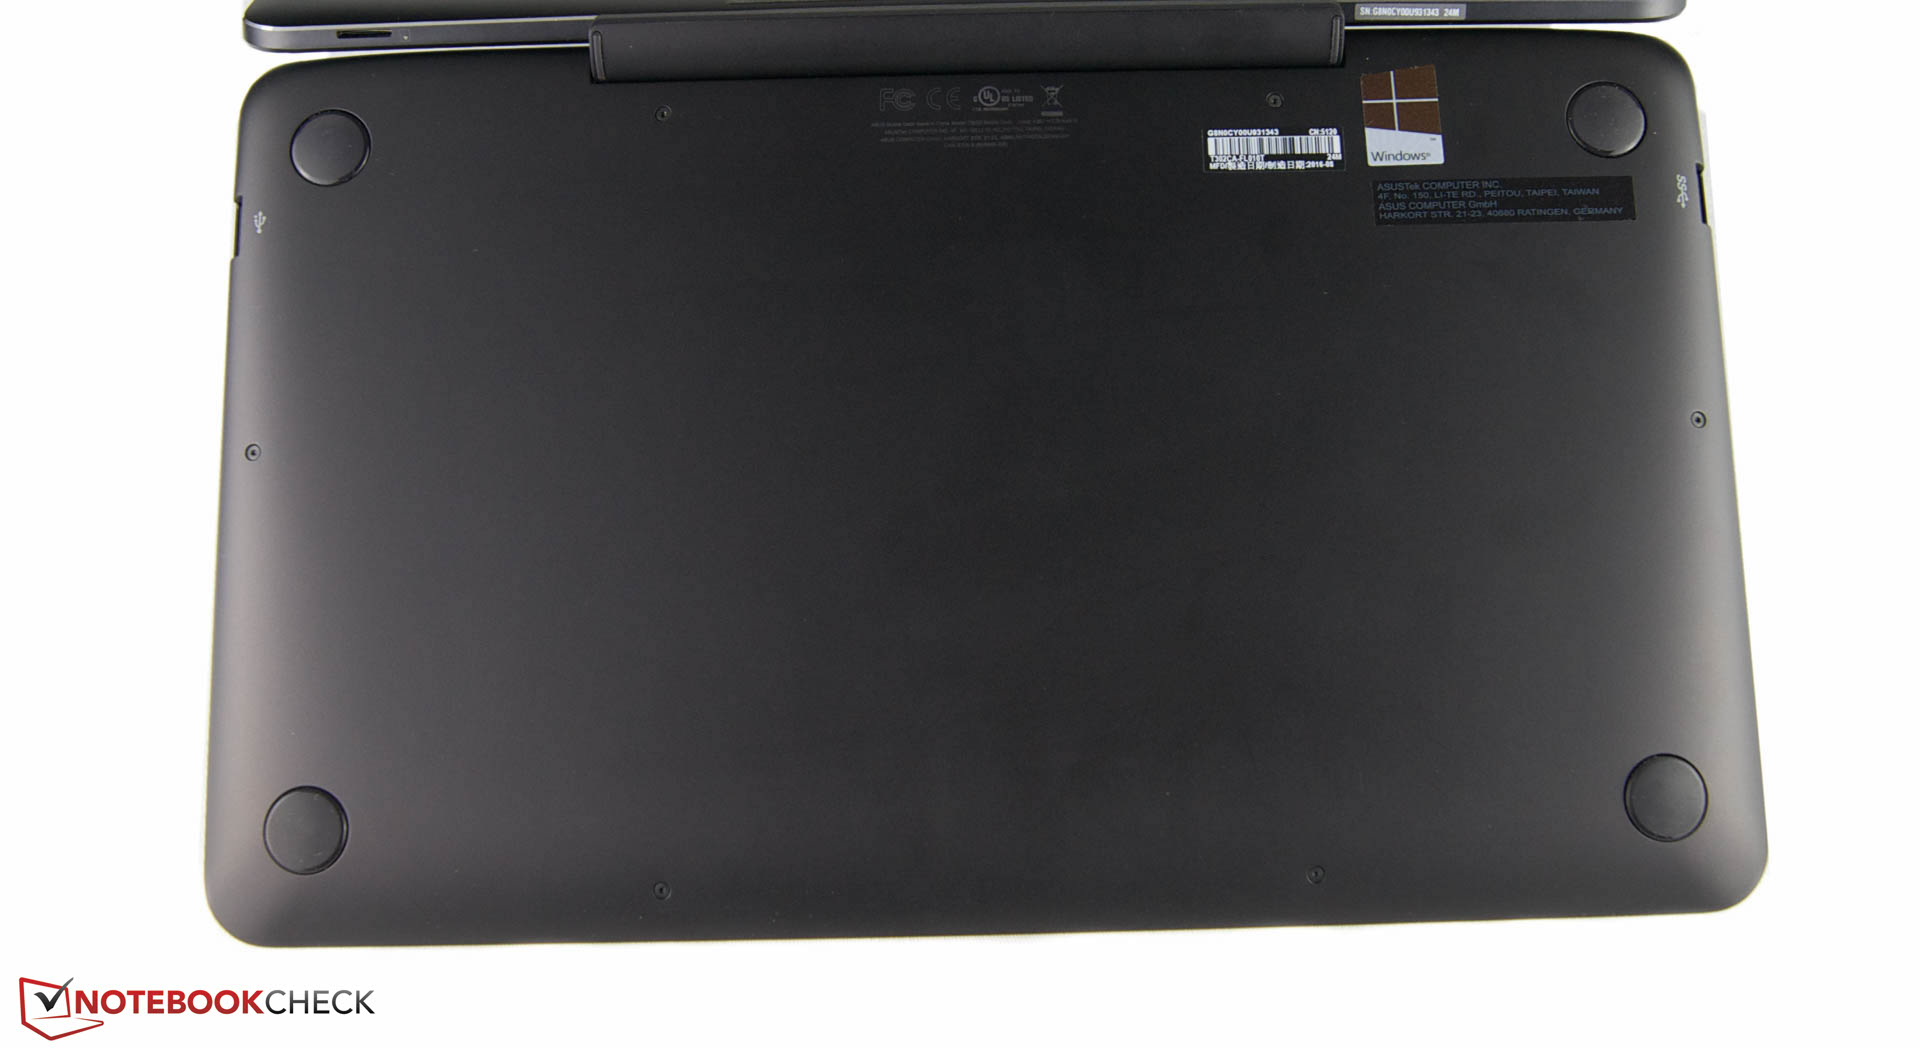
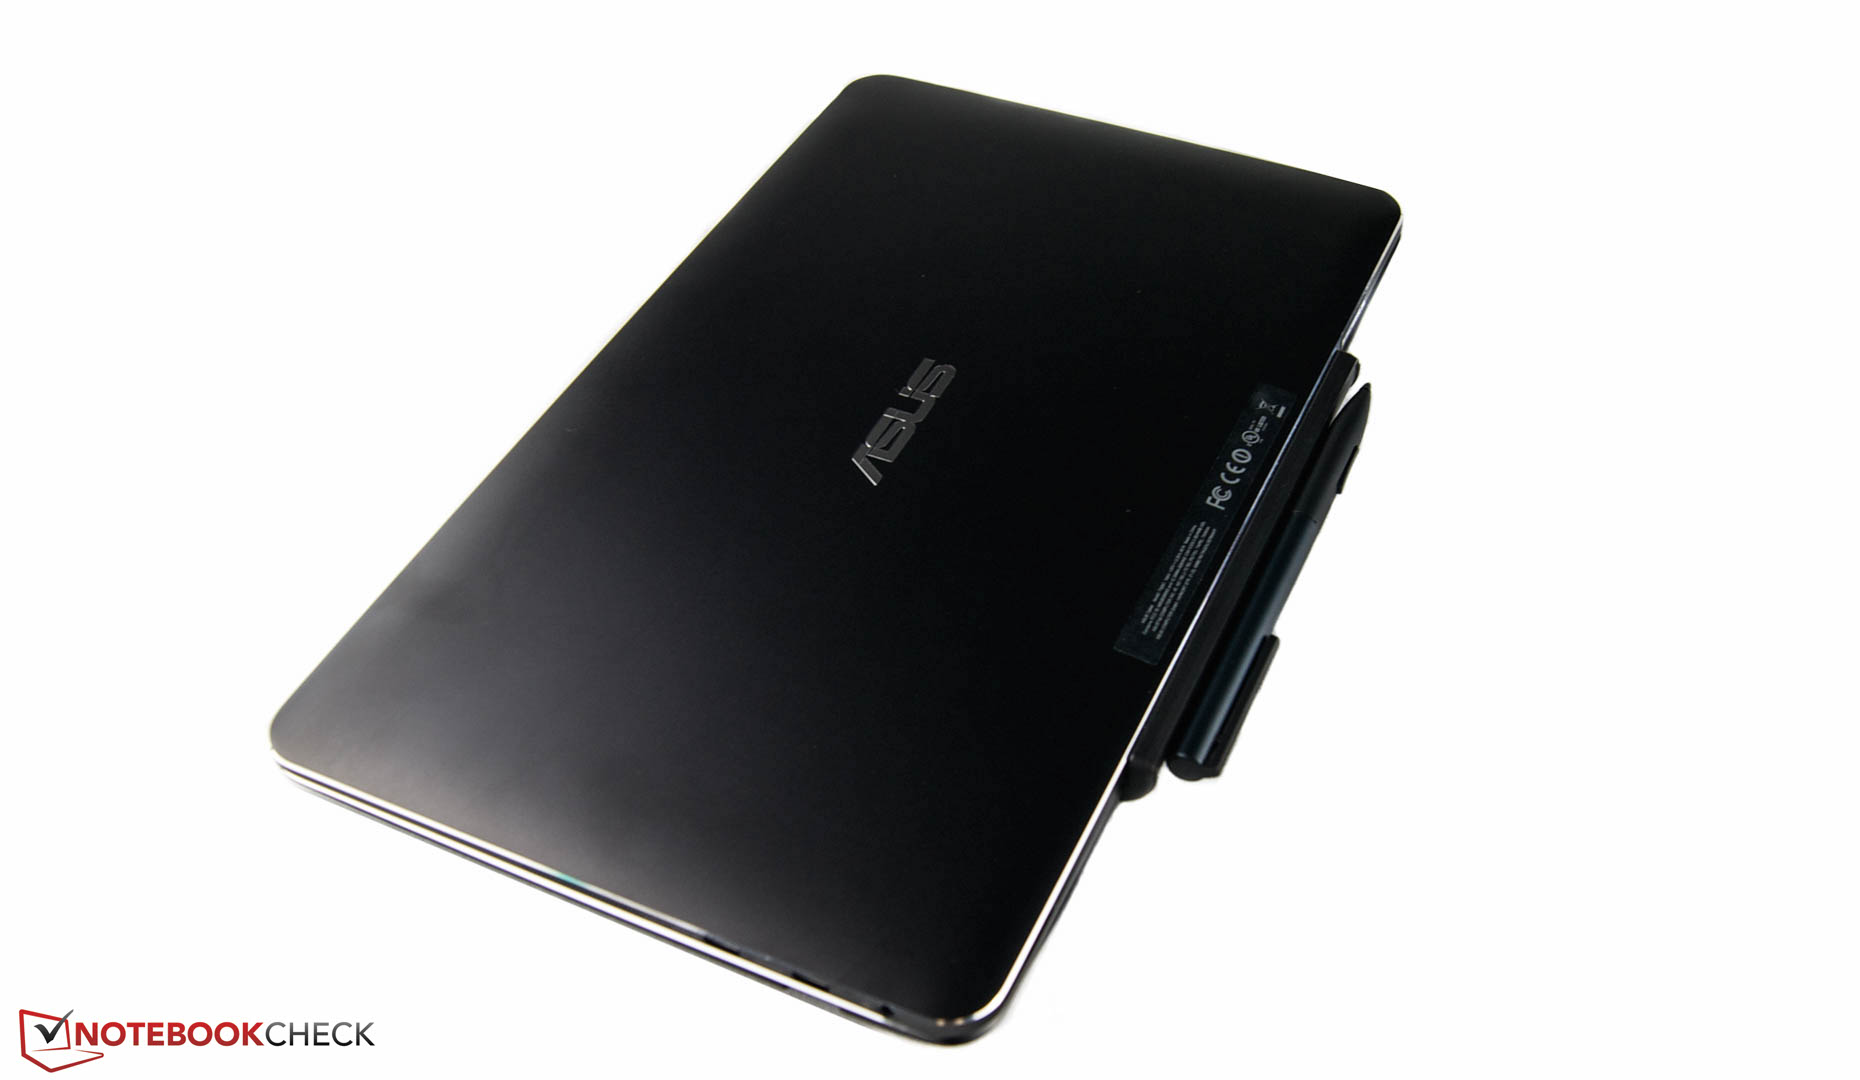
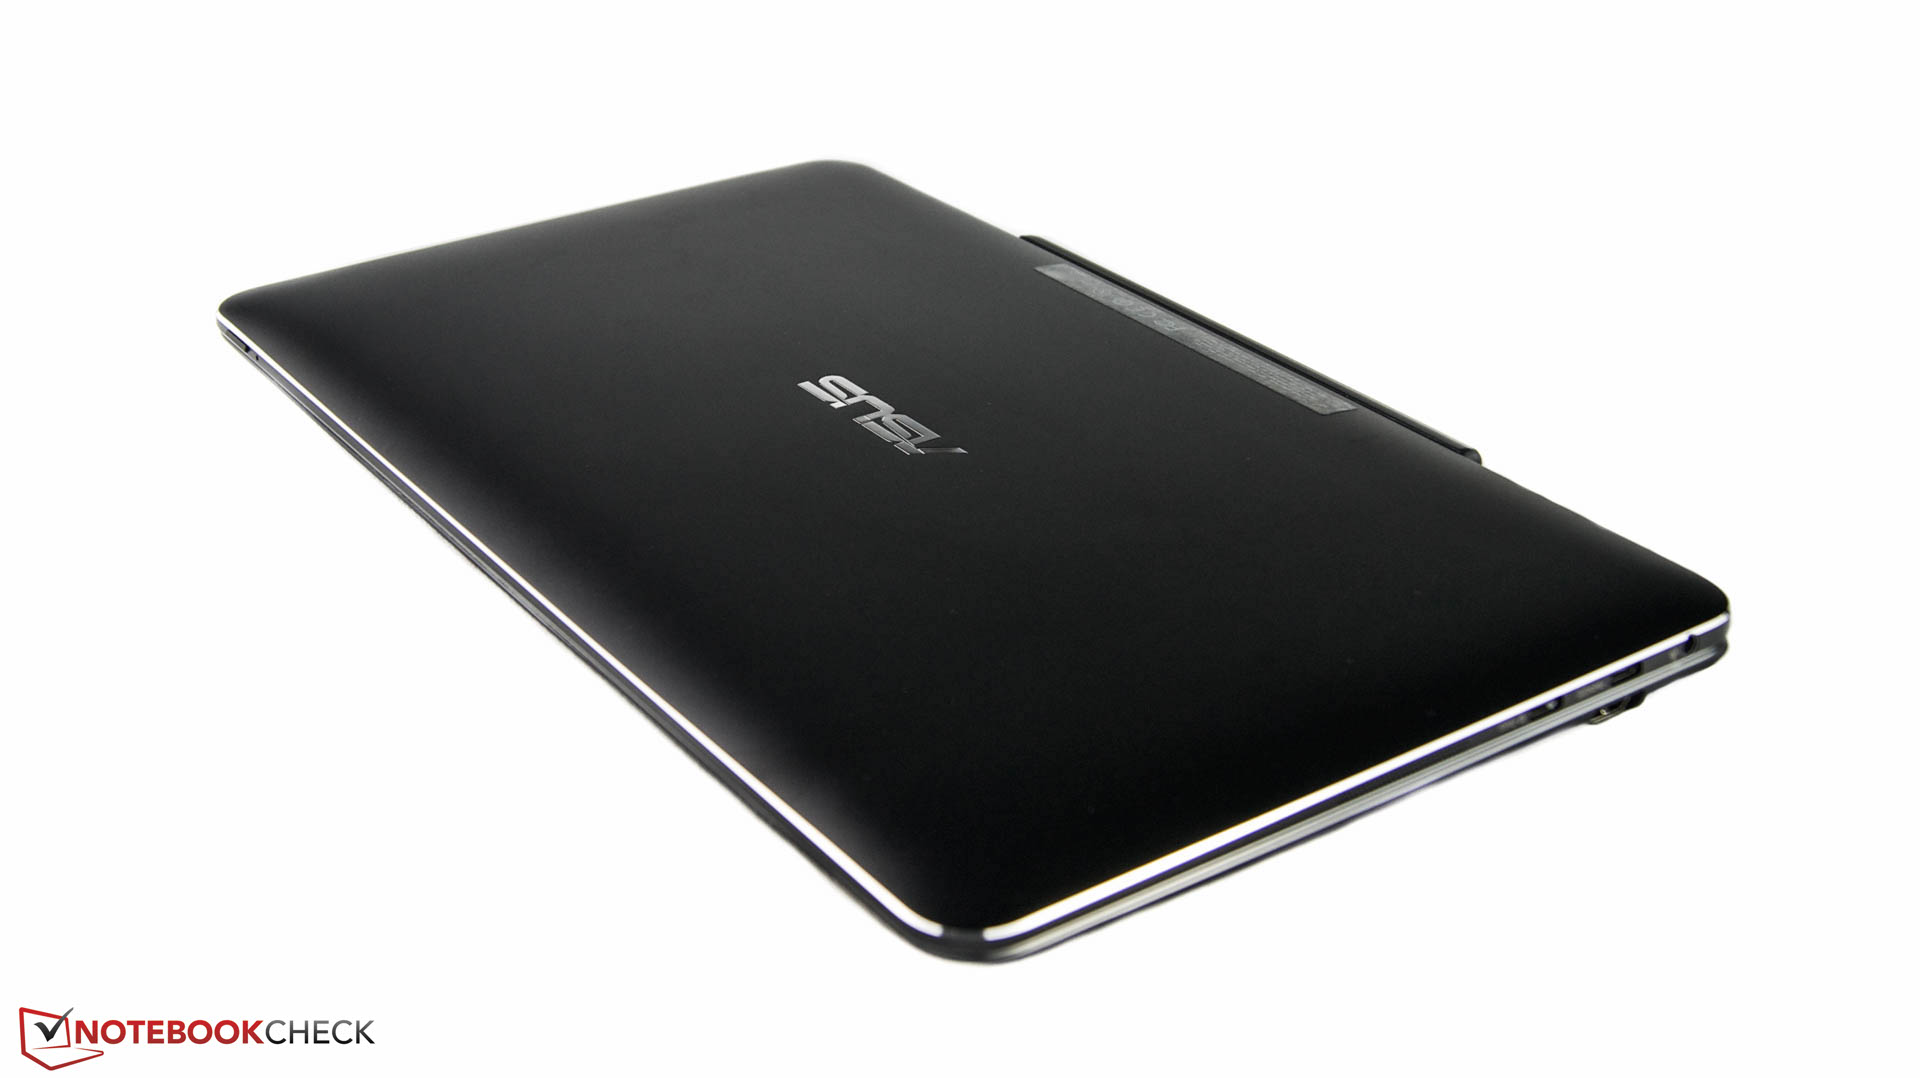
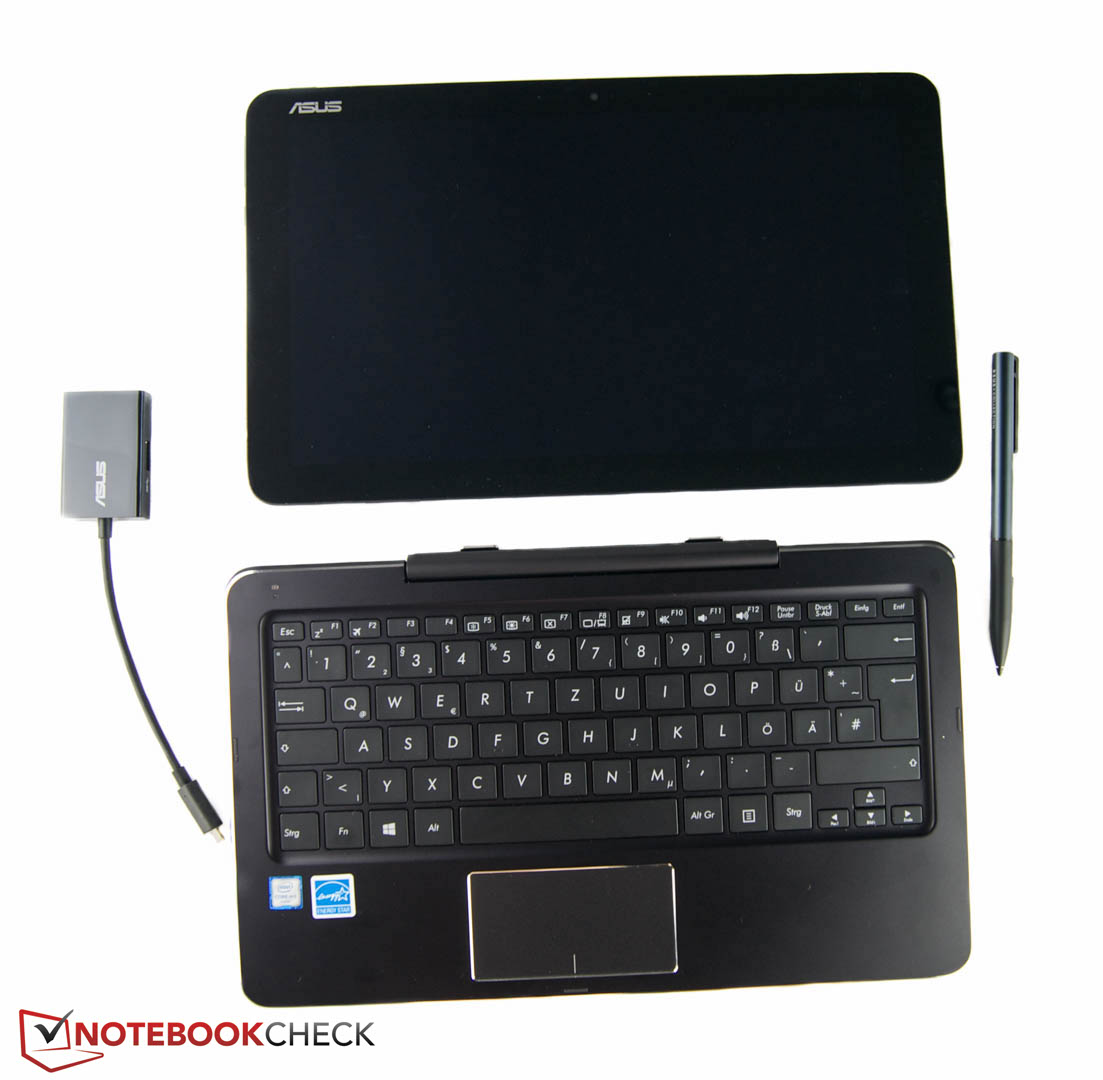
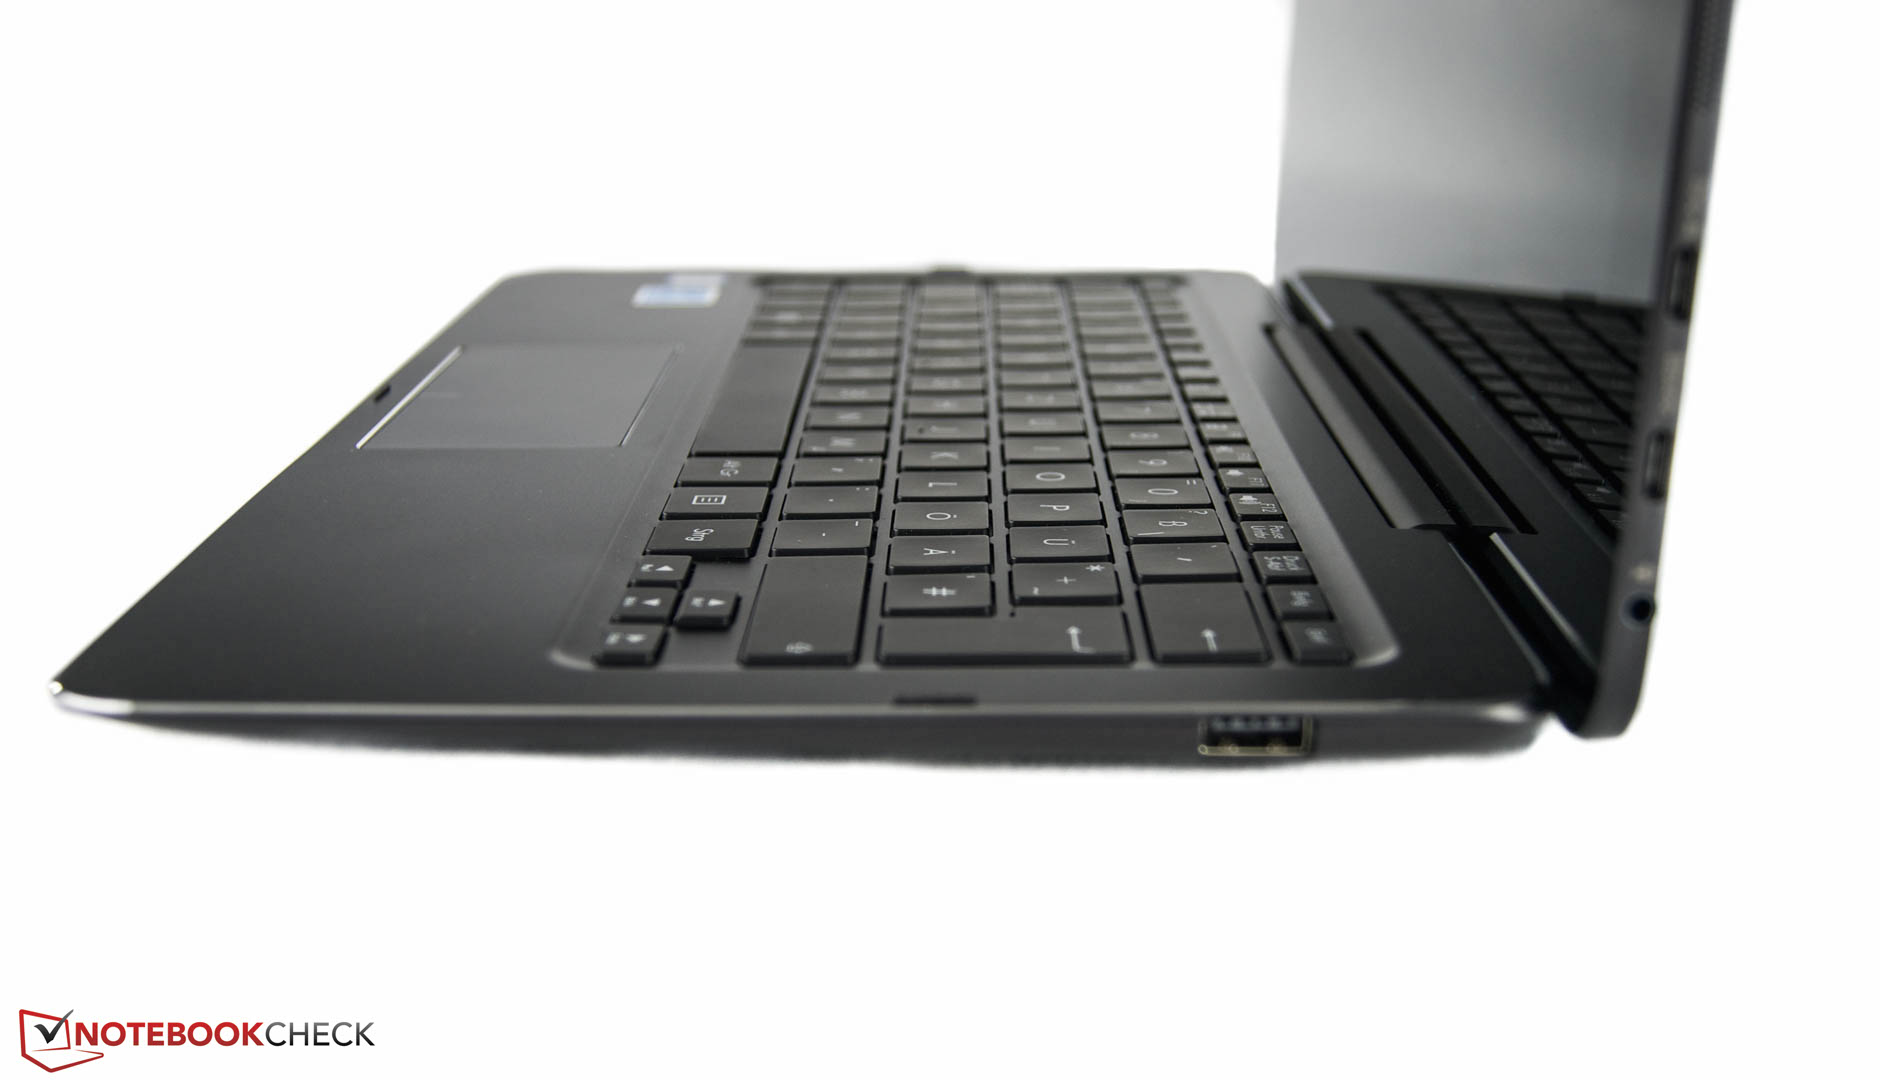
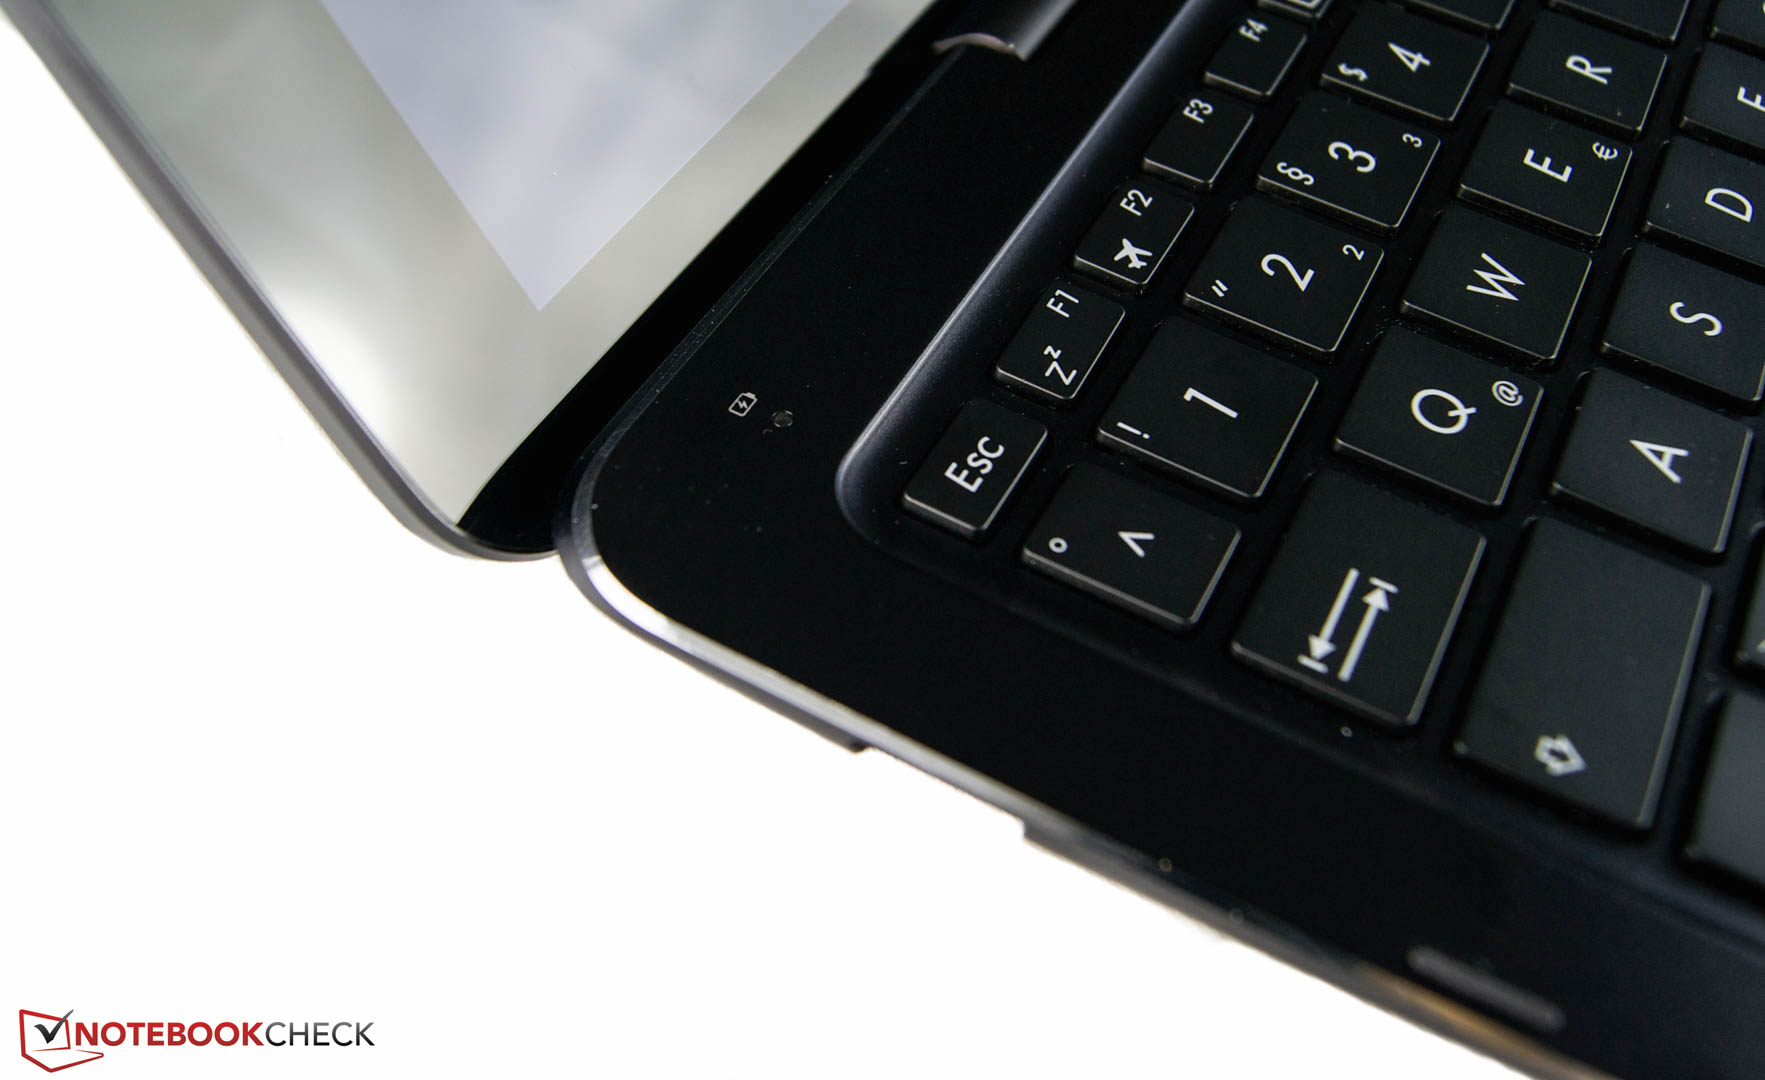
在外观上它的变化很小:铝合金机身带来了高端质感。遗憾的是它的表面十分容易沾染指纹,屏幕转轴也不够稳定。它搭配的输入设备可以满足偶尔的办公需要。我们希望它的触控版可以更大一些。明亮的屏幕可以适合明亮环境下的使用需要,它的明亮IPS面板在这方面毫无问题。类似许多配置相当的最新平板,它也没有内置散热风扇。因此,这台测试机很难在长时间内保持最高性能。不过,它的性能在大部分实际使用中很少会出现类似测试软件和游戏时会遇到的降频问题。它的键盘底座中的第二块电池非常实用,可以带来十分明显的电池续航时间提升。不过,这台测试机的电池续航在没有连接键盘底座时也完全可以和同类产品竞争。
华硕带来了一台十分优秀的便携随身设备,它提供了高品质机身和超长电池续航。
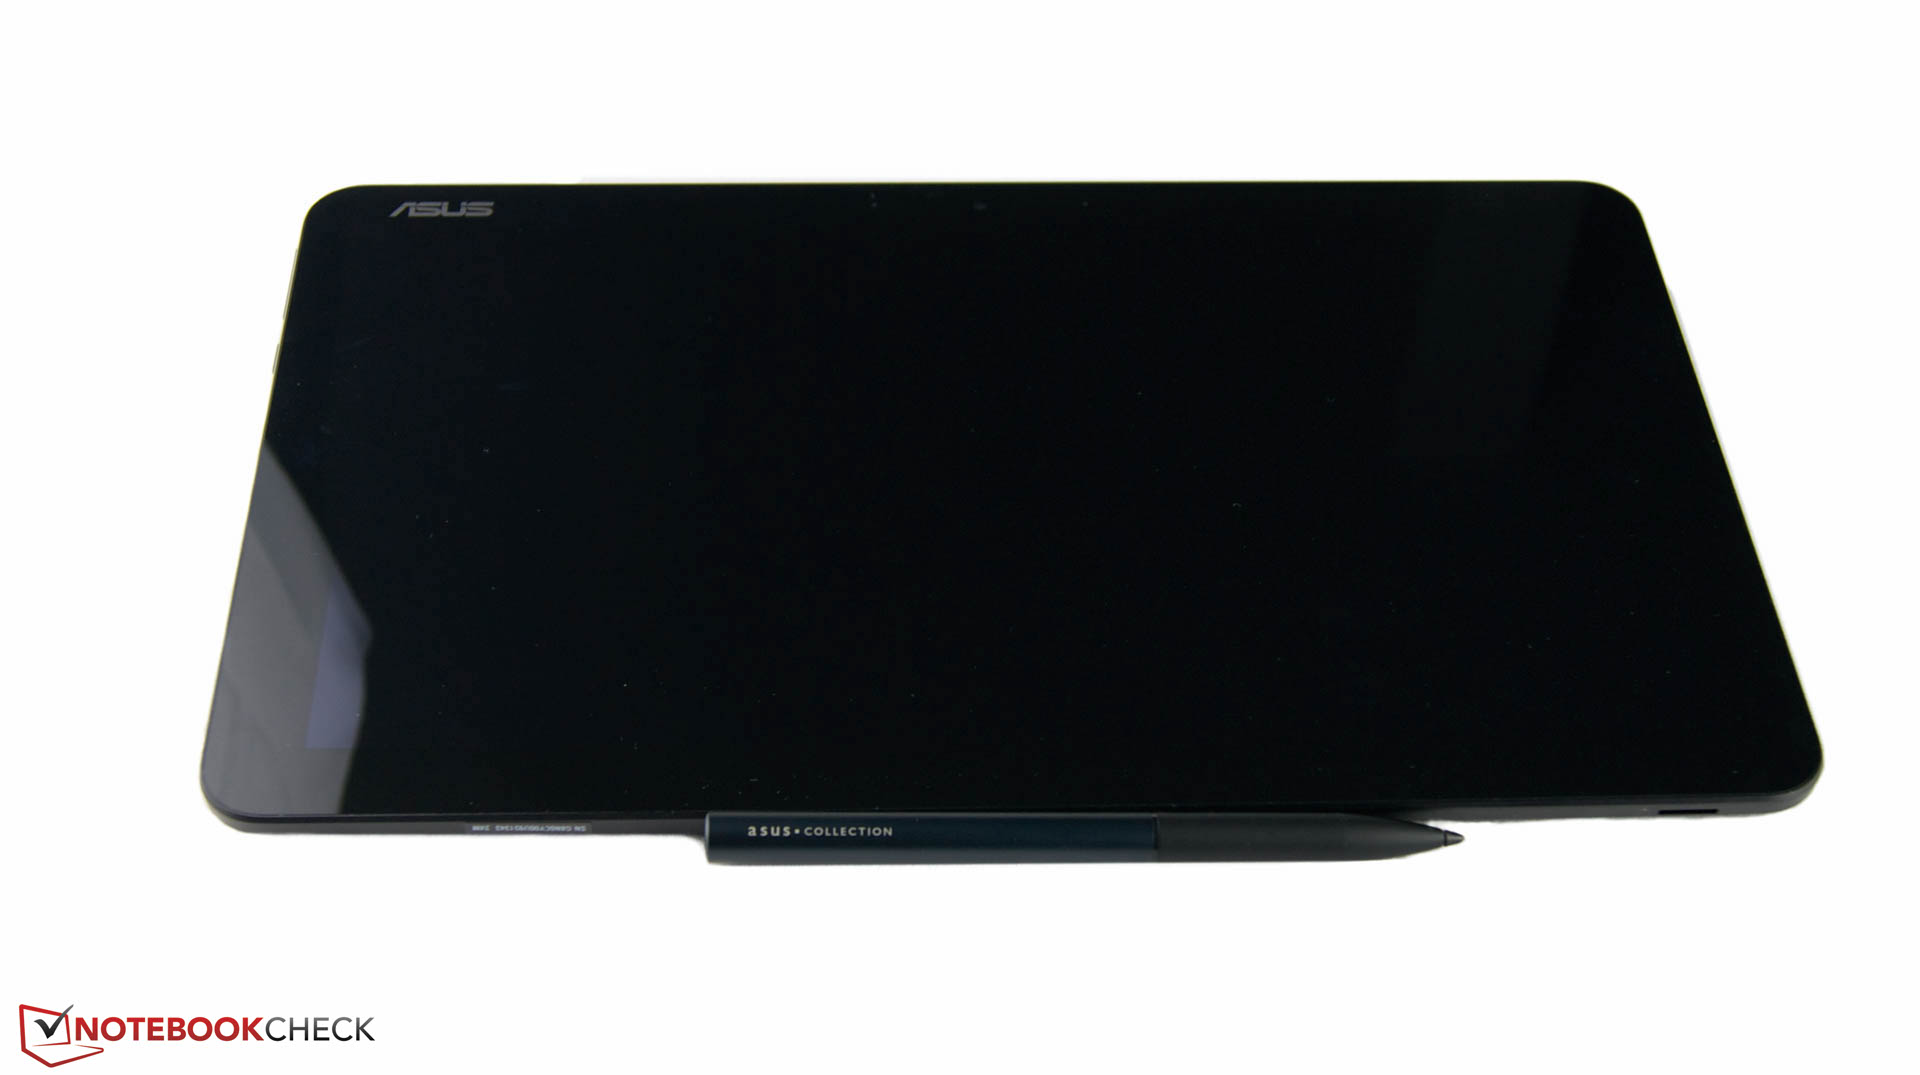
由于支持手写笔和高性价比,对于学生来说这也是一台十分值得考虑的设备。竞争机型如惠普 Pavilion x2售价稍低但表现也十分不错。如果用户经常单独使用平板的话,需要考虑购买一个支架。在测试中表现出色的惠普 Spectre x2 12是一个很好的例子。
注:本文是基于完整评测的缩减版本,阅读完整的英文评测,请点击这里。
Asus TransformerBook T302CA-FL010T
- 11/04/2016 v5.1 (old)
Nino Ricchizzi