三星 Galaxy S8 智能手机简短评测
| SD Card Reader | |
| maximum SDCardreader Maximum Transfer Rate | |
| average SDCardreader Average Transfer Rate |
| Networking | |
| iperf3 transmit AX12 | |
| Samsung Galaxy S8 | |
| Apple iPhone 7 (Klaus I211) | |
| Google Pixel XL 2016 | |
| Huawei P10 | |
| Samsung Galaxy S7 | |
| LG G6 | |
| iperf3 receive AX12 | |
| Apple iPhone 7 (Klaus I211) | |
| Google Pixel XL 2016 | |
| Samsung Galaxy S8 | |
| LG G6 | |
| Huawei P10 | |
| Samsung Galaxy S7 | |


| |||||||||||||||||||||||||
Brightness Distribution: 94 %
Center on Battery: 566 cd/m²
Contrast: ∞:1 (Black: 0 cd/m²)
ΔE ColorChecker Calman: 2.7 | ∀{0.5-29.43 Ø4.71}
ΔE Greyscale Calman: 3.1 | ∀{0.09-98 Ø4.96}
99.87% sRGB (Argyll 1.6.3 3D)
81.57% AdobeRGB 1998 (Argyll 1.6.3 3D)
Gamma: 2.15
CCT: 6335 K
| Samsung Galaxy S8 Super AMOLED, 2960x1440, 5.8" | Samsung Galaxy S7 SAMOLED, 2560x1440, 5.1" | LG G6 IPS LCD, 2880x1440, 5.7" | Huawei P10 LTPS, 1920x1080, 5.1" | Apple iPhone 7 Plus IPS, 1920x1080, 5.5" | Lenovo Moto Z AMOLED, 2560x1440, 5.5" | OnePlus 3T Optic-AMOLED, 1920x1080, 5.5" | |
|---|---|---|---|---|---|---|---|
| Screen | 6% | -27% | -33% | 16% | 2% | -88% | |
| Brightness middle (cd/m²) | 566 | 350 -38% | 646 14% | 547 -3% | 557 -2% | 485 -14% | 421 -26% |
| Brightness (cd/m²) | 564 | 351 -38% | 611 8% | 556 -1% | 553 -2% | 490 -13% | 430 -24% |
| Brightness Distribution (%) | 94 | 98 4% | 89 -5% | 86 -9% | 97 3% | 92 -2% | 84 -11% |
| Black Level * (cd/m²) | 0.23 | 0.43 | 0.35 | ||||
| Colorchecker dE 2000 * | 2.7 | 2.04 24% | 4.5 -67% | 4.8 -78% | 1.4 48% | 2.1 22% | 7.1 -163% |
| Colorchecker dE 2000 max. * | 5.4 | 3.25 40% | 8.3 -54% | 8.8 -63% | 3.1 43% | 5.5 -2% | 15.3 -183% |
| Greyscale dE 2000 * | 3.1 | 1.63 47% | 6 -94% | 4.5 -45% | 1.3 58% | 2.6 16% | 6.8 -119% |
| Gamma | 2.15 102% | 2.07 106% | 2.27 97% | 2.39 92% | 2.21 100% | 2.23 99% | 2.23 99% |
| CCT | 6335 103% | 6391 102% | 7996 81% | 7194 90% | 6667 97% | 6843 95% | 7866 83% |
| Color Space (Percent of AdobeRGB 1998) (%) | 81.57 | 86.86 6% | 67.74 -17% | 63.1 -23% | 88.14 8% | ||
| Color Space (Percent of sRGB) (%) | 99.87 | 99.35 -1% | 99.05 -1% | 99.83 0% | 100 0% | ||
| Contrast (:1) | 2809 | 1272 | 1591 |
* ... smaller is better
Screen Flickering / PWM (Pulse-Width Modulation)
| Screen flickering / PWM detected | 250 Hz | 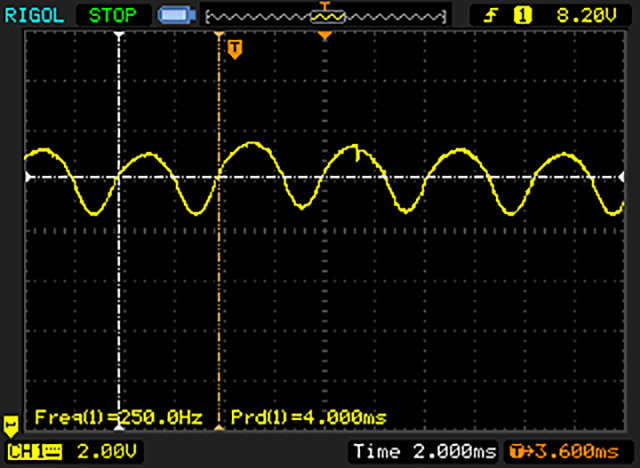 | |
The display backlight flickers at 250 Hz (worst case, e.g., utilizing PWM) . The frequency of 250 Hz is relatively low, so sensitive users will likely notice flickering and experience eyestrain at the stated brightness setting and below. In comparison: 52 % of all tested devices do not use PWM to dim the display. If PWM was detected, an average of 7754 (minimum: 5 - maximum: 343500) Hz was measured. | |||
Display Response Times
| ↔ Response Time Black to White | ||
|---|---|---|
| 3.2 ms ... rise ↗ and fall ↘ combined | ↗ 2 ms rise | 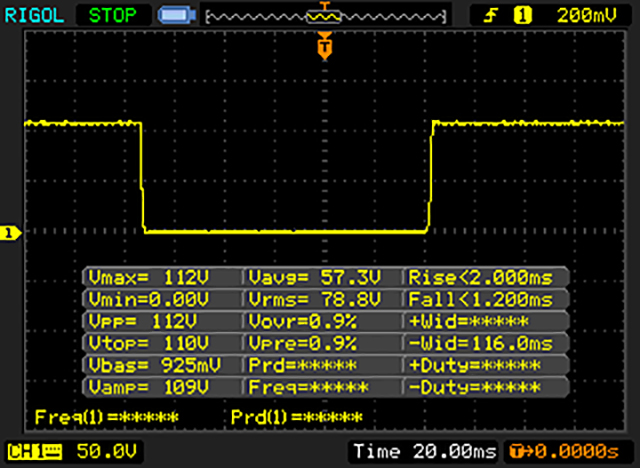 |
| ↘ 1.2 ms fall | ||
| The screen shows very fast response rates in our tests and should be very well suited for fast-paced gaming. In comparison, all tested devices range from 0.1 (minimum) to 240 (maximum) ms. » 15 % of all devices are better. This means that the measured response time is better than the average of all tested devices (19.8 ms). | ||
| ↔ Response Time 50% Grey to 80% Grey | ||
| 5.6 ms ... rise ↗ and fall ↘ combined | ↗ 2.8 ms rise |  |
| ↘ 2.8 ms fall | ||
| The screen shows very fast response rates in our tests and should be very well suited for fast-paced gaming. In comparison, all tested devices range from 0.165 (minimum) to 636 (maximum) ms. » 18 % of all devices are better. This means that the measured response time is better than the average of all tested devices (31 ms). | ||
| AnTuTu v6 - Total Score (sort by value) | |
| Samsung Galaxy S8 | |
| Samsung Galaxy S7 | |
| Huawei P10 | |
| LG G6 | |
| Apple iPhone 7 | |
| HTC U Ultra | |
| Sony Xperia XZ | |
| Lenovo Moto Z | |
| Xiaomi Mi 5s | |
| OnePlus 3T | |
| Google Pixel XL 2016 | |
| Geekbench 4.4 | |
| 64 Bit Single-Core Score (sort by value) | |
| Samsung Galaxy S8 | |
| Samsung Galaxy S7 | |
| Huawei P10 | |
| LG G6 | |
| Apple iPhone 7 | |
| 64 Bit Multi-Core Score (sort by value) | |
| Samsung Galaxy S8 | |
| Samsung Galaxy S7 | |
| Huawei P10 | |
| LG G6 | |
| Apple iPhone 7 | |
| GFXBench 3.0 | |
| on screen Manhattan Onscreen OGL (sort by value) | |
| Samsung Galaxy S8 | |
| Samsung Galaxy S7 | |
| Huawei P10 | |
| LG G6 | |
| Apple iPhone 7 | |
| HTC U Ultra | |
| Sony Xperia XZ | |
| Lenovo Moto Z | |
| Xiaomi Mi 5s | |
| OnePlus 3T | |
| Google Pixel XL 2016 | |
| 1920x1080 1080p Manhattan Offscreen (sort by value) | |
| Samsung Galaxy S8 | |
| Samsung Galaxy S7 | |
| Huawei P10 | |
| LG G6 | |
| Apple iPhone 7 | |
| HTC U Ultra | |
| Sony Xperia XZ | |
| Lenovo Moto Z | |
| Xiaomi Mi 5s | |
| OnePlus 3T | |
| Google Pixel XL 2016 | |
| GFXBench 3.1 | |
| on screen Manhattan ES 3.1 Onscreen (sort by value) | |
| Samsung Galaxy S8 | |
| Samsung Galaxy S7 | |
| Huawei P10 | |
| LG G6 | |
| Apple iPhone 7 | |
| HTC U Ultra | |
| Sony Xperia XZ | |
| Lenovo Moto Z | |
| Xiaomi Mi 5s | |
| OnePlus 3T | |
| Google Pixel XL 2016 | |
| 1920x1080 Manhattan ES 3.1 Offscreen (sort by value) | |
| Samsung Galaxy S8 | |
| Samsung Galaxy S7 | |
| Huawei P10 | |
| LG G6 | |
| Apple iPhone 7 | |
| HTC U Ultra | |
| Sony Xperia XZ | |
| Lenovo Moto Z | |
| Xiaomi Mi 5s | |
| OnePlus 3T | |
| Google Pixel XL 2016 | |
| PCMark for Android | |
| Work performance score (sort by value) | |
| Samsung Galaxy S8 | |
| Samsung Galaxy S7 | |
| Huawei P10 | |
| LG G6 | |
| HTC U Ultra | |
| Sony Xperia XZ | |
| Lenovo Moto Z | |
| Xiaomi Mi 5s | |
| OnePlus 3T | |
| Google Pixel XL 2016 | |
| Work 2.0 performance score (sort by value) | |
| Samsung Galaxy S8 | |
| Samsung Galaxy S7 | |
| Huawei P10 | |
| LG G6 | |
| HTC U Ultra | |
| Sony Xperia XZ | |
| Basemark ES 3.1 / Metal - offscreen Overall Score (sort by value) | |
| Samsung Galaxy S8 | |
| Samsung Galaxy S7 | |
| Huawei P10 | |
| LG G6 | |
| Apple iPhone 7 | |
| Apple iPhone 7 | |
| Lenovo Moto Z | |
| Google Pixel XL 2016 | |
| Lightmark - 1920x1080 1080p (sort by value) | |
| Samsung Galaxy S8 | |
| Samsung Galaxy S7 | |
| Huawei P10 | |
| LG G6 | |
| Lenovo Moto Z | |
| WebXPRT 2015 - Overall (sort by value) | |
| Samsung Galaxy S8 | |
| Samsung Galaxy S7 | |
| Huawei P10 | |
| LG G6 | |
| Apple iPhone 7 | |
| Sony Xperia XZ | |
| Lenovo Moto Z | |
| OnePlus 3T | |
| Google Pixel XL 2016 | |
| Octane V2 - Total Score (sort by value) | |
| Samsung Galaxy S8 | |
| Samsung Galaxy S7 | |
| Huawei P10 | |
| LG G6 | |
| Apple iPhone 7 | |
| HTC U Ultra | |
| Sony Xperia XZ | |
| Lenovo Moto Z | |
| Xiaomi Mi 5s | |
| OnePlus 3T | |
| Google Pixel XL 2016 | |
| Mozilla Kraken 1.1 - Total (sort by value) | |
| Samsung Galaxy S8 | |
| Samsung Galaxy S7 | |
| Huawei P10 | |
| LG G6 | |
| Apple iPhone 7 | |
| HTC U Ultra | |
| Sony Xperia XZ | |
| Lenovo Moto Z | |
| Xiaomi Mi 5s | |
| OnePlus 3T | |
| Google Pixel XL 2016 | |
| JetStream 1.1 - 1.1 Total (sort by value) | |
| Samsung Galaxy S8 | |
| Samsung Galaxy S7 | |
| Huawei P10 | |
| LG G6 | |
| Apple iPhone 7 | |
| HTC U Ultra | |
| Sony Xperia XZ | |
| Lenovo Moto Z | |
| Xiaomi Mi 5s | |
| OnePlus 3T | |
| Google Pixel XL 2016 | |
* ... smaller is better
| Samsung Galaxy S8 | Samsung Galaxy S7 | Huawei P10 | LG G6 | HTC U Ultra | Sony Xperia XZ | Lenovo Moto Z | OnePlus 3T | Xiaomi Mi 5s | Google Pixel XL 2016 | |
|---|---|---|---|---|---|---|---|---|---|---|
| AndroBench 3-5 | -13% | 145% | -13% | -8% | -44% | 56% | 82% | -23% | -40% | |
| Sequential Write 256KB SDCard (MB/s) | 53.5 | 53.6 0% | 32.19 -40% | 53.3 0% | 67.6 26% | 29.8 -44% | 45.64 -15% | |||
| Sequential Read 256KB SDCard (MB/s) | 63.9 | 72.3 13% | 54.2 -15% | 77.6 21% | 82.8 30% | 33.5 -48% | 78.5 23% | |||
| Random Write 4KB (MB/s) | 15.25 | 16.01 5% | 152.3 899% | 16.58 9% | 13.7 -10% | 10.5 -31% | 74.9 391% | 74.4 388% | 15.08 -1% | 14.56 -5% |
| Random Read 4KB (MB/s) | 127.2 | 85.9 -32% | 168.4 32% | 95.2 -25% | 84.2 -34% | 71.5 -44% | 117.2 -8% | 123.6 -3% | 100.3 -21% | 87.7 -31% |
| Sequential Write 256KB (MB/s) | 193.2 | 145.7 -25% | 189.8 -2% | 122.8 -36% | 164.7 -15% | 138 -29% | 168.3 -13% | 165.3 -14% | 153.5 -21% | 83.4 -57% |
| Sequential Read 256KB (MB/s) | 793 | 483.8 -39% | 738 -7% | 428.7 -46% | 423.9 -47% | 281 -65% | 439.7 -45% | 436.4 -45% | 412.7 -48% | 258.2 -67% |
| Asphalt 8: Airborne | |||
| Settings | Value | ||
| high | 29 fps | ||
| very low | 30 fps | ||
| Temple Run 2 | |||
| Settings | Value | ||
| default | 60 fps | ||
| Temple Run 2 | |||
| Settings | Value | ||
| default | 60 fps | ||
(+) The maximum temperature on the upper side is 36.7 °C / 98 F, compared to the average of 35.3 °C / 96 F, ranging from 21.9 to 247 °C for the class Smartphone.
(+) The bottom heats up to a maximum of 37.5 °C / 100 F, compared to the average of 34 °C / 93 F
(+) In idle usage, the average temperature for the upper side is 26 °C / 79 F, compared to the device average of 33 °C / 91 F.
Samsung Galaxy S8 audio analysis
(+) | speakers can play relatively loud (82.4 dB)
Bass 100 - 315 Hz
(-) | nearly no bass - on average 22.1% lower than median
(±) | linearity of bass is average (11.7% delta to prev. frequency)
Mids 400 - 2000 Hz
(±) | higher mids - on average 5% higher than median
(+) | mids are linear (4.3% delta to prev. frequency)
Highs 2 - 16 kHz
(+) | balanced highs - only 3.7% away from median
(+) | highs are linear (6.7% delta to prev. frequency)
Overall 100 - 16.000 Hz
(±) | linearity of overall sound is average (21.8% difference to median)
Compared to same class
» 45% of all tested devices in this class were better, 8% similar, 47% worse
» The best had a delta of 11%, average was 34%, worst was 134%
Compared to all devices tested
» 62% of all tested devices were better, 7% similar, 31% worse
» The best had a delta of 4%, average was 23%, worst was 134%
LG G6 audio analysis
(±) | speaker loudness is average but good (80.3 dB)
Bass 100 - 315 Hz
(-) | nearly no bass - on average 17.1% lower than median
(±) | linearity of bass is average (14.7% delta to prev. frequency)
Mids 400 - 2000 Hz
(+) | balanced mids - only 4.8% away from median
(+) | mids are linear (4% delta to prev. frequency)
Highs 2 - 16 kHz
(±) | higher highs - on average 6.6% higher than median
(+) | highs are linear (5.9% delta to prev. frequency)
Overall 100 - 16.000 Hz
(±) | linearity of overall sound is average (23.2% difference to median)
Compared to same class
» 53% of all tested devices in this class were better, 7% similar, 40% worse
» The best had a delta of 11%, average was 34%, worst was 134%
Compared to all devices tested
» 70% of all tested devices were better, 5% similar, 25% worse
» The best had a delta of 4%, average was 23%, worst was 134%
Huawei P10 audio analysis
(+) | speakers can play relatively loud (82.7 dB)
Bass 100 - 315 Hz
(-) | nearly no bass - on average 20.9% lower than median
(±) | linearity of bass is average (12.6% delta to prev. frequency)
Mids 400 - 2000 Hz
(+) | balanced mids - only 4.2% away from median
(+) | mids are linear (6% delta to prev. frequency)
Highs 2 - 16 kHz
(±) | higher highs - on average 5.4% higher than median
(+) | highs are linear (4.9% delta to prev. frequency)
Overall 100 - 16.000 Hz
(±) | linearity of overall sound is average (23.6% difference to median)
Compared to same class
» 54% of all tested devices in this class were better, 8% similar, 38% worse
» The best had a delta of 11%, average was 34%, worst was 134%
Compared to all devices tested
» 71% of all tested devices were better, 6% similar, 23% worse
» The best had a delta of 4%, average was 23%, worst was 134%
| Off / Standby | |
| Idle | |
| Load |
|
Key:
min: | |
| Samsung Galaxy S8 3000 mAh | Samsung Galaxy S7 3000 mAh | LG G6 3300 mAh | Huawei P10 3200 mAh | Apple iPhone 7 1960 mAh | OnePlus 3T 3400 mAh | Xiaomi Mi 5s 3200 mAh | |
|---|---|---|---|---|---|---|---|
| Power Consumption | -6% | -35% | -65% | -5% | -54% | -36% | |
| Idle Minimum * (Watt) | 0.78 | 0.68 13% | 0.62 21% | 0.83 -6% | 0.54 31% | 0.61 22% | 0.4 49% |
| Idle Average * (Watt) | 1.1 | 1.02 7% | 1.43 -30% | 2.1 -91% | 1.51 -37% | 1.77 -61% | 1.7 -55% |
| Idle Maximum * (Watt) | 1.16 | 1.14 2% | 1.48 -28% | 2.18 -88% | 1.54 -33% | 1.81 -56% | 1.81 -56% |
| Load Average * (Watt) | 4.15 | 4.73 -14% | 5.52 -33% | 6.57 -58% | 3.75 10% | 6.67 -61% | 5.84 -41% |
| Load Maximum * (Watt) | 5.12 | 7.16 -40% | 10.47 -104% | 9.32 -82% | 5.01 2% | 10.98 -114% | 9.12 -78% |
* ... smaller is better
| PCMark for Android - Work 2.0 battery life | |
| Huawei Mate 9 | |
| Samsung Galaxy S8 Plus | |
| Samsung Galaxy S8 | |
| Sony Xperia XZ | |
| Lenovo ZUK Z2 | |
| HTC 10 | |
| Samsung Galaxy S7 | |
| Samsung Galaxy S8 3000 mAh | Samsung Galaxy S7 3000 mAh | Apple iPhone 7 Plus 2915 mAh | LG G6 3300 mAh | Huawei P10 3200 mAh | Lenovo Moto Z 2600 mAh | HTC U Ultra 3000 mAh | |
|---|---|---|---|---|---|---|---|
| Battery runtime | -5% | -4% | -0% | -8% | -12% | -18% | |
| Reader / Idle (h) | 27.8 | 30.2 9% | 30.6 10% | 29.8 7% | 25.7 -8% | 22.9 -18% | 26.1 -6% |
| H.264 (h) | 12.9 | 14.9 16% | 13.6 5% | 13 1% | 9.7 -25% | 12.1 -6% | 10.1 -22% |
| WiFi v1.3 (h) | 12 | 7.6 -37% | 9.8 -18% | 11.5 -4% | 16.1 34% | 6.8 -43% | 9.1 -24% |
| Load (h) | 4.4 | 4 -9% | 3.8 -14% | 4.2 -5% | 2.9 -34% | 5.3 20% | 3.6 -18% |
Pros
Cons

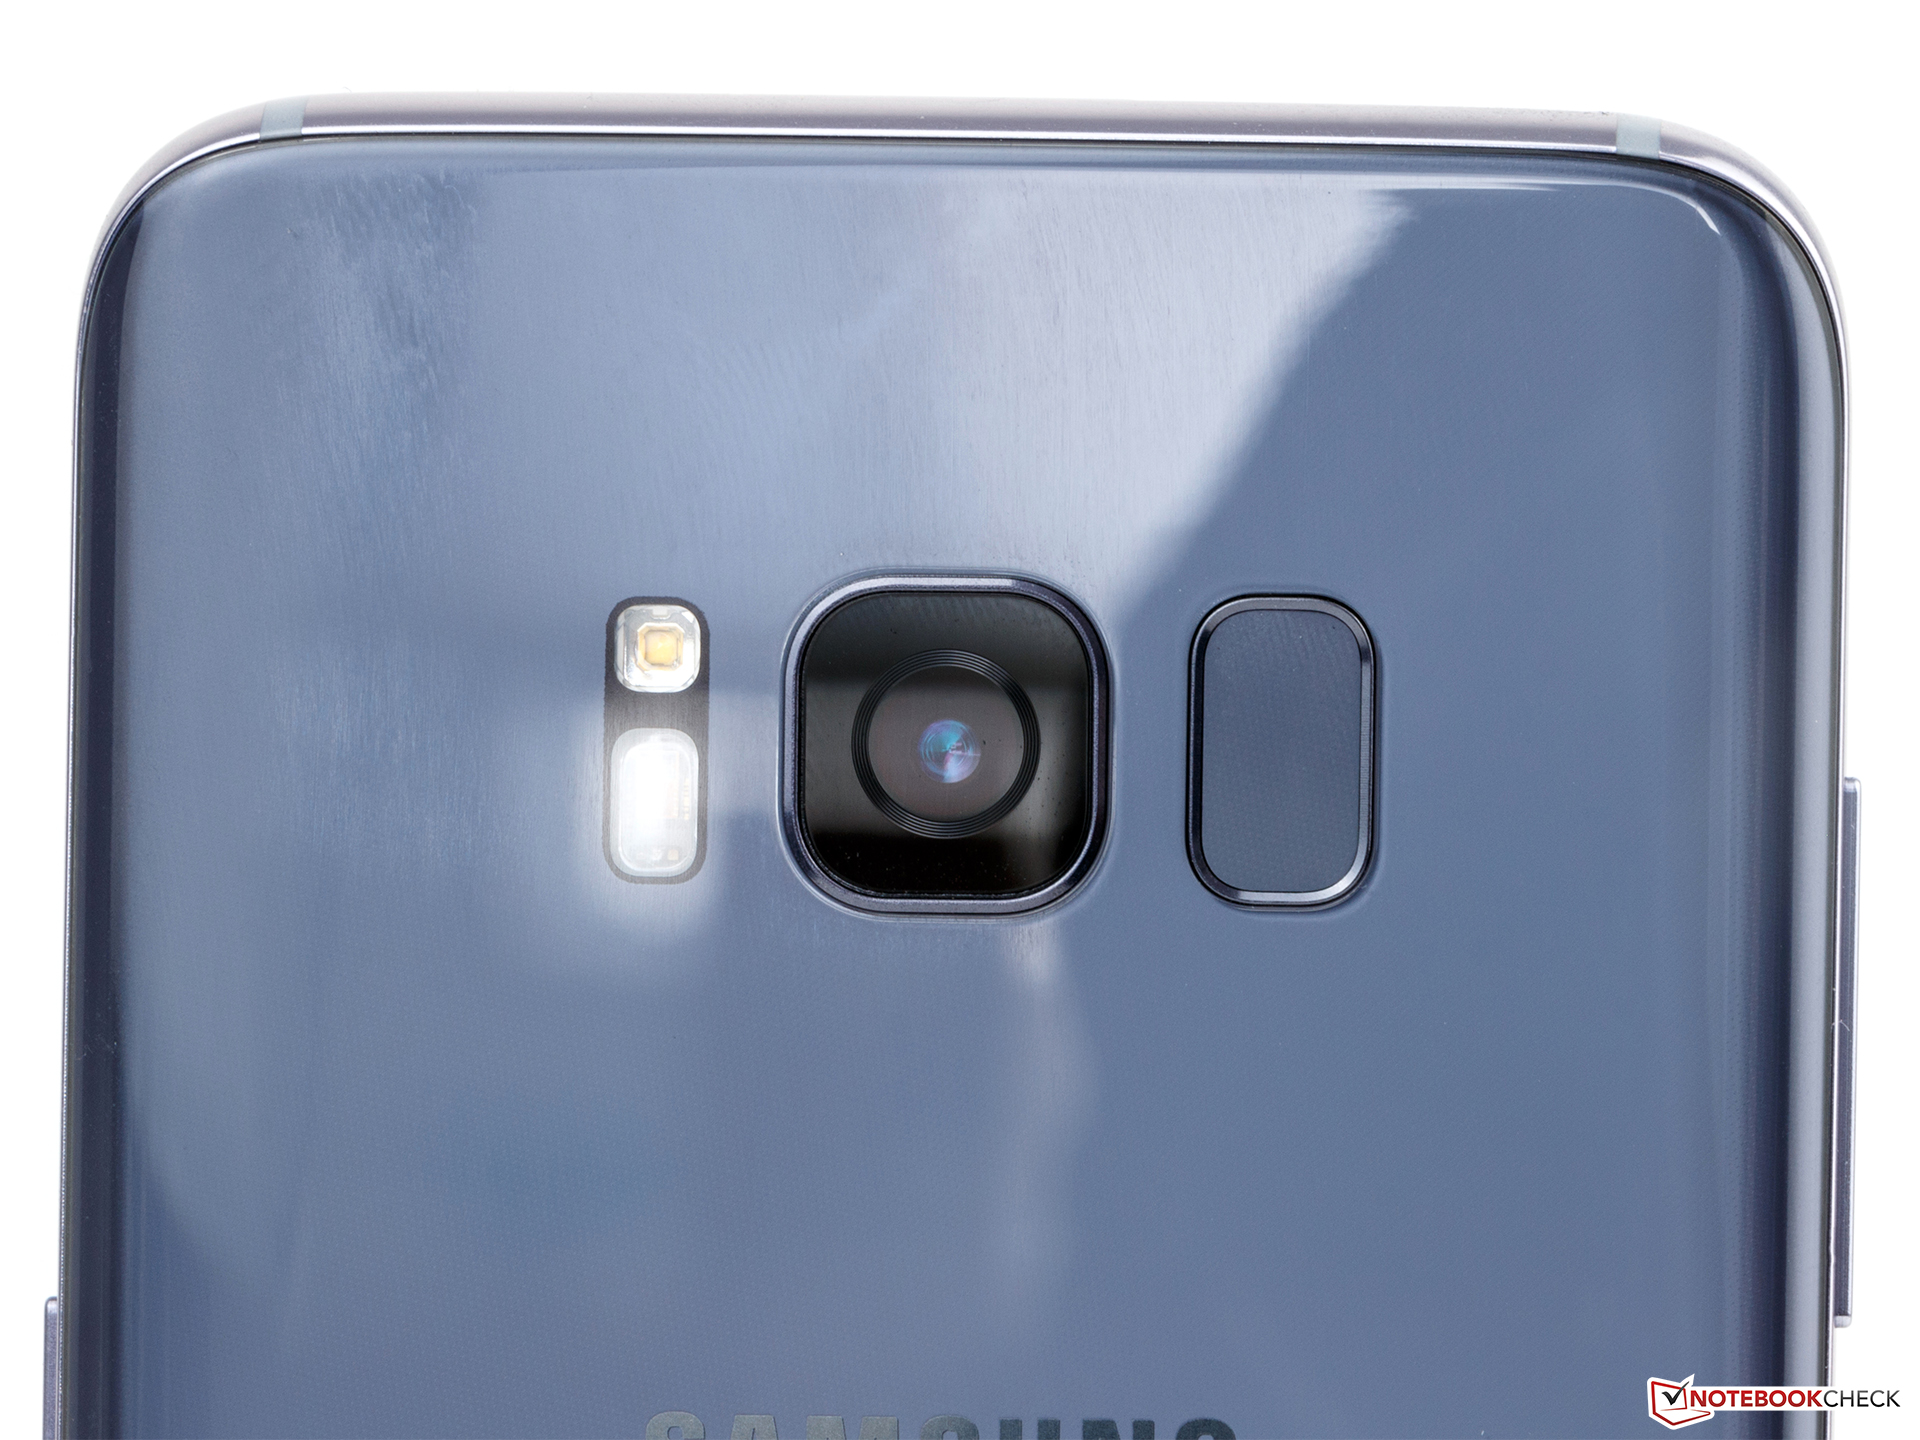
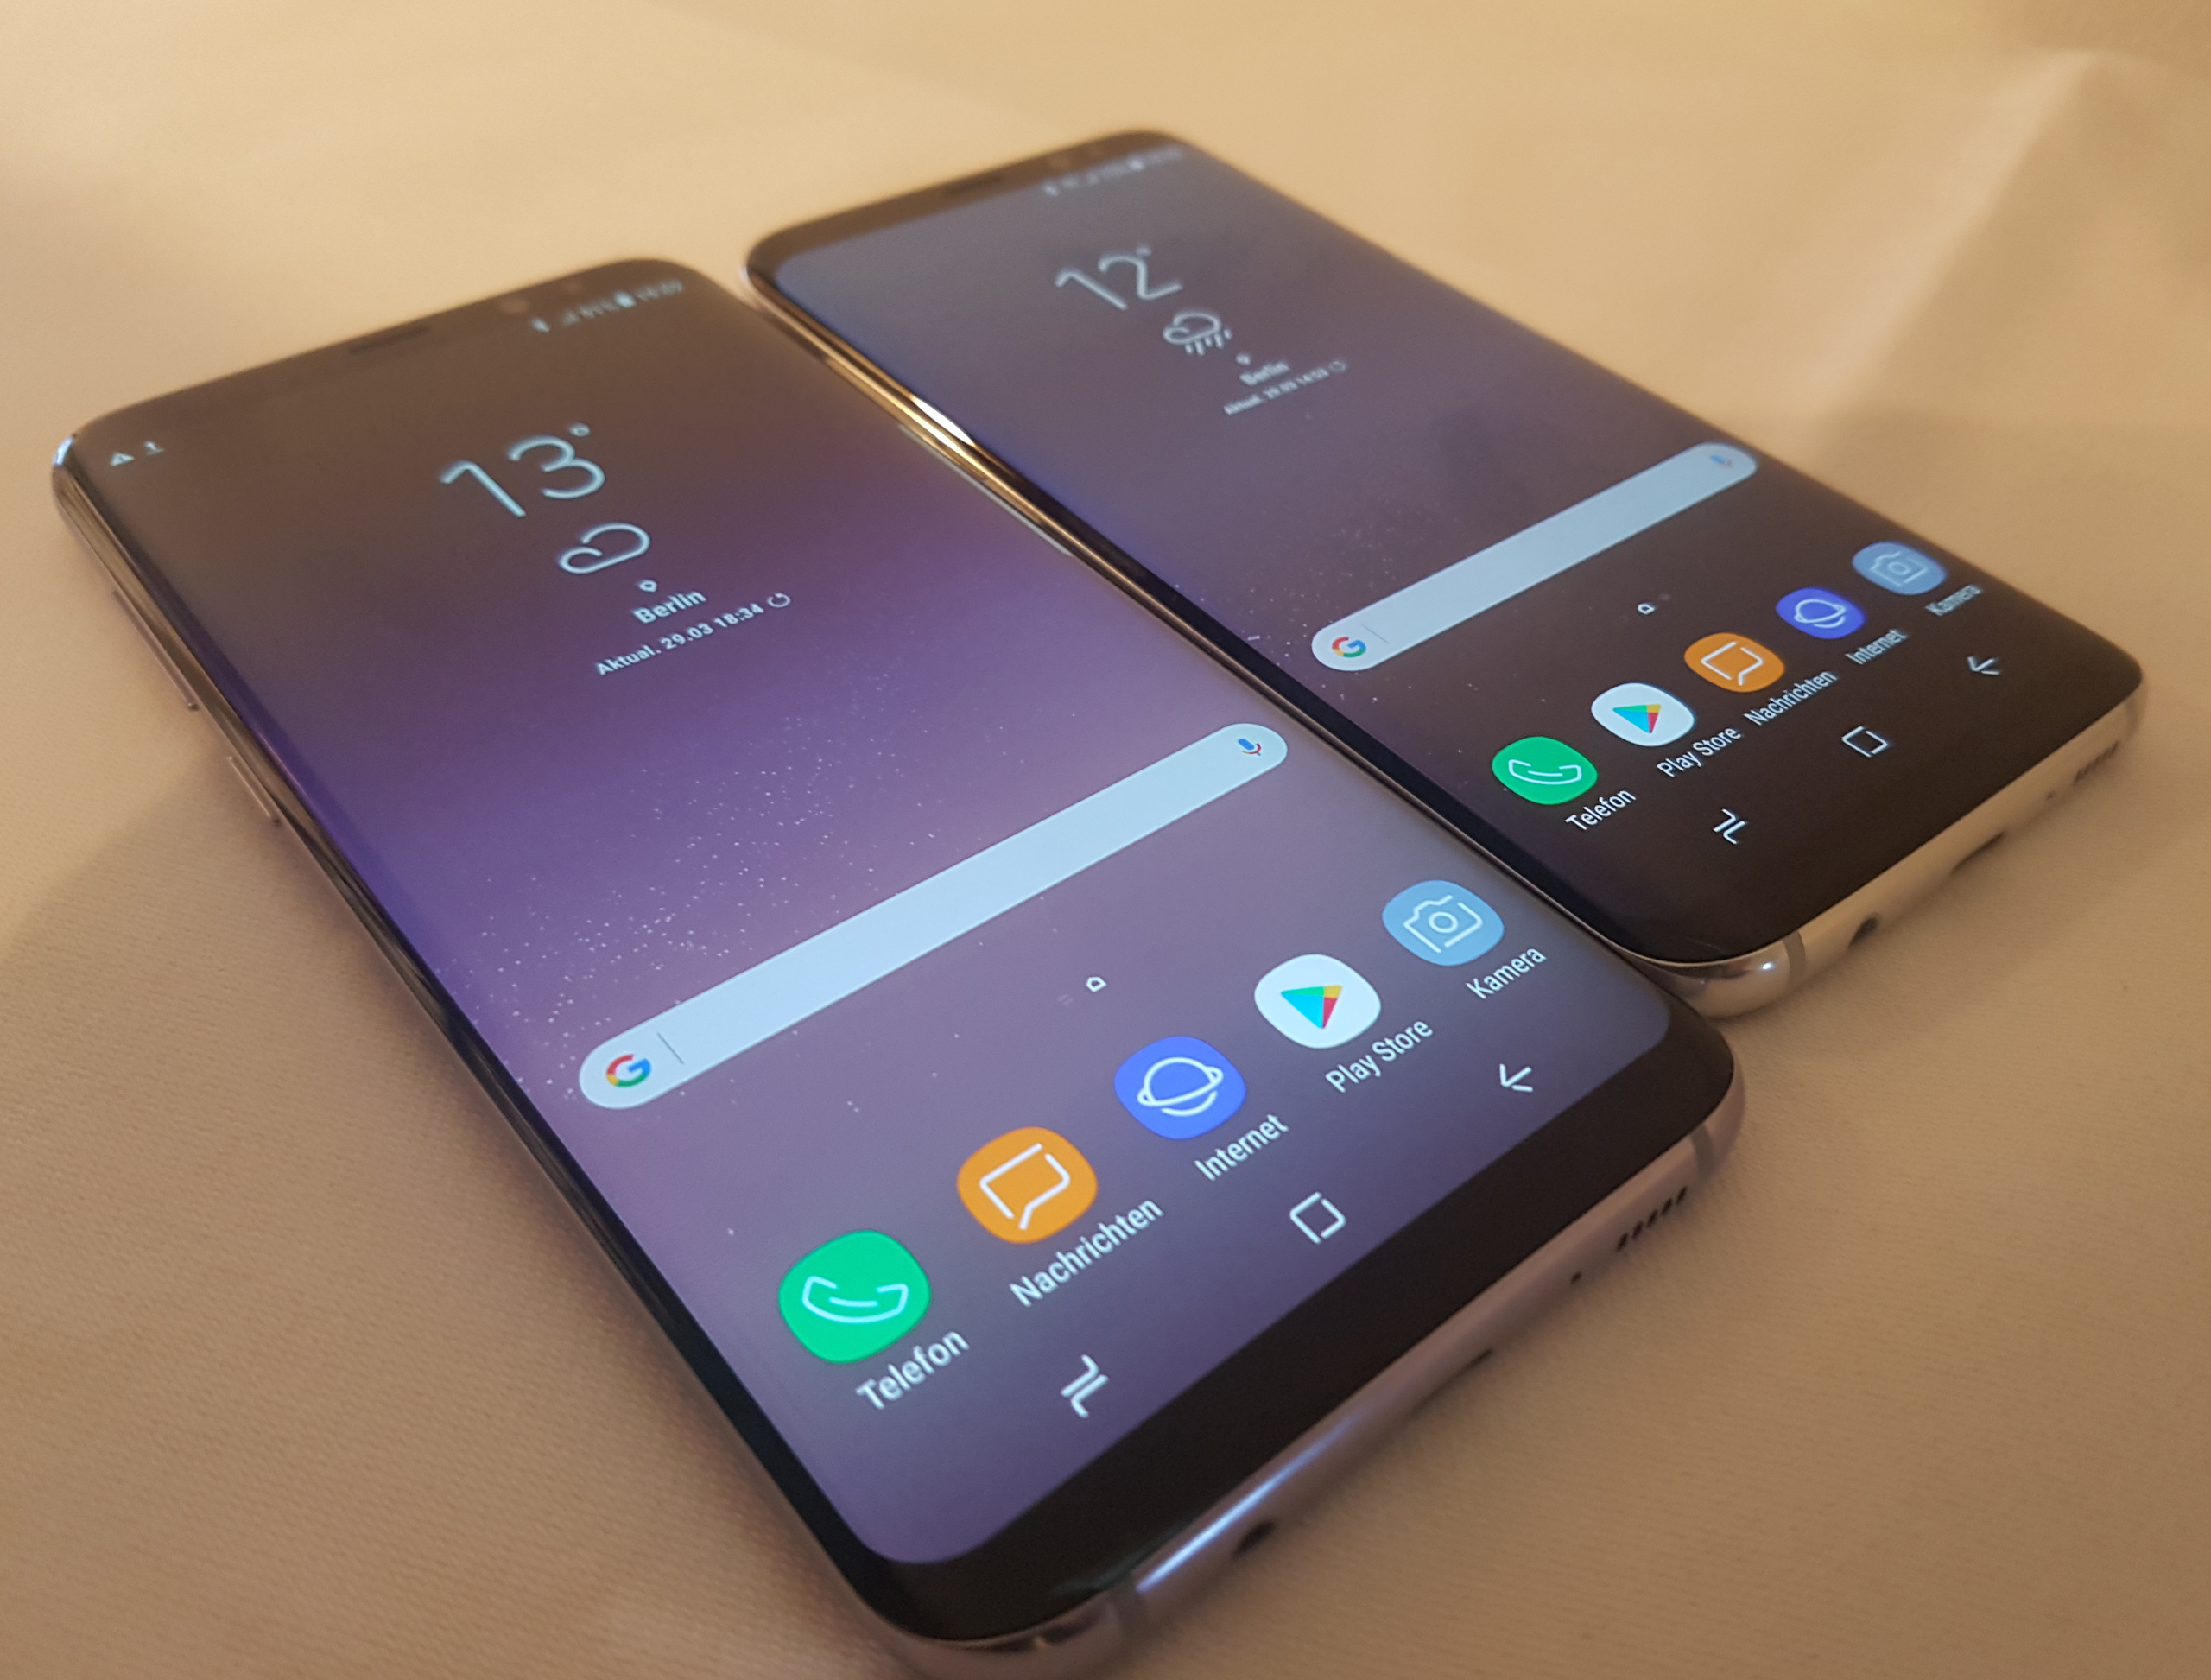
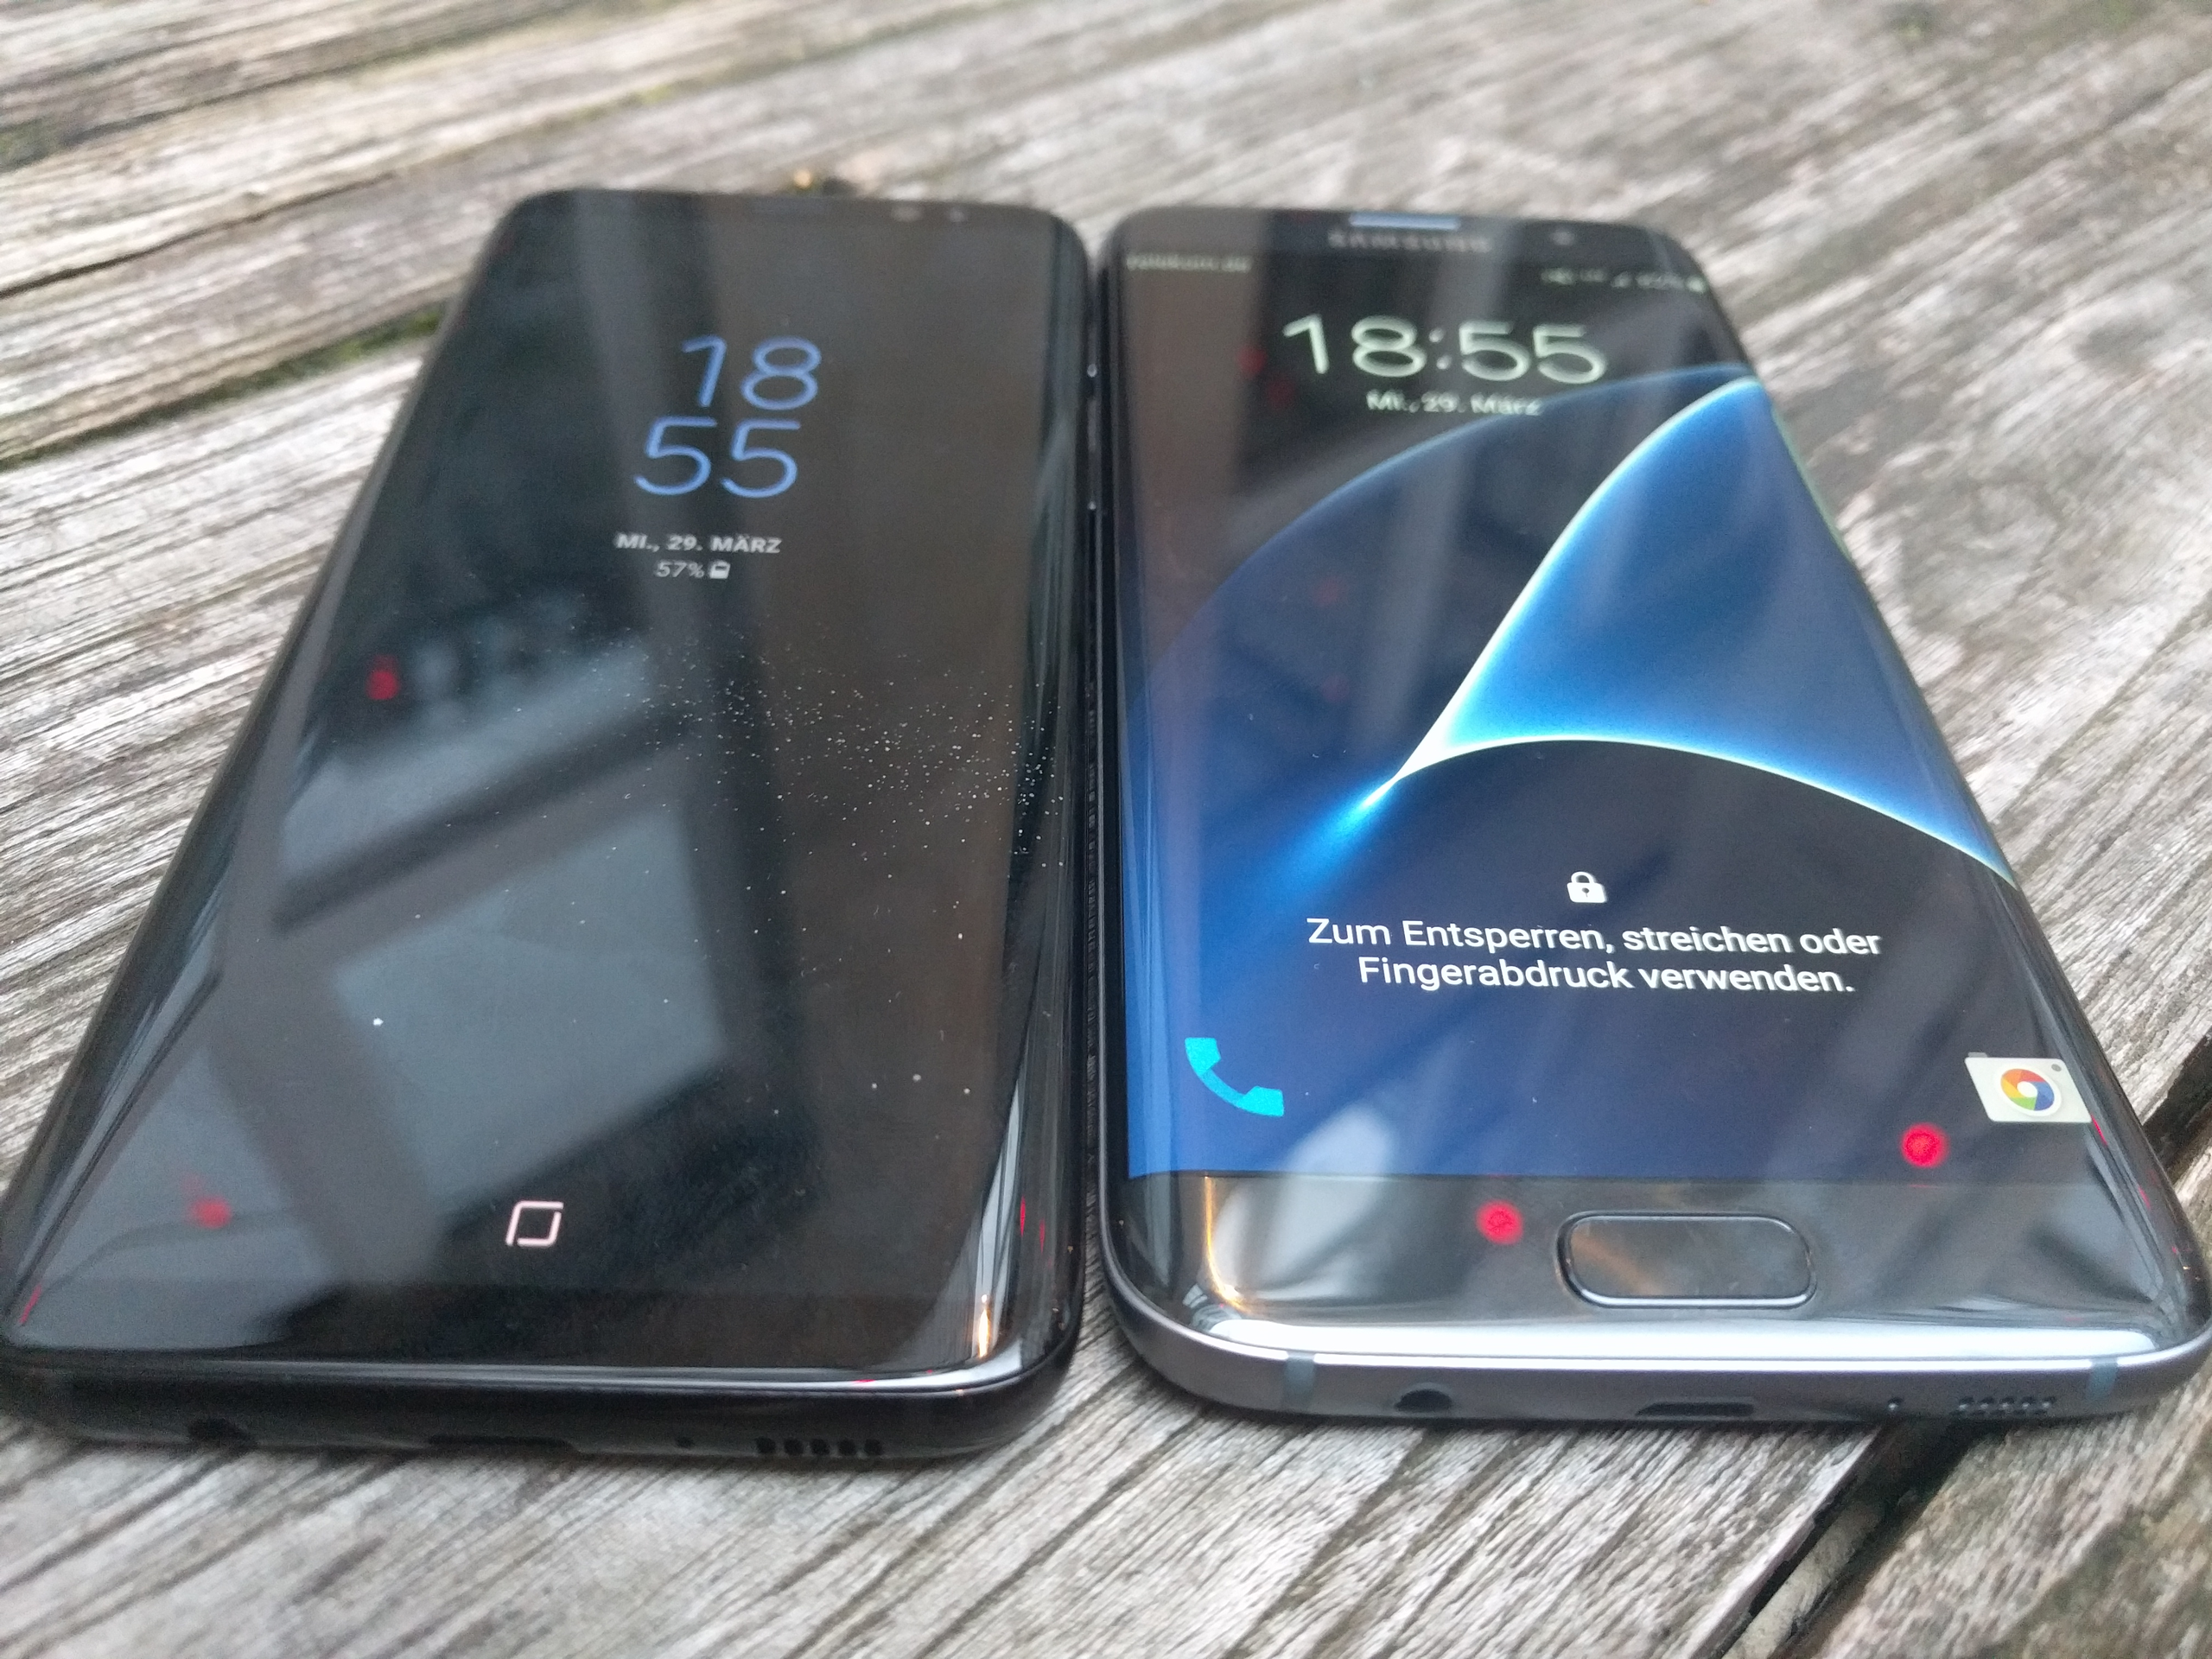
凭借其Galaxy S8,三星创造了一个优秀的产品,甚至比其较大的Galaxy S8 +姐妹机型更好一些。这与S7产品线是不同的,然而Plus型号不能利用其较大的电池,并且更重。 此外,指纹扫描仪的位置由于其尺寸问题而不能达到一定舒适度。因此,当不需要较大屏幕时,可以节省100欧元(〜110美元)的额外费用。
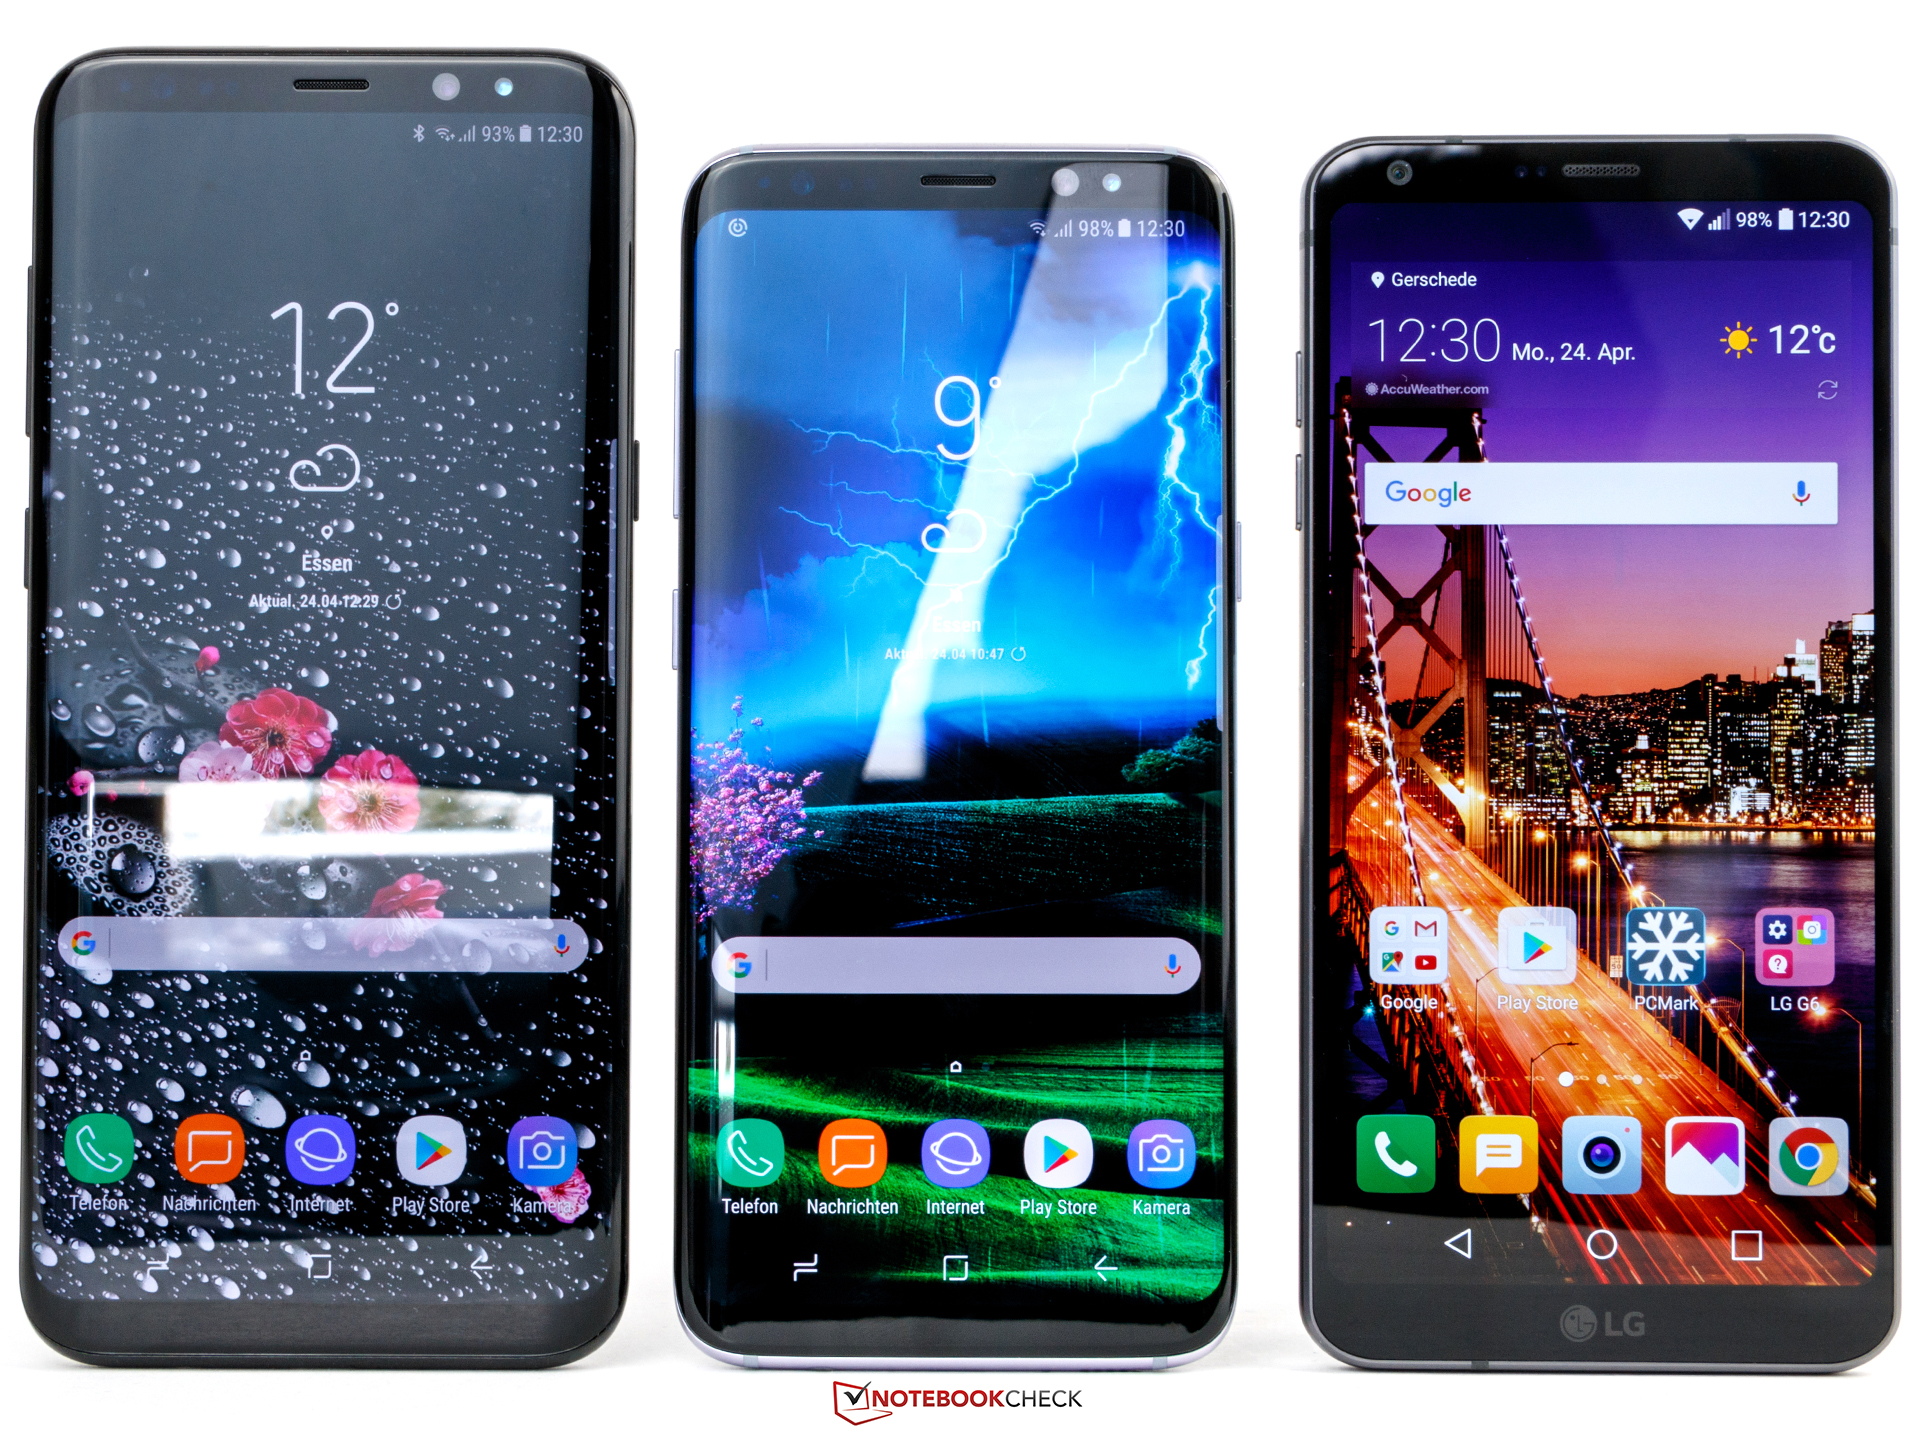
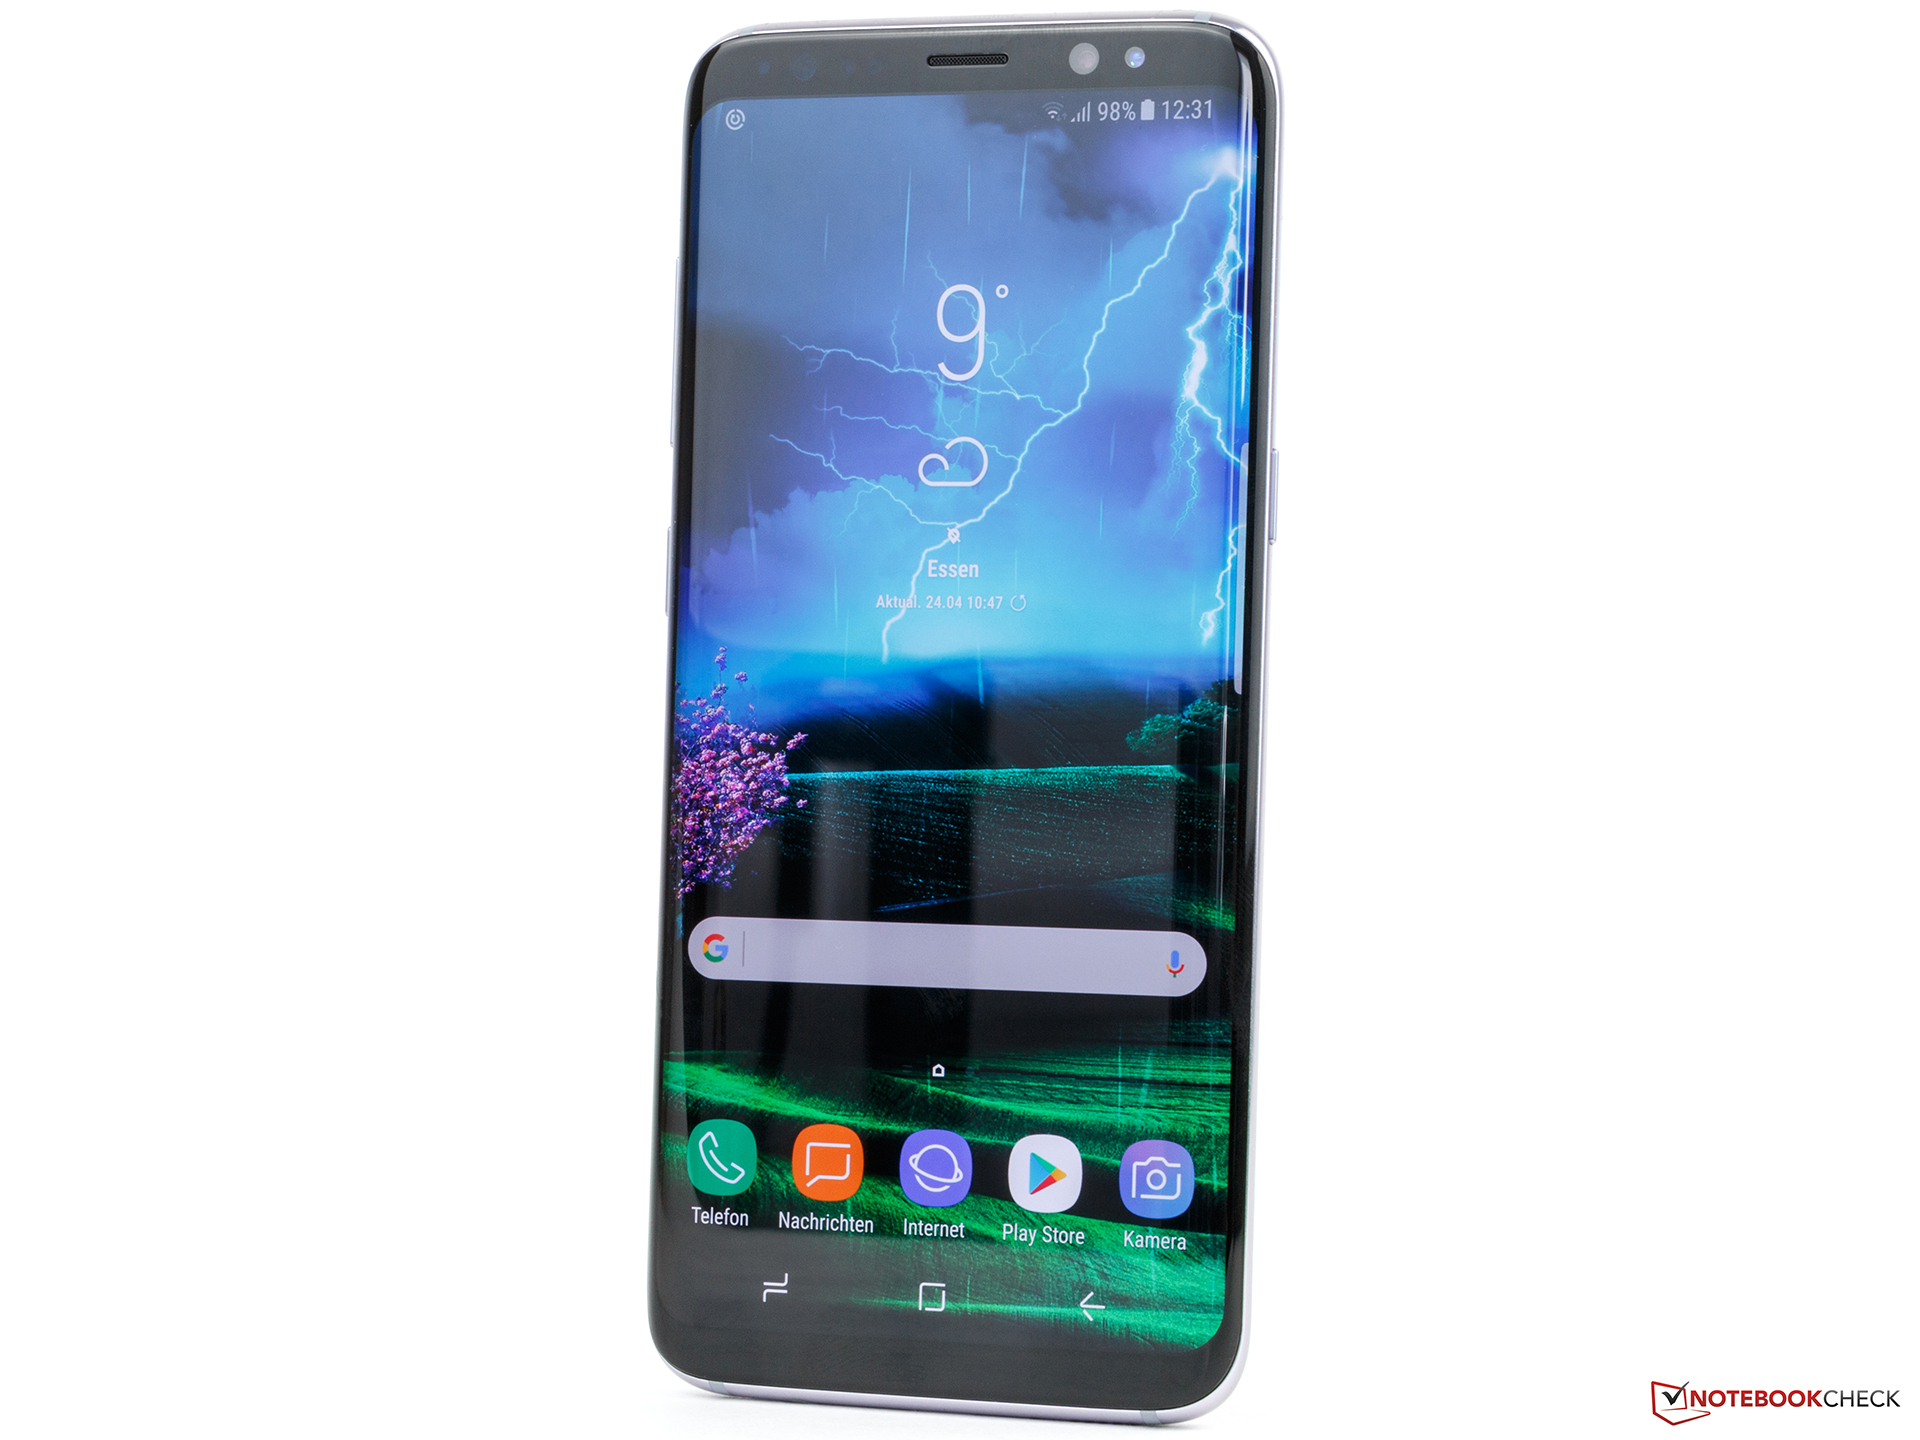
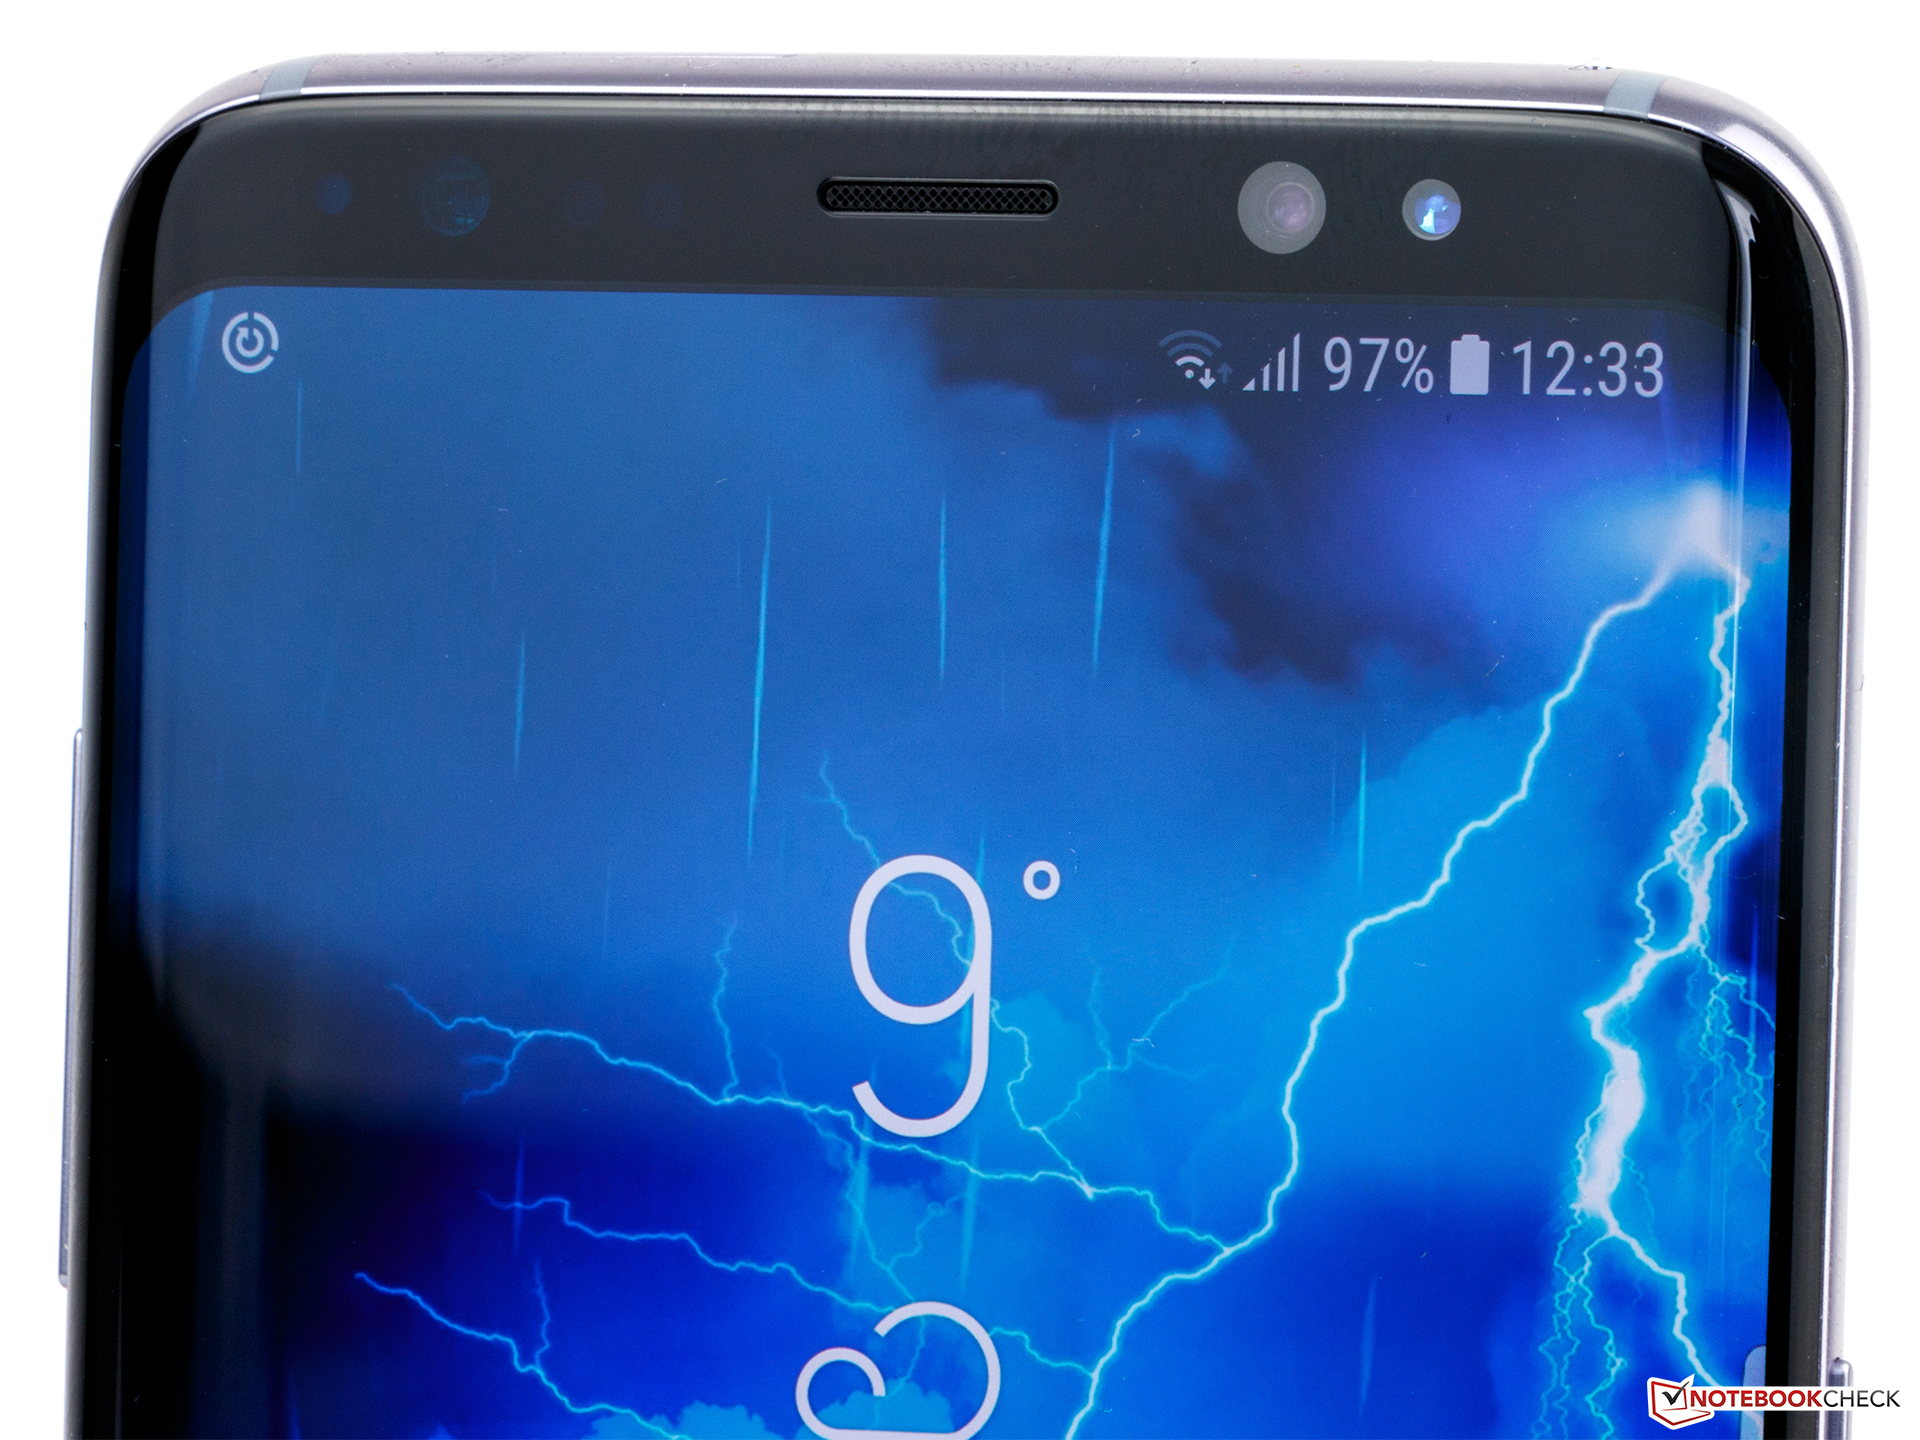
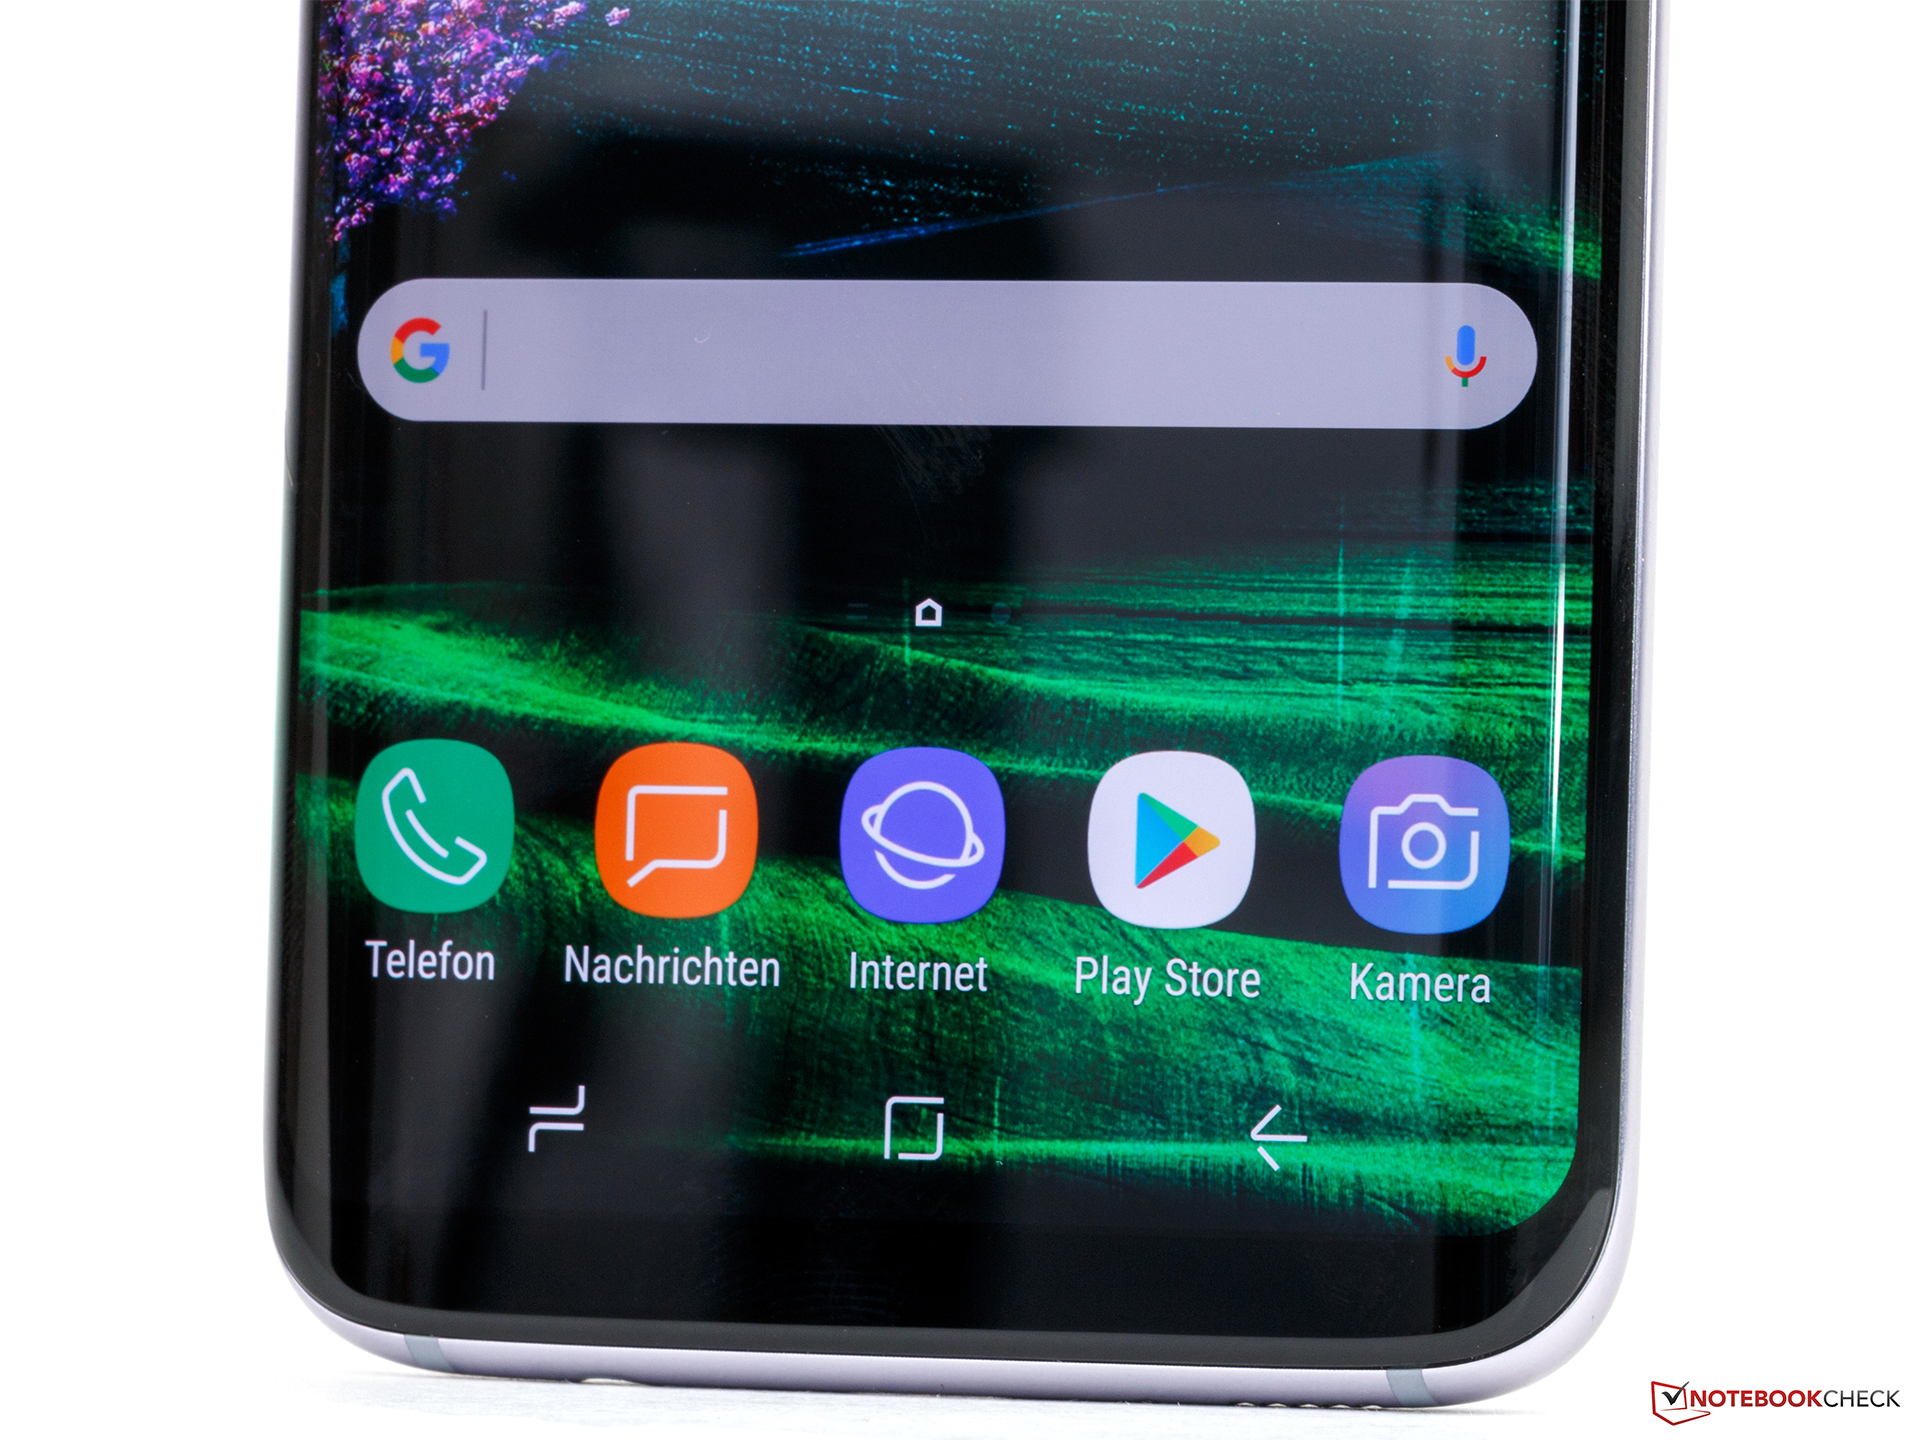
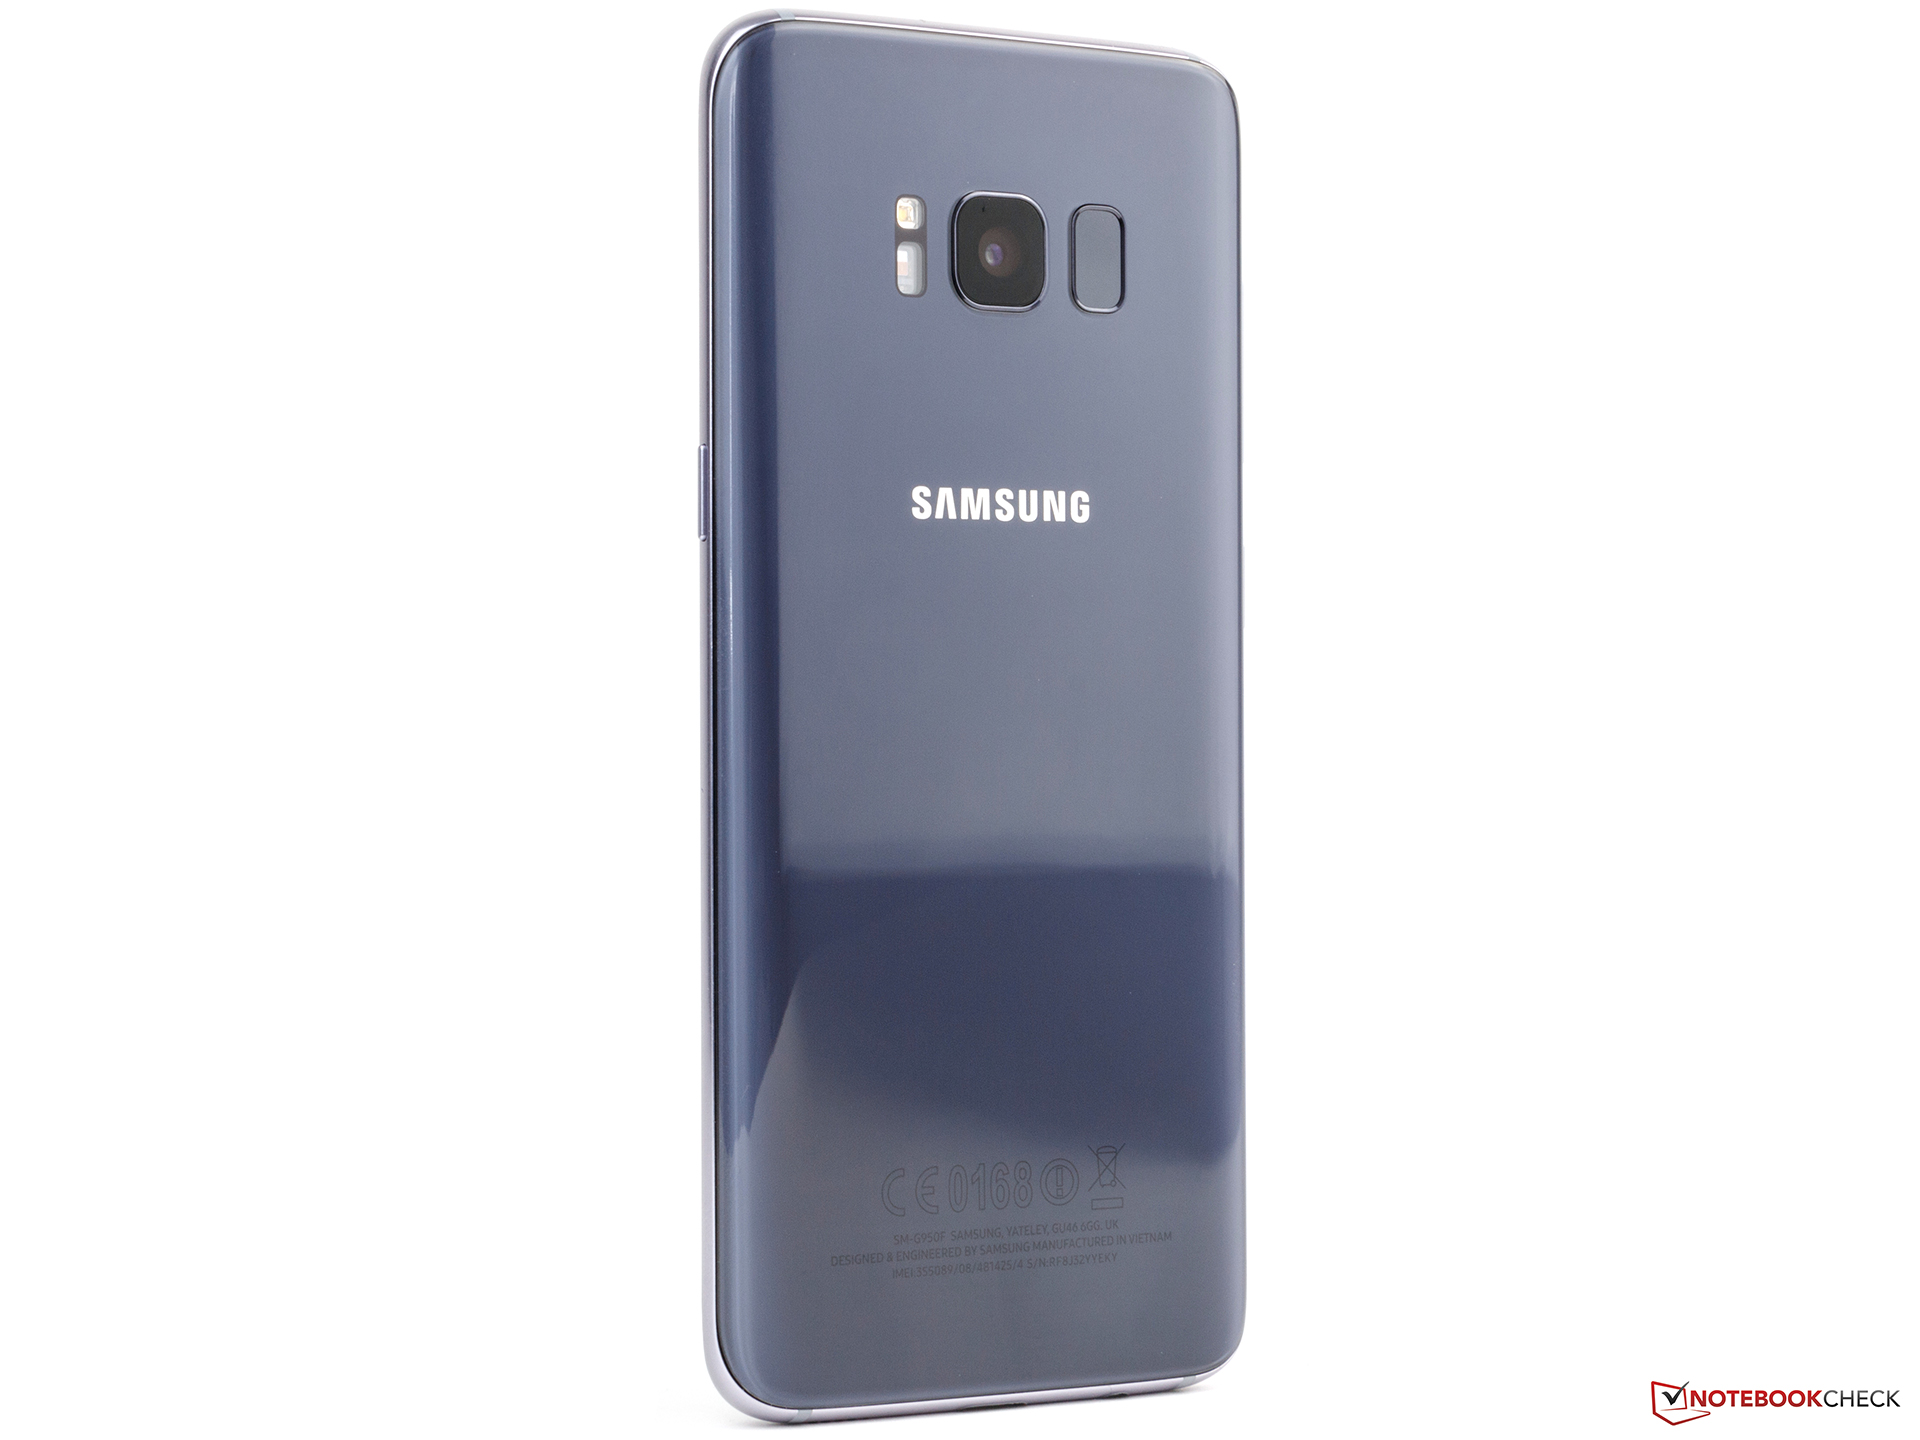
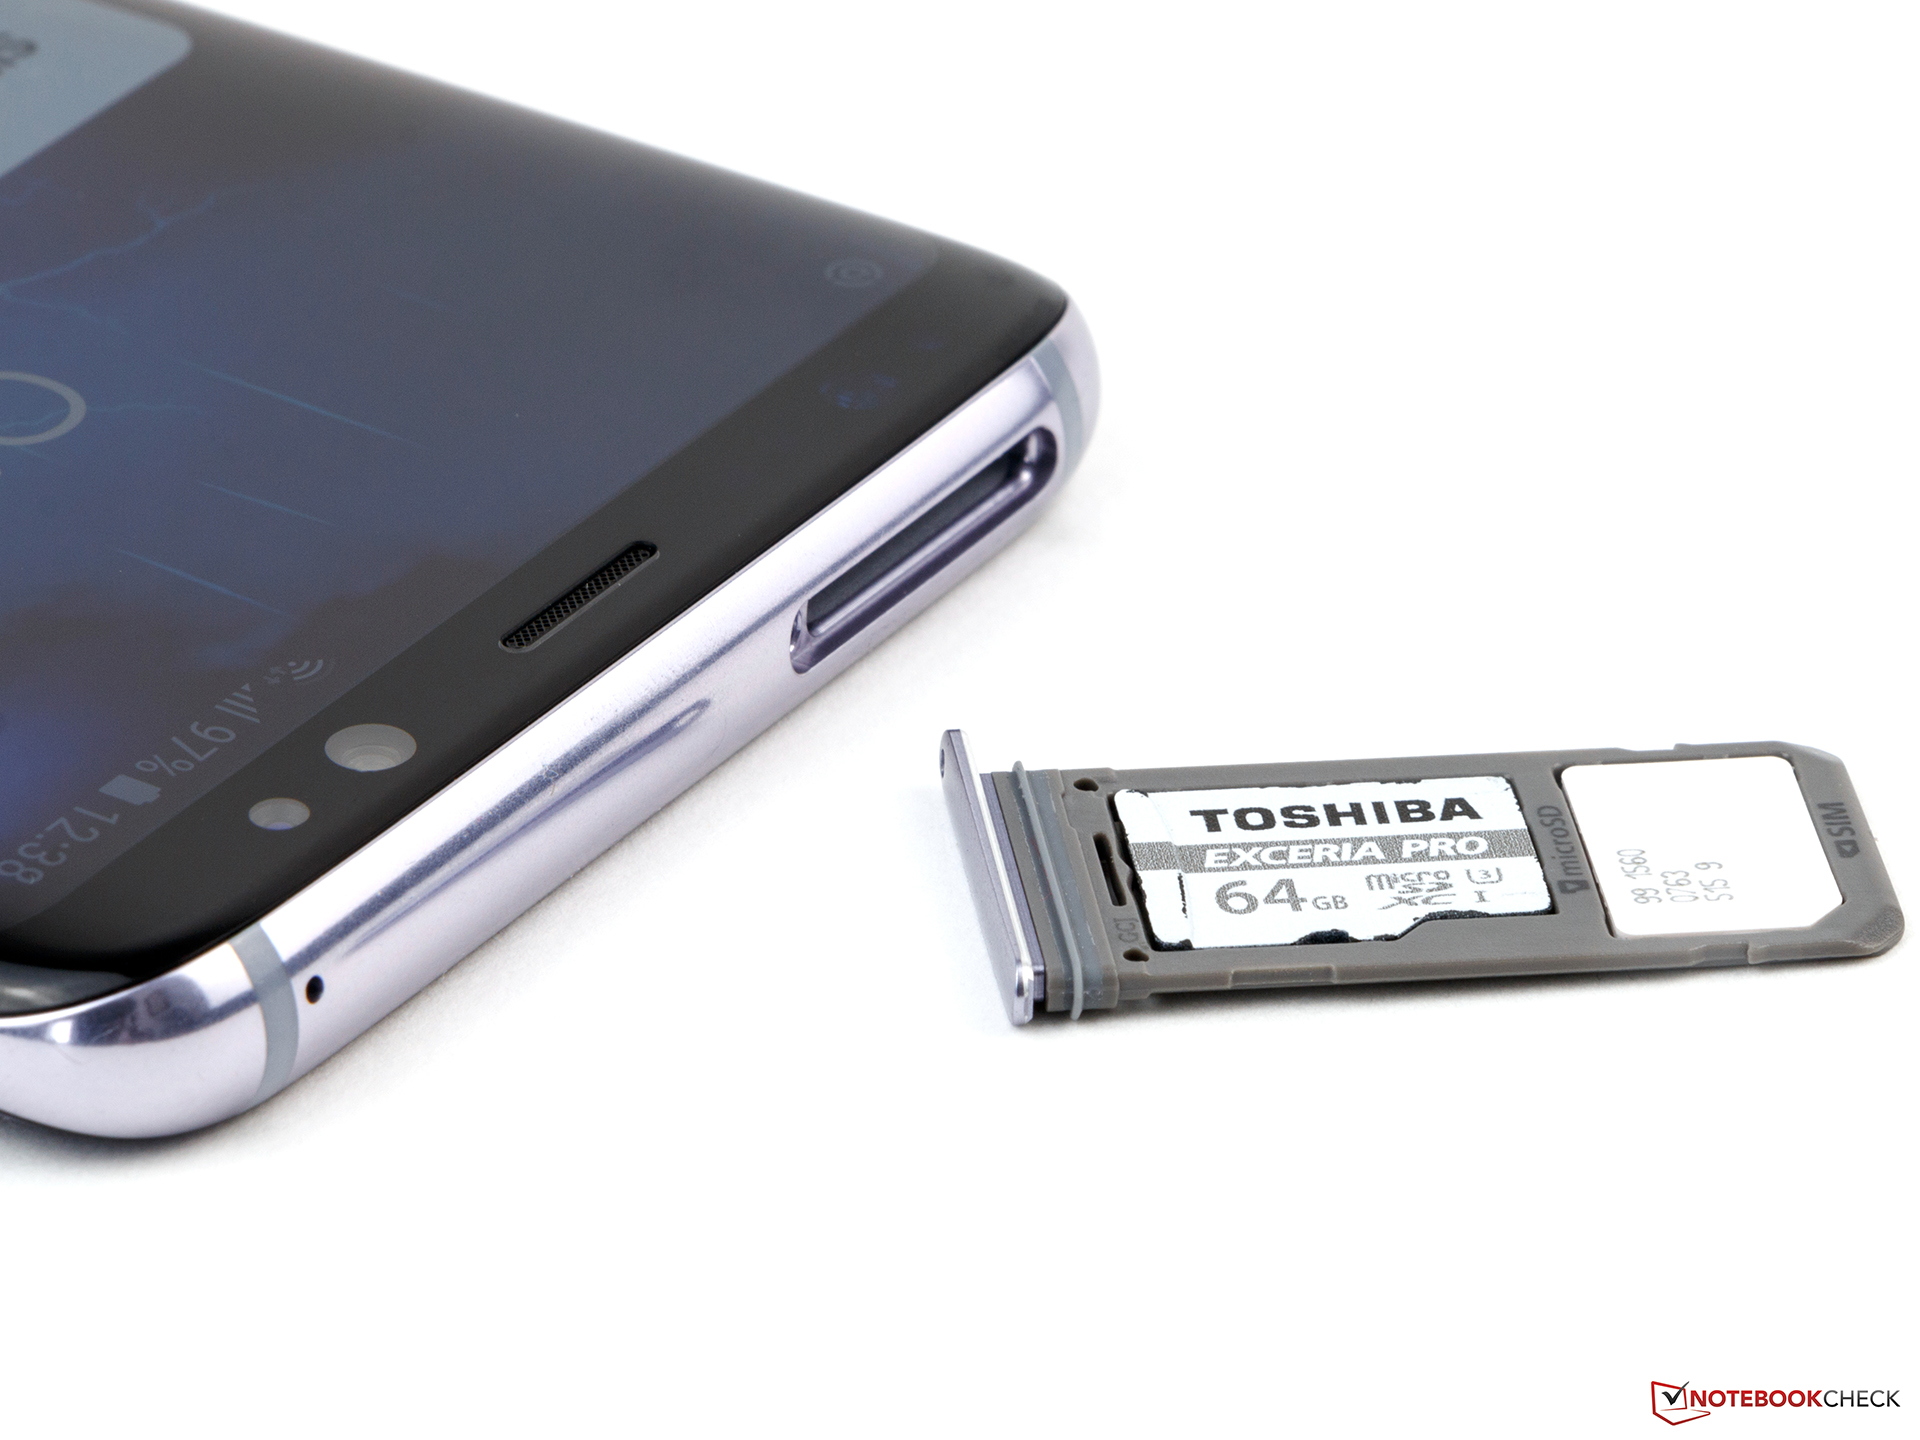
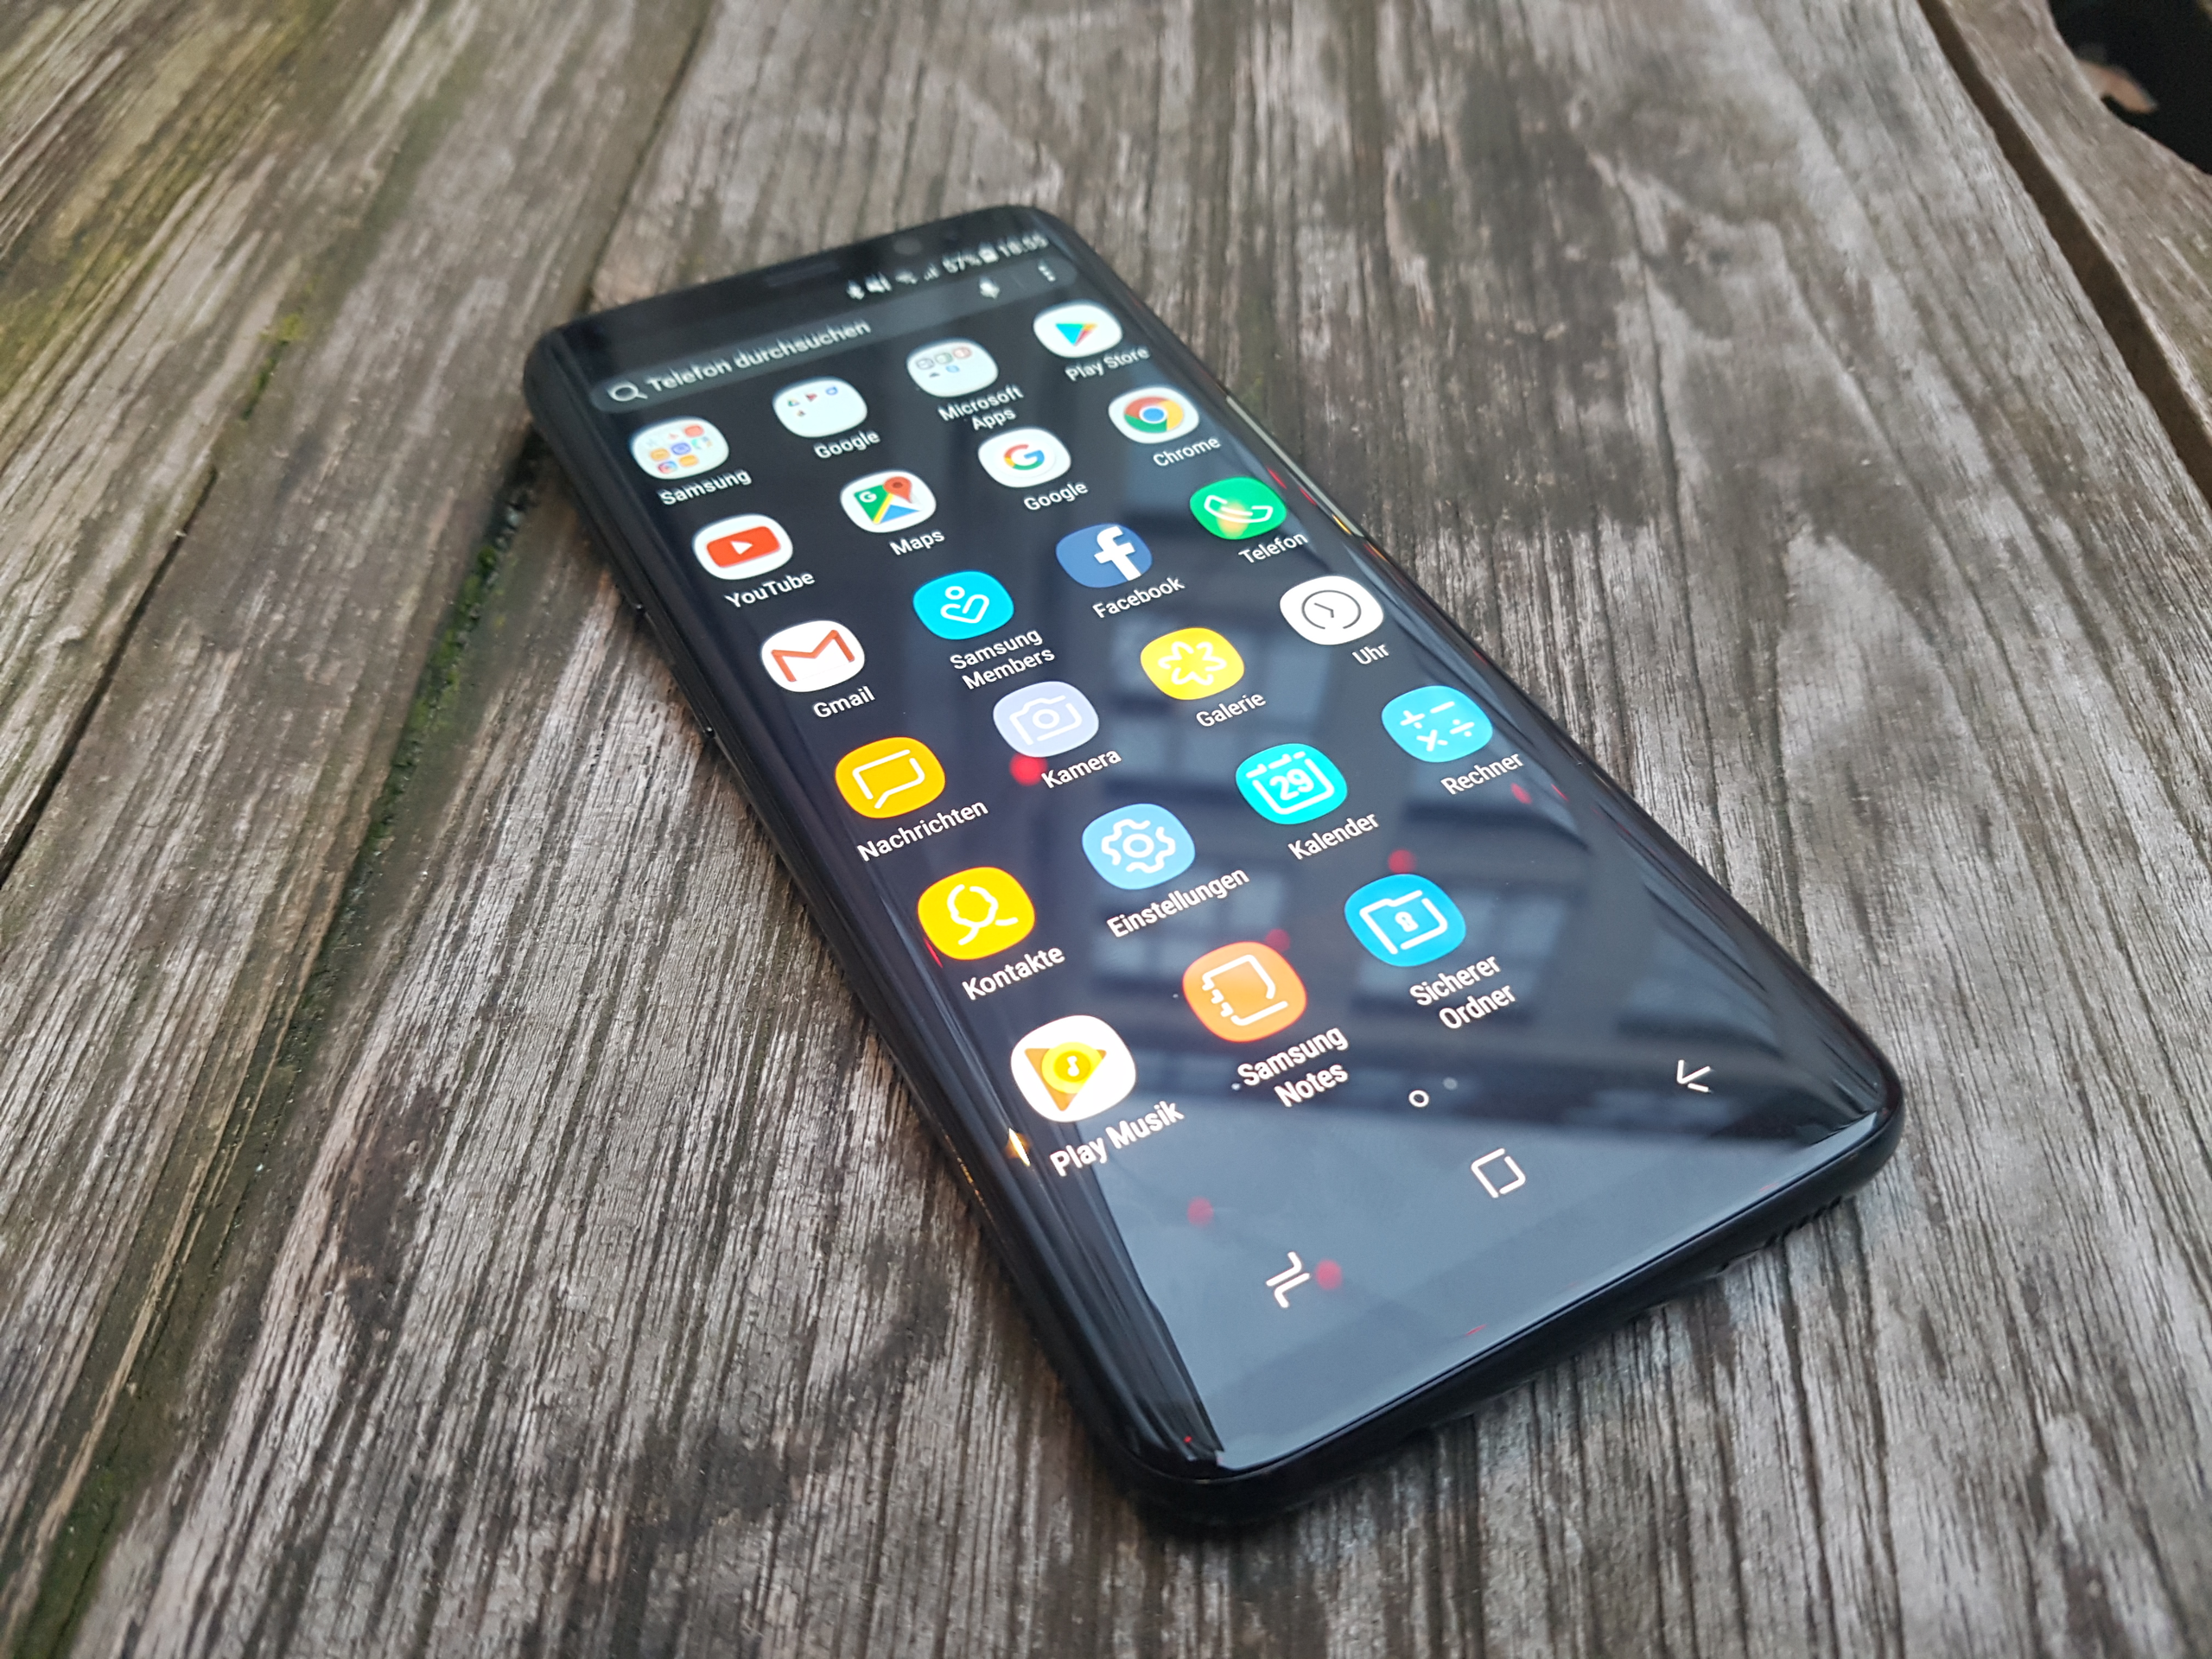
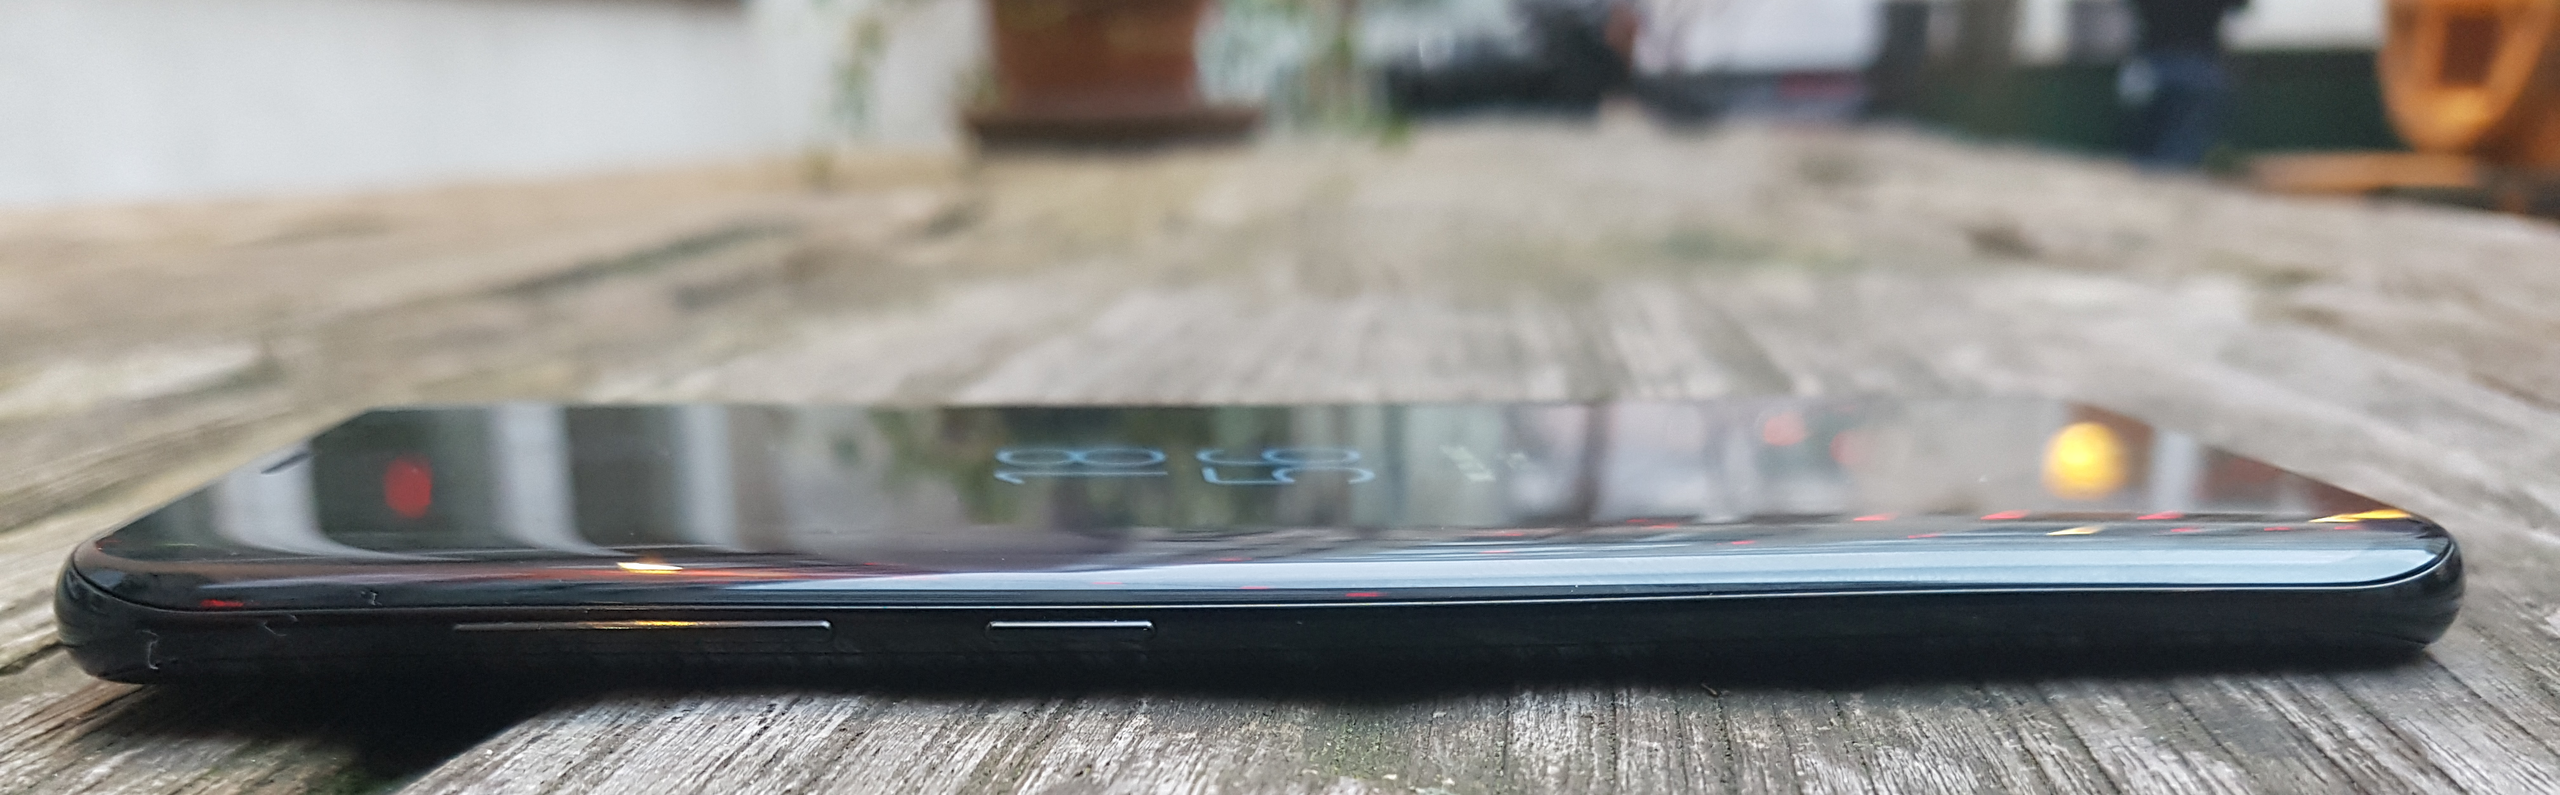
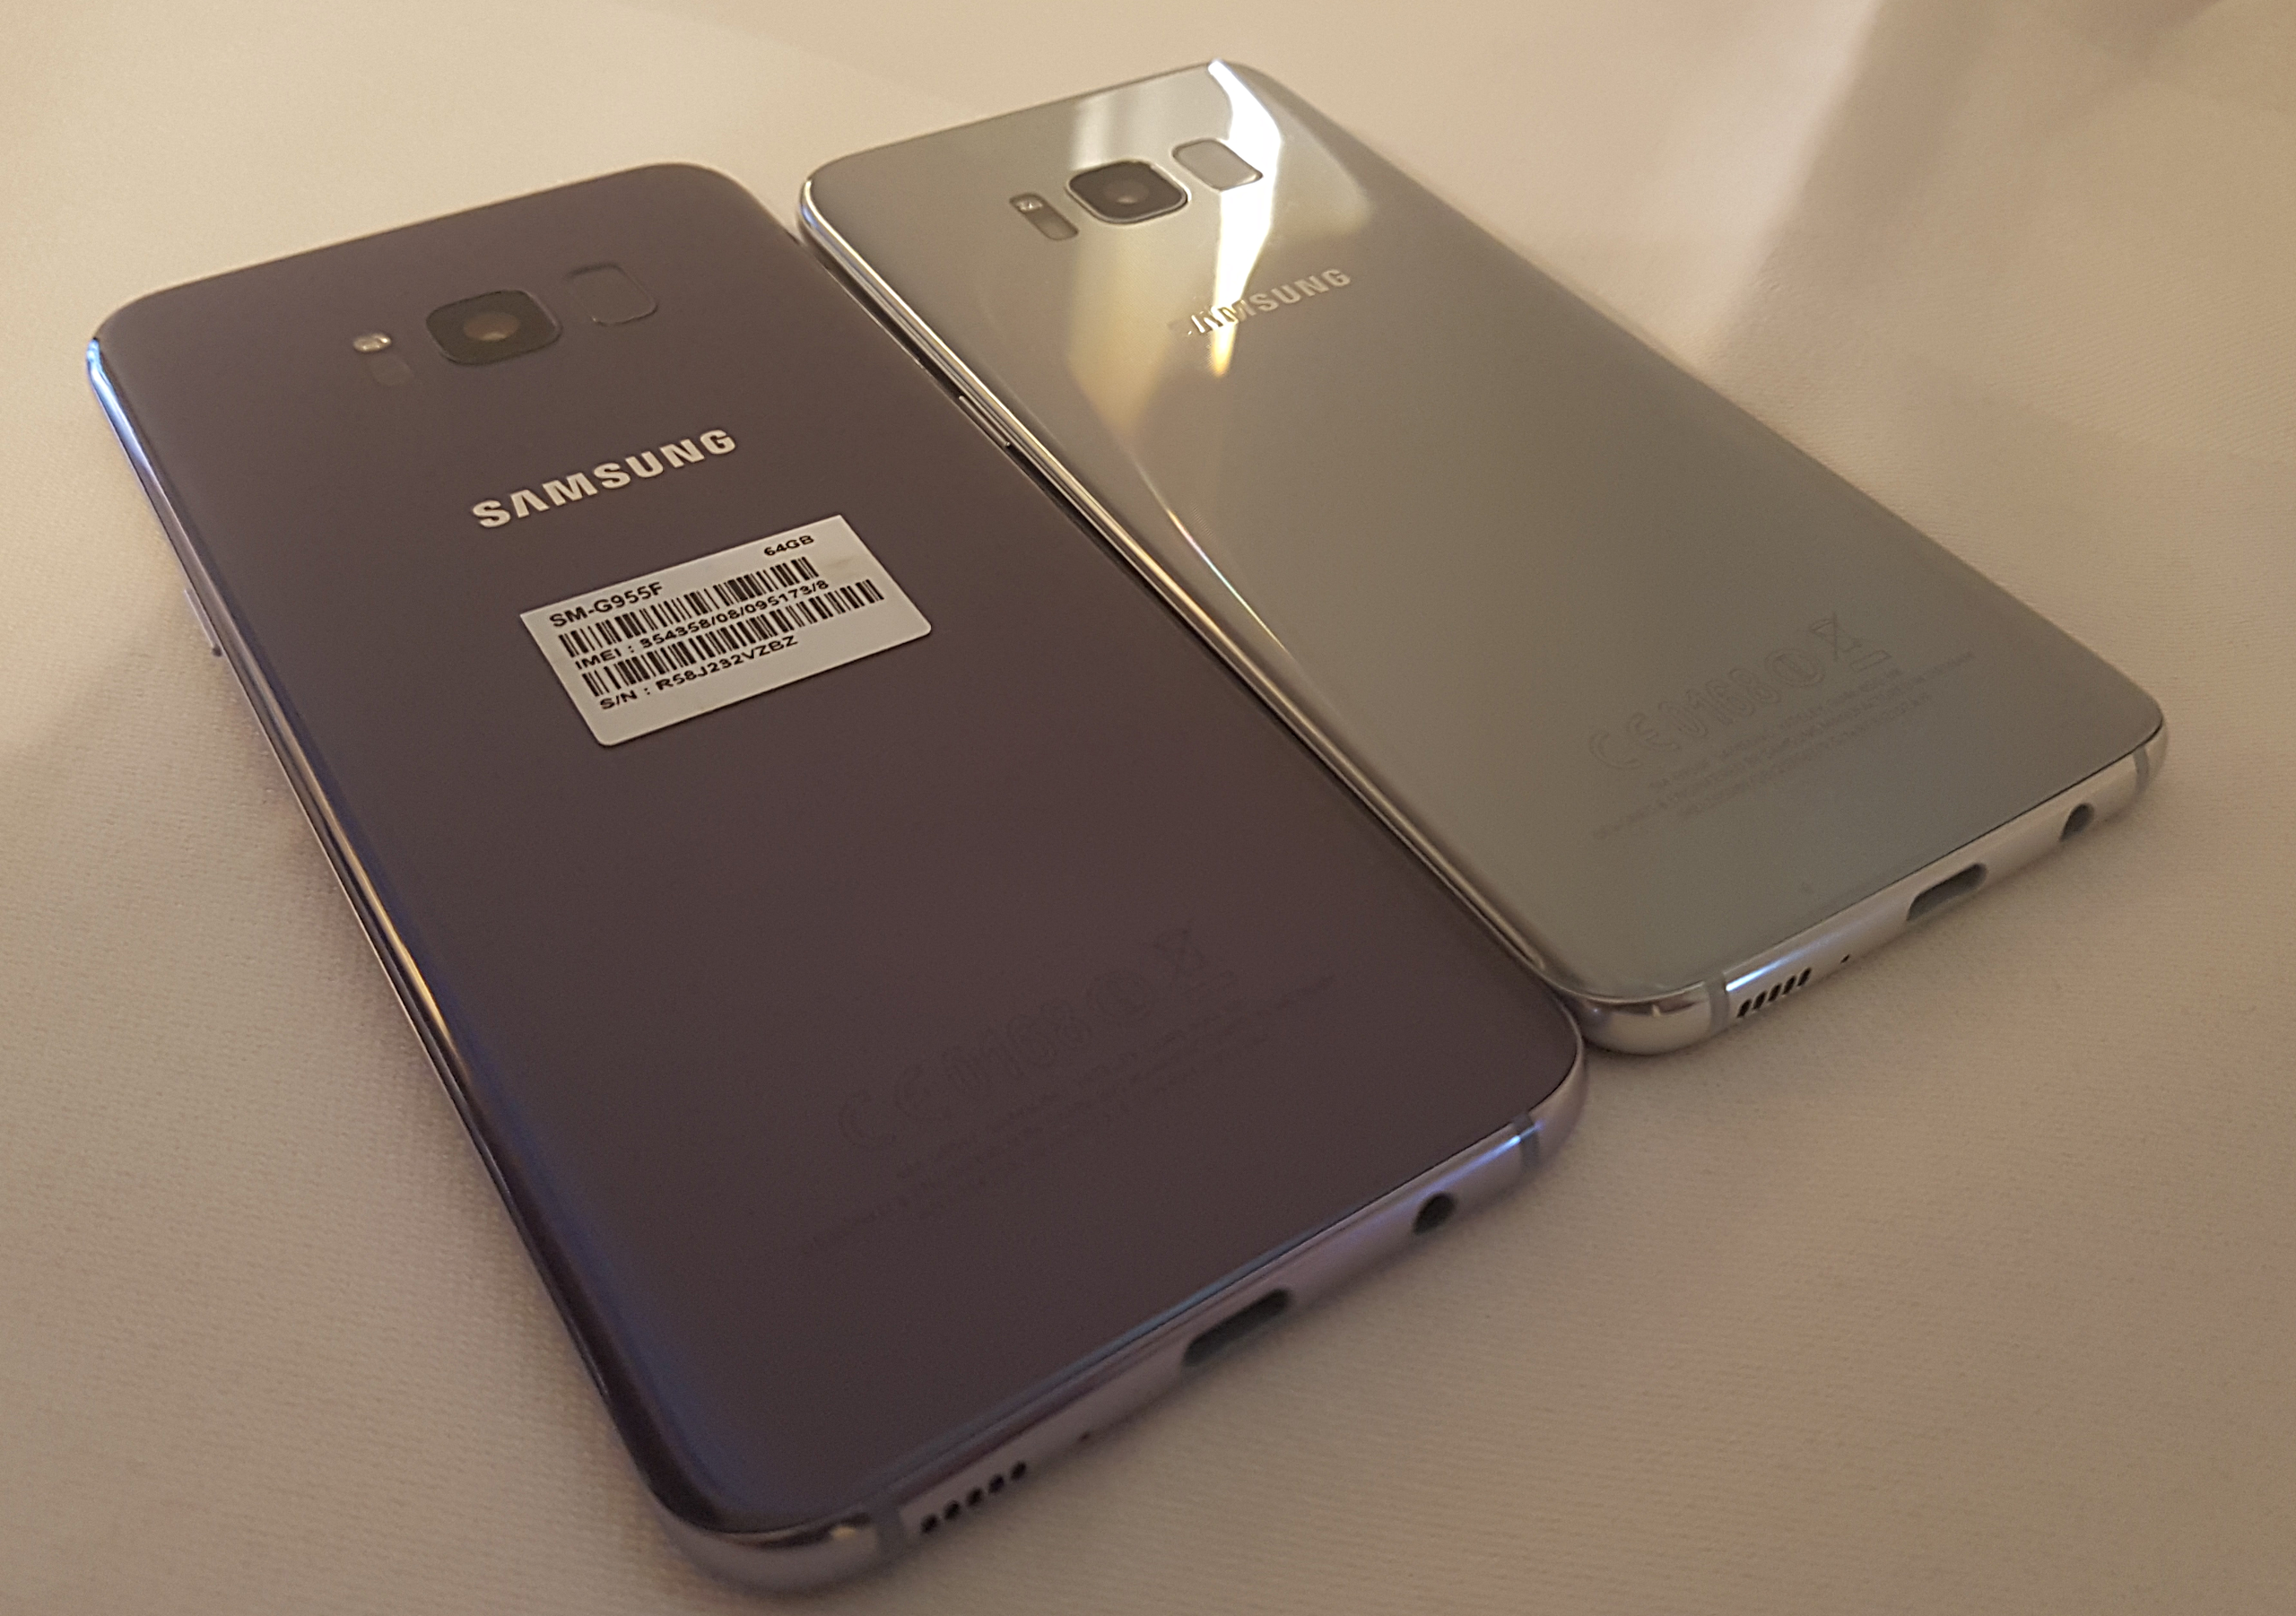
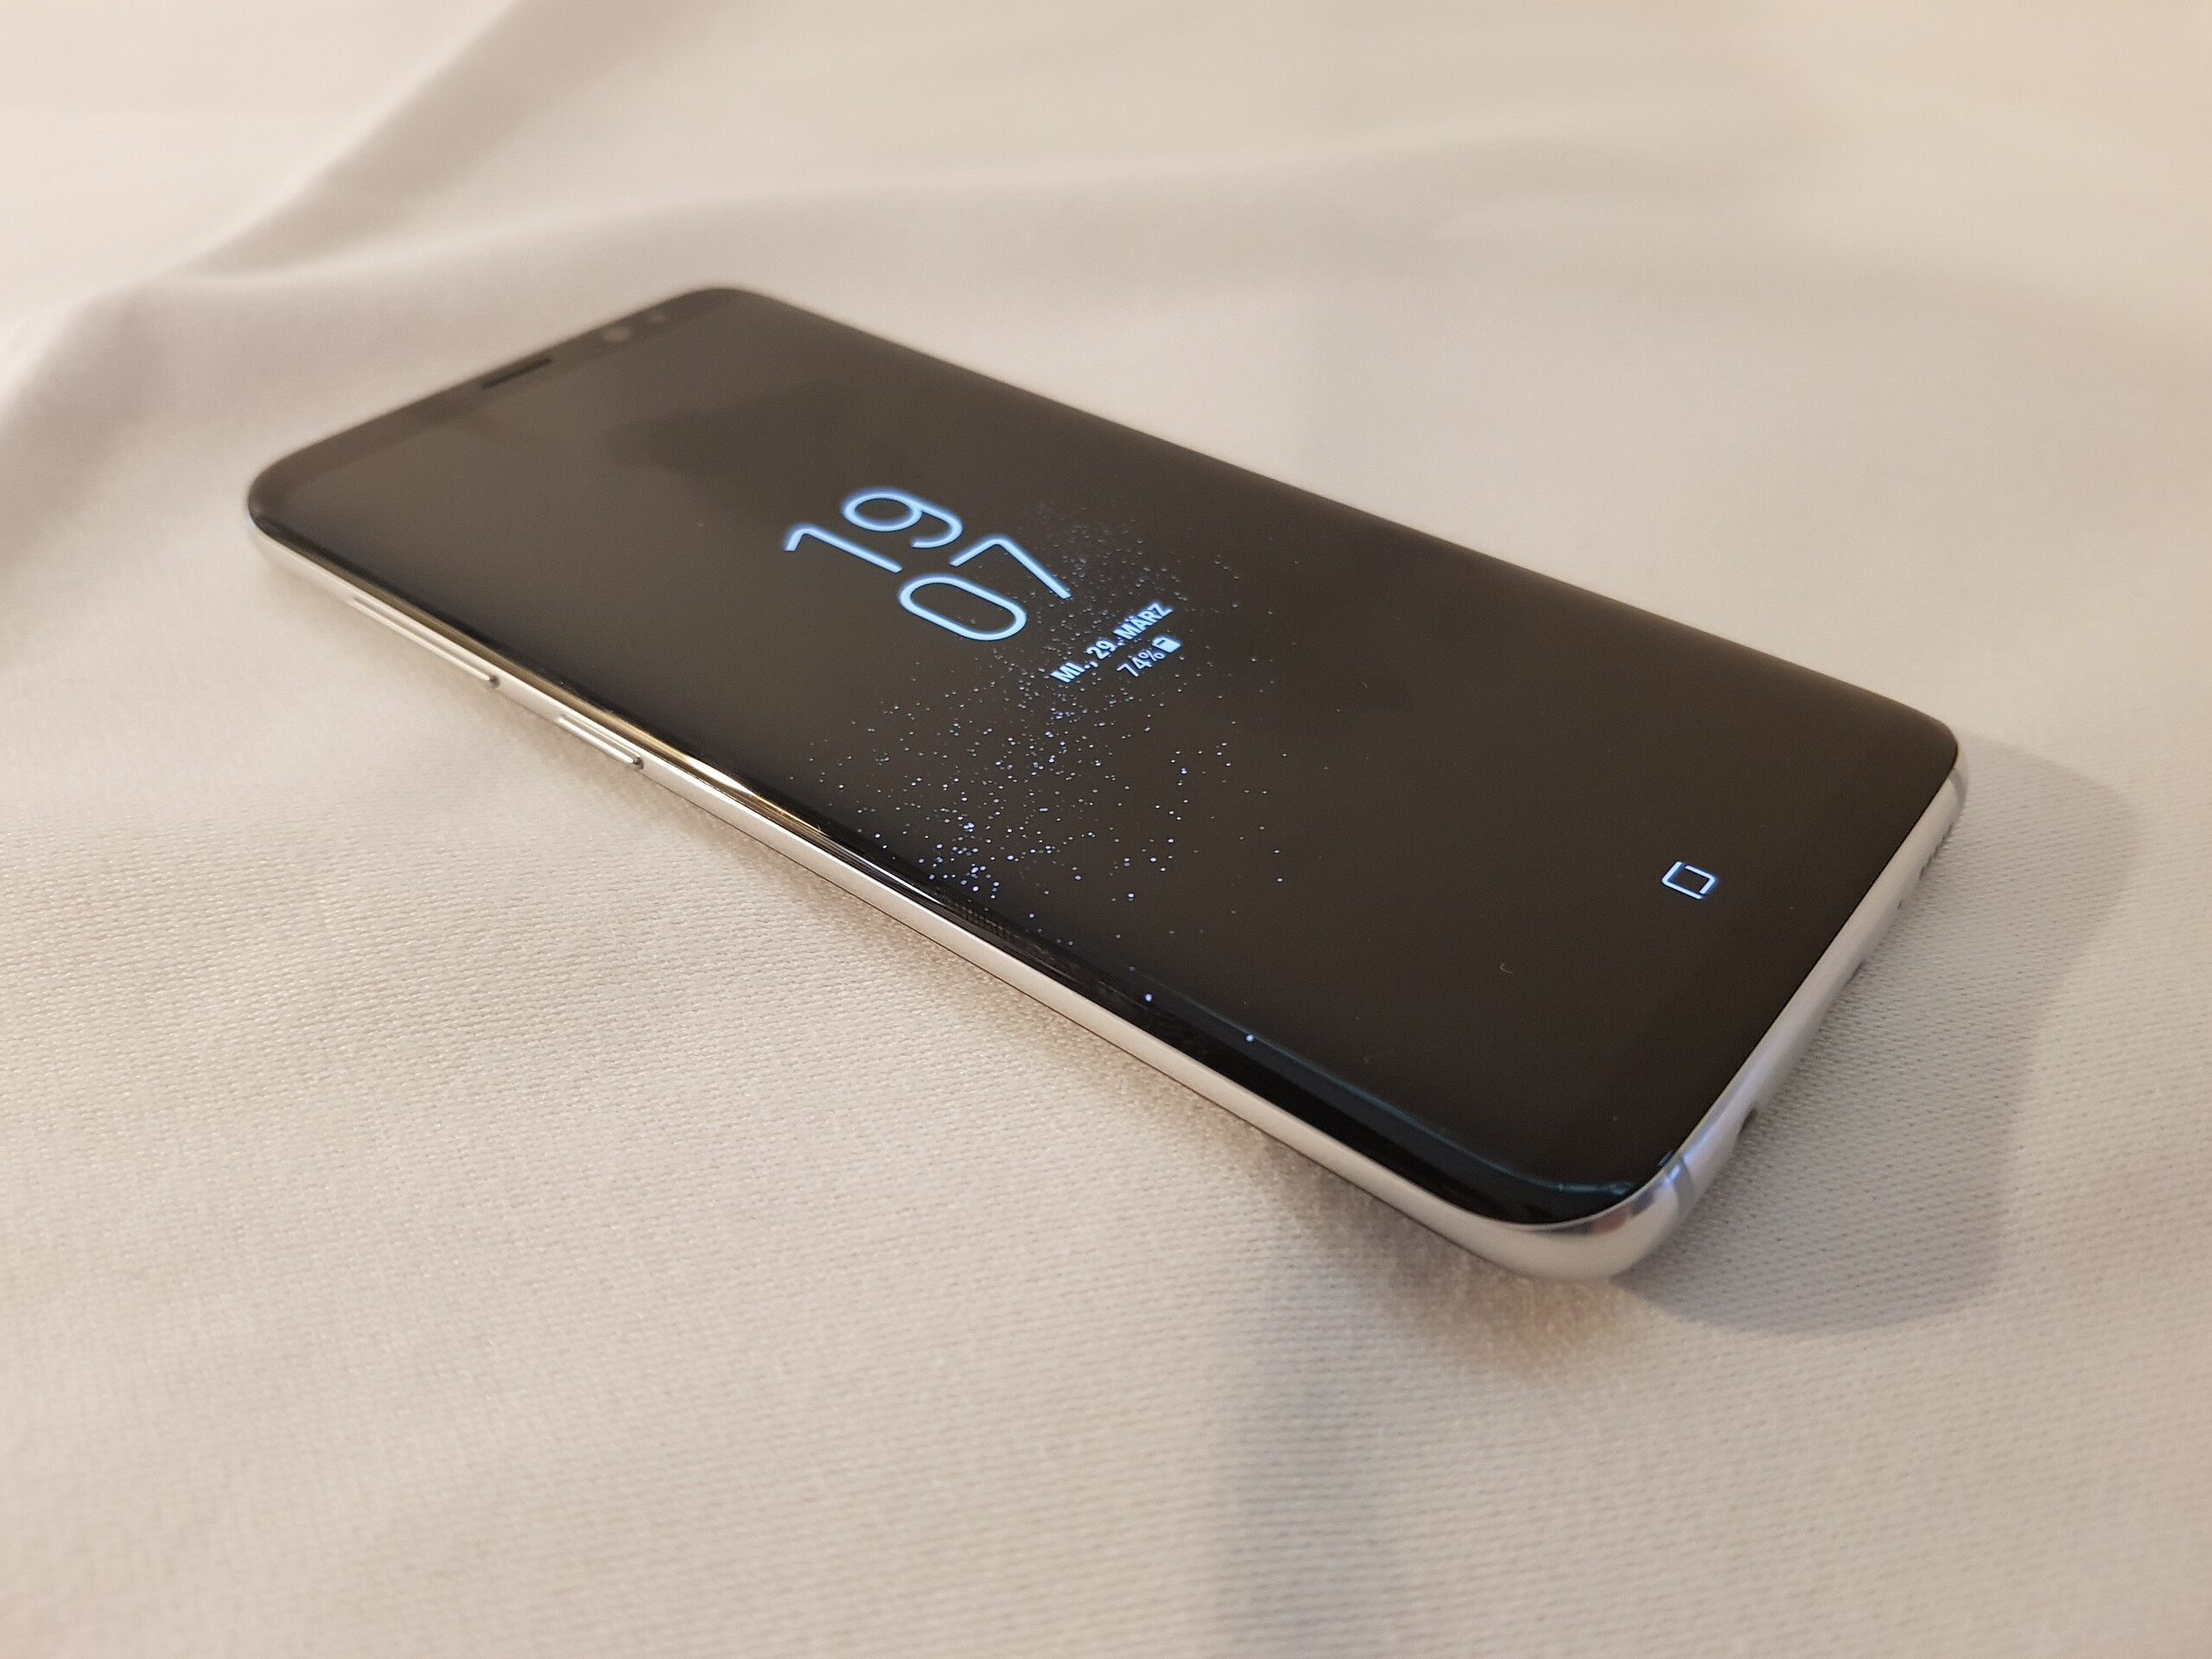
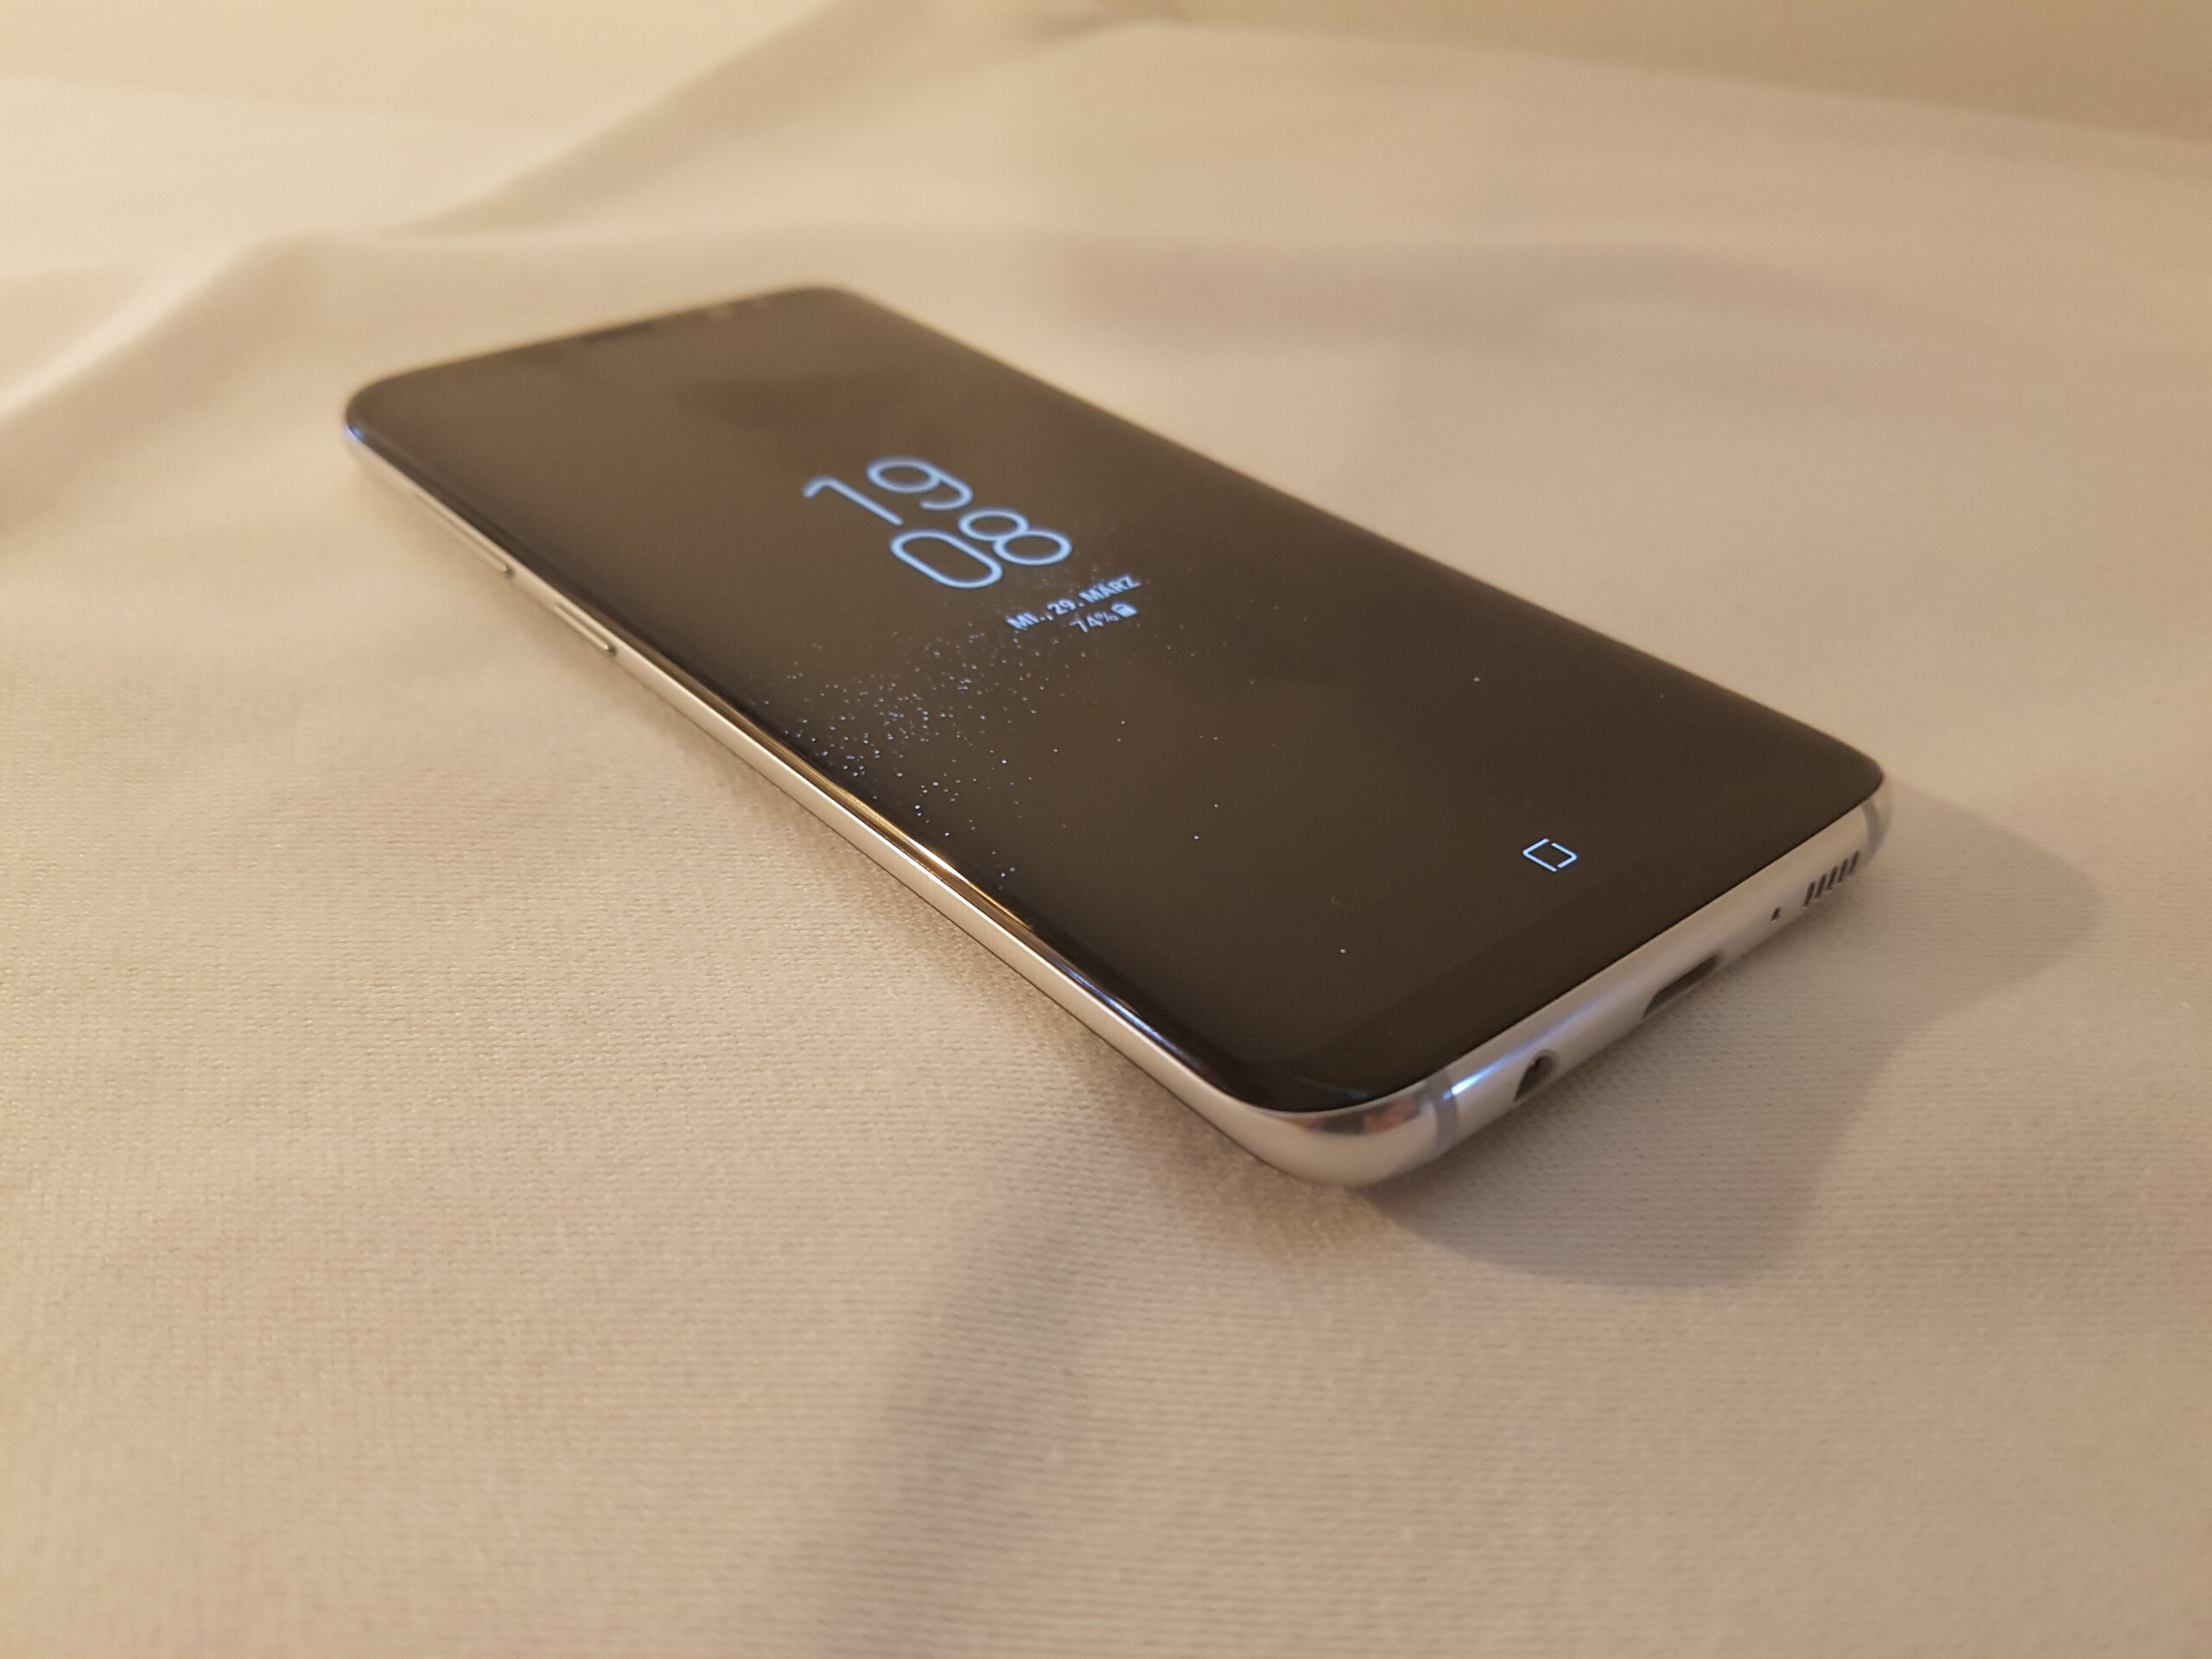
该智能手机拥有时尚的设计和新无边框显示屏。再现了准确的色彩,亮度高和反射少,这也是Galaxy S8的明显优点。另外,配备了新的可以提升性能的SoC,还安装了一个千兆位LTE模块。不过,三星不为该机提供双SIM卡的机型,实在太糟糕了。
尽管如此,三星Galaxy S8还是得接受一些批评,即使它是一款出色的智能手机。
多样化的安全功能也是一个很强的加分点,但是智能手机不应该使用脸部识别,因为这种方法太容易被蒙混过关。不幸的是,个人助理Bixby还不完整,不能让我们信服。
我们希望三星给消费者更多的自由。例如,128 GB型号(6 GB 内存)在欧洲无法获取,另外,如果客户不在亚洲,客户将无法选择所有可用的颜色。
然而,三星已经很好地升级了其高级智能手机为Galaxy S8,它拥有时尚的设计,一个超级棒的相机,非常好的电池续航时间和一个优秀的屏幕。
注:本文是基于完整评测的缩减版本,阅读完整的英文评测,请点击这里。
Samsung Galaxy S8
- 09/03/2022 v7 (old)
Marcus Herbrich, Daniel Schmidt