技嘉Aero 15-XB笔记本电脑评测:引领OLED科技
Rating | Date | Model | Weight | Height | Size | Resolution | Price |
|---|---|---|---|---|---|---|---|
| 85.8 % v7 (old) | 06 / 2020 | Gigabyte Aero 15 OLED XB-8DE51B0SP i7-10875H, GeForce RTX 2070 Super Max-Q | 2.2 kg | 20 mm | 15.60" | 3840x2160 | |
| 82.8 % v7 (old) | 06 / 2020 | MSI GS66 Stealth 10SFS i9-10980HK, GeForce RTX 2070 Super Max-Q | 2.2 kg | 20 mm | 15.60" | 1920x1080 | |
| 84.4 % v7 (old) | 10 / 2019 | Gigabyte Aero 15 OLED XA i7-9750H, GeForce RTX 2070 Max-Q | 2.2 kg | 20 mm | 15.60" | 3840x2160 | |
| 84 % v7 (old) | 08 / 2019 | Acer Predator Triton 500 PT515-51-71PZ i7-9750H, GeForce RTX 2070 Max-Q | 2.1 kg | 18 mm | 15.60" | 1920x1080 | |
| 82.3 % v7 (old) | 10 / 2019 | HP Omen X 2S 15-dg0075cl i7-9750H, GeForce RTX 2070 Max-Q | 2.4 kg | 19.8 mm | 15.60" | 1920x1080 | |
| 82.8 % v7 (old) | 12 / 2019 | Schenker XMG Neo 15 XNE15M19 i7-9750H, GeForce RTX 2070 Max-Q | 2.1 kg | 22 mm | 15.60" | 1920x1080 |
| SD Card Reader | |
| average JPG Copy Test (av. of 3 runs) | |
| Gigabyte Aero 15 OLED XB-8DE51B0SP (Toshiba Exceria Pro SDXC 64 GB UHS-II) | |
| Gigabyte Aero 15 OLED XA (Toshiba Exceria Pro SDXC 64 GB UHS-II) | |
| Schenker XMG Neo 15 XNE15M19 (Toshiba Exceria Pro SDXC 64 GB UHS-II) | |
| maximum AS SSD Seq Read Test (1GB) | |
| Gigabyte Aero 15 OLED XB-8DE51B0SP (Toshiba Exceria Pro SDXC 64 GB UHS-II) | |
| Gigabyte Aero 15 OLED XA (Toshiba Exceria Pro SDXC 64 GB UHS-II) | |
| Schenker XMG Neo 15 XNE15M19 (Toshiba Exceria Pro SDXC 64 GB UHS-II) | |
| Networking | |
| iperf3 transmit AX12 | |
| MSI GS66 Stealth 10SFS | |
| Gigabyte Aero 15 OLED XB-8DE51B0SP | |
| Schenker XMG Neo 15 XNE15M19 | |
| iperf3 receive AX12 | |
| Schenker XMG Neo 15 XNE15M19 | |
| MSI GS66 Stealth 10SFS | |
| Gigabyte Aero 15 OLED XB-8DE51B0SP | |

")
")
| |||||||||||||||||||||||||
Brightness Distribution: 93 %
Center on Battery: 385 cd/m²
Contrast: ∞:1 (Black: 0 cd/m²)
ΔE ColorChecker Calman: 2.46 | ∀{0.5-29.43 Ø4.72}
calibrated: 2.6
ΔE Greyscale Calman: 1.39 | ∀{0.09-98 Ø4.97}
100% sRGB (Argyll 1.6.3 3D)
98% AdobeRGB 1998 (Argyll 1.6.3 3D)
98.2% AdobeRGB 1998 (Argyll 3D)
100% sRGB (Argyll 3D)
99.9% Display P3 (Argyll 3D)
Gamma: 2.31
CCT: 6395 K
| Gigabyte Aero 15 OLED XB-8DE51B0SP Samsung SDCA029, OLED, 3840x2160 | MSI GS66 Stealth 10SFS AUO B156HAN12.0 (AUO328E), IPS, 1920x1080 | Gigabyte Aero 15 OLED XA Samsung SDCA029, OLED, 3840x2160 | Acer Predator Triton 500 PT515-51-71PZ NV156FHM-N4K (BOE082A), IPS, 1920x1080 | HP Omen X 2S 15-dg0075cl AU Optronics AUO82ED, IPS, 1920x1080 | Schenker XMG Neo 15 XNE15M19 NV156FHM-N4G (BOE084D), IPS, 1920x1080 | |
|---|---|---|---|---|---|---|
| Display | -19% | -25% | -25% | -26% | ||
| Display P3 Coverage (%) | 99.9 | 69.5 -30% | 64.6 -35% | 66.2 -34% | 64 -36% | |
| sRGB Coverage (%) | 100 | 99.6 0% | 92.6 -7% | 92.3 -8% | 90.3 -10% | |
| AdobeRGB 1998 Coverage (%) | 98.2 | 70.8 -28% | 66 -33% | 67.2 -32% | 65.4 -33% | |
| Response Times | -485% | -16% | -329% | -546% | -452% | |
| Response Time Grey 50% / Grey 80% * (ms) | 2.2 ? | 14 ? -536% | 2.4 ? -9% | 5.2 ? -136% | 15.2 ? -591% | 9.6 ? -336% |
| Response Time Black / White * (ms) | 1.8 ? | 9.6 ? -433% | 2.2 ? -22% | 11.2 ? -522% | 10.8 ? -500% | 12 ? -567% |
| PWM Frequency (Hz) | 60 ? | 60 ? | ||||
| Screen | -34% | -31% | -34% | -67% | -31% | |
| Brightness middle (cd/m²) | 385 | 316 -18% | 373 -3% | 288 -25% | 324.8 -16% | 313 -19% |
| Brightness (cd/m²) | 390 | 311 -20% | 375 -4% | 265 -32% | 316 -19% | 295 -24% |
| Brightness Distribution (%) | 93 | 92 -1% | 93 0% | 84 -10% | 84 -10% | 89 -4% |
| Black Level * (cd/m²) | 0.21 | 0.22 | 0.26 | 0.3 | ||
| Colorchecker dE 2000 * | 2.46 | 3.03 -23% | 3.98 -62% | 3.22 -31% | 4.96 -102% | 3.33 -35% |
| Colorchecker dE 2000 max. * | 4.01 | 7.32 -83% | 6.28 -57% | 6.26 -56% | 8.95 -123% | 6.25 -56% |
| Colorchecker dE 2000 calibrated * | 2.6 | 1.1 58% | 1.5 42% | 3.23 -24% | 1.77 32% | |
| Greyscale dE 2000 * | 1.39 | 3.9 -181% | 2.81 -102% | 3.43 -147% | 5 -260% | 3.1 -123% |
| Gamma | 2.31 95% | 2.42 91% | 2.62 84% | 2.41 91% | 2.21 100% | 2.51 88% |
| CCT | 6395 102% | 7439 87% | 6434 101% | 7290 89% | 7742 84% | 6930 94% |
| Color Space (Percent of AdobeRGB 1998) (%) | 98 | 65 -34% | 78 -20% | 60 -39% | 59.8 -39% | 59 -40% |
| Color Space (Percent of sRGB) (%) | 100 | 100 0% | 97 -3% | 93 -7% | 91.8 -8% | 90 -10% |
| Contrast (:1) | 1505 | 1309 | 1249 | 1043 | ||
| Total Average (Program / Settings) | -179% /
-95% | -24% /
-28% | -129% /
-74% | -213% /
-126% | -170% /
-90% |
* ... smaller is better
Display Response Times
| ↔ Response Time Black to White | ||
|---|---|---|
| 1.8 ms ... rise ↗ and fall ↘ combined | ↗ 1 ms rise | 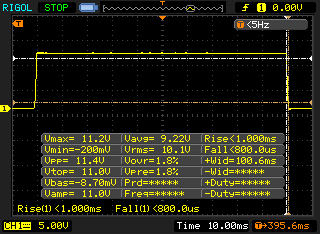 |
| ↘ 0.8 ms fall | ||
| The screen shows very fast response rates in our tests and should be very well suited for fast-paced gaming. In comparison, all tested devices range from 0.1 (minimum) to 240 (maximum) ms. » 10 % of all devices are better. This means that the measured response time is better than the average of all tested devices (19.8 ms). | ||
| ↔ Response Time 50% Grey to 80% Grey | ||
| 2.2 ms ... rise ↗ and fall ↘ combined | ↗ 1 ms rise | 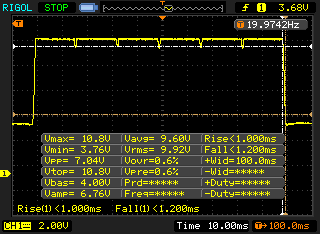 |
| ↘ 1.2 ms fall | ||
| The screen shows very fast response rates in our tests and should be very well suited for fast-paced gaming. In comparison, all tested devices range from 0.165 (minimum) to 636 (maximum) ms. » 11 % of all devices are better. This means that the measured response time is better than the average of all tested devices (31 ms). | ||
Screen Flickering / PWM (Pulse-Width Modulation)
| Screen flickering / PWM detected | 60 Hz | ≤ 80 % brightness setting | 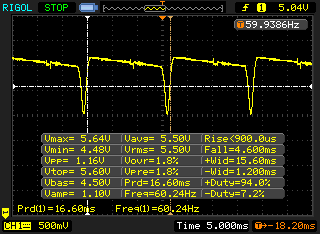 |
The display backlight flickers at 60 Hz (worst case, e.g., utilizing PWM) Flickering detected at a brightness setting of 80 % and below. There should be no flickering or PWM above this brightness setting. The frequency of 60 Hz is very low, so the flickering may cause eyestrain and headaches after extended use. In comparison: 52 % of all tested devices do not use PWM to dim the display. If PWM was detected, an average of 7772 (minimum: 5 - maximum: 343500) Hz was measured. | |||
| Blender - v2.79 BMW27 CPU | |
| MSI GS66 Stealth 10SFS | |
| Gigabyte Aero 15 OLED XB-8DE51B0SP | |
| 7-Zip 18.03 | |
| 7z b 4 -mmt1 | |
| Gigabyte Aero 15 OLED XB-8DE51B0SP | |
| MSI GS66 Stealth 10SFS | |
| 7z b 4 | |
| Gigabyte Aero 15 OLED XB-8DE51B0SP | |
| MSI GS66 Stealth 10SFS | |
| Geekbench 5.5 | |
| Single-Core | |
| Gigabyte Aero 15 OLED XB-8DE51B0SP | |
| MSI GS66 Stealth 10SFS | |
| Multi-Core | |
| Gigabyte Aero 15 OLED XB-8DE51B0SP | |
| MSI GS66 Stealth 10SFS | |
| HWBOT x265 Benchmark v2.2 - 4k Preset | |
| Gigabyte Aero 15 OLED XB-8DE51B0SP | |
| MSI GS66 Stealth 10SFS | |
| LibreOffice - 20 Documents To PDF | |
| MSI GS66 Stealth 10SFS | |
| Gigabyte Aero 15 OLED XB-8DE51B0SP | |
| R Benchmark 2.5 - Overall mean | |
| MSI GS66 Stealth 10SFS | |
| Gigabyte Aero 15 OLED XB-8DE51B0SP | |
* ... smaller is better
| DPC Latencies / LatencyMon - interrupt to process latency (max), Web, Youtube, Prime95 | |
| MSI GS66 Stealth 10SFS | |
| Gigabyte Aero 15 OLED XB-8DE51B0SP | |
* ... smaller is better
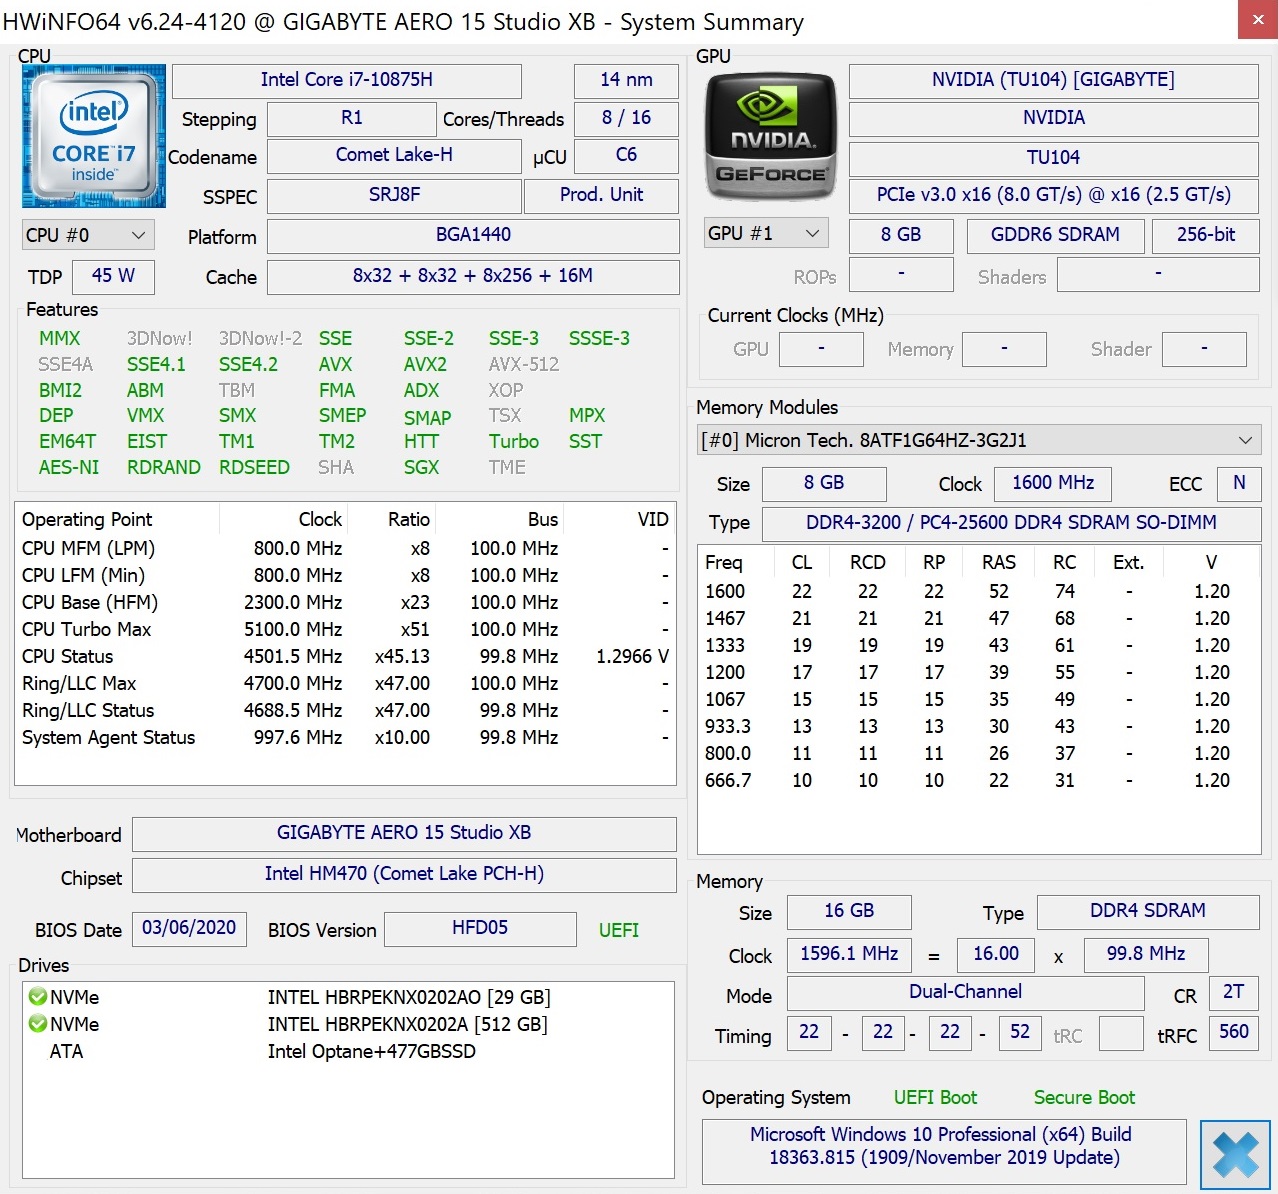
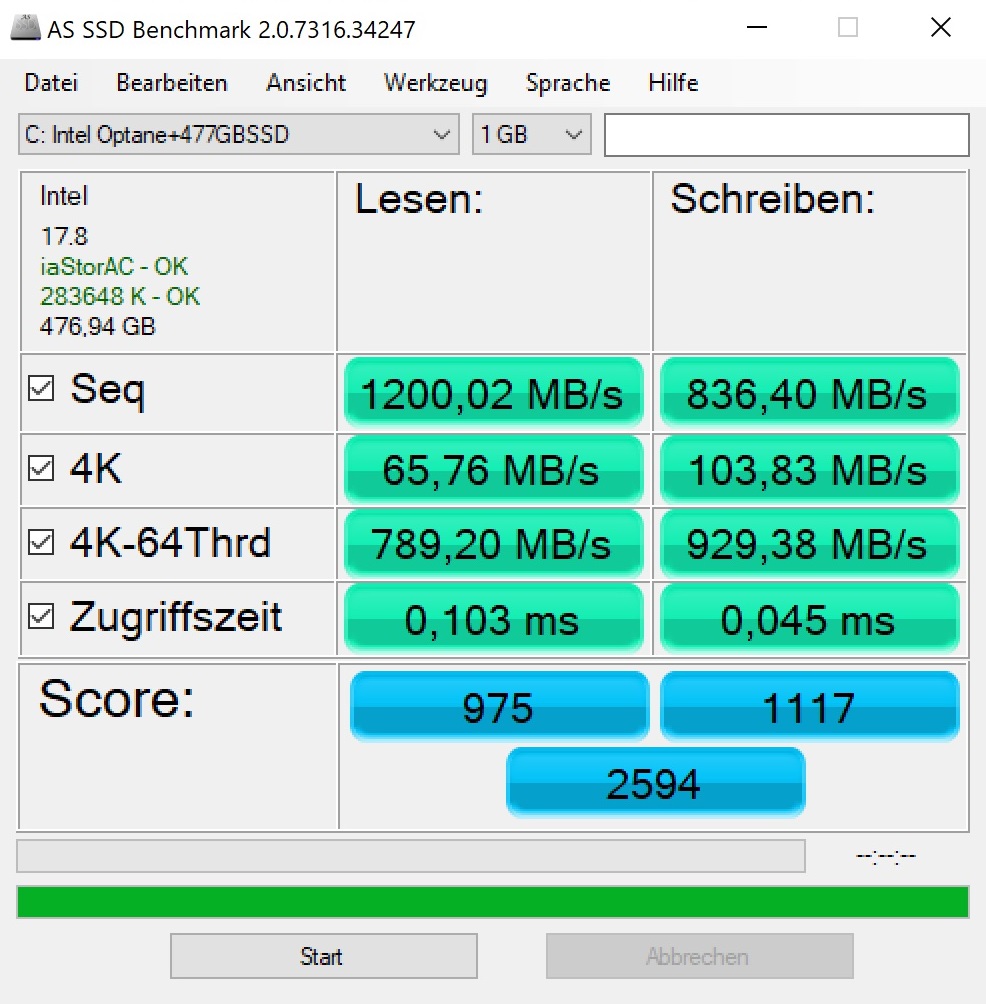
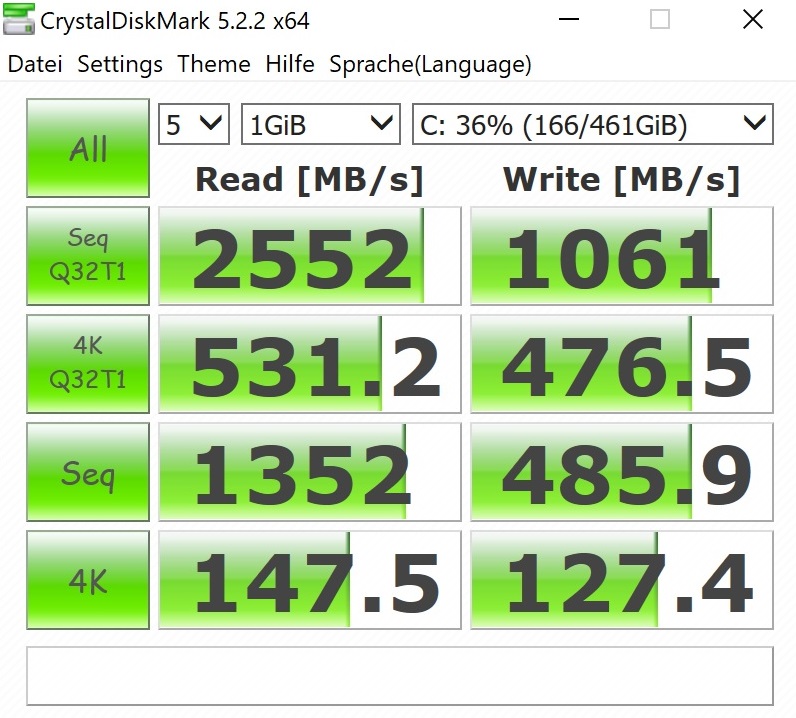
| Gigabyte Aero 15 OLED XB-8DE51B0SP Intel Optane Memory H10 with Solid State Storage 32GB + 512GB HBRPEKNX0202A(L/H) | MSI GS66 Stealth 10SFS Samsung SSD PM981 MZVLB1T0HALR | Gigabyte Aero 15 OLED XA Intel SSD 600p SSDPEKKW512G8L | Acer Predator Triton 500 PT515-51-71PZ WDC PC SN720 SDAPNTW-512G | HP Omen X 2S 15-dg0075cl WDC PC SN720 SDAPNTW-1T00 | Schenker XMG Neo 15 XNE15M19 Seagate FireCuda 510 SSD ZP1000GM30001 | |
|---|---|---|---|---|---|---|
| CrystalDiskMark 5.2 / 6 | 62% | 34% | 62% | 70% | 28% | |
| Write 4K (MB/s) | 127.4 | 131.3 3% | 126.7 -1% | 108.8 -15% | 137.4 8% | 108.7 -15% |
| Read 4K (MB/s) | 147.5 | 45.84 -69% | 66.1 -55% | 40.31 -73% | 41.37 -72% | 41.4 -72% |
| Write Seq (MB/s) | 485.9 | 2370 388% | 1538 217% | 2488 412% | 2500 415% | 1083 123% |
| Read Seq (MB/s) | 1352 | 1509 12% | 2269 68% | 1916 42% | 1576 17% | 917 -32% |
| Write 4K Q32T1 (MB/s) | 476.5 | 481.5 1% | 456.7 -4% | 382.4 -20% | 446.7 -6% | 468.5 -2% |
| Read 4K Q32T1 (MB/s) | 531 | 560 5% | 554 4% | 421.8 -21% | 522 -2% | 530 0% |
| Write Seq Q32T1 (MB/s) | 1061 | 2392 125% | 1541 45% | 2542 140% | 2796 164% | 3057 188% |
| Read Seq Q32T1 (MB/s) | 2552 | 3232 27% | 2567 1% | 3320 30% | 3415 34% | 3422 34% |

| 3DMark 11 Performance | 24383 points | |
| 3DMark Cloud Gate Standard Score | 47119 points | |
| 3DMark Fire Strike Score | 18947 points | |
| 3DMark Time Spy Score | 8066 points | |
Help | ||
| The Witcher 3 | |
| 1920x1080 High Graphics & Postprocessing (Nvidia HairWorks Off) | |
| Gigabyte Aero 15 OLED XB-8DE51B0SP | |
| HP Omen X 2S 15-dg0075cl | |
| MSI GS66 Stealth 10SFS | |
| Acer Predator Triton 500 PT515-51-71PZ | |
| Schenker XMG Neo 15 XNE15M19 | |
| 1920x1080 Ultra Graphics & Postprocessing (HBAO+) | |
| Gigabyte Aero 15 OLED XB-8DE51B0SP | |
| MSI GS66 Stealth 10SFS | |
| HP Omen X 2S 15-dg0075cl | |
| Acer Predator Triton 500 PT515-51-71PZ | |
| Gigabyte Aero 15 OLED XA | |
| Schenker XMG Neo 15 XNE15M19 | |
| low | med. | high | ultra | QHD | 4K | |
|---|---|---|---|---|---|---|
| GTA V (2015) | 182 | 176 | 161 | 91.3 | 73.1 | |
| The Witcher 3 (2015) | 152 | 79.1 | 52.9 | |||
| Dota 2 Reborn (2015) | 157.8 | 148.3 | 140.9 | 132.3 | ||
| X-Plane 11.11 (2018) | 122 | 106 | 89.3 | 67.8 | ||
| Shadow of the Tomb Raider (2018) | 110 | 100 | 68 | 35 | ||
| Battlefield V (2018) | 139 | 130 | 100 | 58.2 | ||
| Far Cry New Dawn (2019) | 110 | 98 | 80 | 45 | ||
| Metro Exodus (2019) | 75.4 | 60.4 | 46.7 | 29.1 | ||
| The Division 2 (2019) | 105 | 77 | 54 | 29 | ||
| Anno 1800 (2019) | 84.2 | 46.8 | 37 | 21.5 | ||
| Control (2019) | 60.2 | 40.6 | 23.8 | |||
| Borderlands 3 (2019) | 84.4 | 64.8 | 45.6 | 24.5 | ||
| Ghost Recon Breakpoint (2019) | 92 | 69 | 50 | 29 | ||
| Red Dead Redemption 2 (2019) | 65.7 | 42.4 | 34.3 | 22 |
Noise level
| Idle |
| 34 / 36 / 41 dB(A) |
| Load |
| 48 / 54 dB(A) |
 | ||
30 dB silent 40 dB(A) audible 50 dB(A) loud |
||
min: | ||
| Gigabyte Aero 15 OLED XB-8DE51B0SP i7-10875H, GeForce RTX 2070 Super Max-Q | MSI GS66 Stealth 10SFS i9-10980HK, GeForce RTX 2070 Super Max-Q | Gigabyte Aero 15 OLED XA i7-9750H, GeForce RTX 2070 Max-Q | Acer Predator Triton 500 PT515-51-71PZ i7-9750H, GeForce RTX 2070 Max-Q | HP Omen X 2S 15-dg0075cl i7-9750H, GeForce RTX 2070 Max-Q | Schenker XMG Neo 15 XNE15M19 i7-9750H, GeForce RTX 2070 Max-Q | |
|---|---|---|---|---|---|---|
| Noise | 1% | -1% | 5% | 9% | 3% | |
| off / environment * (dB) | 30 | 30 -0% | 30 -0% | 30 -0% | 29 3% | 31 -3% |
| Idle Minimum * (dB) | 34 | 32 6% | 34 -0% | 30 12% | 30.5 10% | 31 9% |
| Idle Average * (dB) | 36 | 34 6% | 35 3% | 33 8% | 31.5 12% | 34 6% |
| Idle Maximum * (dB) | 41 | 39 5% | 45 -10% | 39 5% | 31.5 23% | 37 10% |
| Load Average * (dB) | 48 | 53 -10% | 43 10% | 45 6% | 40.6 15% | 47 2% |
| Witcher 3 ultra * (dB) | 48 | 48 -0% | 52 -8% | 49 -2% | 49.5 -3% | 50 -4% |
| Load Maximum * (dB) | 54 | 53 2% | 54 -0% | 51 6% | 53.4 1% | 54 -0% |
* ... smaller is better
(-) The maximum temperature on the upper side is 49 °C / 120 F, compared to the average of 40.4 °C / 105 F, ranging from 21.2 to 68.8 °C for the class Gaming.
(-) The bottom heats up to a maximum of 61 °C / 142 F, compared to the average of 43.2 °C / 110 F
(+) In idle usage, the average temperature for the upper side is 25.6 °C / 78 F, compared to the device average of 33.9 °C / 93 F.
(-) Playing The Witcher 3, the average temperature for the upper side is 40.2 °C / 104 F, compared to the device average of 33.9 °C / 93 F.
(±) The palmrests and touchpad can get very hot to the touch with a maximum of 36 °C / 96.8 F.
(-) The average temperature of the palmrest area of similar devices was 28.8 °C / 83.8 F (-7.2 °C / -13 F).
| Gigabyte Aero 15 OLED XB-8DE51B0SP i7-10875H, GeForce RTX 2070 Super Max-Q | MSI GS66 Stealth 10SFS i9-10980HK, GeForce RTX 2070 Super Max-Q | Gigabyte Aero 15 OLED XA i7-9750H, GeForce RTX 2070 Max-Q | Acer Predator Triton 500 PT515-51-71PZ i7-9750H, GeForce RTX 2070 Max-Q | HP Omen X 2S 15-dg0075cl i7-9750H, GeForce RTX 2070 Max-Q | Schenker XMG Neo 15 XNE15M19 i7-9750H, GeForce RTX 2070 Max-Q | |
|---|---|---|---|---|---|---|
| Heat | -1% | -7% | -0% | -25% | -13% | |
| Maximum Upper Side * (°C) | 49 | 53 -8% | 49 -0% | 49 -0% | 48.8 -0% | 60 -22% |
| Maximum Bottom * (°C) | 61 | 55 10% | 59 3% | 59 3% | 55 10% | 66 -8% |
| Idle Upper Side * (°C) | 27 | 28 -4% | 33 -22% | 28 -4% | 41 -52% | 30 -11% |
| Idle Bottom * (°C) | 29 | 29 -0% | 32 -10% | 29 -0% | 45.6 -57% | 32 -10% |
* ... smaller is better
Gigabyte Aero 15 OLED XB-8DE51B0SP audio analysis
(+) | speakers can play relatively loud (85 dB)
Bass 100 - 315 Hz
(-) | nearly no bass - on average 23.8% lower than median
(±) | linearity of bass is average (9.7% delta to prev. frequency)
Mids 400 - 2000 Hz
(±) | higher mids - on average 5.2% higher than median
(+) | mids are linear (6.9% delta to prev. frequency)
Highs 2 - 16 kHz
(+) | balanced highs - only 2.2% away from median
(+) | highs are linear (4.9% delta to prev. frequency)
Overall 100 - 16.000 Hz
(±) | linearity of overall sound is average (18.3% difference to median)
Compared to same class
» 58% of all tested devices in this class were better, 9% similar, 33% worse
» The best had a delta of 6%, average was 18%, worst was 132%
Compared to all devices tested
» 40% of all tested devices were better, 8% similar, 52% worse
» The best had a delta of 4%, average was 24%, worst was 134%
MSI GS66 Stealth 10SFS audio analysis
(+) | speakers can play relatively loud (91 dB)
Bass 100 - 315 Hz
(-) | nearly no bass - on average 25.3% lower than median
(+) | bass is linear (6.8% delta to prev. frequency)
Mids 400 - 2000 Hz
(±) | higher mids - on average 9.2% higher than median
(±) | linearity of mids is average (8.3% delta to prev. frequency)
Highs 2 - 16 kHz
(+) | balanced highs - only 2.9% away from median
(+) | highs are linear (5.8% delta to prev. frequency)
Overall 100 - 16.000 Hz
(±) | linearity of overall sound is average (23.5% difference to median)
Compared to same class
» 85% of all tested devices in this class were better, 5% similar, 10% worse
» The best had a delta of 6%, average was 18%, worst was 132%
Compared to all devices tested
» 70% of all tested devices were better, 6% similar, 24% worse
» The best had a delta of 4%, average was 24%, worst was 134%
| Off / Standby | |
| Idle | |
| Load |
|
Key:
min: | |
| Gigabyte Aero 15 OLED XB-8DE51B0SP i7-10875H, GeForce RTX 2070 Super Max-Q | MSI GS66 Stealth 10SFS i9-10980HK, GeForce RTX 2070 Super Max-Q | Gigabyte Aero 15 OLED XA i7-9750H, GeForce RTX 2070 Max-Q | Acer Predator Triton 500 PT515-51-71PZ i7-9750H, GeForce RTX 2070 Max-Q | HP Omen X 2S 15-dg0075cl i7-9750H, GeForce RTX 2070 Max-Q | Schenker XMG Neo 15 XNE15M19 i7-9750H, GeForce RTX 2070 Max-Q | |
|---|---|---|---|---|---|---|
| Power Consumption | 15% | -2% | 34% | -65% | 28% | |
| Idle Minimum * (Watt) | 18 | 13 28% | 23 -28% | 7 61% | 46 -156% | 11 39% |
| Idle Average * (Watt) | 21 | 16 24% | 25 -19% | 12 43% | 59 -181% | 15 29% |
| Idle Maximum * (Watt) | 38 | 27 29% | 33 13% | 22 42% | 65.5 -72% | 21 45% |
| Load Average * (Watt) | 113 | 109 4% | 96 15% | 86 24% | 99.8 12% | 94 17% |
| Witcher 3 ultra * (Watt) | 149 | 155 -4% | 168 -13% | 144 3% | 154.1 -3% | 143 4% |
| Load Maximum * (Watt) | 256 | 236 8% | 197 23% | 177 31% | 222.7 13% | 173 32% |
* ... smaller is better
| Gigabyte Aero 15 OLED XB-8DE51B0SP i7-10875H, GeForce RTX 2070 Super Max-Q, 94.2 Wh | MSI GS66 Stealth 10SFS i9-10980HK, GeForce RTX 2070 Super Max-Q, 99.99 Wh | Gigabyte Aero 15 OLED XA i7-9750H, GeForce RTX 2070 Max-Q, 94.24 Wh | Acer Predator Triton 500 PT515-51-71PZ i7-9750H, GeForce RTX 2070 Max-Q, Wh | HP Omen X 2S 15-dg0075cl i7-9750H, GeForce RTX 2070 Max-Q, 72 Wh | Schenker XMG Neo 15 XNE15M19 i7-9750H, GeForce RTX 2070 Max-Q, 62 Wh | |
|---|---|---|---|---|---|---|
| Battery runtime | -14% | -1% | 6% | -58% | -25% | |
| Reader / Idle (h) | 8.6 | 8.4 -2% | 9.9 15% | 11.1 29% | 3.7 -57% | 7.3 -15% |
| WiFi v1.3 (h) | 6.1 | 6.1 0% | 5.7 -7% | 8 31% | 2.2 -64% | 5.7 -7% |
| Load (h) | 2.8 | 1.7 -39% | 2.5 -11% | 1.6 -43% | 1.3 -54% | 1.3 -54% |
Pros
Cons
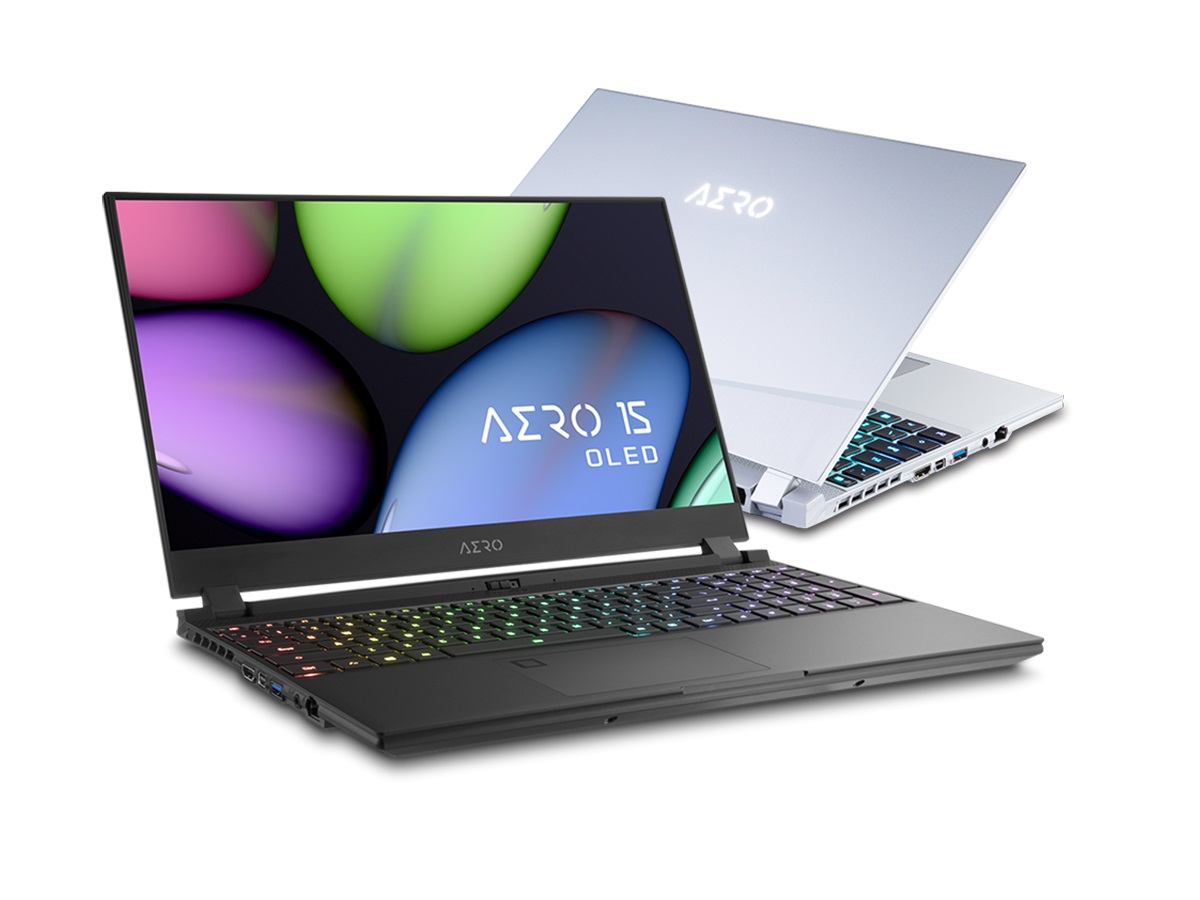
如果您非常重视笔记本电脑的图像质量,那么Aero 15 OLED就是正确的选择。
如果排除反光表面和刷新率,则4K显示屏有利无弊。 除了高亮度,出色的对比度和较短的响应时间外,还有X-Rite Pantone带来的高色域。
由于Aero 15 OLED没有什么明显的缺陷,因此所有想用它来打游戏的游戏玩家和创作者都可以使用。
Gigabyte Aero 15 OLED XB-8DE51B0SP
- 08/31/2022 v7 (old)
Florian Glaser
Price comparison