结论功能强大的惠普笔记本电脑,程序员的理想之选
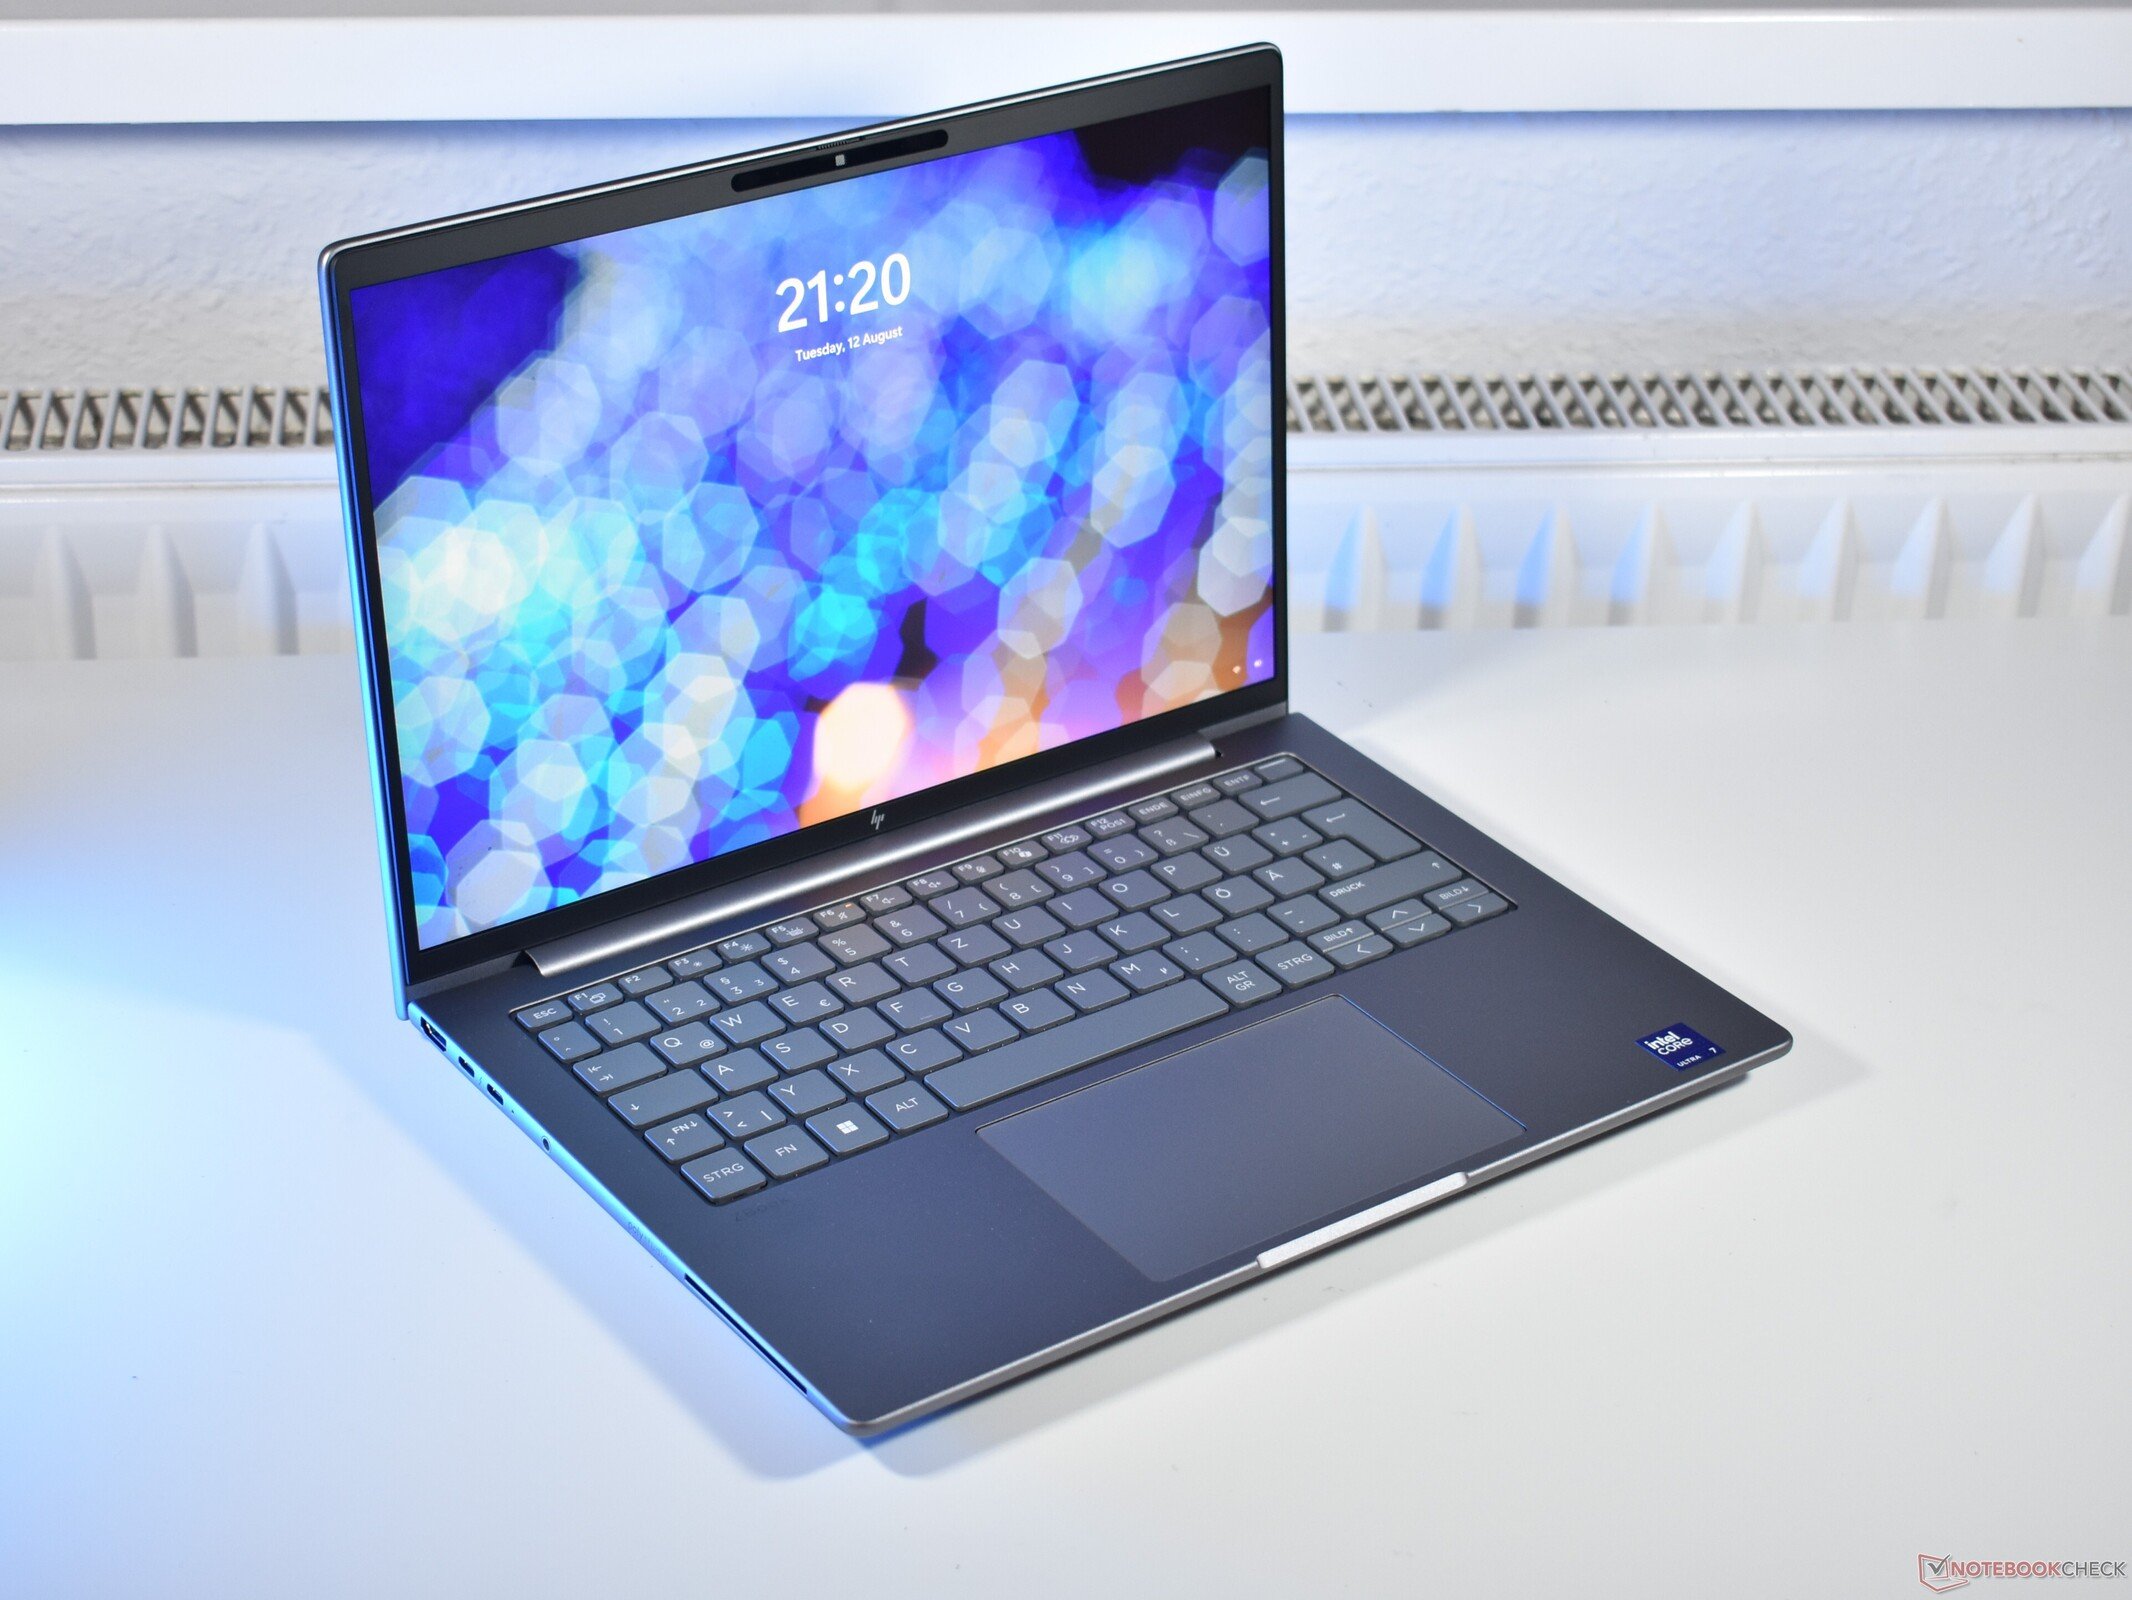
惠普 ZBook 8 G1i 14 是一款工作站笔记本电脑,与老款 ZBook 萤火虫系列相比有了令人印象深刻的改进:双风扇散热让性能大放异彩,端口选择和电池续航时间也得到了改善。我们还不得不称赞惠普出色的键盘。
对于需要 CPU 性能但不一定需要 GPU 性能的程序员来说,所选的配置应该能很好地满足他们的需求。如果需要更强的 GPU 性能,还可以选择专用 GPU,我们将很快对 ZBook 进行评测。
Pros
Cons
再见,萤火虫惠普告别了入门级 ZBook 系列的旧名称。当然,工作站笔记本电脑本身并没有消失,只是换了个新名字而已。因此,惠普 ZBook 8 诞生了,这个名字表明该产品线与办公产品线惠普 EliteBook 8 关系密切。在本次评测中,我们将对惠普 ZBook 8 G1i 14 进行评测。有趣的是,我们的具体机型没有配备移动工作站必须的专用显卡,而是选择了集成的英特尔显卡。
规格英特尔 ARC 图形处理器和 WQXGA 屏幕
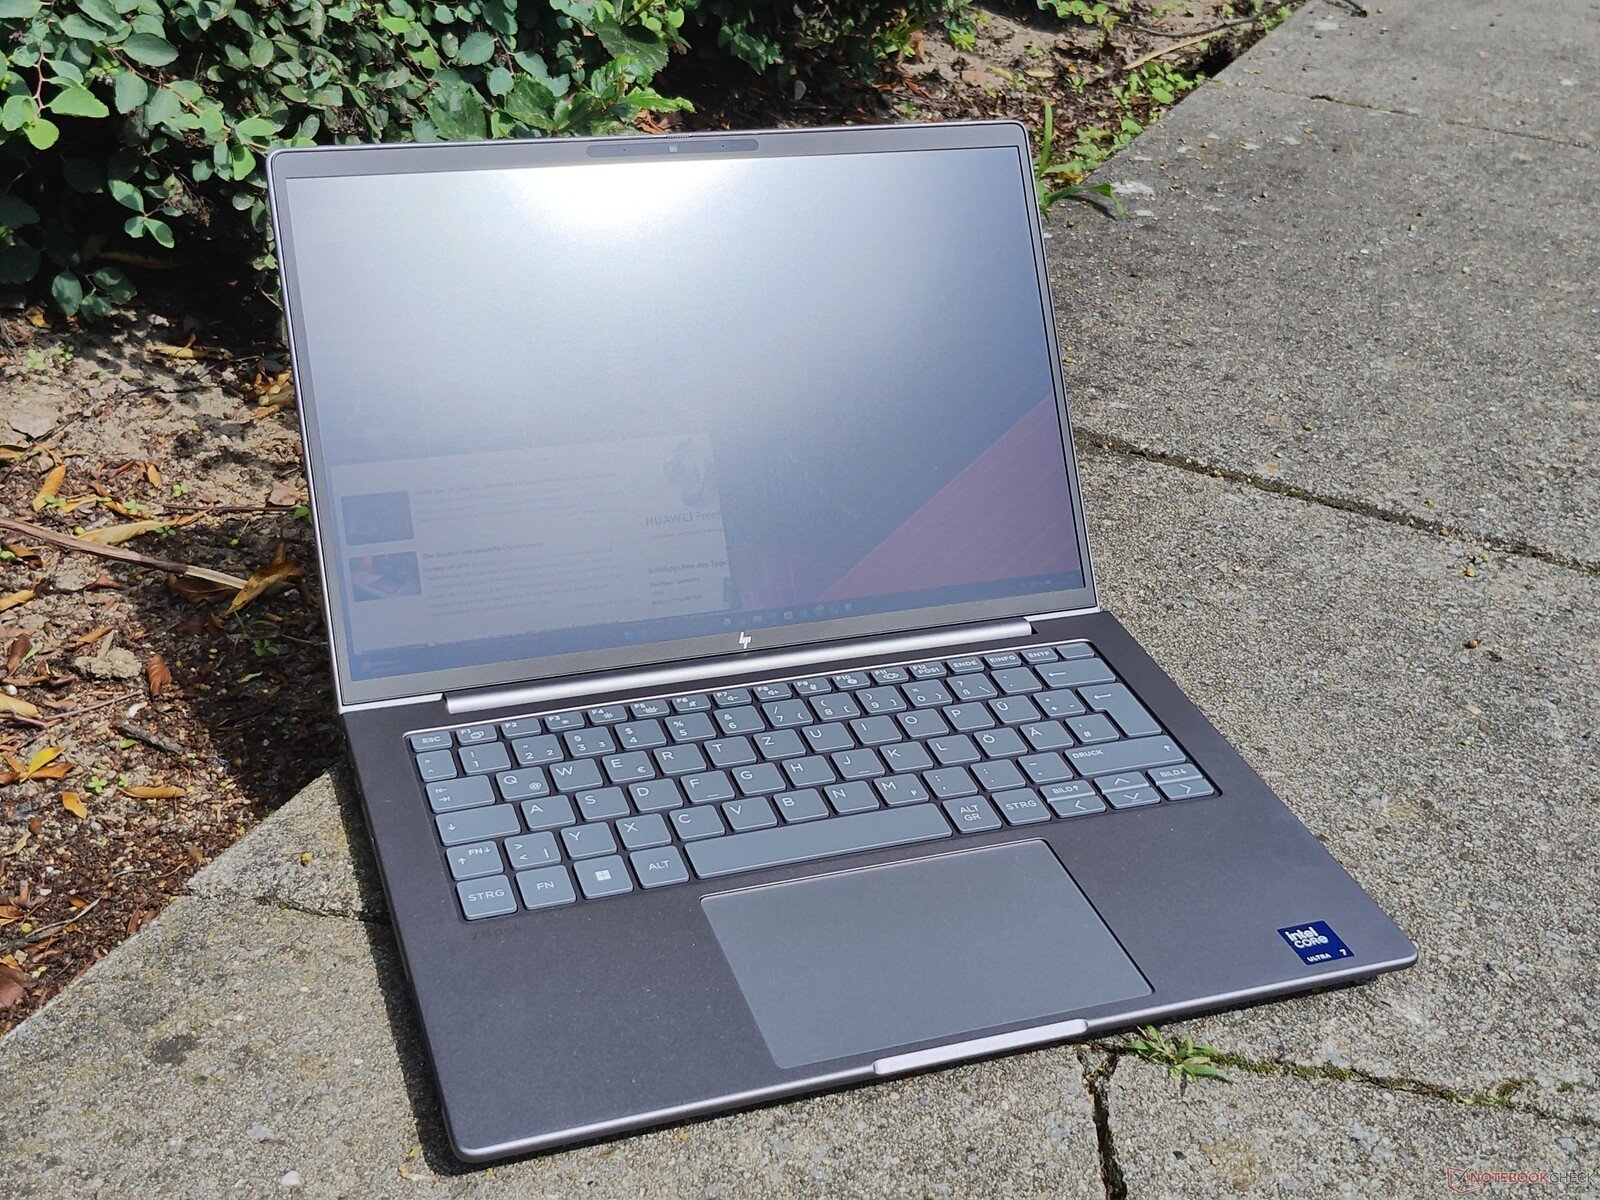
外壳和连接性:就像加厚的 HP EliteBook 8
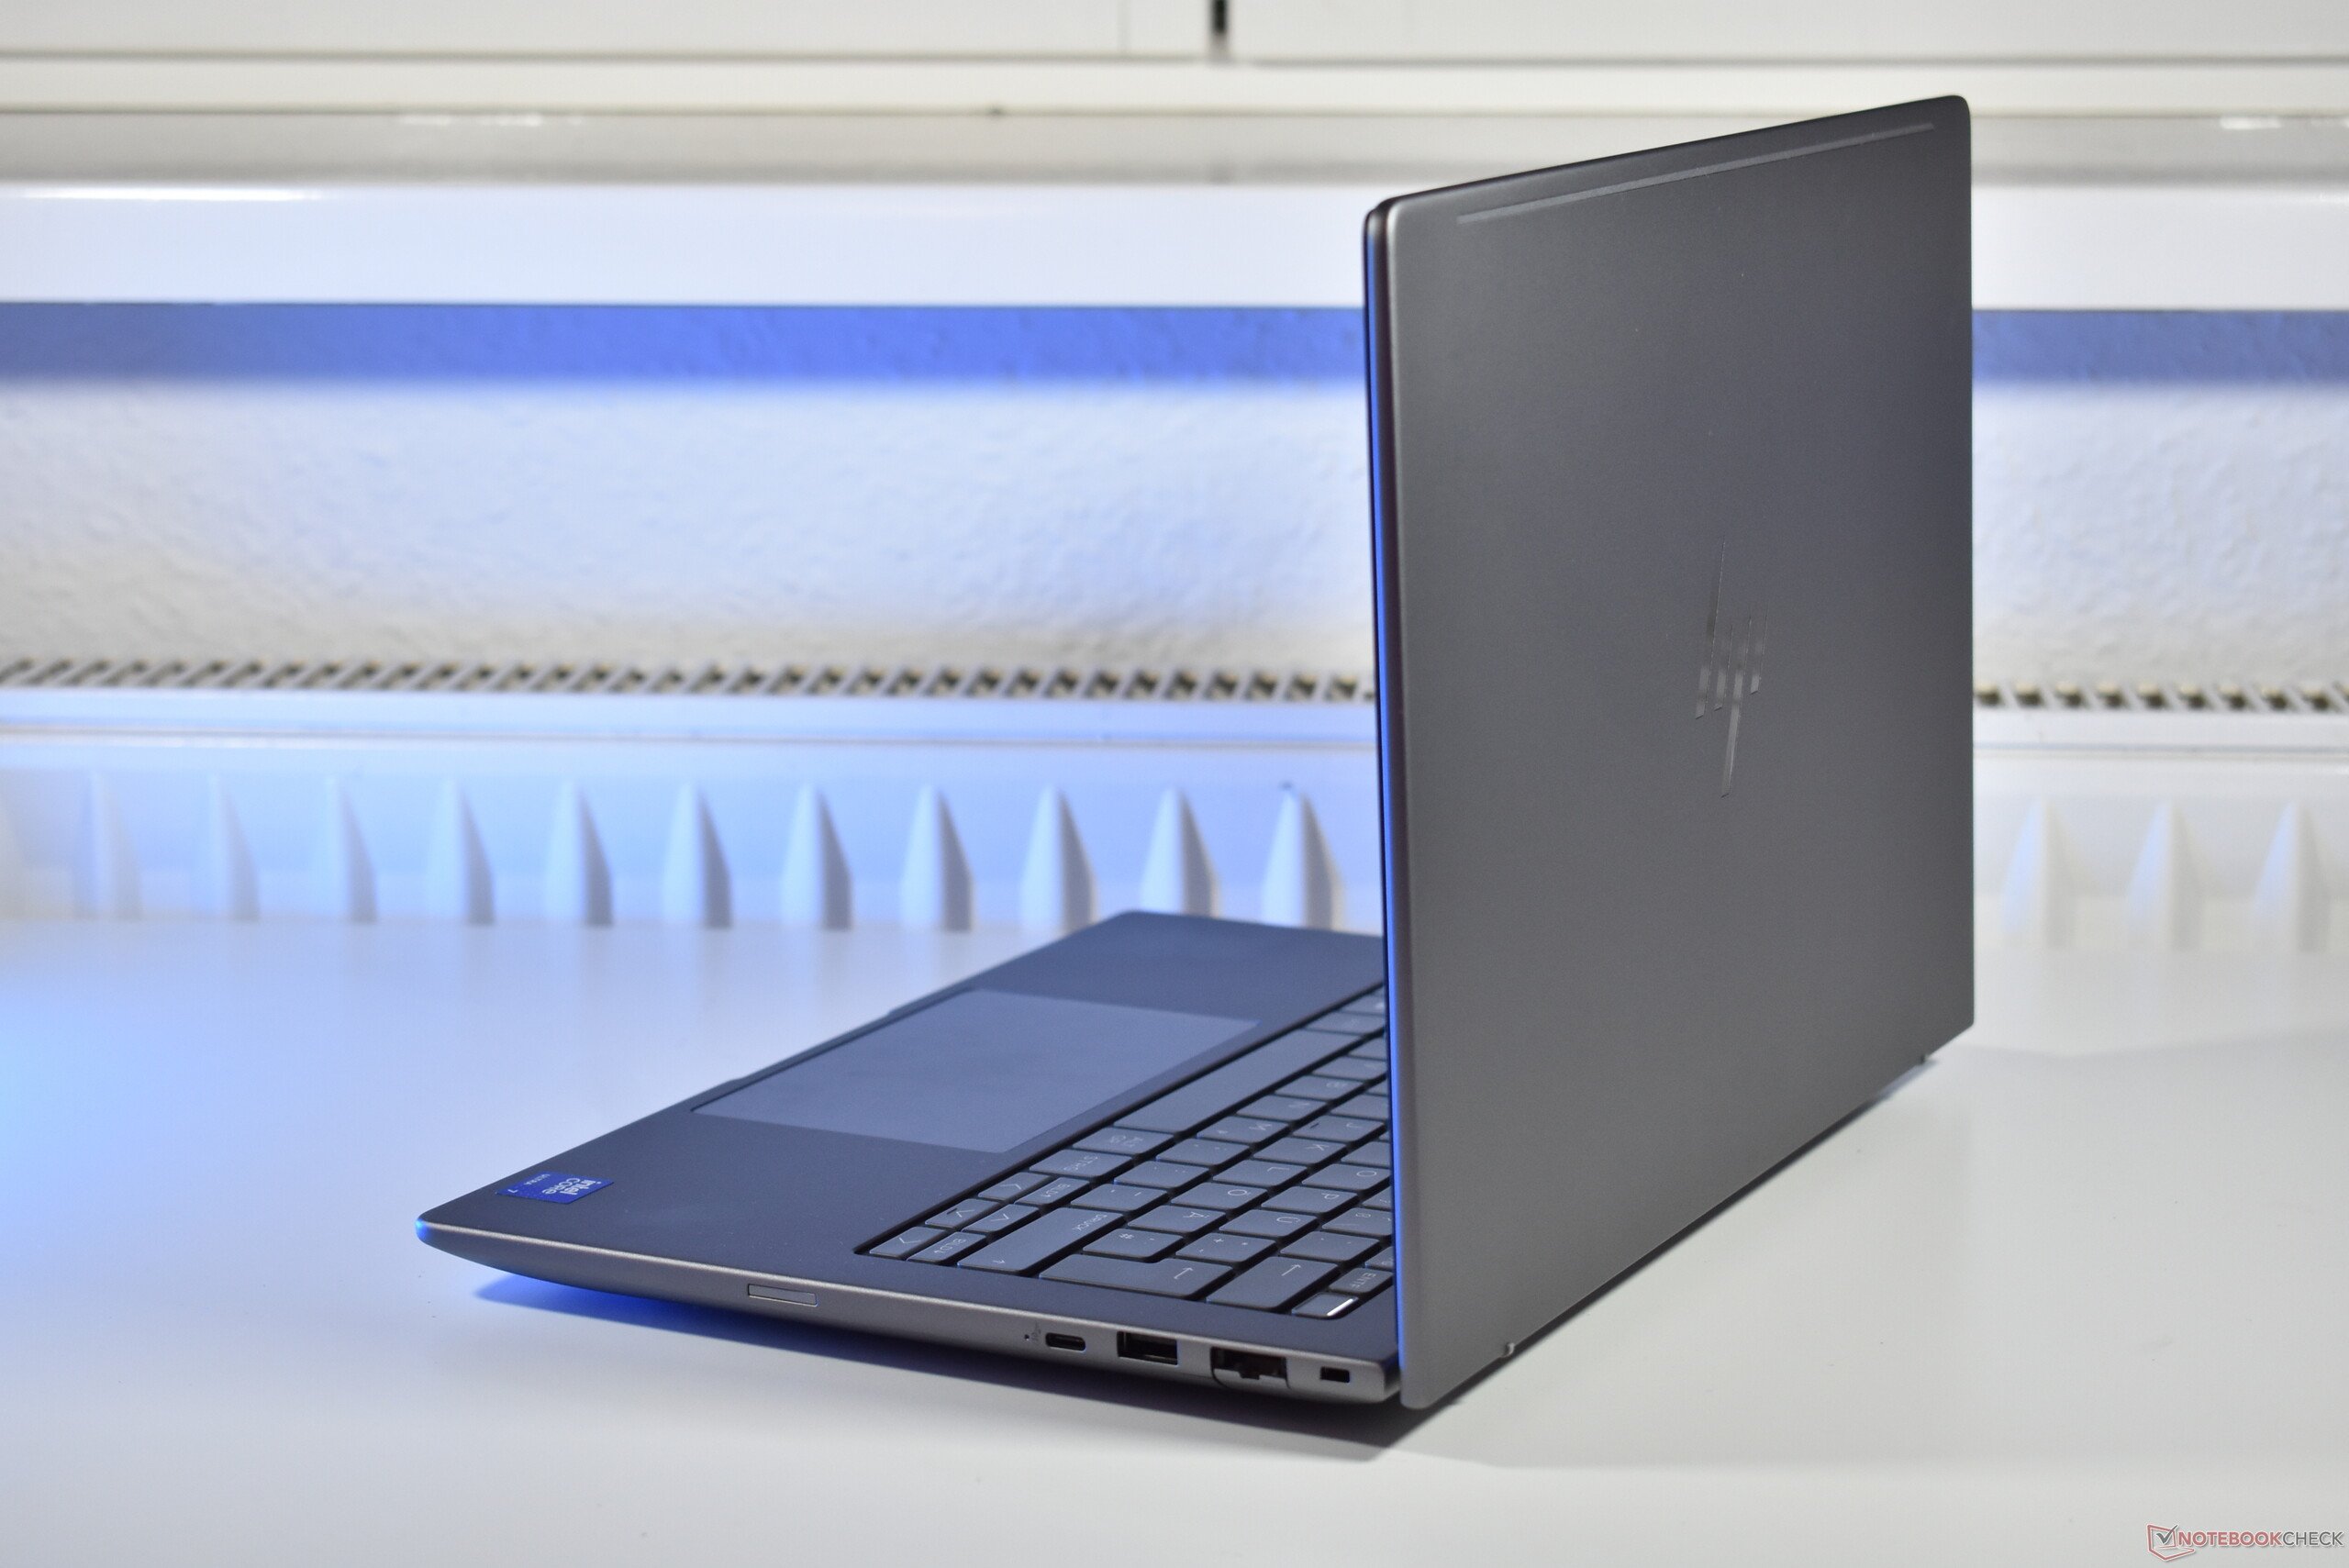
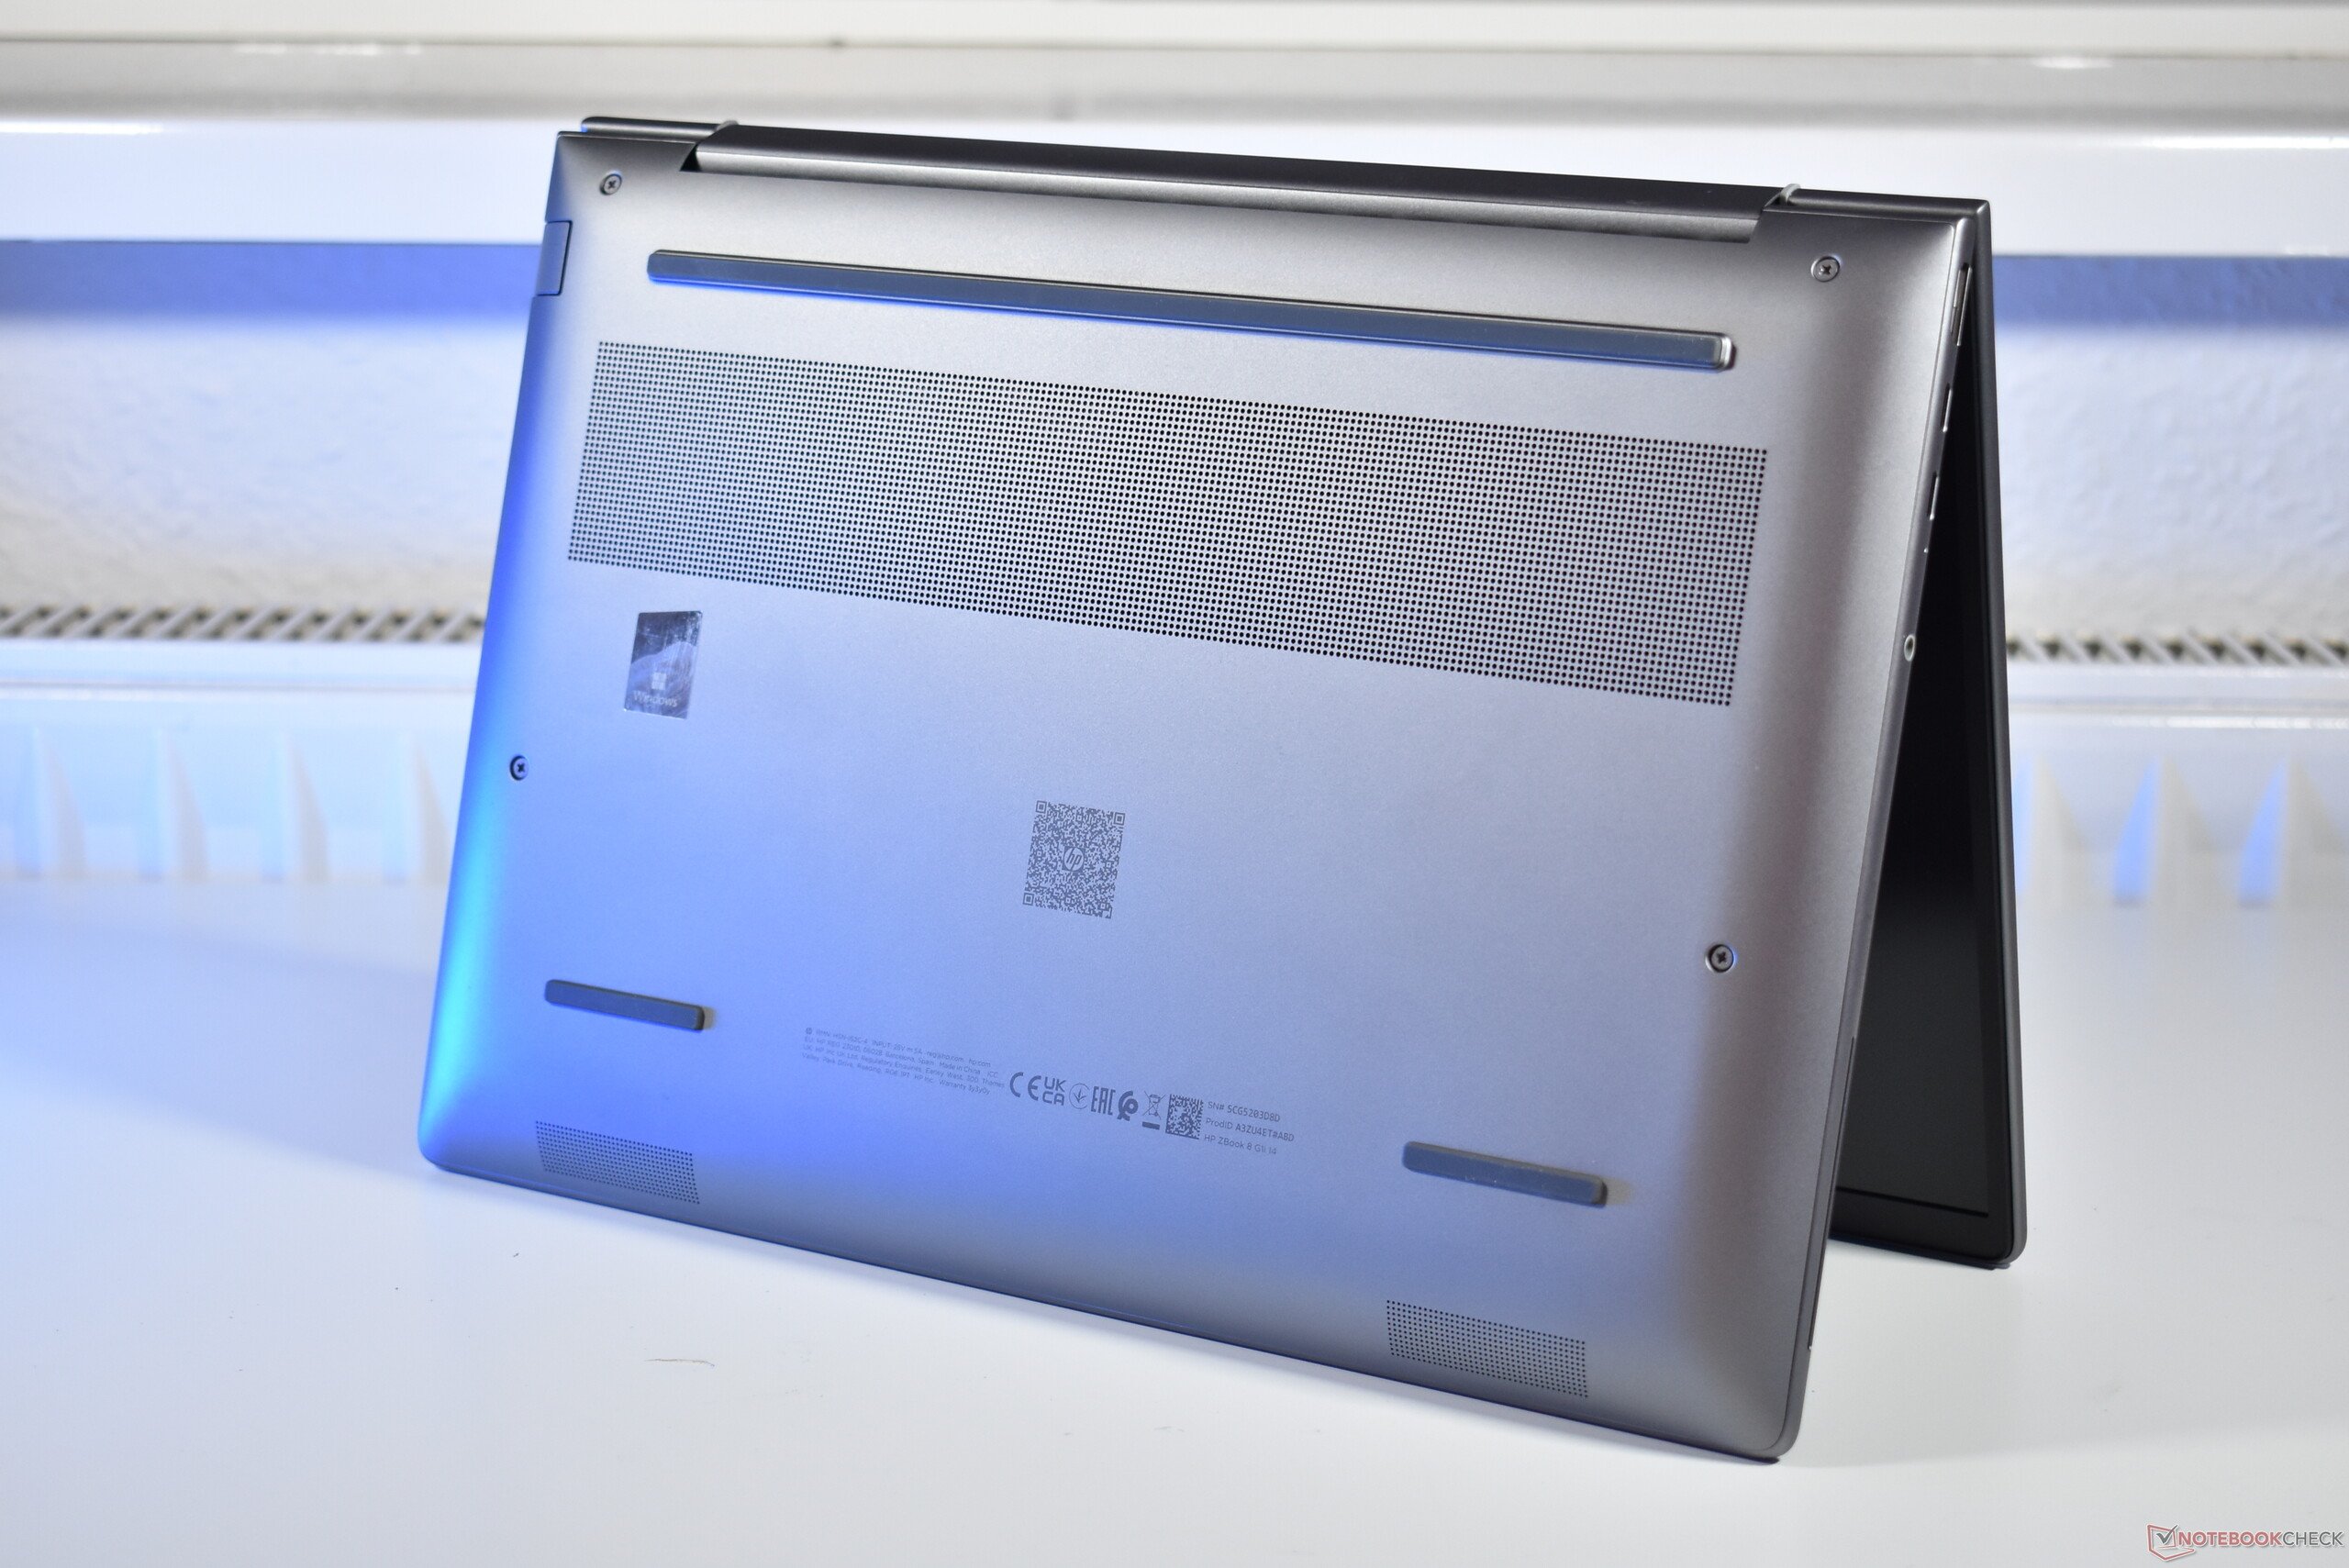
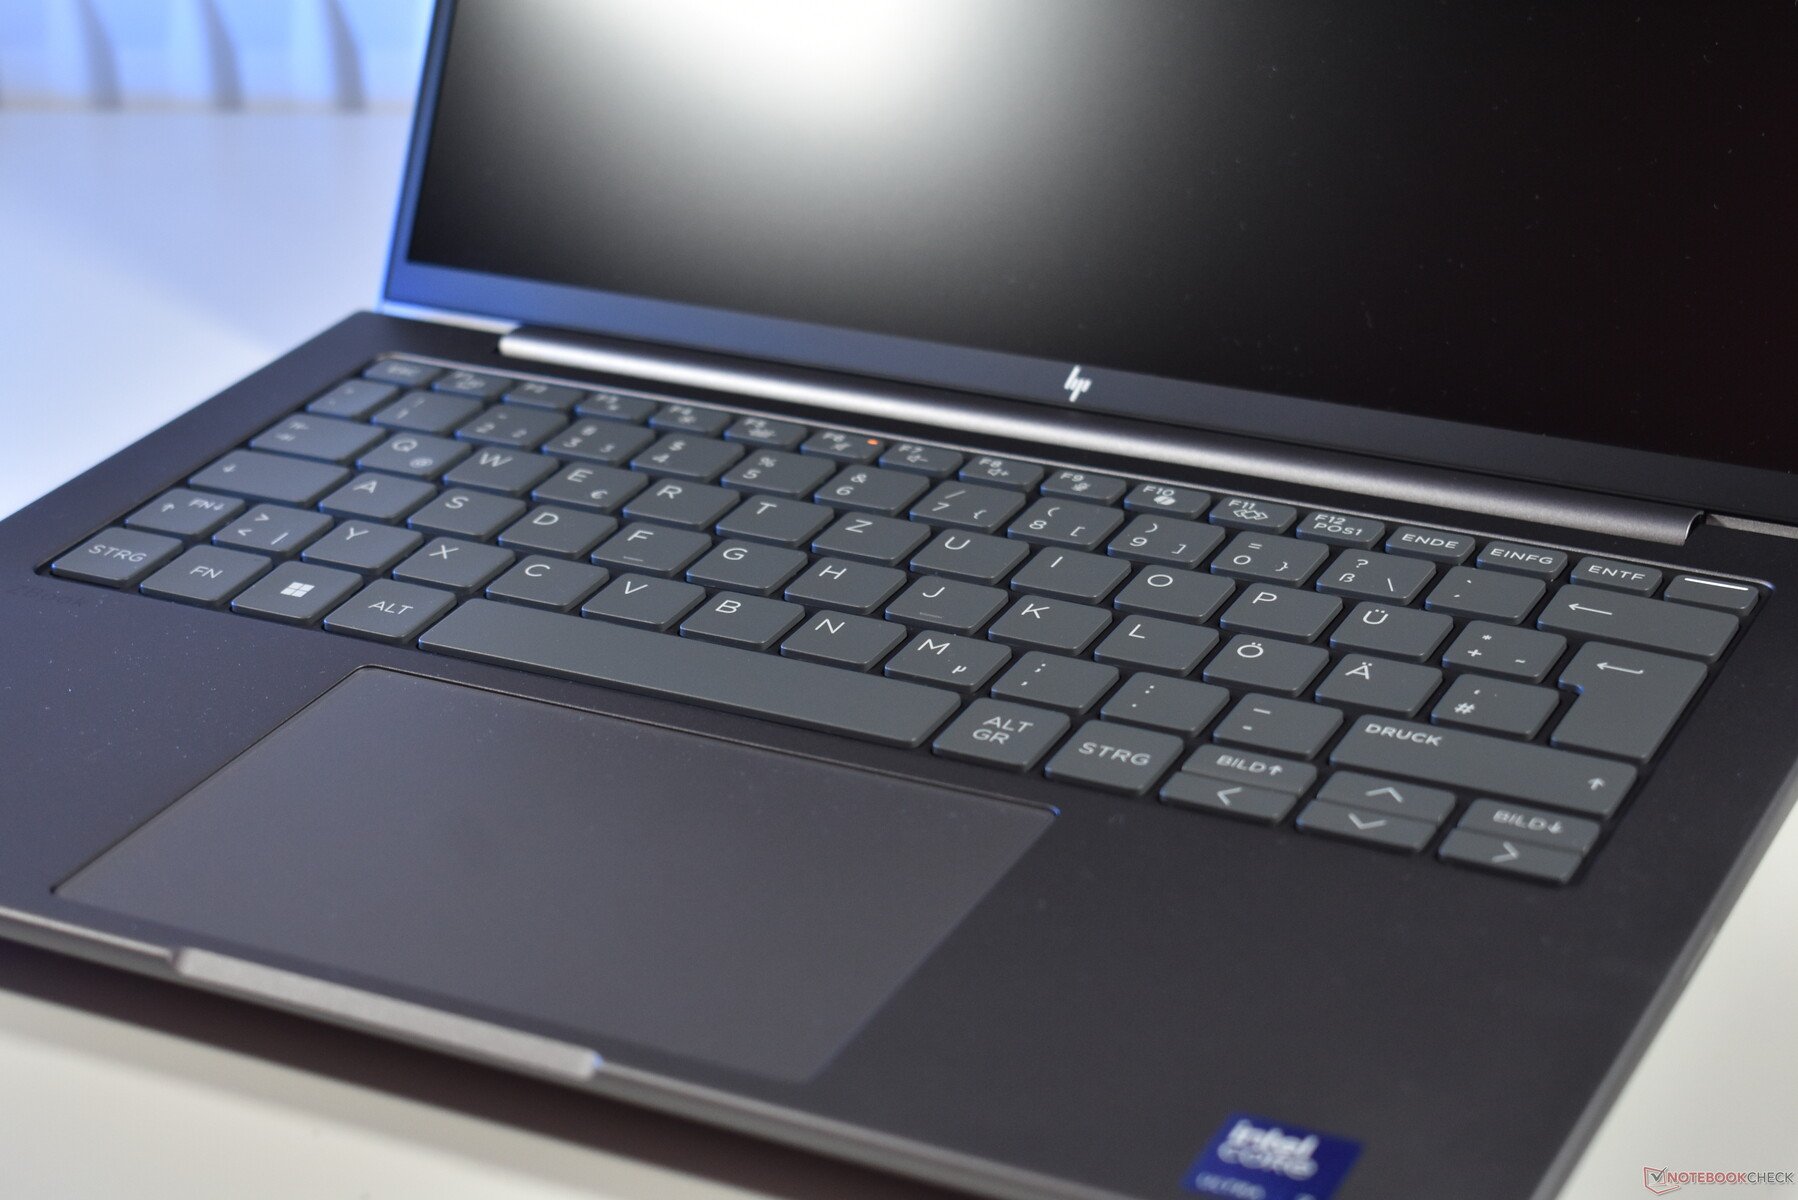
惠普 ZBook 8 G1i 14 看起来像是惠普 EliteBook 8 G1a 14 的兄长。 HP EliteBook 8 G1a 14的兄长。这并非巧合,因为两者采用了相同的基本设计,并共享触摸板和键盘等部件。ZBook 只是颜色比 EliteBook 深一些,厚度也比 EliteBook 厚一些。在制造质量方面,ZBook 与采用全铝机身的办公本一样出色。
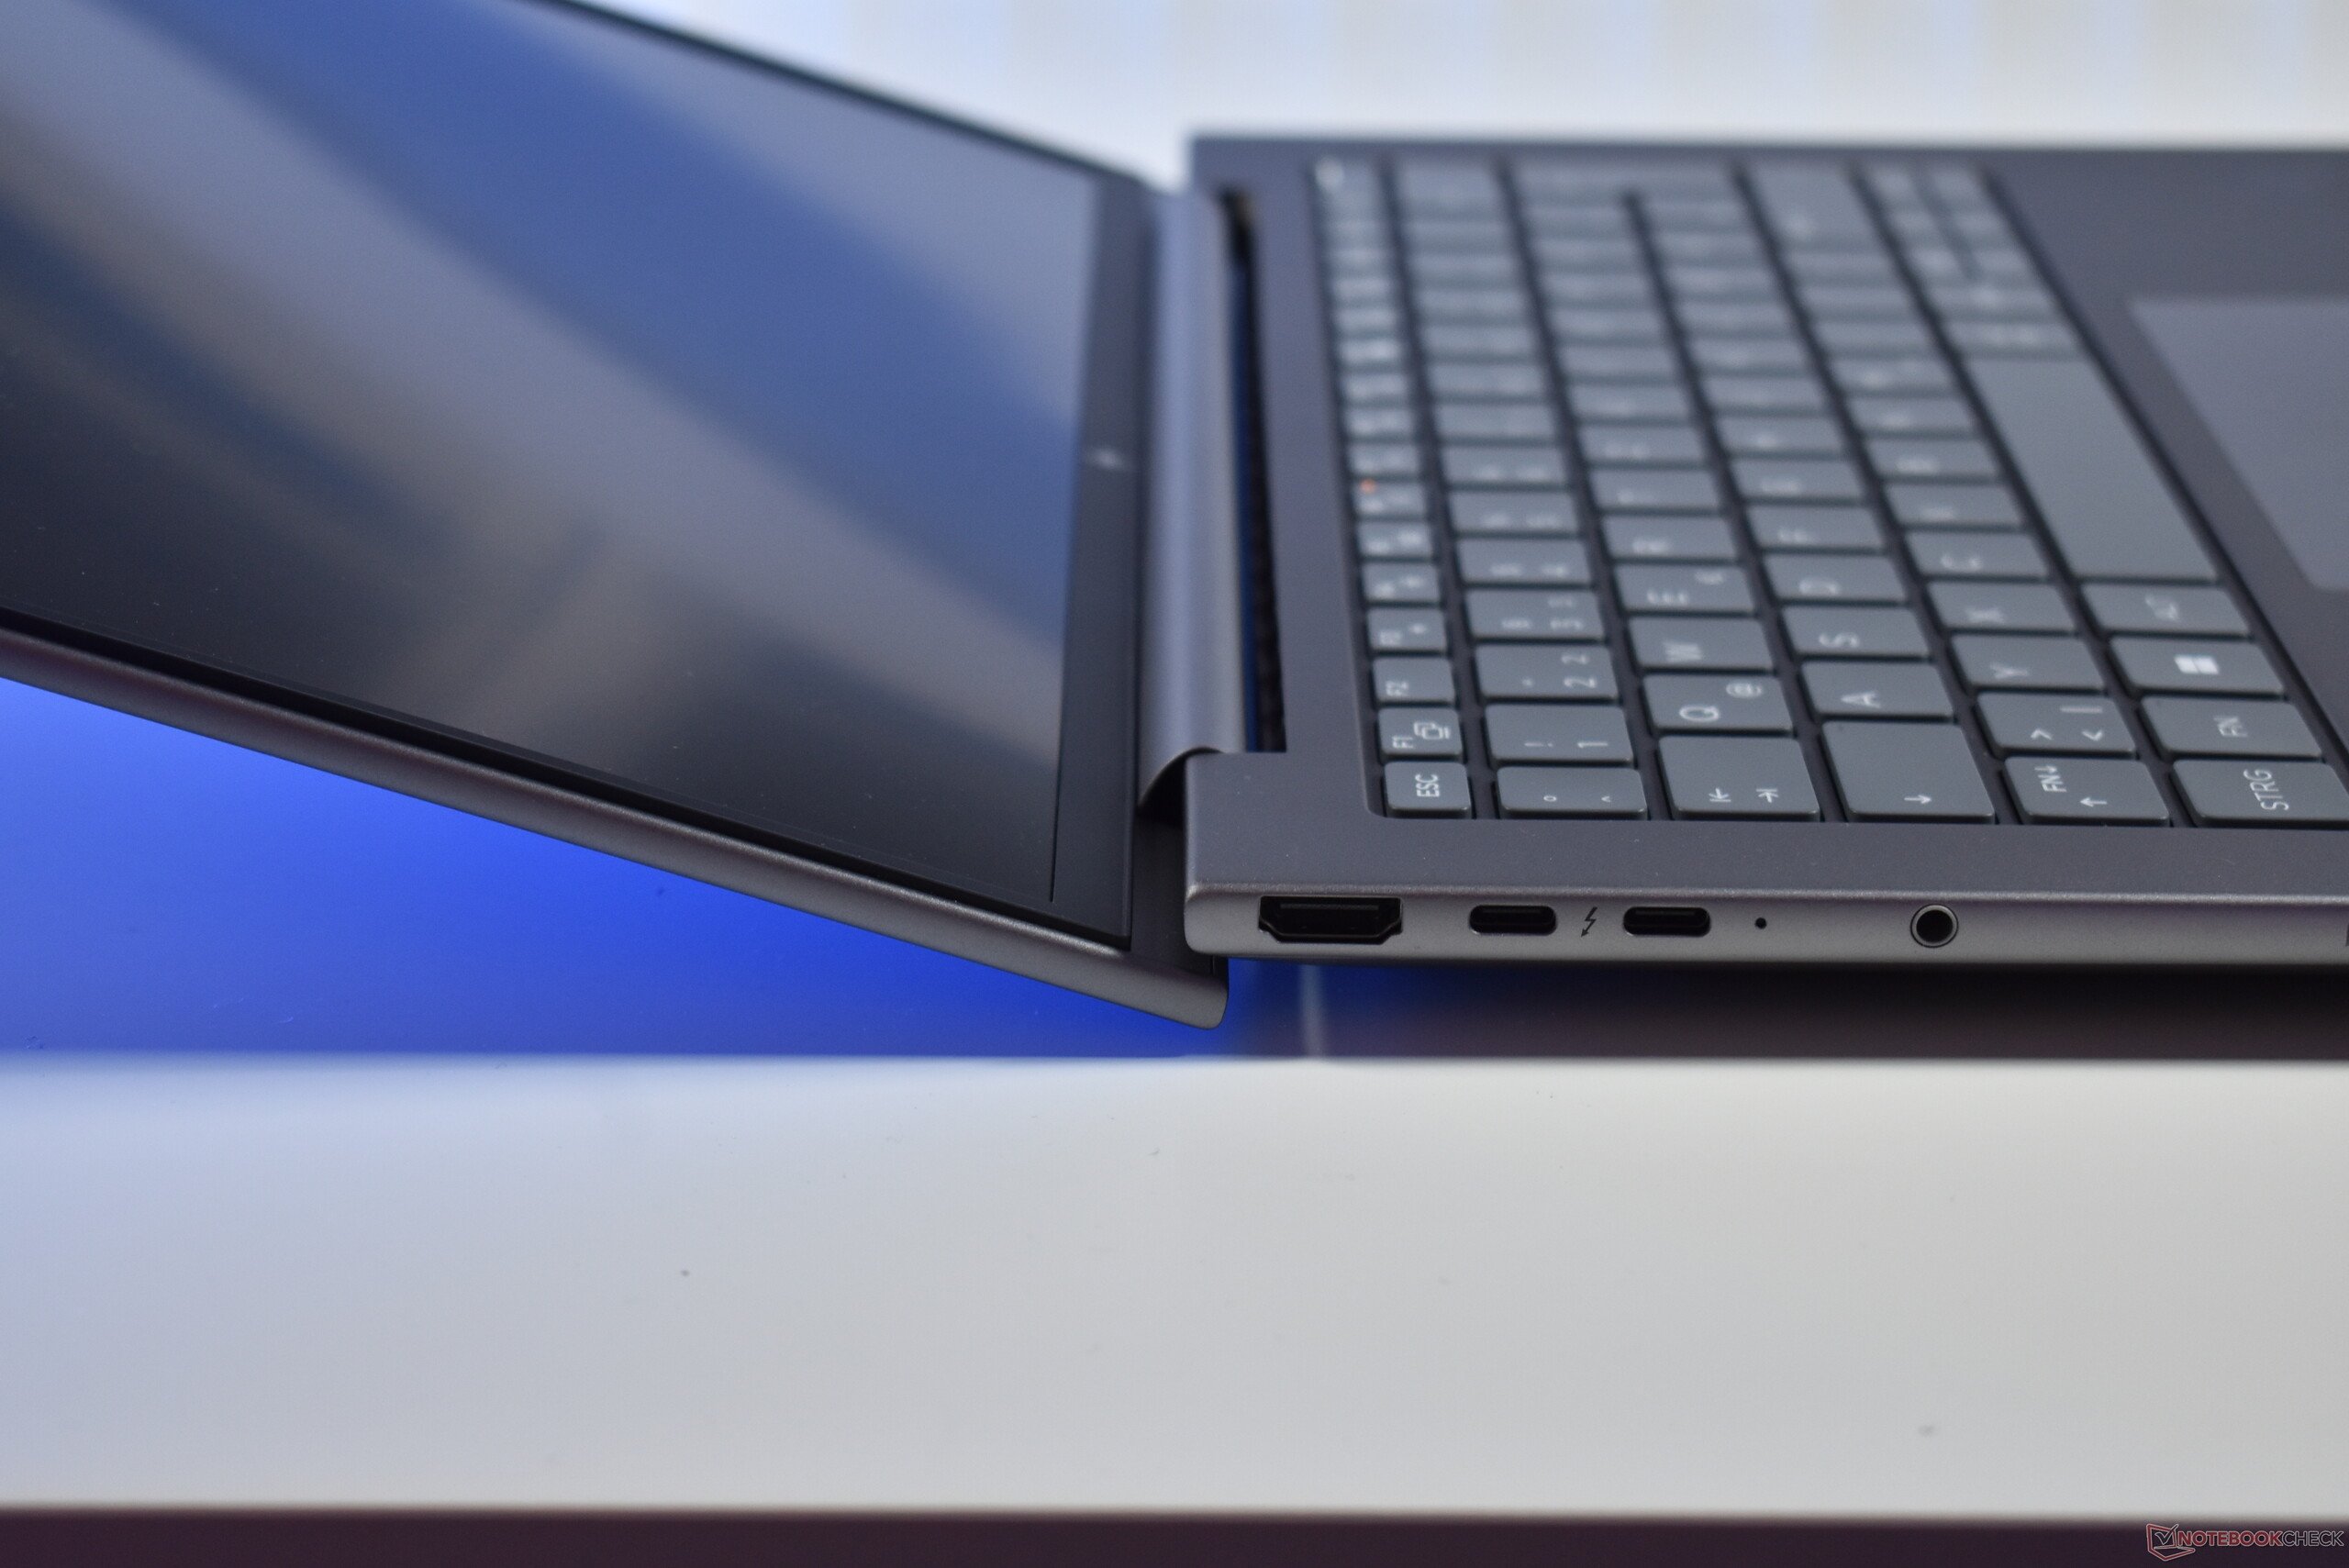
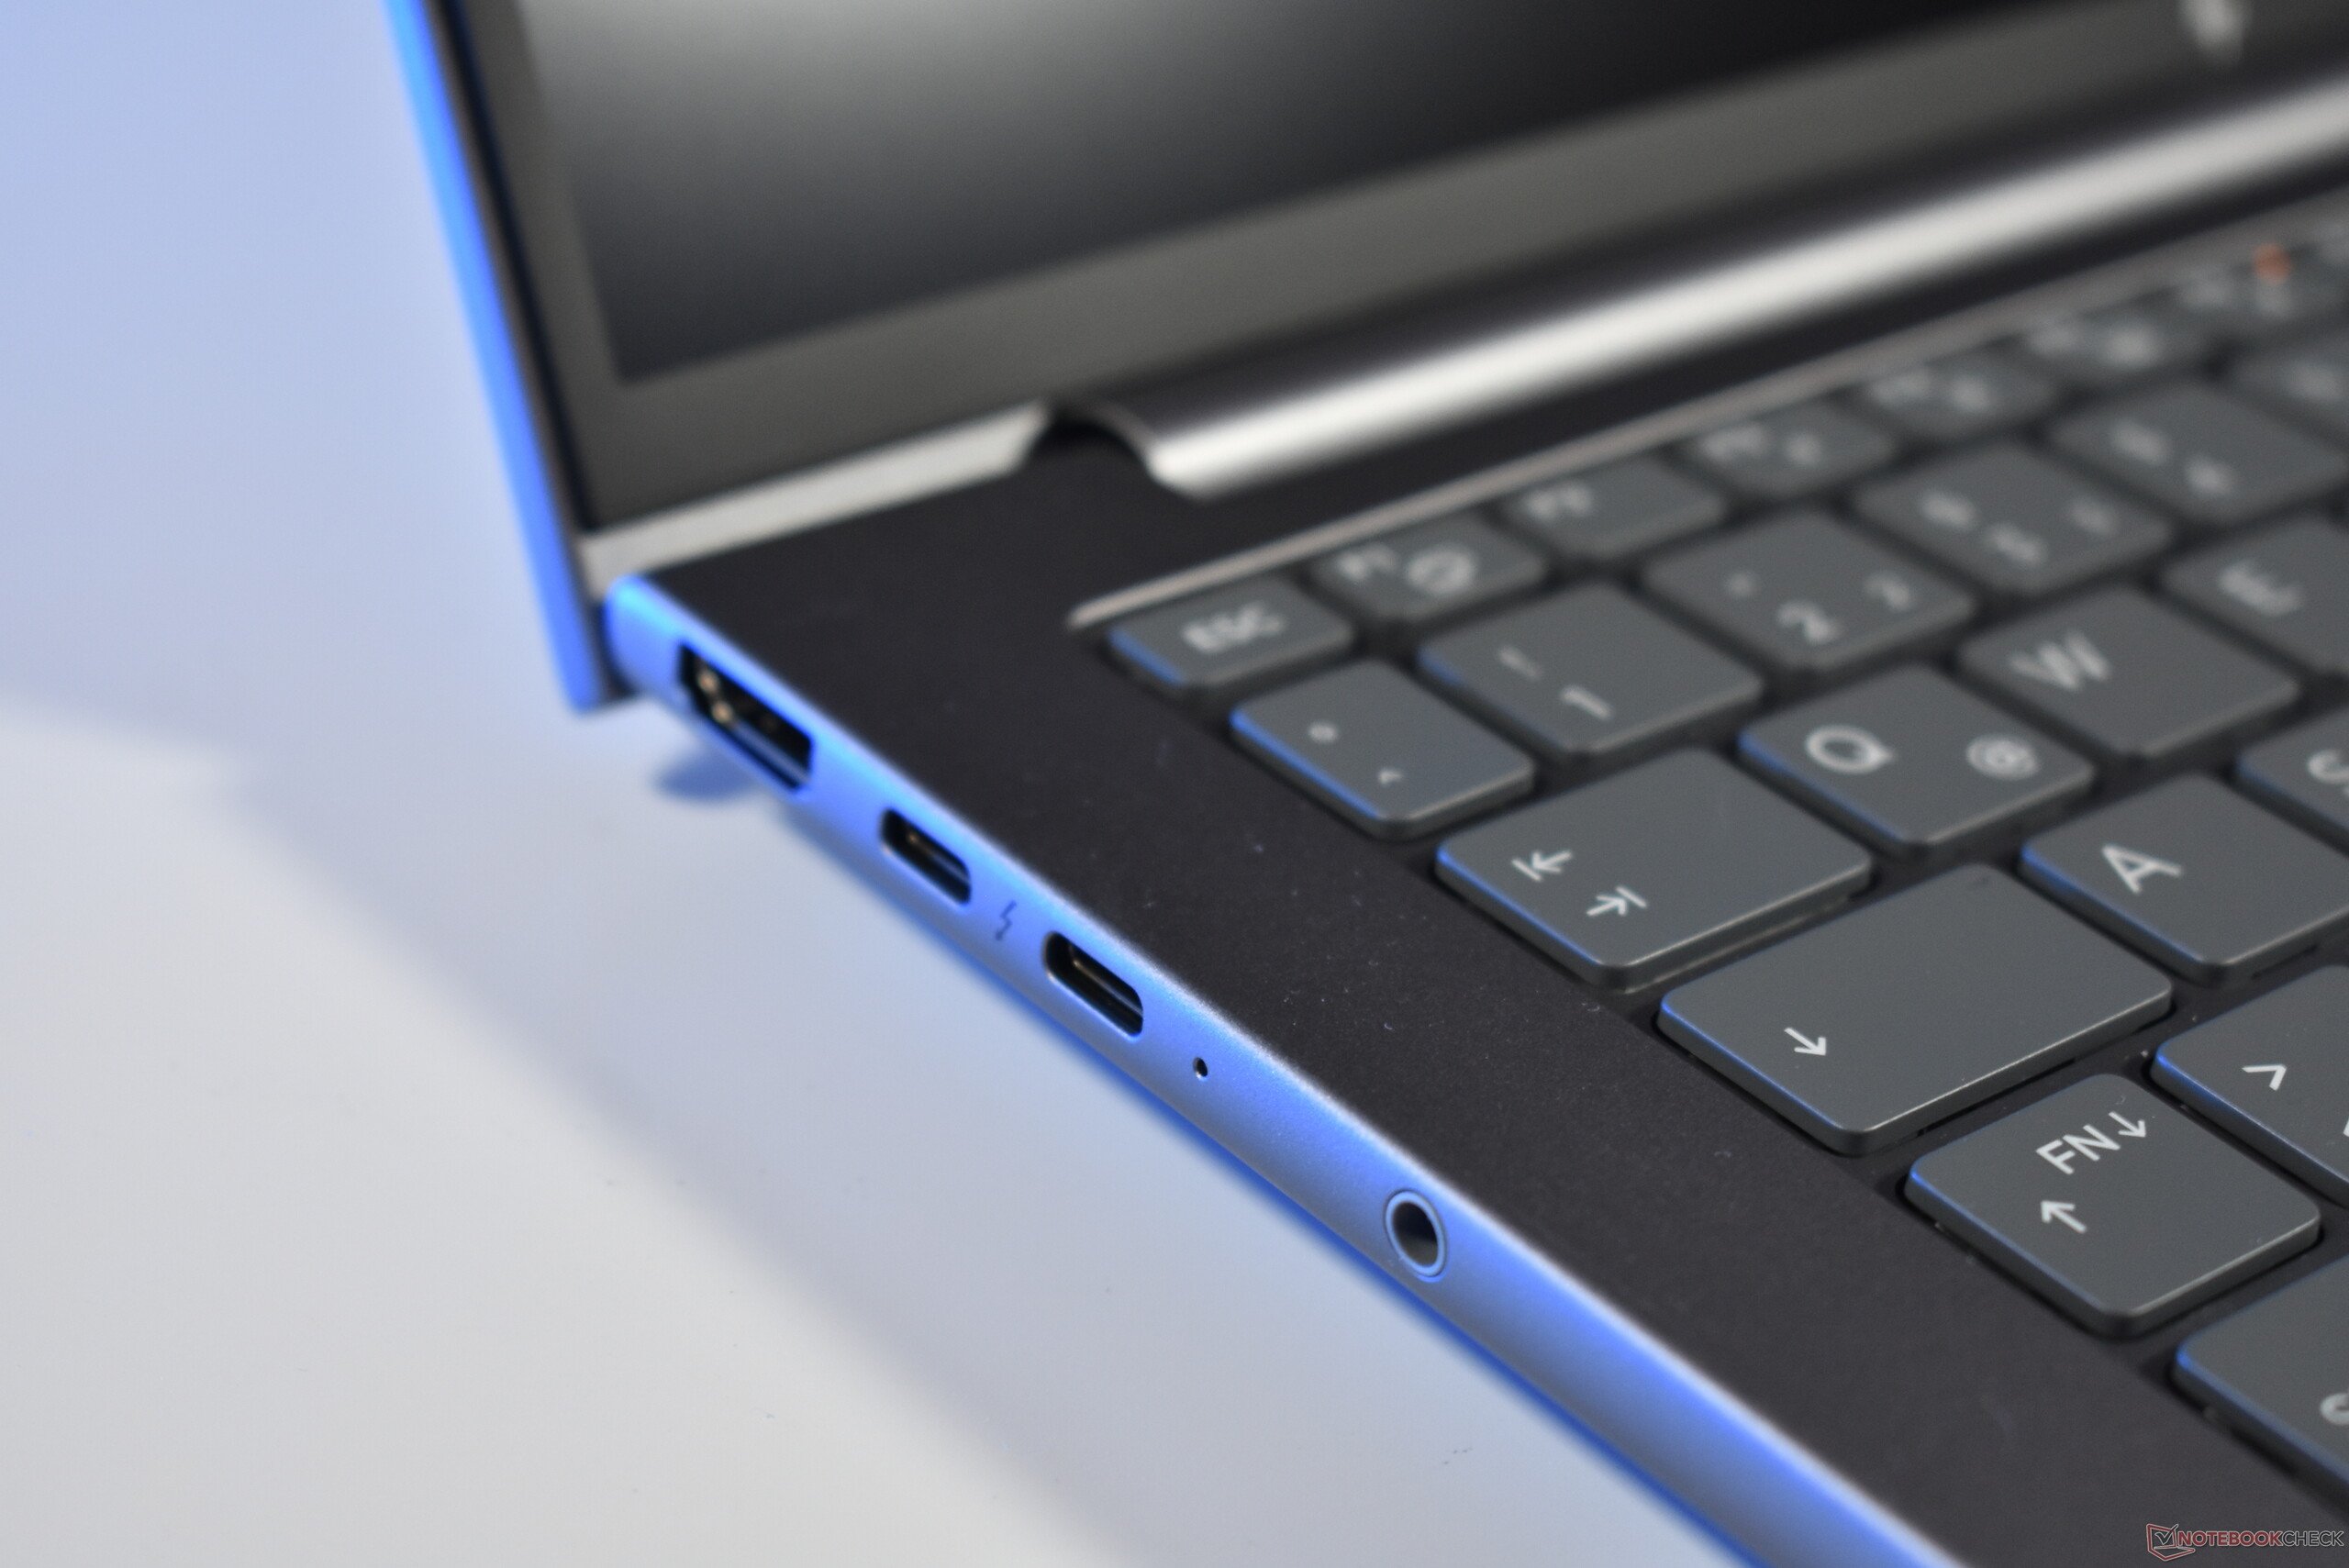
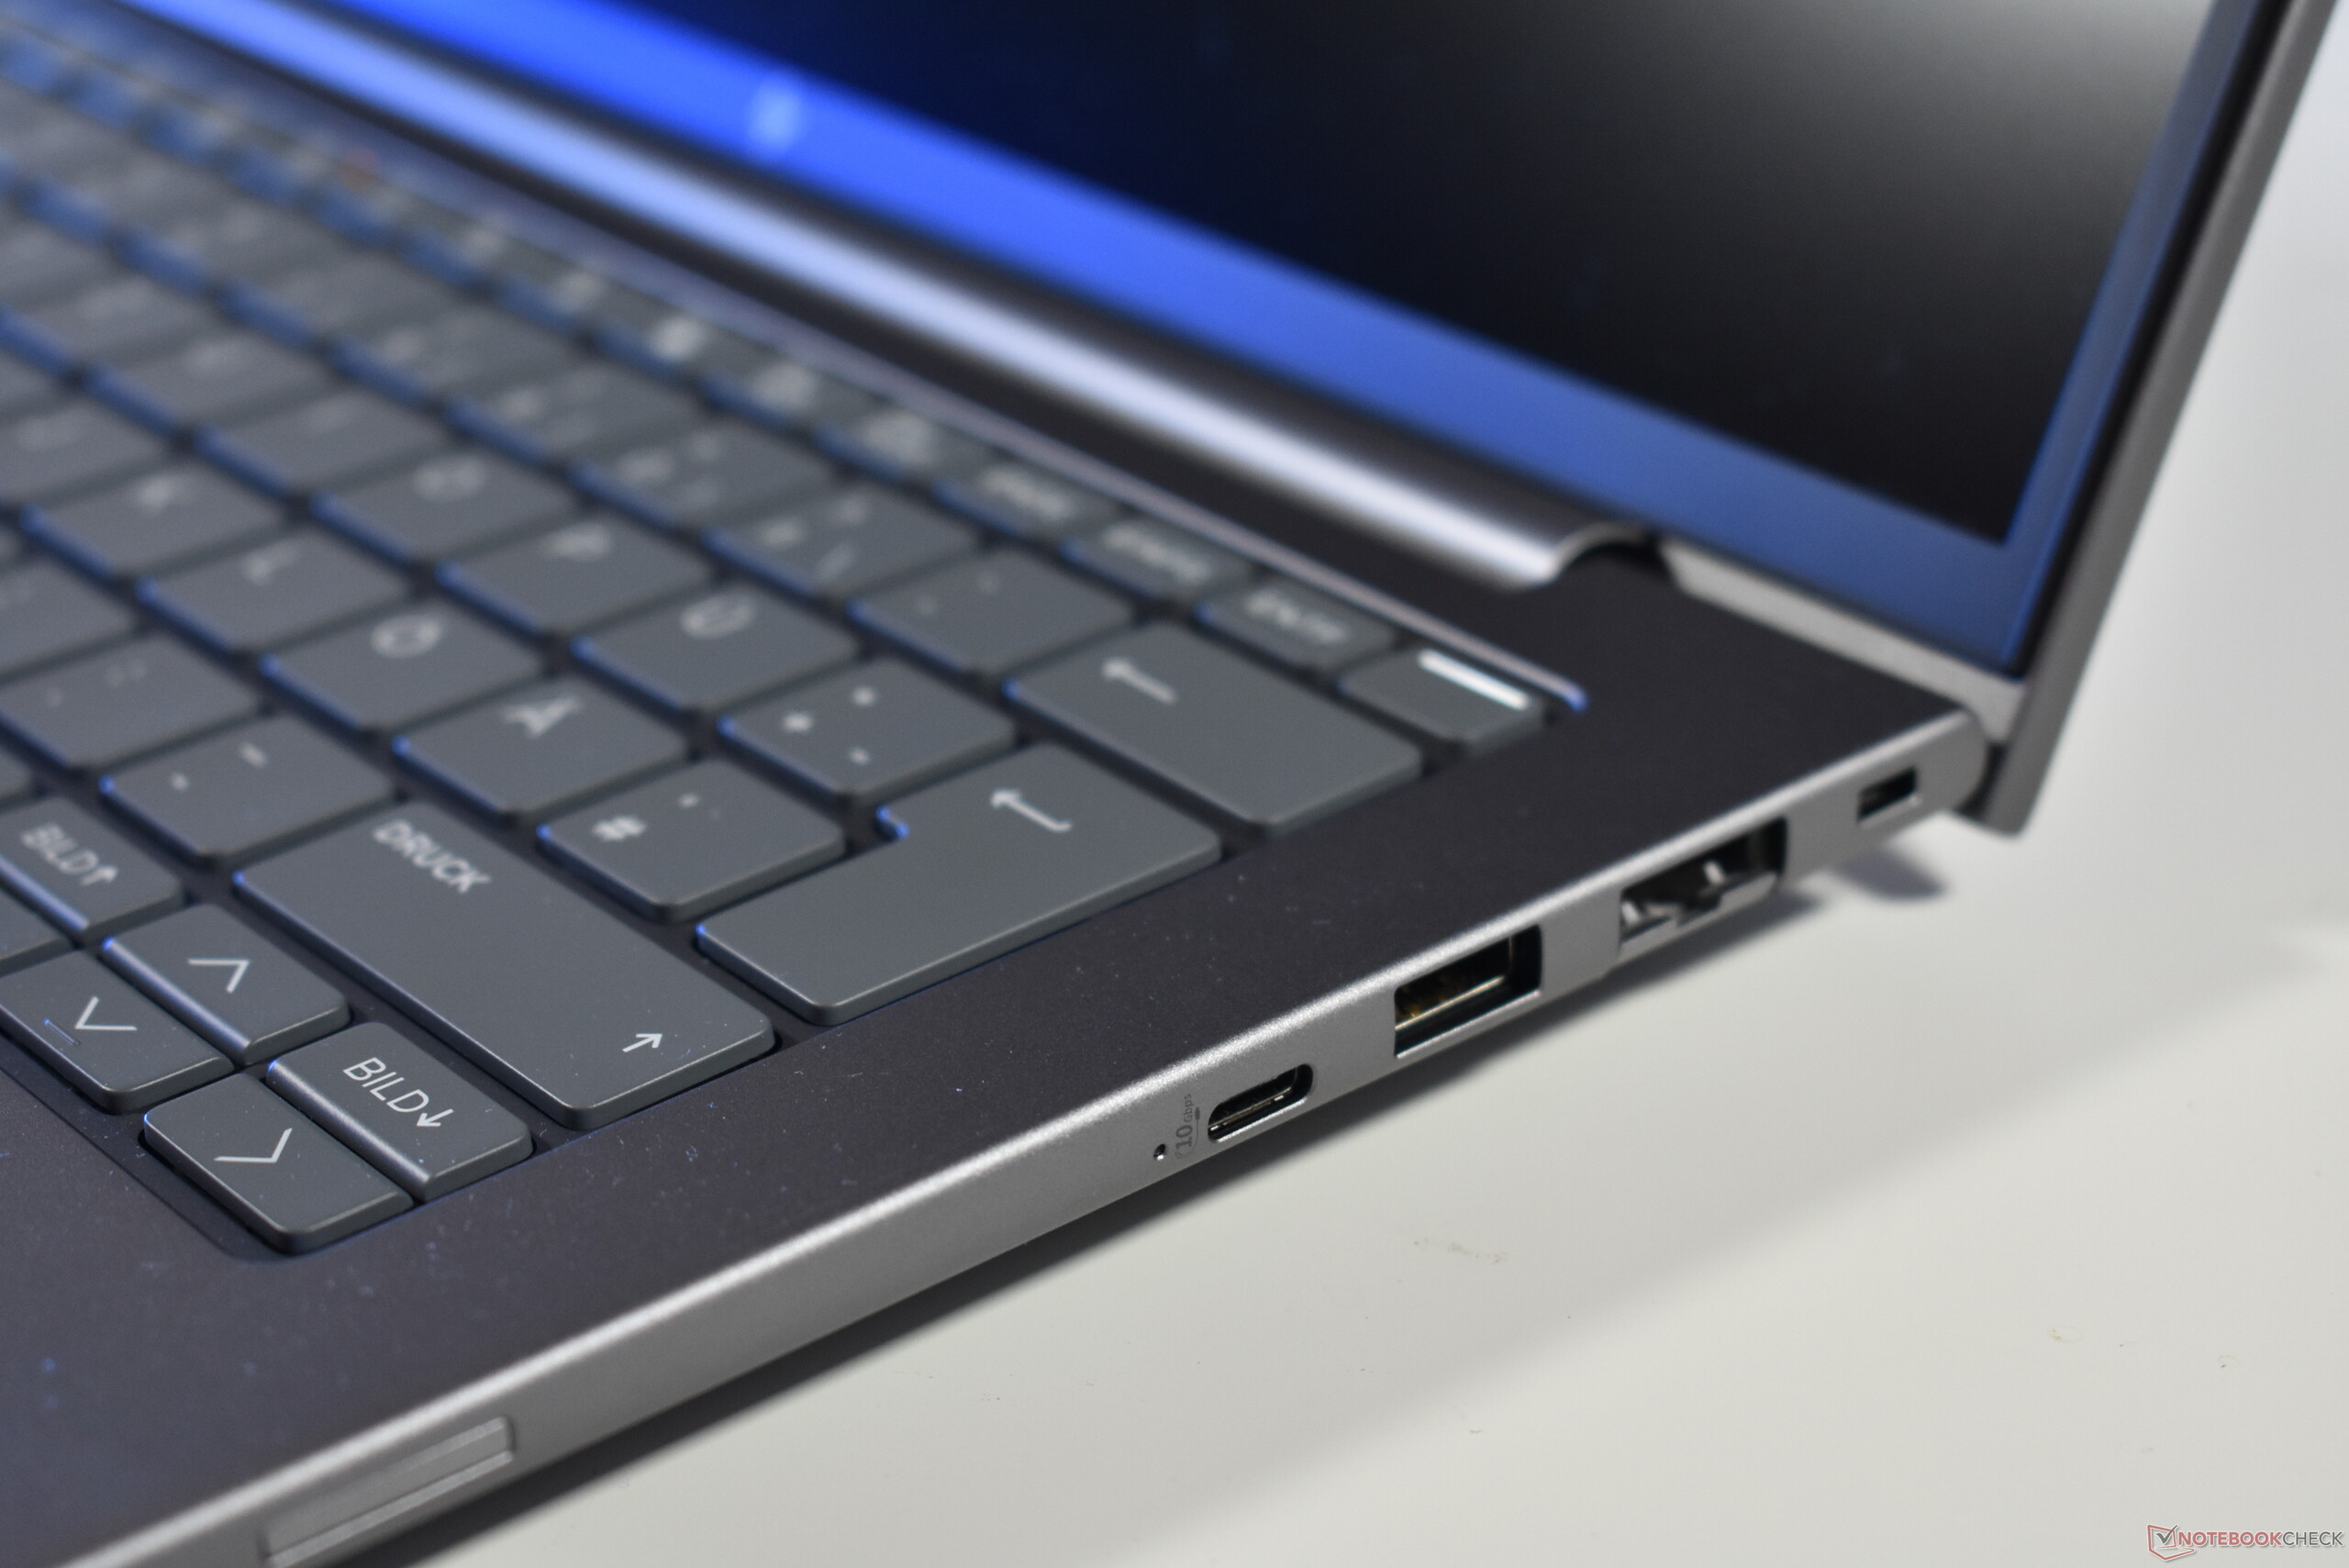
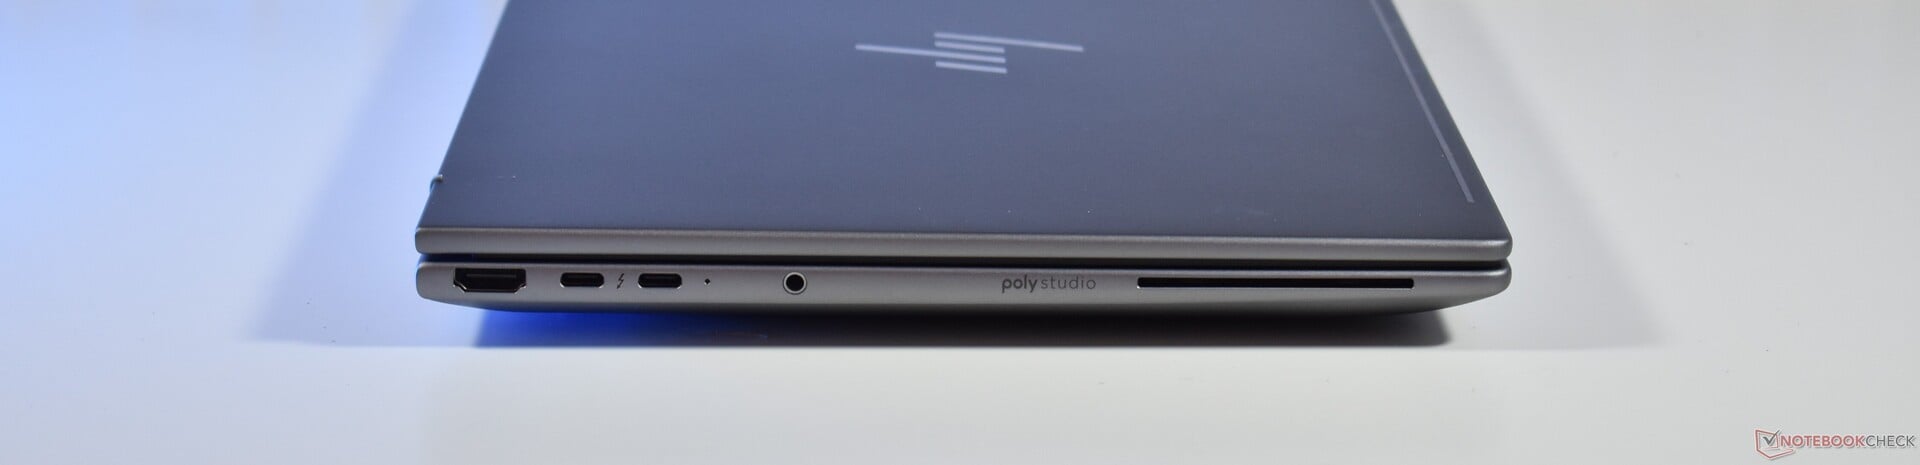
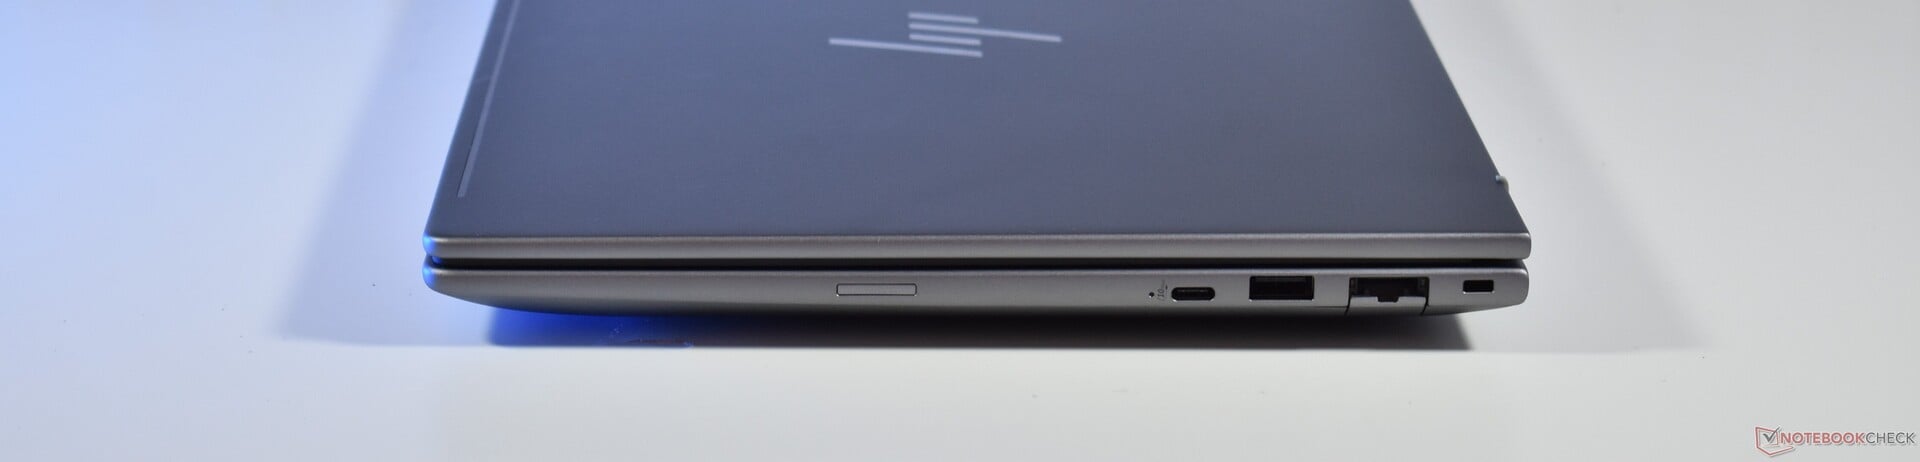
与旧款 ZBook 萤火虫 14,其中一个 USB-A 端口消失了,取而代之的是第三个 USB-C。使用大量旧配件的用户可能不喜欢这一变化,但 USB-C 接口功能更强大,而且还能从右侧充电。此外,新款 ZBook 8 G1i 14 现在有了一个 RJ45 以太网端口,这是一个非常受欢迎的变化。
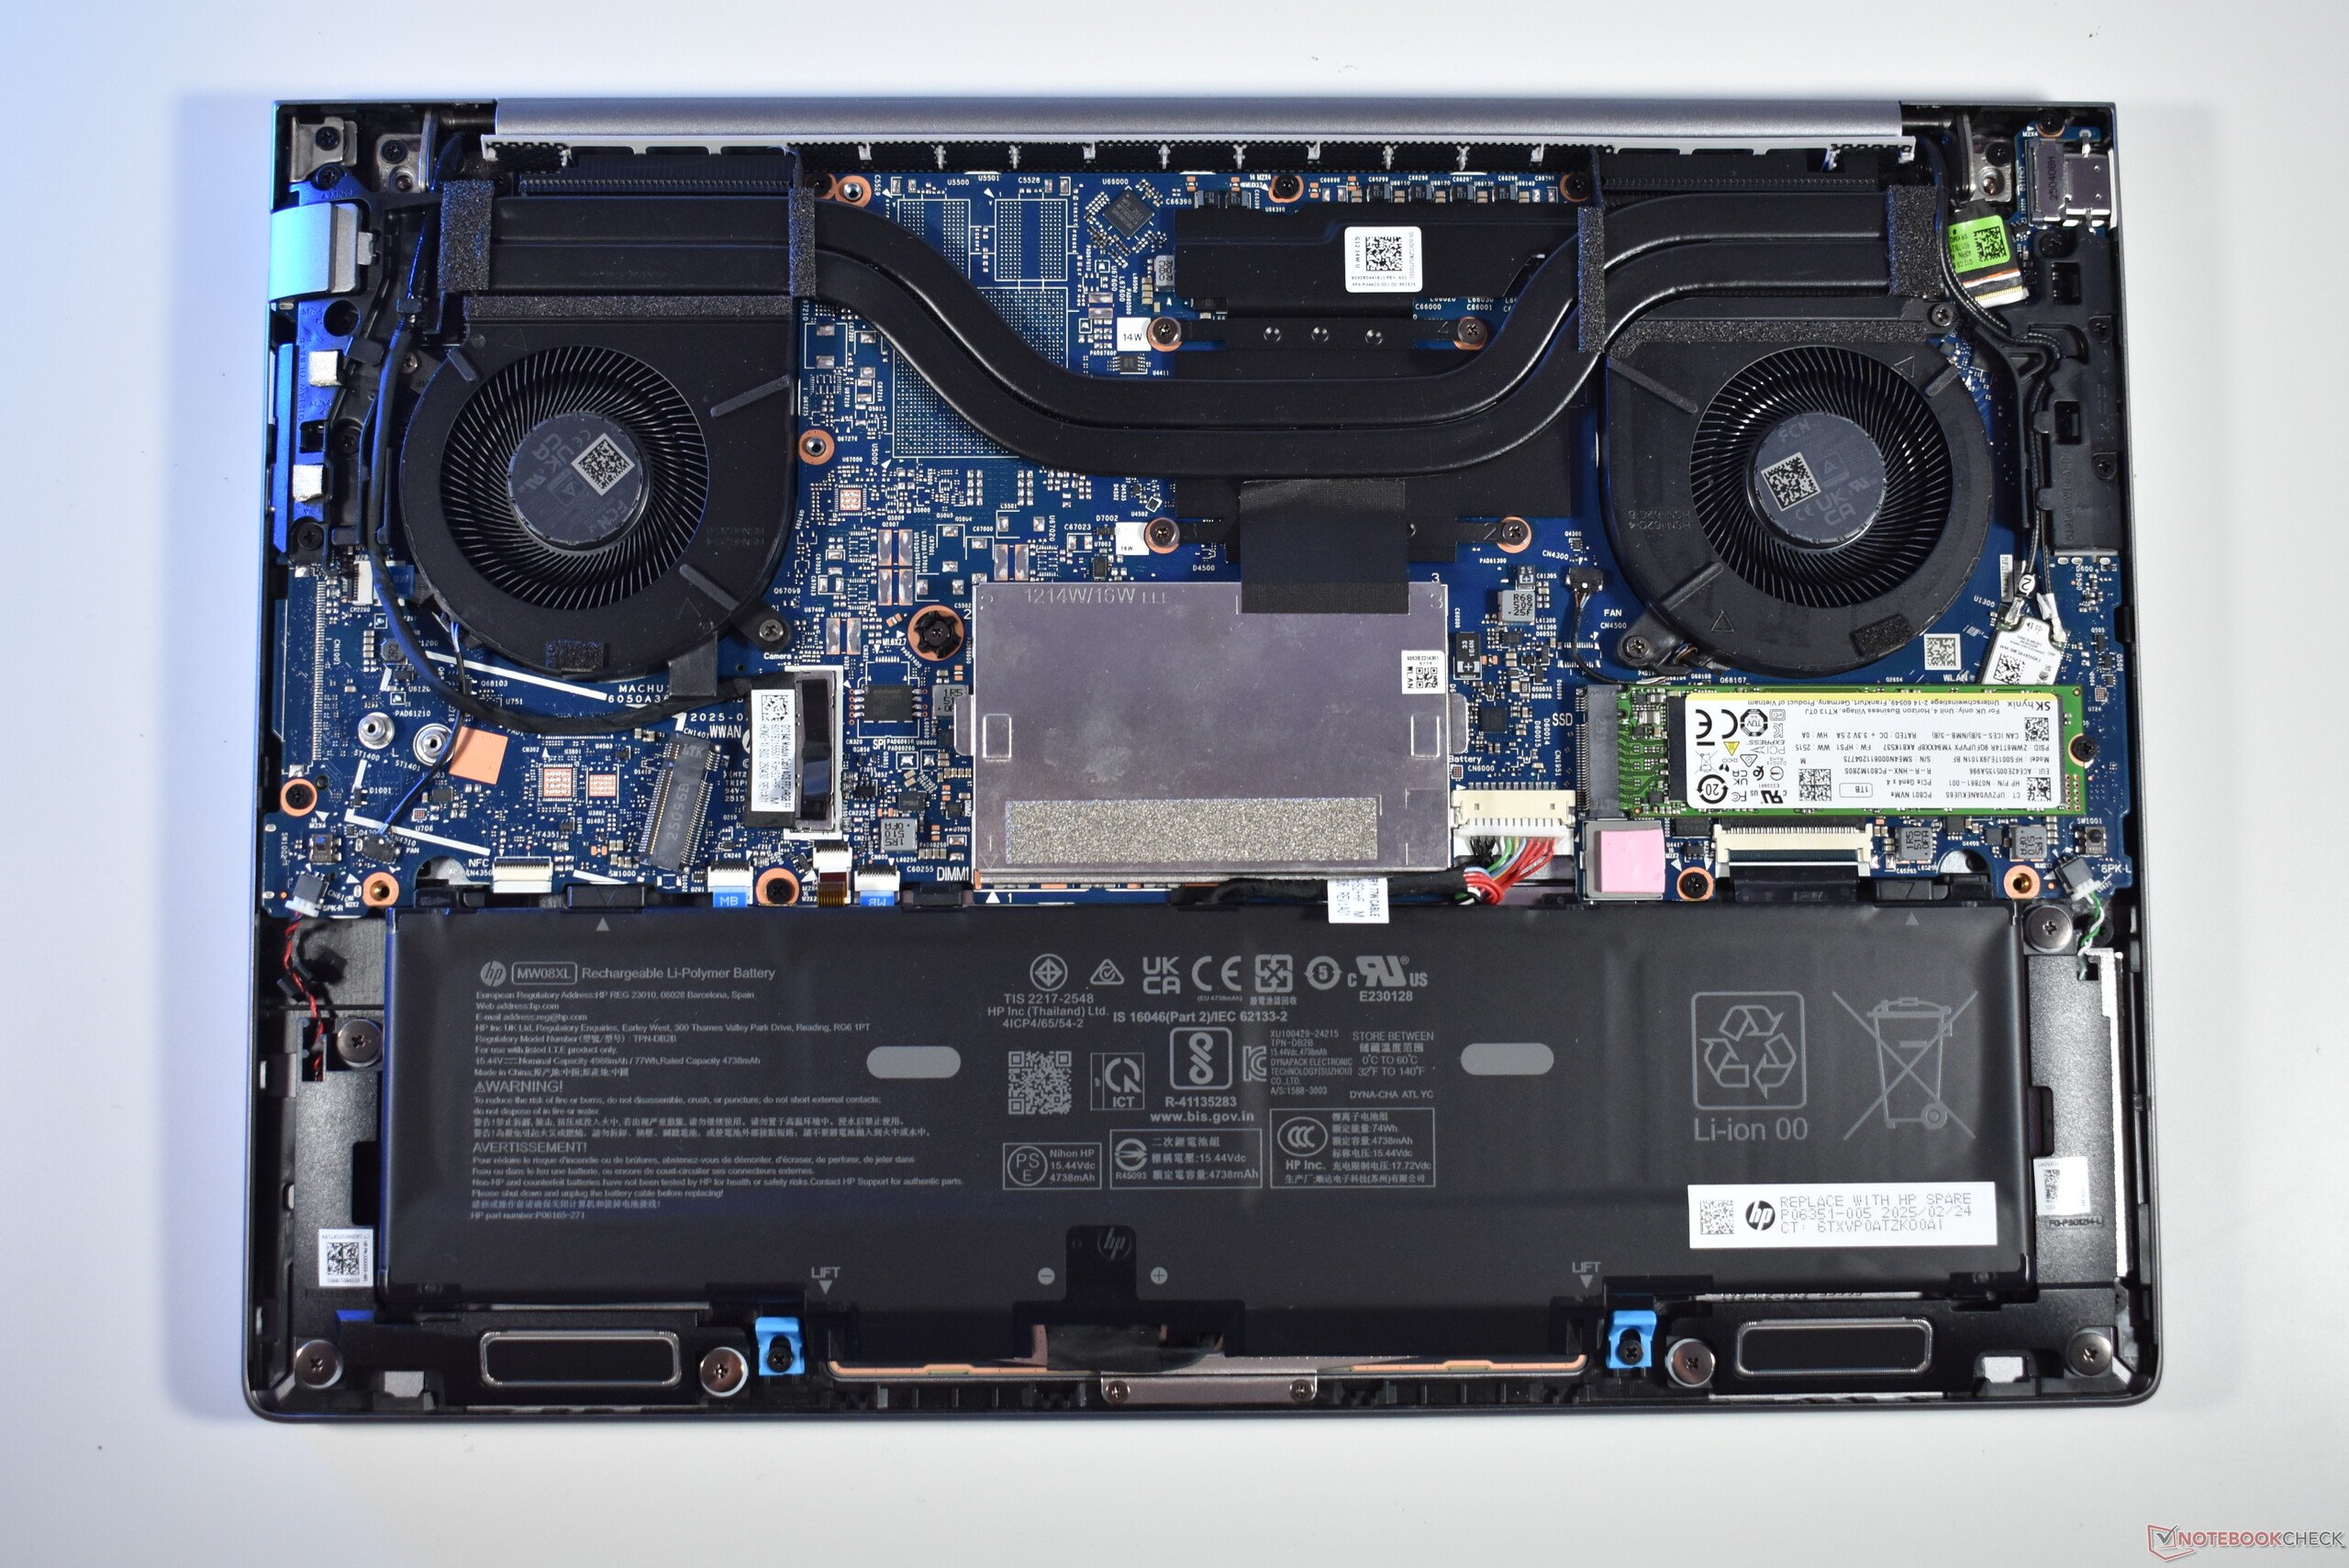
另外一个变化是引入了第二个散热风扇,老款 ZBook Firefly 使用的是单风扇,第二个风扇也是 EliteBook 8 的不同之处。尽管有这样的变化,ZBook 8 G1i 14 仍保留了两个 SO-DIMM 插槽以及模块化 M.2 2280 固态硬盘。


输入设备:非常舒适的 HP ZBook 键盘
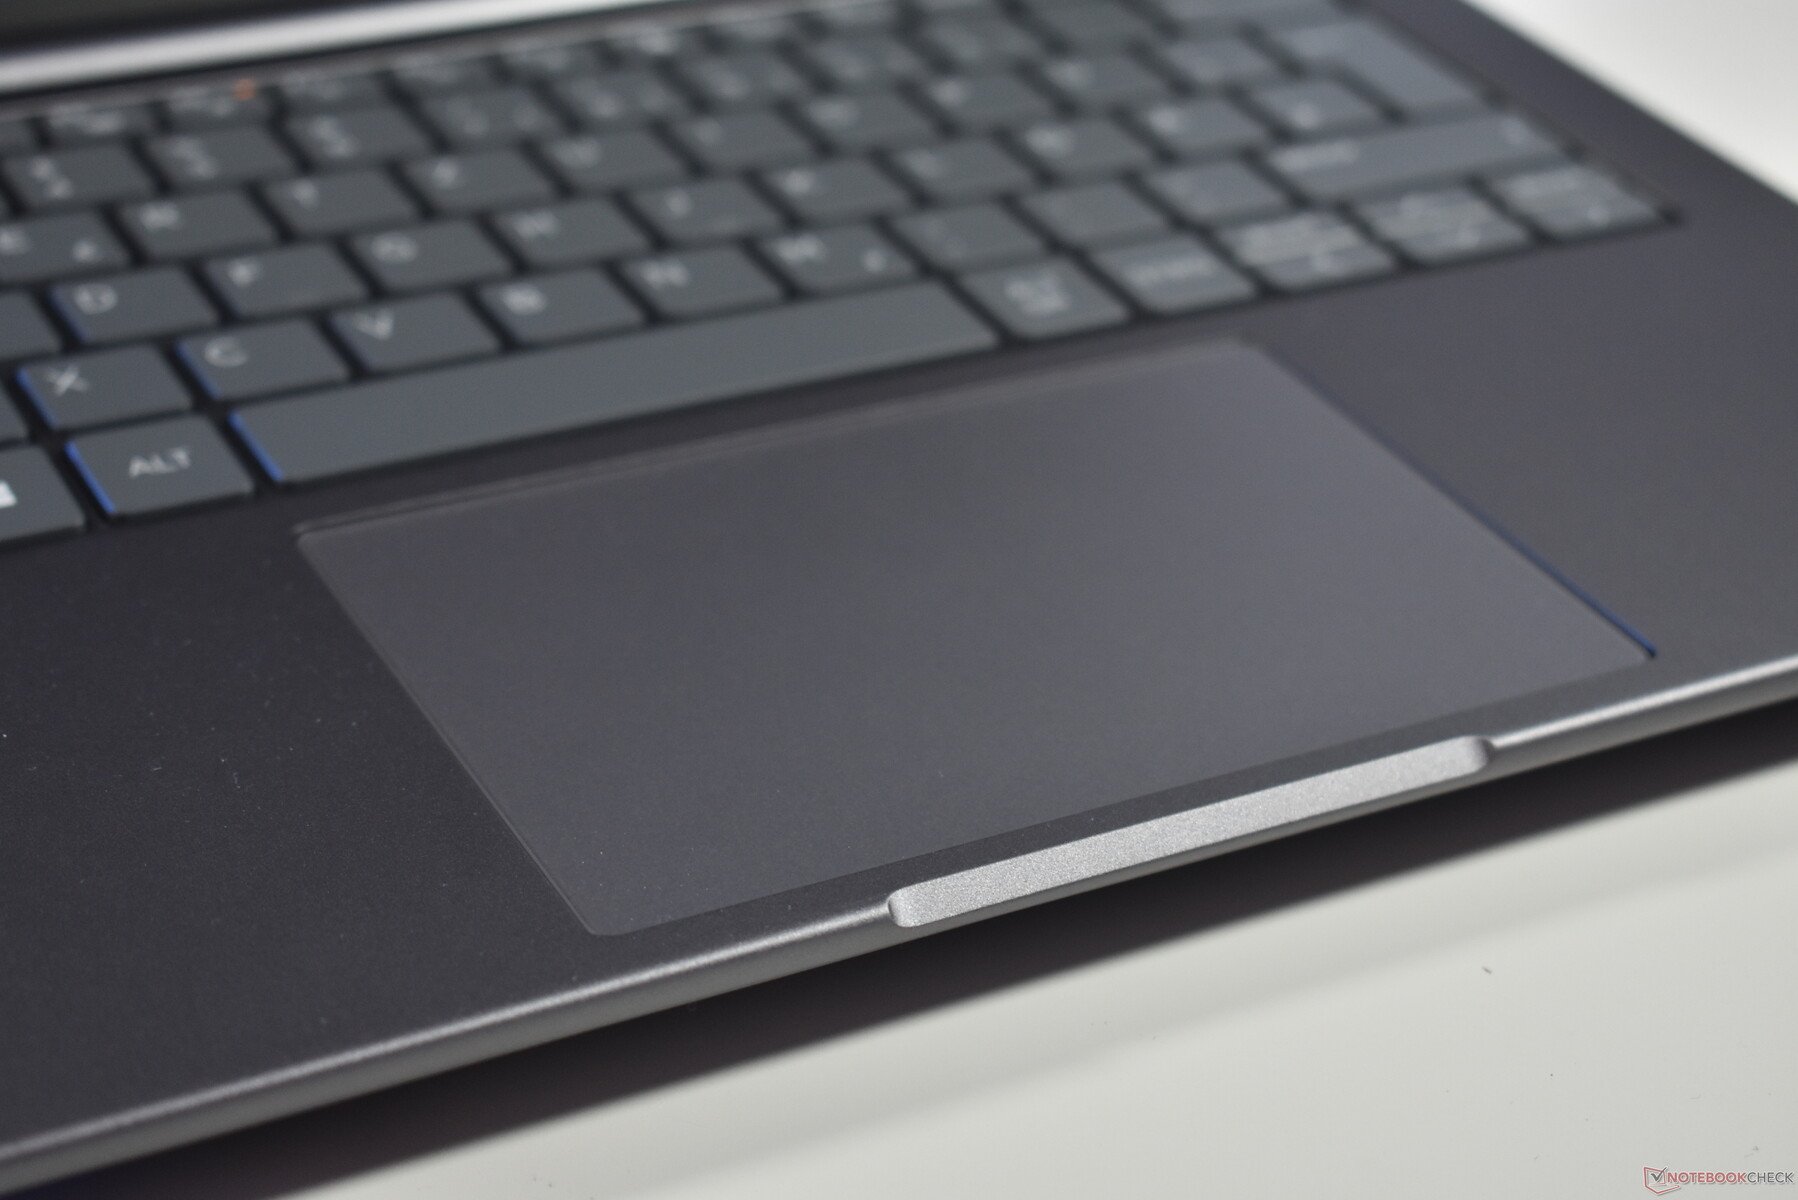
我们对键盘的评价 HP EliteBook 8 G1a 14的键盘的评价基本上也适用于这款产品:1.5 毫米行程的 Chiclet 键触感极佳,是一款出色的键盘。键盘布局还有改进的余地,但使用惠普 ZBook 8 G1i 键盘打字和工作是一种享受。尺寸为 12.5 x 8 厘米的玻璃触控板也非常坚固。唯一可以改进的方法是使用触觉解决方案而不是机械解决方案,因为这样用户就可以随处点击。
显示屏:WQXGA 屏幕可以更亮一些

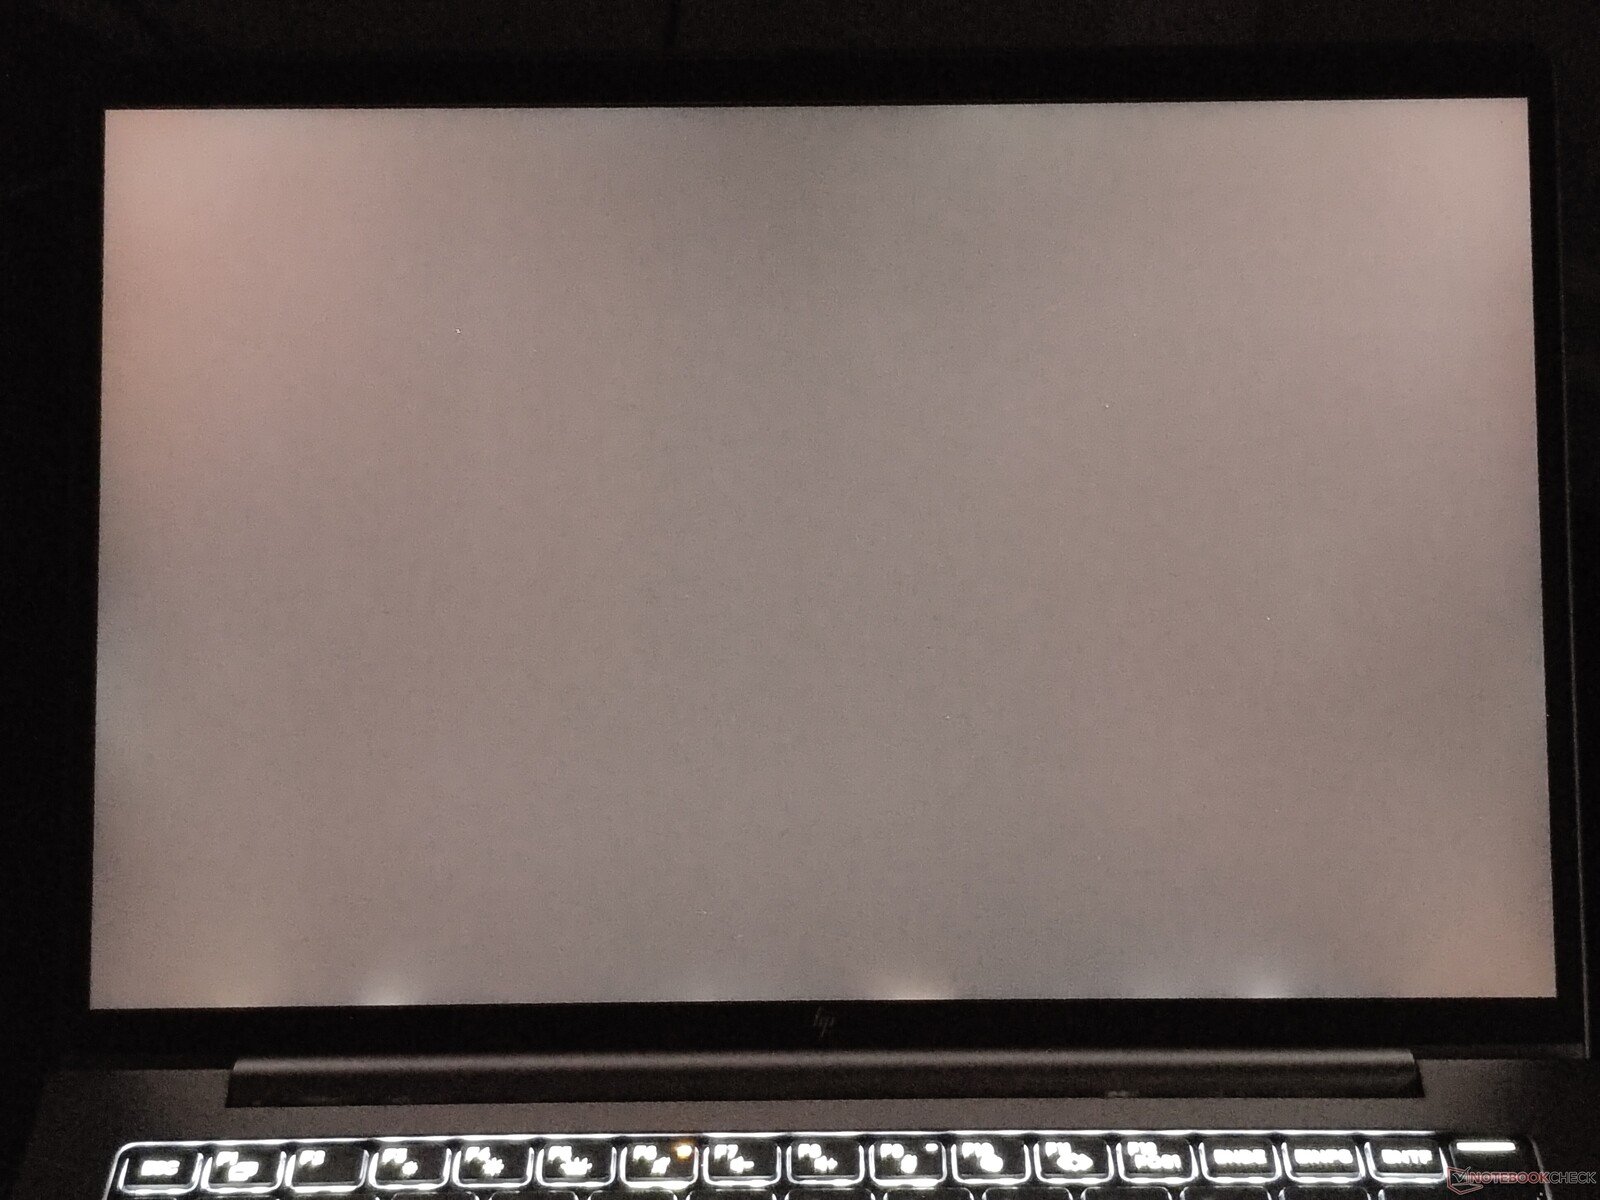
惠普为 HP ZBook 8 G1i 14 选择合适的显示屏并不容易,因为总共有七种不同的 14 英寸 16:10 IPS 雾面屏幕:
- WUXGA (1,920 x 1,080), 300 cd/m², 62.5 % sRGB
- WUXGA(1,920 x 1,080),300 cd/m²,62.5 % sRGB,触摸屏
- WUXGA (1,920 x 1,080),400 cd/m²,100 % sRGB,低功耗
- WUXGA(1,920 x 1,080),800 cd/m²,100 % sRGB,SureView 5
- WUXGA(1,920 x 1,080),800 cd/m²,100 % sRGB,SureView 5,触摸屏
- WQXGA/2.5K (2,560 x 1,600), 400 cd/m², 100 % AdobeRGB / DCI-P3, 120 Hz VRR
- WQXGA/2.5K(2,560 x 1,600),500 cd/m²,100 % DCI-P3,120 Hz,Dreamcolor
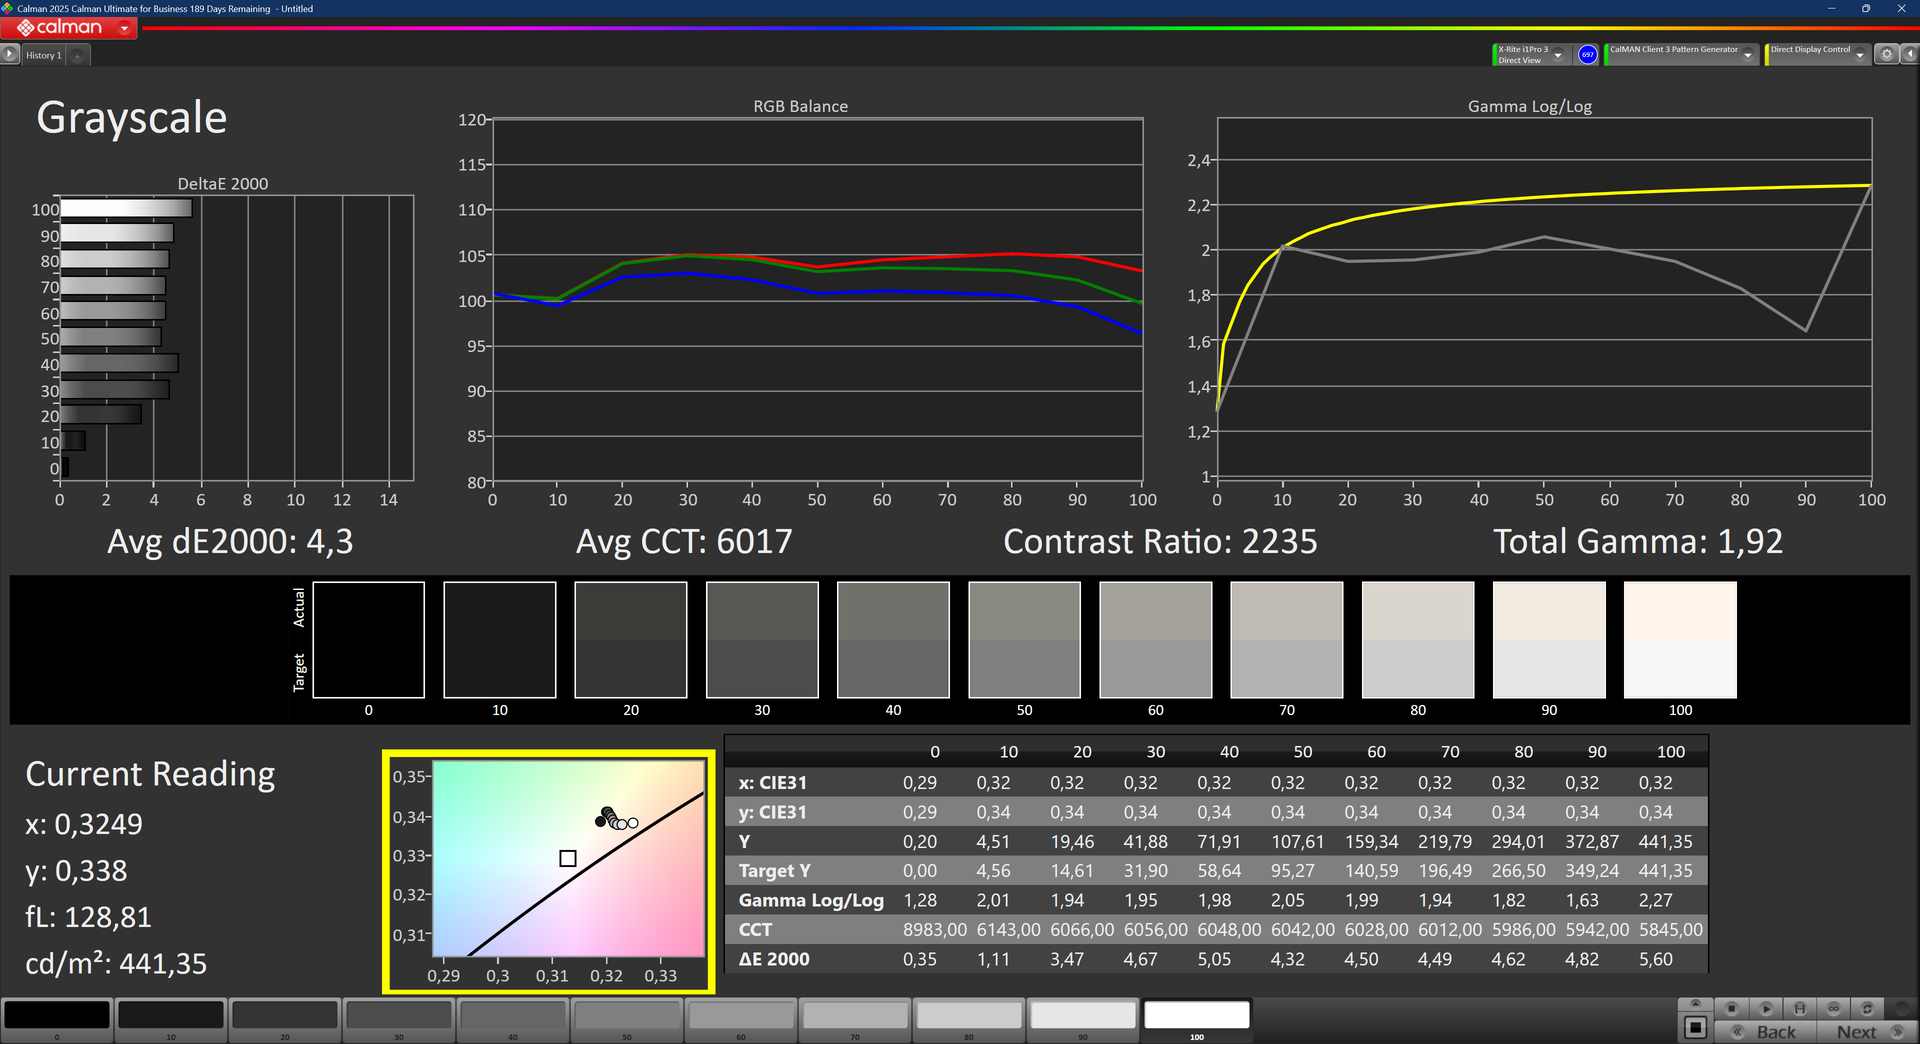
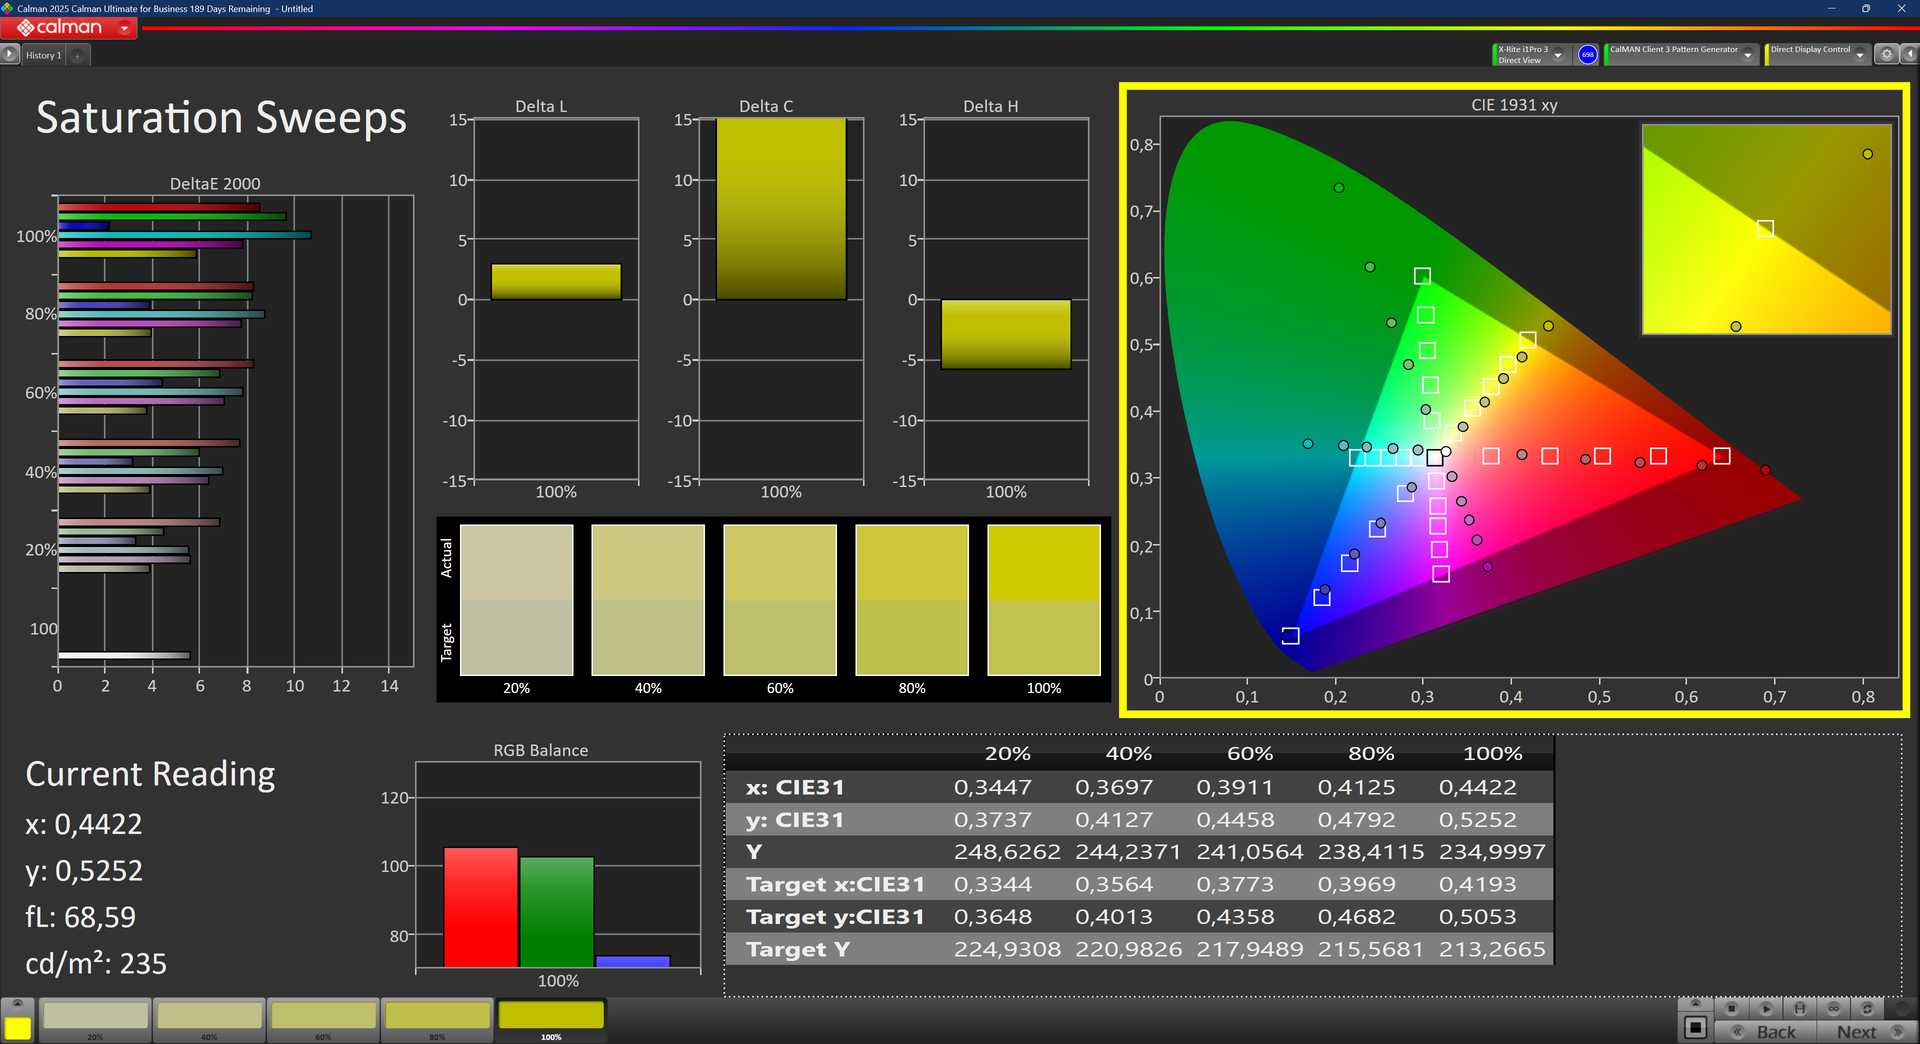
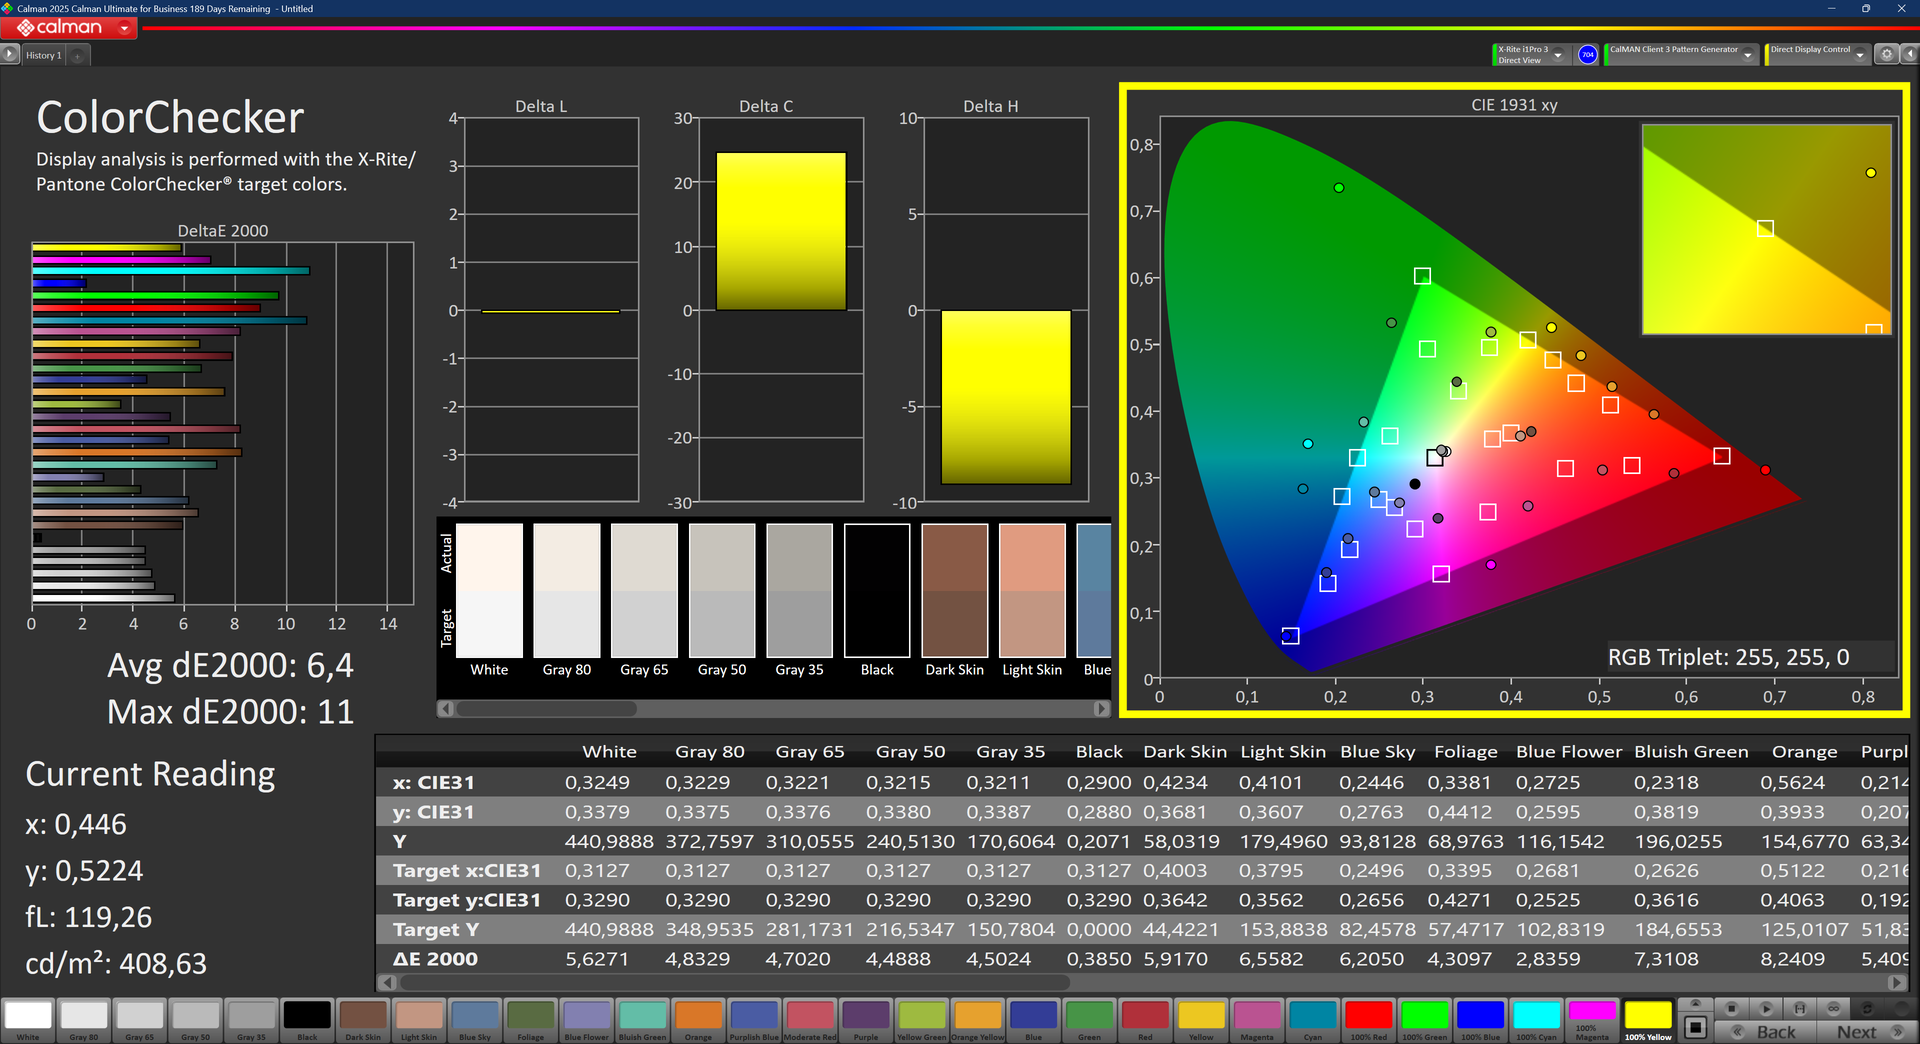
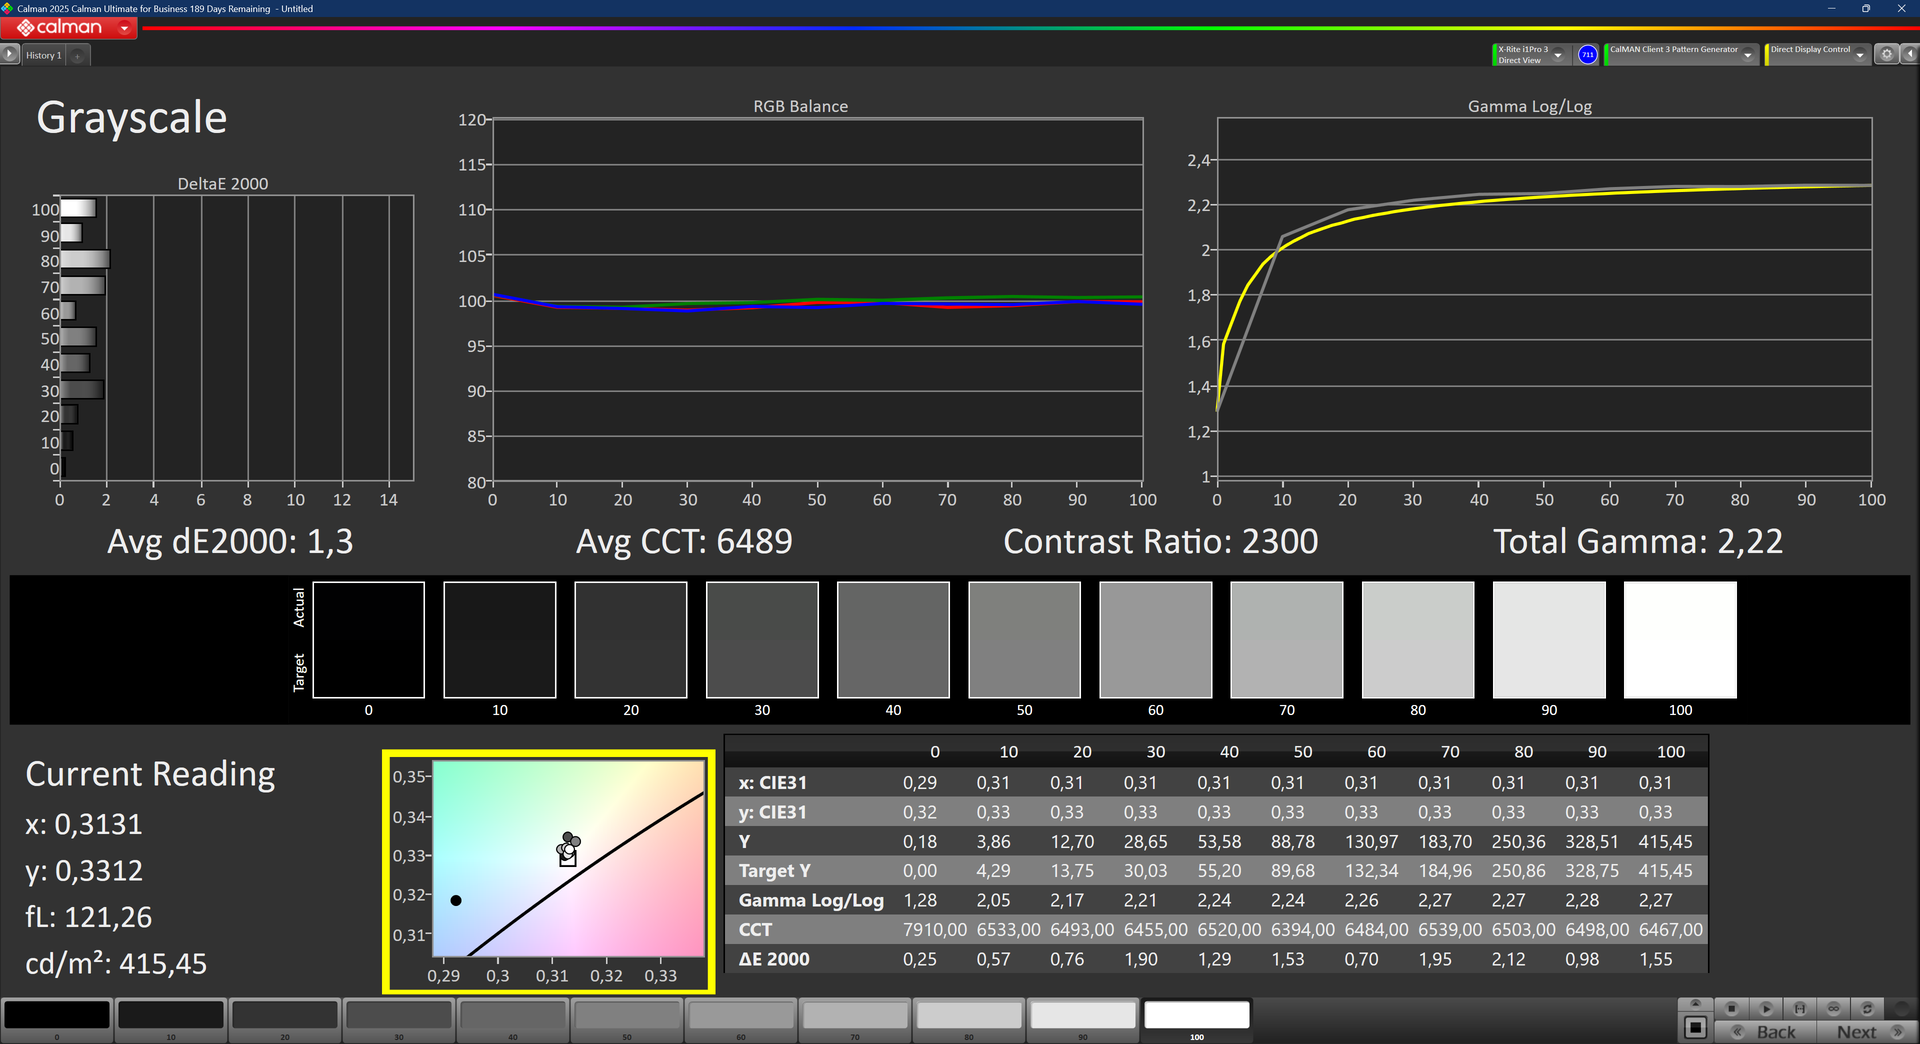
WQXGA 屏幕亮度很高,超过 400 cd/m²,虽然比老款 ZBook Firefly 低一些。屏幕的色彩非常出色,得益于 120 Hz VRR 刷新率,尽管响应时间不是最好的,但也不会感觉迟钝。总体而言,这是一款非常适合色彩工作的面板,尽管 400 cd/m² 左右的亮度对于现在的高级屏幕来说有点有限。
| |||||||||||||||||||||||||
Brightness Distribution: 92 %
Center on Battery: 441 cd/m²
Contrast: 2205:1 (Black: 0.2 cd/m²)
ΔE ColorChecker Calman: 6.4 | ∀{0.5-29.43 Ø4.72}
calibrated: 4.8
ΔE Greyscale Calman: 4.3 | ∀{0.09-98 Ø4.97}
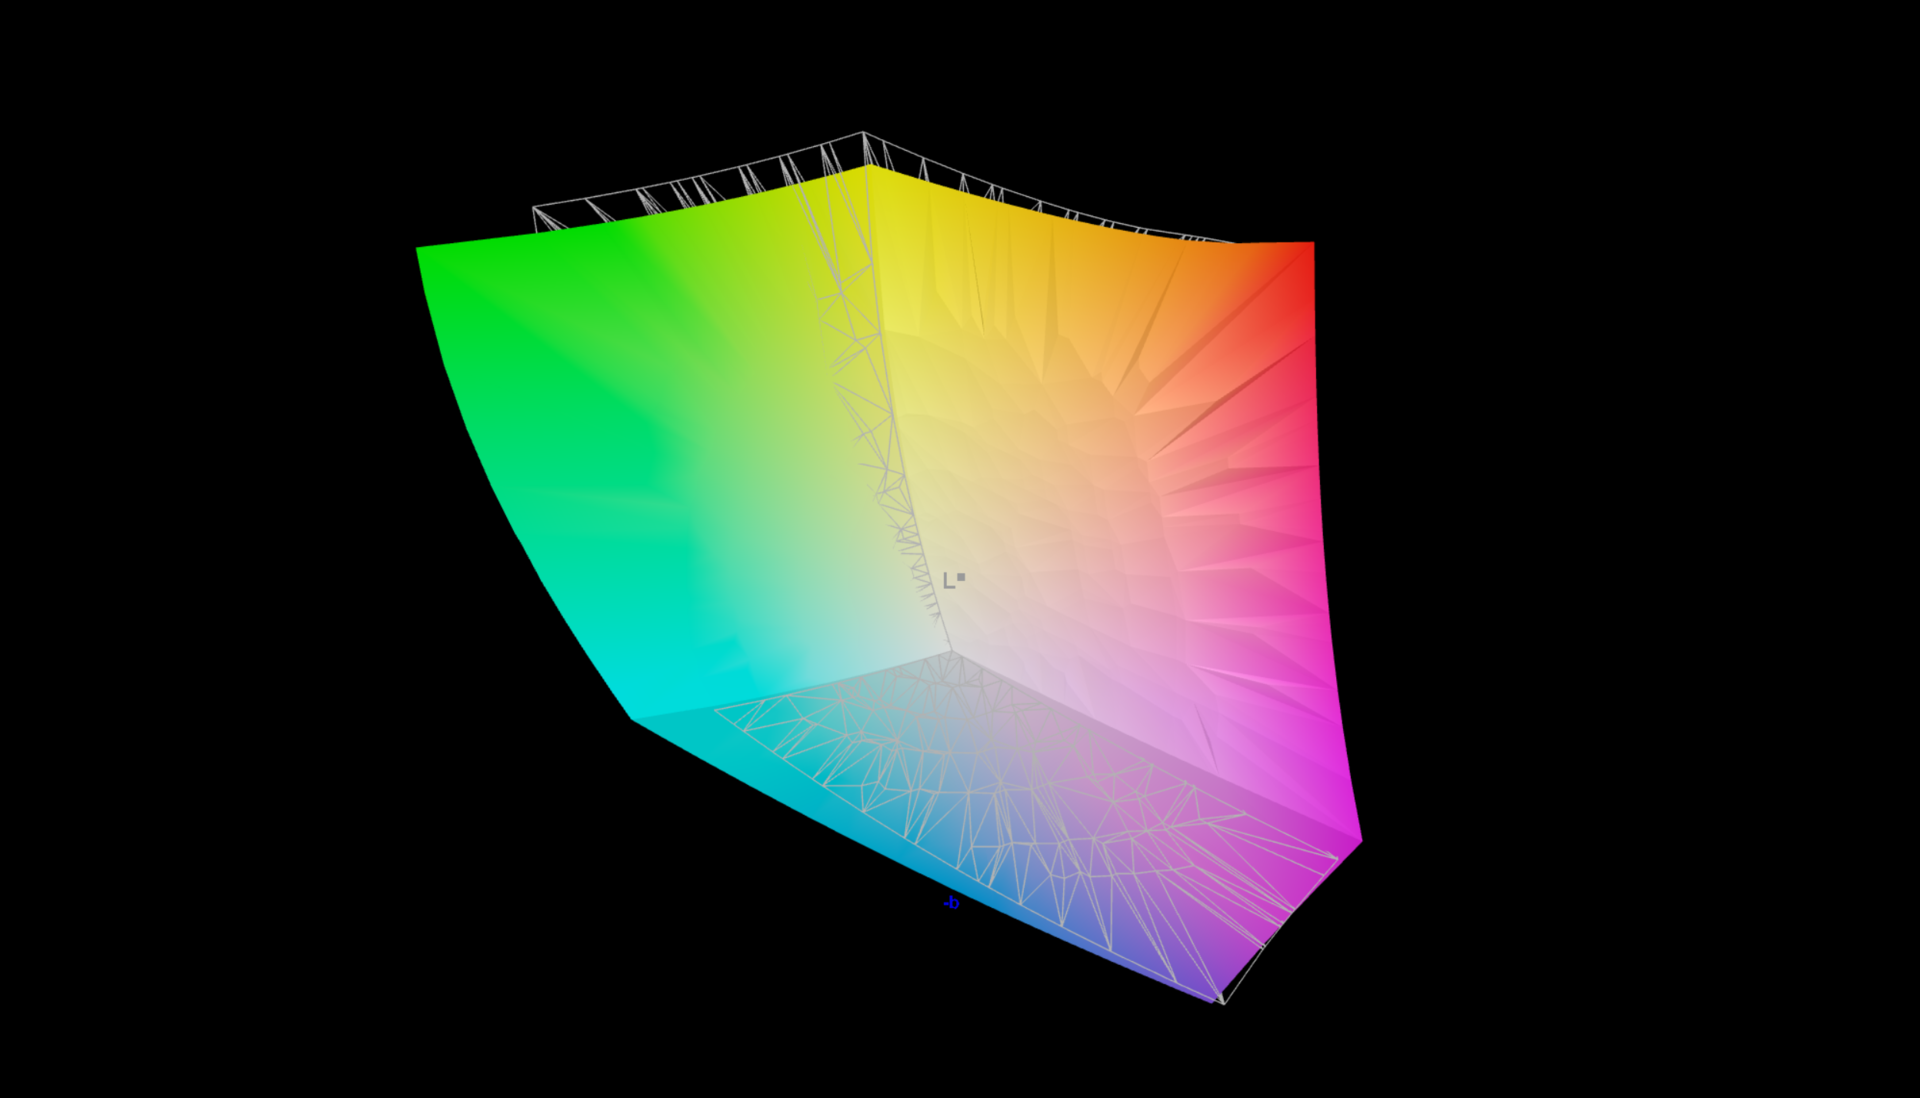
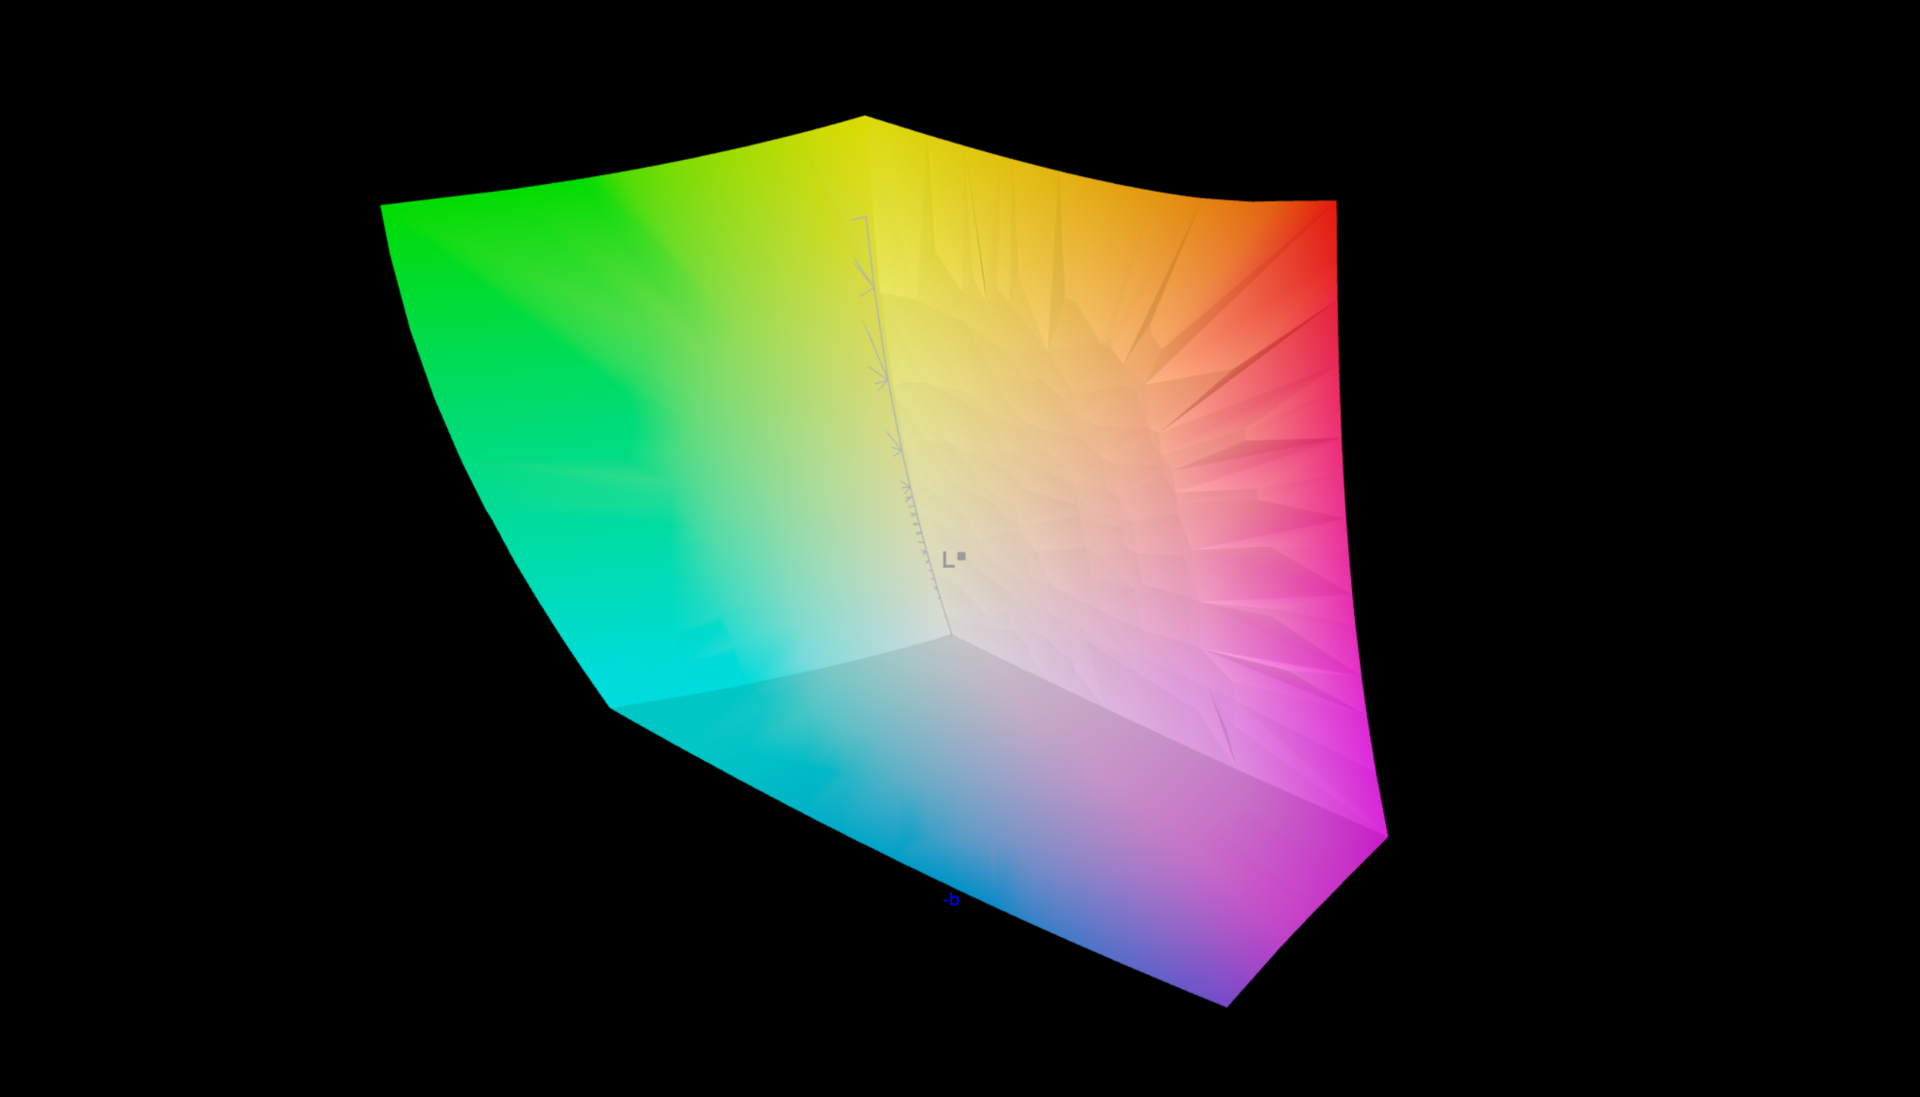
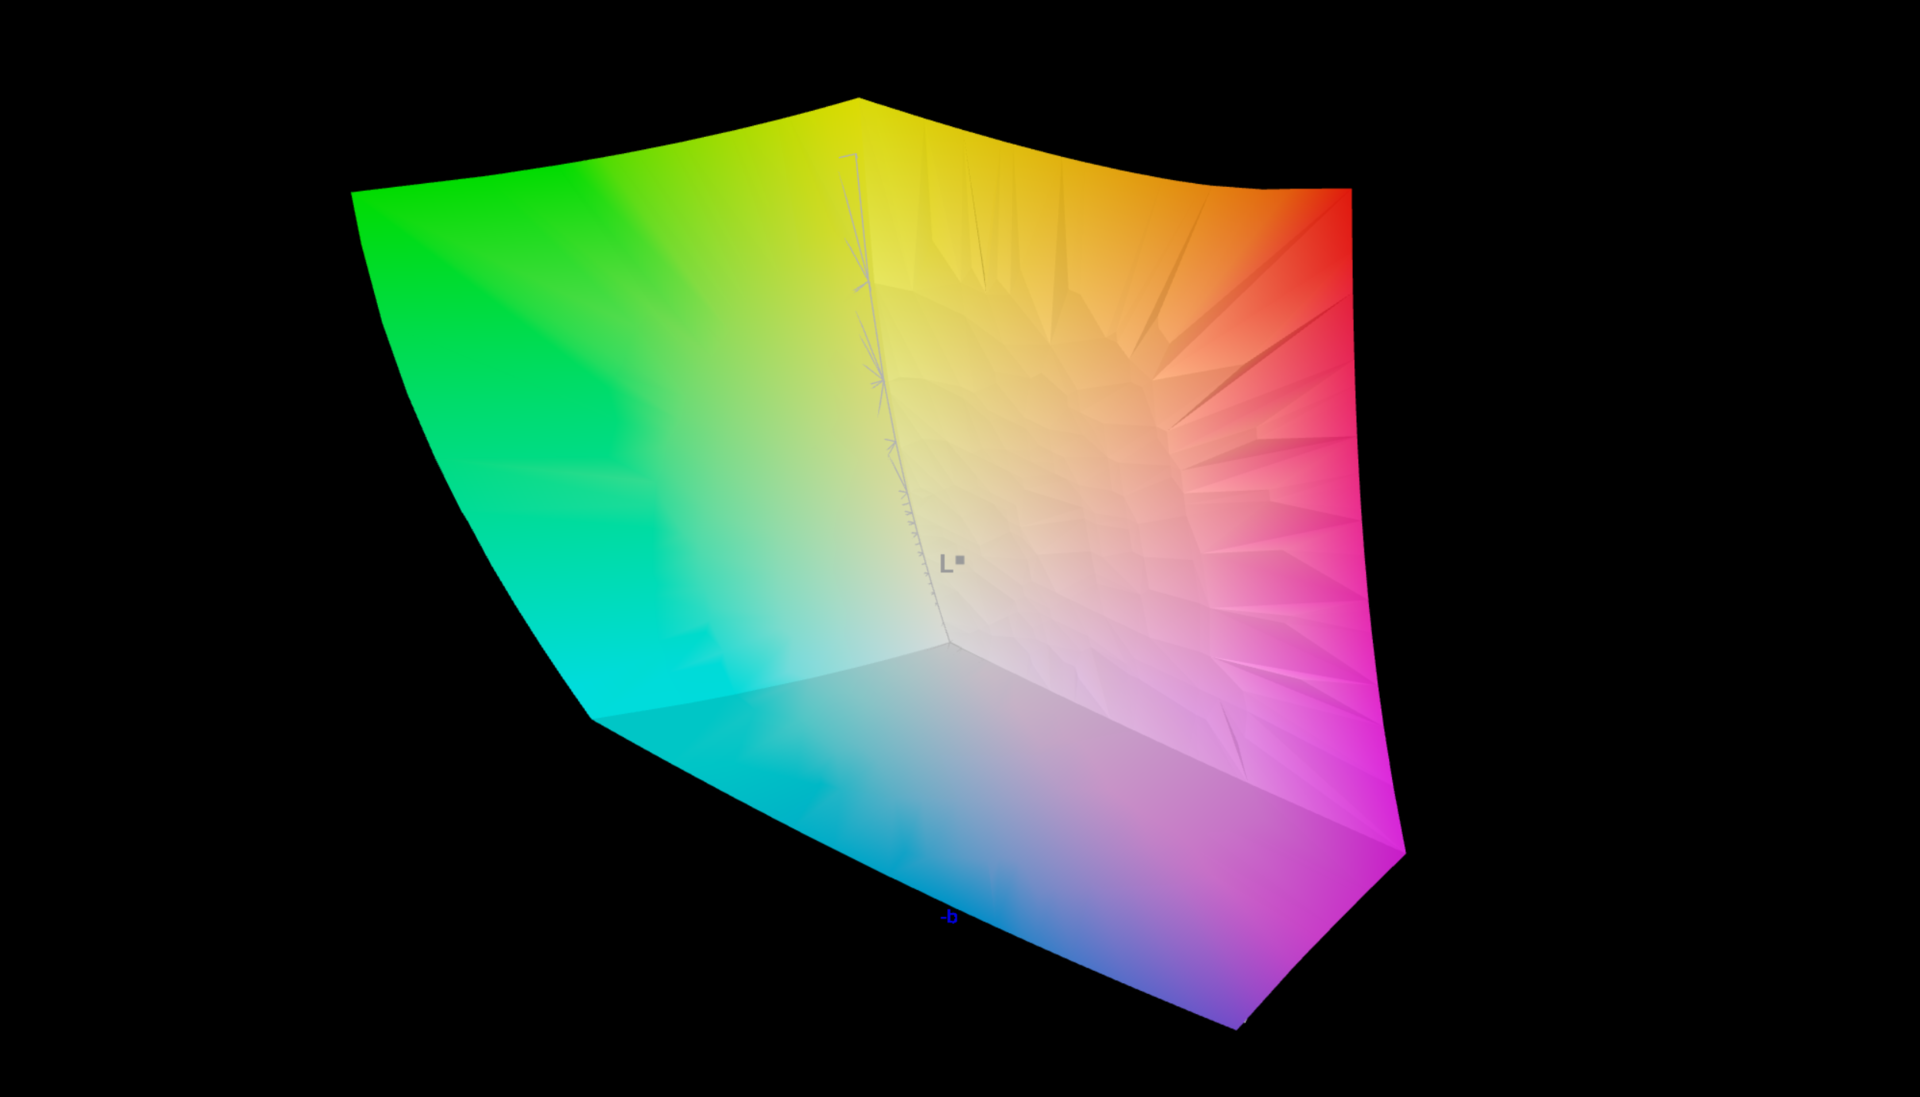
99.9% AdobeRGB 1998 (Argyll 3D)
99.9% sRGB (Argyll 3D)
95.8% Display P3 (Argyll 3D)
Gamma: 1.92
CCT: 6017 K
| HP ZBook 8 G1i 14 LGD07B5, IPS LED, 2560x1600, 14", 120 Hz | HP ZBook Firefly 14 G11 AUO6DA8, IPS, 2560x1600, 14", 120 Hz | Lenovo ThinkPad P14s Gen 6 21RV0017GE NE140WUM-N6M, IPS LED, 1920x1200, 14", 60 Hz | HP ZBook Ultra G1a 14 Samsung SDC41B3, OLED, 2880x1800, 14", 120 Hz | Dell Precision 5000 5490 AU Optronics B140QAN, IPS, 2560x1600, 14", 60 Hz | |
|---|---|---|---|---|---|
| Display | -3% | -21% | 0% | -12% | |
| Display P3 Coverage (%) | 95.8 | 98.9 3% | 67.1 -30% | 99.7 4% | 79.7 -17% |
| sRGB Coverage (%) | 99.9 | 99.9 0% | 98.6 -1% | 100 0% | 100 0% |
| AdobeRGB 1998 Coverage (%) | 99.9 | 86.6 -13% | 69.2 -31% | 95.6 -4% | 79.5 -20% |
| Response Times | 61% | 3% | 78% | -62% | |
| Response Time Grey 50% / Grey 80% * (ms) | 30.3 ? | 12.3 ? 59% | 31.1 ? -3% | 0.94 ? 97% | 52.3 ? -73% |
| Response Time Black / White * (ms) | 22.2 ? | 8.3 ? 63% | 20.5 ? 8% | 1.01 ? 95% | 33.3 ? -50% |
| PWM Frequency (Hz) | 24000 ? | 492.6 | |||
| PWM Amplitude * (%) | 75 | 43 43% | |||
| Screen | 10% | 21% | 34% | 16% | |
| Brightness middle (cd/m²) | 441 | 554.1 26% | 558 27% | 384.7 -13% | 485.1 10% |
| Brightness (cd/m²) | 417 | 540 29% | 545 31% | 387 -7% | 471 13% |
| Brightness Distribution (%) | 92 | 93 1% | 91 -1% | 99 8% | 90 -2% |
| Black Level * (cd/m²) | 0.2 | 0.58 -190% | 0.32 -60% | 0.38 -90% | |
| Contrast (:1) | 2205 | 955 -57% | 1744 -21% | 1277 -42% | |
| Colorchecker dE 2000 * | 6.4 | 2.54 60% | 2.7 58% | 3.36 48% | 2.15 66% |
| Colorchecker dE 2000 max. * | 11 | 4.99 55% | 5.3 52% | 6.45 41% | 5.39 51% |
| Colorchecker dE 2000 calibrated * | 4.8 | 0.56 88% | 0.7 85% | 0.65 86% | 0.67 86% |
| Greyscale dE 2000 * | 4.3 | 1 77% | 3.5 19% | 1 77% | 2 53% |
| Gamma | 1.92 115% | 2.3 96% | 2.1 105% | 2.26 97% | 2.3 96% |
| CCT | 6017 108% | 6556 99% | 7191 90% | 6380 102% | 6826 95% |
| Total Average (Program / Settings) | 23% /
14% | 1% /
10% | 37% /
37% | -19% /
-1% |
* ... smaller is better


Display Response Times
| ↔ Response Time Black to White | ||
|---|---|---|
| 22.2 ms ... rise ↗ and fall ↘ combined | ↗ 9.3 ms rise | 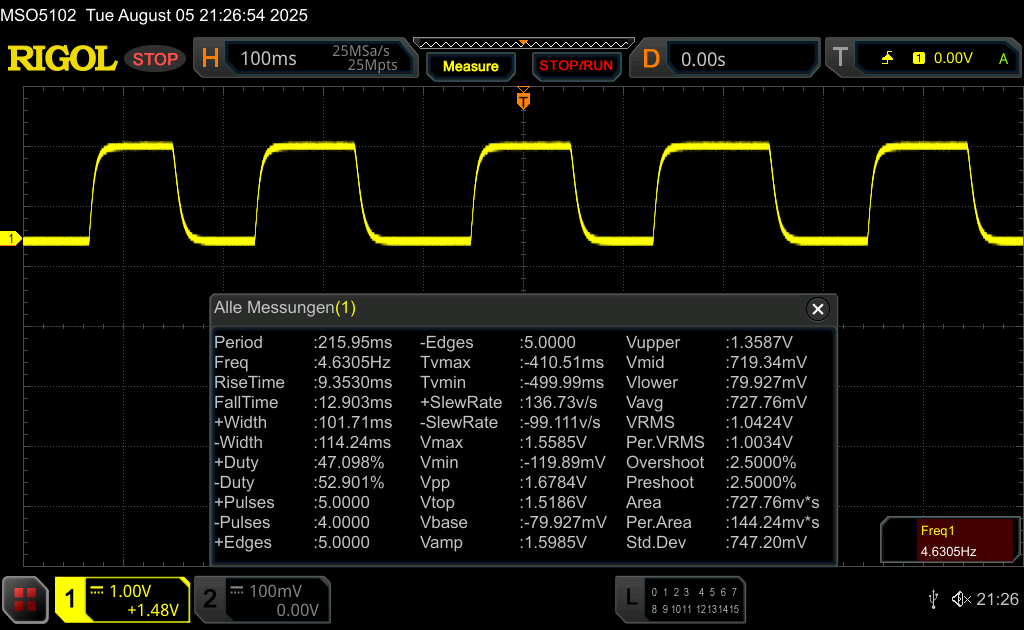 |
| ↘ 12.9 ms fall | ||
| The screen shows good response rates in our tests, but may be too slow for competitive gamers. In comparison, all tested devices range from 0.1 (minimum) to 240 (maximum) ms. » 51 % of all devices are better. This means that the measured response time is worse than the average of all tested devices (19.8 ms). | ||
| ↔ Response Time 50% Grey to 80% Grey | ||
| 30.3 ms ... rise ↗ and fall ↘ combined | ↗ 13.3 ms rise | 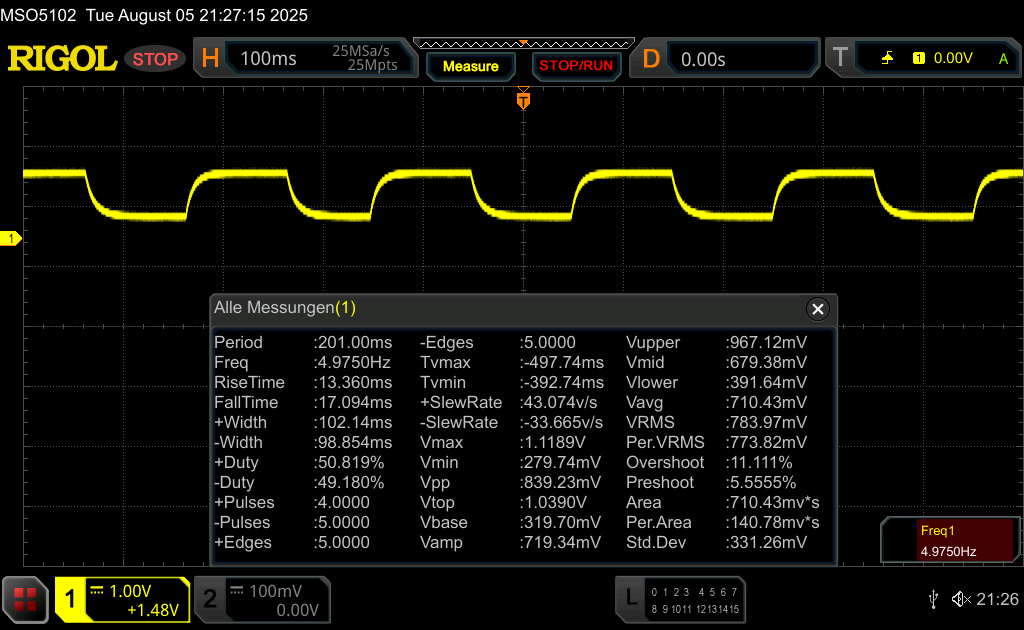 |
| ↘ 17 ms fall | ||
| The screen shows slow response rates in our tests and will be unsatisfactory for gamers. In comparison, all tested devices range from 0.165 (minimum) to 636 (maximum) ms. » 41 % of all devices are better. This means that the measured response time is similar to the average of all tested devices (31 ms). | ||
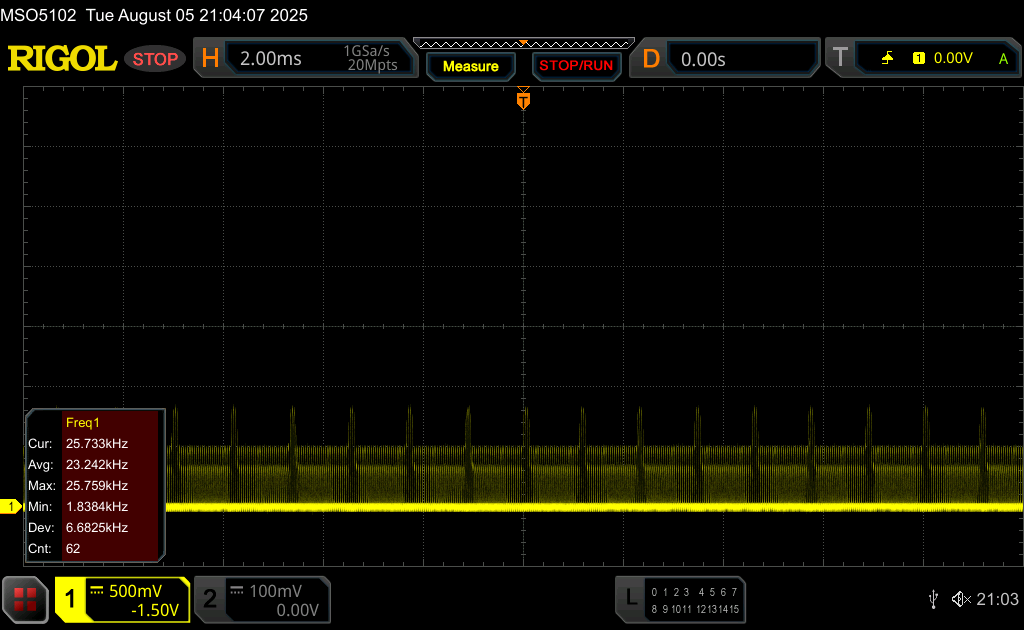
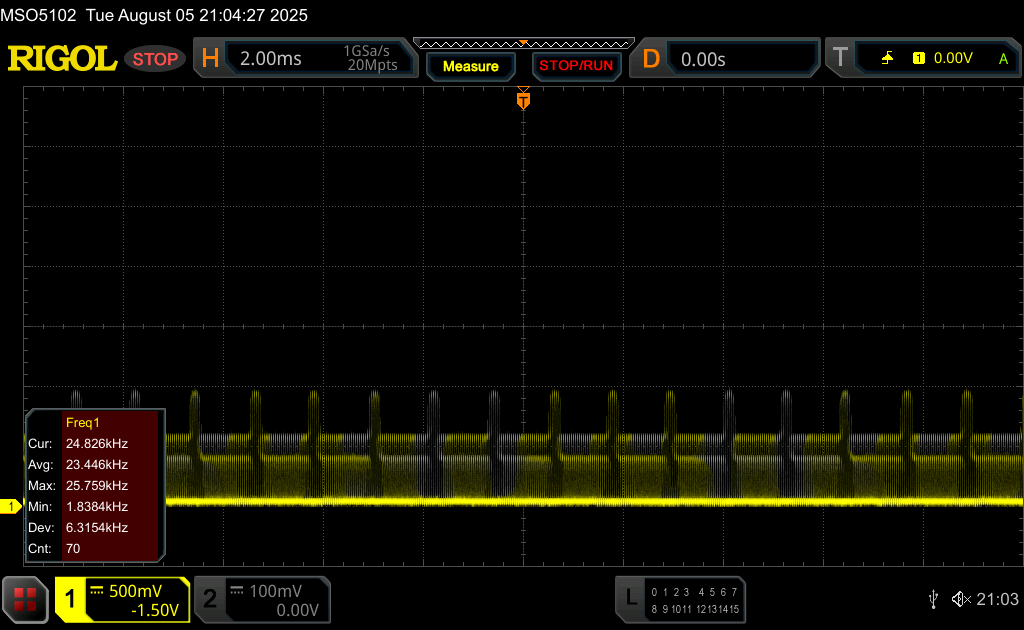
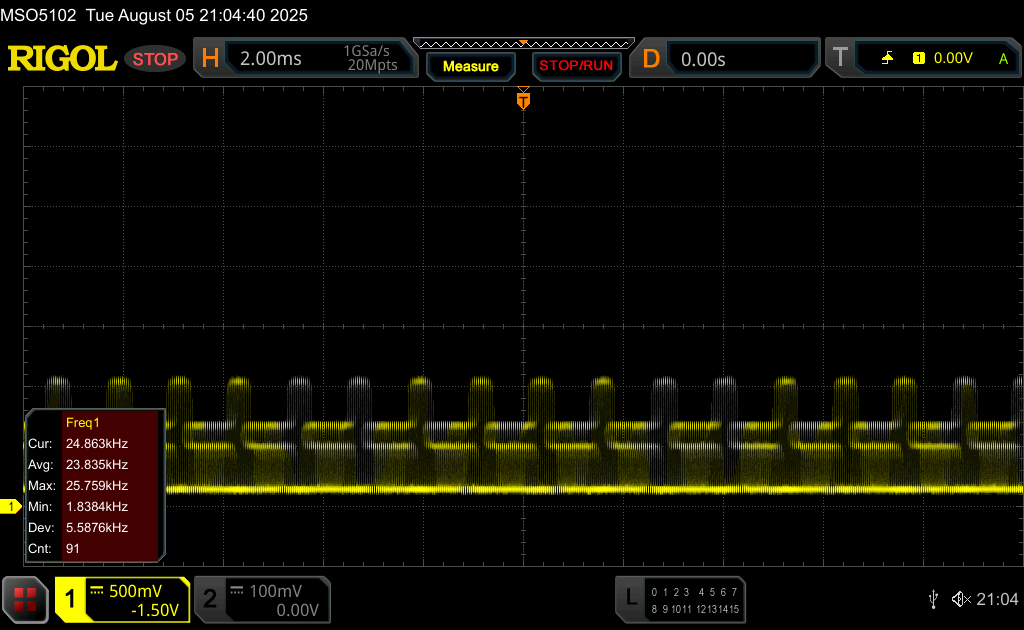
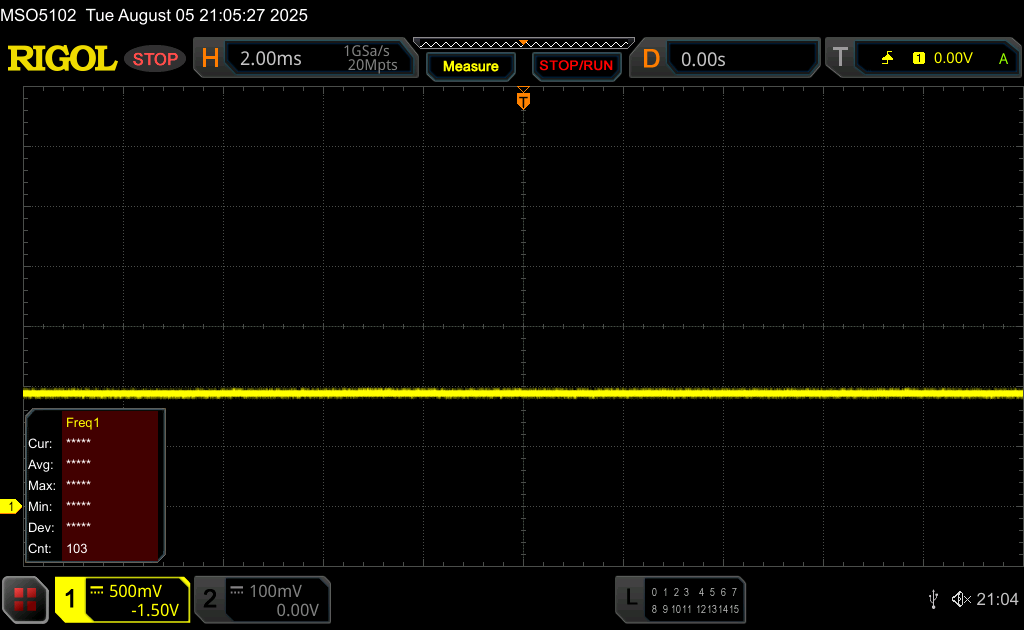
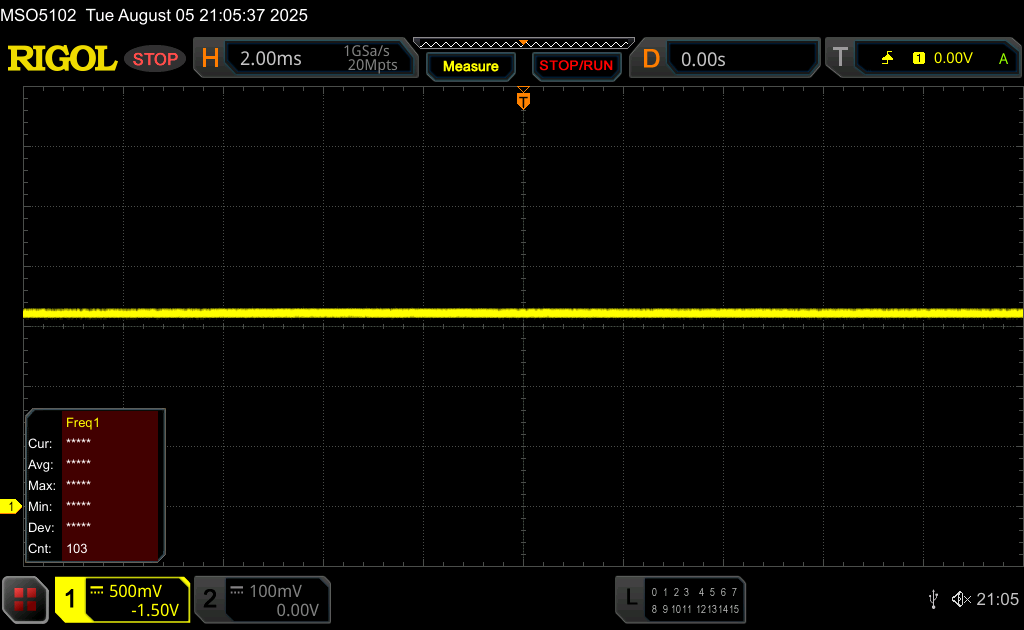
Screen Flickering / PWM (Pulse-Width Modulation)
| Screen flickering / PWM detected | 24000 Hz Amplitude: 75 % | ≤ 74 % brightness setting | 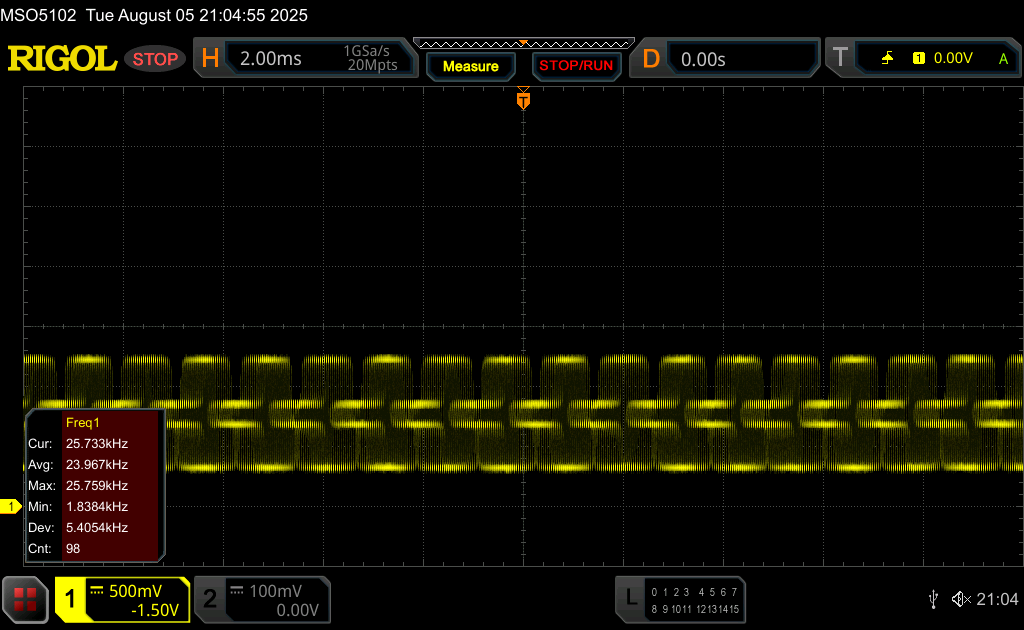 |
The display backlight flickers at 24000 Hz (worst case, e.g., utilizing PWM) Flickering detected at a brightness setting of 74 % and below. There should be no flickering or PWM above this brightness setting. The frequency of 24000 Hz is quite high, so most users sensitive to PWM should not notice any flickering. In comparison: 52 % of all tested devices do not use PWM to dim the display. If PWM was detected, an average of 7750 (minimum: 5 - maximum: 343500) Hz was measured. | |||
性能英特尔箭湖 H 与 Strix Point 不相上下
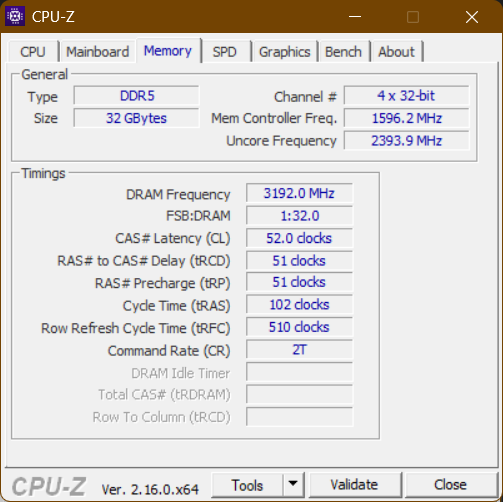
惠普提供 Arrow Lake U 和 Arrow Lake H 两种 CPU 可供选择,所提供的 9 个 CPU 内核总数从 12 个到 16 个不等。GPU 有四种选择,三种来自英特尔,另一种是 Nvidia RTX 500 Ada作为单个专用 GPU。最高可提供 64 GB DDR5-5600 内存(2x SO-DIMM)和单个 M.2 2280 NVMe PCIe 4.0 固态硬盘,容量最高可达 2 TB。
测试条件
我们使用 "最佳性能 "电源模式对评测设备进行了测试。处理器的功率限制如下:
- 最佳能效:PL1 40 W / PL2 60 W
- 平衡:PL1 60 W / PL2 60 W
- 最佳性能:PL1 60 W / PL2 60 W
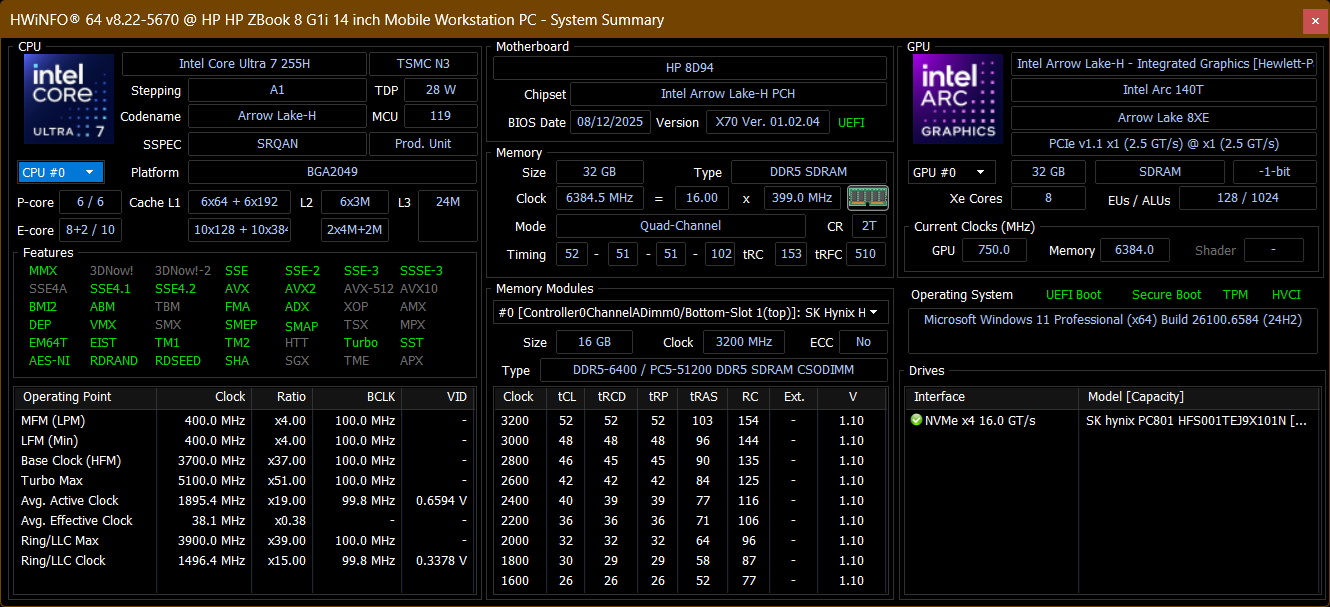
处理器
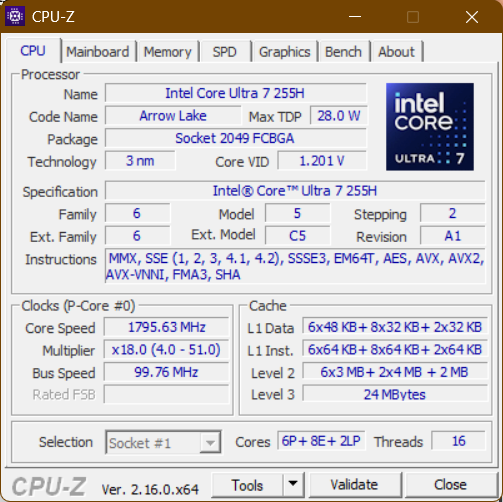
英特尔 英特尔酷睿255H是一款 Arrow Lake H 处理器,共有 16 个内核(6 个 Lion Cove P 内核,主频高达 5.1 GHz;8 个 Skymont E 内核,主频高达 4.4 GHz;2 个 Low Power E 内核,主频高达 2.5 GHz)。该处理器的典型 TDP 额定值为 28 W,但如果制造商设定为 115 W,则其功耗可高达 115 W。您可以通过我们的 CPU 基准列表.
性能比 ZBook 萤火虫 G11由于采用了新的双风扇冷却系统,持续 TDP 从 26 W 增加到 60 W,因此性能明显提高。在单核负载方面,英特尔 CPU 比 AMD 芯片略胜一筹,但在多核任务方面,AMD Strix Halo 要好得多。它与联想的 Strix Point 芯片打成平手。 联想 ThinkPad P14s 6 代 AMD但值得一提的是,该芯片在持续负载下的功耗仅为 36 瓦。
在电池模式下,CPU 性能不会受到影响。
Cinebench R15 多回路运行
Cinebench R23: Multi Core | Single Core
Cinebench R20: CPU (Multi Core) | CPU (Single Core)
Cinebench R15: CPU Multi 64Bit | CPU Single 64Bit
Blender: v2.79 BMW27 CPU
7-Zip 18.03: 7z b 4 | 7z b 4 -mmt1
Geekbench 6.7: Multi-Core | Single-Core
Geekbench 5.5: Multi-Core | Single-Core
HWBOT x265 Benchmark v2.2: 4k Preset
LibreOffice : 20 Documents To PDF
R Benchmark 2.5: Overall mean
| CPU Performance rating | |
| HP ZBook Ultra G1a 14 | |
| Average of class Workstation | |
| HP ZBook 8 G1i 14 | |
| Average Intel Core Ultra 7 255H | |
| Lenovo ThinkPad P14s Gen 6 21RV0017GE | |
| Dell Precision 5000 5490 | |
| HP ZBook Firefly 14 G11 | |
| Cinebench R23 / Multi Core | |
| HP ZBook Ultra G1a 14 | |
| Average of class Workstation (14621 - 38520, n=24, last 2 years) | |
| HP ZBook 8 G1i 14 | |
| Average Intel Core Ultra 7 255H (16105 - 22578, n=20) | |
| Lenovo ThinkPad P14s Gen 6 21RV0017GE | |
| Dell Precision 5000 5490 | |
| HP ZBook Firefly 14 G11 | |
| Cinebench R23 / Single Core | |
| Average Intel Core Ultra 7 255H (1874 - 2152, n=20) | |
| HP ZBook 8 G1i 14 | |
| Average of class Workstation (1712 - 2228, n=24, last 2 years) | |
| HP ZBook Ultra G1a 14 | |
| Lenovo ThinkPad P14s Gen 6 21RV0017GE | |
| Dell Precision 5000 5490 | |
| HP ZBook Firefly 14 G11 | |
| Cinebench R20 / CPU (Multi Core) | |
| HP ZBook Ultra G1a 14 | |
| Average of class Workstation (5760 - 15043, n=24, last 2 years) | |
| Average Intel Core Ultra 7 255H (6356 - 8860, n=19) | |
| HP ZBook 8 G1i 14 | |
| Lenovo ThinkPad P14s Gen 6 21RV0017GE | |
| Dell Precision 5000 5490 | |
| HP ZBook Firefly 14 G11 | |
| Cinebench R20 / CPU (Single Core) | |
| Average Intel Core Ultra 7 255H (743 - 826, n=19) | |
| HP ZBook 8 G1i 14 | |
| HP ZBook Ultra G1a 14 | |
| Average of class Workstation (671 - 857, n=24, last 2 years) | |
| Lenovo ThinkPad P14s Gen 6 21RV0017GE | |
| Dell Precision 5000 5490 | |
| HP ZBook Firefly 14 G11 | |
| Cinebench R15 / CPU Multi 64Bit | |
| HP ZBook Ultra G1a 14 | |
| Average of class Workstation (2489 - 5810, n=24, last 2 years) | |
| Lenovo ThinkPad P14s Gen 6 21RV0017GE | |
| Average Intel Core Ultra 7 255H (2414 - 3444, n=19) | |
| HP ZBook 8 G1i 14 | |
| Dell Precision 5000 5490 | |
| HP ZBook Firefly 14 G11 | |
| Cinebench R15 / CPU Single 64Bit | |
| HP ZBook Ultra G1a 14 | |
| HP ZBook 8 G1i 14 | |
| Average Intel Core Ultra 7 255H (258 - 322, n=20) | |
| Average of class Workstation (191.4 - 328, n=24, last 2 years) | |
| HP ZBook Firefly 14 G11 | |
| Dell Precision 5000 5490 | |
| Lenovo ThinkPad P14s Gen 6 21RV0017GE | |
| Blender / v2.79 BMW27 CPU | |
| HP ZBook Firefly 14 G11 | |
| Dell Precision 5000 5490 | |
| Average Intel Core Ultra 7 255H (156 - 293, n=19) | |
| HP ZBook 8 G1i 14 | |
| Lenovo ThinkPad P14s Gen 6 21RV0017GE | |
| Average of class Workstation (91 - 222, n=24, last 2 years) | |
| HP ZBook Ultra G1a 14 | |
| 7-Zip 18.03 / 7z b 4 | |
| HP ZBook Ultra G1a 14 | |
| Average of class Workstation (60489 - 116969, n=24, last 2 years) | |
| Lenovo ThinkPad P14s Gen 6 21RV0017GE | |
| Dell Precision 5000 5490 | |
| HP ZBook 8 G1i 14 | |
| Average Intel Core Ultra 7 255H (42155 - 70397, n=20) | |
| HP ZBook Firefly 14 G11 | |
| 7-Zip 18.03 / 7z b 4 -mmt1 | |
| Average of class Workstation (5126 - 6960, n=24, last 2 years) | |
| Lenovo ThinkPad P14s Gen 6 21RV0017GE | |
| Average Intel Core Ultra 7 255H (4589 - 6385, n=20) | |
| HP ZBook 8 G1i 14 | |
| HP ZBook Ultra G1a 14 | |
| Dell Precision 5000 5490 | |
| HP ZBook Firefly 14 G11 | |
| Geekbench 6.7 / Multi-Core | |
| HP ZBook Ultra G1a 14 | |
| Average of class Workstation (12721 - 20887, n=24, last 2 years) | |
| HP ZBook 8 G1i 14 | |
| Average Intel Core Ultra 7 255H (11979 - 17489, n=20) | |
| Lenovo ThinkPad P14s Gen 6 21RV0017GE | |
| Dell Precision 5000 5490 | |
| HP ZBook Firefly 14 G11 | |
| Geekbench 6.7 / Single-Core | |
| HP ZBook 8 G1i 14 | |
| Lenovo ThinkPad P14s Gen 6 21RV0017GE | |
| Average Intel Core Ultra 7 255H (2712 - 2939, n=20) | |
| Average of class Workstation (2389 - 3065, n=24, last 2 years) | |
| HP ZBook Ultra G1a 14 | |
| HP ZBook Firefly 14 G11 | |
| Dell Precision 5000 5490 | |
| Geekbench 5.5 / Multi-Core | |
| HP ZBook Ultra G1a 14 | |
| Average of class Workstation (11542 - 25554, n=24, last 2 years) | |
| HP ZBook 8 G1i 14 | |
| Average Intel Core Ultra 7 255H (11348 - 17218, n=19) | |
| Lenovo ThinkPad P14s Gen 6 21RV0017GE | |
| Dell Precision 5000 5490 | |
| HP ZBook Firefly 14 G11 | |
| Geekbench 5.5 / Single-Core | |
| Lenovo ThinkPad P14s Gen 6 21RV0017GE | |
| HP ZBook 8 G1i 14 | |
| HP ZBook Ultra G1a 14 | |
| Average Intel Core Ultra 7 255H (1938 - 2121, n=19) | |
| Average of class Workstation (1783 - 2183, n=24, last 2 years) | |
| HP ZBook Firefly 14 G11 | |
| Dell Precision 5000 5490 | |
| HWBOT x265 Benchmark v2.2 / 4k Preset | |
| HP ZBook Ultra G1a 14 | |
| Average of class Workstation (17.8 - 40.5, n=24, last 2 years) | |
| Lenovo ThinkPad P14s Gen 6 21RV0017GE | |
| HP ZBook 8 G1i 14 | |
| Average Intel Core Ultra 7 255H (13.7 - 26.5, n=19) | |
| Dell Precision 5000 5490 | |
| HP ZBook Firefly 14 G11 | |
| LibreOffice / 20 Documents To PDF | |
| HP ZBook Ultra G1a 14 | |
| Lenovo ThinkPad P14s Gen 6 21RV0017GE | |
| HP ZBook Firefly 14 G11 | |
| Average Intel Core Ultra 7 255H (41.1 - 61.6, n=19) | |
| Average of class Workstation (37.1 - 74.7, n=24, last 2 years) | |
| HP ZBook 8 G1i 14 | |
| Dell Precision 5000 5490 | |
| R Benchmark 2.5 / Overall mean | |
| Dell Precision 5000 5490 | |
| HP ZBook Firefly 14 G11 | |
| Average Intel Core Ultra 7 255H (0.4233 - 0.515, n=19) | |
| HP ZBook 8 G1i 14 | |
| Average of class Workstation (0.3825 - 0.603, n=24, last 2 years) | |
| Lenovo ThinkPad P14s Gen 6 21RV0017GE | |
| HP ZBook Ultra G1a 14 | |
* ... smaller is better
AIDA64: FP32 Ray-Trace | FPU Julia | CPU SHA3 | CPU Queen | FPU SinJulia | FPU Mandel | CPU AES | CPU ZLib | FP64 Ray-Trace | CPU PhotoWorxx
| Performance rating | |
| HP ZBook Ultra G1a 14 | |
| Average of class Workstation | |
| Lenovo ThinkPad P14s Gen 6 21RV0017GE | |
| HP ZBook 8 G1i 14 | |
| Average Intel Core Ultra 7 255H | |
| Dell Precision 5000 5490 | |
| HP ZBook Firefly 14 G11 | |
| AIDA64 / FP32 Ray-Trace | |
| HP ZBook Ultra G1a 14 | |
| Lenovo ThinkPad P14s Gen 6 21RV0017GE | |
| Average of class Workstation (15143 - 61611, n=24, last 2 years) | |
| HP ZBook 8 G1i 14 | |
| Average Intel Core Ultra 7 255H (13863 - 24741, n=17) | |
| Dell Precision 5000 5490 | |
| HP ZBook Firefly 14 G11 | |
| AIDA64 / FPU Julia | |
| HP ZBook Ultra G1a 14 | |
| Average of class Workstation (81575 - 186971, n=24, last 2 years) | |
| Lenovo ThinkPad P14s Gen 6 21RV0017GE | |
| HP ZBook 8 G1i 14 | |
| Average Intel Core Ultra 7 255H (71030 - 119222, n=17) | |
| Dell Precision 5000 5490 | |
| HP ZBook Firefly 14 G11 | |
| AIDA64 / CPU SHA3 | |
| HP ZBook Ultra G1a 14 | |
| Average of class Workstation (3833 - 8975, n=24, last 2 years) | |
| Lenovo ThinkPad P14s Gen 6 21RV0017GE | |
| HP ZBook 8 G1i 14 | |
| Average Intel Core Ultra 7 255H (3408 - 5548, n=17) | |
| Dell Precision 5000 5490 | |
| HP ZBook Firefly 14 G11 | |
| AIDA64 / CPU Queen | |
| HP ZBook Ultra G1a 14 | |
| Average of class Workstation (60778 - 144411, n=24, last 2 years) | |
| Dell Precision 5000 5490 | |
| Lenovo ThinkPad P14s Gen 6 21RV0017GE | |
| HP ZBook Firefly 14 G11 | |
| HP ZBook 8 G1i 14 | |
| Average Intel Core Ultra 7 255H (59098 - 68460, n=16) | |
| AIDA64 / FPU SinJulia | |
| HP ZBook Ultra G1a 14 | |
| Lenovo ThinkPad P14s Gen 6 21RV0017GE | |
| Average of class Workstation (8165 - 29343, n=24, last 2 years) | |
| Dell Precision 5000 5490 | |
| HP ZBook 8 G1i 14 | |
| HP ZBook Firefly 14 G11 | |
| Average Intel Core Ultra 7 255H (6716 - 9006, n=17) | |
| AIDA64 / FPU Mandel | |
| HP ZBook Ultra G1a 14 | |
| Average of class Workstation (40055 - 98153, n=24, last 2 years) | |
| Lenovo ThinkPad P14s Gen 6 21RV0017GE | |
| HP ZBook 8 G1i 14 | |
| Average Intel Core Ultra 7 255H (37031 - 63347, n=17) | |
| Dell Precision 5000 5490 | |
| HP ZBook Firefly 14 G11 | |
| AIDA64 / CPU AES | |
| HP ZBook Ultra G1a 14 | |
| Average of class Workstation (73133 - 187841, n=24, last 2 years) | |
| Lenovo ThinkPad P14s Gen 6 21RV0017GE | |
| Dell Precision 5000 5490 | |
| HP ZBook 8 G1i 14 | |
| Average Intel Core Ultra 7 255H (58402 - 83568, n=17) | |
| HP ZBook Firefly 14 G11 | |
| AIDA64 / CPU ZLib | |
| HP ZBook Ultra G1a 14 | |
| Average of class Workstation (929 - 2148, n=24, last 2 years) | |
| Lenovo ThinkPad P14s Gen 6 21RV0017GE | |
| HP ZBook 8 G1i 14 | |
| Average Intel Core Ultra 7 255H (822 - 1316, n=17) | |
| Dell Precision 5000 5490 | |
| HP ZBook Firefly 14 G11 | |
| AIDA64 / FP64 Ray-Trace | |
| HP ZBook Ultra G1a 14 | |
| Lenovo ThinkPad P14s Gen 6 21RV0017GE | |
| Average of class Workstation (7813 - 32891, n=24, last 2 years) | |
| HP ZBook 8 G1i 14 | |
| Average Intel Core Ultra 7 255H (7384 - 13231, n=17) | |
| Dell Precision 5000 5490 | |
| HP ZBook Firefly 14 G11 | |
| AIDA64 / CPU PhotoWorxx | |
| HP ZBook Ultra G1a 14 | |
| Average Intel Core Ultra 7 255H (23836 - 65787, n=17) | |
| HP ZBook 8 G1i 14 | |
| Dell Precision 5000 5490 | |
| Average of class Workstation (37151 - 93684, n=24, last 2 years) | |
| Lenovo ThinkPad P14s Gen 6 21RV0017GE | |
| HP ZBook Firefly 14 G11 | |
系统性能
惠普 ZBook 8 G1i 14 在系统性能基准测试中取得了最佳成绩,在日常使用中也表现出色。
PCMark 10: Score | Essentials | Productivity | Digital Content Creation
CrossMark: Overall | Productivity | Creativity | Responsiveness
WebXPRT 3: Overall
WebXPRT 4: Overall
Mozilla Kraken 1.1: Total
| Performance rating | |
| Average of class Workstation | |
| HP ZBook 8 G1i 14 | |
| Average Intel Core Ultra 7 255H, Intel Arc Graphics 140T | |
| HP ZBook Ultra G1a 14 | |
| Lenovo ThinkPad P14s Gen 6 21RV0017GE | |
| Dell Precision 5000 5490 | |
| HP ZBook Firefly 14 G11 | |
| PCMark 10 / Score | |
| Average of class Workstation (6563 - 10409, n=20, last 2 years) | |
| HP ZBook Ultra G1a 14 | |
| HP ZBook 8 G1i 14 | |
| Average Intel Core Ultra 7 255H, Intel Arc Graphics 140T (6878 - 9156, n=13) | |
| Lenovo ThinkPad P14s Gen 6 21RV0017GE | |
| Dell Precision 5000 5490 | |
| HP ZBook Firefly 14 G11 | |
| PCMark 10 / Essentials | |
| Dell Precision 5000 5490 | |
| HP ZBook 8 G1i 14 | |
| Lenovo ThinkPad P14s Gen 6 21RV0017GE | |
| Average Intel Core Ultra 7 255H, Intel Arc Graphics 140T (10637 - 11556, n=13) | |
| HP ZBook Ultra G1a 14 | |
| Average of class Workstation (9622 - 11157, n=20, last 2 years) | |
| HP ZBook Firefly 14 G11 | |
| PCMark 10 / Productivity | |
| Average of class Workstation (8789 - 20616, n=20, last 2 years) | |
| Average Intel Core Ultra 7 255H, Intel Arc Graphics 140T (7598 - 15694, n=13) | |
| Lenovo ThinkPad P14s Gen 6 21RV0017GE | |
| HP ZBook 8 G1i 14 | |
| HP ZBook Firefly 14 G11 | |
| Dell Precision 5000 5490 | |
| HP ZBook Ultra G1a 14 | |
| PCMark 10 / Digital Content Creation | |
| HP ZBook Ultra G1a 14 | |
| HP ZBook 8 G1i 14 | |
| Average of class Workstation (8108 - 15631, n=20, last 2 years) | |
| Average Intel Core Ultra 7 255H, Intel Arc Graphics 140T (10461 - 12552, n=13) | |
| Dell Precision 5000 5490 | |
| Lenovo ThinkPad P14s Gen 6 21RV0017GE | |
| HP ZBook Firefly 14 G11 | |
| CrossMark / Overall | |
| Average of class Workstation (1307 - 2267, n=23, last 2 years) | |
| HP ZBook Ultra G1a 14 | |
| Average Intel Core Ultra 7 255H, Intel Arc Graphics 140T (1610 - 2018, n=13) | |
| HP ZBook 8 G1i 14 | |
| Lenovo ThinkPad P14s Gen 6 21RV0017GE | |
| Dell Precision 5000 5490 | |
| HP ZBook Firefly 14 G11 | |
| CrossMark / Productivity | |
| Average Intel Core Ultra 7 255H, Intel Arc Graphics 140T (1566 - 1908, n=13) | |
| Average of class Workstation (1130 - 2122, n=23, last 2 years) | |
| HP ZBook 8 G1i 14 | |
| Lenovo ThinkPad P14s Gen 6 21RV0017GE | |
| Dell Precision 5000 5490 | |
| HP ZBook Ultra G1a 14 | |
| HP ZBook Firefly 14 G11 | |
| CrossMark / Creativity | |
| HP ZBook Ultra G1a 14 | |
| Average of class Workstation (1657 - 2725, n=23, last 2 years) | |
| HP ZBook 8 G1i 14 | |
| Lenovo ThinkPad P14s Gen 6 21RV0017GE | |
| Average Intel Core Ultra 7 255H, Intel Arc Graphics 140T (1827 - 2396, n=13) | |
| Dell Precision 5000 5490 | |
| HP ZBook Firefly 14 G11 | |
| CrossMark / Responsiveness | |
| Average of class Workstation (993 - 2096, n=23, last 2 years) | |
| Average Intel Core Ultra 7 255H, Intel Arc Graphics 140T (1194 - 1781, n=13) | |
| Lenovo ThinkPad P14s Gen 6 21RV0017GE | |
| HP ZBook Ultra G1a 14 | |
| Dell Precision 5000 5490 | |
| HP ZBook 8 G1i 14 | |
| HP ZBook Firefly 14 G11 | |
| WebXPRT 3 / Overall | |
| Lenovo ThinkPad P14s Gen 6 21RV0017GE | |
| HP ZBook 8 G1i 14 | |
| Average of class Workstation (260 - 360, n=24, last 2 years) | |
| Average Intel Core Ultra 7 255H, Intel Arc Graphics 140T (273 - 327, n=13) | |
| HP ZBook Firefly 14 G11 | |
| Dell Precision 5000 5490 | |
| HP ZBook Ultra G1a 14 | |
| WebXPRT 4 / Overall | |
| HP ZBook 8 G1i 14 | |
| Average Intel Core Ultra 7 255H, Intel Arc Graphics 140T (247 - 317, n=13) | |
| Average of class Workstation (189.2 - 326, n=24, last 2 years) | |
| Lenovo ThinkPad P14s Gen 6 21RV0017GE | |
| Dell Precision 5000 5490 | |
| HP ZBook Firefly 14 G11 | |
| HP ZBook Ultra G1a 14 | |
| Mozilla Kraken 1.1 / Total | |
| Dell Precision 5000 5490 | |
| HP ZBook Firefly 14 G11 | |
| Average of class Workstation (411 - 538, n=24, last 2 years) | |
| Average Intel Core Ultra 7 255H, Intel Arc Graphics 140T (427 - 510, n=13) | |
| Lenovo ThinkPad P14s Gen 6 21RV0017GE | |
| HP ZBook 8 G1i 14 | |
| HP ZBook Ultra G1a 14 | |
* ... smaller is better
| PCMark 10 Score | 7865 points | |
Help | ||
| AIDA64 / Memory Copy | |
| HP ZBook Ultra G1a 14 | |
| Dell Precision 5000 5490 | |
| Average Intel Core Ultra 7 255H (39188 - 110930, n=17) | |
| HP ZBook 8 G1i 14 | |
| Average of class Workstation (56003 - 164795, n=24, last 2 years) | |
| HP ZBook Firefly 14 G11 | |
| Lenovo ThinkPad P14s Gen 6 21RV0017GE | |
| AIDA64 / Memory Read | |
| HP ZBook Ultra G1a 14 | |
| HP ZBook 8 G1i 14 | |
| Dell Precision 5000 5490 | |
| Lenovo ThinkPad P14s Gen 6 21RV0017GE | |
| Average Intel Core Ultra 7 255H (43703 - 90552, n=17) | |
| Average of class Workstation (55795 - 121563, n=24, last 2 years) | |
| HP ZBook Firefly 14 G11 | |
| AIDA64 / Memory Write | |
| HP ZBook Ultra G1a 14 | |
| Dell Precision 5000 5490 | |
| Average of class Workstation (55663 - 214520, n=24, last 2 years) | |
| Lenovo ThinkPad P14s Gen 6 21RV0017GE | |
| Average Intel Core Ultra 7 255H (36438 - 87199, n=17) | |
| HP ZBook 8 G1i 14 | |
| HP ZBook Firefly 14 G11 | |
| AIDA64 / Memory Latency | |
| HP ZBook Ultra G1a 14 | |
| Dell Precision 5000 5490 | |
| Average of class Workstation (84.5 - 165.2, n=24, last 2 years) | |
| Average Intel Core Ultra 7 255H (107.6 - 147.2, n=17) | |
| HP ZBook Firefly 14 G11 | |
| HP ZBook 8 G1i 14 | |
| Lenovo ThinkPad P14s Gen 6 21RV0017GE | |
* ... smaller is better
DPC 延迟
在我们的测试中,惠普笔记本电脑没有出现与 DPC 延迟相关的问题。
| DPC Latencies / LatencyMon - interrupt to process latency (max), Web, Youtube, Prime95 | |
| HP ZBook Firefly 14 G11 | |
| Dell Precision 5000 5490 | |
| HP ZBook 8 G1i 14 | |
| Lenovo ThinkPad P14s Gen 6 21RV0017GE | |
* ... smaller is better
存储设备
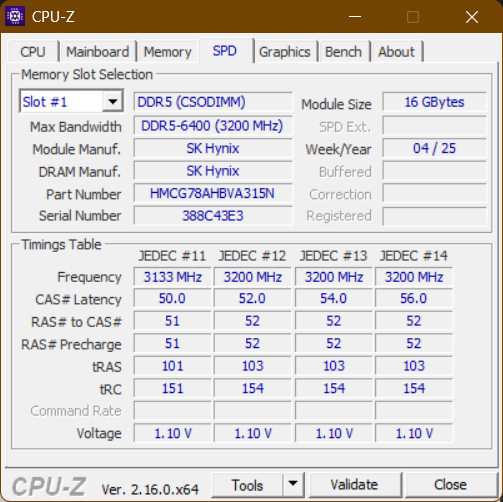
惠普使用了快速的 SK Hynix M.2 2280 固态硬盘,通过 NVMe PCIe 4.0 与系统相连。虽然这款固态硬盘确实不错,但它在负载情况下确实会受到热节流的影响。在持续负载情况下,其速度会降低一半左右。

* ... smaller is better
磁盘节流DiskSpd 读取循环,队列深度 8
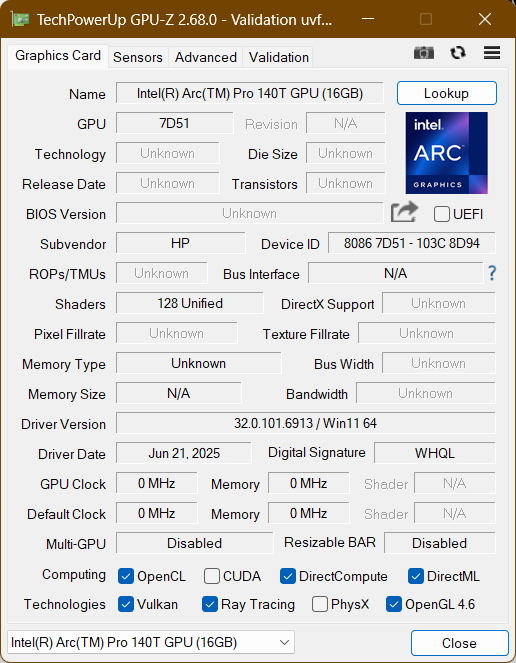
图形处理器性能
ZBook 8 G1i 14 的图形处理器是比较有趣的方面之一。通常,工作站使用专用 GPU,但惠普使用集成的英特尔解决方案。几年来,一些基于 AMD 的工作站也采用了这种方法,但效果不一。在这种情况下,它显然不是一个非常强大的解决方案,因为 英特尔 ARC 140T甚至无法与 Strix Point 的集成 AMD iGPU 相抗衡。它当然可以用于非常基本的渲染,但不能用于大型项目。在 SPECviewperf 基准测试中,它排名最后。
| 3DMark 11 Performance | 13217 points | |
| 3DMark Fire Strike Score | 7981 points | |
| 3DMark Time Spy Score | 4294 points | |
Help | ||
* ... smaller is better
| Performance rating - Percent | |
| Average of class Workstation | |
| HP ZBook Ultra G1a 14 | |
| Dell Precision 5000 5490 -1! | |
| HP ZBook Firefly 14 G11 -1! | |
| Lenovo ThinkPad P14s Gen 6 21RV0017GE | |
| HP ZBook 8 G1i 14 | |
| Cyberpunk 2077 - 1920x1080 Ultra Preset (FSR off) | |
| HP ZBook Ultra G1a 14 | |
| Average of class Workstation (21.5 - 152.4, n=24, last 2 years) | |
| Dell Precision 5000 5490 | |
| Lenovo ThinkPad P14s Gen 6 21RV0017GE | |
| HP ZBook 8 G1i 14 | |
| HP ZBook Firefly 14 G11 | |
| Baldur's Gate 3 - 1920x1080 Ultra Preset AA:T | |
| HP ZBook Ultra G1a 14 | |
| Average of class Workstation (23.7 - 205, n=25, last 2 years) | |
| Dell Precision 5000 5490 | |
| HP ZBook Firefly 14 G11 | |
| HP ZBook 8 G1i 14 | |
| Lenovo ThinkPad P14s Gen 6 21RV0017GE | |
| GTA V - 1920x1080 Highest AA:4xMSAA + FX AF:16x | |
| Average of class Workstation (18.1 - 156.1, n=24, last 2 years) | |
| HP ZBook Ultra G1a 14 | |
| Lenovo ThinkPad P14s Gen 6 21RV0017GE | |
| HP ZBook 8 G1i 14 | |
| Final Fantasy XV Benchmark - 1920x1080 High Quality | |
| Average of class Workstation (26.4 - 197.6, n=24, last 2 years) | |
| HP ZBook Ultra G1a 14 | |
| Dell Precision 5000 5490 | |
| HP ZBook 8 G1i 14 | |
| HP ZBook Firefly 14 G11 | |
| Lenovo ThinkPad P14s Gen 6 21RV0017GE | |
| Dota 2 Reborn - 1920x1080 ultra (3/3) best looking | |
| HP ZBook Ultra G1a 14 | |
| Average of class Workstation (50.7 - 178.4, n=24, last 2 years) | |
| Dell Precision 5000 5490 | |
| HP ZBook Firefly 14 G11 | |
| HP ZBook 8 G1i 14 | |
| Lenovo ThinkPad P14s Gen 6 21RV0017GE | |
| X-Plane 11.11 - 1920x1080 high (fps_test=3) | |
| HP ZBook Firefly 14 G11 | |
| Average of class Workstation (30.5 - 139.7, n=24, last 2 years) | |
| Dell Precision 5000 5490 | |
| HP ZBook Ultra G1a 14 | |
| Lenovo ThinkPad P14s Gen 6 21RV0017GE | |
| HP ZBook 8 G1i 14 | |
赛博朋克 2077》超 FPS 图表
| low | med. | high | ultra | QHD | |
|---|---|---|---|---|---|
| GTA V (2015) | 179.2 | 169.1 | 44.4 | 18.1 | 12.3 |
| Dota 2 Reborn (2015) | 105.6 | 91.2 | 69.6 | 83.2 | |
| Final Fantasy XV Benchmark (2018) | 88.7 | 44.9 | 31.7 | 23.4 | |
| X-Plane 11.11 (2018) | 58.8 | 47.3 | 36.1 | ||
| Baldur's Gate 3 (2023) | 41.5 | 32.6 | 28.3 | 27.8 | 19.5 |
| Cyberpunk 2077 (2023) | 38.4 | 30.8 | 27.5 | 24.8 | 15.8 |
| F1 25 (2025) | 70.8 | 59.4 | 46.9 | 9.58 |
排放与功耗:HP ZBook 扬声器强劲有力
系统噪音
总的来说,惠普 ZBook 8 G1i 14 并不是一款噪音很大的系统,因为在日常正常使用过程中,风扇一直处于关闭状态。即使在持续最大负载的情况下,风扇开启时也不会疯狂运转,最大噪音为 44.1 dB(a)。
这款惠普笔记本电脑没有线圈啸叫问题。
Noise level
| Idle |
| 24.9 / 24.9 / 30.3 dB(A) |
| Load |
| 44.1 / 44.1 dB(A) |
 | ||
30 dB silent 40 dB(A) audible 50 dB(A) loud |
||
min: | ||
| HP ZBook 8 G1i 14 Arc 140T, Ultra 7 255H, SK hynix PC801 HFS001TEJ9X101N | HP ZBook Firefly 14 G11 RTX A500 Laptop GPU, Ultra 7 165H, Kioxia XG8 KXG80ZNV512G | Lenovo ThinkPad P14s Gen 6 21RV0017GE Radeon 890M, Ryzen AI 9 HX PRO 370, SK hynix PC801 HFS001TEJ9X162N | HP ZBook Ultra G1a 14 Radeon 8060S, Ryzen AI Max+ PRO 395, WDC PC SN810 2TB | Dell Precision 5000 5490 RTX 3000 Ada Generation Laptop, Ultra 9 185H, Kioxia XG8 KXG80ZNV1T02 | |
|---|---|---|---|---|---|
| Noise | 3% | 4% | -1% | 5% | |
| off / environment * (dB) | 24.9 | 24.3 2% | 24.5 2% | 23.9 4% | 22.8 8% |
| Idle Minimum * (dB) | 24.9 | 24.6 1% | 24.5 2% | 23.9 4% | 23.8 4% |
| Idle Average * (dB) | 24.9 | 25.2 -1% | 24.5 2% | 23.9 4% | 23.8 4% |
| Idle Maximum * (dB) | 30.3 | 26.8 12% | 24.5 19% | 26.8 12% | 24.7 18% |
| Load Average * (dB) | 44.1 | 38.9 12% | 36.5 17% | 42.2 4% | 38.9 12% |
| Cyberpunk 2077 ultra * (dB) | 40.4 | 41.8 -3% | 44.7 -11% | 49.1 -22% | |
| Load Maximum * (dB) | 44.1 | 45.8 -4% | 44.9 -2% | 49.2 -12% | 51.4 -17% |
| Witcher 3 ultra * (dB) | 49.9 |
* ... smaller is better
温度
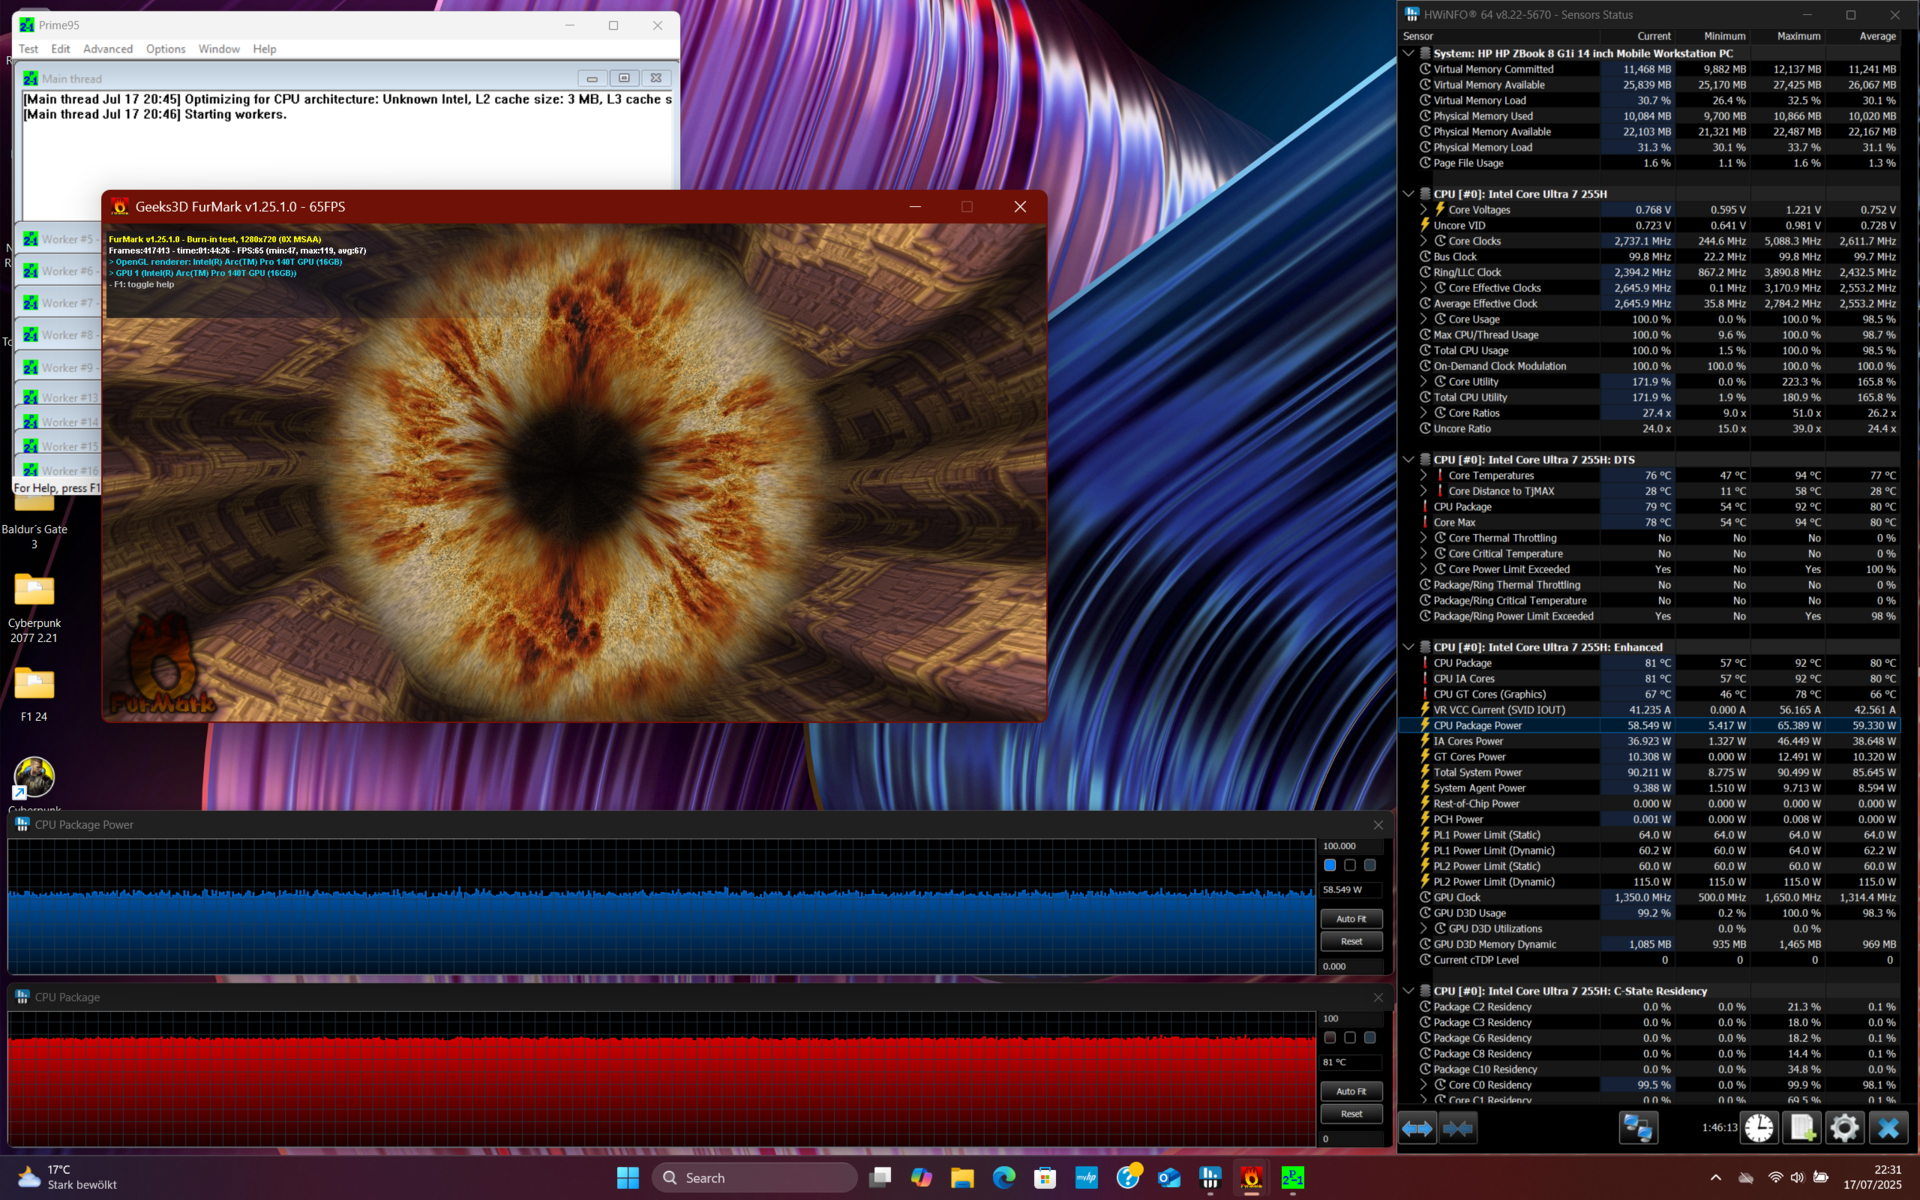
HP ZBook 8 G1i 14 的温度略高于 40.3 摄氏度或 105 华氏度,在负载情况下完全不会发烫。即使在持续负载的情况下,掌托区域也能保持相当低的温度。
在压力测试中没有出现节流现象。
(±) The maximum temperature on the upper side is 40.3 °C / 105 F, compared to the average of 38.2 °C / 101 F, ranging from 22.2 to 69.8 °C for the class Workstation.
(+) The bottom heats up to a maximum of 38.4 °C / 101 F, compared to the average of 41.1 °C / 106 F
(+) In idle usage, the average temperature for the upper side is 27.4 °C / 81 F, compared to the device average of 32 °C / 90 F.
(±) 3: The average temperature for the upper side is 32.3 °C / 90 F, compared to the average of 32 °C / 90 F for the class Workstation.
(+) The palmrests and touchpad are cooler than skin temperature with a maximum of 29.3 °C / 84.7 F and are therefore cool to the touch.
(±) The average temperature of the palmrest area of similar devices was 27.8 °C / 82 F (-1.5 °C / -2.7 F).
| HP ZBook 8 G1i 14 Intel Core Ultra 7 255H, Intel Arc Graphics 140T | HP ZBook Firefly 14 G11 Intel Core Ultra 7 165H, NVIDIA RTX A500 Laptop GPU | Lenovo ThinkPad P14s Gen 6 21RV0017GE AMD Ryzen AI 9 HX PRO 370, AMD Radeon 890M | HP ZBook Ultra G1a 14 AMD Ryzen AI Max+ PRO 395, AMD Radeon 8060S | Dell Precision 5000 5490 Intel Core Ultra 9 185H, NVIDIA RTX 3000 Ada Generation Laptop | |
|---|---|---|---|---|---|
| Heat | -7% | -14% | -6% | -4% | |
| Maximum Upper Side * (°C) | 40.3 | 42.8 -6% | 50.5 -25% | 41.4 -3% | 43.2 -7% |
| Maximum Bottom * (°C) | 38.4 | 44 -15% | 50.2 -31% | 36.6 5% | 38.4 -0% |
| Idle Upper Side * (°C) | 29.4 | 30.6 -4% | 29.1 1% | 34 -16% | 31.6 -7% |
| Idle Bottom * (°C) | 30.3 | 31.4 -4% | 30.1 1% | 33.6 -11% | 30.6 -1% |
* ... smaller is better
发言人
一鸣惊人惠普 ZBook 笔记本电脑的扬声器远高于竞争对手的扬声器 联想 ThinkPad P14s 第 6 代 AMD.无论是音量还是扬声器质量,惠普设备都胜过 ThinkPad 笔记本电脑。
HP ZBook 8 G1i 14 audio analysis
(+) | speakers can play relatively loud (87.8 dB)
Bass 100 - 315 Hz
(-) | nearly no bass - on average 15% lower than median
(±) | linearity of bass is average (11.7% delta to prev. frequency)
Mids 400 - 2000 Hz
(+) | balanced mids - only 2% away from median
(+) | mids are linear (3.4% delta to prev. frequency)
Highs 2 - 16 kHz
(+) | balanced highs - only 4.3% away from median
(+) | highs are linear (5.3% delta to prev. frequency)
Overall 100 - 16.000 Hz
(+) | overall sound is linear (10.6% difference to median)
Compared to same class
» 9% of all tested devices in this class were better, 5% similar, 87% worse
» The best had a delta of 7%, average was 17%, worst was 35%
Compared to all devices tested
» 6% of all tested devices were better, 1% similar, 93% worse
» The best had a delta of 4%, average was 23%, worst was 134%
Lenovo ThinkPad P14s Gen 6 21RV0017GE audio analysis
(±) | speaker loudness is average but good (78 dB)
Bass 100 - 315 Hz
(-) | nearly no bass - on average 16.2% lower than median
(±) | linearity of bass is average (12.4% delta to prev. frequency)
Mids 400 - 2000 Hz
(±) | higher mids - on average 6% higher than median
(+) | mids are linear (3.3% delta to prev. frequency)
Highs 2 - 16 kHz
(+) | balanced highs - only 1.9% away from median
(+) | highs are linear (3.9% delta to prev. frequency)
Overall 100 - 16.000 Hz
(±) | linearity of overall sound is average (17.4% difference to median)
Compared to same class
» 53% of all tested devices in this class were better, 10% similar, 37% worse
» The best had a delta of 7%, average was 17%, worst was 35%
Compared to all devices tested
» 33% of all tested devices were better, 8% similar, 58% worse
» The best had a delta of 4%, average was 23%, worst was 134%
耗电量
与 HP ZBook Firefly G11 相比,空闲时的功耗略低,但在负载情况下功耗略高。 HP ZBook Firefly G11.这是有道理的,因为缺少专用 GPU 和更高效的 Arrow Lake CPU 会提高空闲时的效率,但双风扇散热带来的更高功率限制会增加负载时的功耗。
惠普笔记本电脑没有超出 100 W USB-C 充电器的功率范围。
| Off / Standby | |
| Idle | |
| Load |
|
Key:
min: | |
功耗 赛博朋克/压力测试
外部显示器功耗
电池寿命
尽管使用了高分辨率屏幕和 H 级 CPU,惠普 ZBook 8 G1i 14 的电池续航时间还是不错的。在我们的 Wi-Fi 网上冲浪测试(屏幕亮度为 150 cd/m²)中,12 小时的续航时间值得称赞,尤其是在耗电的工作站类别中。
| HP ZBook 8 G1i 14 Ultra 7 255H, Arc 140T, 77 Wh | HP ZBook Firefly 14 G11 Ultra 7 165H, RTX A500 Laptop GPU, 56 Wh | Lenovo ThinkPad P14s Gen 6 21RV0017GE Ryzen AI 9 HX PRO 370, Radeon 890M, 57 Wh | HP ZBook Ultra G1a 14 Ryzen AI Max+ PRO 395, Radeon 8060S, 74.5 Wh | Dell Precision 5000 5490 Ultra 9 185H, RTX 3000 Ada Generation Laptop, 72 Wh | Average of class Workstation | |
|---|---|---|---|---|---|---|
| Battery runtime | -28% | -11% | -42% | -8% | 1% | |
| WiFi v1.3 (h) | 12 | 8.6 -28% | 9.3 -22% | 7 -42% | 11 -8% | 8.52 ? -29% |
| Load (h) | 1.1 | 1.1 0% | 1.429 ? 30% |
笔记本检查评级
惠普 ZBook 8 G1i 是一款功能强大的工作笔记本电脑。我们的特定配置尤其适合 CPU 较重的任务。该设备没有任何明显的缺点。
HP ZBook 8 G1i 14
- 10/14/2025 v8
Benjamin Herzig
 Total Sustainability Score:
 潜在竞争对手比较
Image | Model / Review | Price | Weight | Height | Display |
|---|---|---|---|---|---|
1. 82% 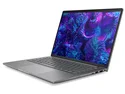 | HP ZBook 8 G1i 14 Intel Core Ultra 7 255H ⎘ Intel Arc Graphics 140T ⎘ 32 GB Memory, 1024 GB SSD | Amazon: List Price: 1860 Euro | 1.7 kg | 23 mm | 14.00" 2560x1600 216 PPI IPS LED |
2. 80.3%  | HP ZBook Firefly 14 G11 Intel Core Ultra 7 165H ⎘ NVIDIA RTX A500 Laptop GPU ⎘ 32 GB Memory, 512 GB SSD | Amazon: List Price: 3500 USD | 1.5 kg | 19.2 mm | 14.00" 2560x1600 216 PPI IPS |
3. 81.6% 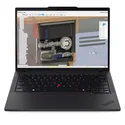 | Lenovo ThinkPad P14s Gen 6 21RV0017GE AMD Ryzen AI 9 HX PRO 370 ⎘ AMD Radeon 890M ⎘ 64 GB Memory, 1024 GB SSD | Amazon: List Price: 2289 Euro | 1.4 kg | 22 mm | 14.00" 1920x1200 162 PPI IPS LED |
4. 87.4% 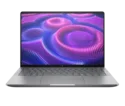 | HP ZBook Ultra G1a 14 AMD Ryzen AI Max+ PRO 395 ⎘ AMD Radeon 8060S ⎘ 128 GB Memory, 2048 GB SSD | Amazon: List Price: 4000 USD | 1.6 kg | 18.5 mm | 14.00" 2880x1800 243 PPI OLED |
5. 89.3% v7 (old) 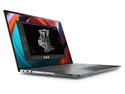 | Dell Precision 5000 5490 Intel Core Ultra 9 185H ⎘ NVIDIA RTX 3000 Ada Generation Laptop ⎘ 64 GB Memory, 1024 GB SSD | Amazon: List Price: 3800 USD | 1.6 kg | 18.95 mm | 14.00" 2560x1600 216 PPI IPS |
Transparency
The selection of devices to be reviewed is made by our editorial team. The test sample was provided to the author as a loan by the manufacturer or retailer for the purpose of this review. The lender had no influence on this review, nor did the manufacturer receive a copy of this review before publication. There was no obligation to publish this review. As an independent media company, Notebookcheck is not subjected to the authority of manufacturers, retailers or publishers.
This is how Notebookcheck is testing
Every year, Notebookcheck independently reviews hundreds of laptops and smartphones using standardized procedures to ensure that all results are comparable. We have continuously developed our test methods for around 20 years and set industry standards in the process. In our test labs, high-quality measuring equipment is utilized by experienced technicians and editors. These tests involve a multi-stage validation process. Our complex rating system is based on hundreds of well-founded measurements and benchmarks, which maintains objectivity. Further information on our test methods can be found here.

