





关于三星 Galaxy Z Flip8 的结论
如果你想拥有一款最出色的翻盖智能手机,今年你势必得选择 Galaxy Z Flip8。这与其说是因为三星这款手机相较于前代产品有所改进——实际上这些差异相当有限——不如说是因为小米或OPPO在高端市场缺乏有竞争力的产品。 虽然摩托罗拉目前也有Razr系列机型,但它们属于不同的级别。在我们的基准测试中,这款三星手机的速度有时甚至超过Razr系列两倍以上;而在粉红噪声测量中,Flip8的表现也优于Razr 70 Plus和Razr 70 Ultra。
这款手机重量仅为180克(约6.4盎司),机身厚度仅6.1毫米(约0.24英寸),相当纤薄,三星将一块6.9英寸的大尺寸OLED显示屏巧妙地融入了这一紧凑机身之中。 即使折叠后,Flip8的厚度也仅比当前带保护壳的旗舰手机略厚一点。全新的铰链设计还确保了在日常使用中,屏幕折痕依然微乎其微,几乎难以察觉。
得益于全新的软件功能,4.1英寸的外屏在手机闭合时显著提升了易用性。借助“MultiStar”扩展模块,用户不再局限于系统应用;例如,他们还可以使用谷歌地图进行导航,或通过Chrome快速查看自己喜爱的网站。
但即便是第八代机型,在日常使用中仍暴露出若干缺陷,三星亟需加以解决。电池容量再次偏小,充电速度仍仅为25瓦——甚至去年的Mix Flip 2在这方面的表现都明显优于它。 由于翻盖设计,音量键和指纹传感器位于机身顶部,当设备打开时,单手操作这些按键非常困难甚至几乎不可能。缺乏防尘能力也对日常使用造成了不便。
对于下一代Flip手机,我们希望看到一款“宽屏版”,类似于三星今年在Fold系列中推出的版本。此外,三星应为其OLED面板配备高频PWM调光功能;我们的测量数据显示,其频率仅为481 Hz。
Pros
Cons
三星 Galaxy Z Flip 8 的价格与上市情况

三星 Galaxy Z Flip8 的规格参数
案例与亮点——防水翻盖智能手机更轻薄
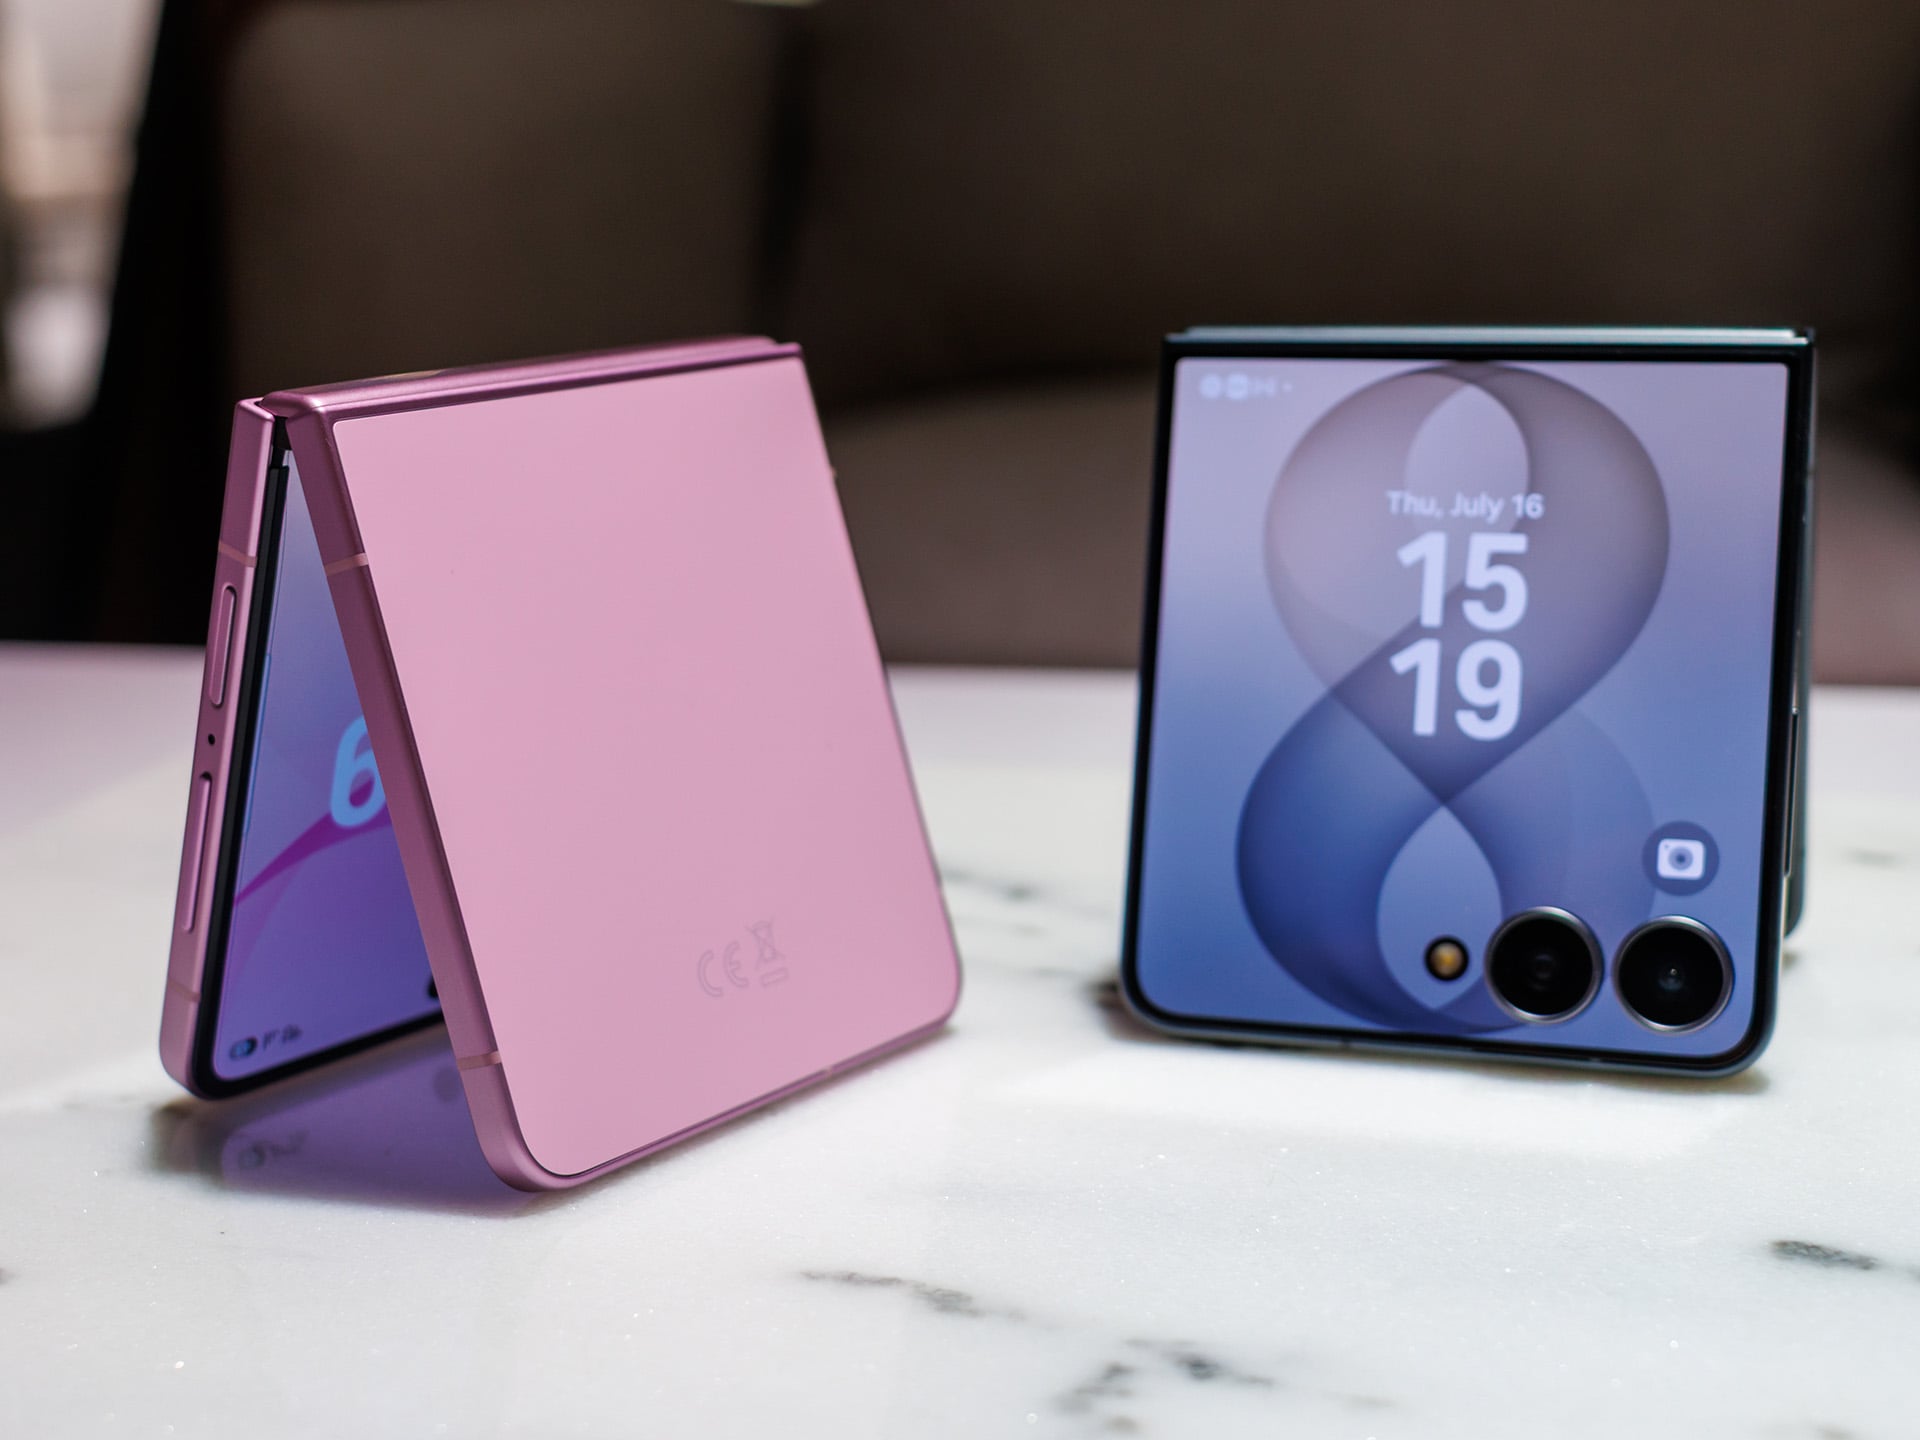
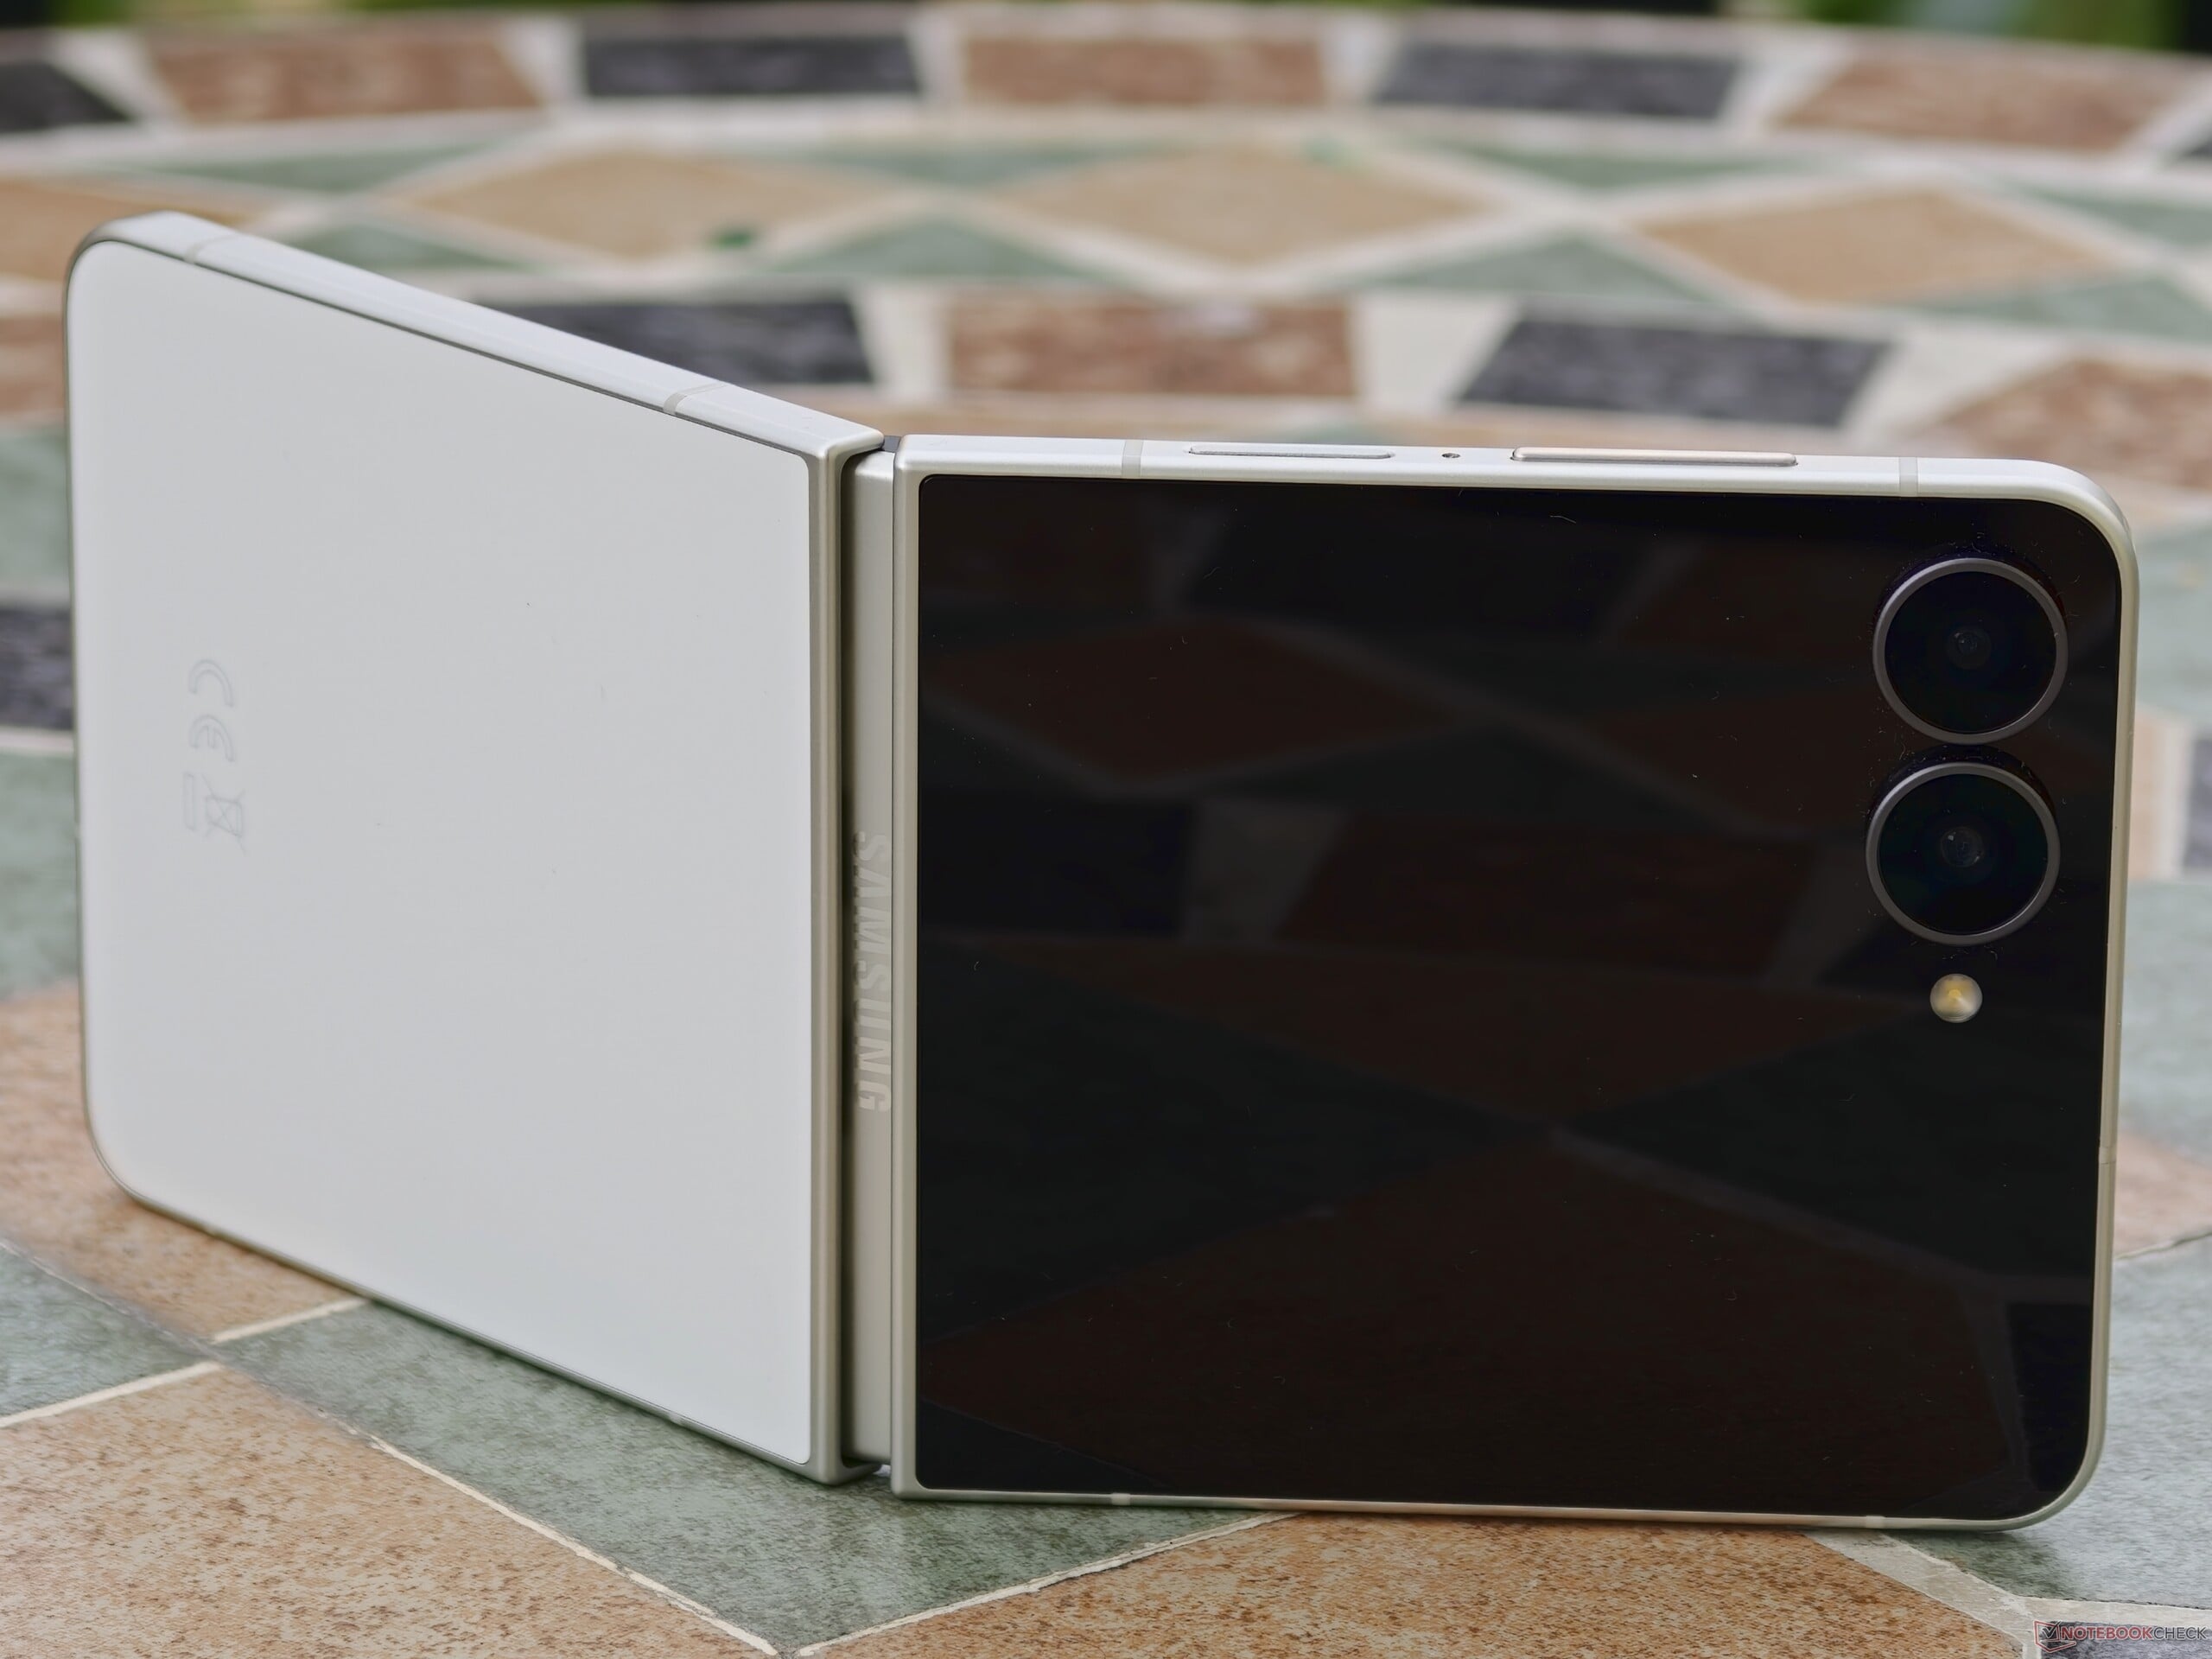
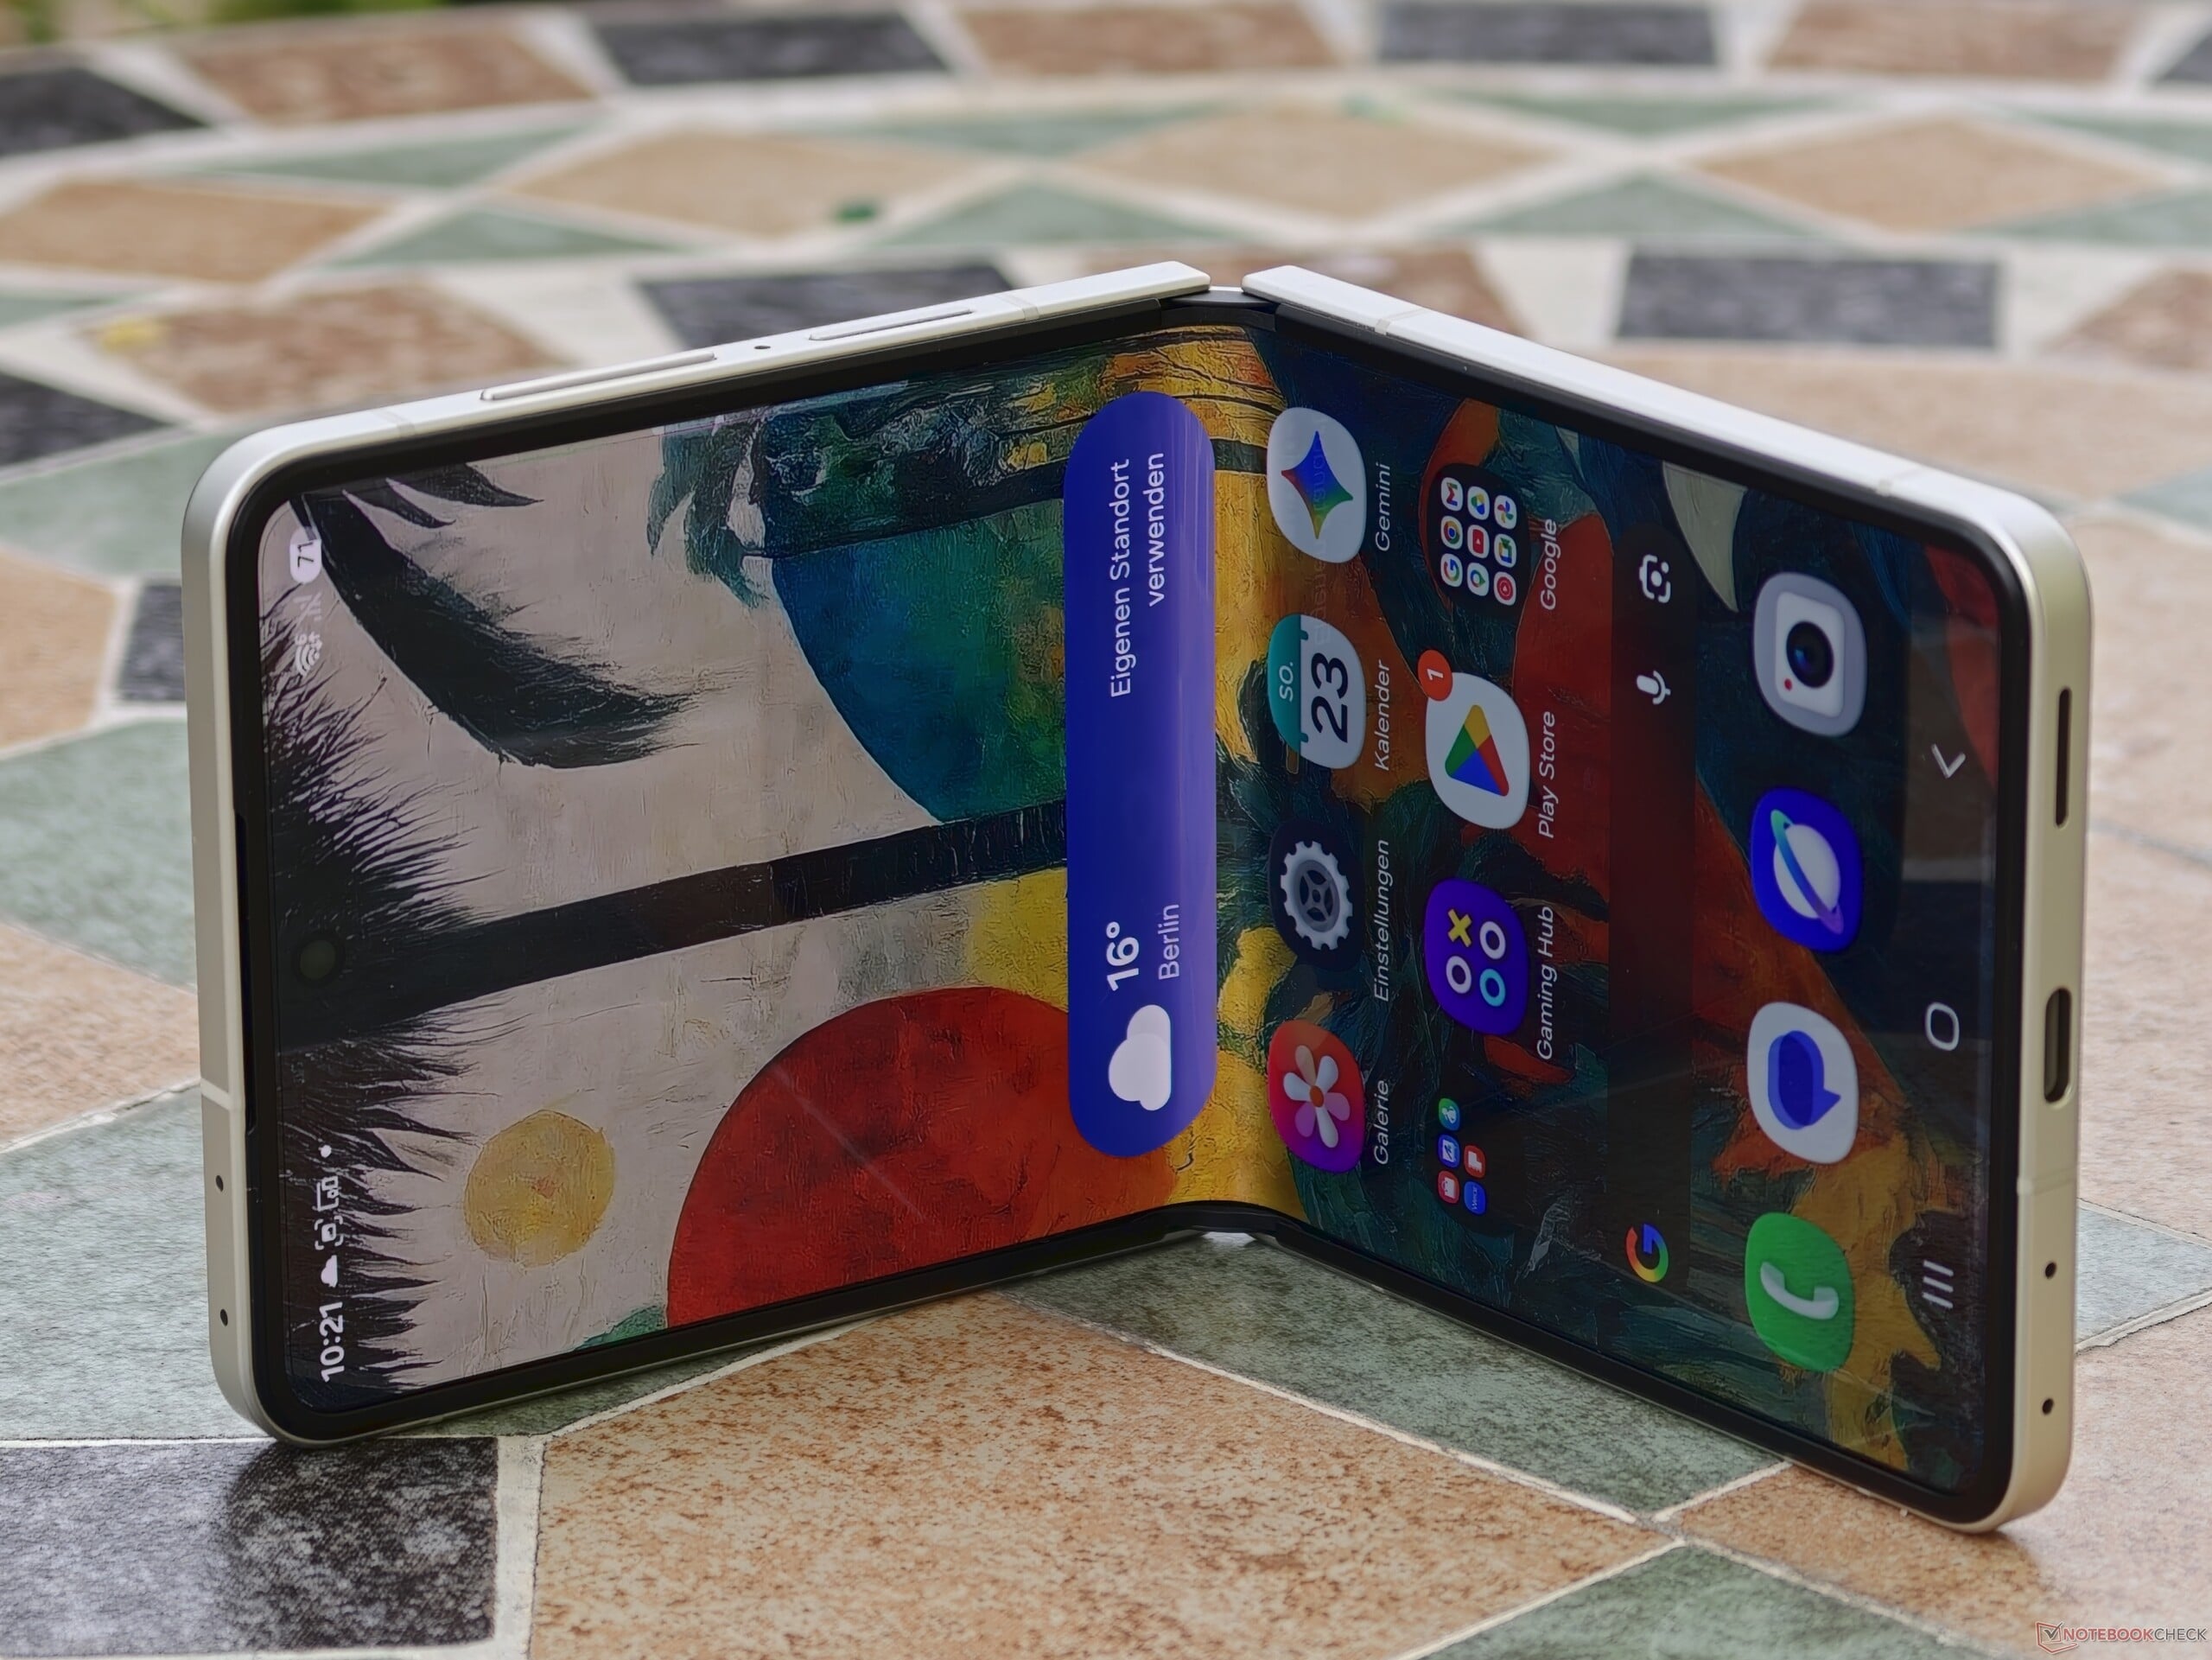
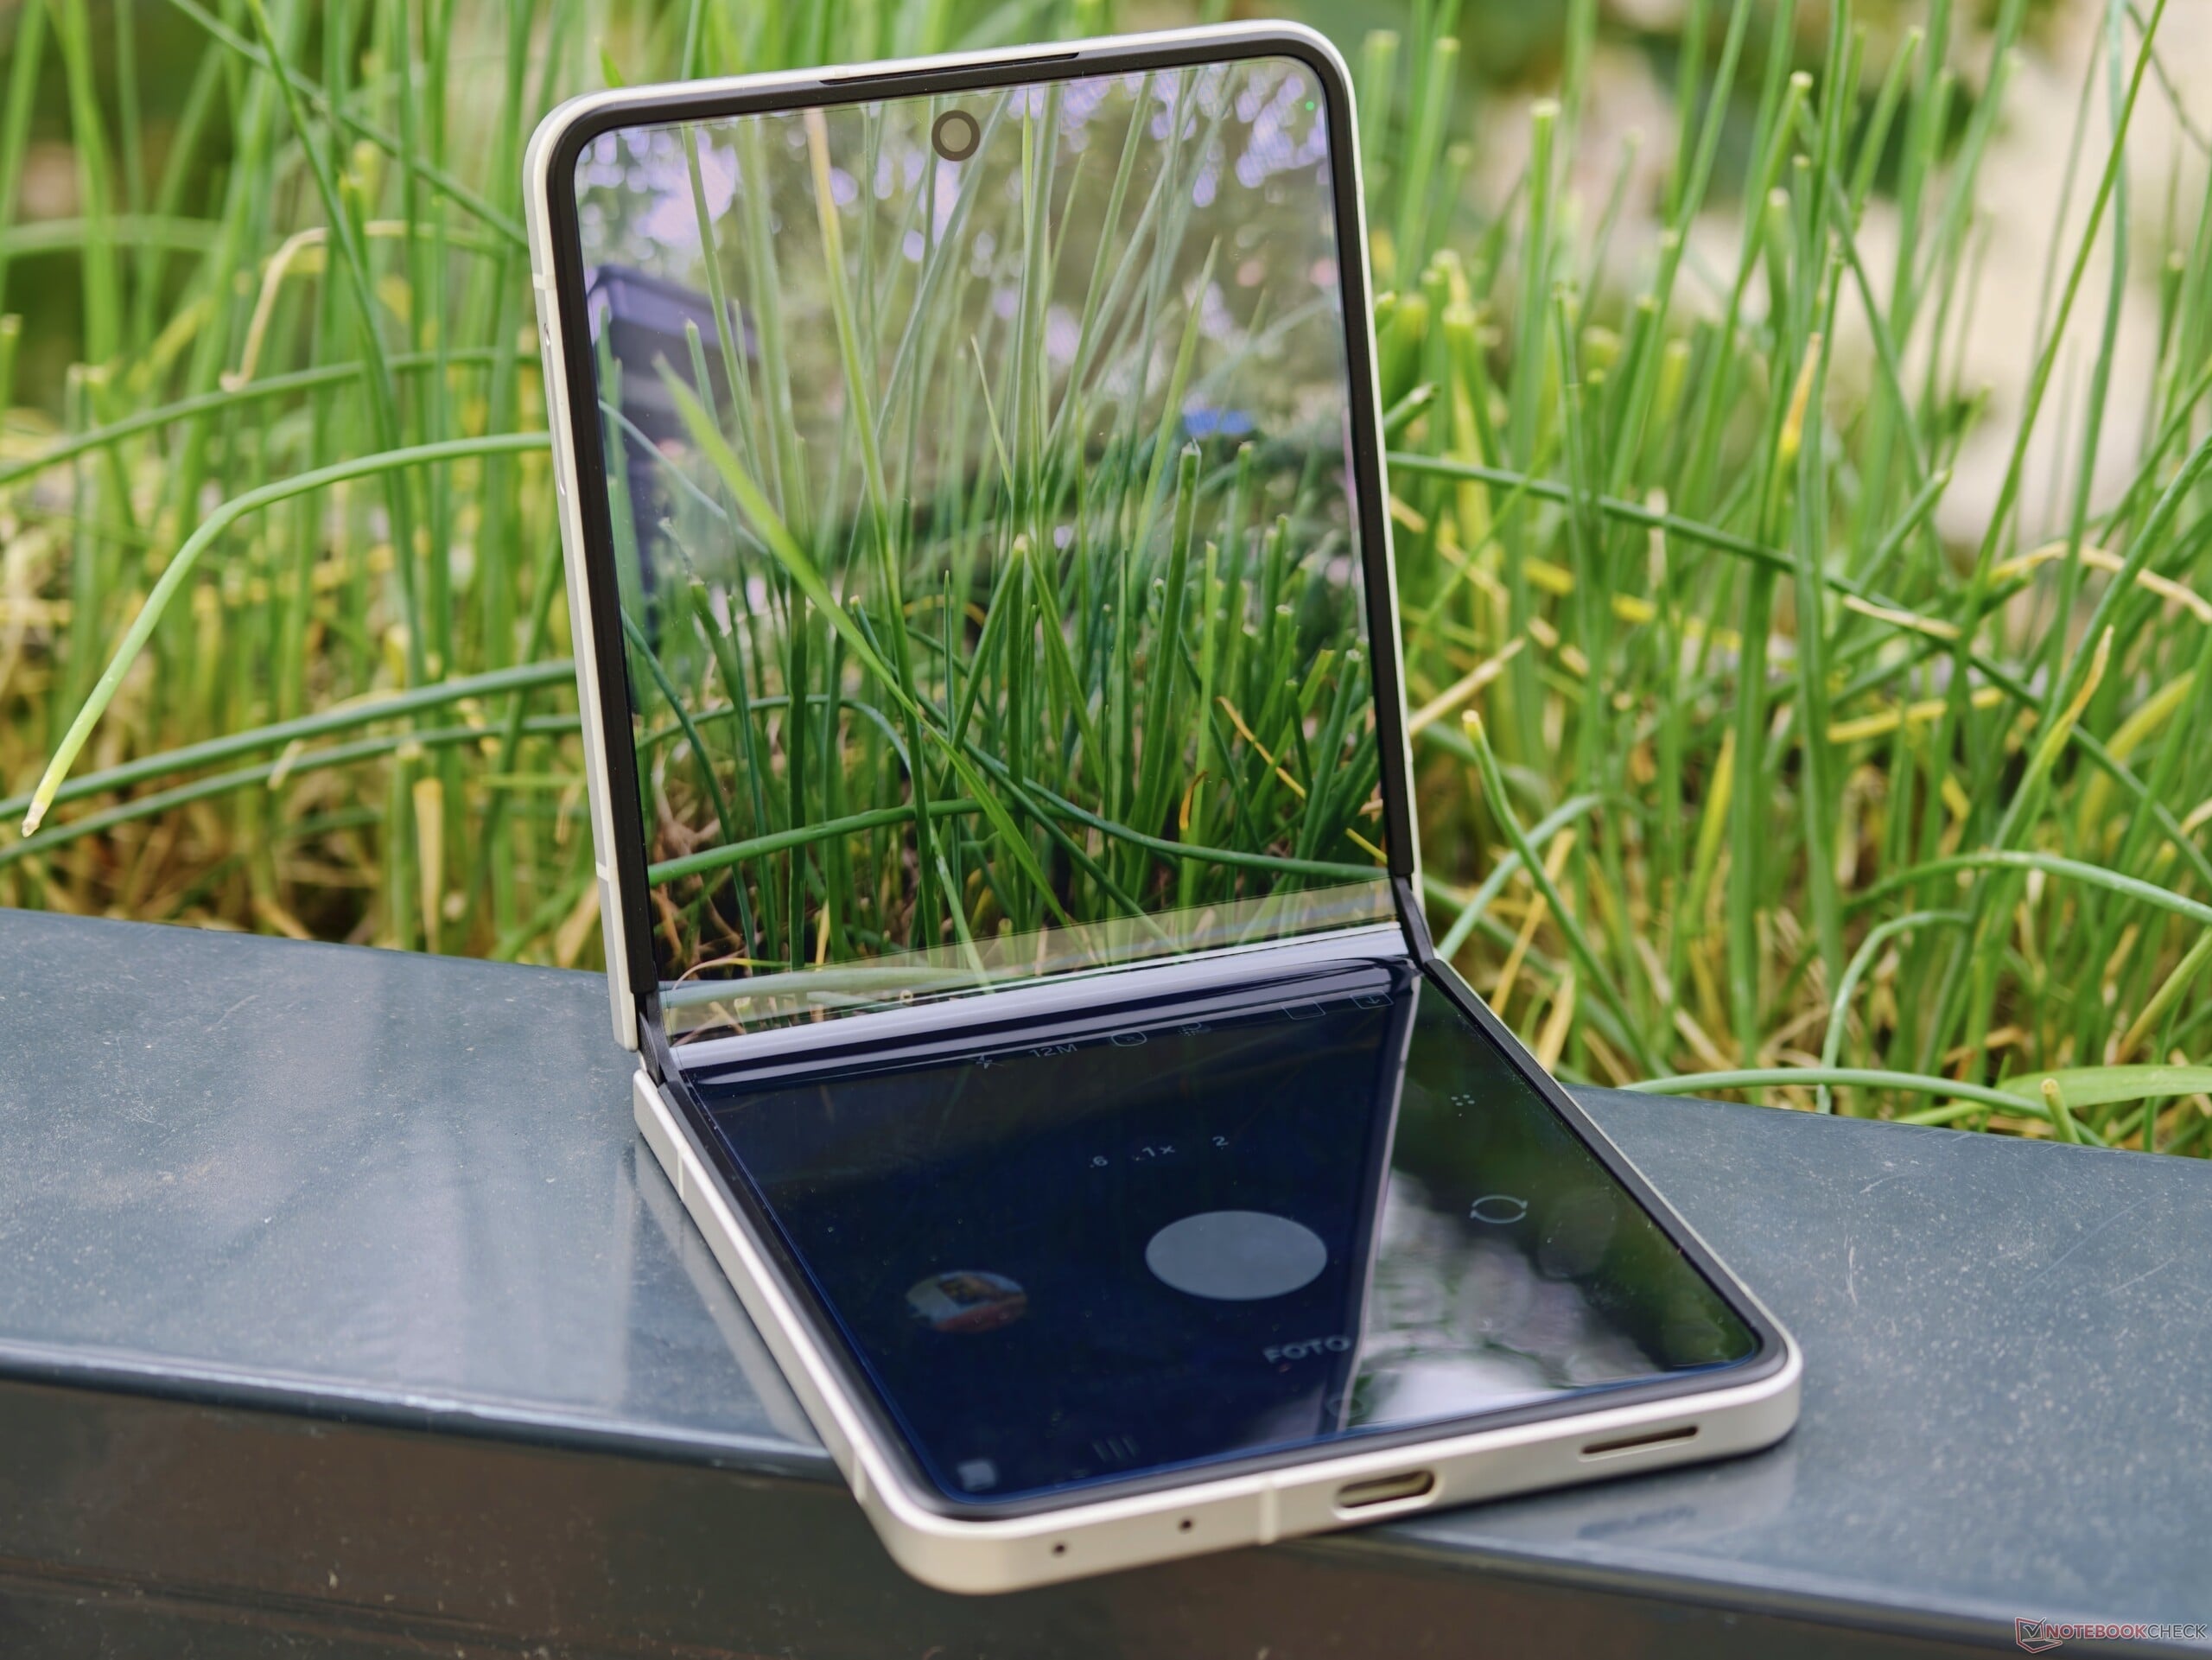
Flip8 不仅重量轻,而且宽度不到 76 毫米(约 3 英寸),相当纤薄紧凑,拿在手里还能感受到其高品质的质感。 新款铰链虽不如 Fold8 Ultra 那般紧实,但这款小巧的翻盖手机仍可在多种角度下使用。
尽管机身略微变薄,但凭借 IP48 认证,这款翻盖手机仍无法完全防尘。OLED 屏幕中央的折痕虽然可见,但在日常使用中几乎难以察觉。

通信与易用性——配备 WiFi 7 和 5G 的紧凑型安卓手机
| Networking | |
| Samsung Galaxy Z Flip8 | |
| iperf3 transmit Wi-Fi6/7 RT-BE96U | |
| iperf3 receive Wi-Fi6/7 RT-BE96U | |
| Motorola Razr 70 Plus | |
| iperf3 transmit Wi-Fi6/7 RT-BE96U | |
| iperf3 receive Wi-Fi6/7 RT-BE96U | |
| Xiaomi Mix Flip 2 | |
| iperf3 transmit AXE11000 6GHz | |
| iperf3 receive AXE11000 6GHz | |
| Samsung Galaxy Z Flip7 | |
| iperf3 transmit AXE11000 | |
| iperf3 receive AXE11000 | |
| Average 802.11 a/b/g/n/ac/ax/be | |
| iperf3 transmit AXE11000 | |
| iperf3 receive AXE11000 | |
| iperf3 transmit AXE11000 6GHz | |
| iperf3 receive AXE11000 6GHz | |
| iperf3 transmit Wi-Fi6/7 RT-BE96U | |
| iperf3 receive Wi-Fi6/7 RT-BE96U | |
| Average of class Smartphone | |
| iperf3 transmit AXE11000 | |
| iperf3 receive AXE11000 | |
| iperf3 transmit AXE11000 6GHz | |
| iperf3 receive AXE11000 6GHz | |
| iperf3 transmit Wi-Fi6/7 RT-BE96U | |
| iperf3 receive Wi-Fi6/7 RT-BE96U | |
相机——配备5000万像素摄像头和光学防抖功能的Galaxy手机
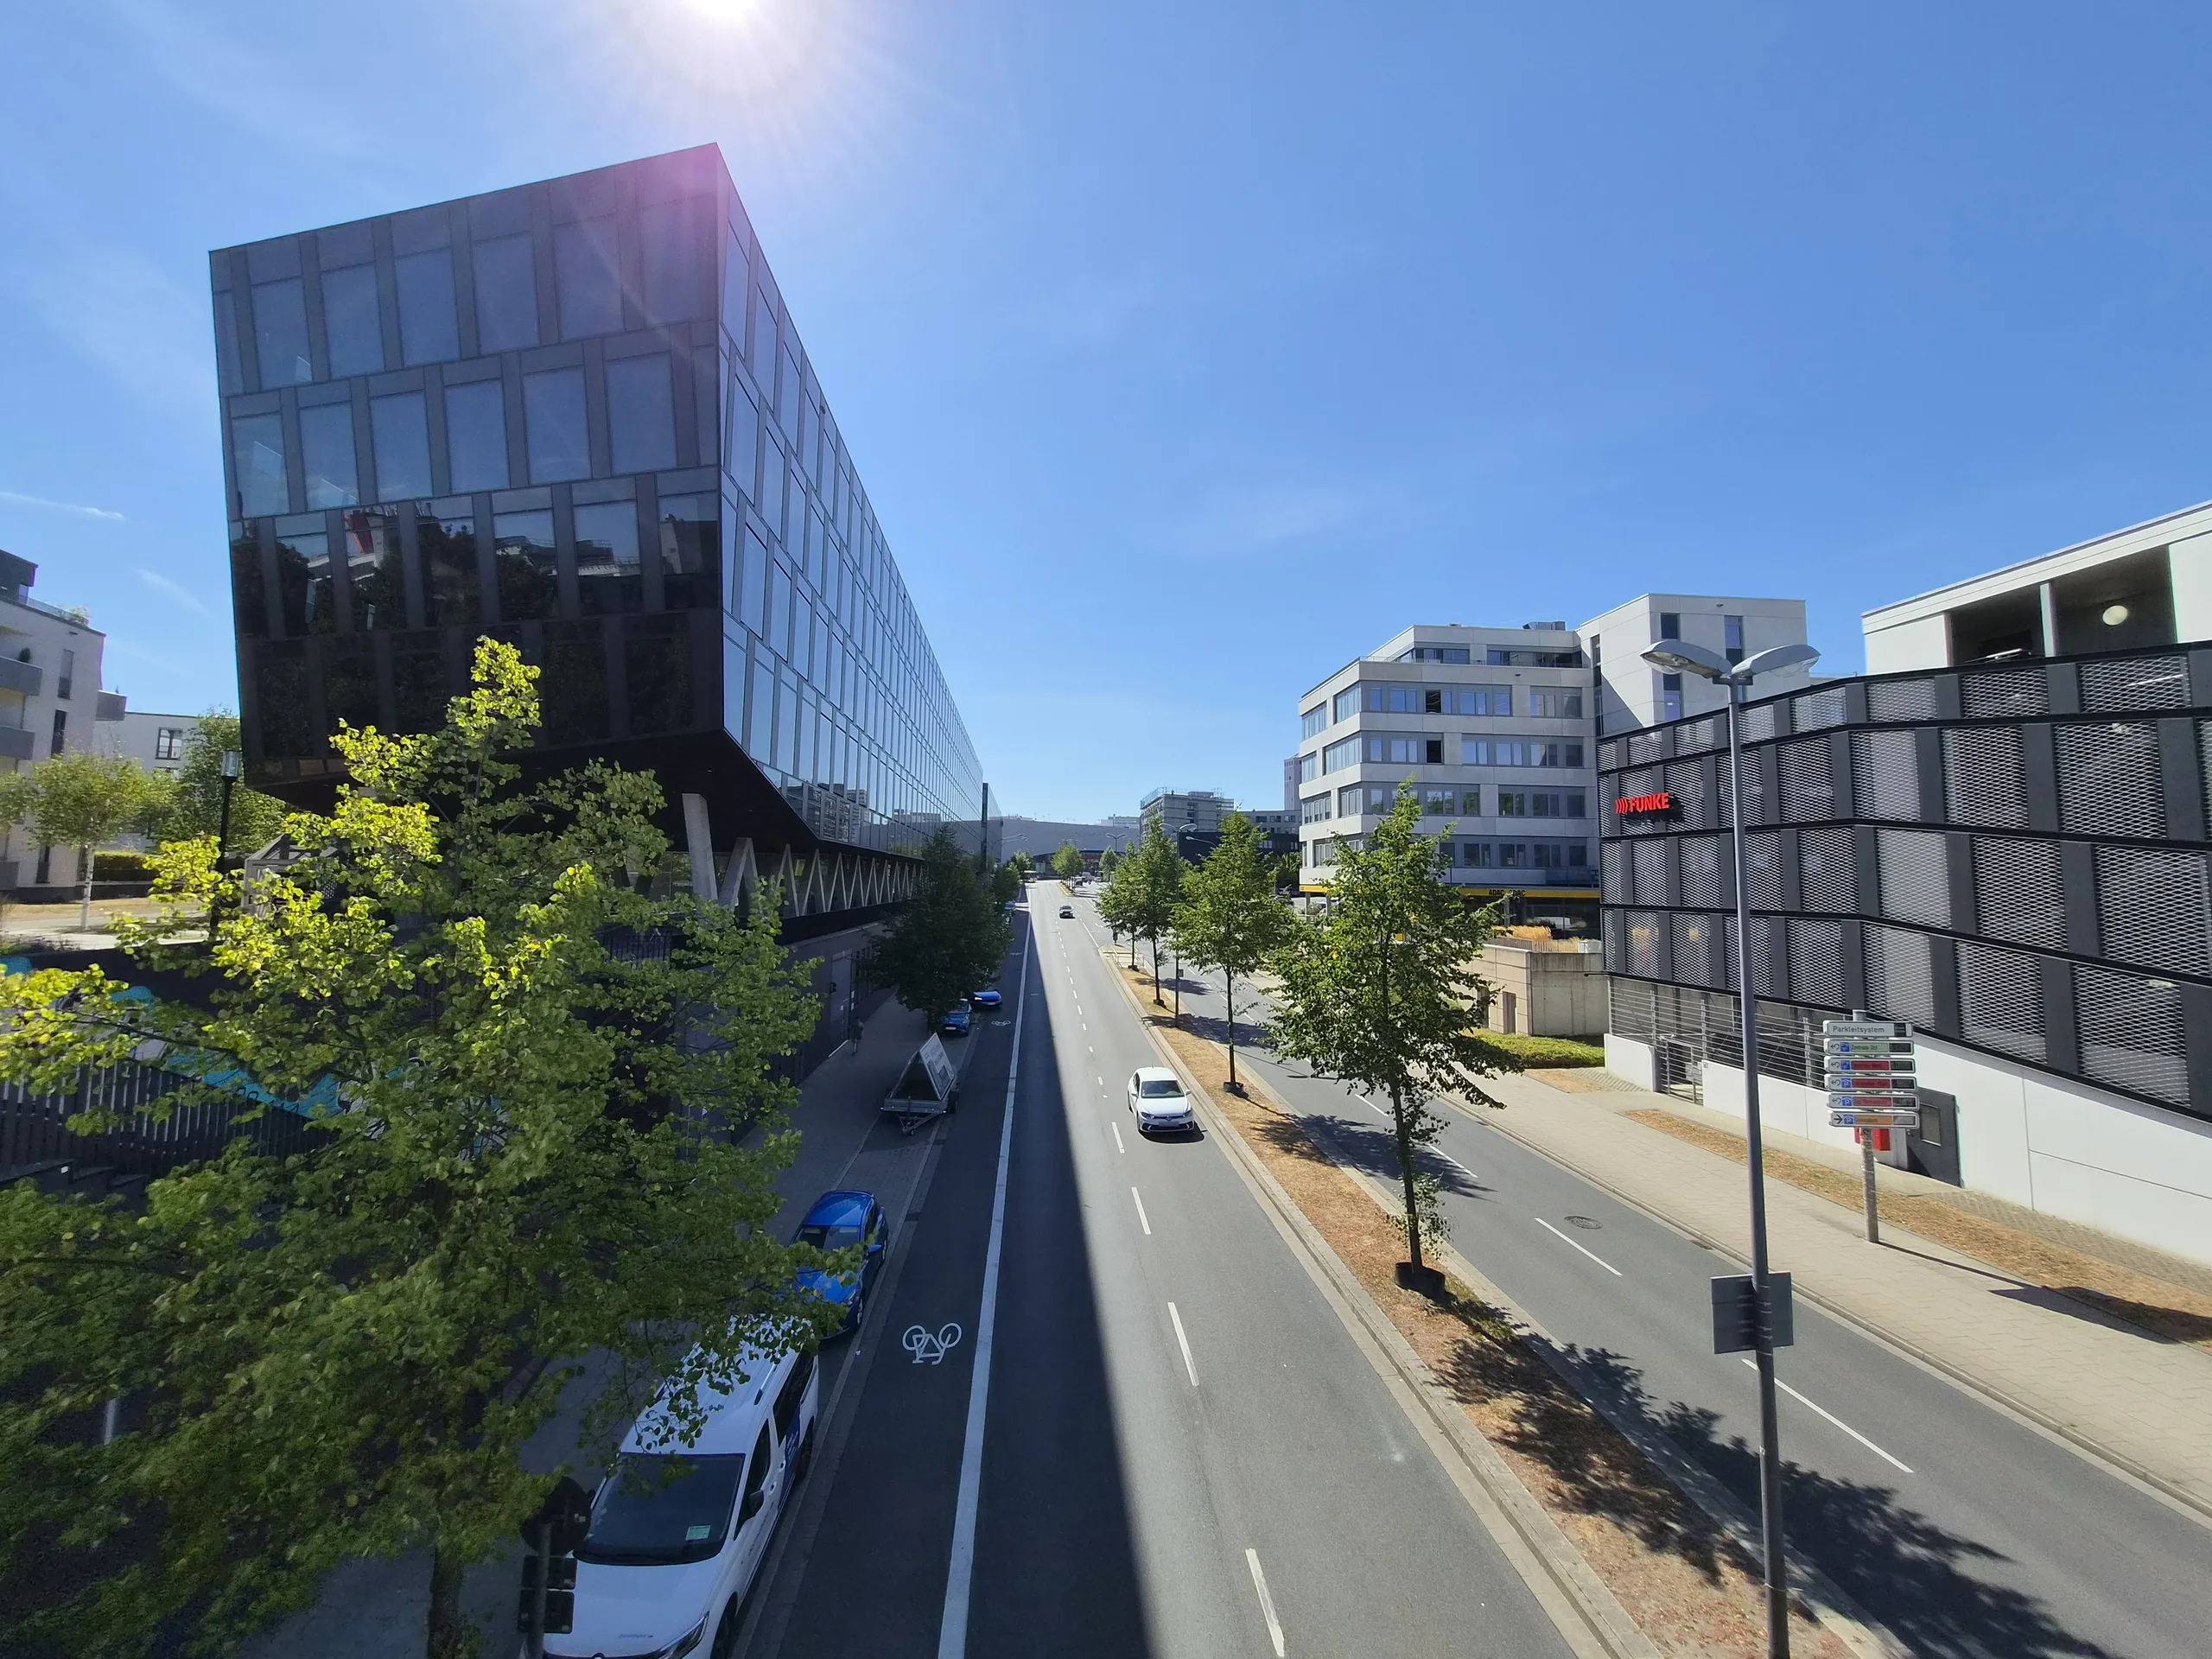


Image comparison
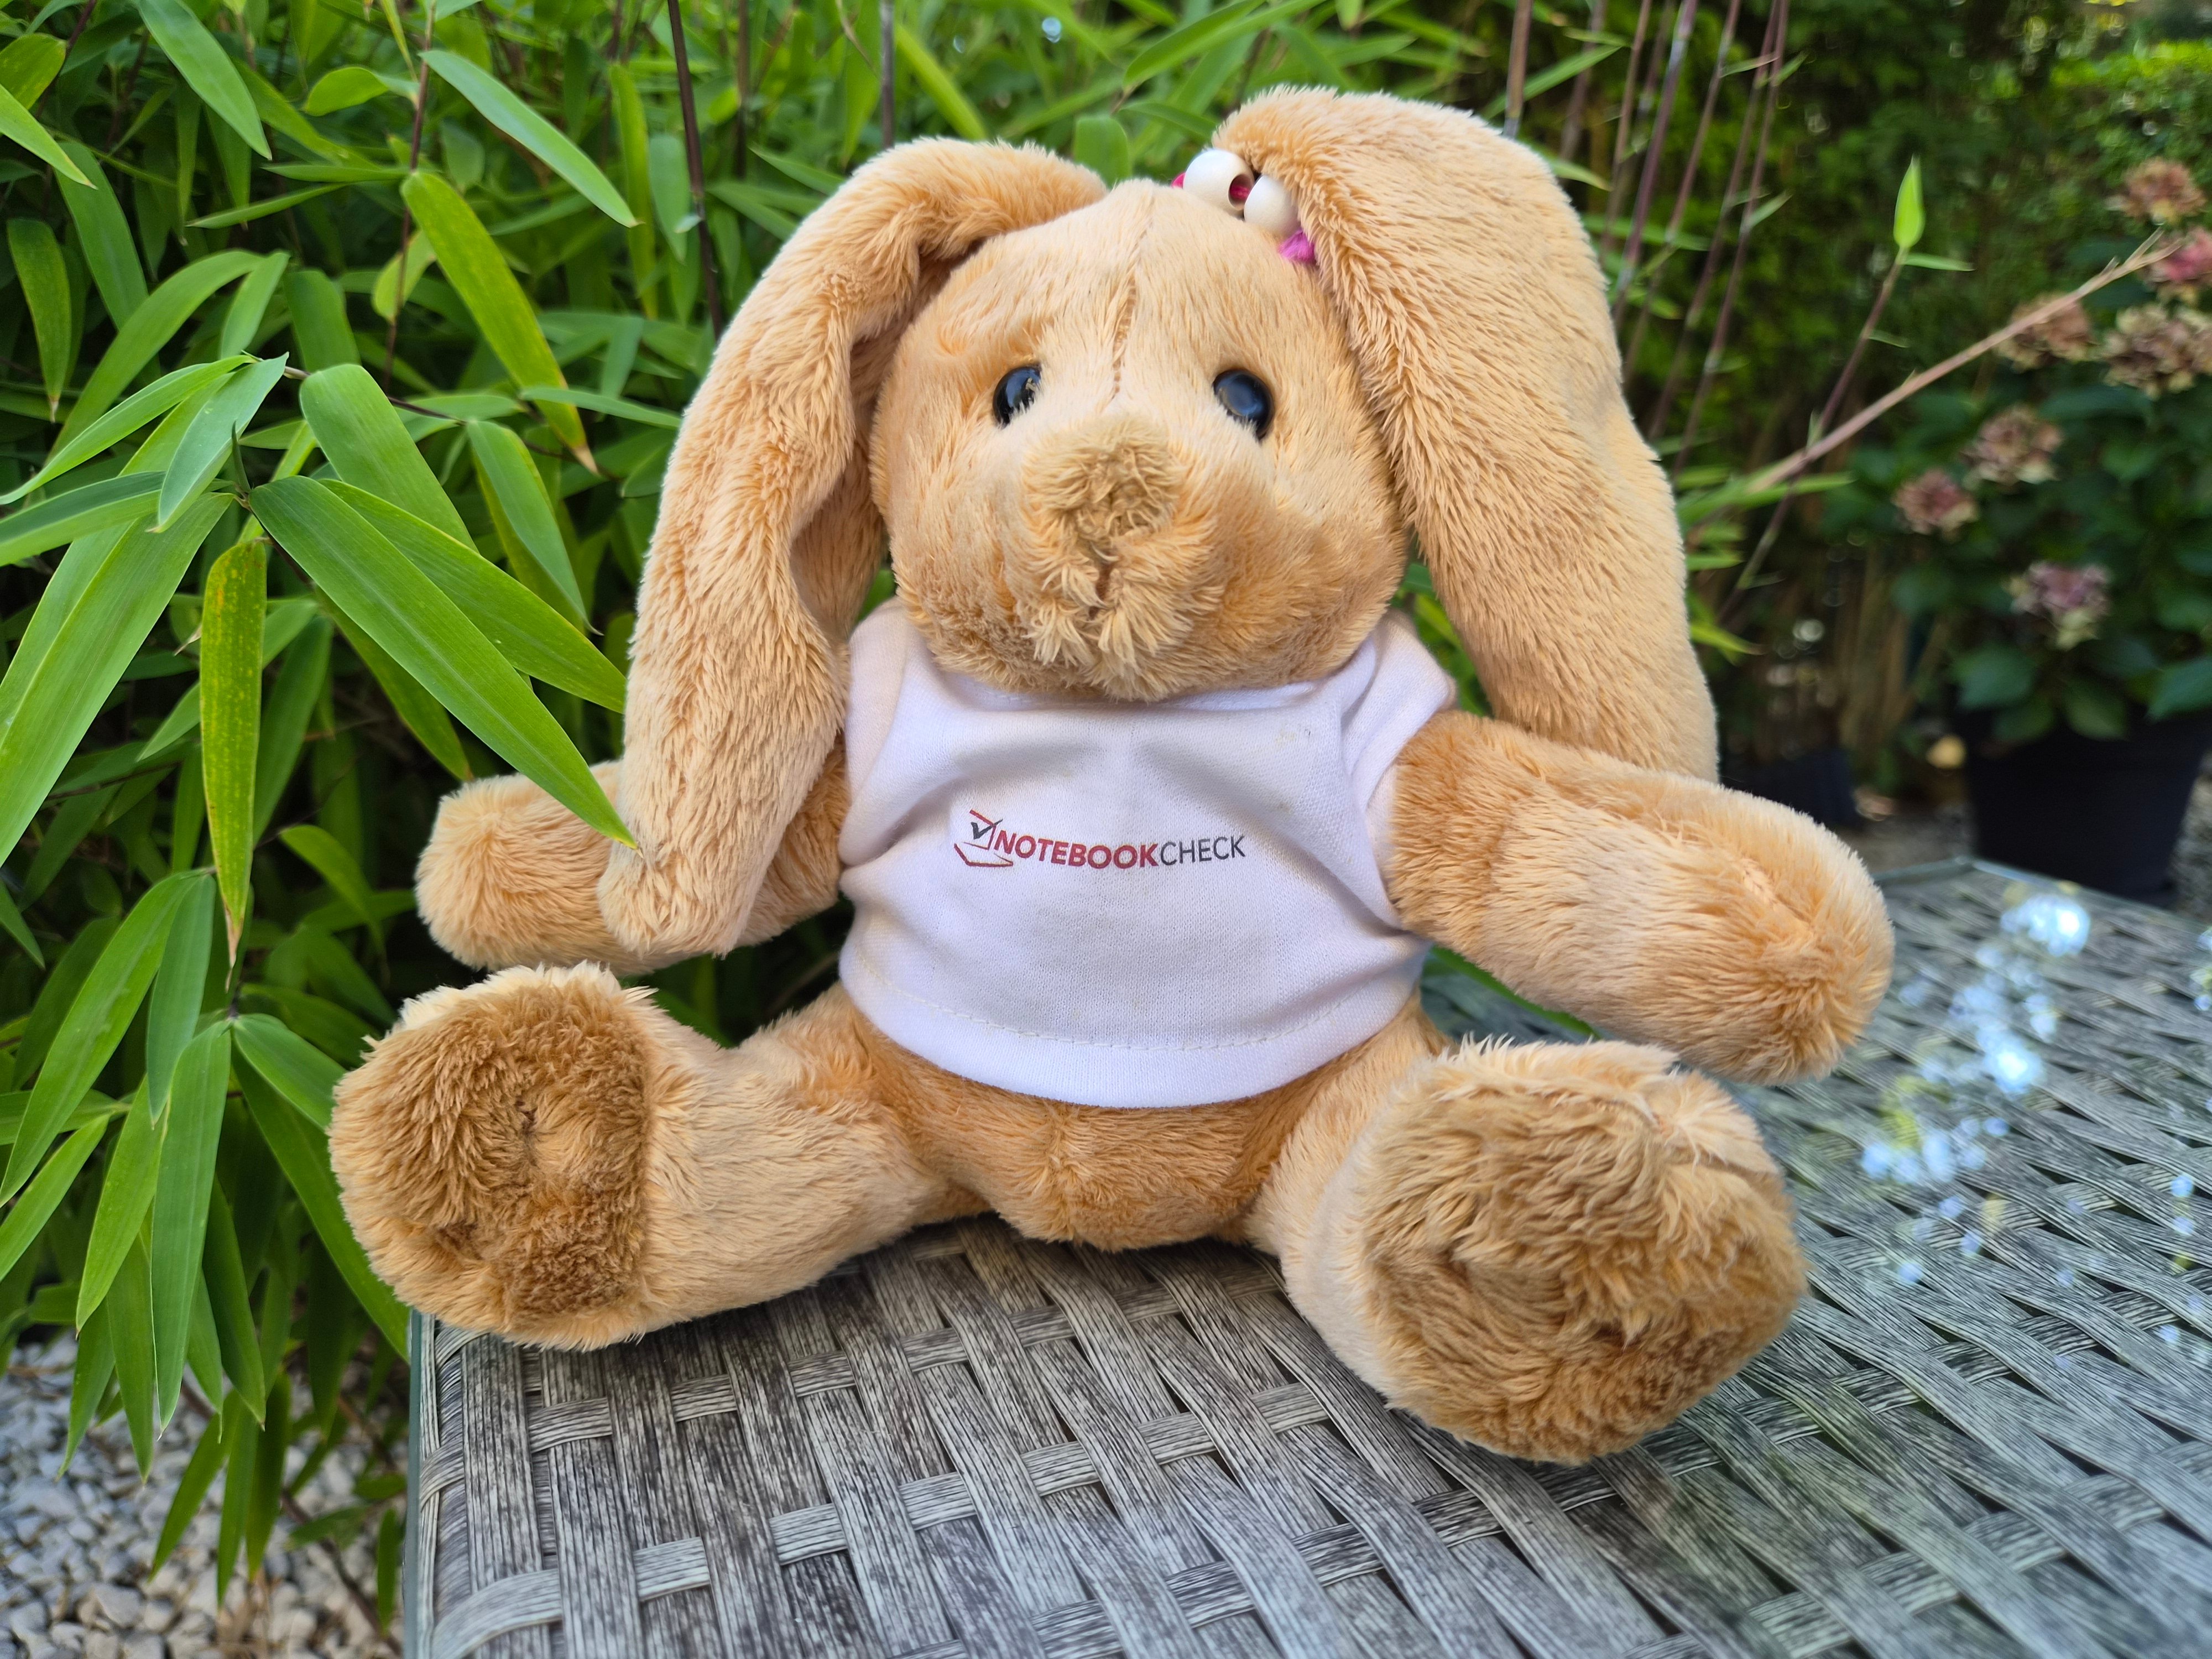
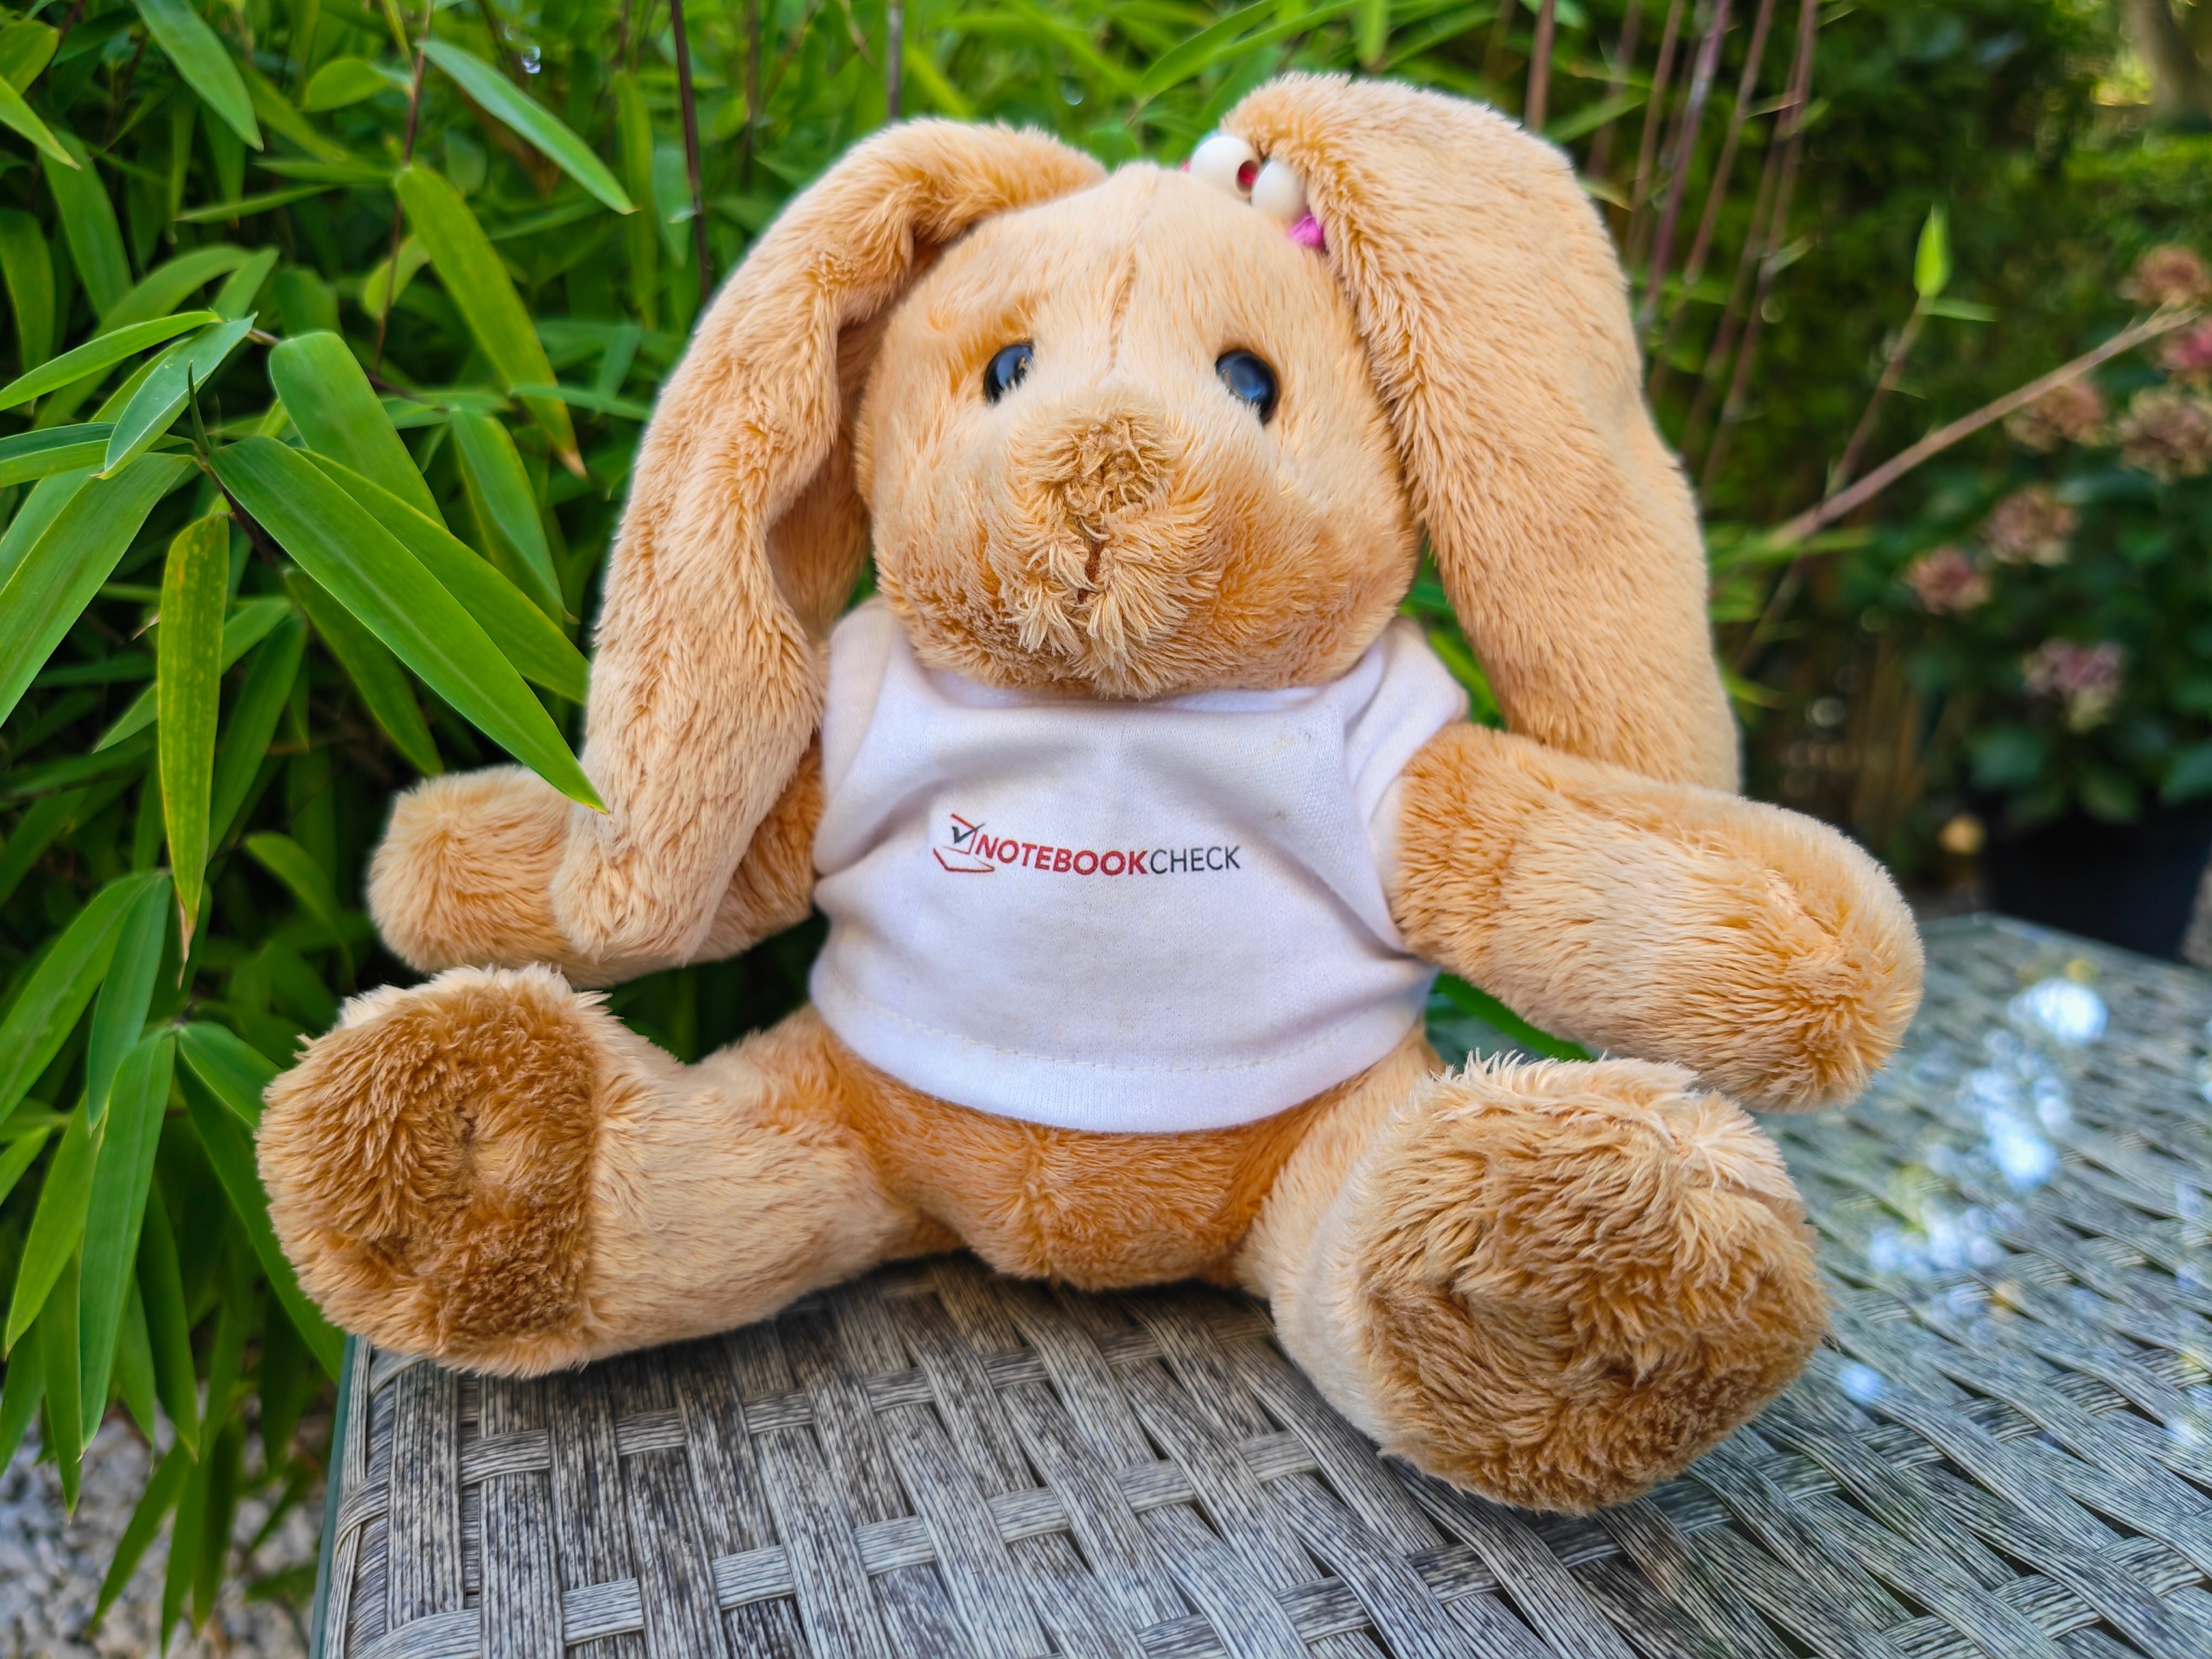
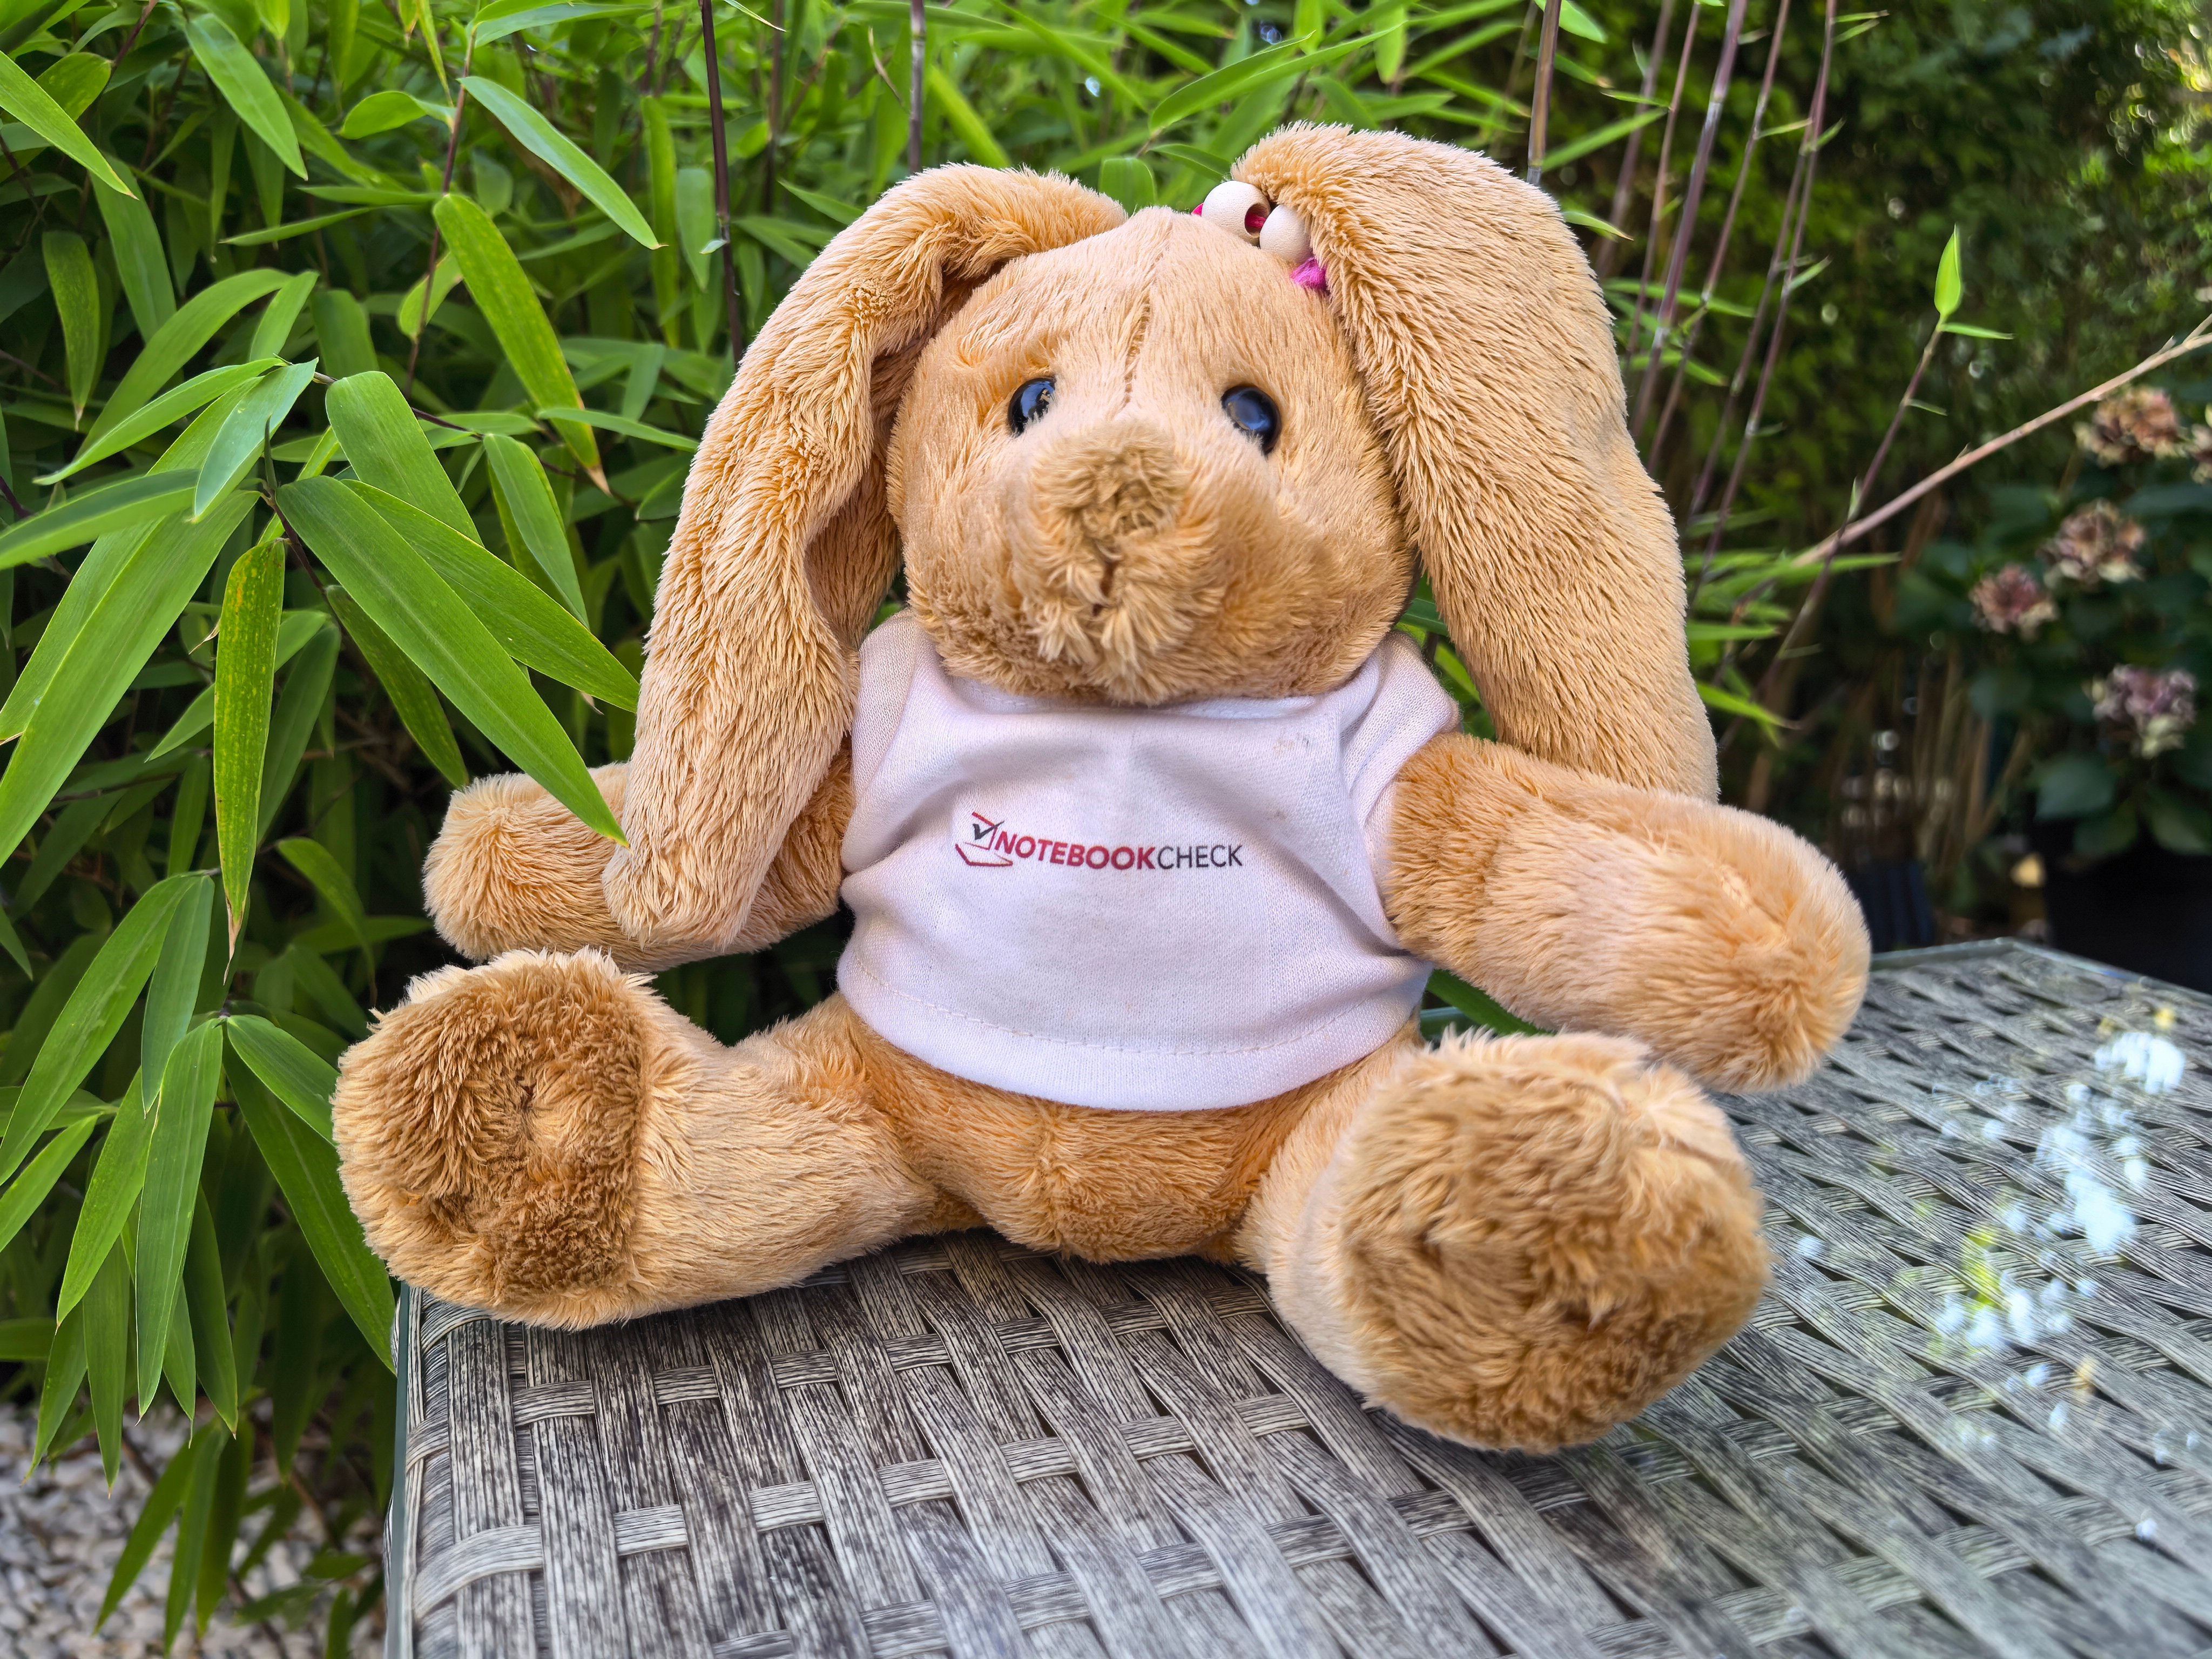
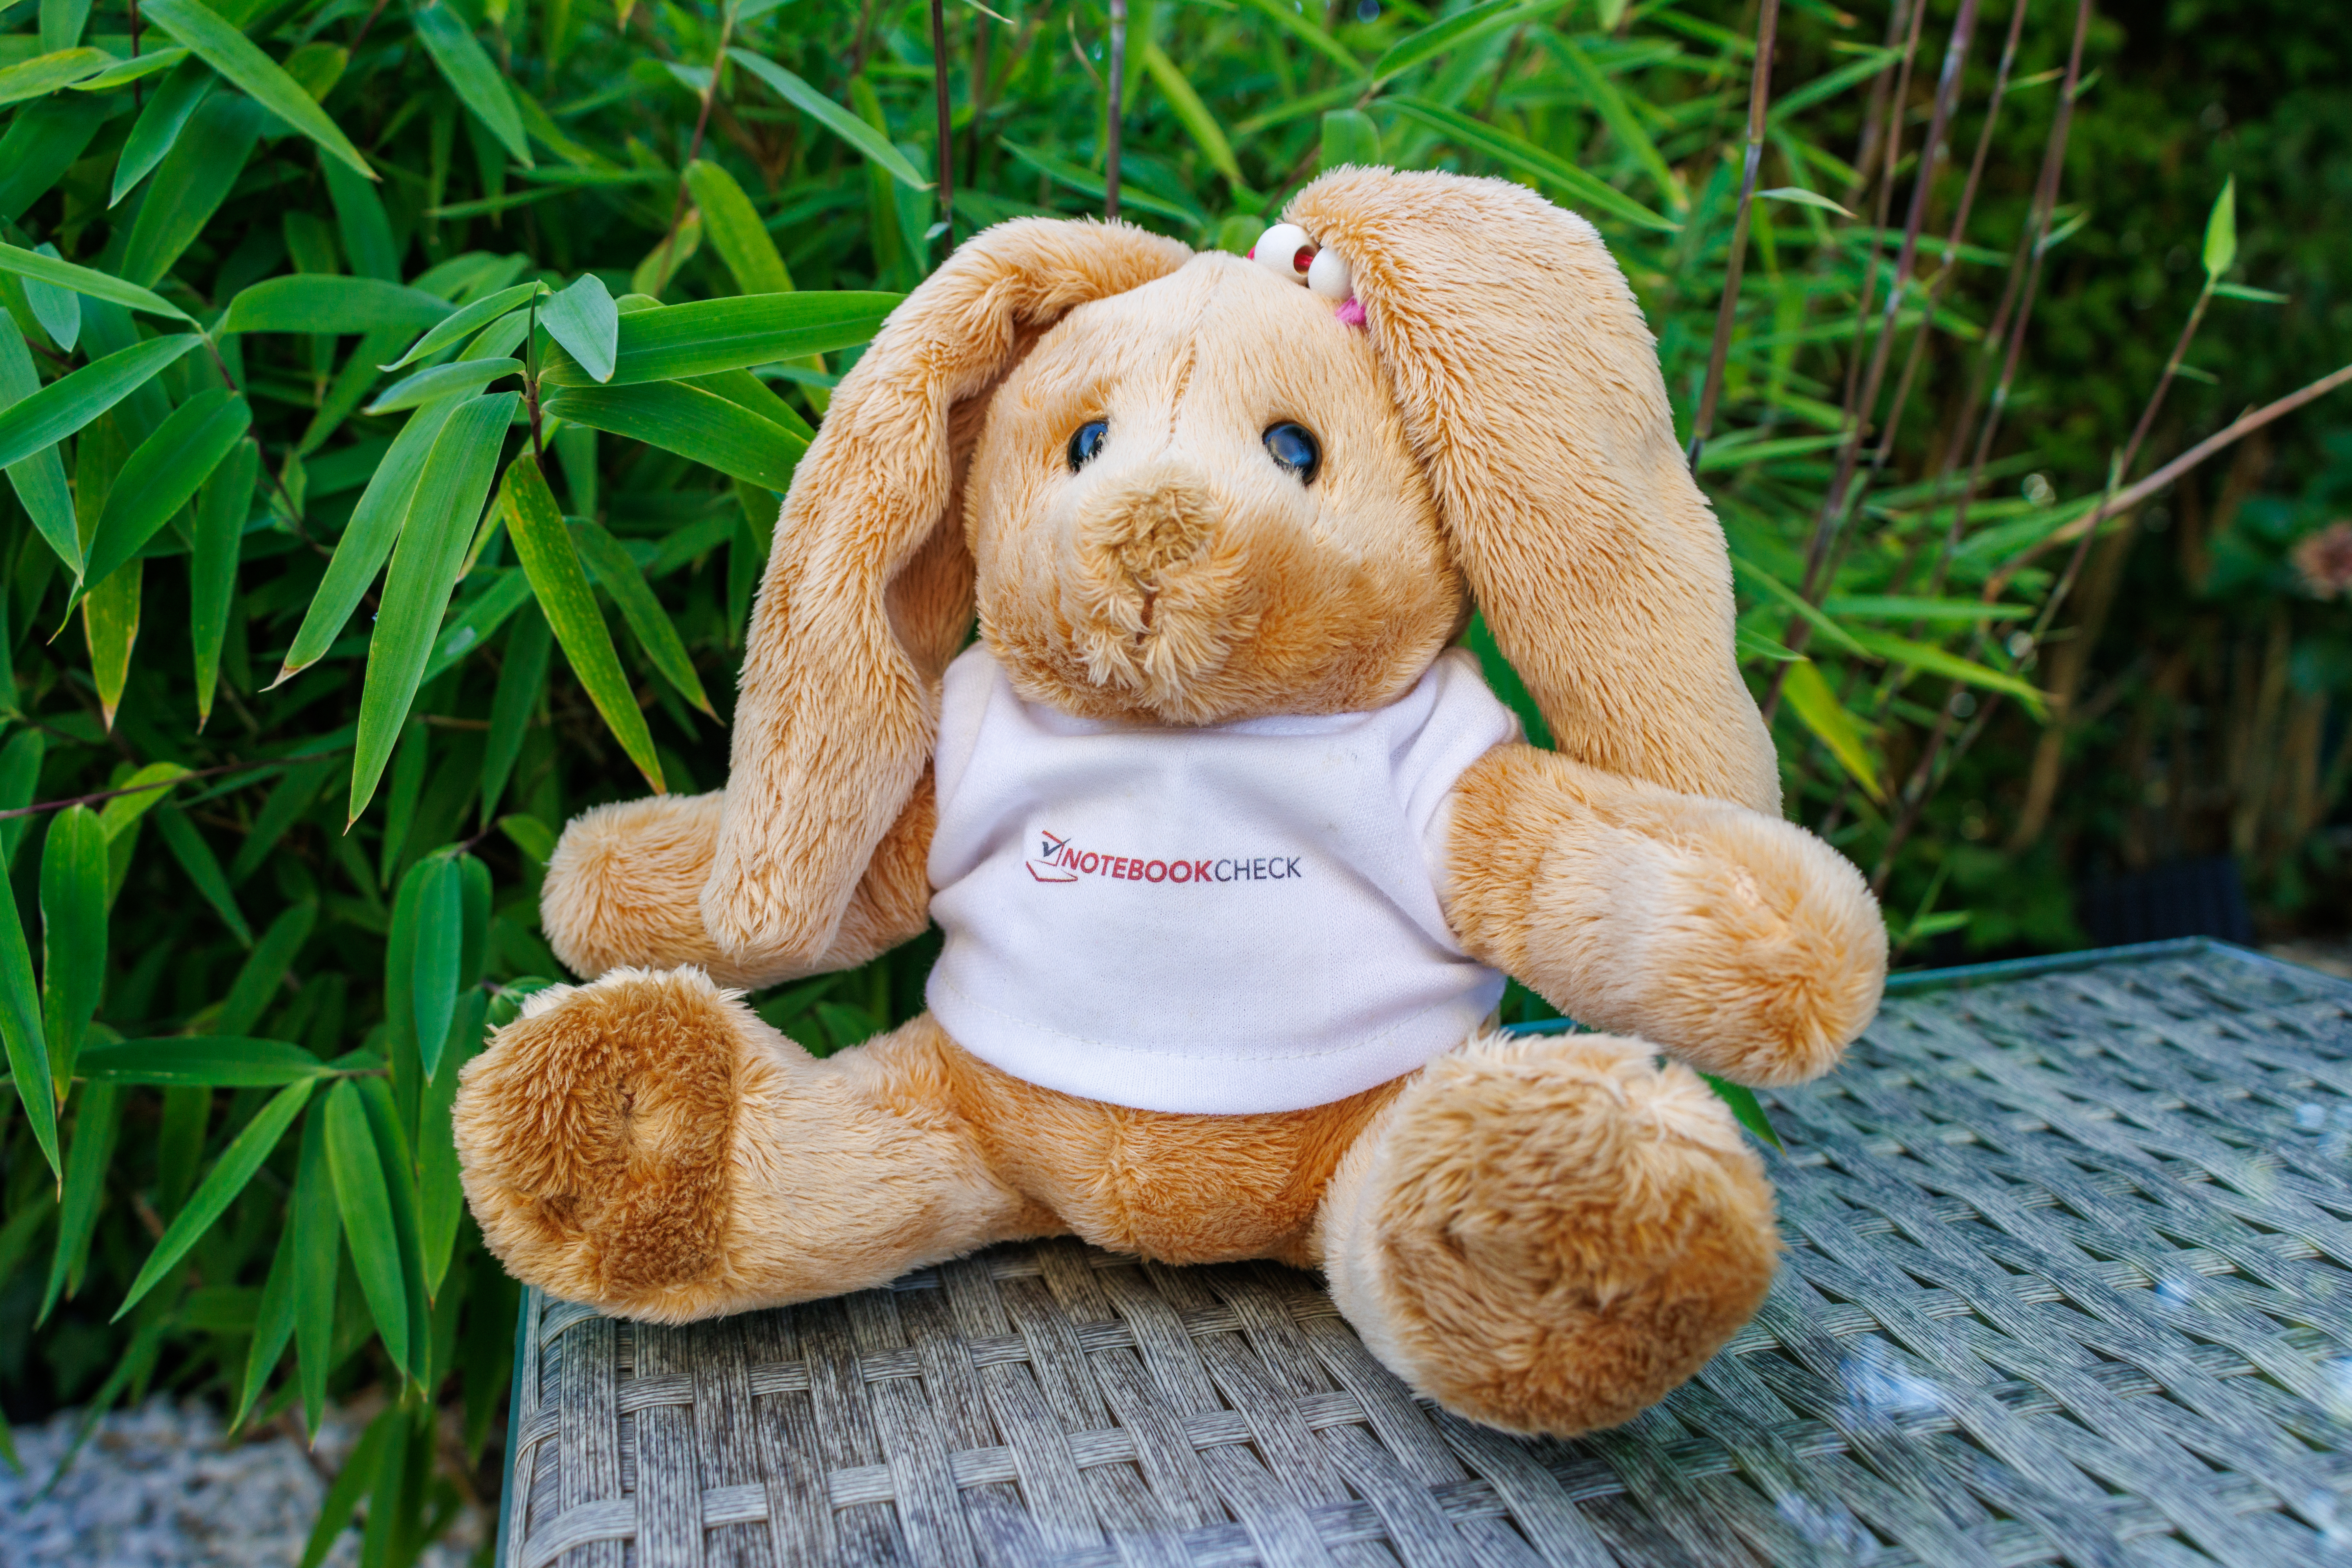
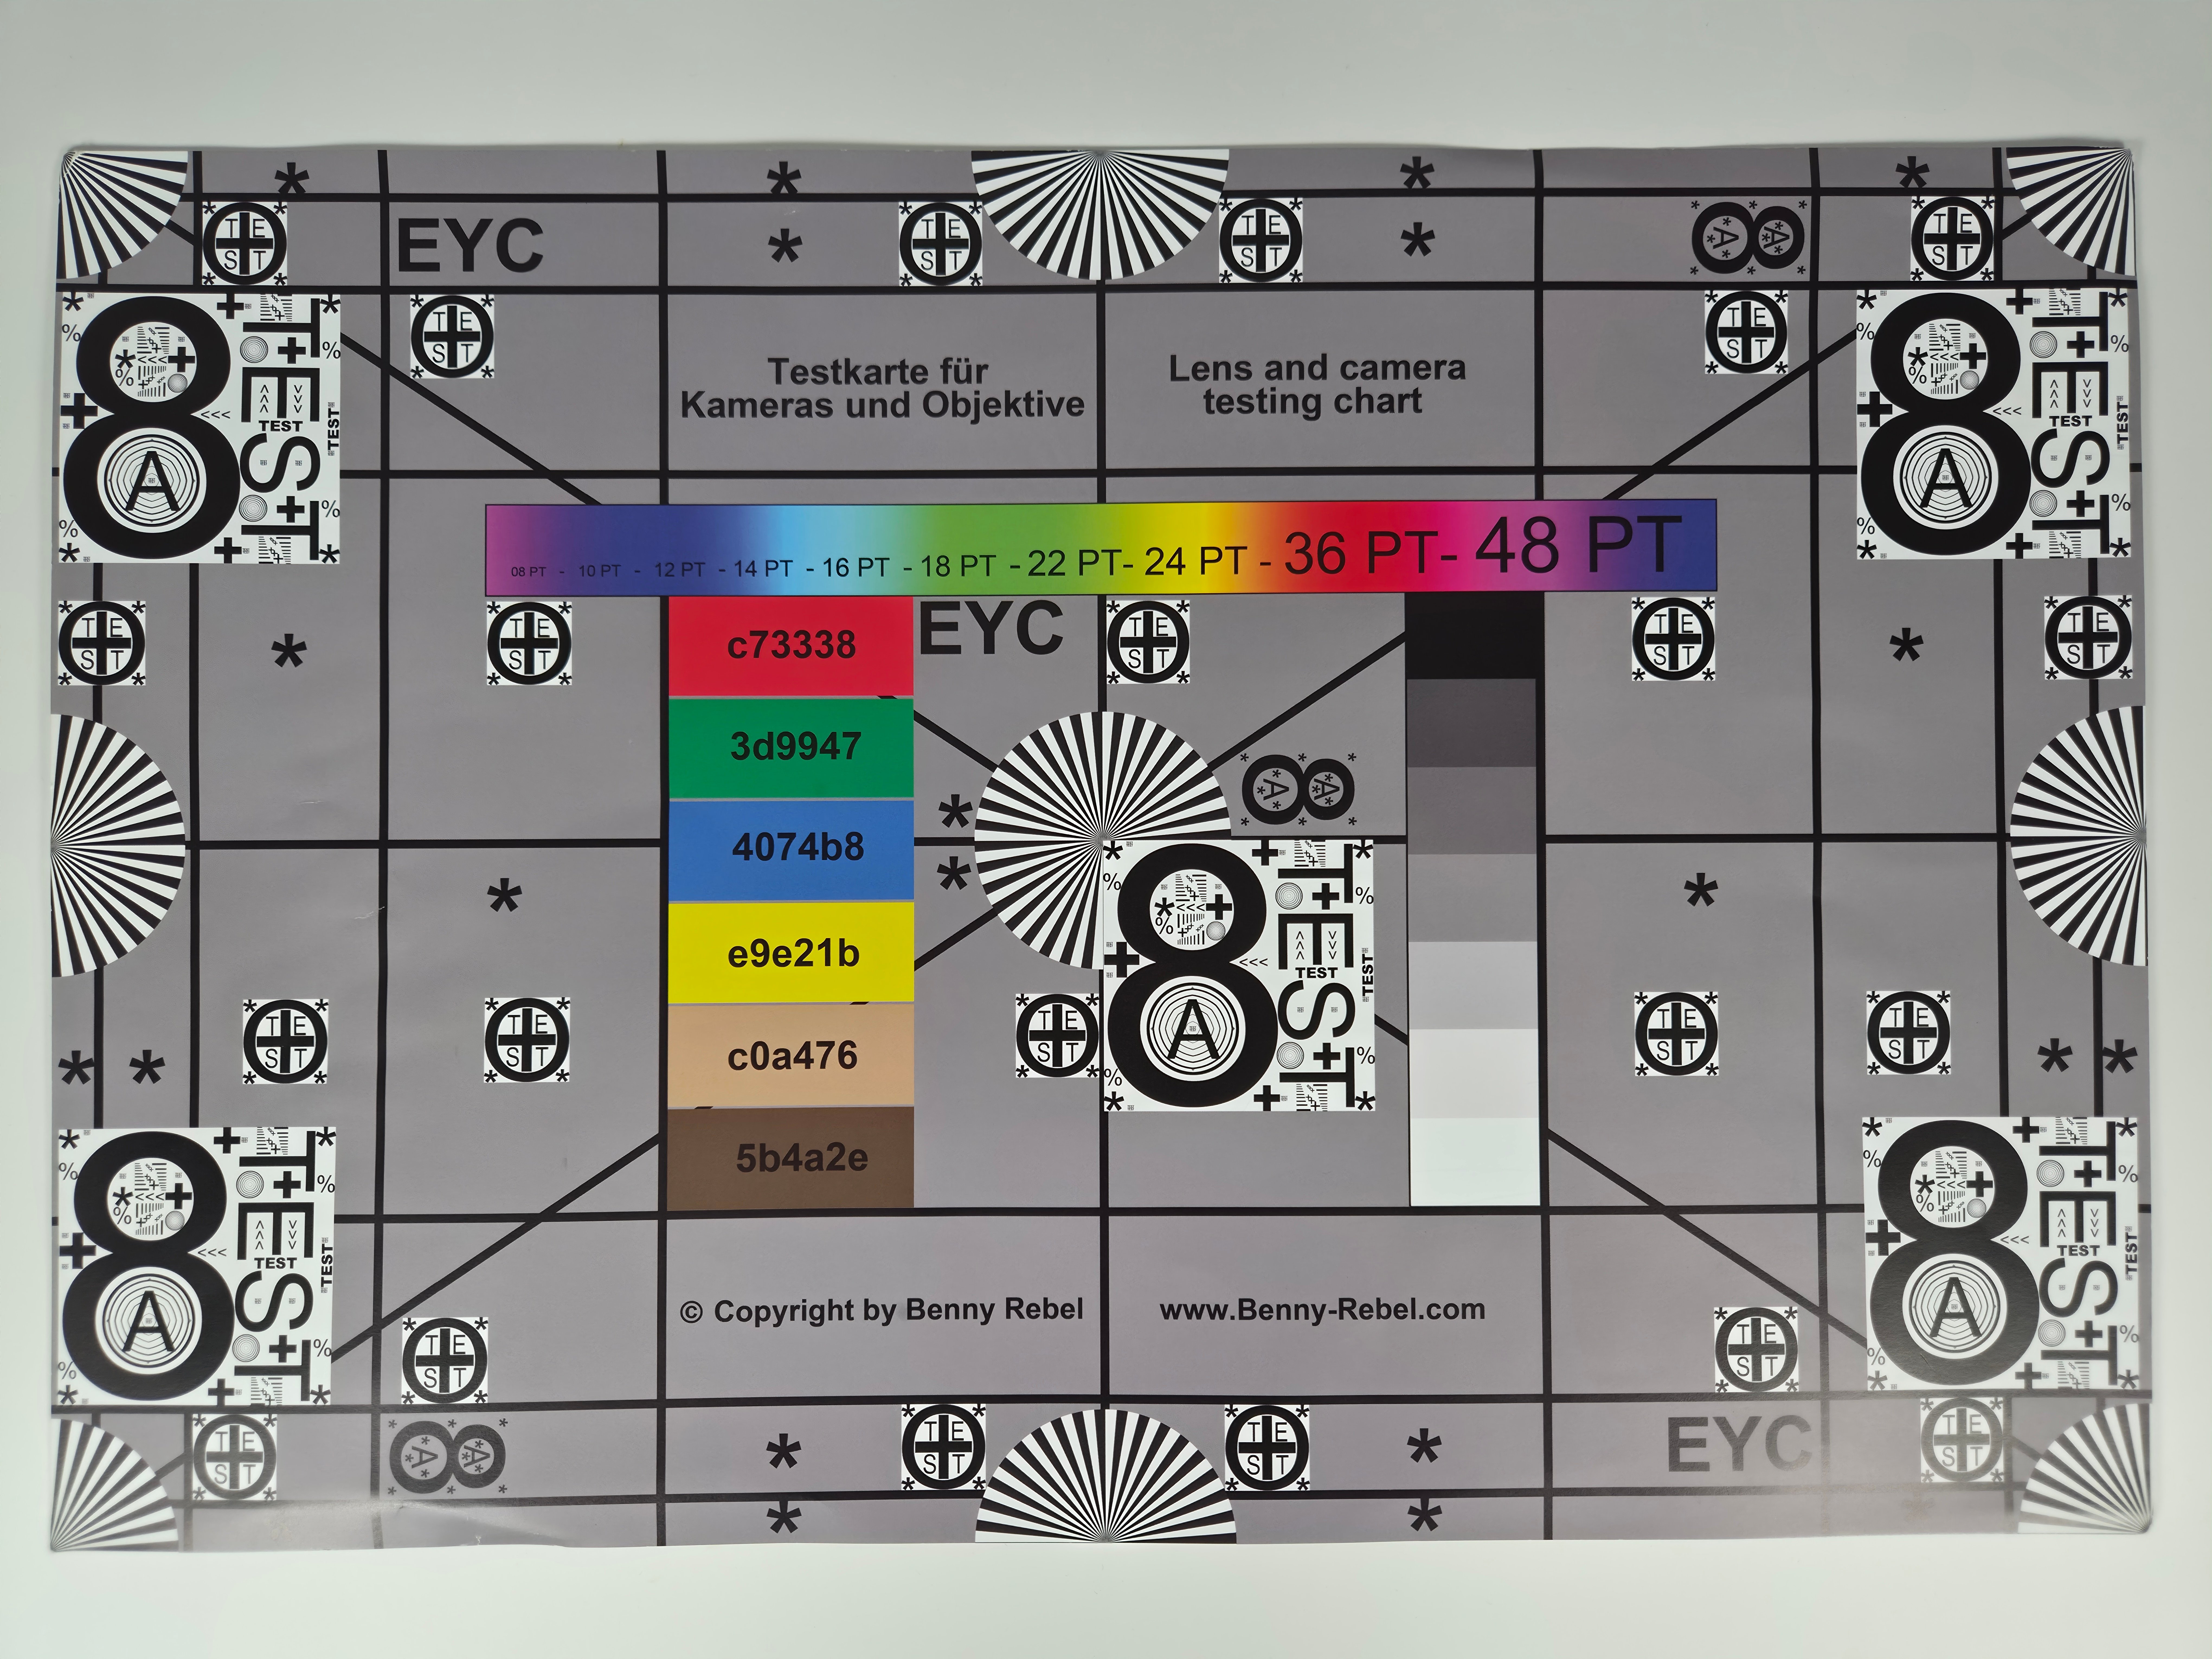
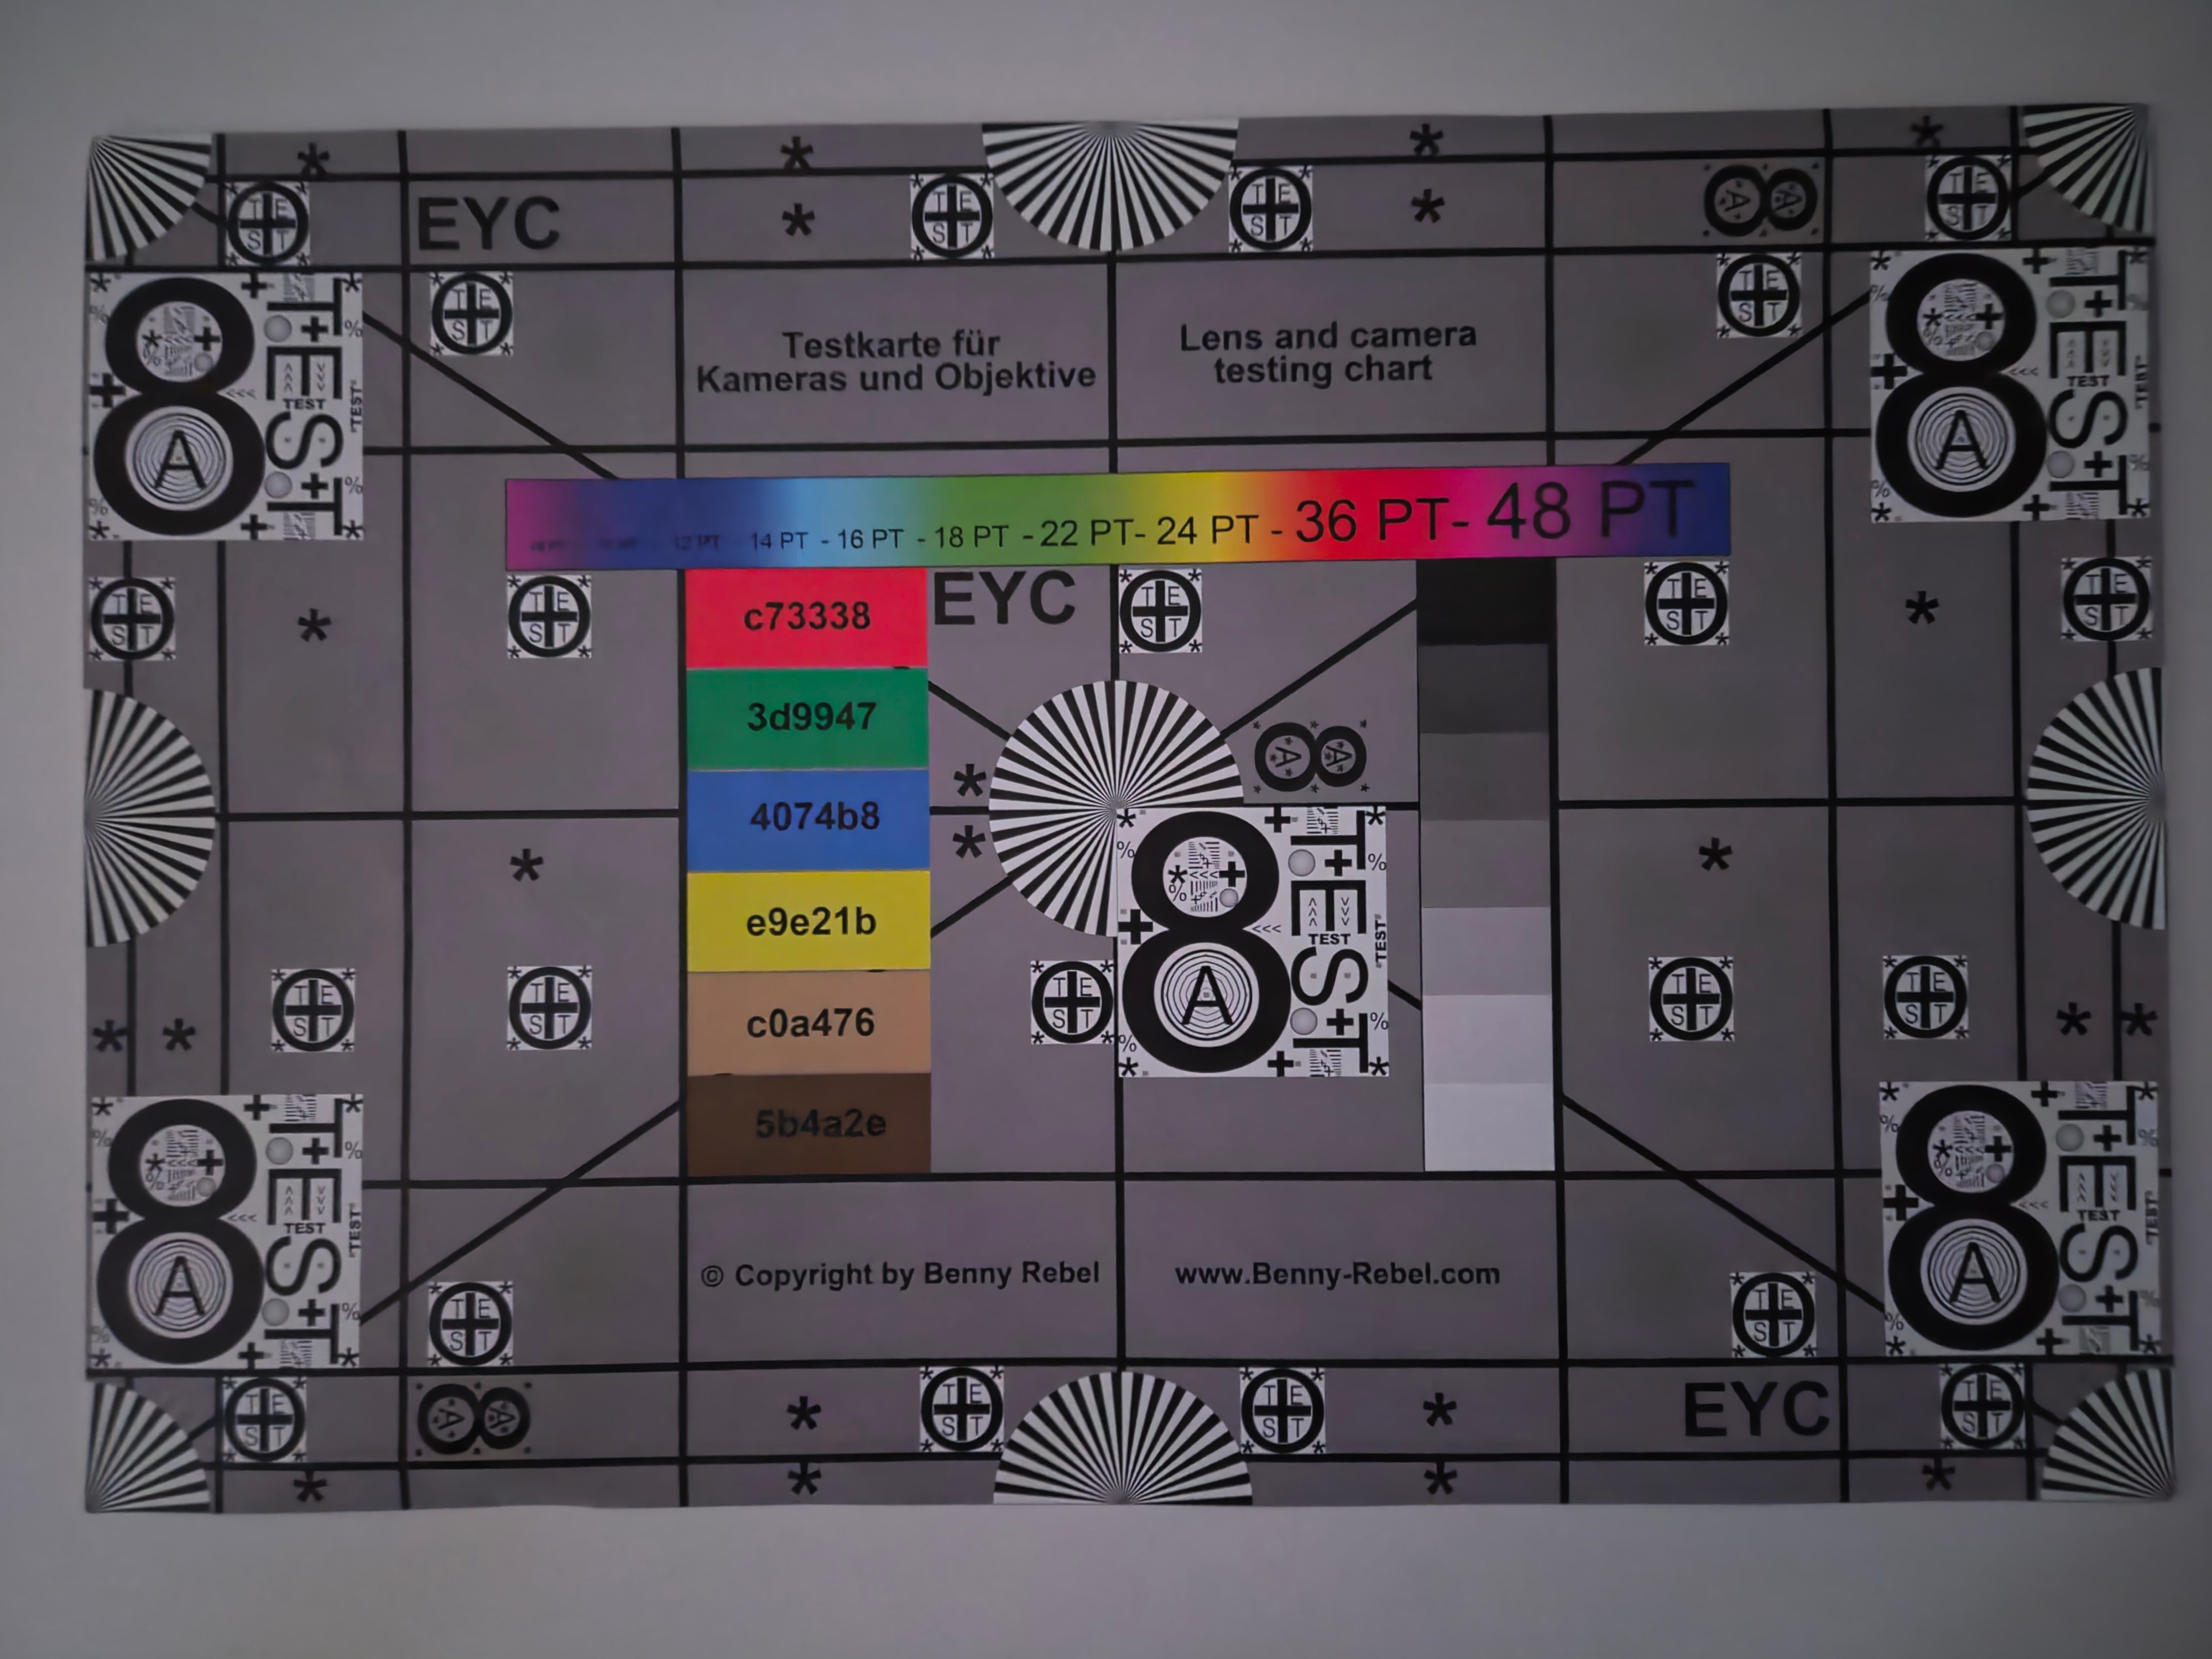
Choose a scene and navigate within the first image. One click changes the position on touchscreens. One click on the zoomed-in image opens the original in a new window. The first image shows the scaled photograph of the test device.





显示屏——大尺寸OLED屏幕,具有较低的PWM调光频率
这款6.9英寸可折叠OLED面板与Flip7完全相同。不过,鉴于今年翻盖手机品类缺乏竞争对手,该面板仍属顶级水平,尽管与Razr 70 Plus相比,其色彩还原度还有些许提升空间。 对于一款高端手机而言,继续沿用1,085p分辨率也并非理想之选。
不过,对于部分用户来说,高频PWM调光技术缺乏改进,在日常使用中可能是一个更严重的问题。 三星仍采用仅480 Hz的低频来控制屏幕亮度。通过Rigol软件,我们还测得其基频约为240 Hz。
| |||||||||||||||||||||||||
Center on Battery: 1339 cd/m²
Contrast: ∞:1 (Black: 0 cd/m²)
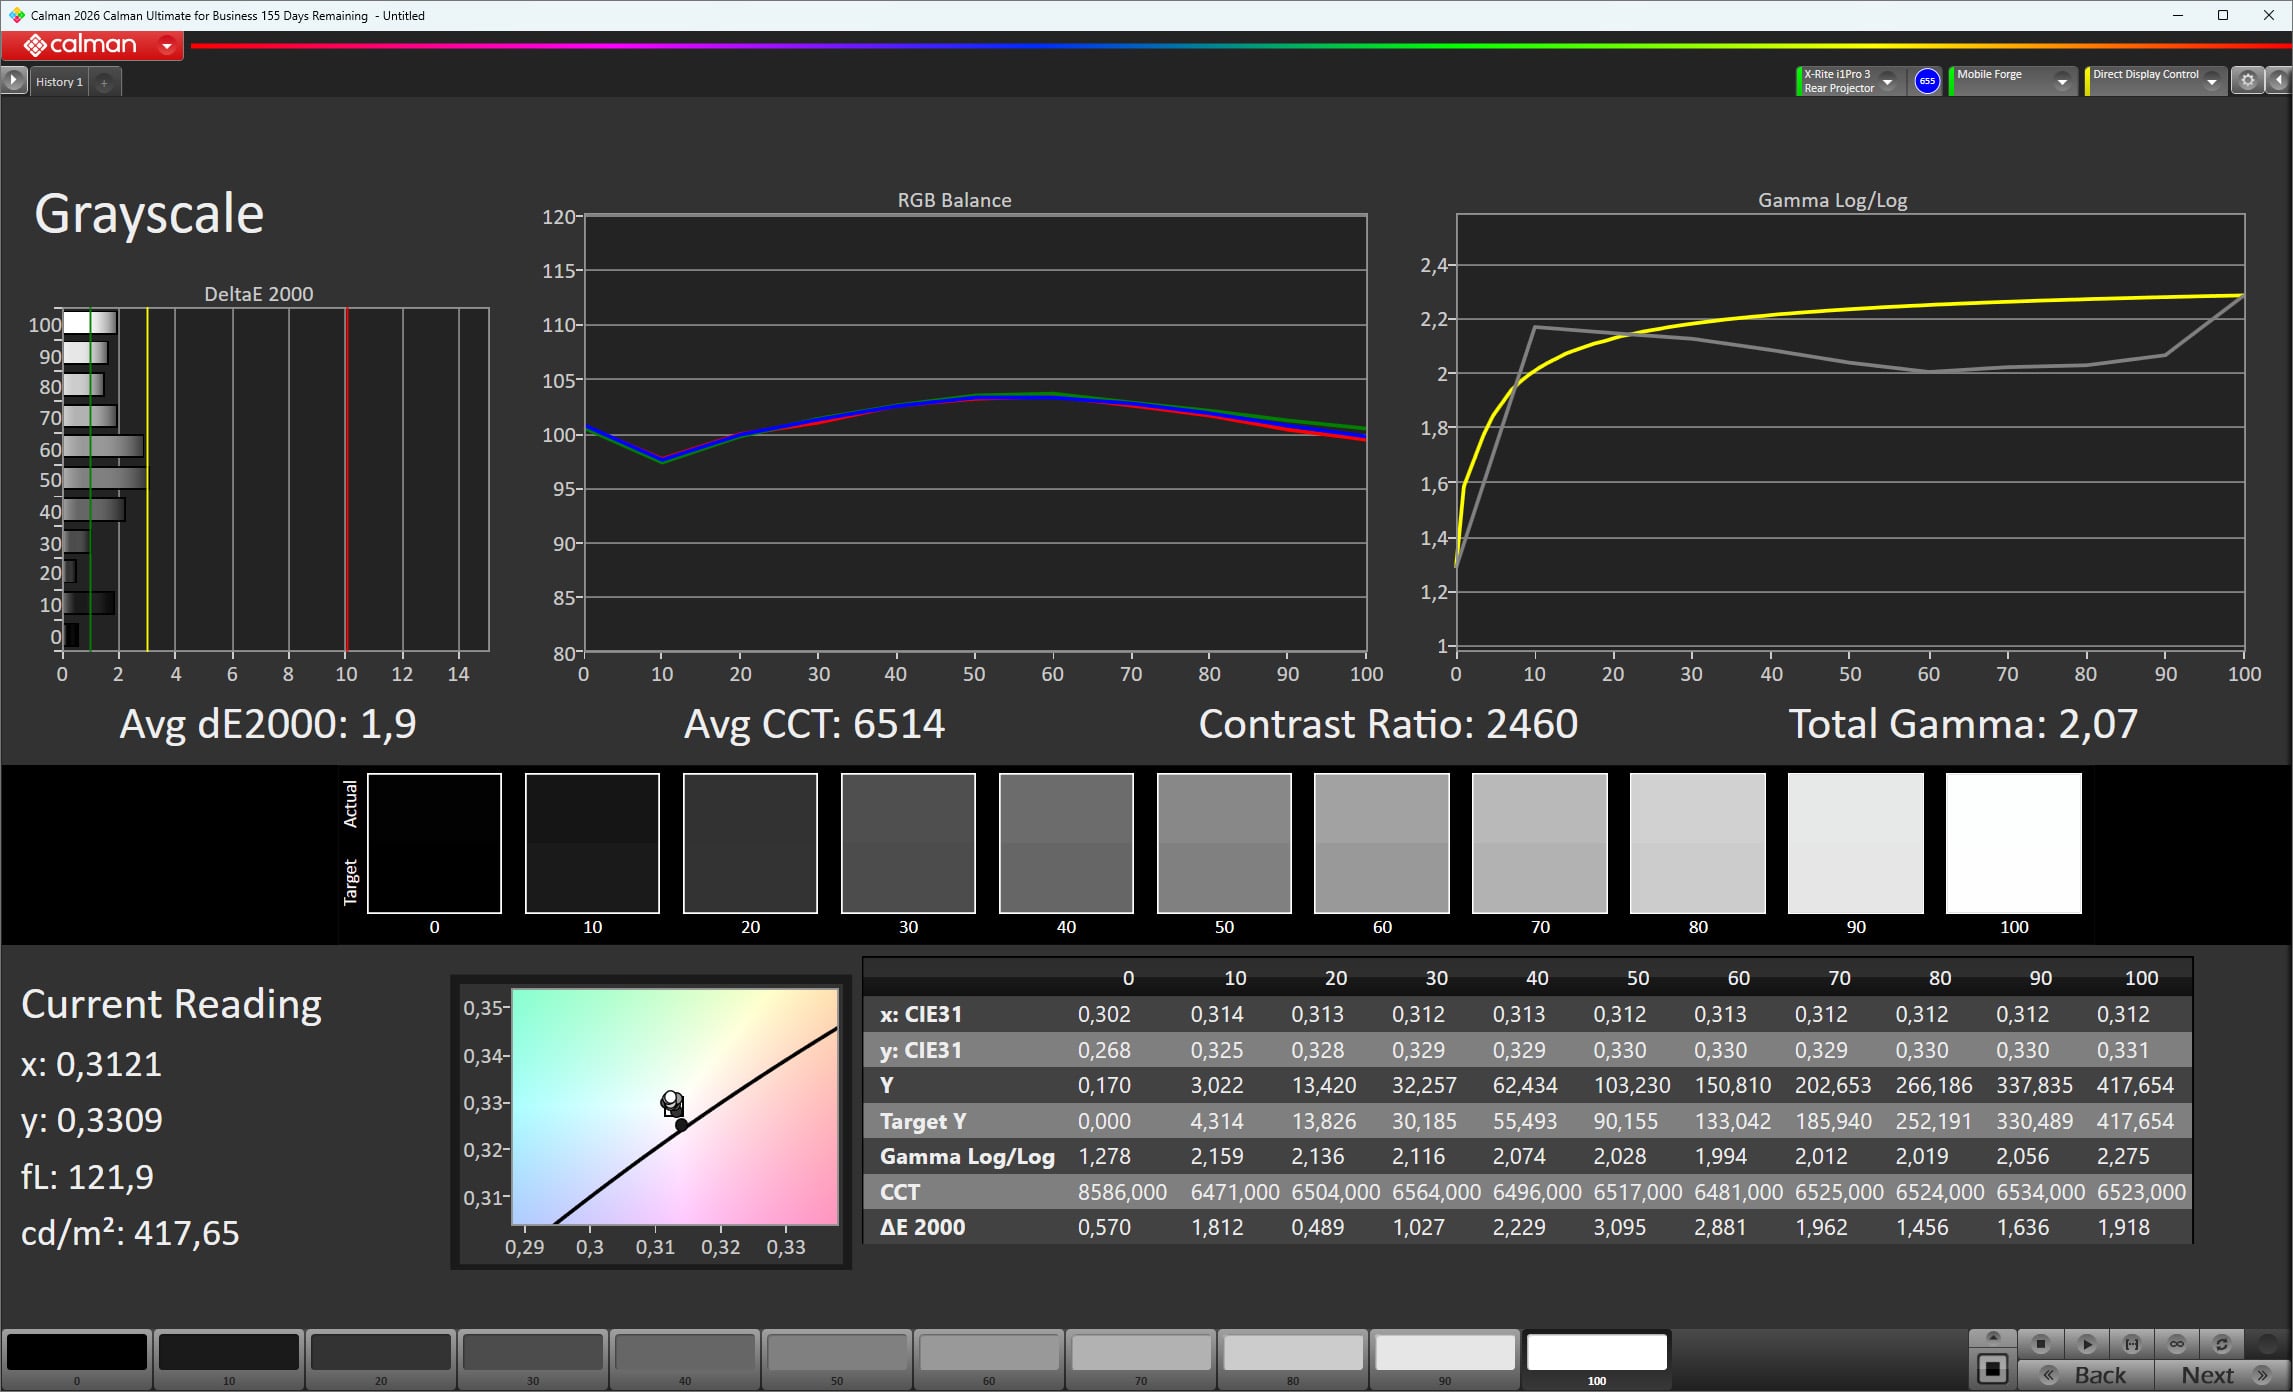
ΔE ColorChecker Calman: 2.6 | ∀{0.5-29.43 Ø4.7}
ΔE Greyscale Calman: 1.9 | ∀{0.09-98 Ø4.95}
99.1% sRGB (Calman 2D)
Gamma: 2.07
CCT: 6514 K
| Samsung Galaxy Z Flip8 Super AMOLED, 2520x1080, 6.9" | Motorola Razr 70 Plus AMOLED, 2640x1084, 6.9" | Xiaomi Mix Flip 2 AMOLED, 2912x1224, 6.9" | Samsung Galaxy Z Flip7 AMOLED, 2520x1080, 6.9" | |
|---|---|---|---|---|
| Display | 1% | -7% | ||
| APL18 Peak Brightness (cd/m²) | 2636 | 2765 5% | 2635 0% | |
| HDR Peak Brightness (cd/m²) | 2788 | 2684 -4% | 2431 -13% | |
| Response Times | -7% | -39% | 9% | |
| Response Time Grey 50% / Grey 80% * (ms) | 0.68 ? | 0.6 ? 12% | 1.4 ? -106% | 0.64 ? 6% |
| Response Time Black / White * (ms) | 1.1 ? | 1.6 ? -45% | 1 ? 9% | 1.05 ? 5% |
| PWM Frequency (Hz) | 240 | 180 | 121 | 240 |
| PWM Amplitude * (%) | 15.96 | 14 12% | 19 -19% | 13.64 15% |
| Screen | 24% | -3% | 13% | |
| Brightness middle (cd/m²) | 1339 | 1346 1% | 1077 -20% | 1349 1% |
| Black Level * (cd/m²) | ||||
| Colorchecker dE 2000 * | 2.6 | 1.27 51% | 2.11 19% | 2.2 15% |
| Colorchecker dE 2000 max. * | 4.1 | 2.39 42% | 3.62 12% | 3.3 20% |
| Greyscale dE 2000 * | 1.9 | 1.9 -0% | 2.3 -21% | 1.6 16% |
| Gamma | 2.07 106% | 2.173 101% | 2.155 102% | 2.06 107% |
| CCT | 6514 100% | 6374 102% | 6275 104% | 6484 100% |
| Brightness (cd/m²) | 1036 | 1354 | ||
| Brightness Distribution (%) | 95 | 98 | ||
| Total Average (Program / Settings) | 6% /
8% | -21% /
-18% | 5% /
7% |
* ... smaller is better
Screen Flickering / PWM (Pulse-Width Modulation)
| Screen flickering / PWM detected | 240 Hz Amplitude: 15.96 % Secondary Frequency: 480 Hz | 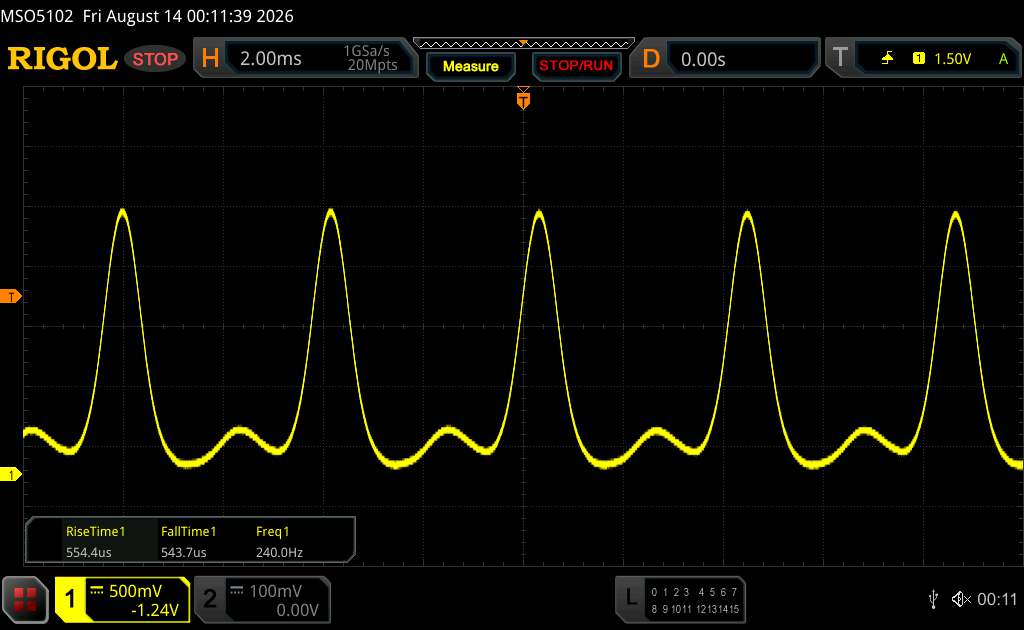 | |
The display backlight flickers at 240 Hz (worst case, e.g., utilizing PWM) . The frequency of 240 Hz is relatively low, so sensitive users will likely notice flickering and experience eyestrain at the stated brightness setting and below. In comparison: 52 % of all tested devices do not use PWM to dim the display. If PWM was detected, an average of 7659 (minimum: 5 - maximum: 343500) Hz was measured. | |||
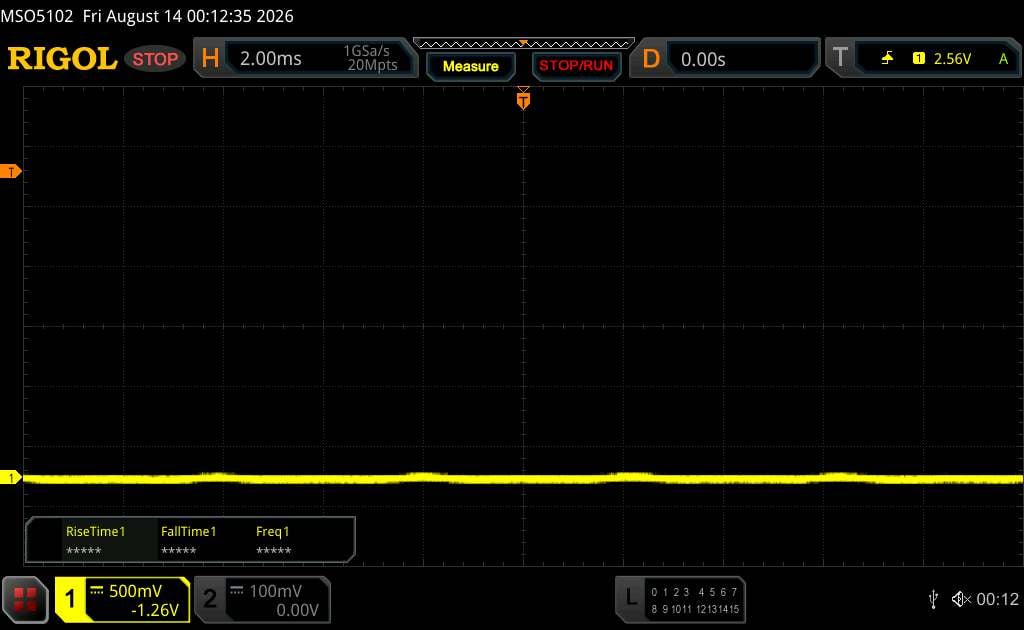
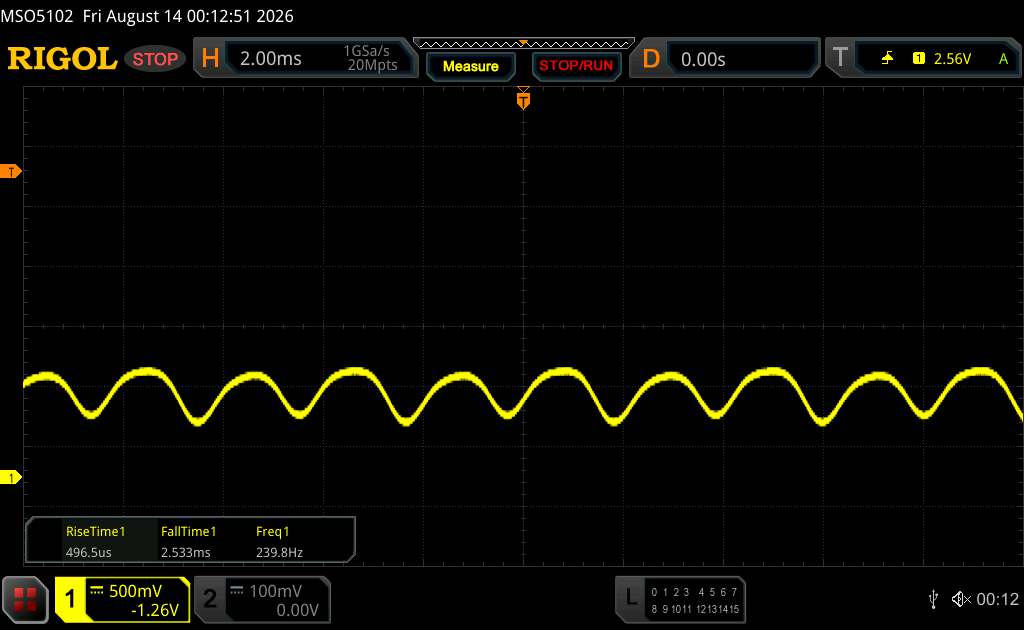
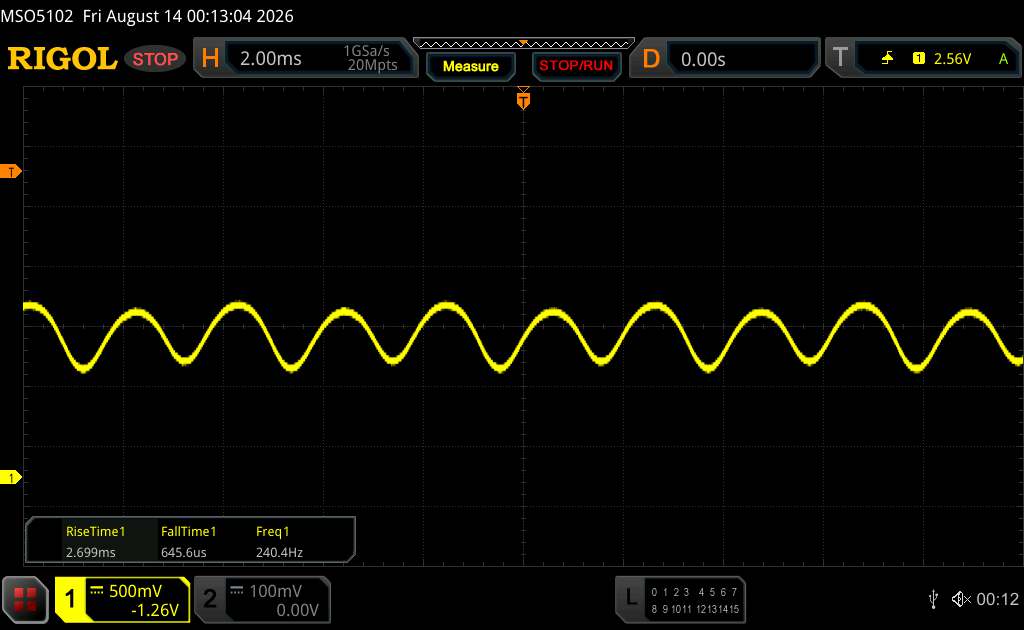
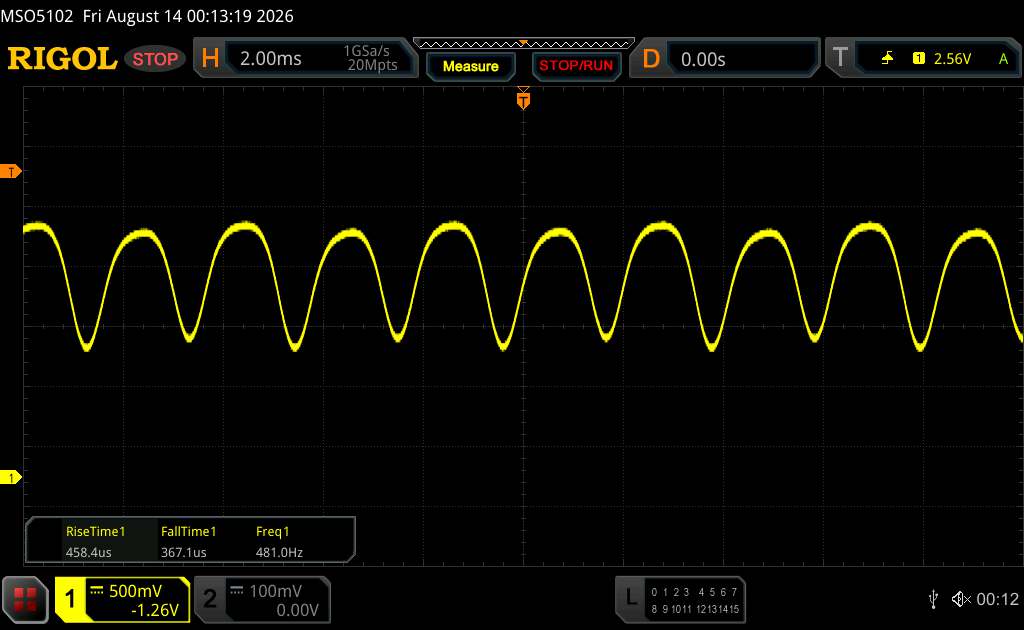
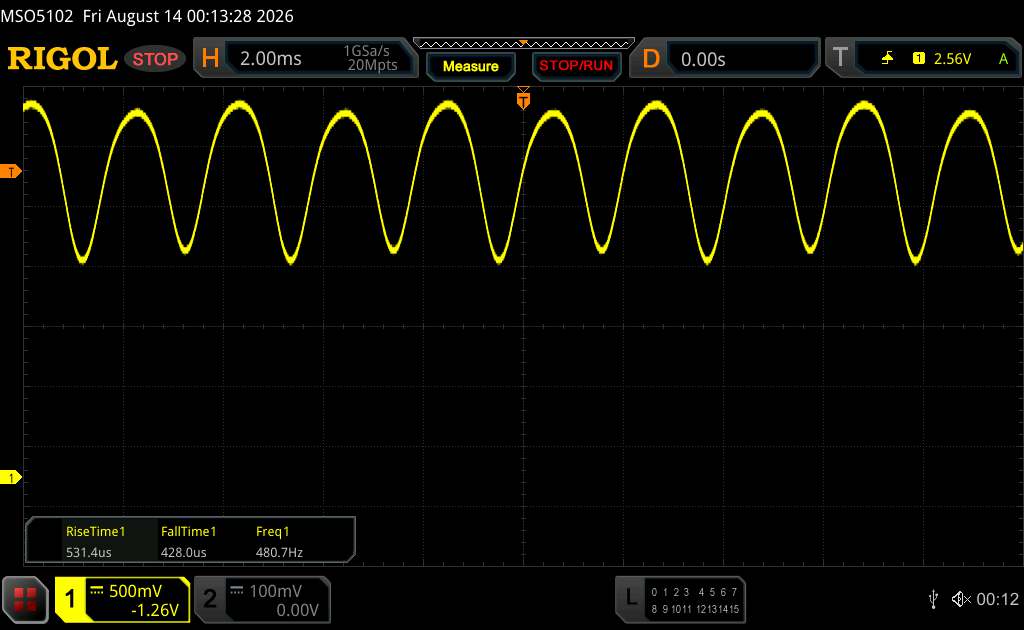
在固定缩放级别下、不同亮度设置下的测量数据序列(尽管在最低亮度下振幅曲线看似平坦,但这仅是缩放比例所致。信息框中显示了最低亮度下振幅的放大图。)


Display Response Times
| ↔ Response Time Black to White | ||
|---|---|---|
| 1.1 ms ... rise ↗ and fall ↘ combined | ↗ 0.5545 ms rise | 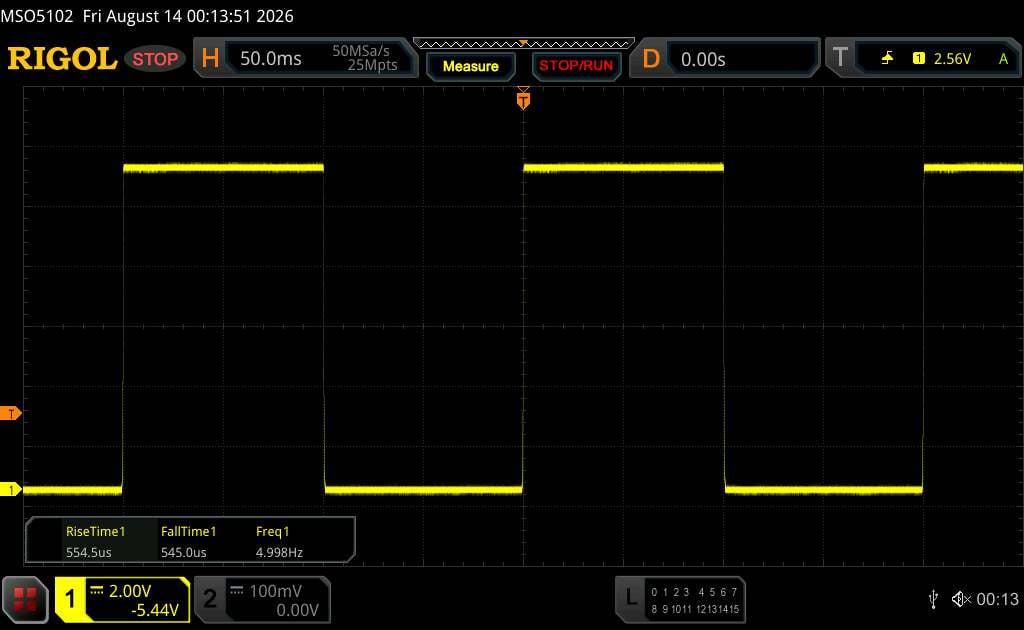 |
| ↘ 0.545 ms fall | ||
| The screen shows very fast response rates in our tests and should be very well suited for fast-paced gaming. In comparison, all tested devices range from 0.1 (minimum) to 240 (maximum) ms. » 5 % of all devices are better. This means that the measured response time is better than the average of all tested devices (19.7 ms). | ||
| ↔ Response Time 50% Grey to 80% Grey | ||
| 0.68 ms ... rise ↗ and fall ↘ combined | ↗ 0.3615 ms rise | 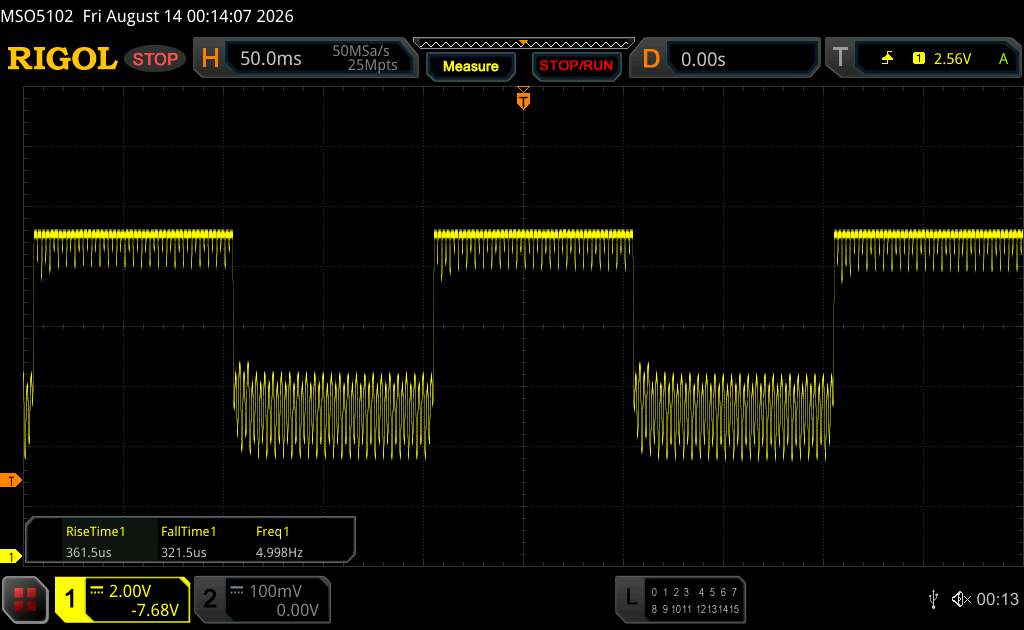 |
| ↘ 0.3215 ms fall | ||
| The screen shows very fast response rates in our tests and should be very well suited for fast-paced gaming. In comparison, all tested devices range from 0.13 (minimum) to 636 (maximum) ms. » 2 % of all devices are better. This means that the measured response time is better than the average of all tested devices (30.8 ms). | ||
封面展示
| Samsung Galaxy Z Flip8 1048x948, 4.1" | Samsung Galaxy Z Flip7 AMOLED, 1048x948, 4.1" | Motorola Razr 70 Plus x, | Motorola Razr 70 Ultra (Razr Ultra 2026) x, | |
|---|---|---|---|---|
| Display | -43% | -17% | ||
| APL18 Peak Brightness (cd/m²) | 1494 -43% | 2311 -12% | ||
| HDR Peak Brightness (cd/m²) | 2167 -22% | |||
| Response Times | -494% | 6% | ||
| Response Time Grey 50% / Grey 80% * (ms) | 4.28 ? -529% | |||
| Response Time Black / White * (ms) | 11.71 ? -965% | |||
| PWM Frequency (Hz) | 120 | 120 | ||
| PWM Amplitude * (%) | 14.25 11% | 15.04 6% | ||
| Screen | ||||
| Brightness middle (cd/m²) | 1475 | 1449 | 979 | 1002 |
| Black Level * (cd/m²) | ||||
| Brightness (cd/m²) | 1460 | |||
| Brightness Distribution (%) | 98 | |||
| Colorchecker dE 2000 * | 0.63 | 1.37 | ||
| Colorchecker dE 2000 max. * | 1.3 | 2.18 | ||
| Greyscale dE 2000 * | 0.9 | 1.4 | ||
| Gamma | 2.186 101% | 2.215 99% | ||
| CCT | 6634 98% | 6480 100% | ||
| Total Average (Program / Settings) | -269% /
-382% | -6% /
-9% |
* ... smaller is better
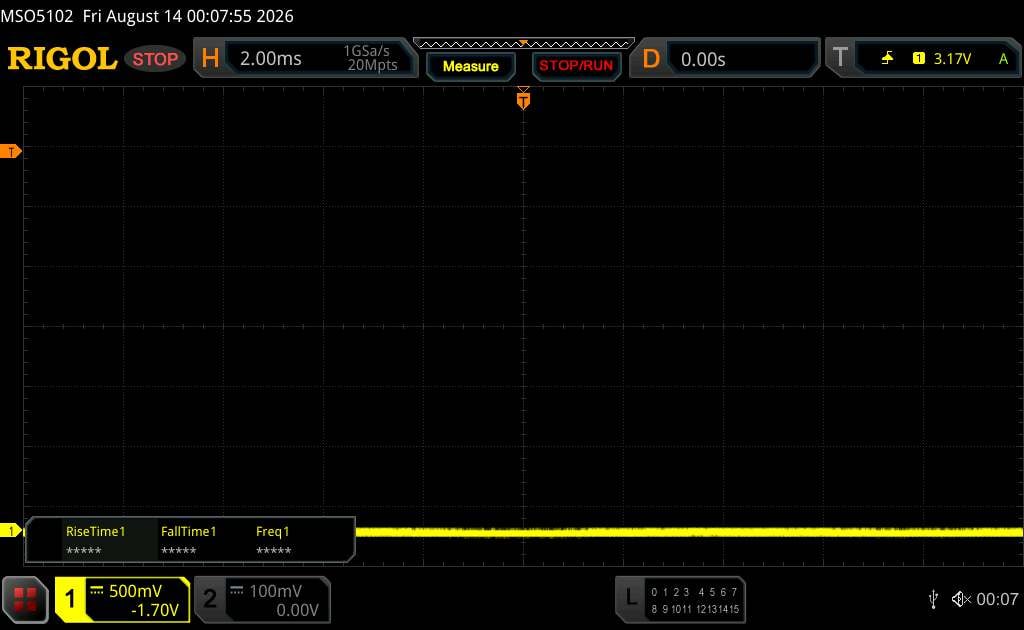
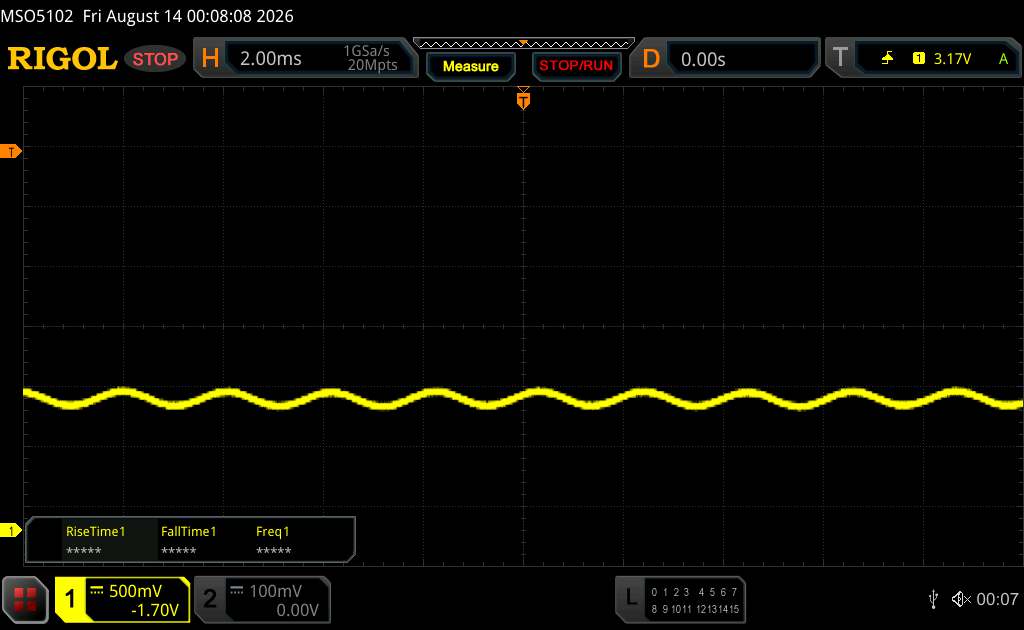
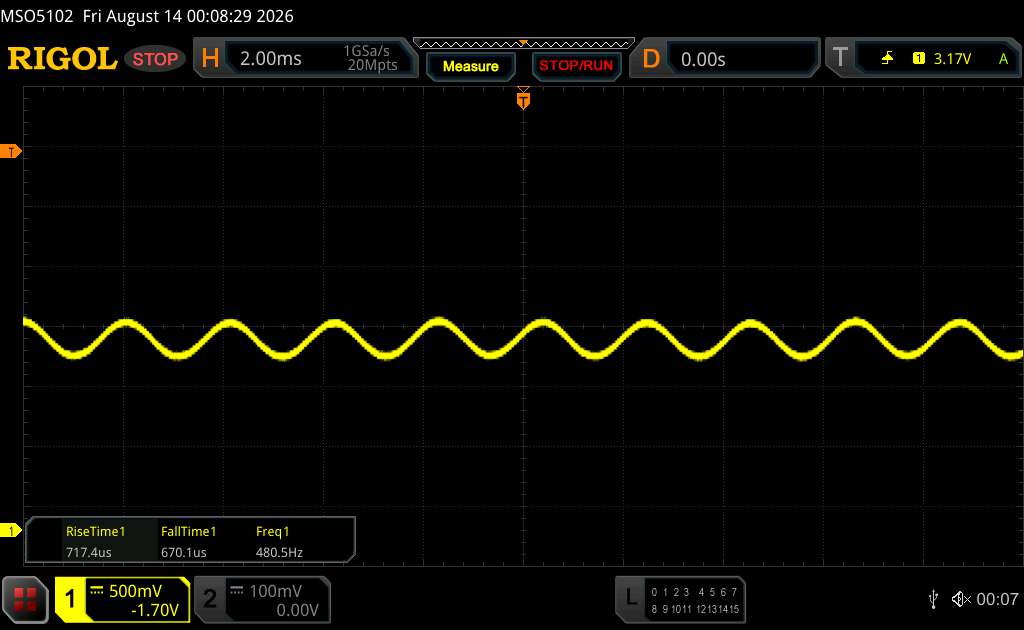
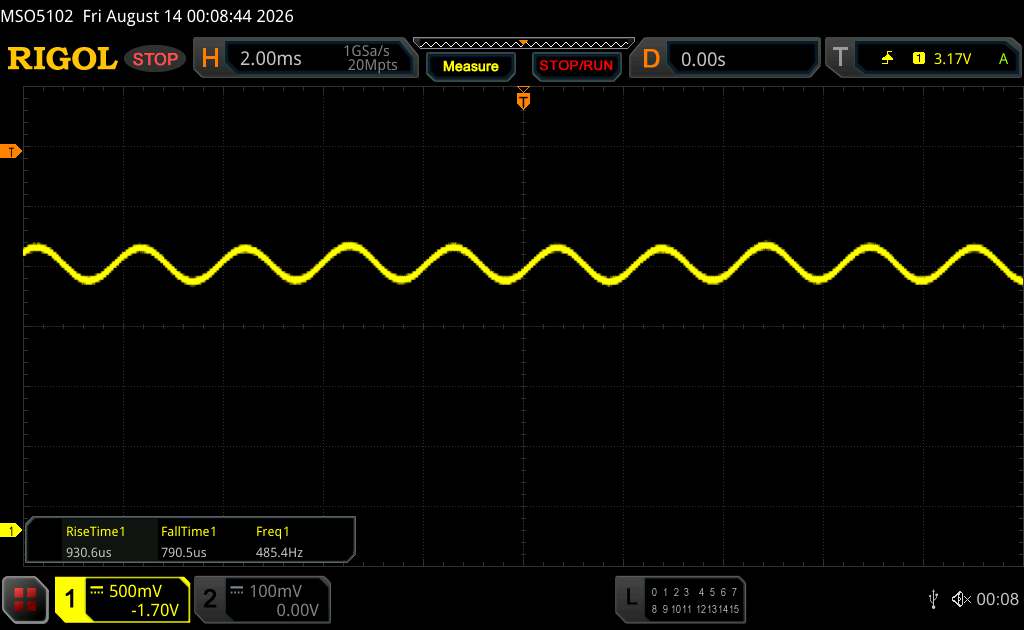
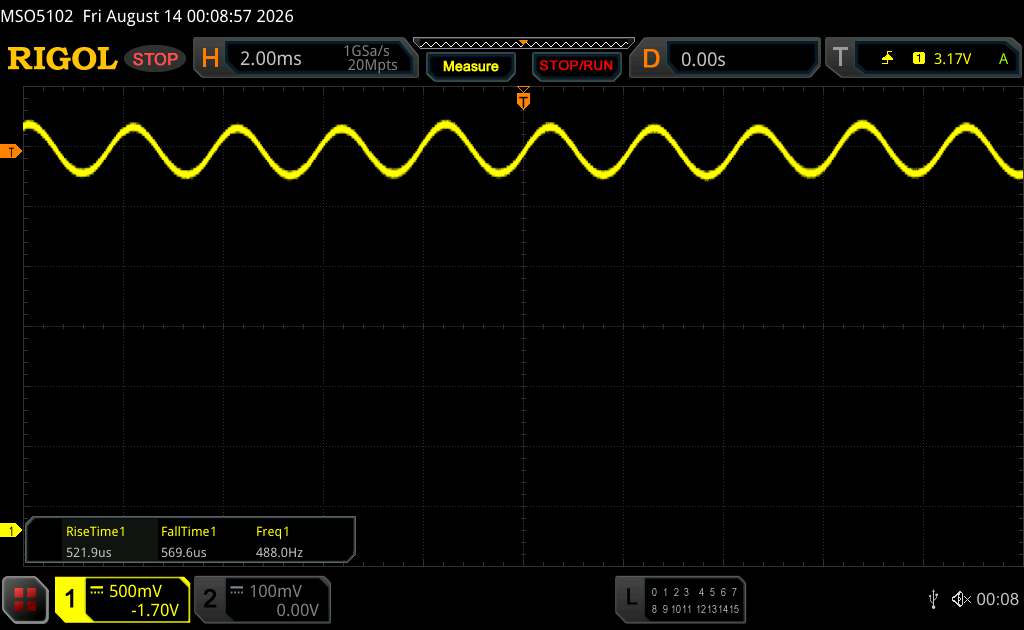
在固定缩放级别下、不同亮度设置下的测量数据序列(尽管在最低亮度下的振幅曲线看起来平坦,但这只是由于缩放比例所致。信息框中显示的是最低亮度下振幅的放大图。)
性能、排放和电池续航——搭载12 GB内存的三星高速芯片,性能卓越
Galaxy Z Flip7 的继任机型再次搭载了三星自研芯片。Exynos 2600 在我们的基准测试中表现优异,但速度略逊于 Galaxy S26+。特别是在图形测试中,Xclipse 960 的性能明显优于去年的 GPU。
遗憾的是,在电池方面并未取得任何进展。4,300 mAh 的容量依然偏低,而 25 瓦的充电速度较慢,设备需要连接充电器近 1.5 小时才能充满。
| Samsung Galaxy Z Flip8 | Motorola Razr 70 Plus | Xiaomi Mix Flip 2 | Samsung Galaxy Z Flip7 | Motorola Razr 70 Ultra (Razr Ultra 2026) | Average 256 GB UFS 4.0 Flash | Average of class Smartphone | |
|---|---|---|---|---|---|---|---|
| AndroBench 3-5 | -7% | 0% | -24% | -19% | -19% | -38% | |
| Sequential Read 256KB (MB/s) | 3878.32 | 3956.8 2% | 4083.53 5% | 4044.67 4% | 3611.3 -7% | 3615 ? -7% | 2277 ? -41% |
| Sequential Write 256KB (MB/s) | 3178.91 | 3864 22% | 3894.12 22% | 2981.82 -6% | 3423.9 8% | 2641 ? -17% | 1960 ? -38% |
| Random Read 4KB (MB/s) | 421.85 | 359.4 -15% | 403.94 -4% | 366.98 -13% | 315.4 -25% | 391 ? -7% | 315 ? -25% |
| Random Write 4KB (MB/s) | 698.44 | 455.7 -35% | 534.73 -23% | 143.67 -79% | 351 -50% | 394 ? -44% | 361 ? -48% |
(-) The maximum temperature on the upper side is 47.9 °C / 118 F, compared to the average of 35.3 °C / 96 F, ranging from 21.9 to 247 °C for the class Smartphone.
(-) The bottom heats up to a maximum of 46.4 °C / 116 F, compared to the average of 34.1 °C / 93 F
3DMark 压力测试
| 3DMark | |
| Wild Life Stress Test Stability | |
| Motorola Razr 70 Plus | |
| Samsung Galaxy Z Flip7 | |
| Samsung Galaxy Z Flip8 | |
| Steel Nomad Light Stress Test Stability | |
| Samsung Galaxy Z Flip7 | |
| Samsung Galaxy Z Flip8 | |
Samsung Galaxy Z Flip8 audio analysis
(+) | speakers can play relatively loud (91.8 dB)
Bass 100 - 315 Hz
(-) | nearly no bass - on average 19.4% lower than median
(+) | bass is linear (6.1% delta to prev. frequency)
Mids 400 - 2000 Hz
(±) | higher mids - on average 7.7% higher than median
(±) | linearity of mids is average (7.8% delta to prev. frequency)
Highs 2 - 16 kHz
(±) | higher highs - on average 6.2% higher than median
(+) | highs are linear (4.7% delta to prev. frequency)
Overall 100 - 16.000 Hz
(±) | linearity of overall sound is average (18.1% difference to median)
Compared to same class
» 17% of all tested devices in this class were better, 9% similar, 74% worse
» The best had a delta of 11%, average was 34%, worst was 136%
Compared to all devices tested
» 39% of all tested devices were better, 8% similar, 53% worse
» The best had a delta of 4%, average was 23%, worst was 136%
Motorola Razr 70 Plus audio analysis
(±) | speaker loudness is average but good (80.2 dB)
Bass 100 - 315 Hz
(-) | nearly no bass - on average 27.1% lower than median
(-) | bass is not linear (18.4% delta to prev. frequency)
Mids 400 - 2000 Hz
(±) | higher mids - on average 7.7% higher than median
(±) | linearity of mids is average (12.1% delta to prev. frequency)
Highs 2 - 16 kHz
(±) | higher highs - on average 9.9% higher than median
(±) | linearity of highs is average (13.1% delta to prev. frequency)
Overall 100 - 16.000 Hz
(-) | overall sound is not linear (33.8% difference to median)
Compared to same class
» 84% of all tested devices in this class were better, 1% similar, 14% worse
» The best had a delta of 11%, average was 34%, worst was 136%
Compared to all devices tested
» 93% of all tested devices were better, 1% similar, 6% worse
» The best had a delta of 4%, average was 23%, worst was 136%
| Off / Standby |   0.06 / 0.2 Watt 0.06 / 0.2 Watt |
| Idle |  0.55 / 1.17 / 1.3 Watt 0.55 / 1.17 / 1.3 Watt |
    
| |
Key:
min: ,
med: ,
max: Metrahit Energy | |
| Samsung Galaxy Z Flip8 4300 mAh | Motorola Razr 70 Plus 4500 mAh | Samsung Galaxy Z Flip7 4300 mAh | Average Samsung Exynos 2600 | Average of class Smartphone | |
|---|---|---|---|---|---|
| Power Consumption | -60% | 20% | 8% | -37% | |
| Idle Minimum * (Watt) | 0.55 | 1 -82% | 0.49 11% | 0.52 ? 5% | 0.878 ? -60% |
| Idle Average * (Watt) | 1.17 | 1.6 -37% | 0.87 26% | 1.067 ? 9% | 1.455 ? -24% |
| Idle Maximum * (Watt) | 1.3 | 2.1 -62% | 0.99 24% | 1.18 ? 9% | 1.65 ? -27% |
* ... smaller is better
| Battery runtime - WiFi v1.3 | |
| Samsung Galaxy Z Flip8 | |
| Motorola Razr 70 Plus | |
| Xiaomi Mix Flip 2 | |
| Samsung Galaxy Z Flip7 | |
Notebookcheck 综合评分
任何正在寻找新款翻盖手机的人,都会在这款全新的三星机型中找到市场上最佳的选择。然而,Galaxy Z Flip8 与其前代机型之间的差异微乎其微,其“主导地位”在很大程度上归因于缺乏竞争对手。

Samsung Galaxy Z Flip8
- 09/11/2026 v8
Marcus Herbrich
 Total Sustainability Score:
 可能替代方案的比较
Image | Model / Review | Price | Weight | Drive | Display |
|---|---|---|---|---|---|
1. 86.3%  | Samsung Galaxy Z Flip8 Samsung Exynos 2600 ⎘ Samsung Xclipse 960 ⎘ 12 GB Memory, 256 GB UFS 4.x | List Price: 1299€ | 180 g | 256 GB UFS 4.0 Flash | 6.90" 2520x1080 397 PPI Super AMOLED |
2. 79.7%  | Motorola Razr 70 Plus Qualcomm Snapdragon 8s Gen 3 ⎘ Qualcomm Adreno 735 ⎘ 12 GB Memory, 512 GB UFS 4.x | List Price: 1000€ | 189 g | 512 GB UFS 4.1 Flash | 6.90" 2640x1084 414 PPI AMOLED |
3. 85.9%  | Xiaomi Mix Flip 2 Qualcomm Snapdragon 8 Elite ⎘ Qualcomm Adreno 830 ⎘ 12 GB Memory, 512 GB UFS 4.x | Amazon: 1. $1,567.49 Samsung Galaxy Z Fold8, 256G... 2. $354.99 Motorola razr | 2024 | Unloc... 3. $289.75 XIAOMI Redmi Pad 2 PRO Only ... List Price: 970€ | 199 g | 512 GB UFS 4.1 Flash | 6.86" 2912x1224 460 PPI AMOLED |
4. 86.2%  | Samsung Galaxy Z Flip7 Samsung Exynos 2500 ⎘ Samsung Xclipse 950 ⎘ 12 GB Memory, 256 GB UFS 4.x | List Price: 1199€ | 188 g | 256 GB UFS 4.0 Flash | 6.90" 2520x1080 397 PPI AMOLED |
Transparency
The selection of devices to be reviewed is made by our editorial team. The test sample was provided to the author as a loan by the manufacturer or retailer for the purpose of this review. The lender had no influence on this review, nor did the manufacturer receive a copy of this review before publication. There was no obligation to publish this review. As an independent media company, Notebookcheck is not subjected to the authority of manufacturers, retailers or publishers.
This is how Notebookcheck is testing
Every year, Notebookcheck independently reviews hundreds of laptops and smartphones using standardized procedures to ensure that all results are comparable. We have continuously developed our test methods for around 20 years and set industry standards in the process. In our test labs, high-quality measuring equipment is utilized by experienced technicians and editors. These tests involve a multi-stage validation process. Our complex rating system is based on hundreds of well-founded measurements and benchmarks, which maintains objectivity. Further information on our test methods can be found here.
 Add as a preferred source on Google