BMAX X14 Pro笔记本电脑回顾。诱人的AMD Ryzen 5,价格低于500美元
14英寸Max X14 Pro副笔记本紧随11.6英寸MaxBook Y11的脚步。 笔记本电脑Y11两年前推出的可转换笔记本。两者都是各自类别中的经济型机型,旨在比相同价格范围内的竞争机型拥有更有吸引力的铝制外形。
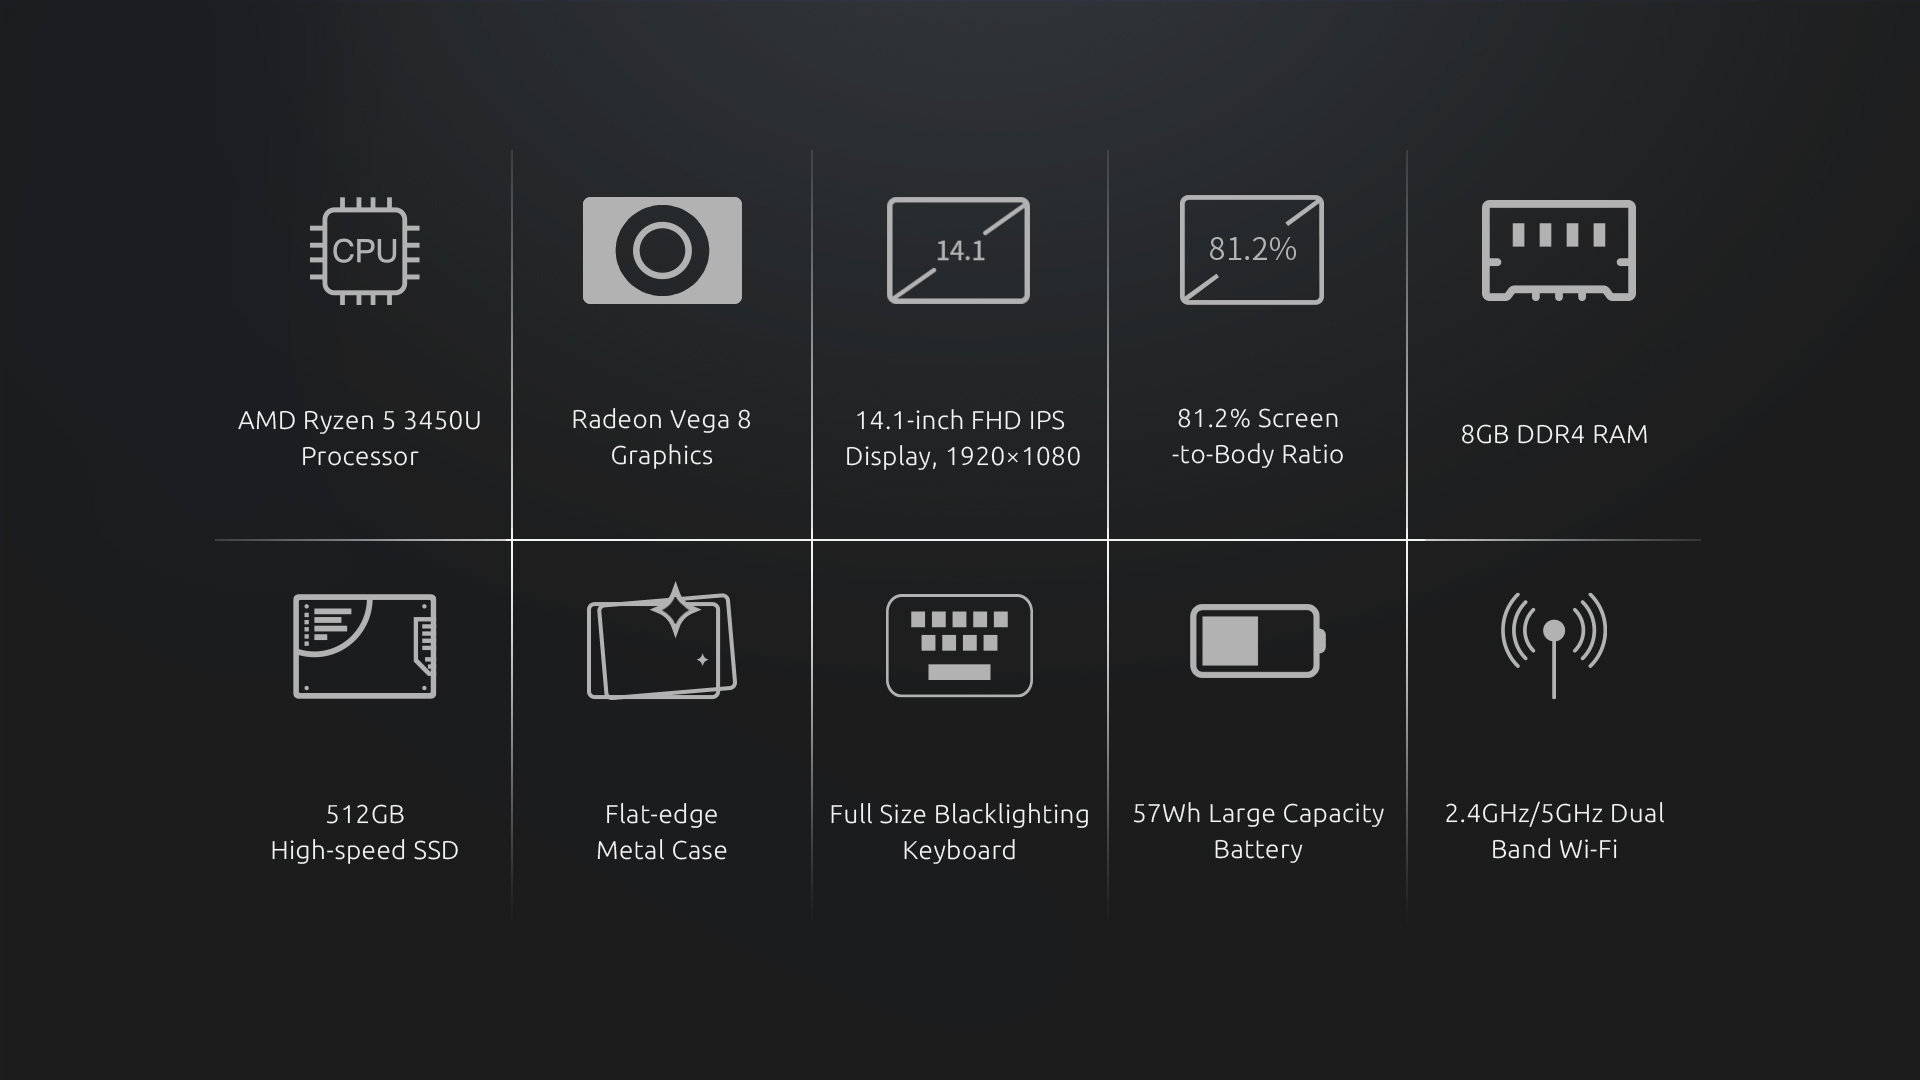
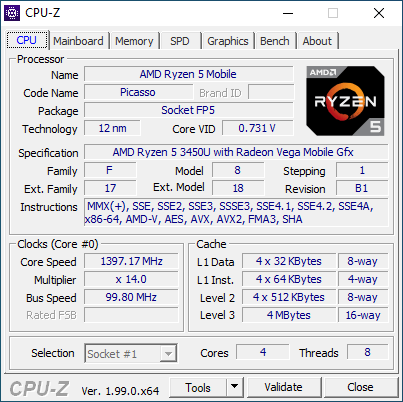
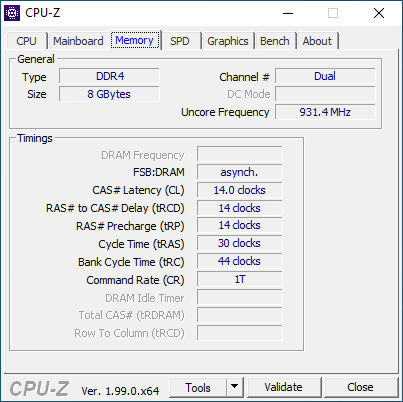
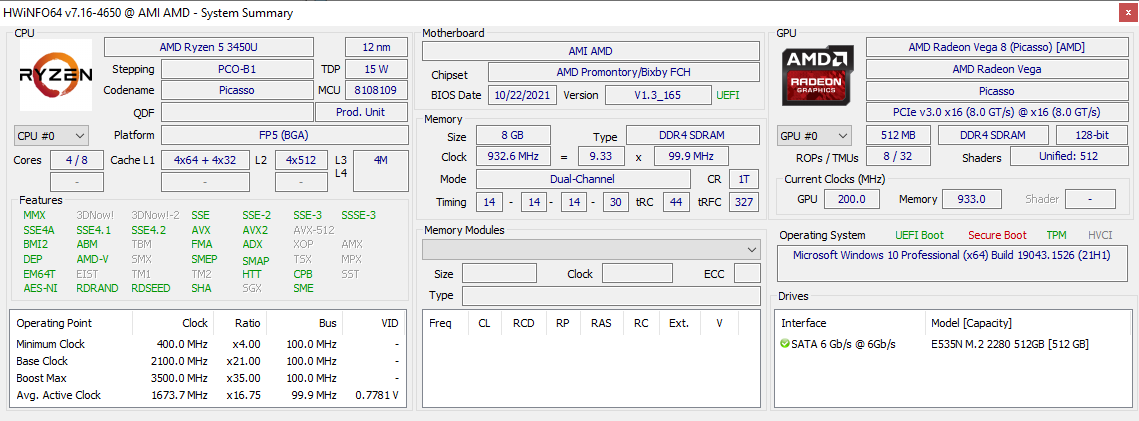
在内部,BMax X14 Pro采用了较早但相对不常见的AMD Zen+ Ryzen 5 3450UCPU,这应该是在竞争的500美元以下笔记本电脑上常见的任何赛扬或Atom解决方案的升级。其他功能包括1080p IPS显示屏、背光键盘和宽敞的512GB SSD,这些都是比较典型的高价笔记本电脑。
X14 Pro的替代品包括其他廉价的14英寸机型,如 华硕VivoBook系列, 联想IdeaPad 3系列, 英菲尼克斯INBook X2, 创维CoreBook X, 或 戴尔 Inspiron 14 3000系列.
潜在的竞争对手比较
Rating | Date | Model | Weight | Height | Size | Resolution | Price |
|---|---|---|---|---|---|---|---|
| 76 % v7 (old) | 02 / 2022 | BMAX X14 Pro R5 3450U, Vega 8 | 1.4 kg | 18.3 mm | 14.00" | 1920x1080 | |
| 85.5 % v7 (old) | 11 / 2021 | Lenovo IdeaPad 5 Pro 14ACN6 R5 5600U, Vega 7 | 1.5 kg | 17.9 mm | 14.00" | 2240x1400 | |
| 82.9 % v7 (old) | 09 / 2021 | Dell Inspiron 14 7400 7415 2-in-1 R7 5700U, Vega 8 | 1.5 kg | 17.95 mm | 14.00" | 1920x1080 | |
| 84.8 % v7 (old) | 01 / 2022 | HP Pavilion 14-dv0357ng i5-1135G7, Iris Xe G7 80EUs | 1.4 kg | 19 mm | 14.00" | 1920x1080 | |
| 86.3 % v7 (old) | 12 / 2020 | Huawei MateBook 14 2020 Intel i7-10510U, GeForce MX350 | 1.5 kg | 15.9 mm | 14.00" | 2160x1440 | |
| 79.5 % v7 (old) | 01 / 2022 | Infinix INBook X2 i7-1065G7, Iris Plus Graphics G7 (Ice Lake 64 EU) | 1.2 kg | 14.8 mm | 14.00" | 1920x1080 |
案例
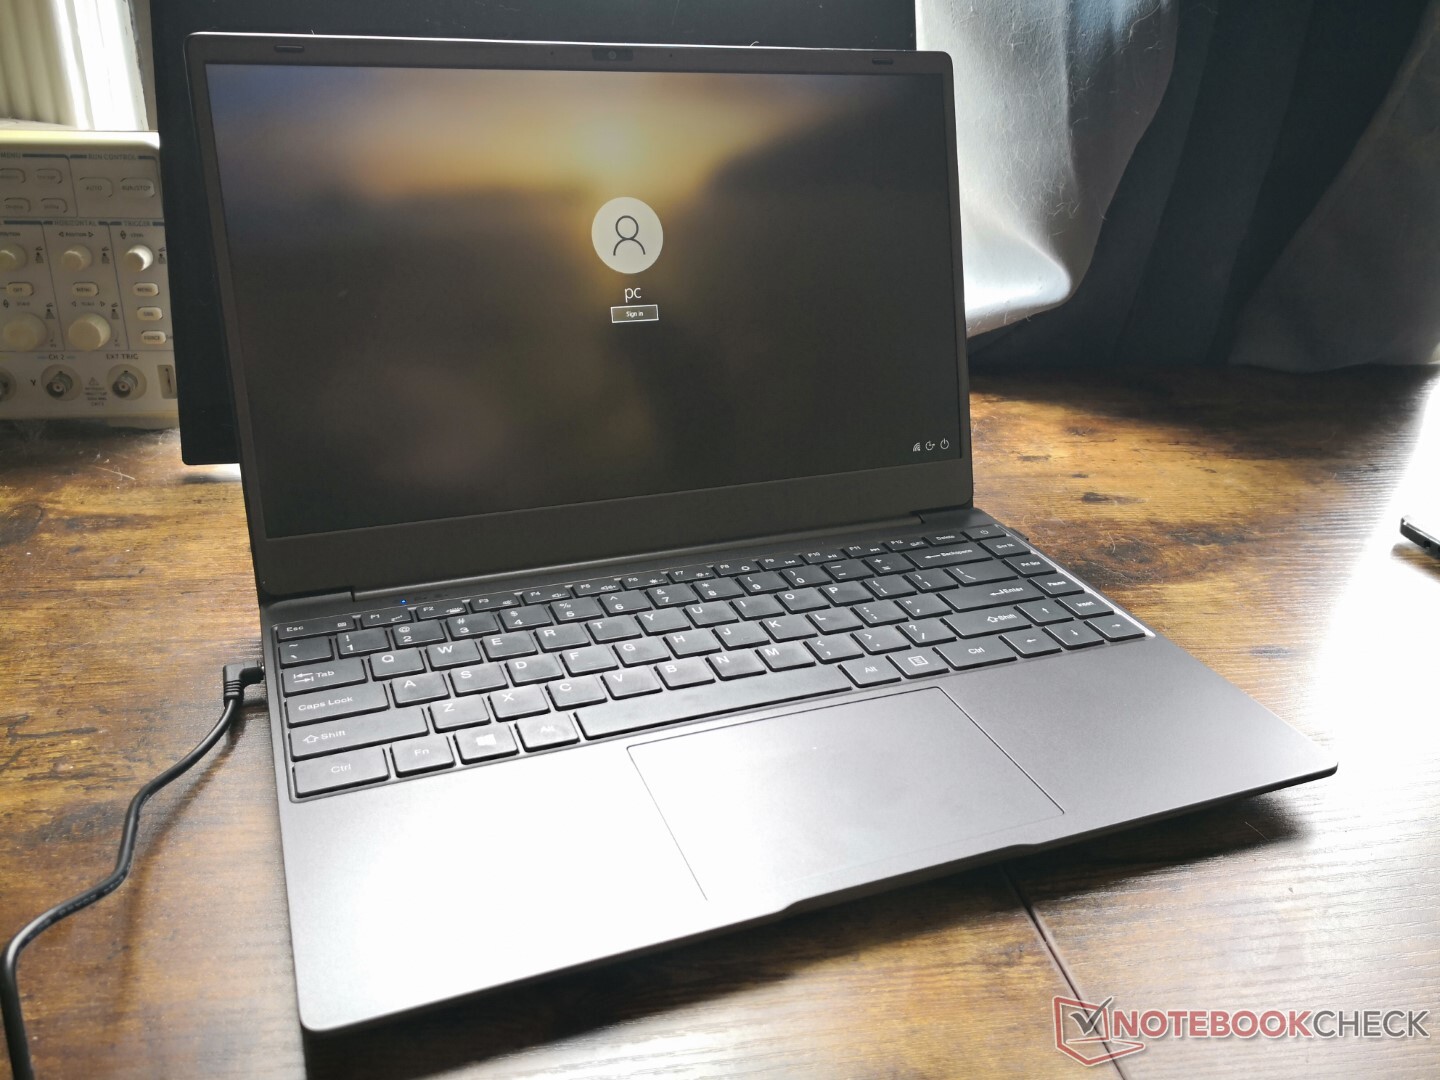
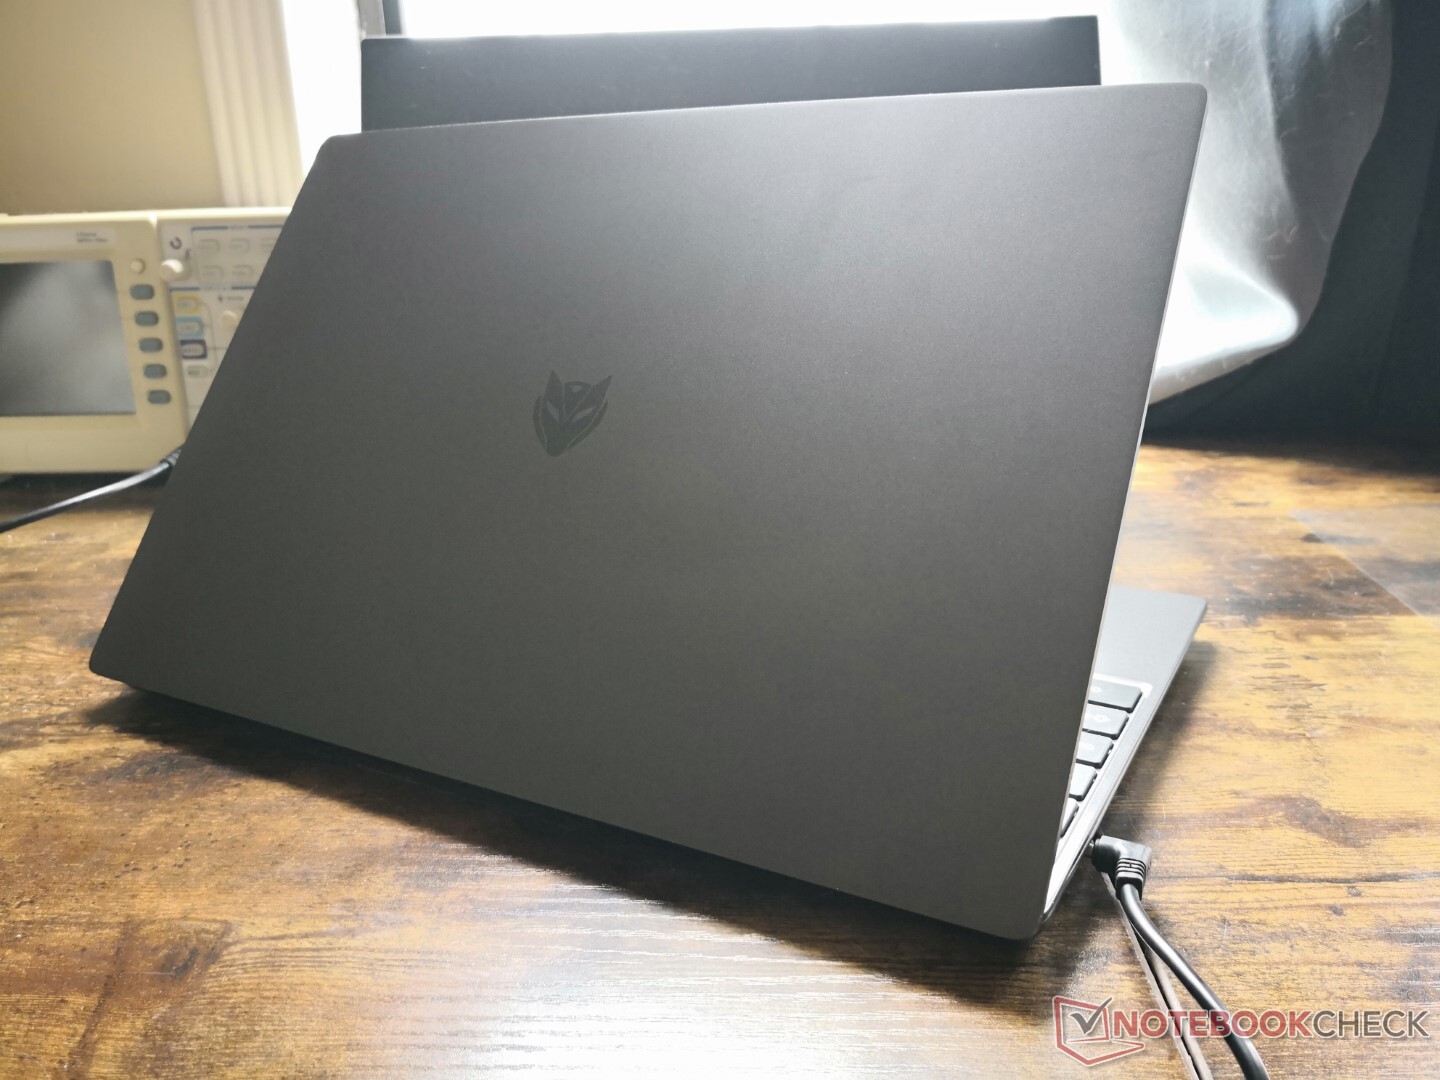
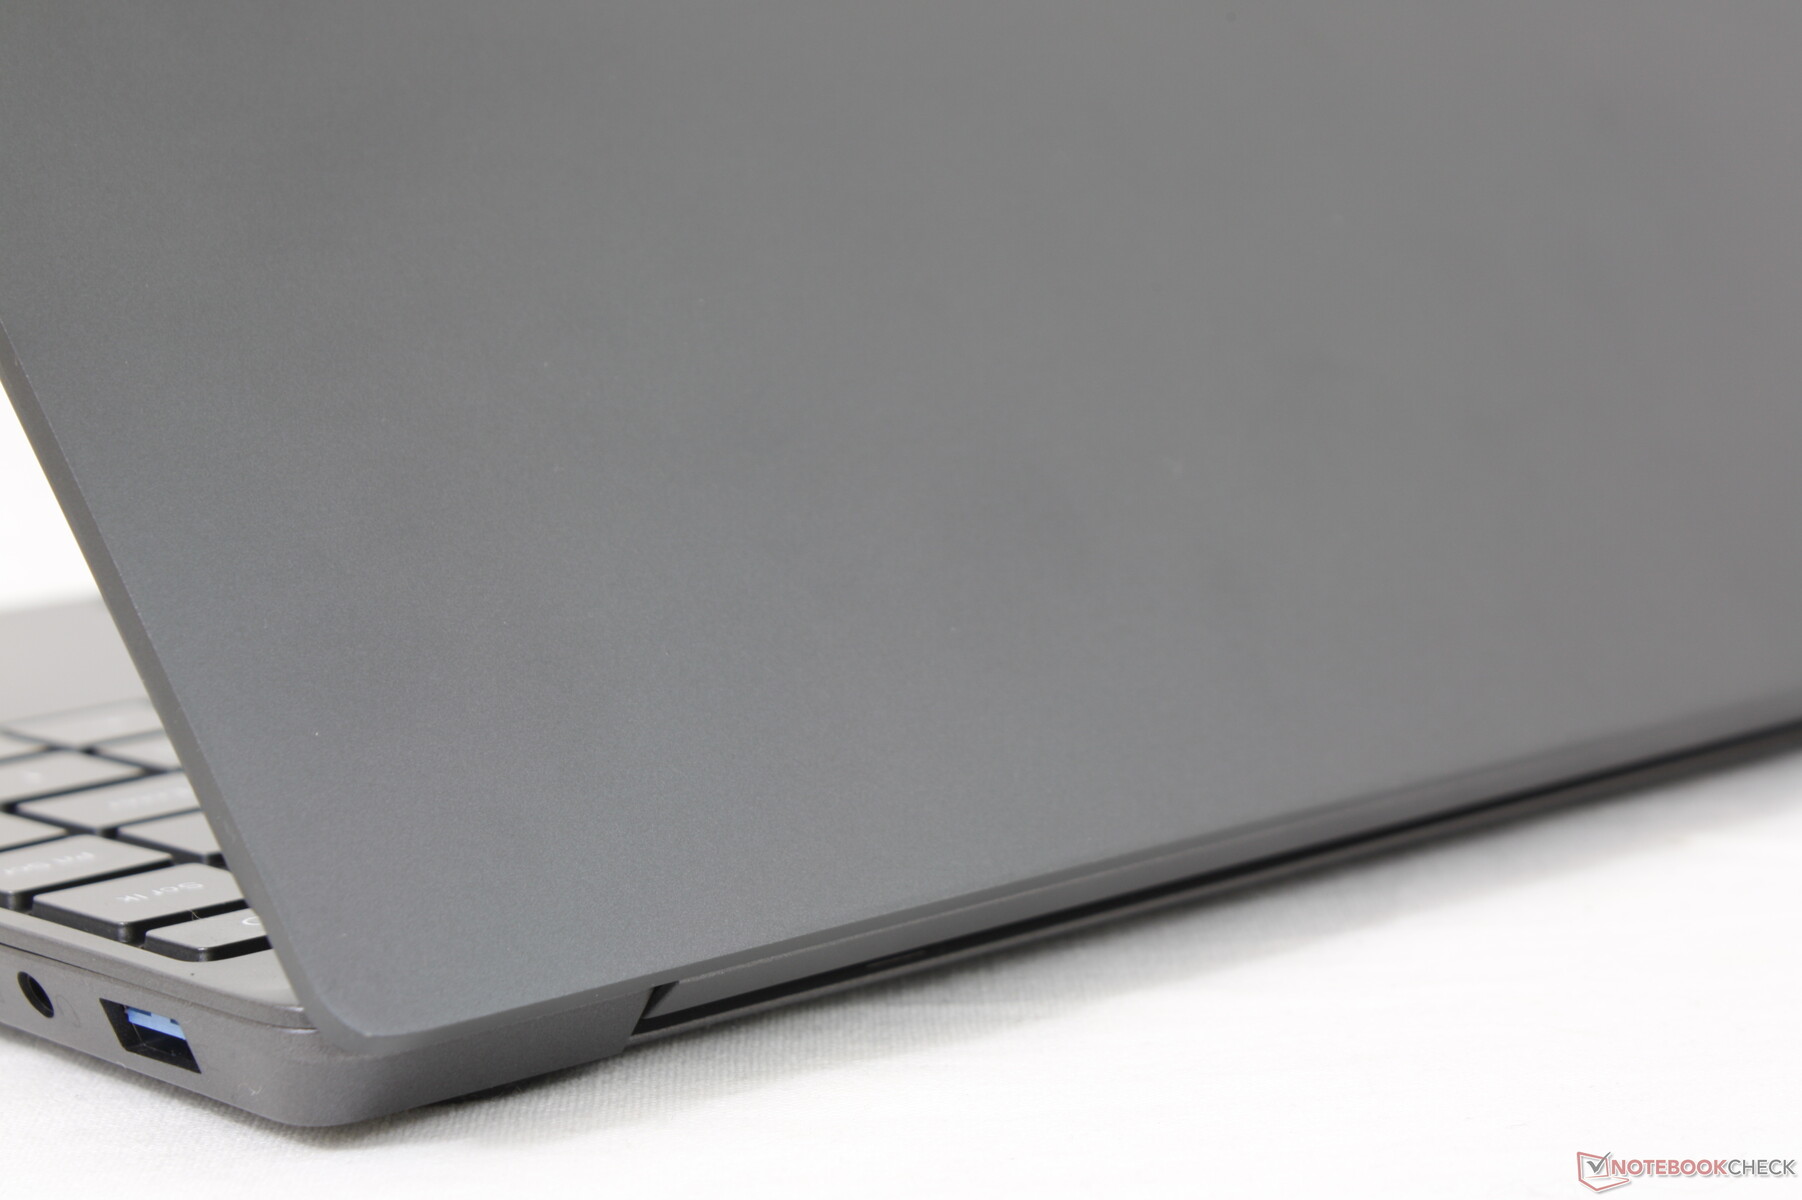
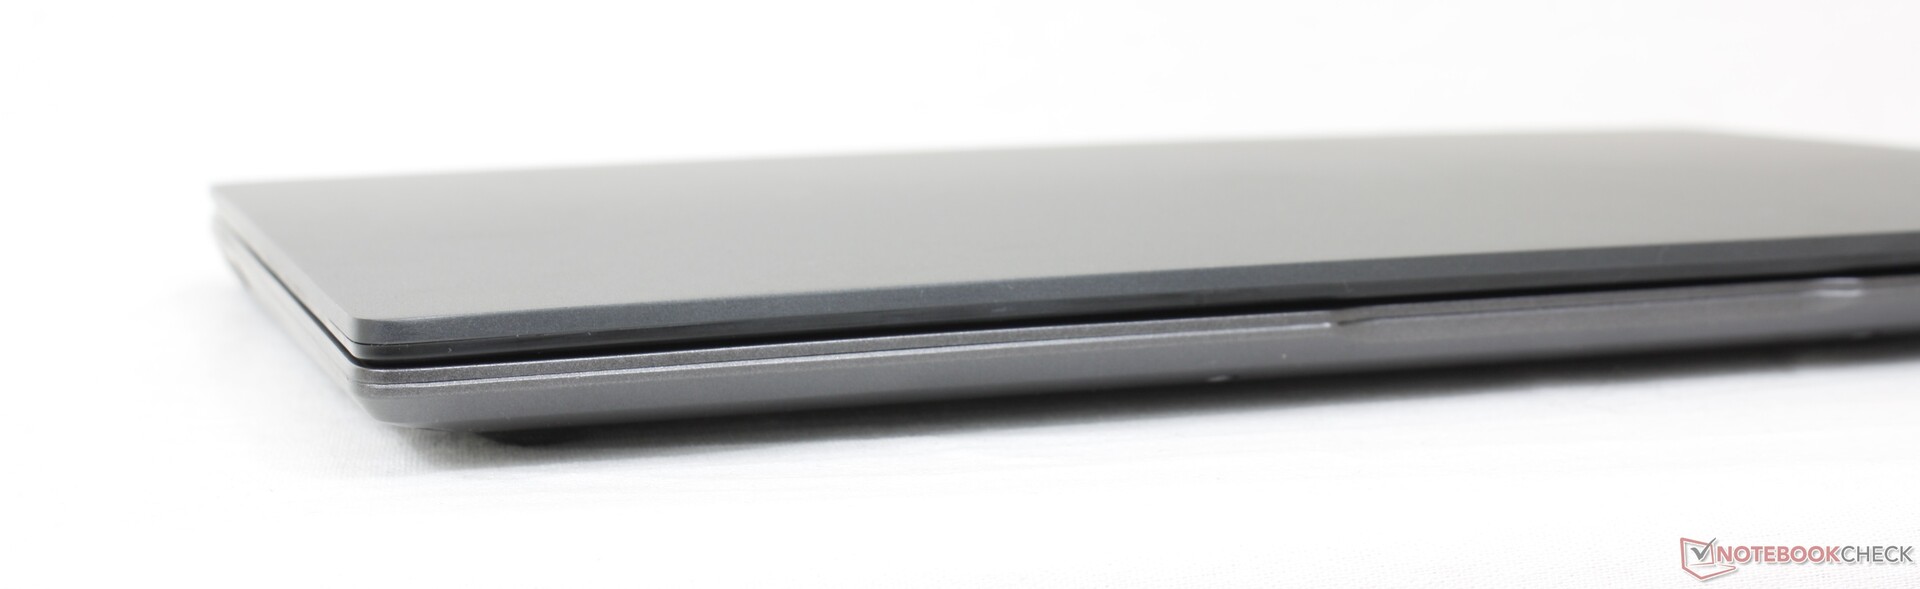
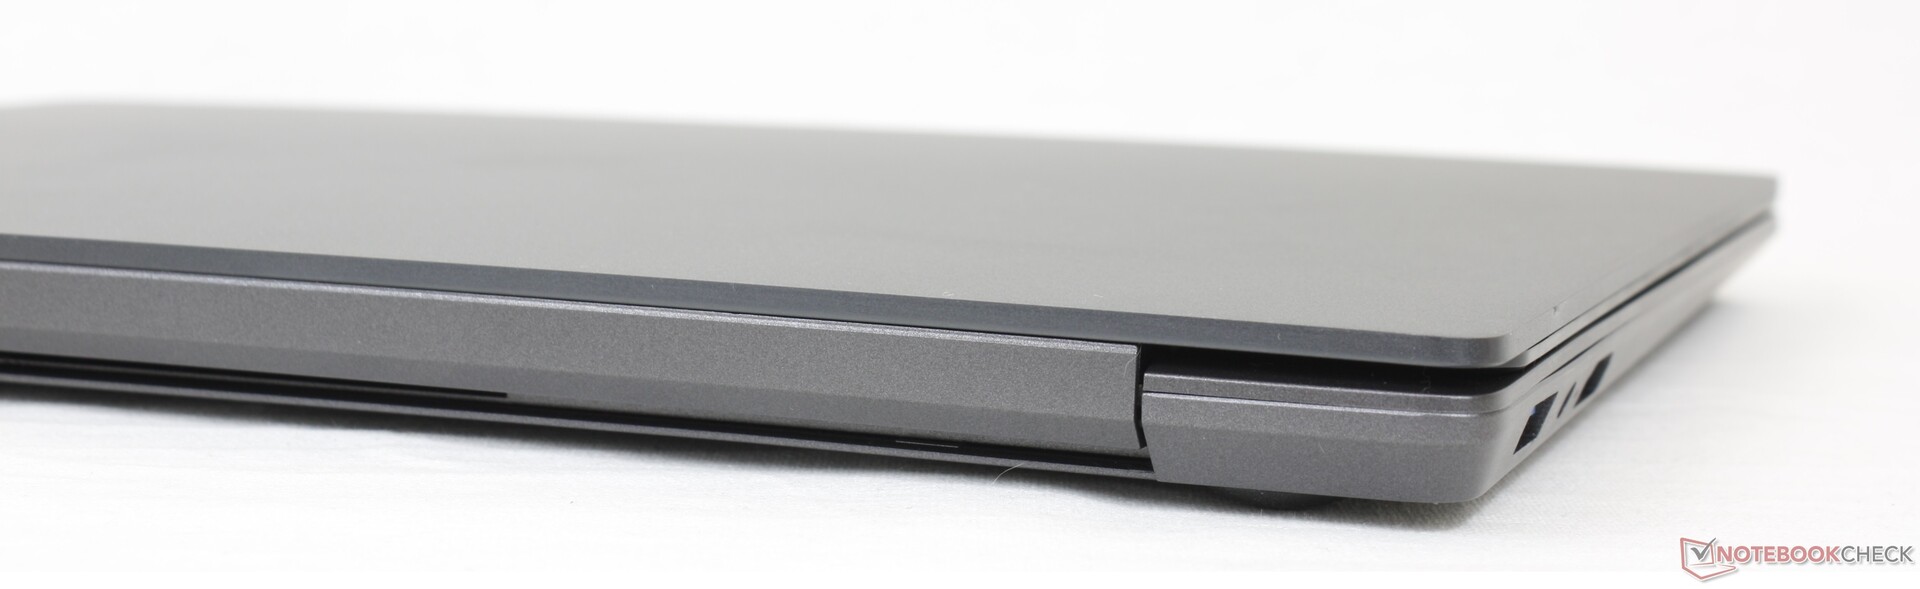
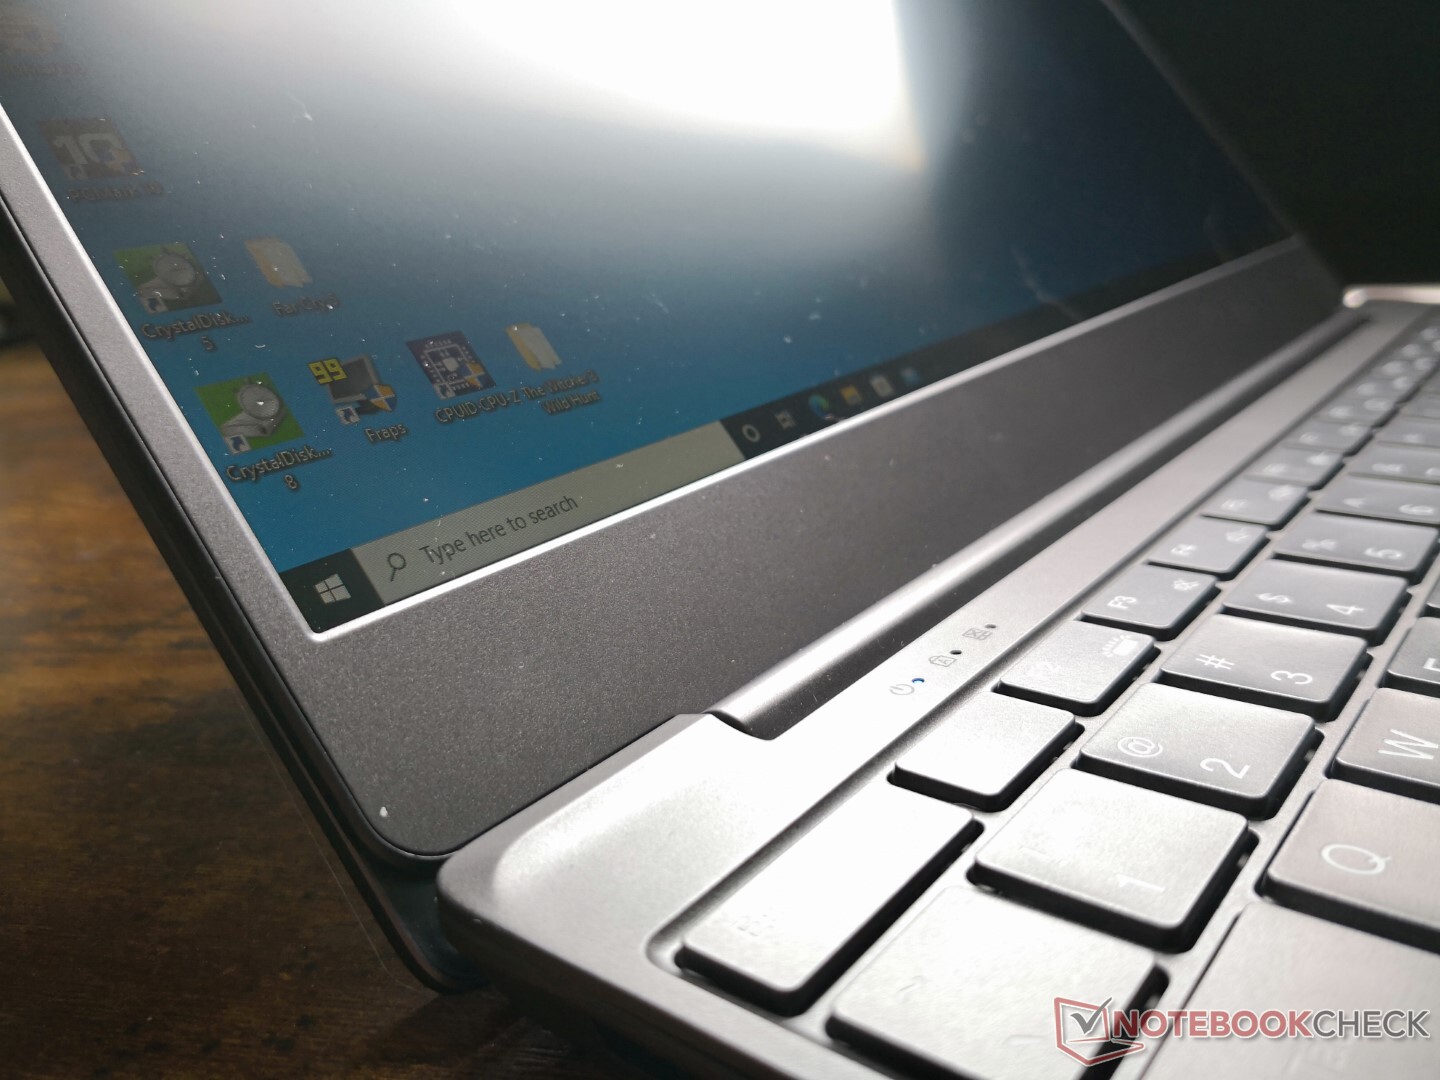
从远处看,机箱看起来很好,就像许多Chuwi笔记本电脑一样。然而,它的弱点一旦被握住就变得更加明显,因为金属底盘比戴尔XPS、惠普Spectre或华硕ZenBook的金属骨架更容易弯曲和嘎吱作响。底座的四角、键盘中心、外盖和铰链都表现出适度的扭曲。因此,虽然X14 Pro看起来像一台零售价超过500美元的笔记本电脑,但它也没有比其他廉价机型如华硕VivoBook或 联想IdeaPad 3 14这些机型主要是塑料的。
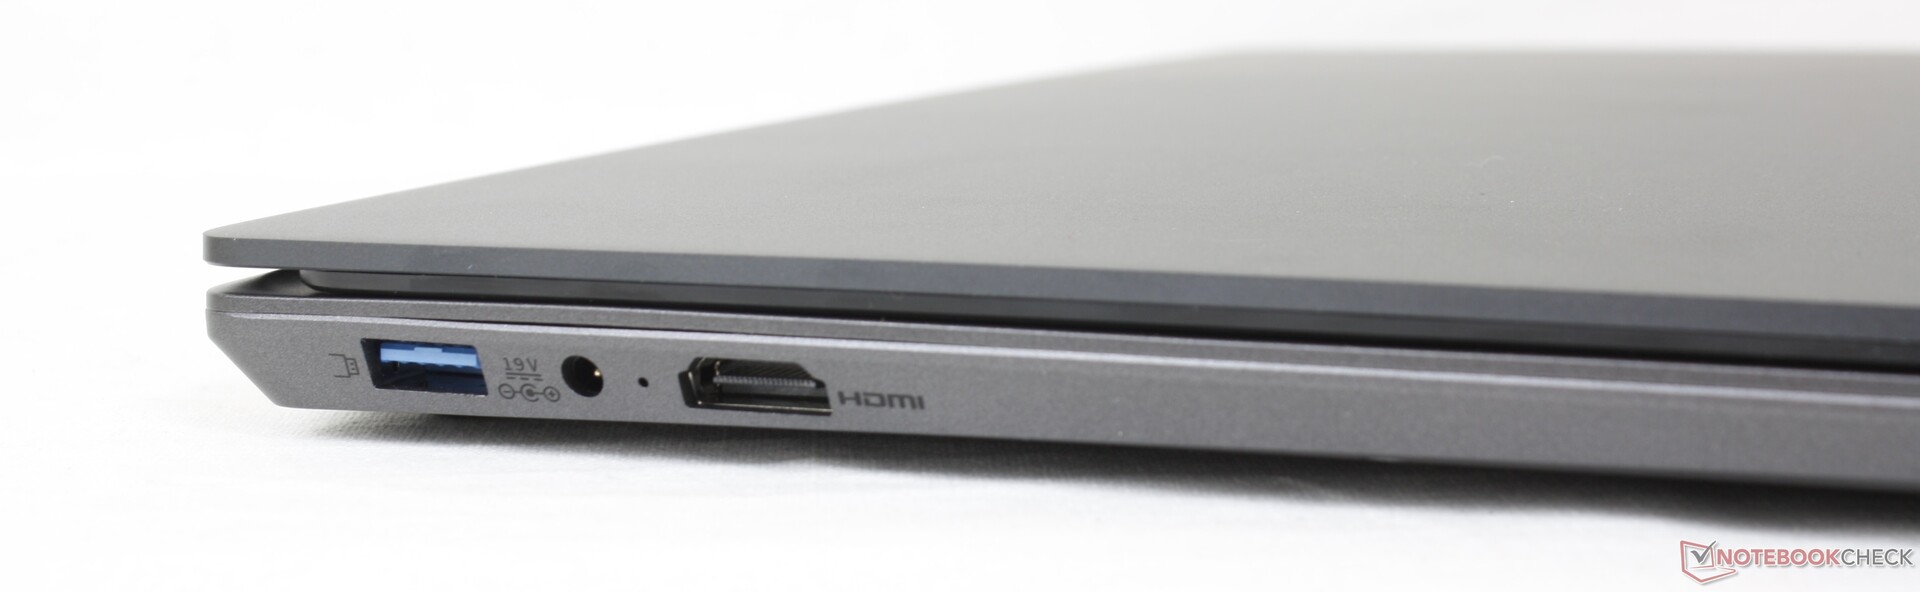
连接性
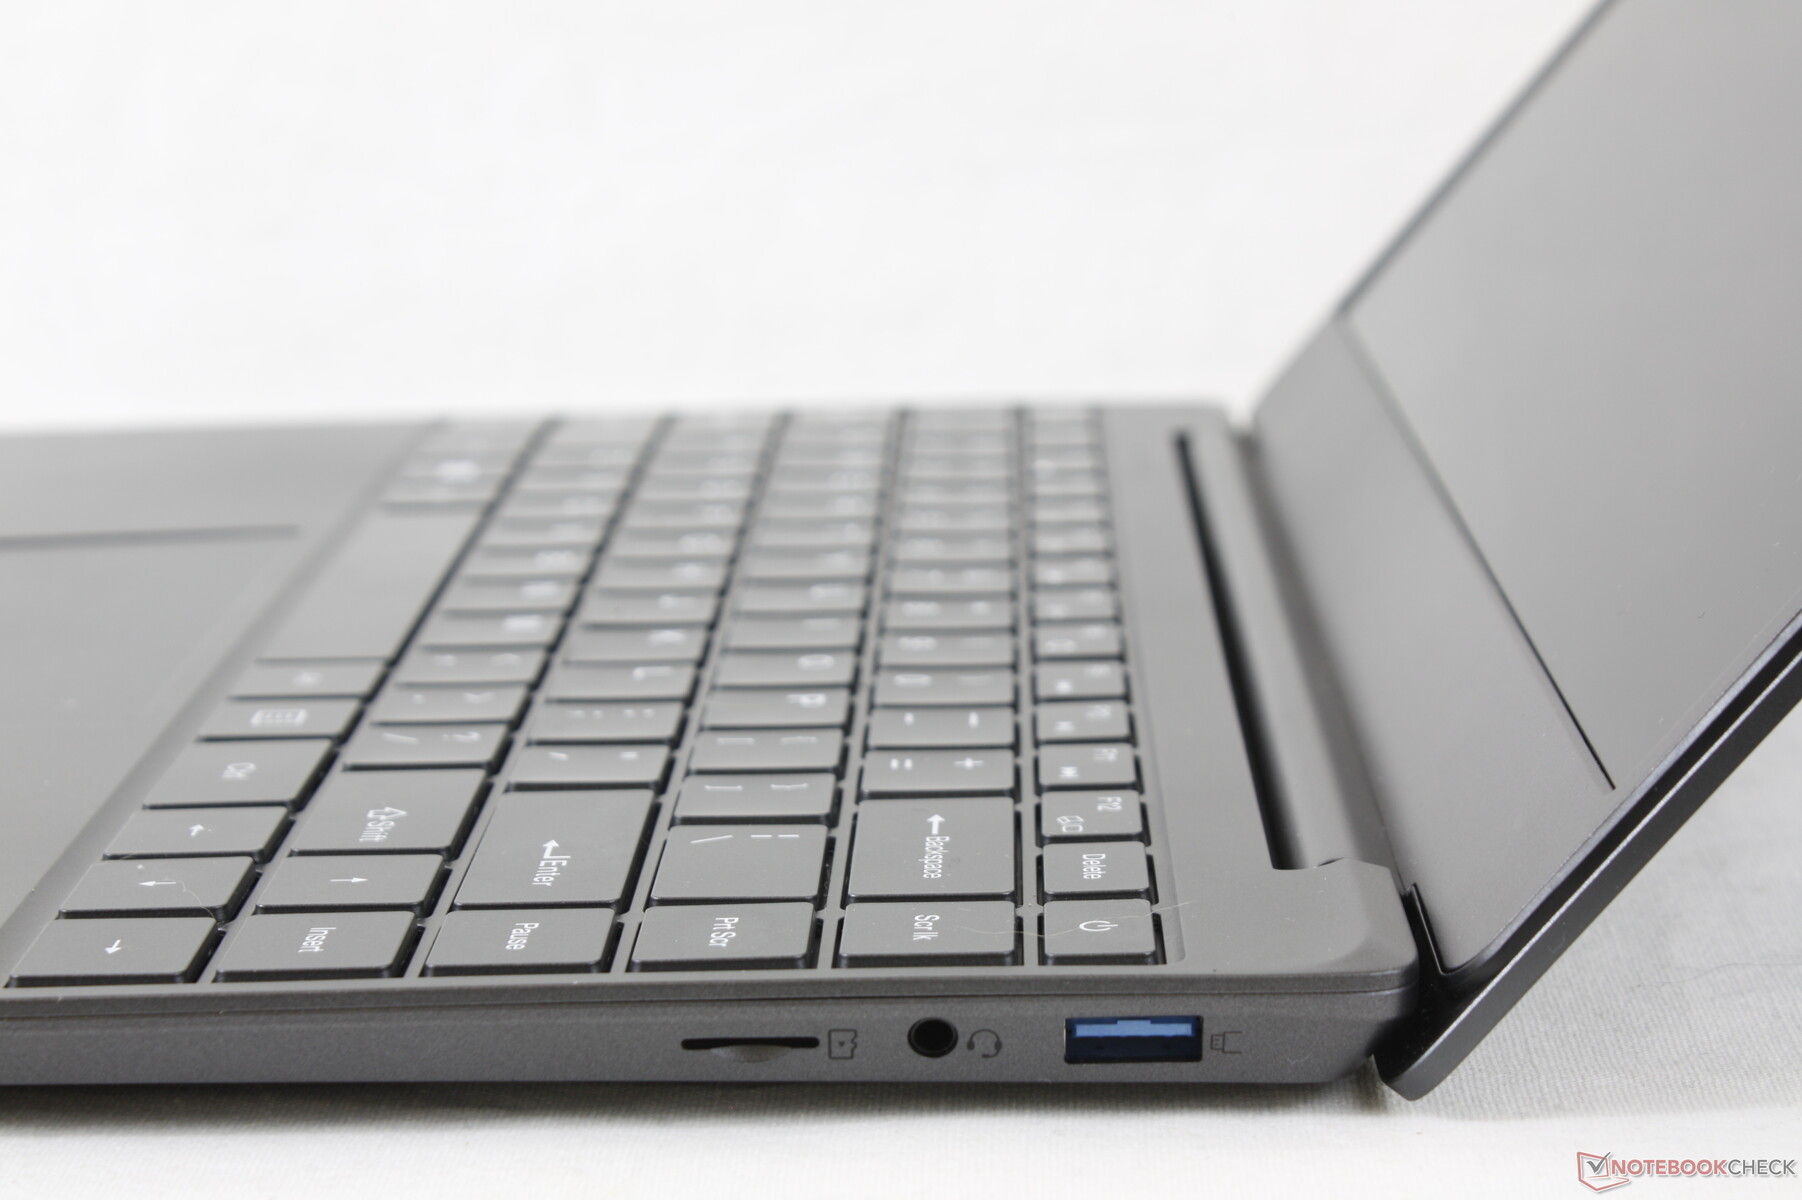
对于一台14英寸的笔记本电脑来说,端口选择是合理的,尽管位置可能相当紧张。例如,沿着左侧边缘的电缆会经常纠缠在一起。
BMax没有宣传HDMI端口的版本,但我们可以确认它是一个HDMI 2.0端口,因为它支持4K和60Hz的外部显示器。
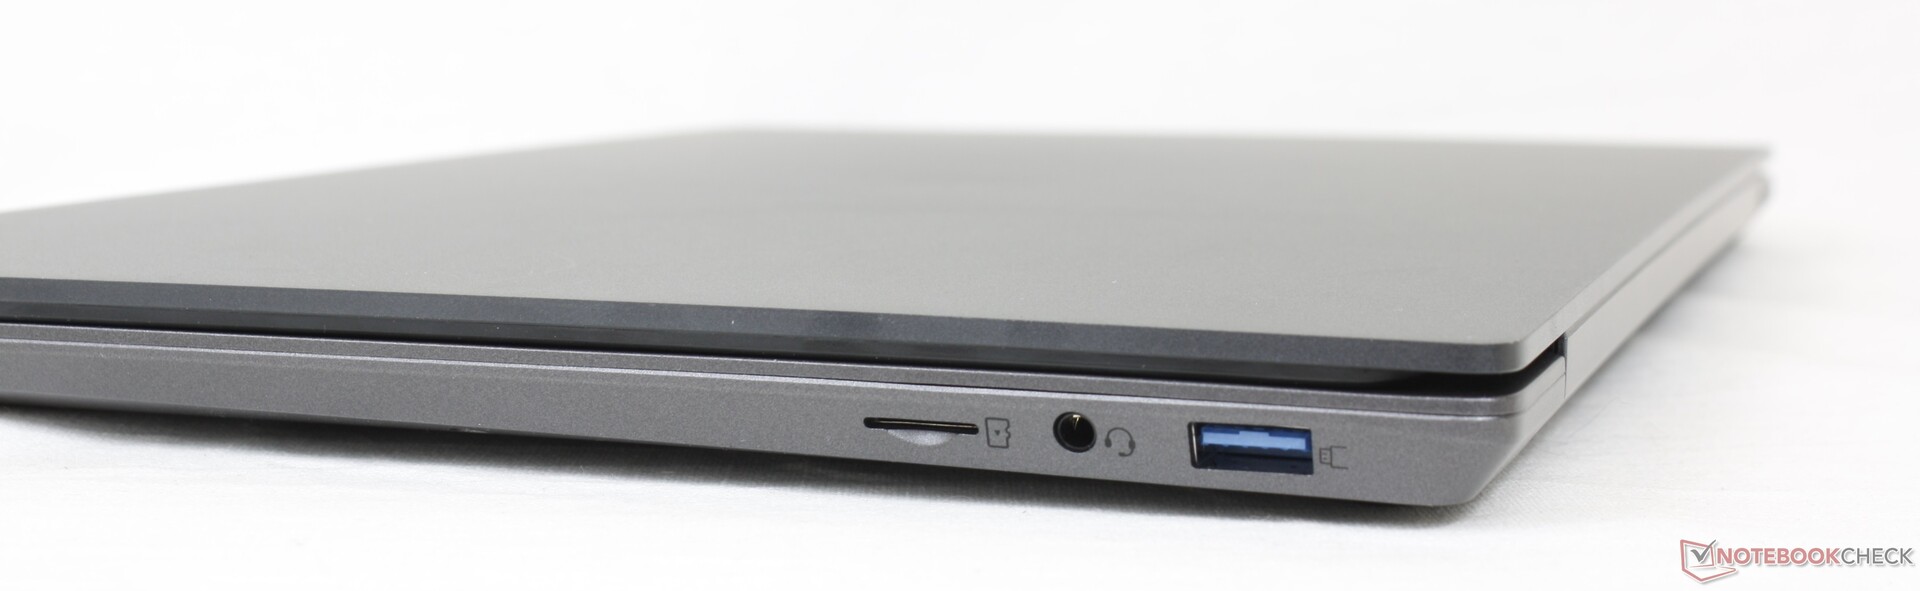
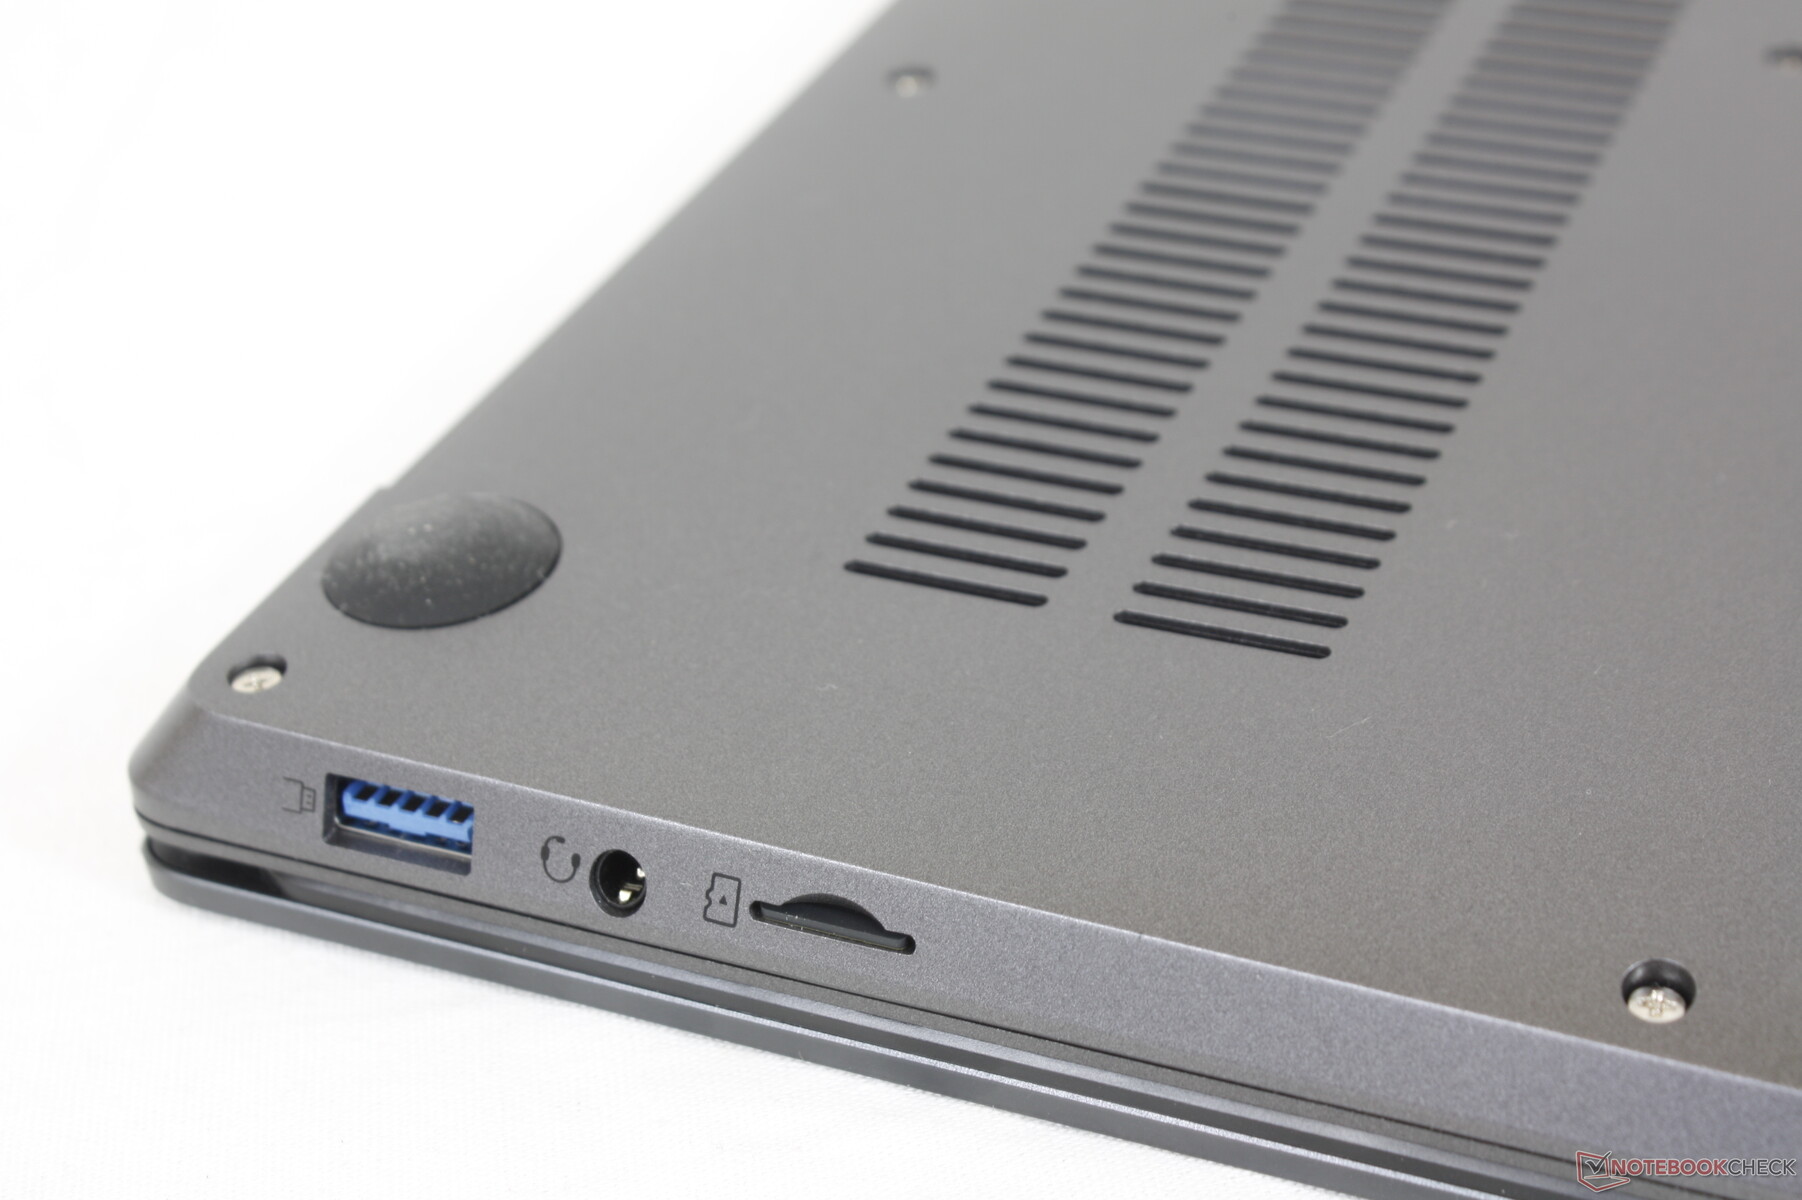
SD卡阅读器
弹簧式MicroSD读卡器提供缓慢的传输速率。请记住,MicroSD卡必须倒着插入,而且可能很难弹出。
| SD Card Reader | |
| average JPG Copy Test (av. of 3 runs) | |
| Lenovo IdeaPad 5 Pro 14ACN6 (AV PRO V60) | |
| HP Pavilion 14-dv0357ng | |
| BMAX X14 Pro (AV Pro V60) | |
| Dell Inspiron 14 7400 7415 2-in-1 (AV Pro V60) | |
| Infinix INBook X2 (AV Pro V60) | |
| maximum AS SSD Seq Read Test (1GB) | |
| HP Pavilion 14-dv0357ng | |
| Lenovo IdeaPad 5 Pro 14ACN6 (AV PRO V60) | |
| BMAX X14 Pro (AV Pro V60) | |
| Dell Inspiron 14 7400 7415 2-in-1 (AV Pro V60) | |
| Infinix INBook X2 (AV Pro V60) | |
沟通
集成的Wi-Fi 5模块很稳定,尽管速度很慢,两个方向的传输速率平均为250Mbps。
网络摄像头
720p网络摄像头,不支持Windows Hello或隐私快门。


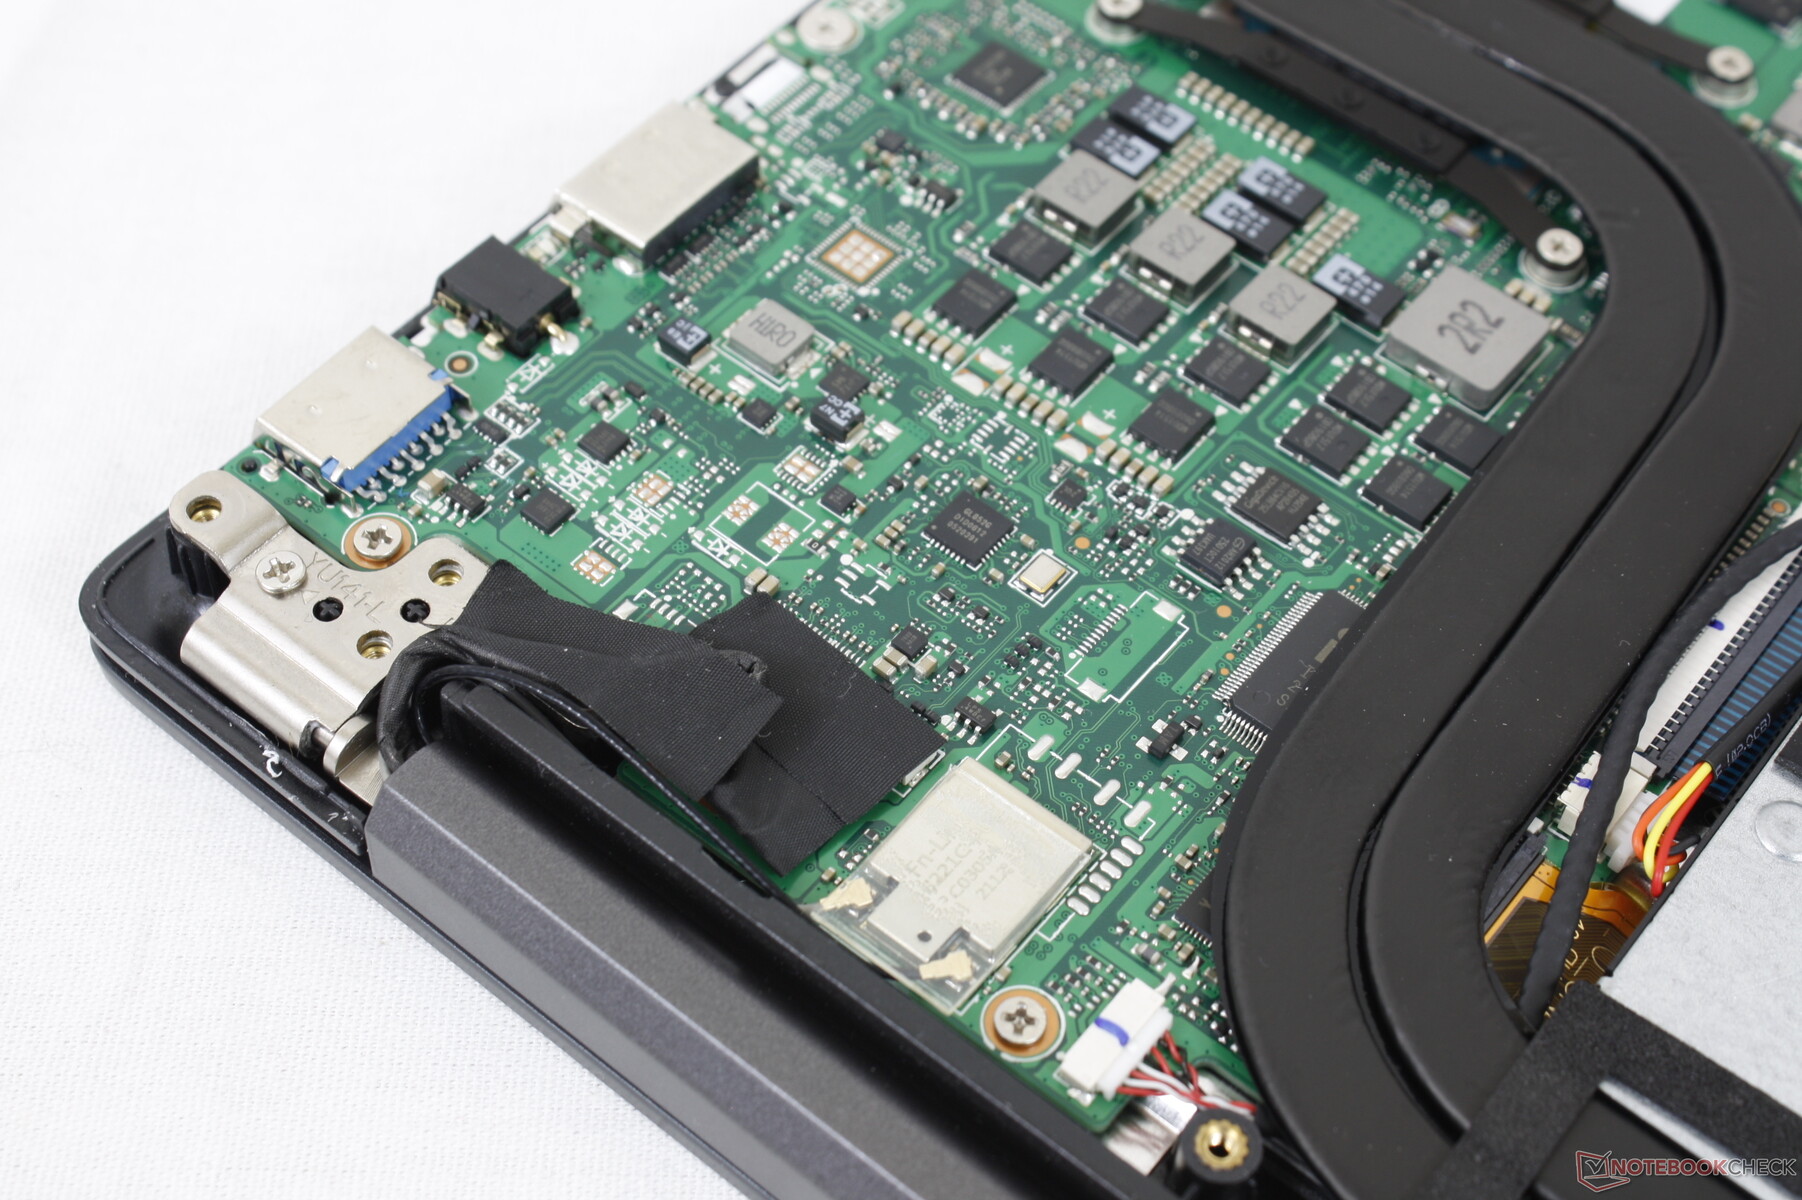
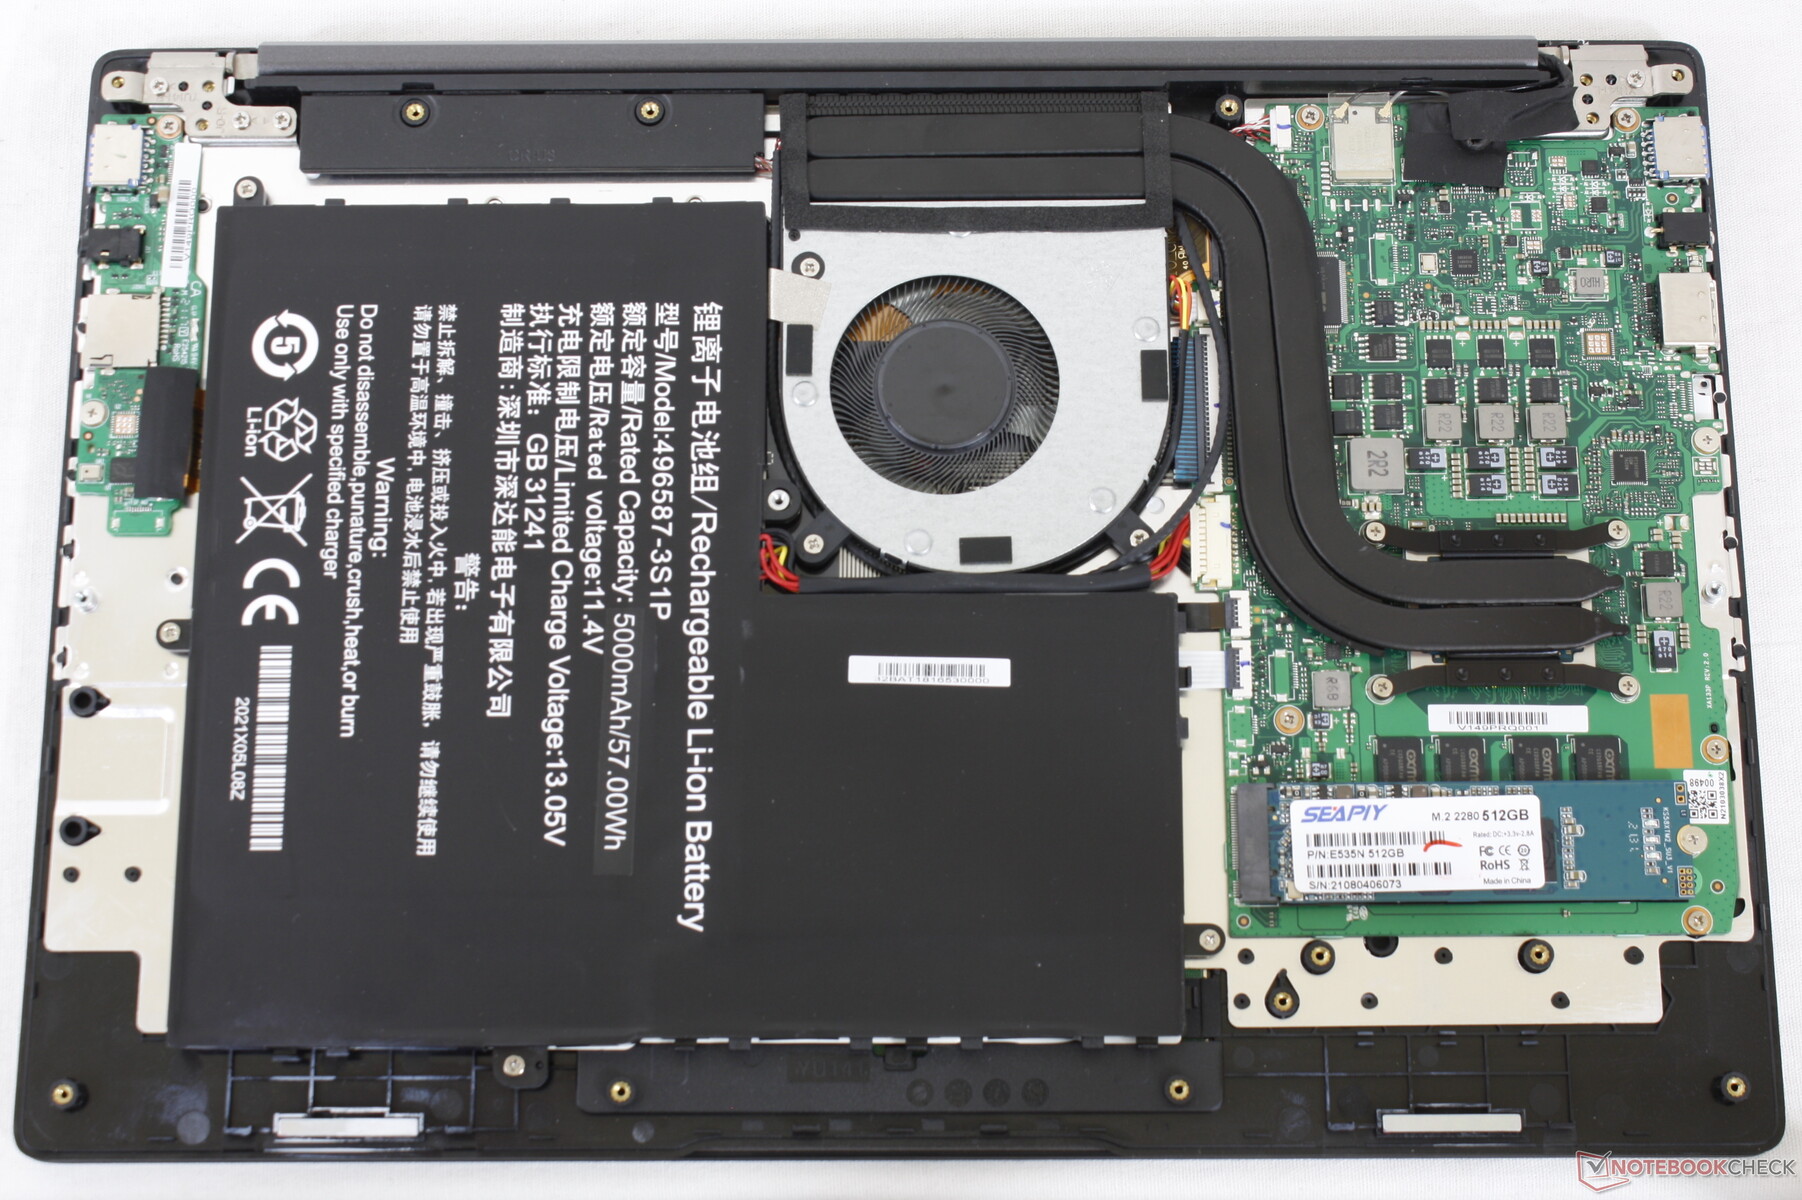
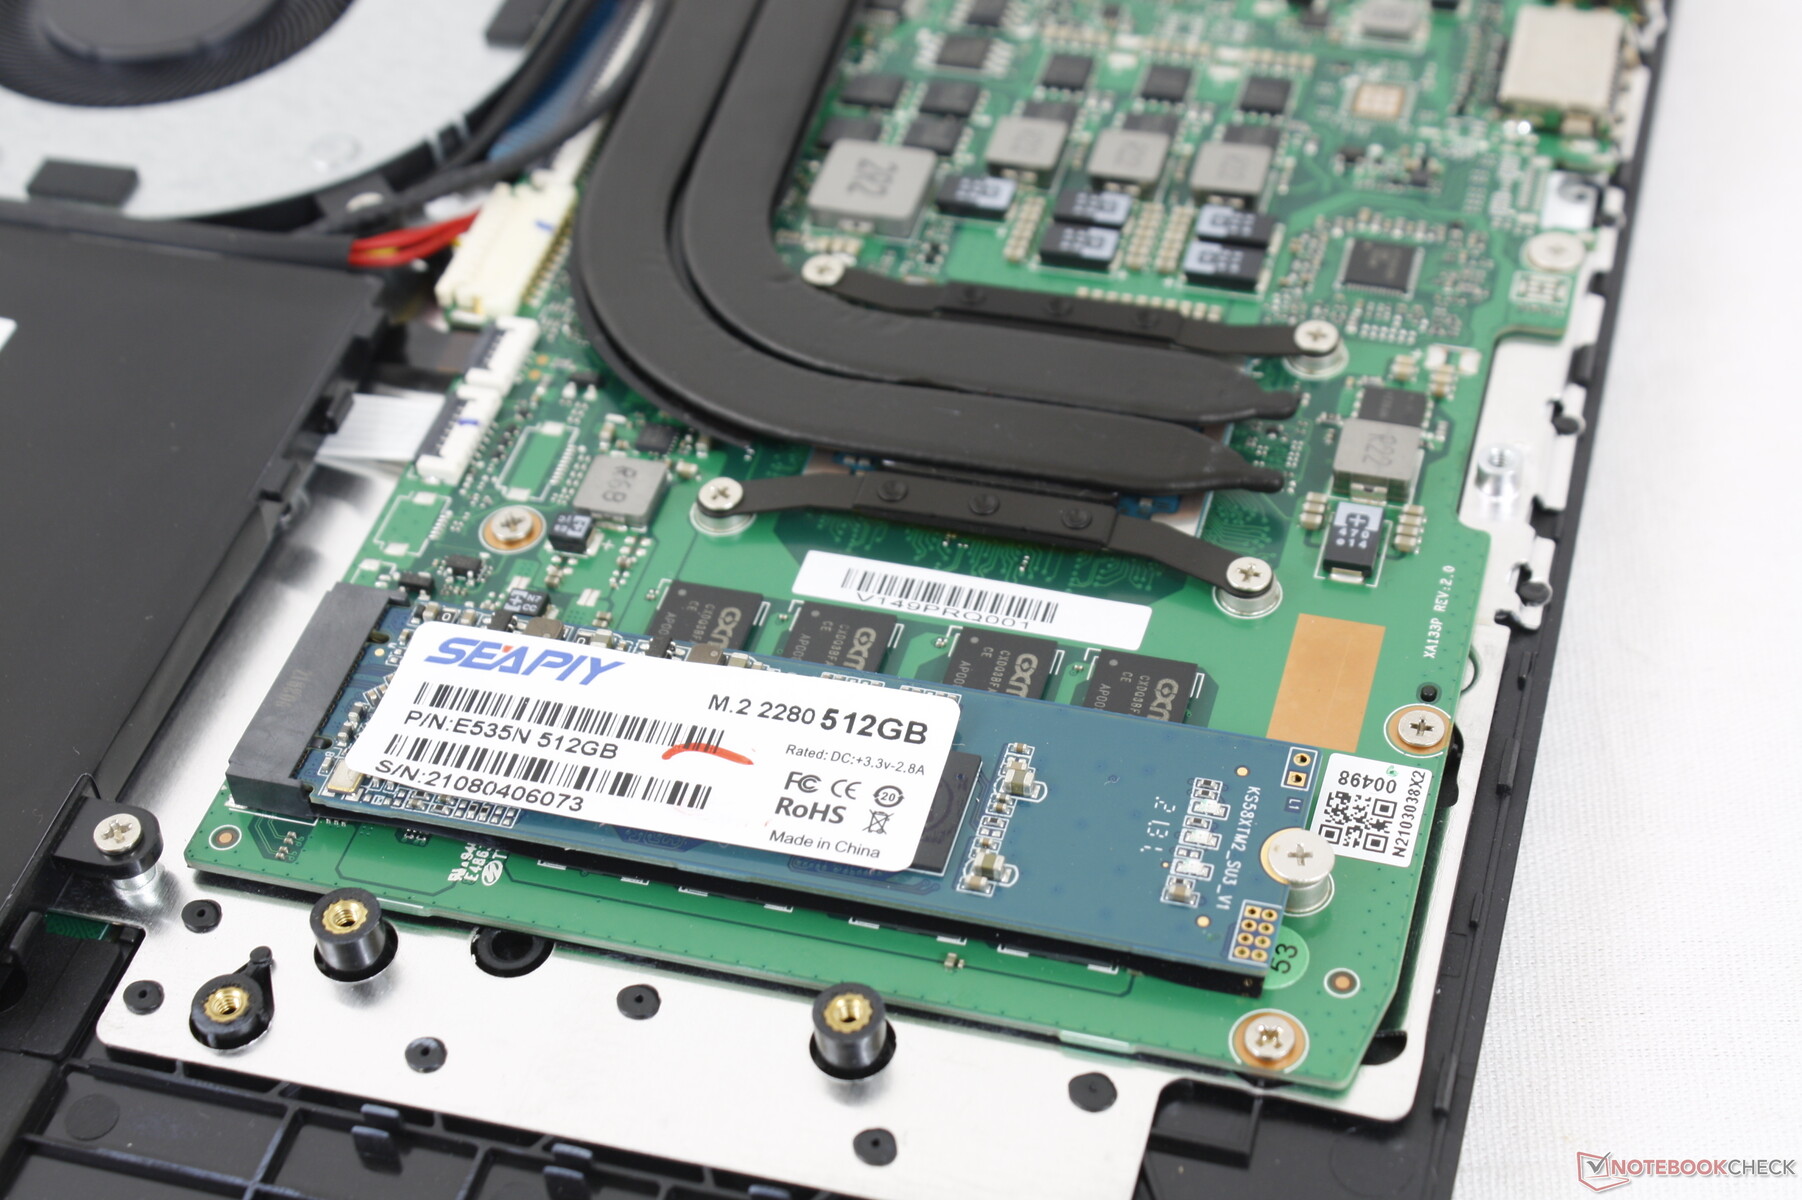
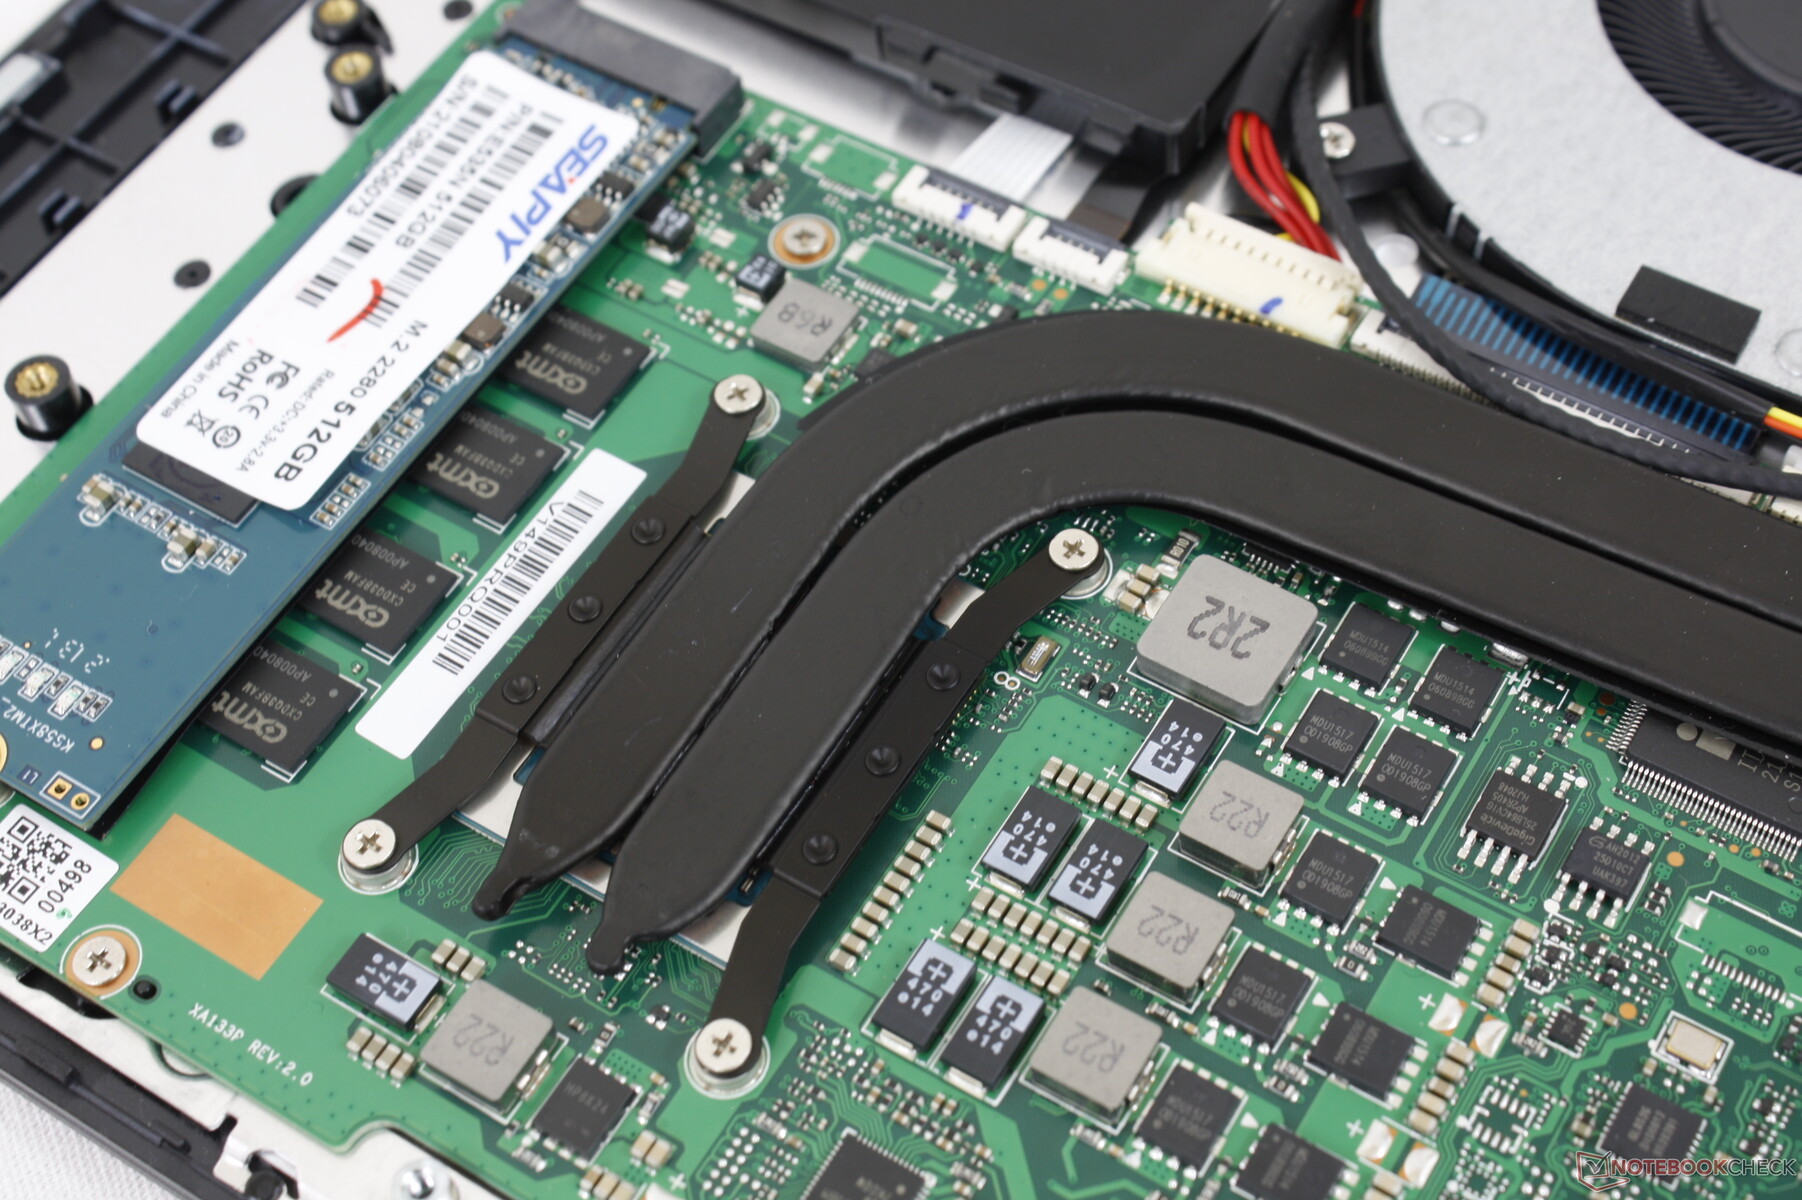
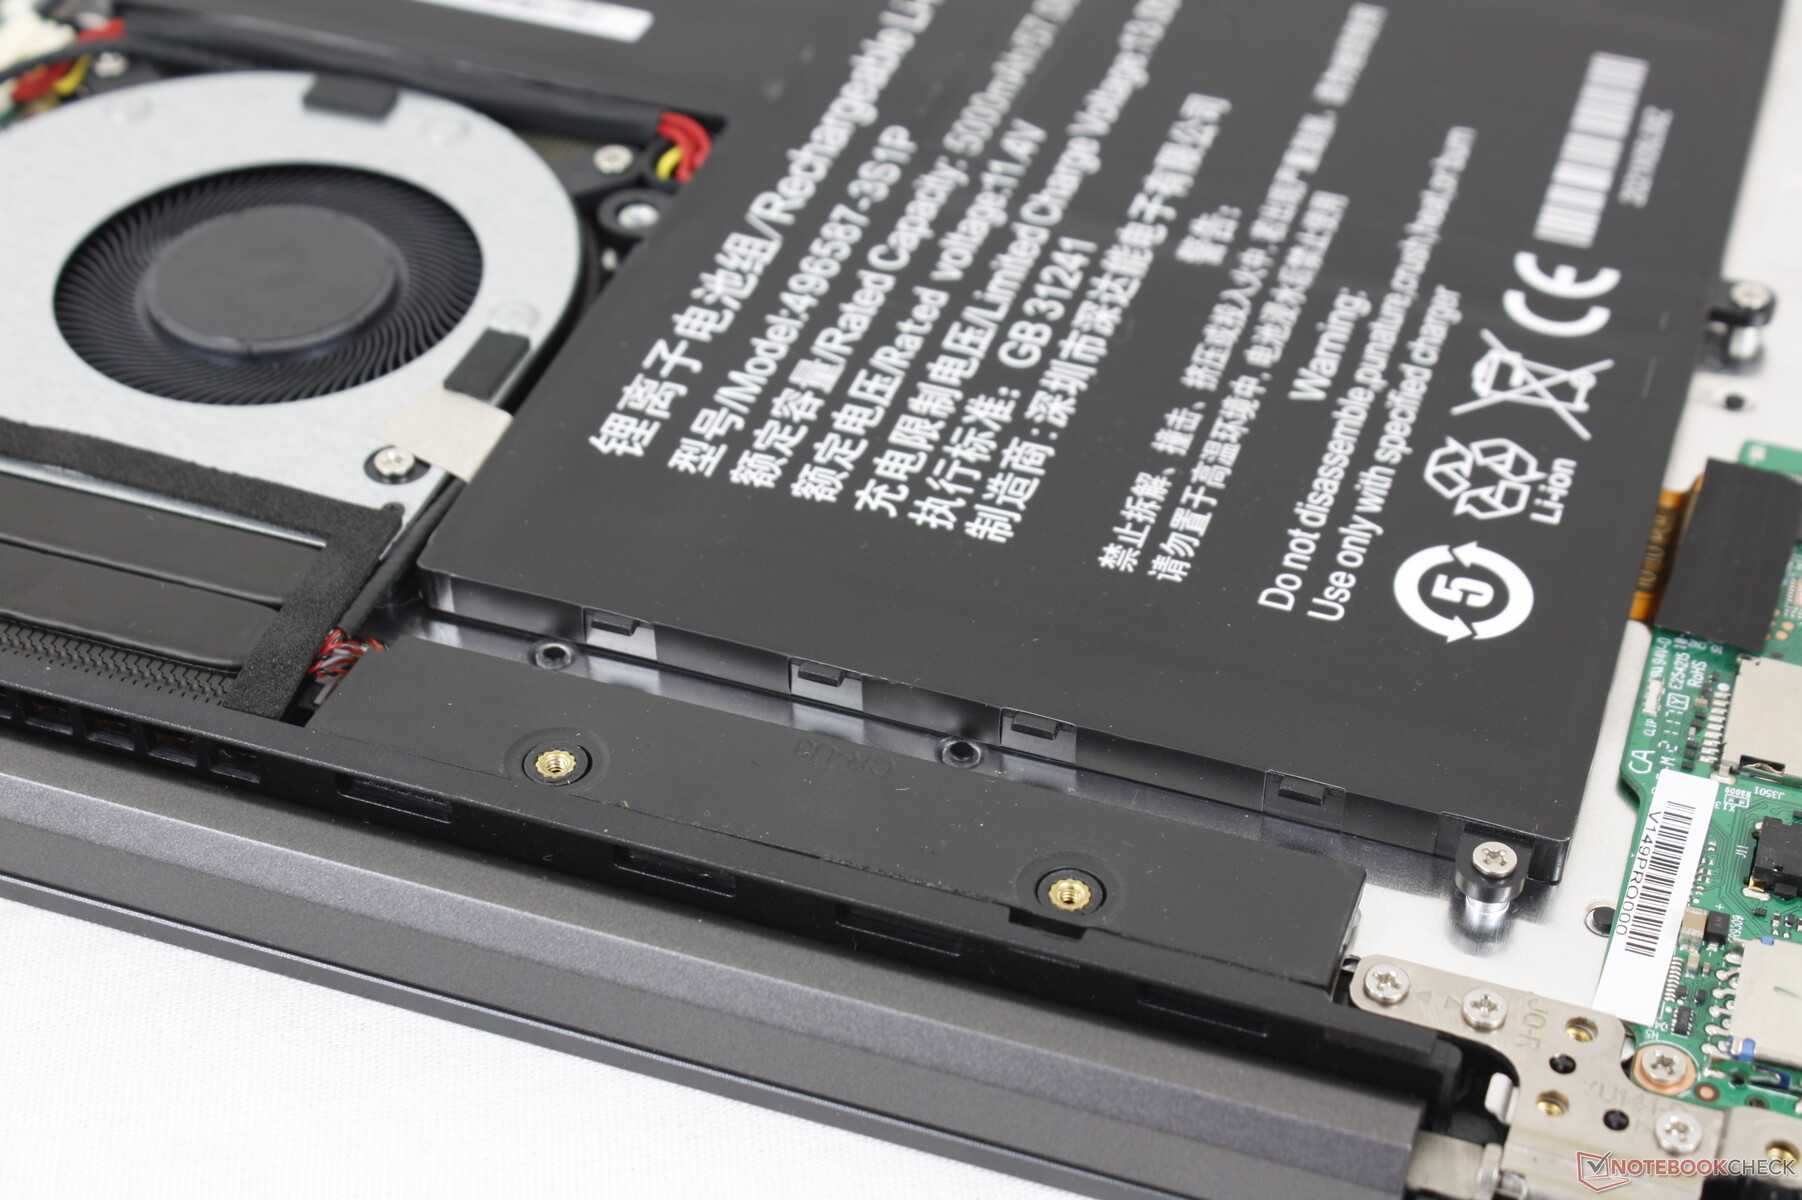
维护
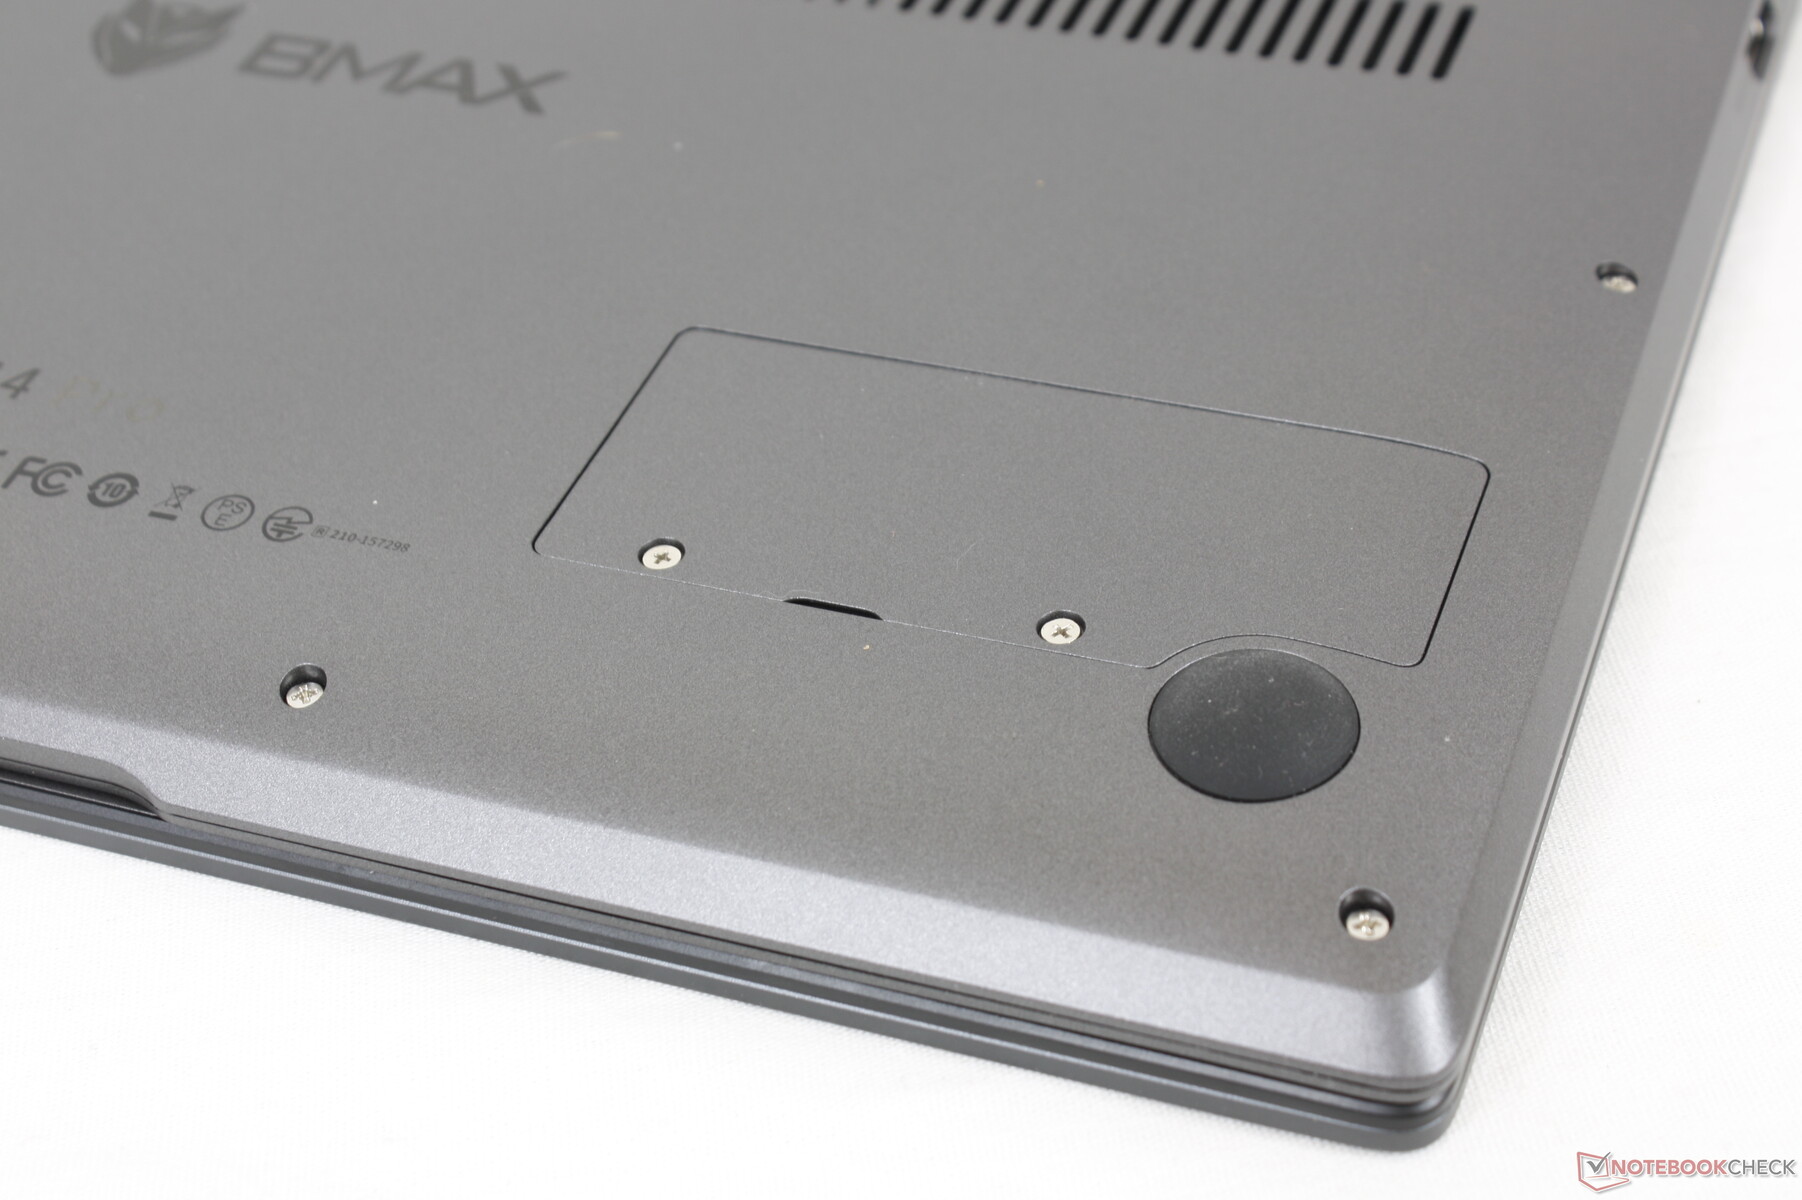
底部面板由11颗飞利浦螺钉固定,另外还有两颗隐藏在后部橡胶脚下的螺钉。用户只能升级M.2 2280存储,因为内存和WLAN模块都是焊接的。值得庆幸的是,RAM是双通道模式。
配件和保修
盒子里除了交流电适配器和文件外,没有任何额外的东西。由于海外运输的原因,申请制造商的保修可能会很及时或费用很高。
输入设备
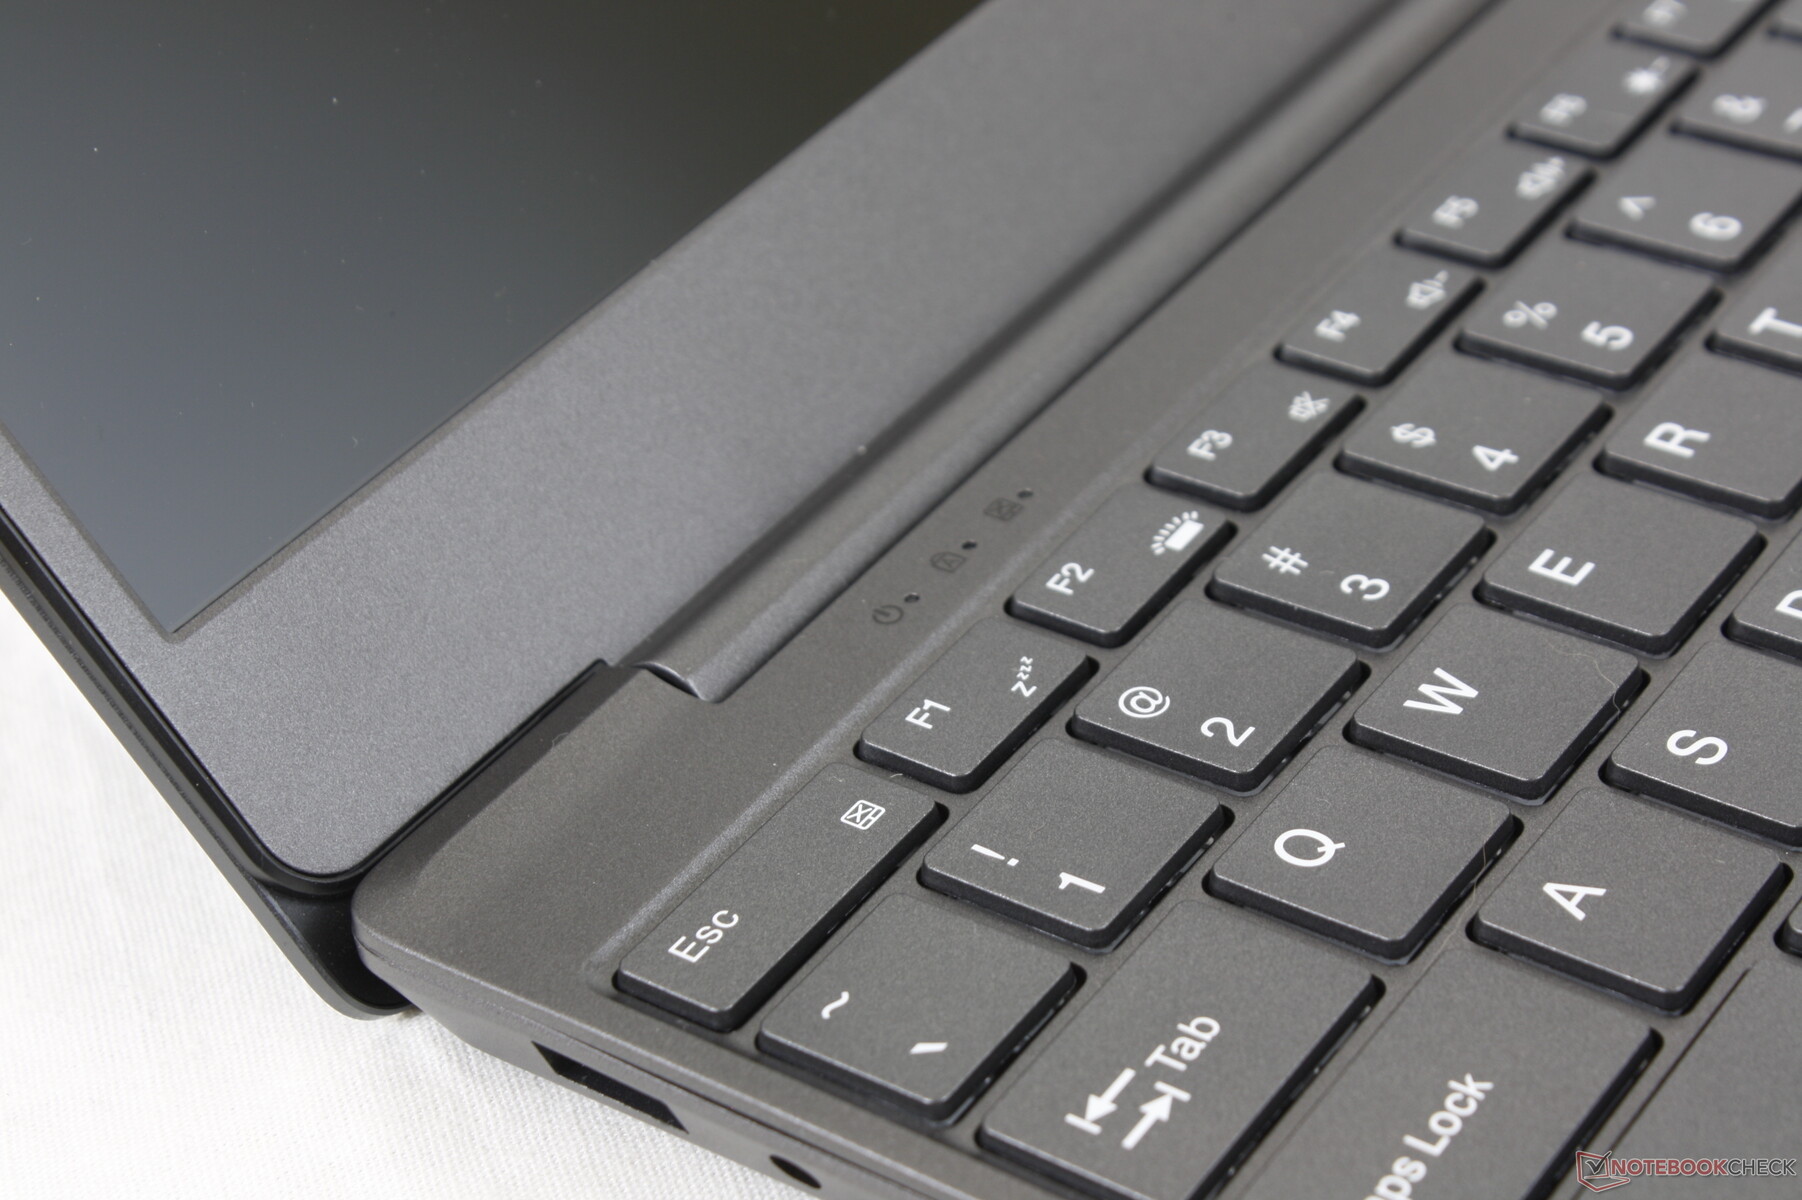
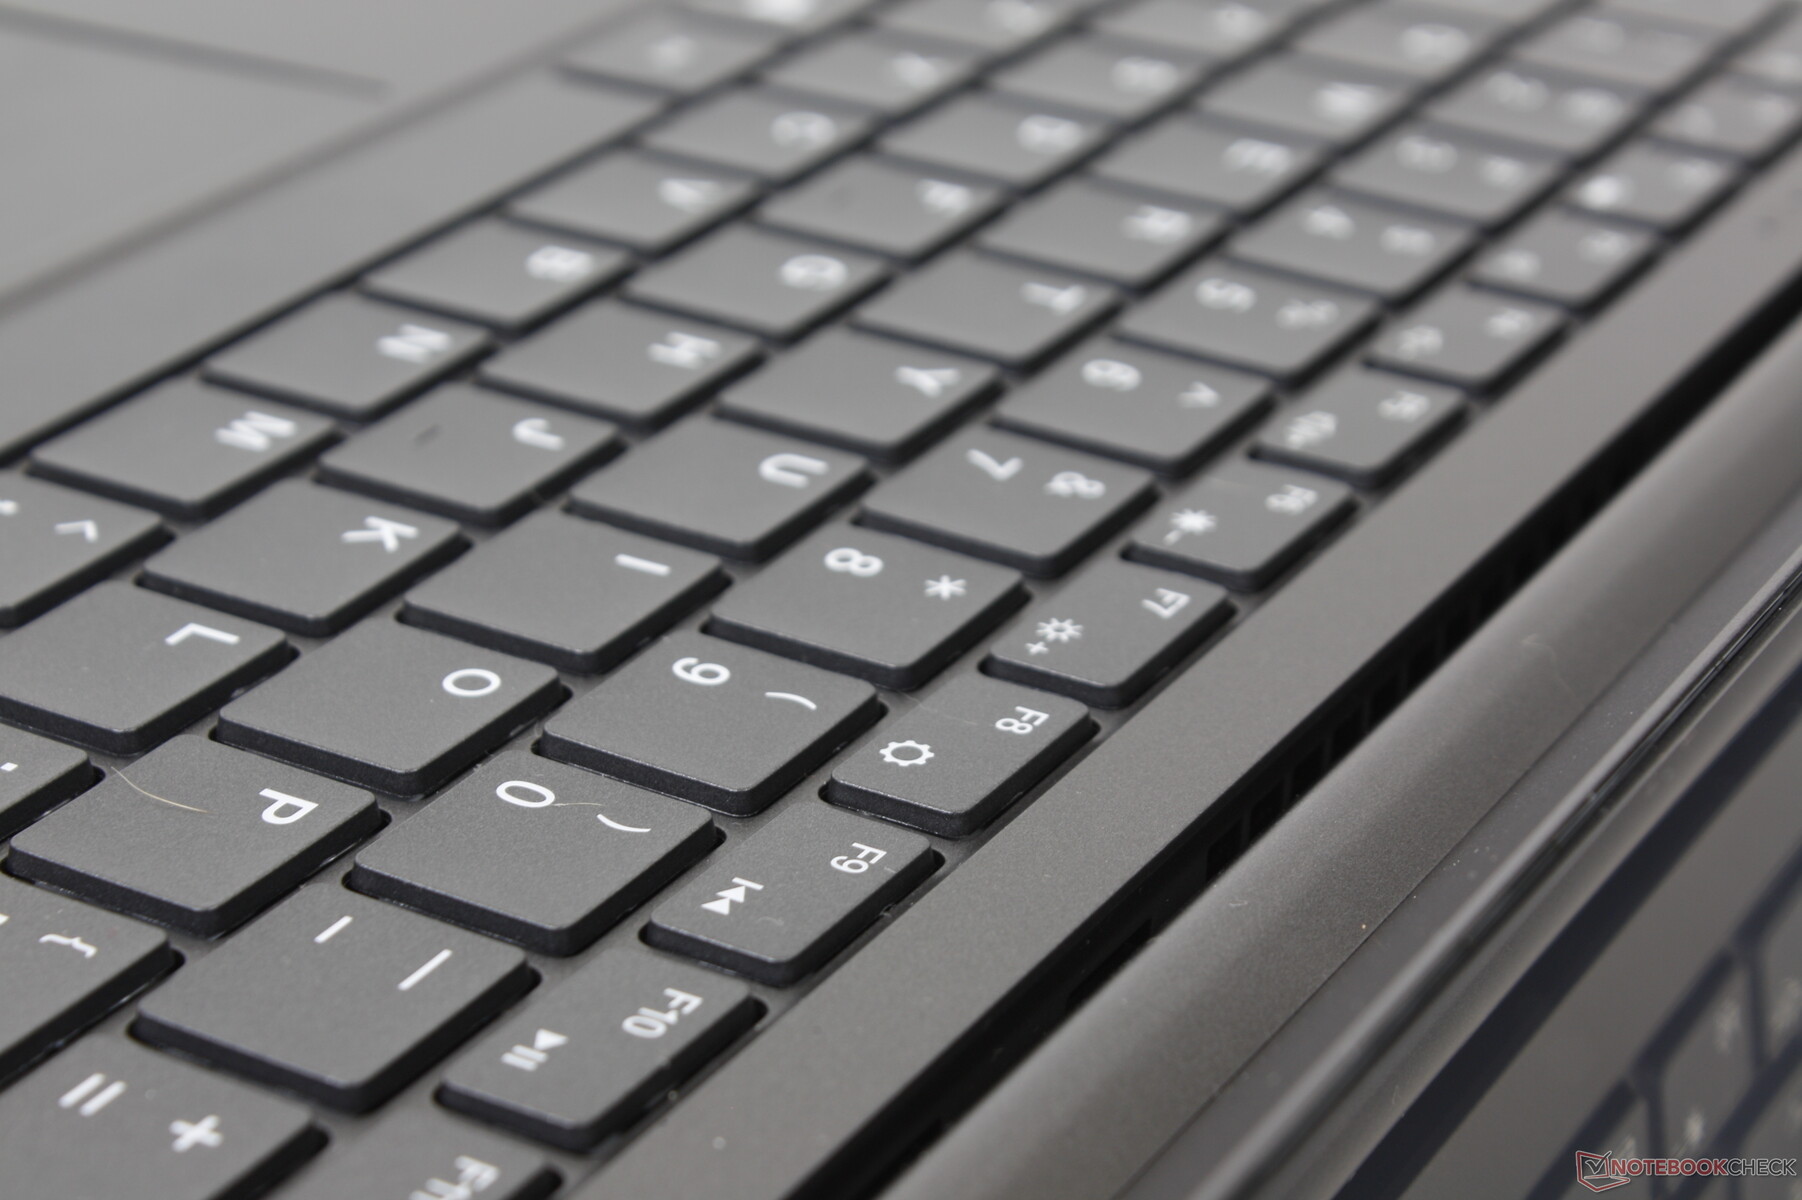
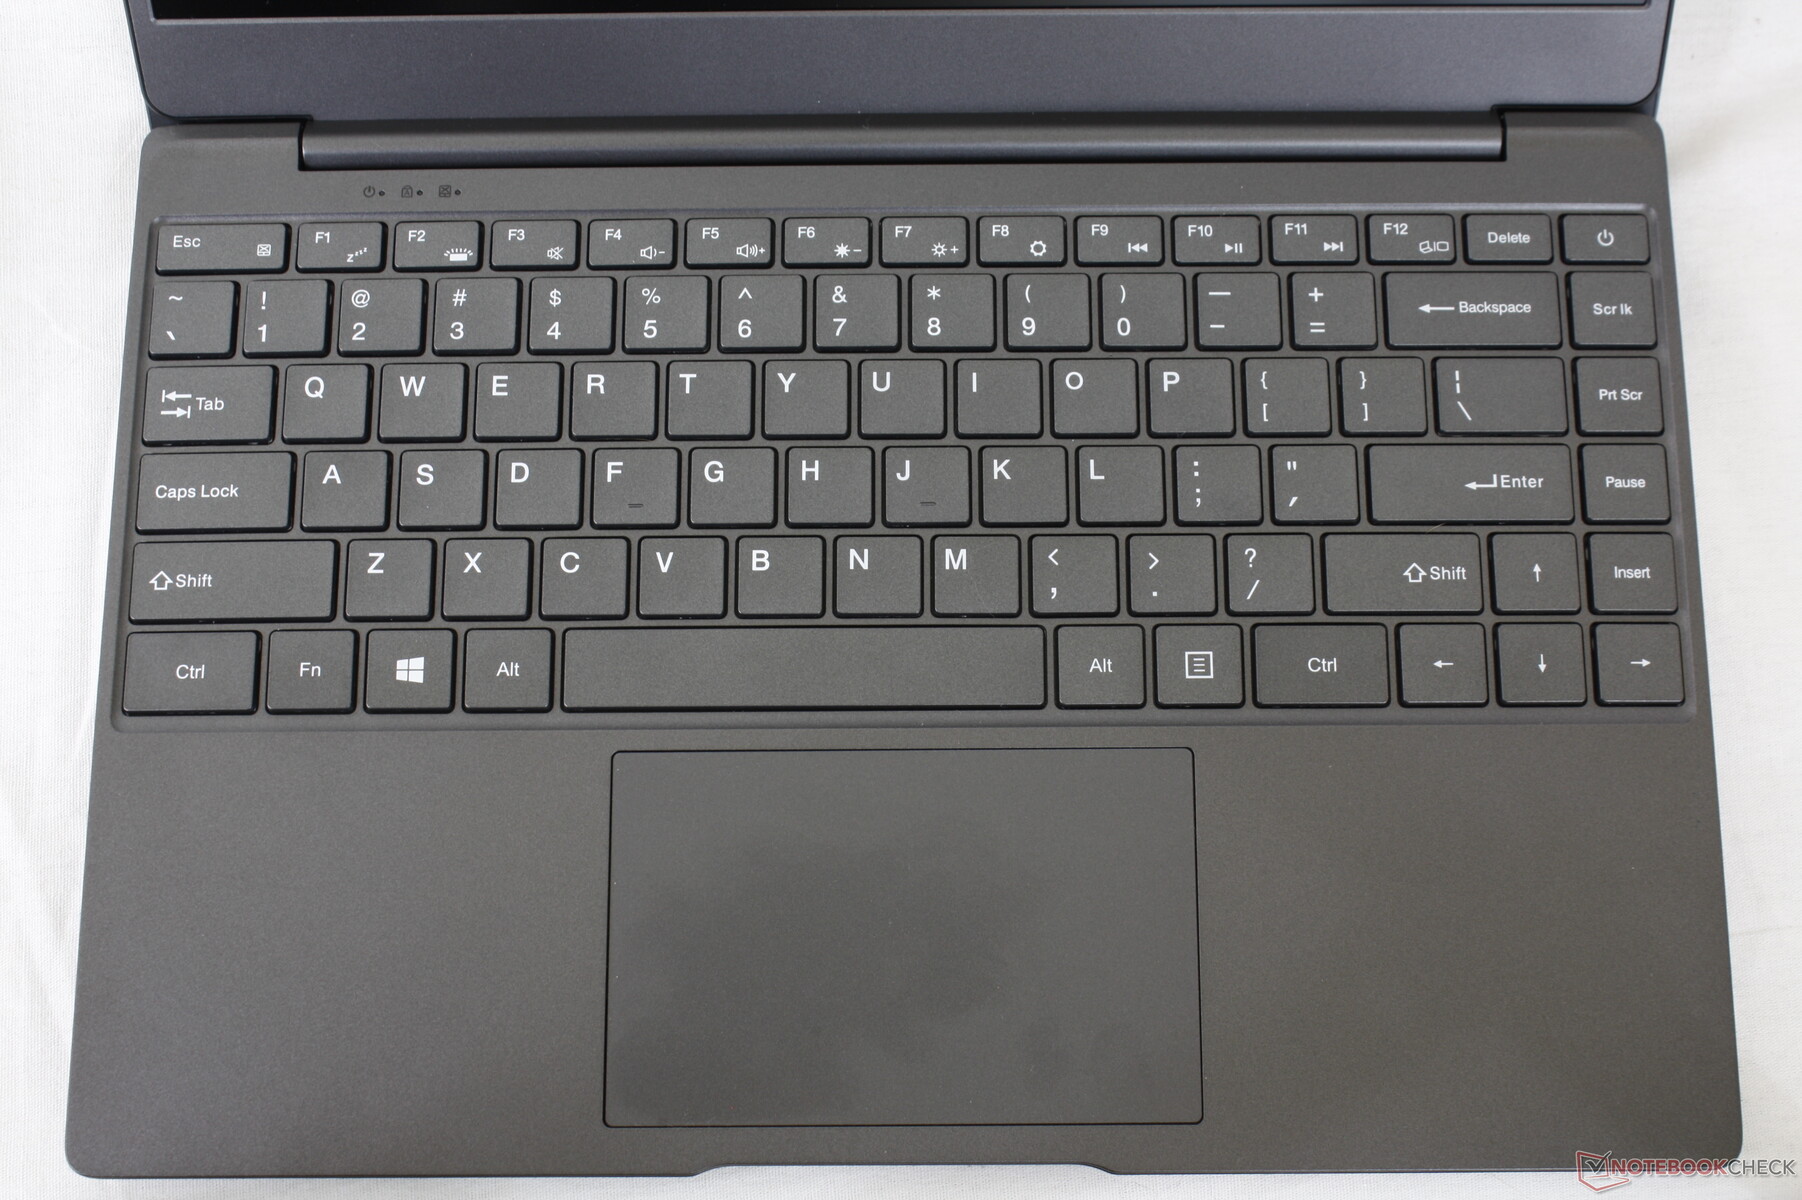
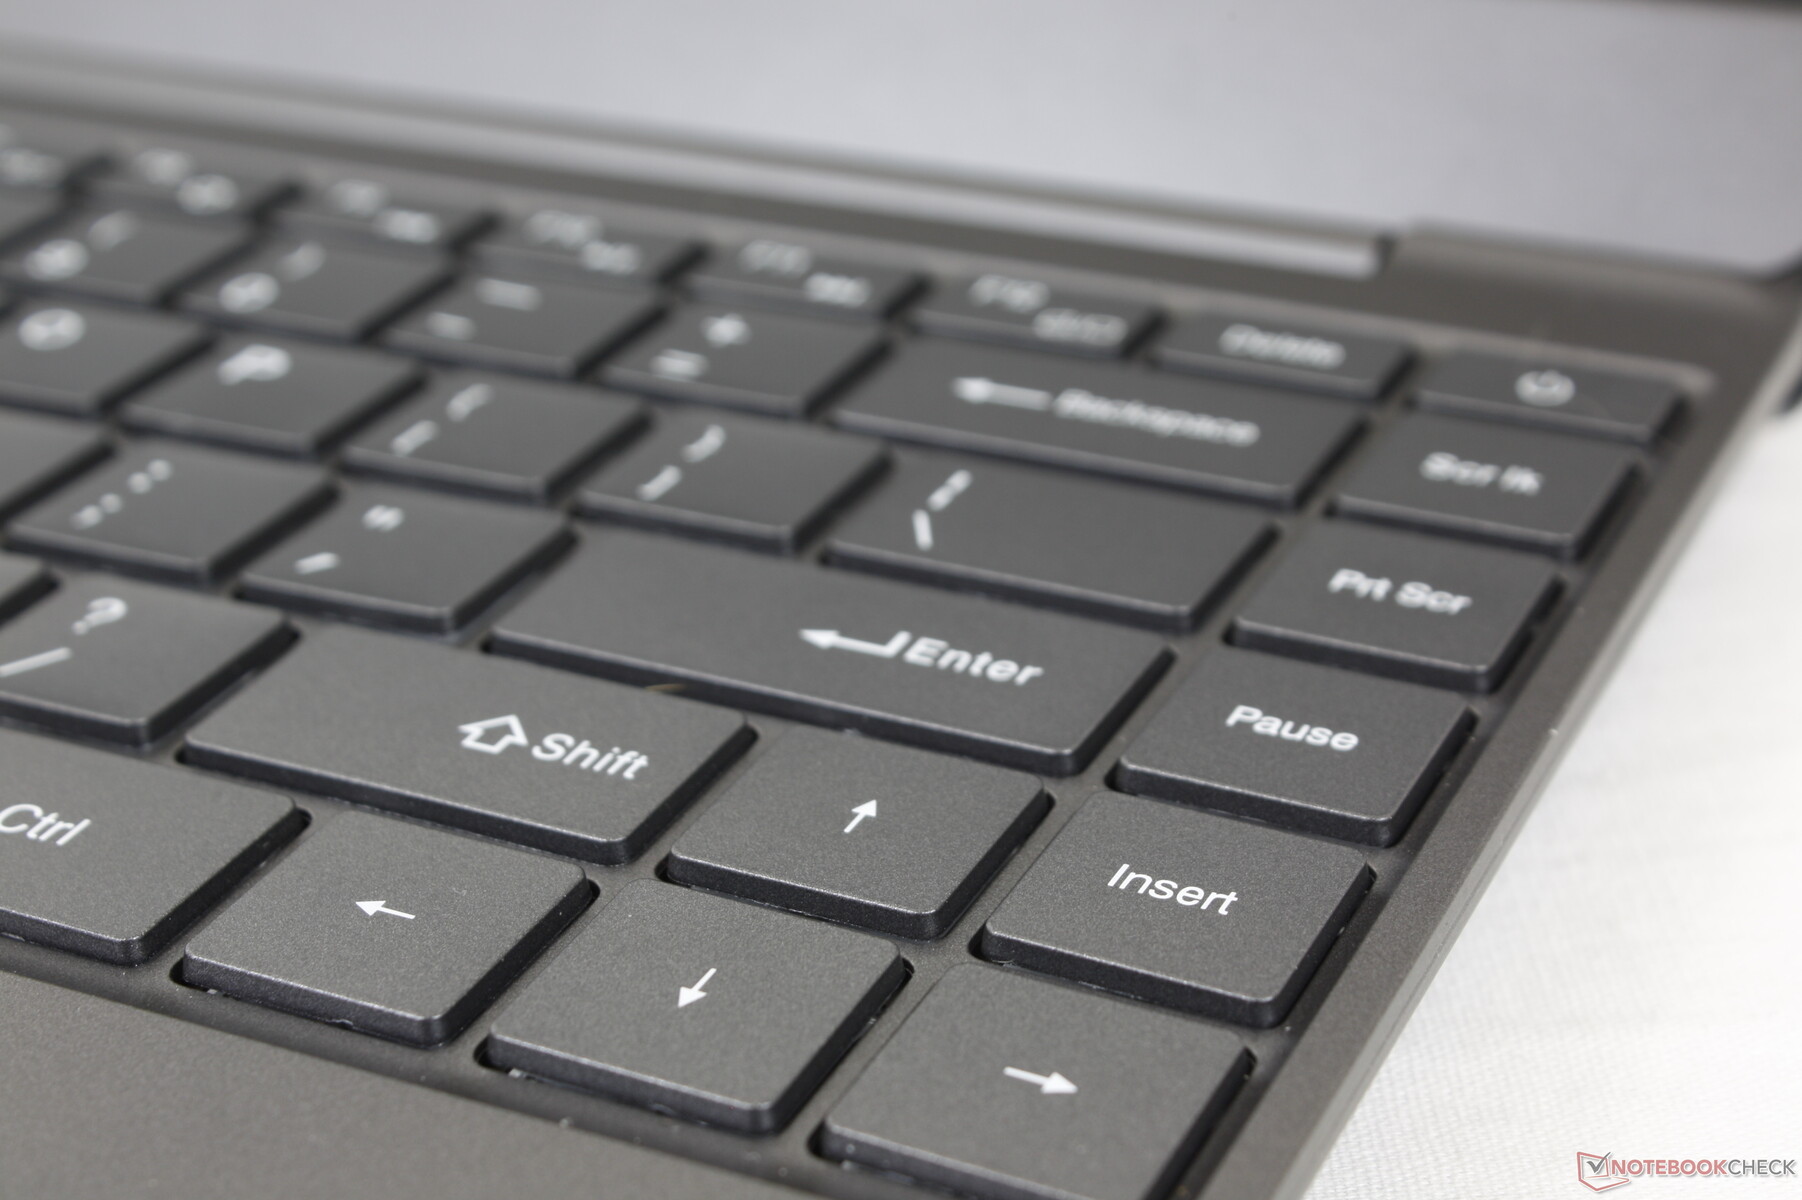
键盘
按键反馈和键程比联想IdeaPad笔记本电脑上的按键略微深一些,也更结实。然而,按键反馈的均匀性很差,因为某些按键比其他按键更有弹性。特别是空格键的反馈明显较软,破坏了BMax上的打字体验。
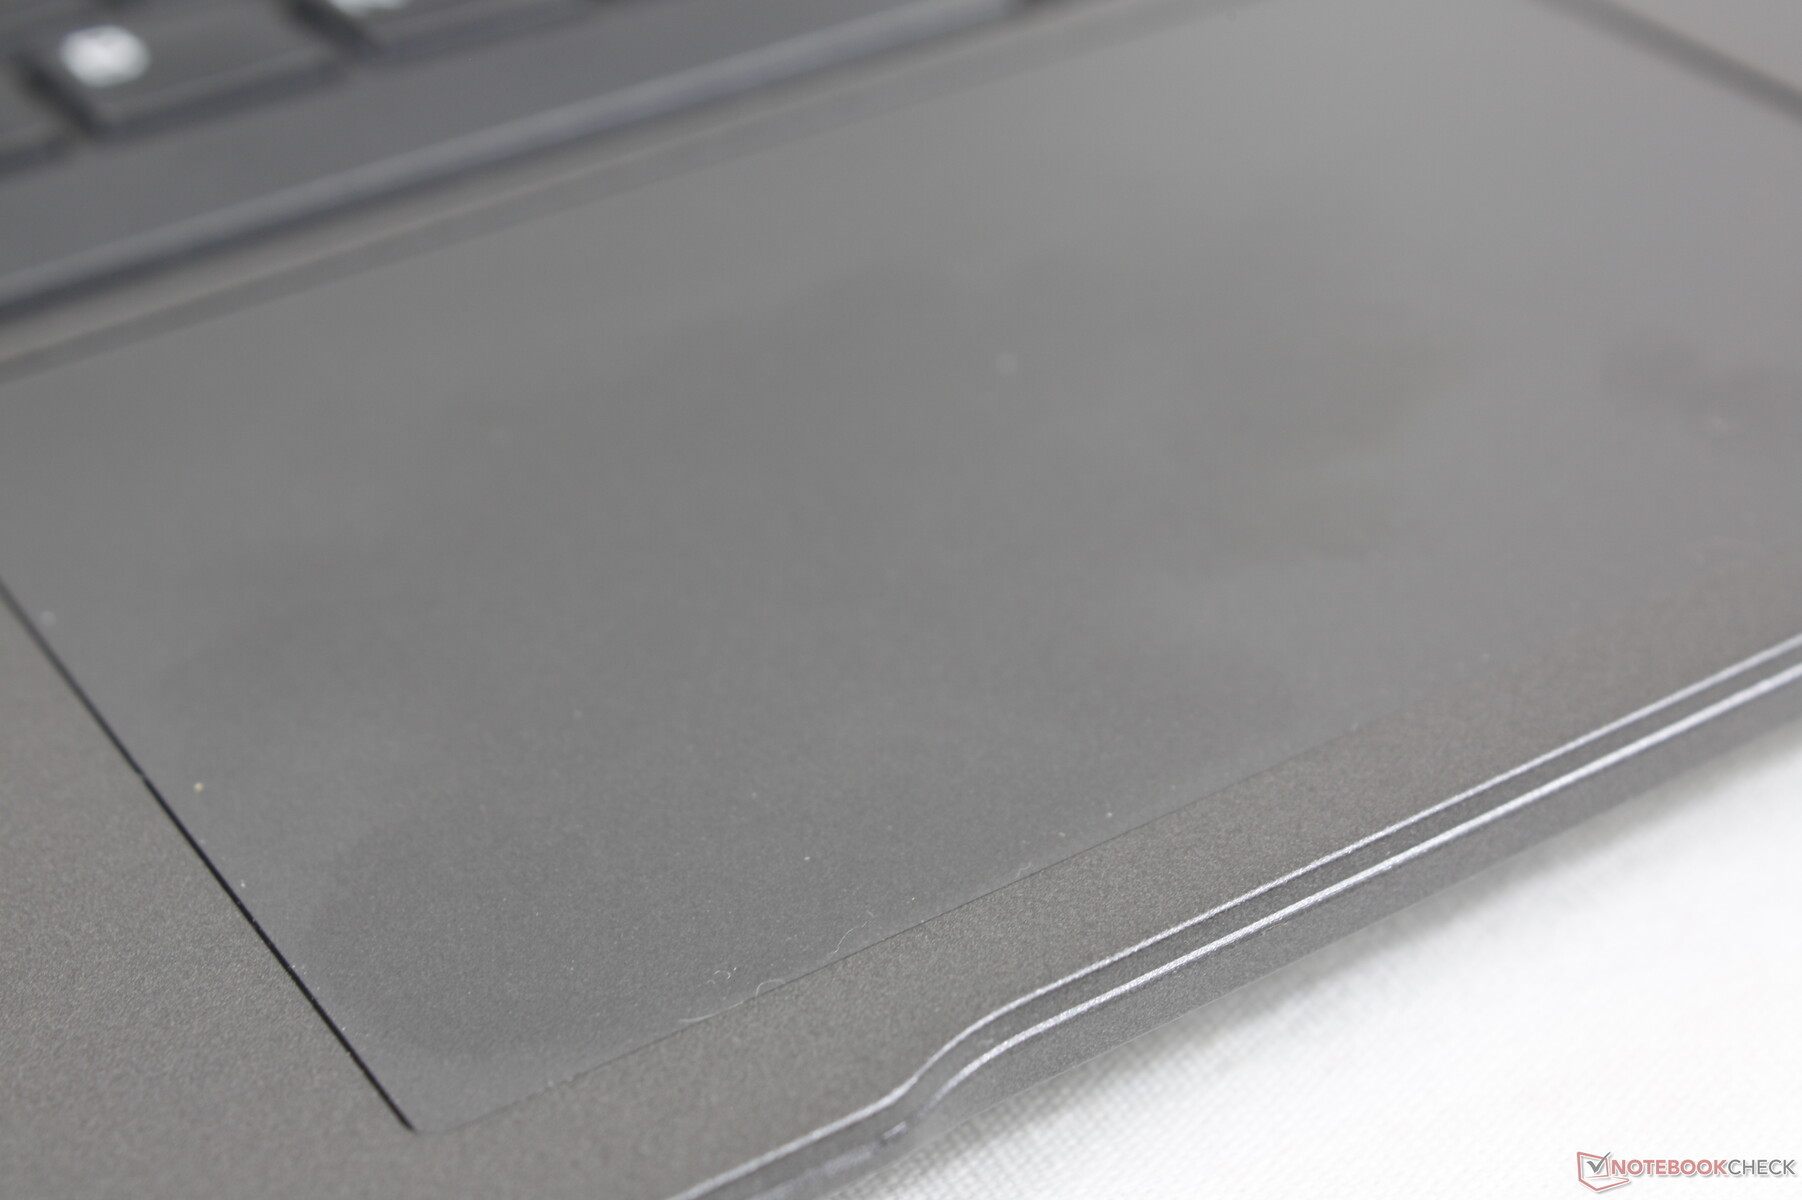
触摸板
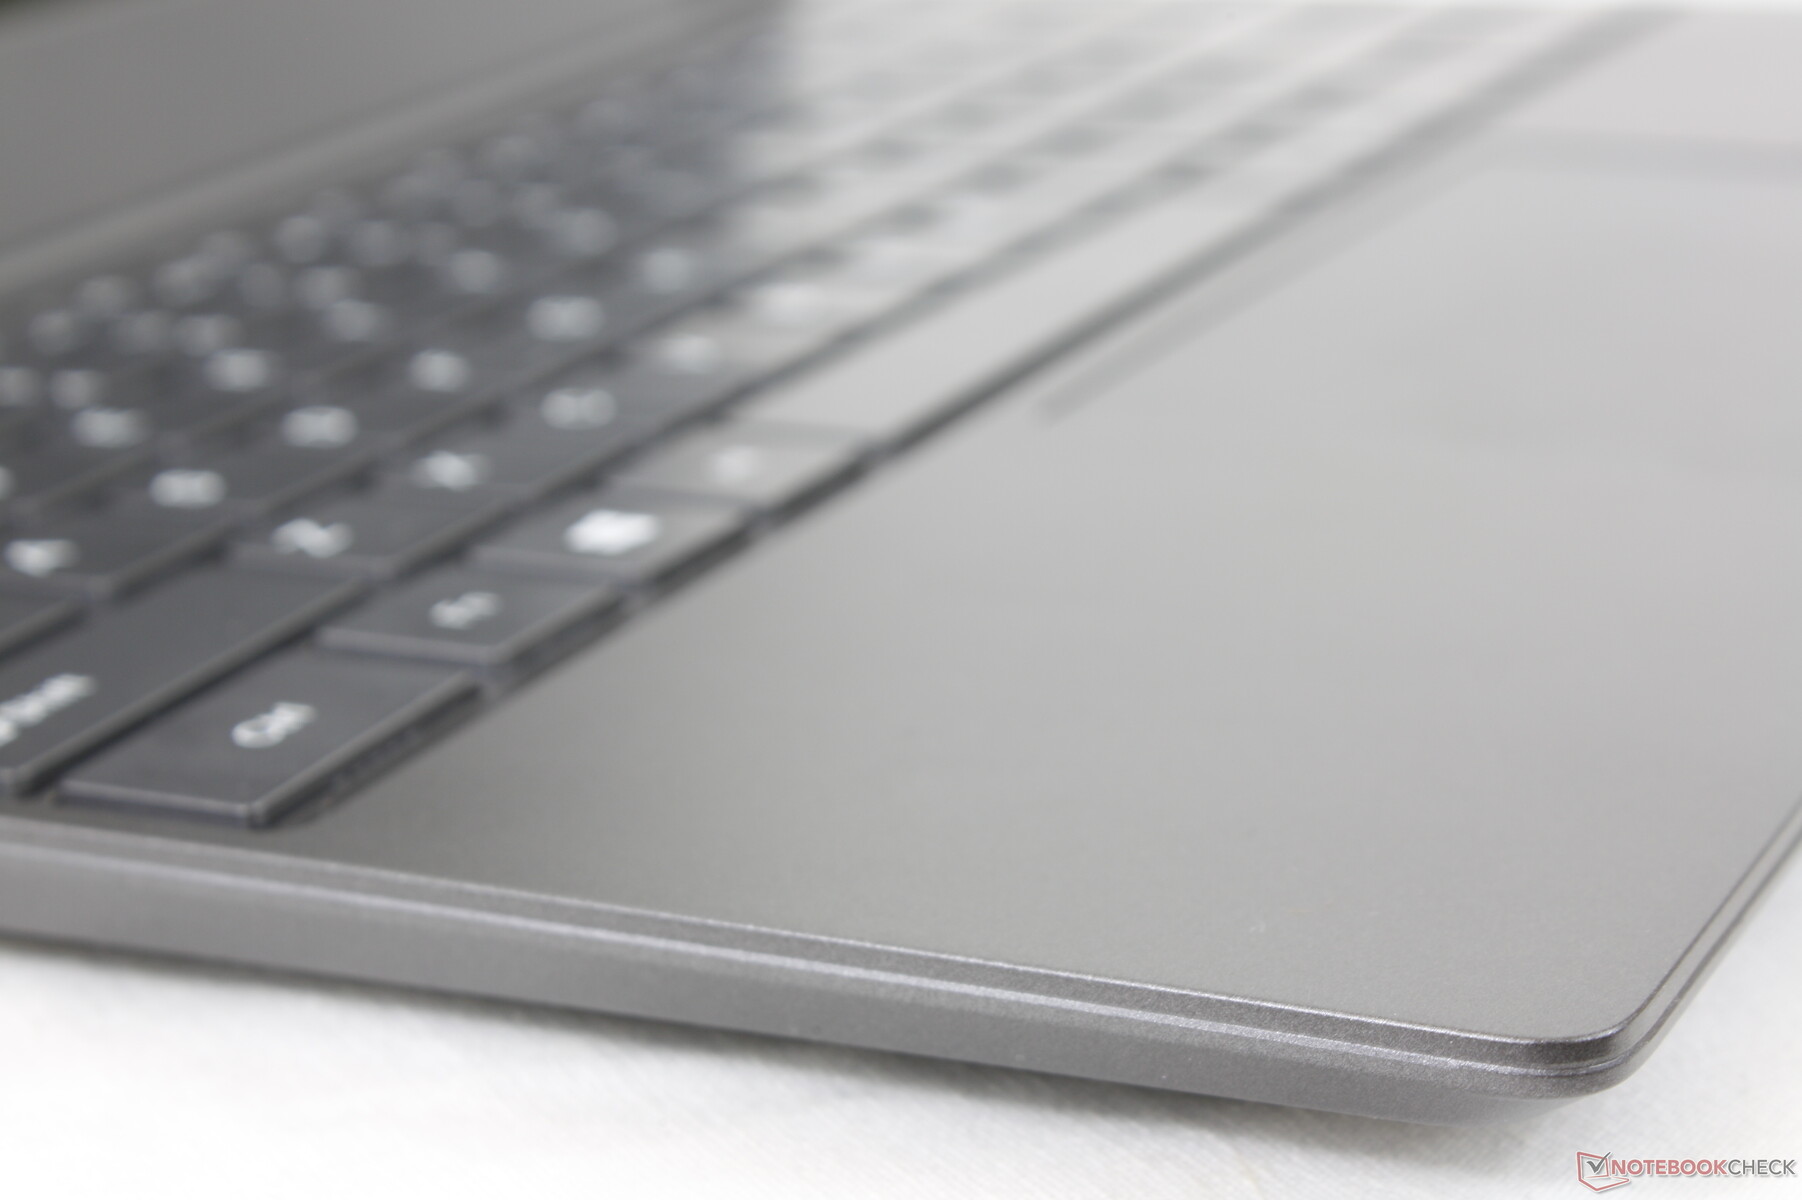
支持Precision ,点击板相当大,为11.5 x 7.3厘米,相比之下,10.5 x 7厘米的点击板是比较大的。联想IdeaPad 5 Pro 14.与一些Chuwi笔记本电脑上的点击板不同,BMax上的点击板很可靠,没有任何光标跳跃的问题。它的表面在以中等或较高速度滑行时很光滑,而较低的速度往往更粘。

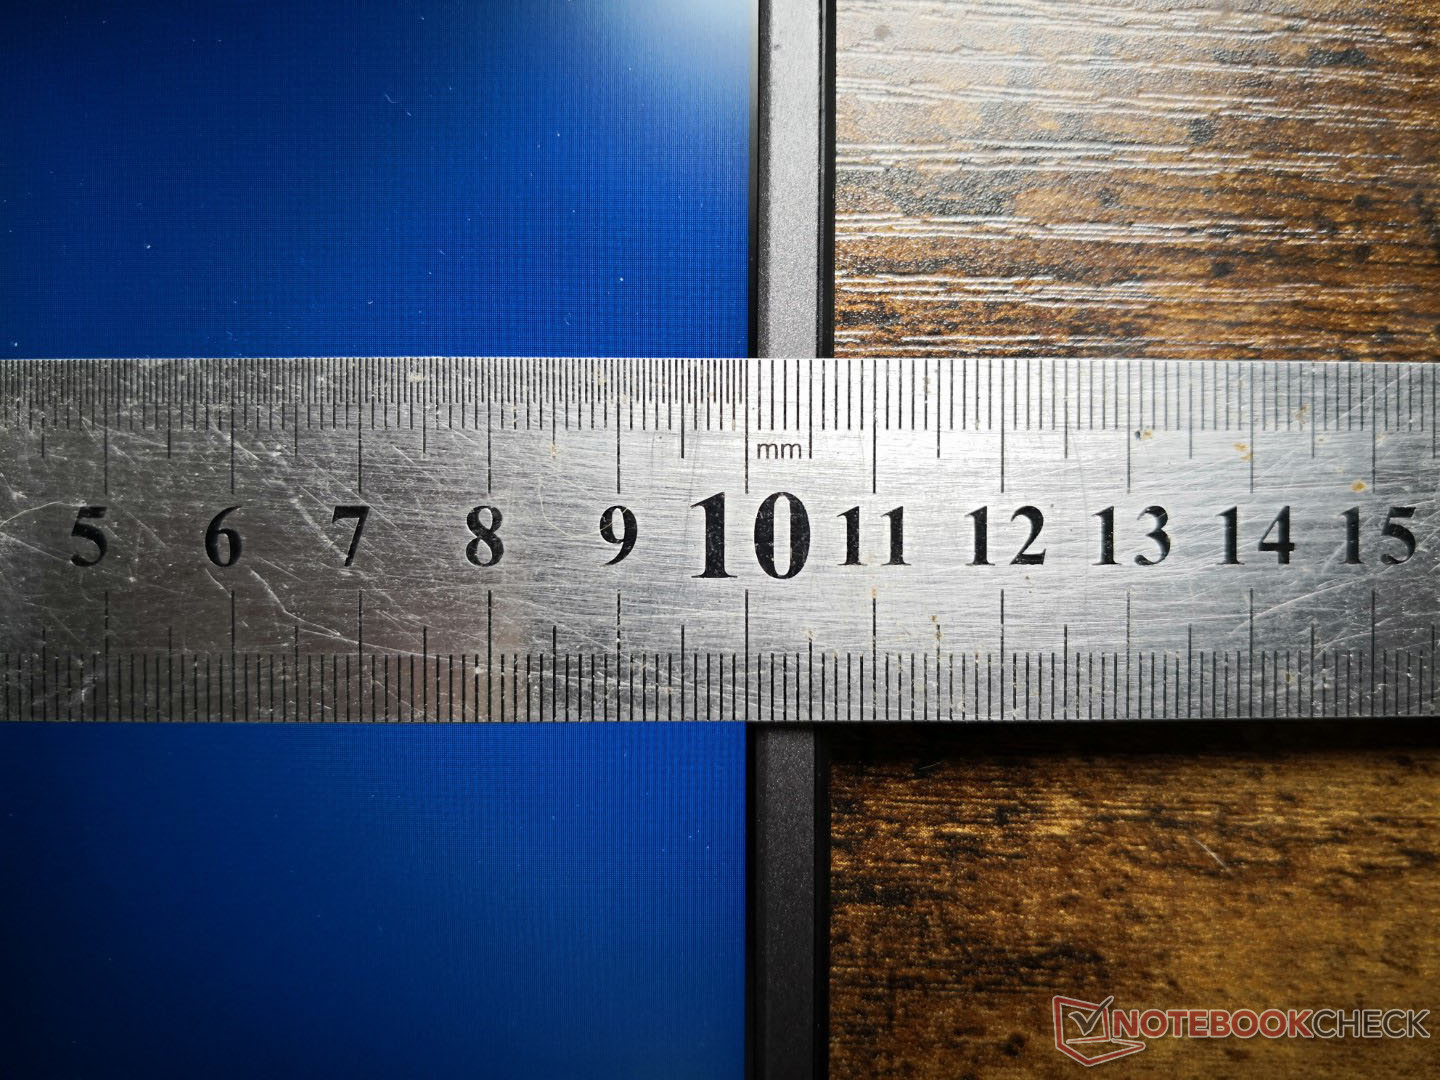
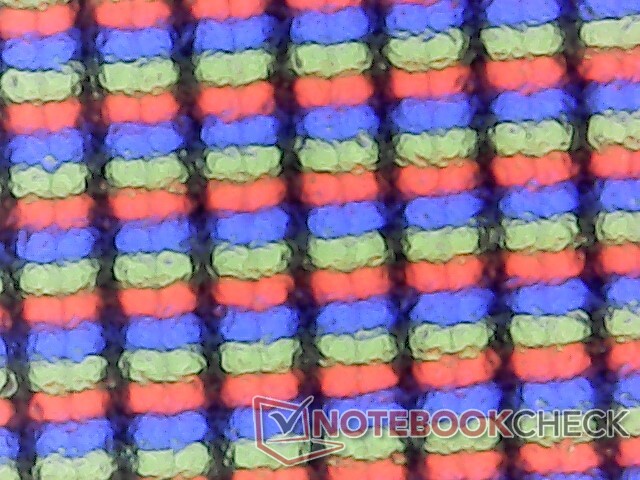
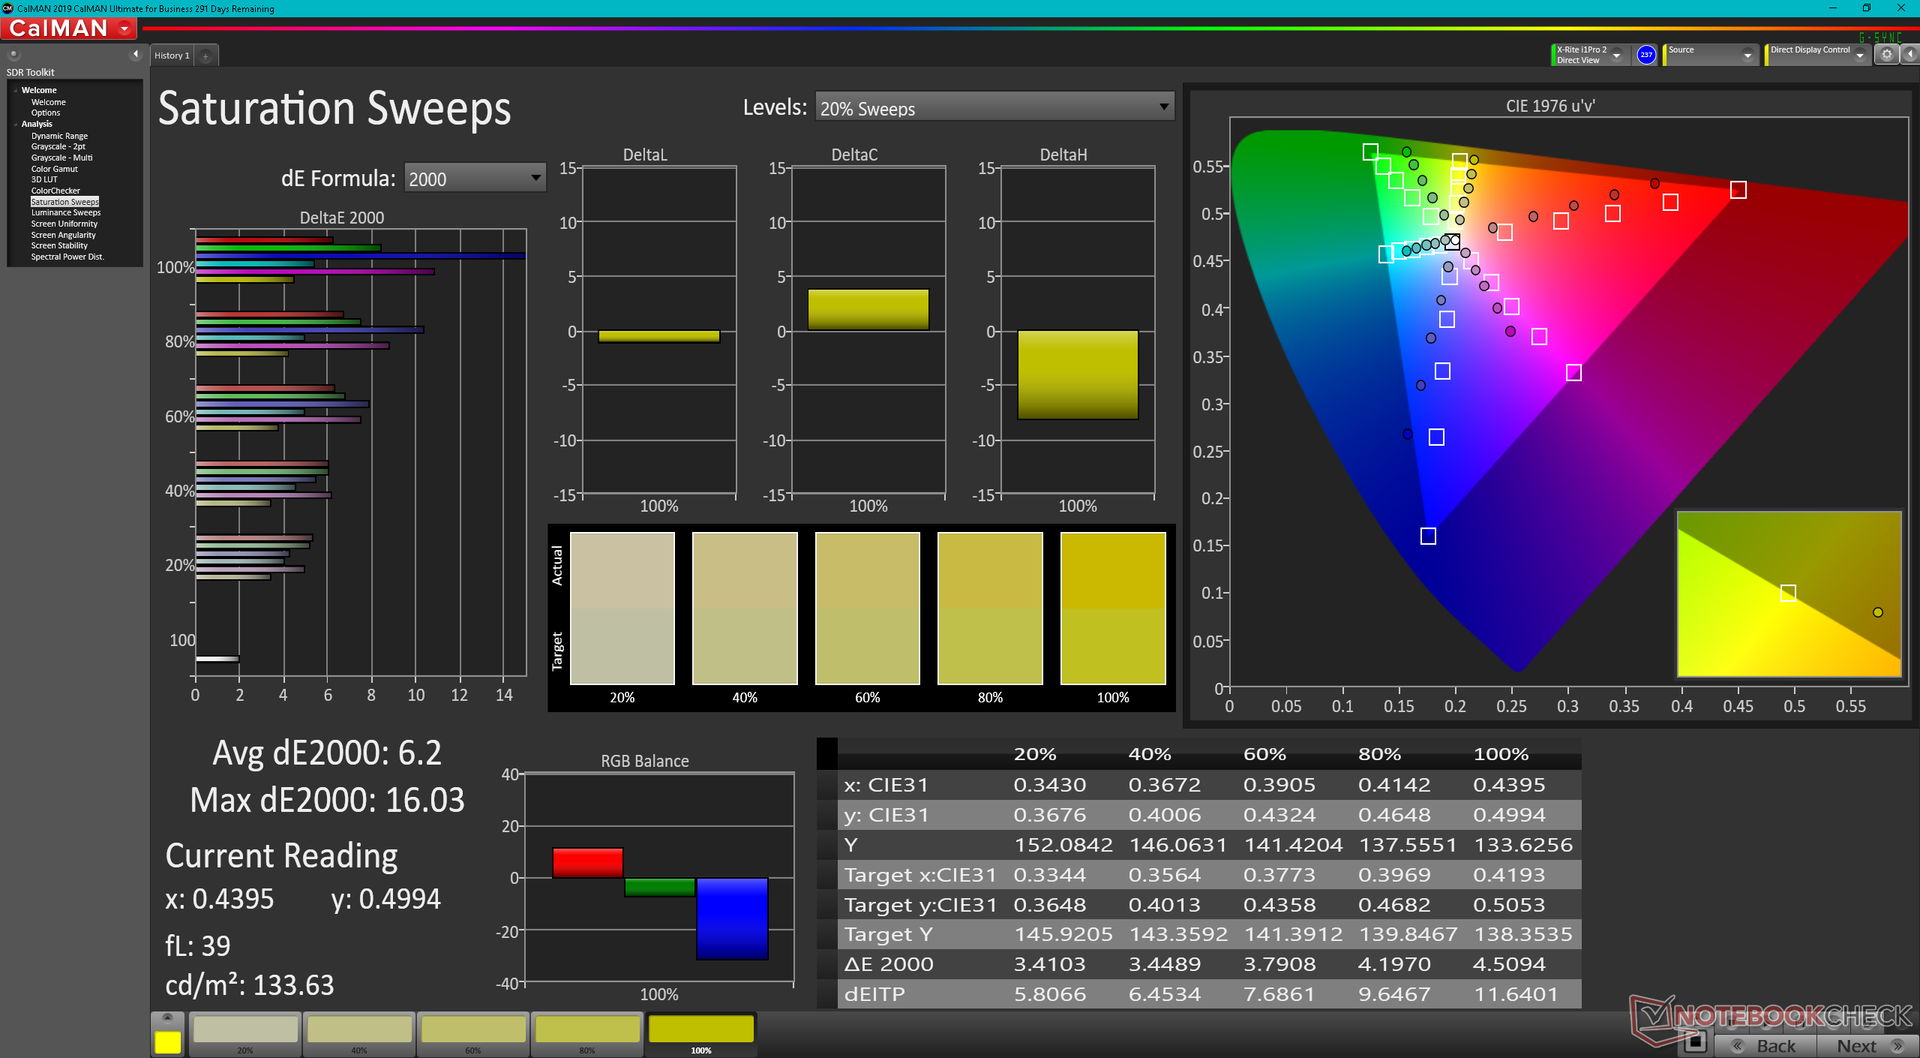
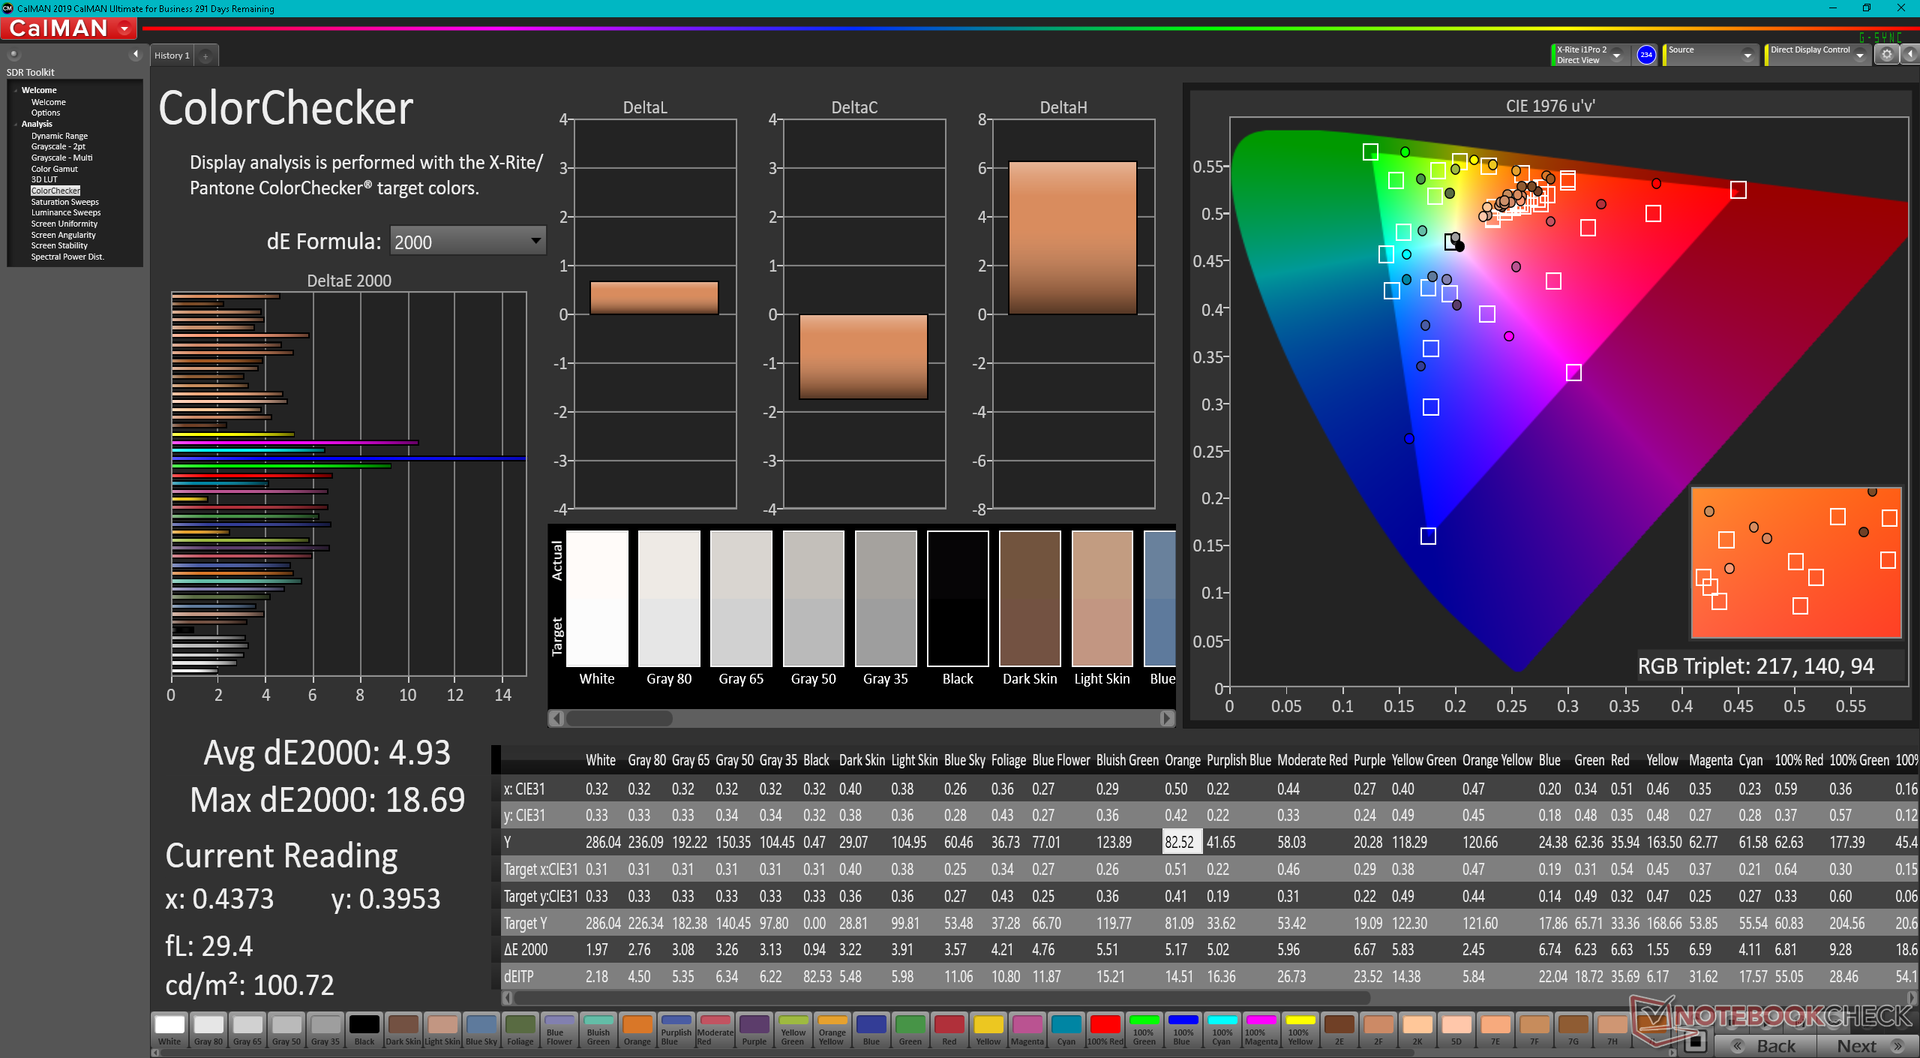
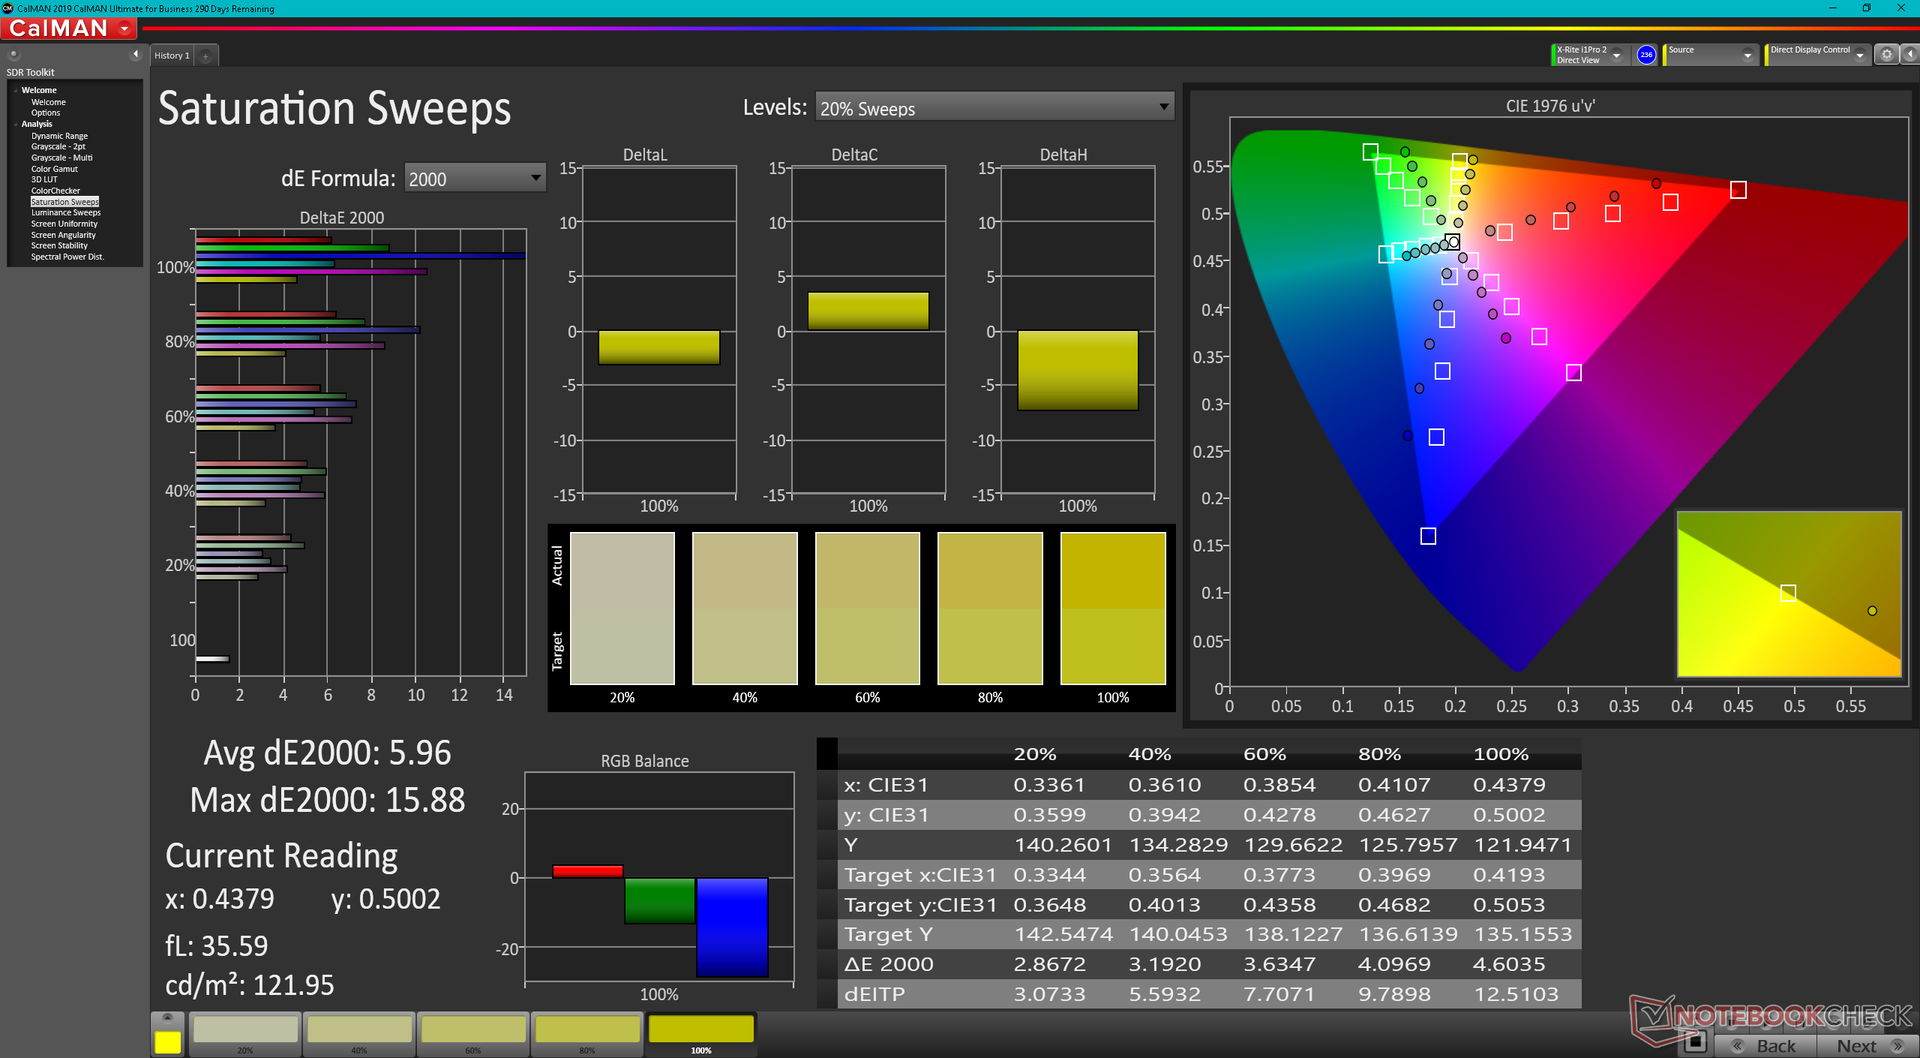
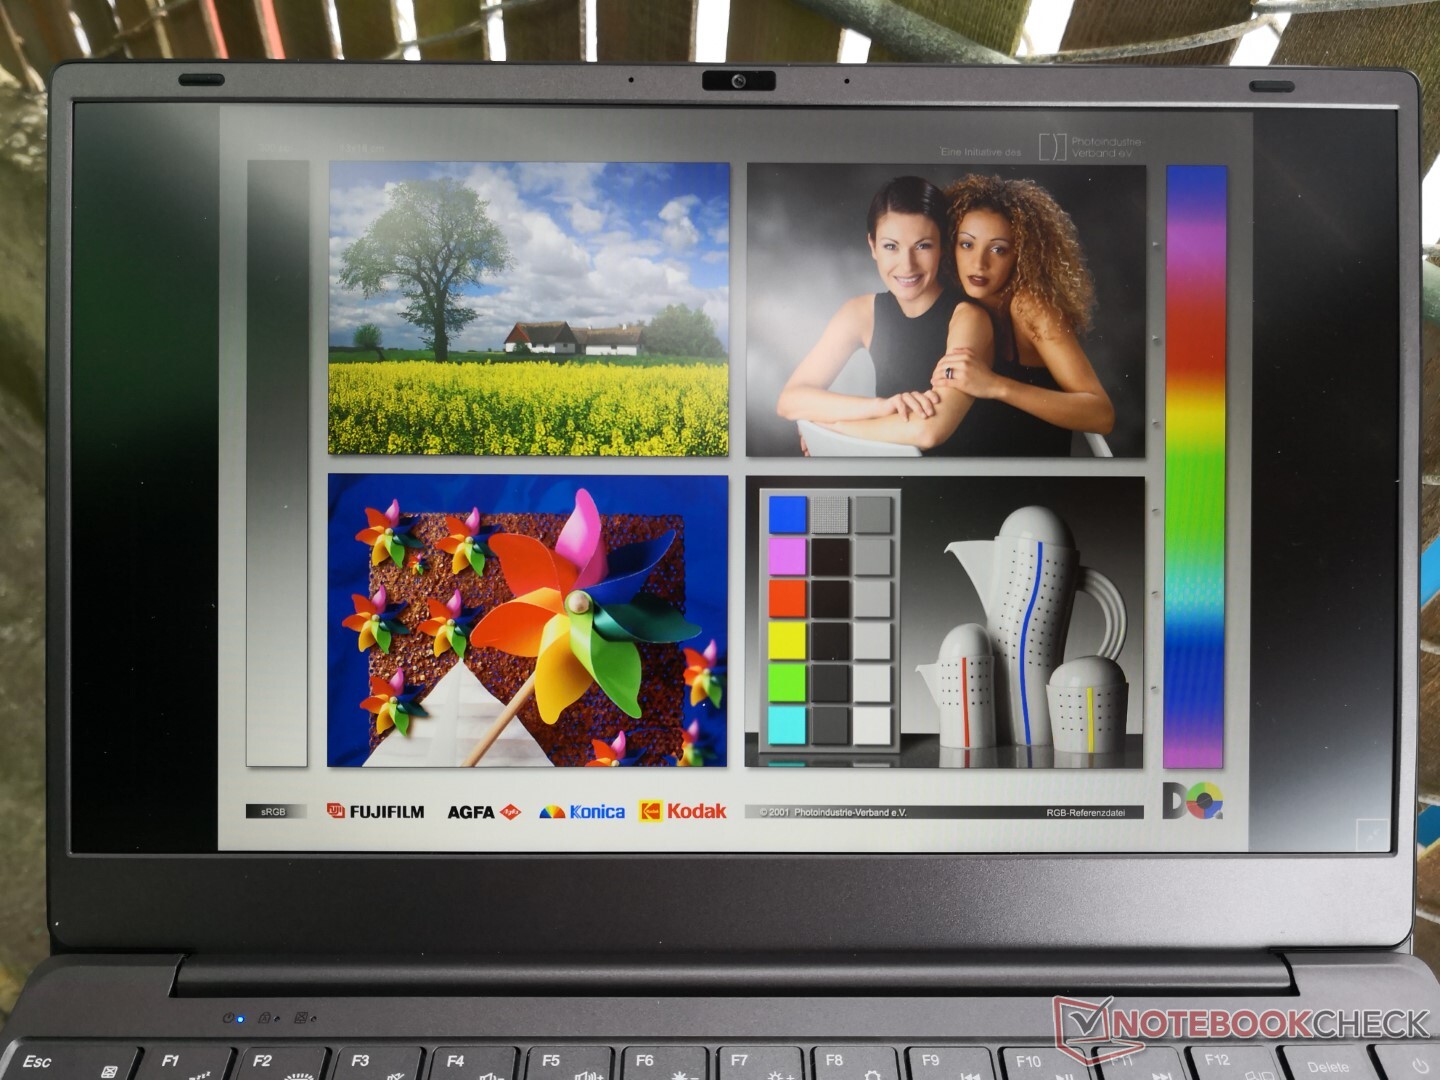
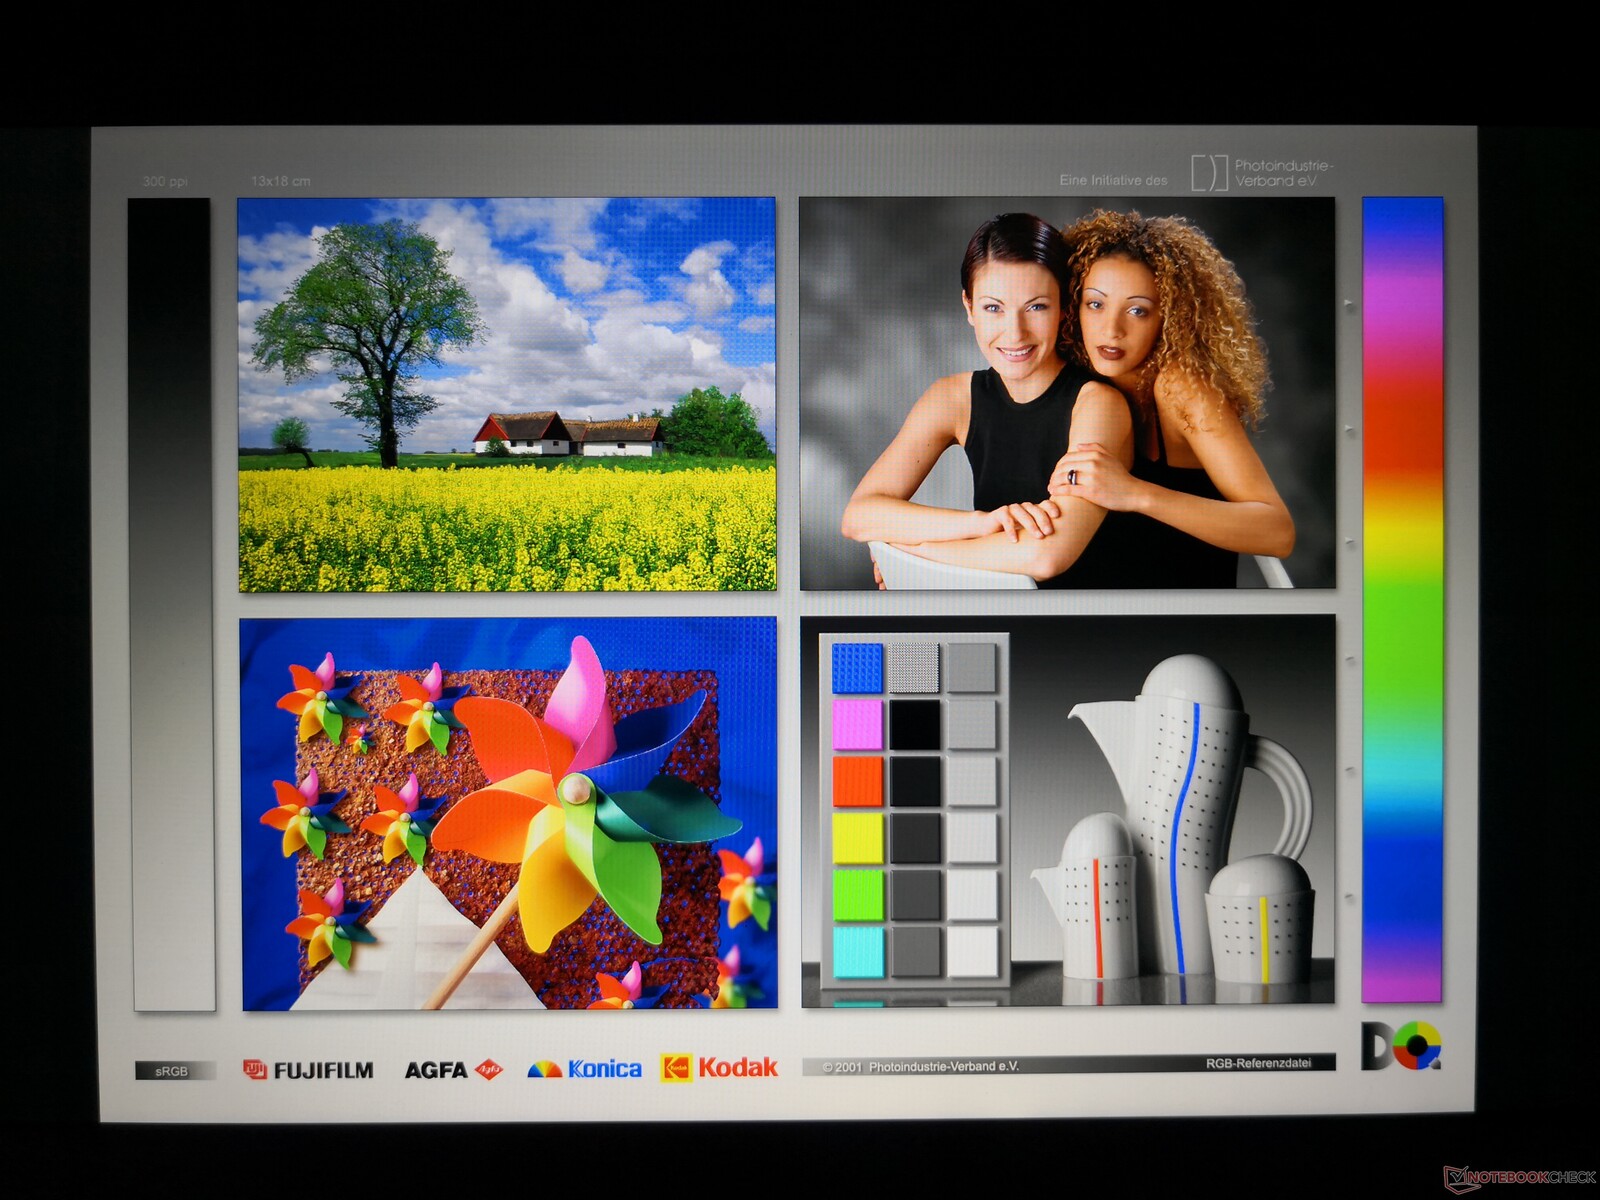
显示
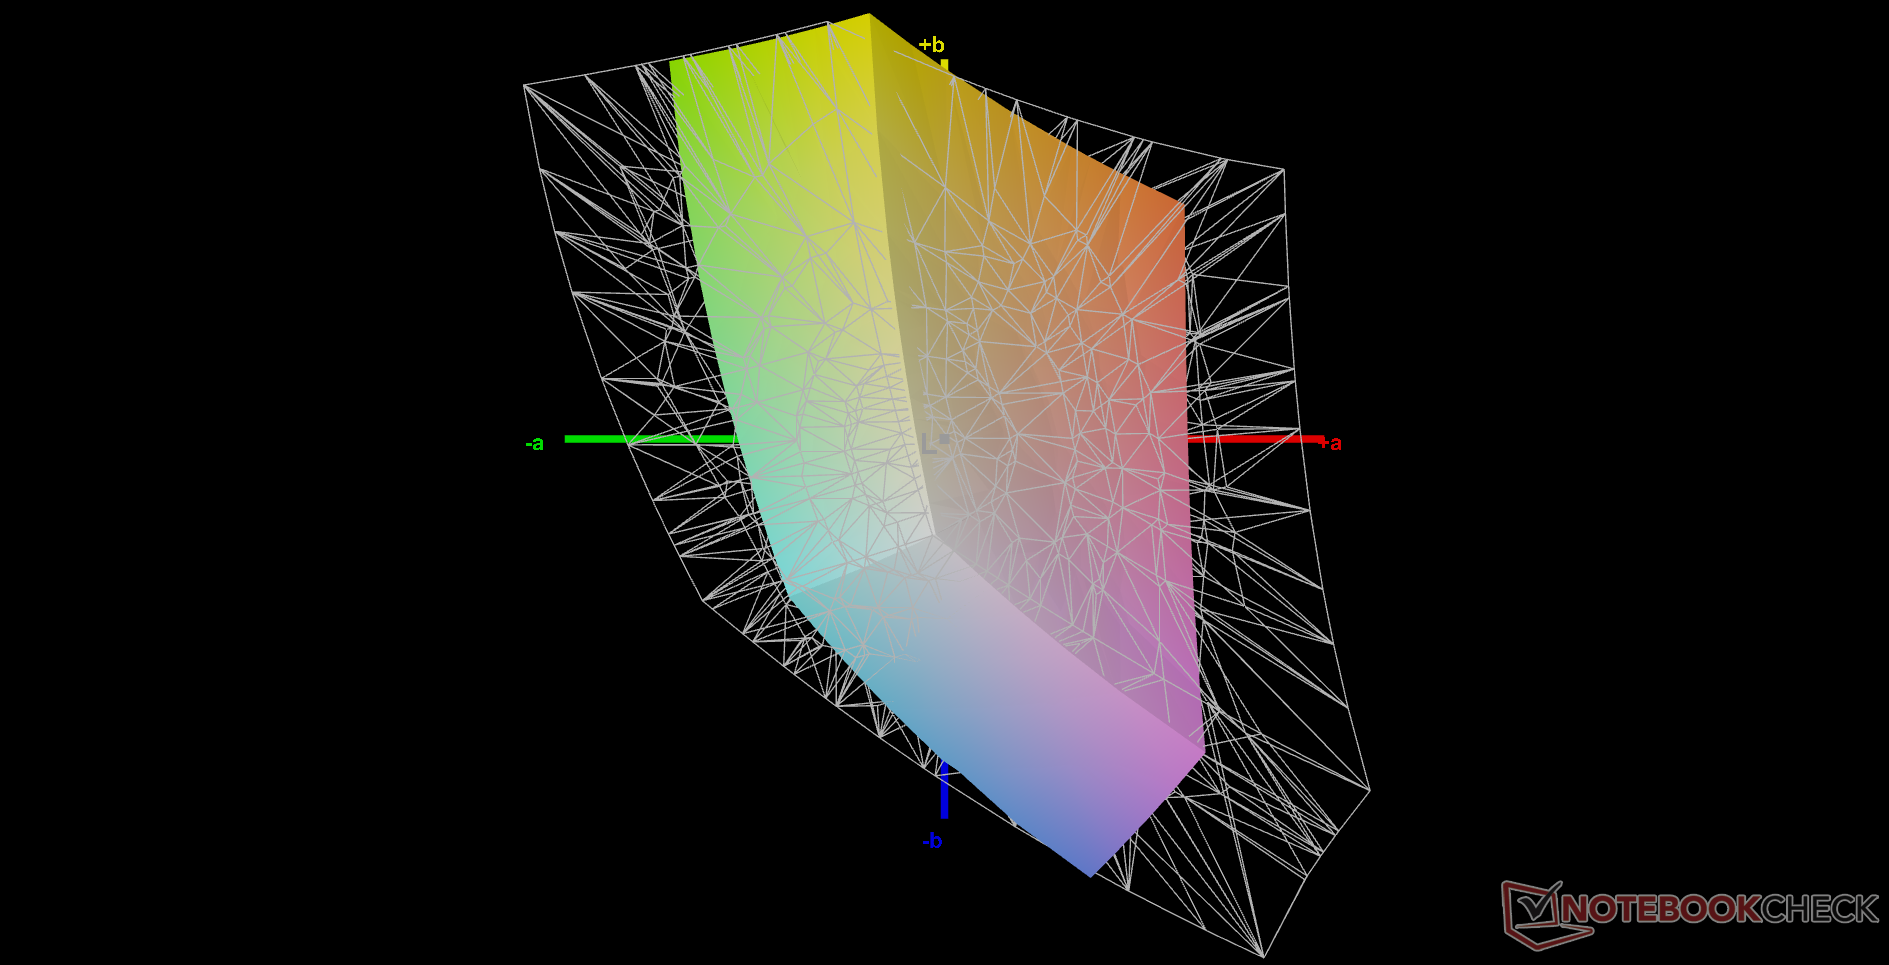
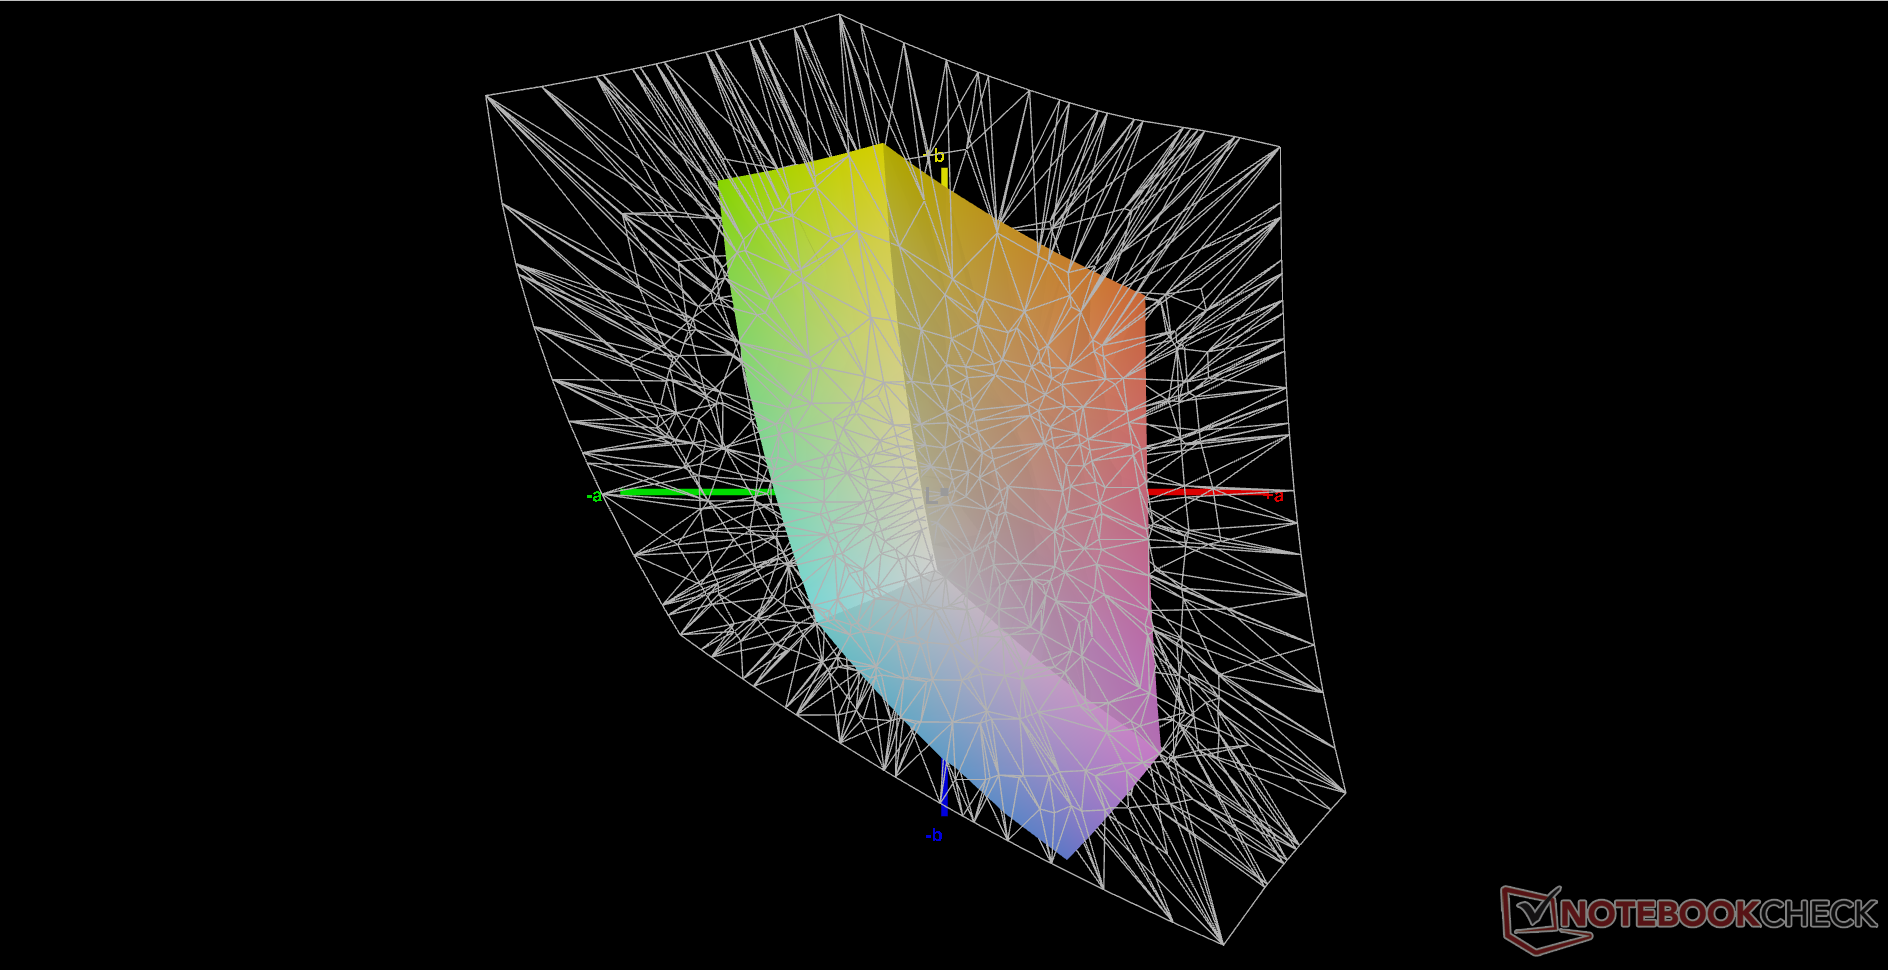
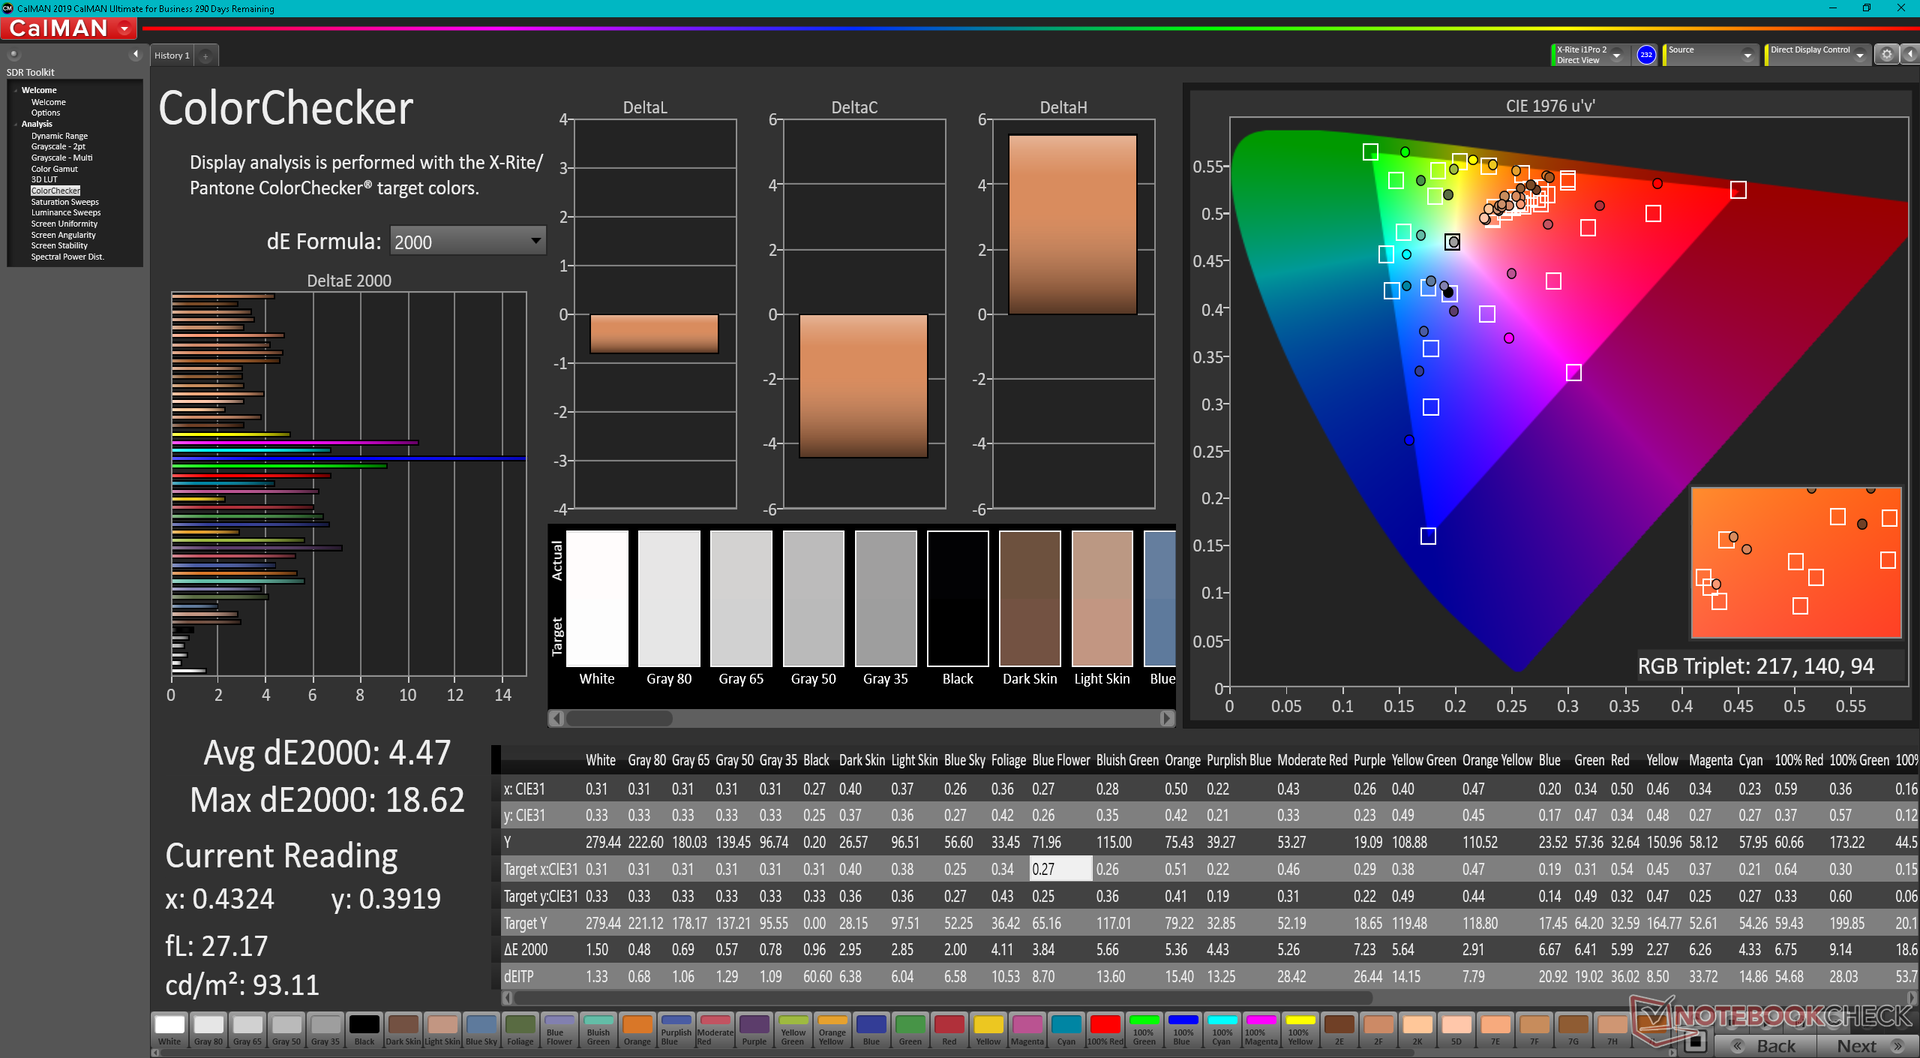
BMax使用的是京东方NV140FHM-N48 IPS面板,与联想ThinkPad E14上的面板相同。联想ThinkPad E14,ThinkPad L14 G2, 或 IdeaPad S540.这是一款经济型面板,色彩覆盖面有限,黑白和灰度响应时间缓慢,对比度有限,正如我们下面的X-Rite测量结果所示。
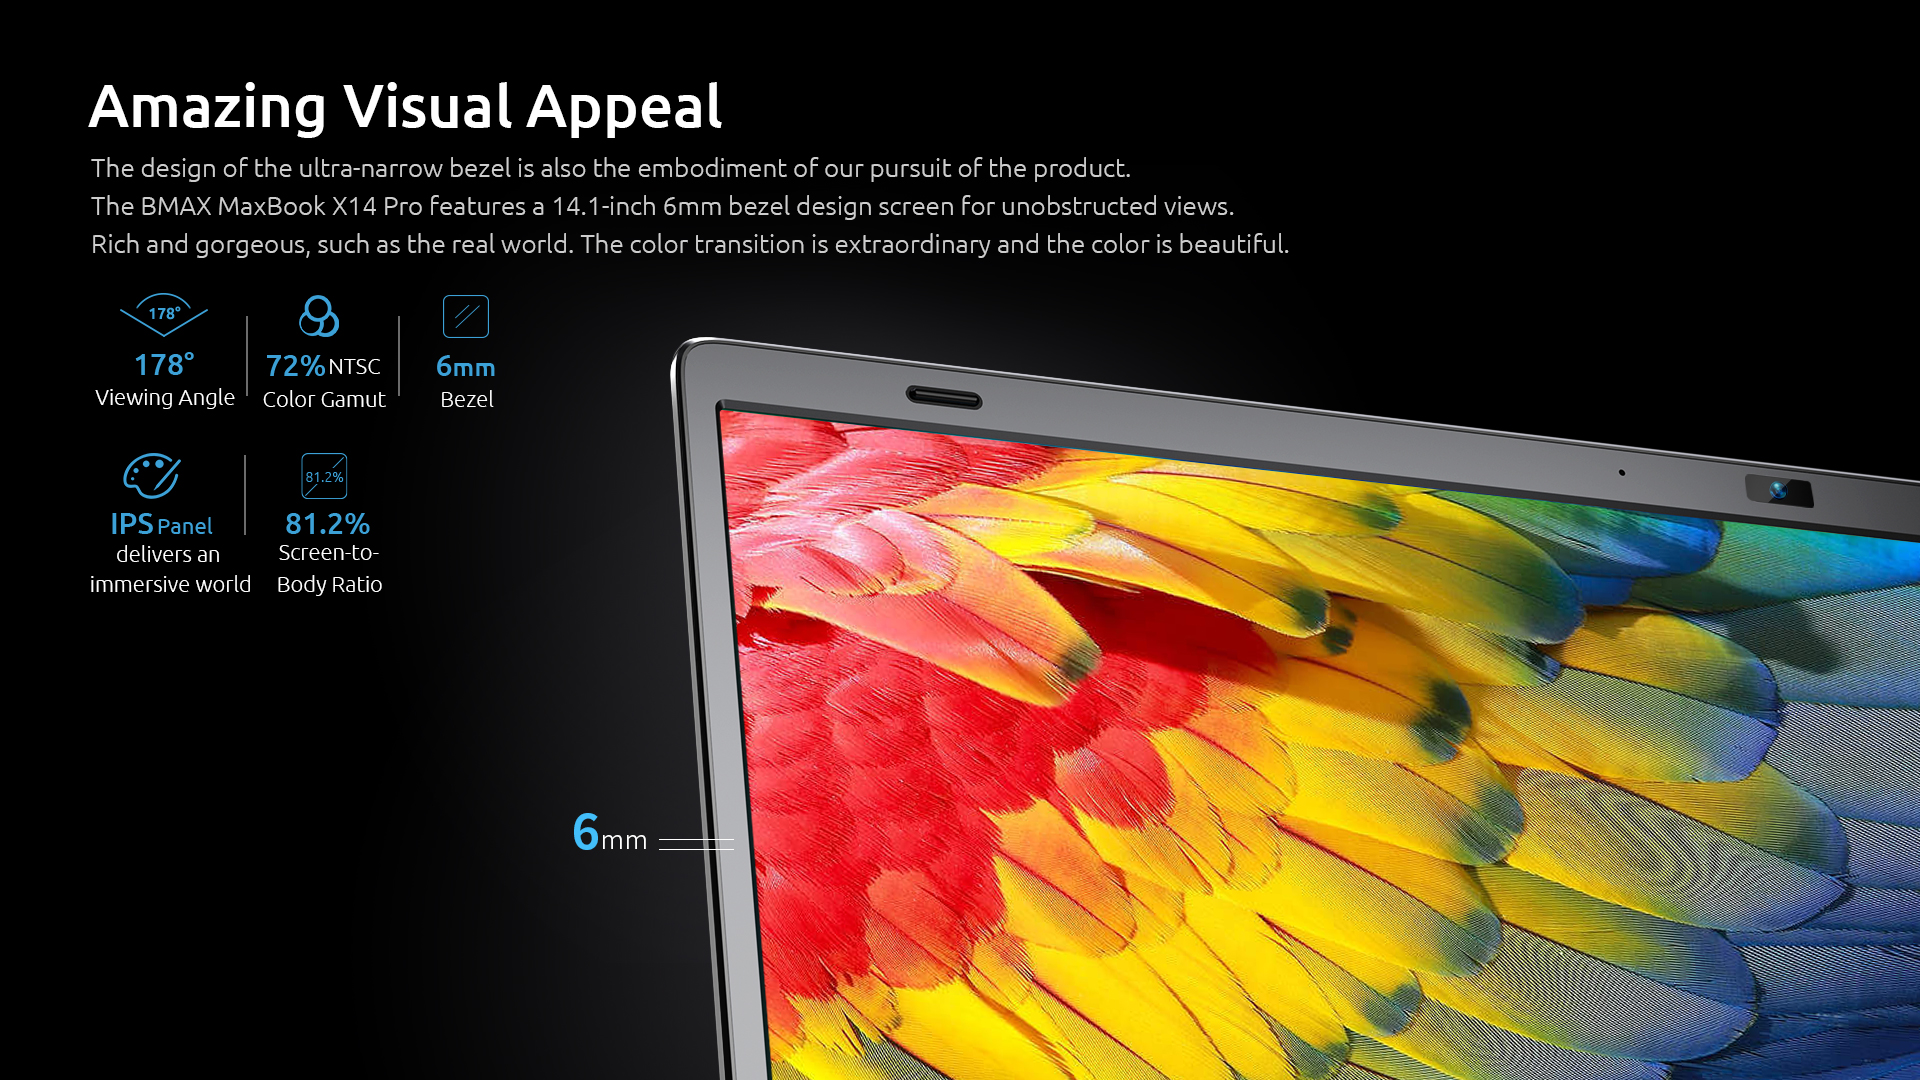
值得一提的是,制造商目前宣传的是14.1英寸的屏幕尺寸,具有完整的sRGB覆盖。实际上,X14 Pro有一个14.0英寸的显示屏,sRGB覆盖率只有59%。如果全sRGB覆盖率对你的工作负荷很重要,我们不建议购买这台Max。
| |||||||||||||||||||||||||
Brightness Distribution: 87 %
Center on Battery: 285.4 cd/m²
Contrast: 571:1 (Black: 0.5 cd/m²)
ΔE ColorChecker Calman: 4.93 | ∀{0.5-29.43 Ø4.72}
calibrated: 4.47
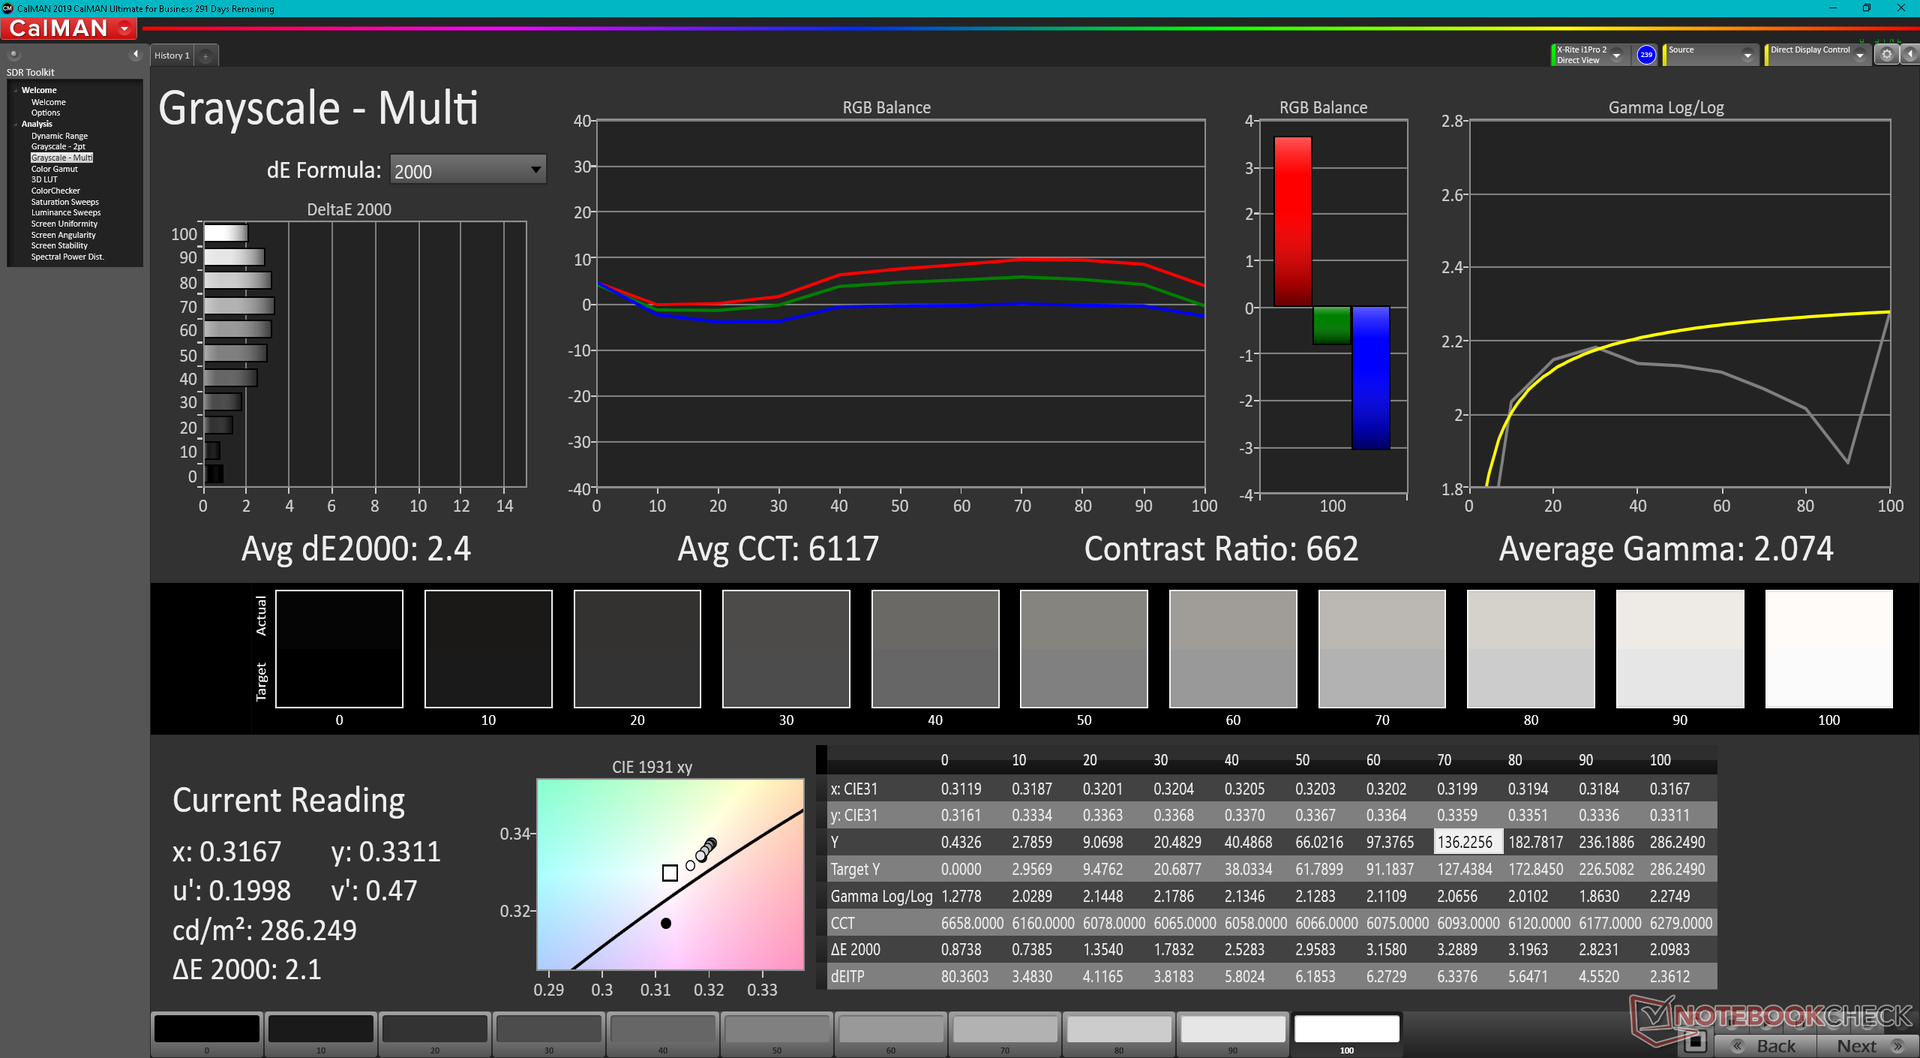
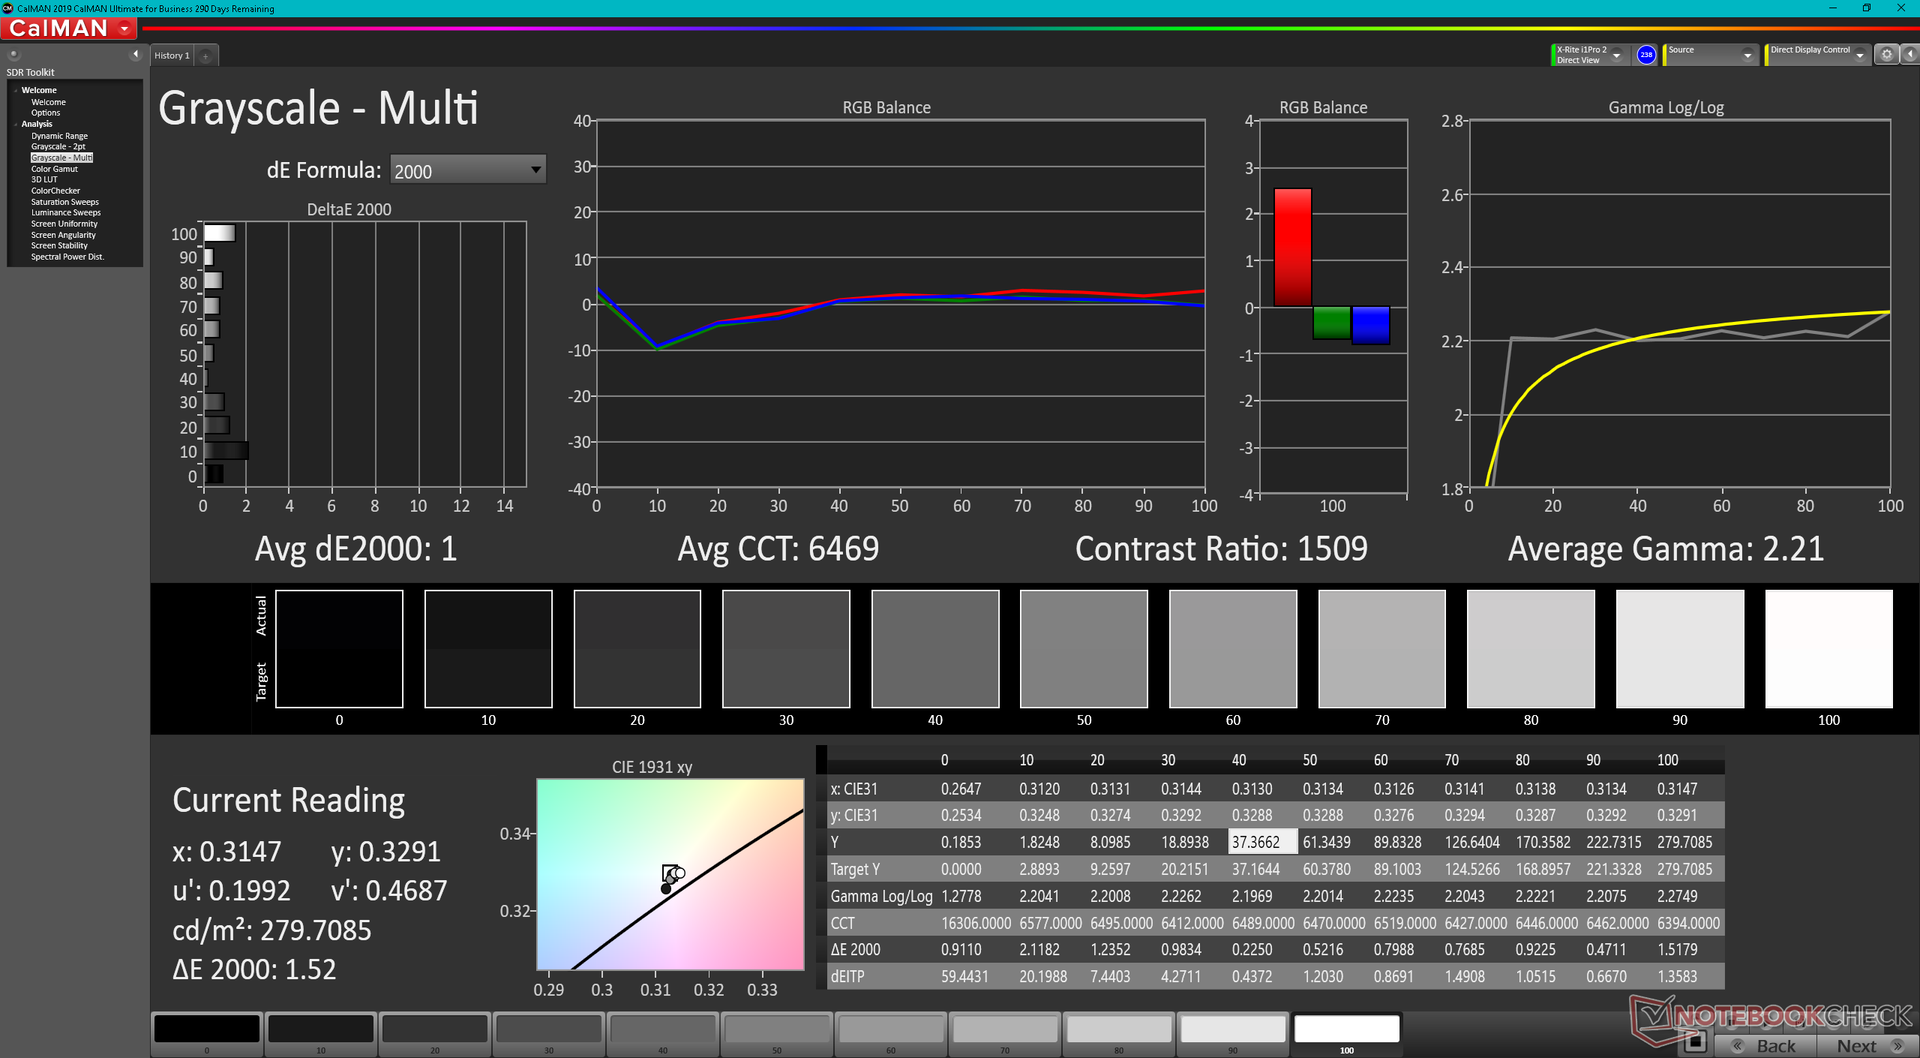
ΔE Greyscale Calman: 2.4 | ∀{0.09-98 Ø4.97}
41.7% AdobeRGB 1998 (Argyll 3D)
59.2% sRGB (Argyll 3D)
40.4% Display P3 (Argyll 3D)
Gamma: 2.07
CCT: 6117 K
| BMAX X14 Pro BOE NV140FHM-N48, IPS, 1920x1080, 14" | Lenovo IdeaPad 5 Pro 14ACN6 LEN140WUXGA+, IPS, 2240x1400, 14" | Dell Inspiron 14 7400 7415 2-in-1 Chi Mei 140HCA, IPS, 1920x1080, 14" | HP Pavilion 14-dv0357ng LGD0619, IPS, 1920x1080, 14" | Huawei MateBook 14 2020 Intel TV140WTM-NH0, IPS LED, 2160x1440, 14" | Infinix INBook X2 140PM42D1568, IPS, 1920x1080, 14" | |
|---|---|---|---|---|---|---|
| Display | 75% | 6% | 53% | 66% | 53% | |
| Display P3 Coverage (%) | 40.4 | 72.2 79% | 42.5 5% | 62 53% | 67.1 66% | 62.7 55% |
| sRGB Coverage (%) | 59.2 | 99.5 68% | 63.1 7% | 92 55% | 99.1 67% | 89.2 51% |
| AdobeRGB 1998 Coverage (%) | 41.7 | 74.3 78% | 44 6% | 63 51% | 69 65% | 64.1 54% |
| Response Times | 14% | 38% | 46% | 38% | -14% | |
| Response Time Grey 50% / Grey 80% * (ms) | 62.8 ? | 45.2 ? 28% | 28.8 ? 54% | 37 ? 41% | 37.6 ? 40% | 65.2 ? -4% |
| Response Time Black / White * (ms) | 34.8 ? | 35.2 ? -1% | 27.6 ? 21% | 17 ? 51% | 22.4 ? 36% | 43.2 ? -24% |
| PWM Frequency (Hz) | 59520 ? | 10000 ? | ||||
| Screen | 39% | -17% | 14% | 50% | 13% | |
| Brightness middle (cd/m²) | 285.4 | 310.6 9% | 262.7 -8% | 387 36% | 458 60% | 368 29% |
| Brightness (cd/m²) | 267 | 302 13% | 245 -8% | 359 34% | 448 68% | 331 24% |
| Brightness Distribution (%) | 87 | 92 6% | 84 -3% | 84 -3% | 89 2% | 82 -6% |
| Black Level * (cd/m²) | 0.5 | 0.22 56% | 0.37 26% | 0.55 -10% | 0.25 50% | 0.39 22% |
| Contrast (:1) | 571 | 1412 147% | 710 24% | 704 23% | 1832 221% | 944 65% |
| Colorchecker dE 2000 * | 4.93 | 2.67 46% | 6.23 -26% | 4.04 18% | 3.4 31% | 4.9 1% |
| Colorchecker dE 2000 max. * | 18.69 | 4.54 76% | 22.62 -21% | 8.28 56% | 6.7 64% | 8.22 56% |
| Colorchecker dE 2000 calibrated * | 4.47 | 2.33 48% | 1.8 60% | 1 78% | 1.7 62% | 1.59 64% |
| Greyscale dE 2000 * | 2.4 | 3.7 -54% | 7.1 -196% | 5 -108% | 4.9 -104% | 5.8 -142% |
| Gamma | 2.07 106% | 2.12 104% | 2.22 99% | 2.62 84% | 2.16 102% | 2.13 103% |
| CCT | 6117 106% | 6398 102% | 6241 104% | 7123 91% | 7704 84% | 7163 91% |
| Color Space (Percent of AdobeRGB 1998) (%) | 63.5 | |||||
| Color Space (Percent of sRGB) (%) | 99.1 | |||||
| Total Average (Program / Settings) | 43% /
43% | 9% /
-4% | 38% /
27% | 51% /
52% | 17% /
18% |
* ... smaller is better
尽管色温偏暖,但该显示器开箱后的校准效果还不错。由于上述面板的色彩空间较窄,用X-Rite色度计校准后,平均DeltaE值仅有小幅提高。
Display Response Times
| ↔ Response Time Black to White | ||
|---|---|---|
| 34.8 ms ... rise ↗ and fall ↘ combined | ↗ 18.4 ms rise | 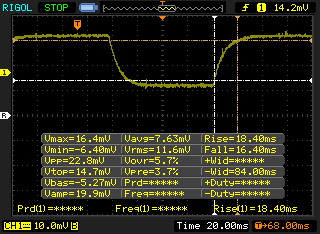 |
| ↘ 16.4 ms fall | ||
| The screen shows slow response rates in our tests and will be unsatisfactory for gamers. In comparison, all tested devices range from 0.1 (minimum) to 240 (maximum) ms. » 92 % of all devices are better. This means that the measured response time is worse than the average of all tested devices (19.8 ms). | ||
| ↔ Response Time 50% Grey to 80% Grey | ||
| 62.8 ms ... rise ↗ and fall ↘ combined | ↗ 32.8 ms rise | 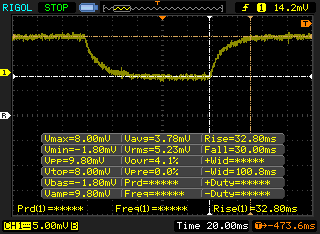 |
| ↘ 30 ms fall | ||
| The screen shows slow response rates in our tests and will be unsatisfactory for gamers. In comparison, all tested devices range from 0.165 (minimum) to 636 (maximum) ms. » 97 % of all devices are better. This means that the measured response time is worse than the average of all tested devices (31 ms). | ||
Screen Flickering / PWM (Pulse-Width Modulation)
| Screen flickering / PWM not detected | 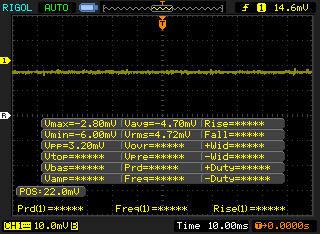 | ||
In comparison: 52 % of all tested devices do not use PWM to dim the display. If PWM was detected, an average of 7753 (minimum: 5 - maximum: 343500) Hz was measured. | |||
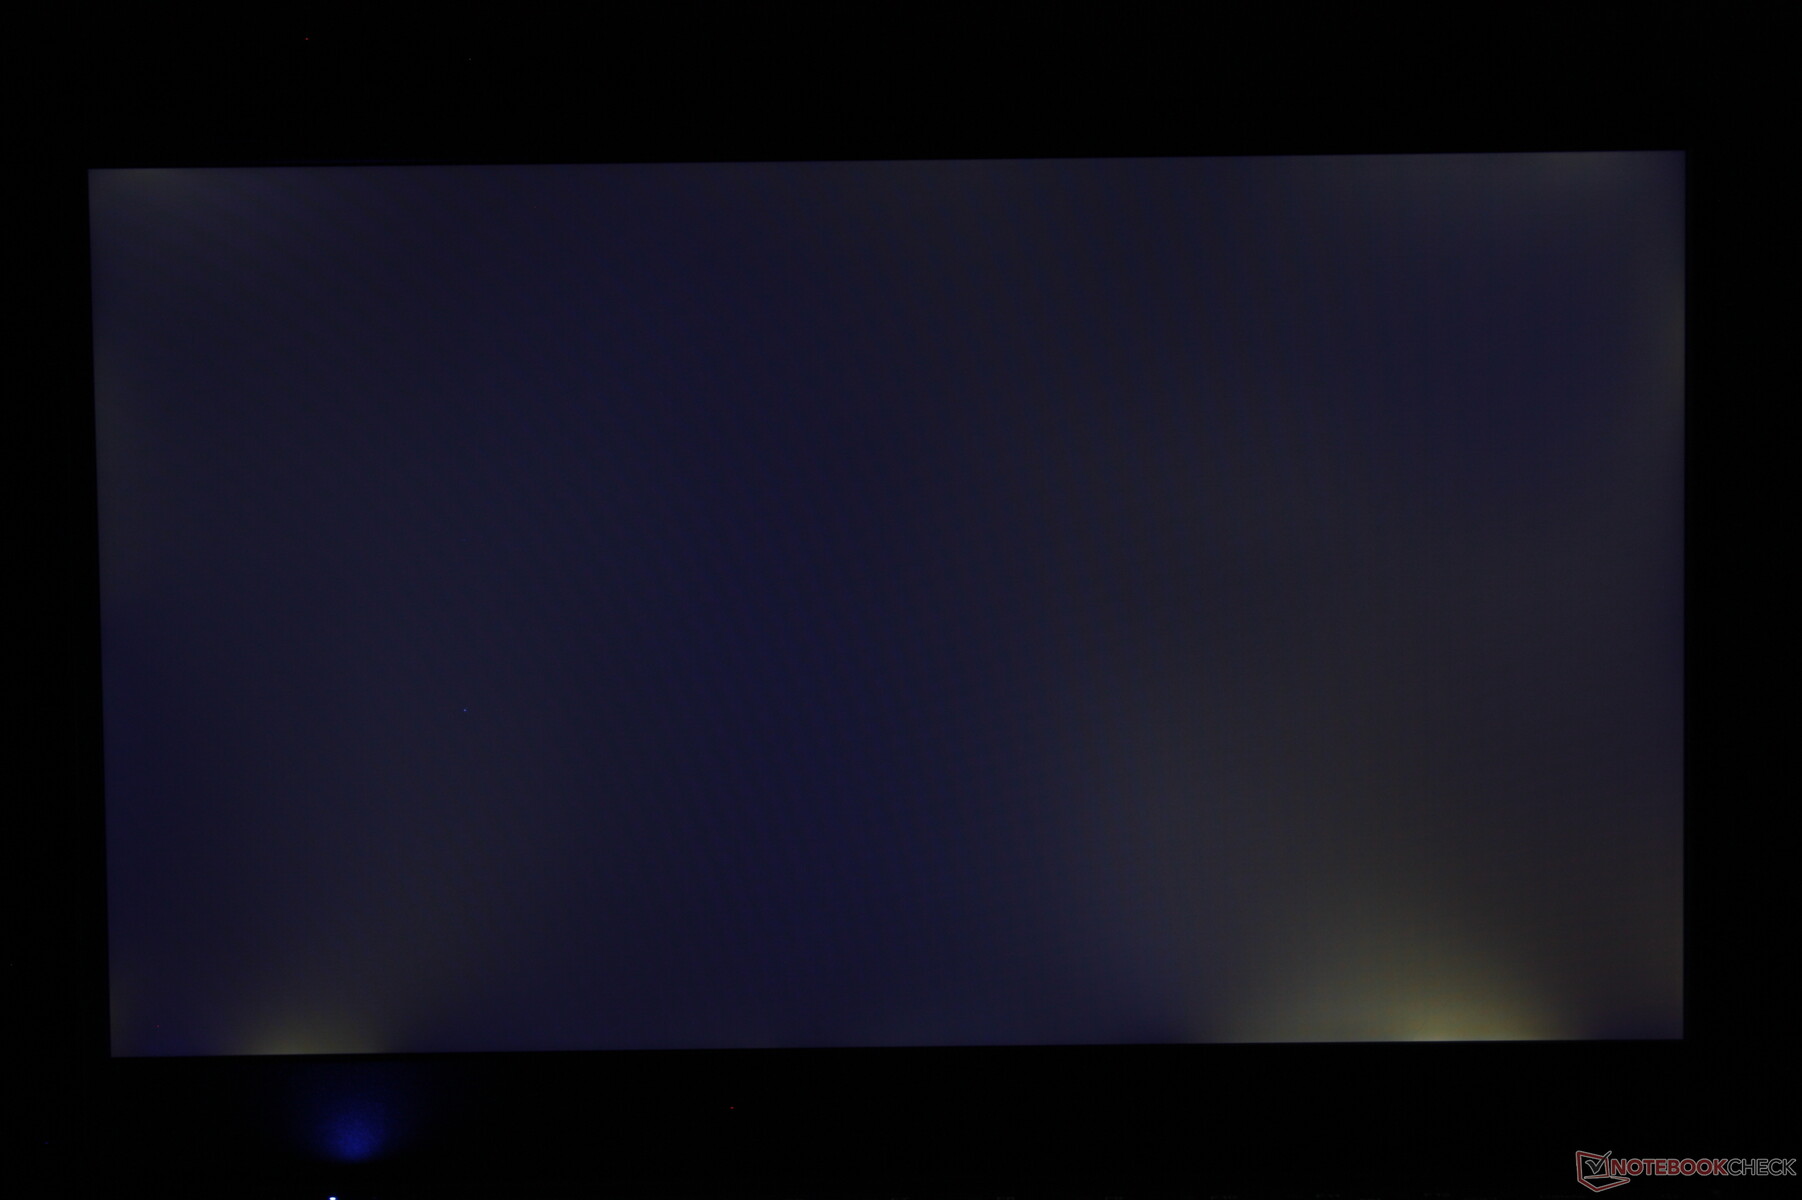
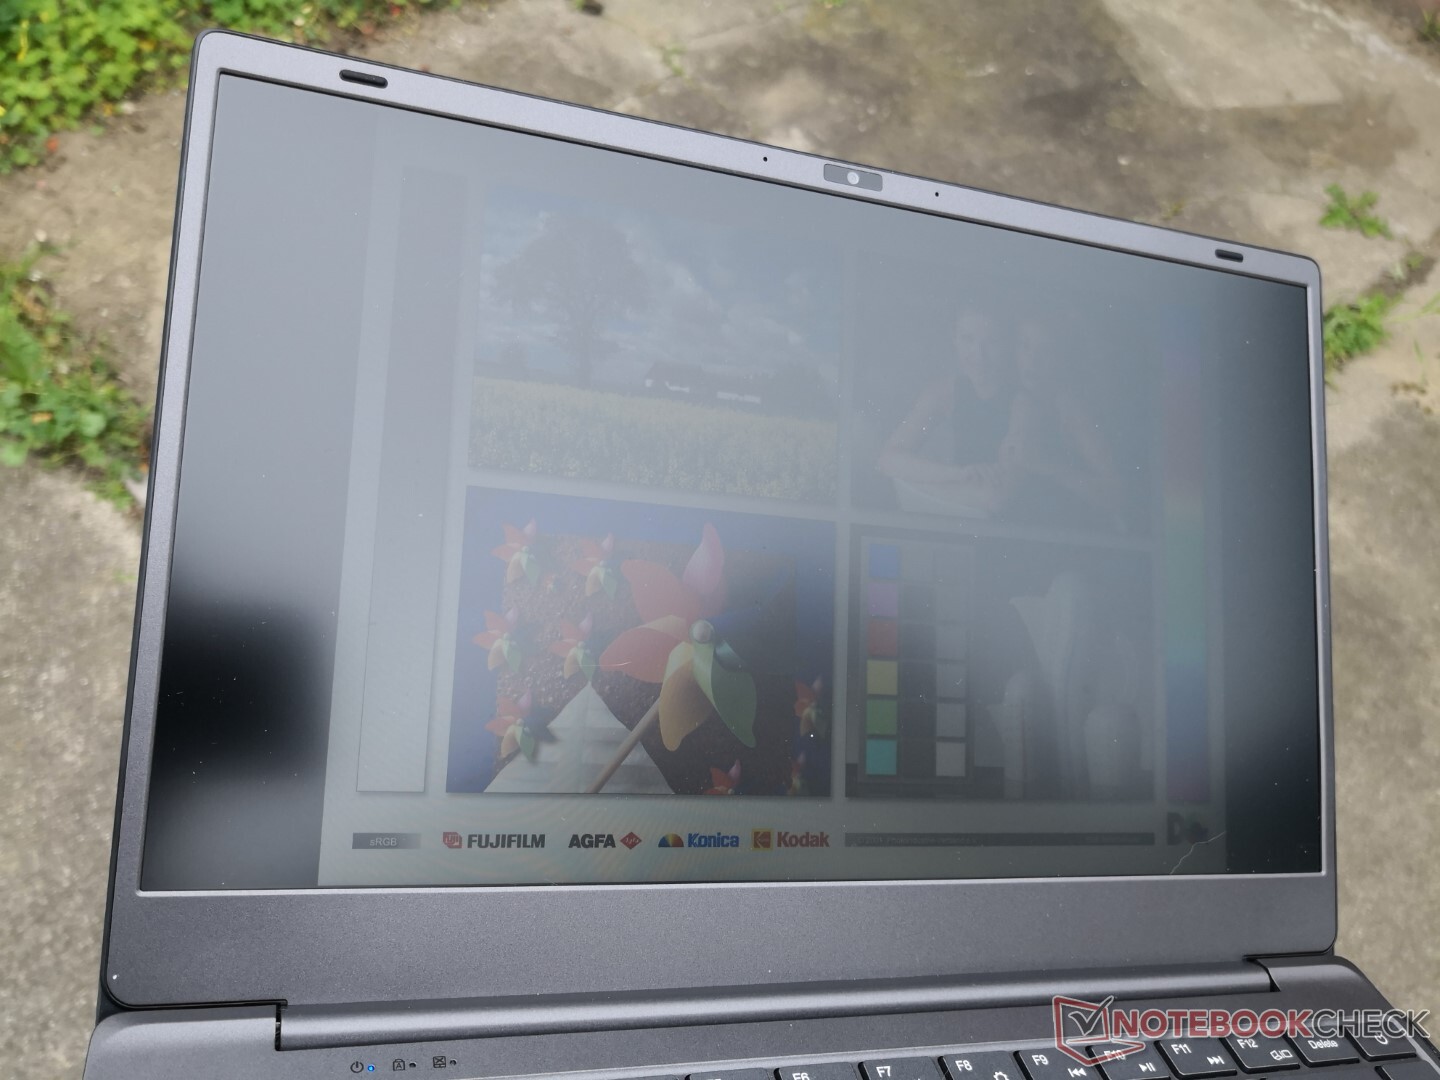
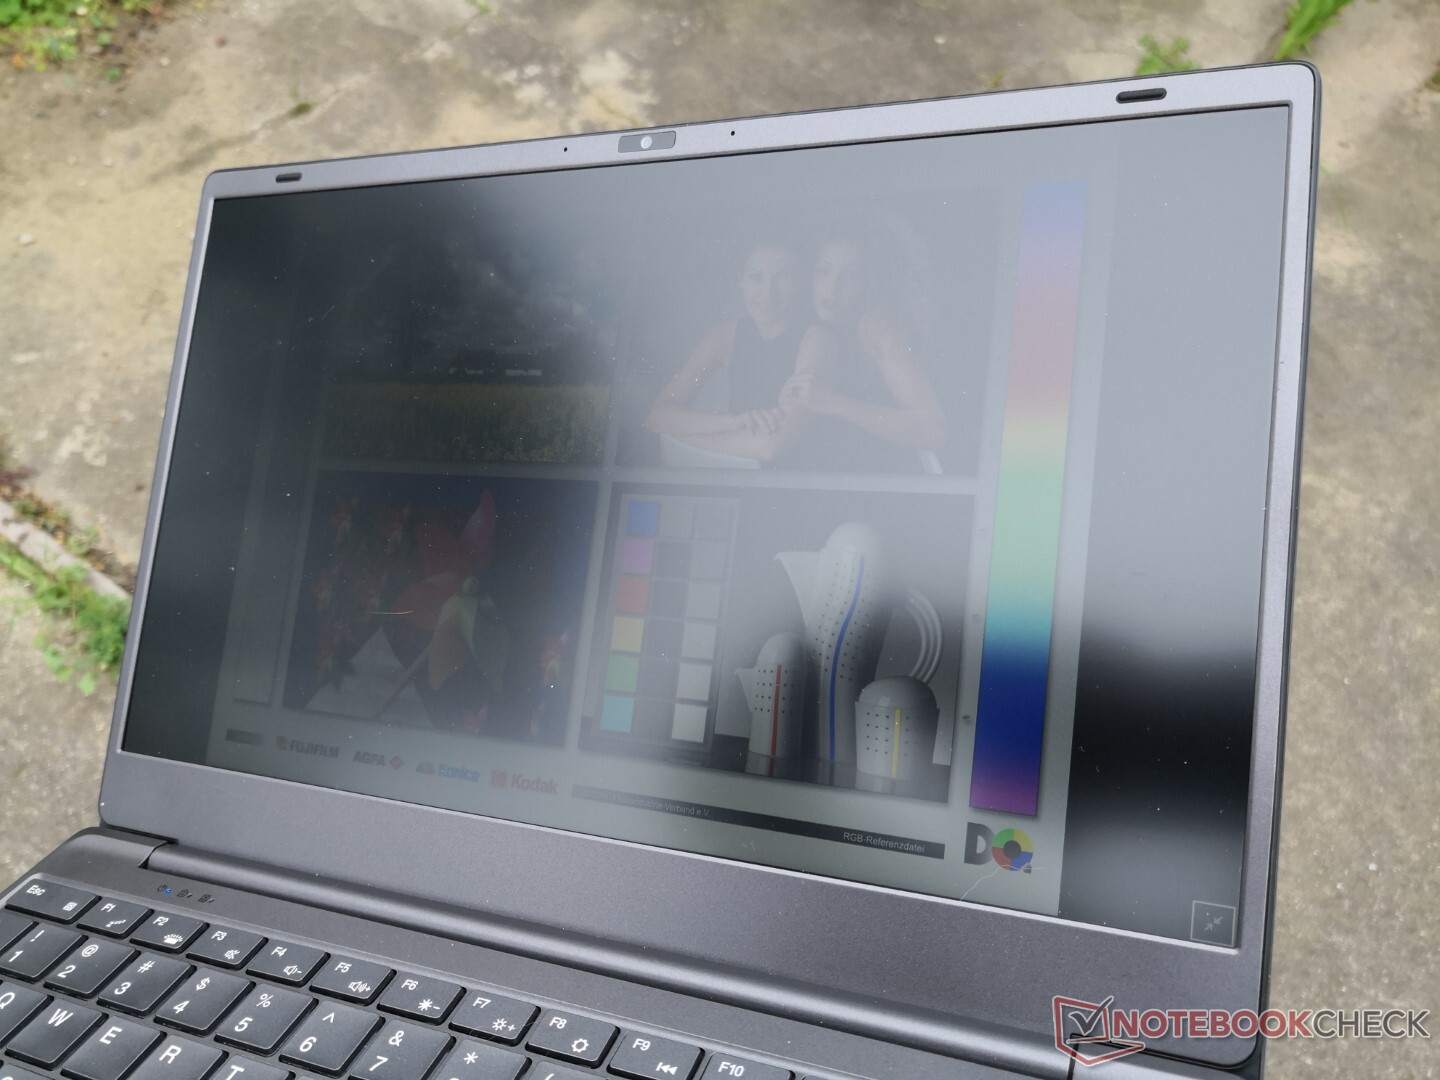
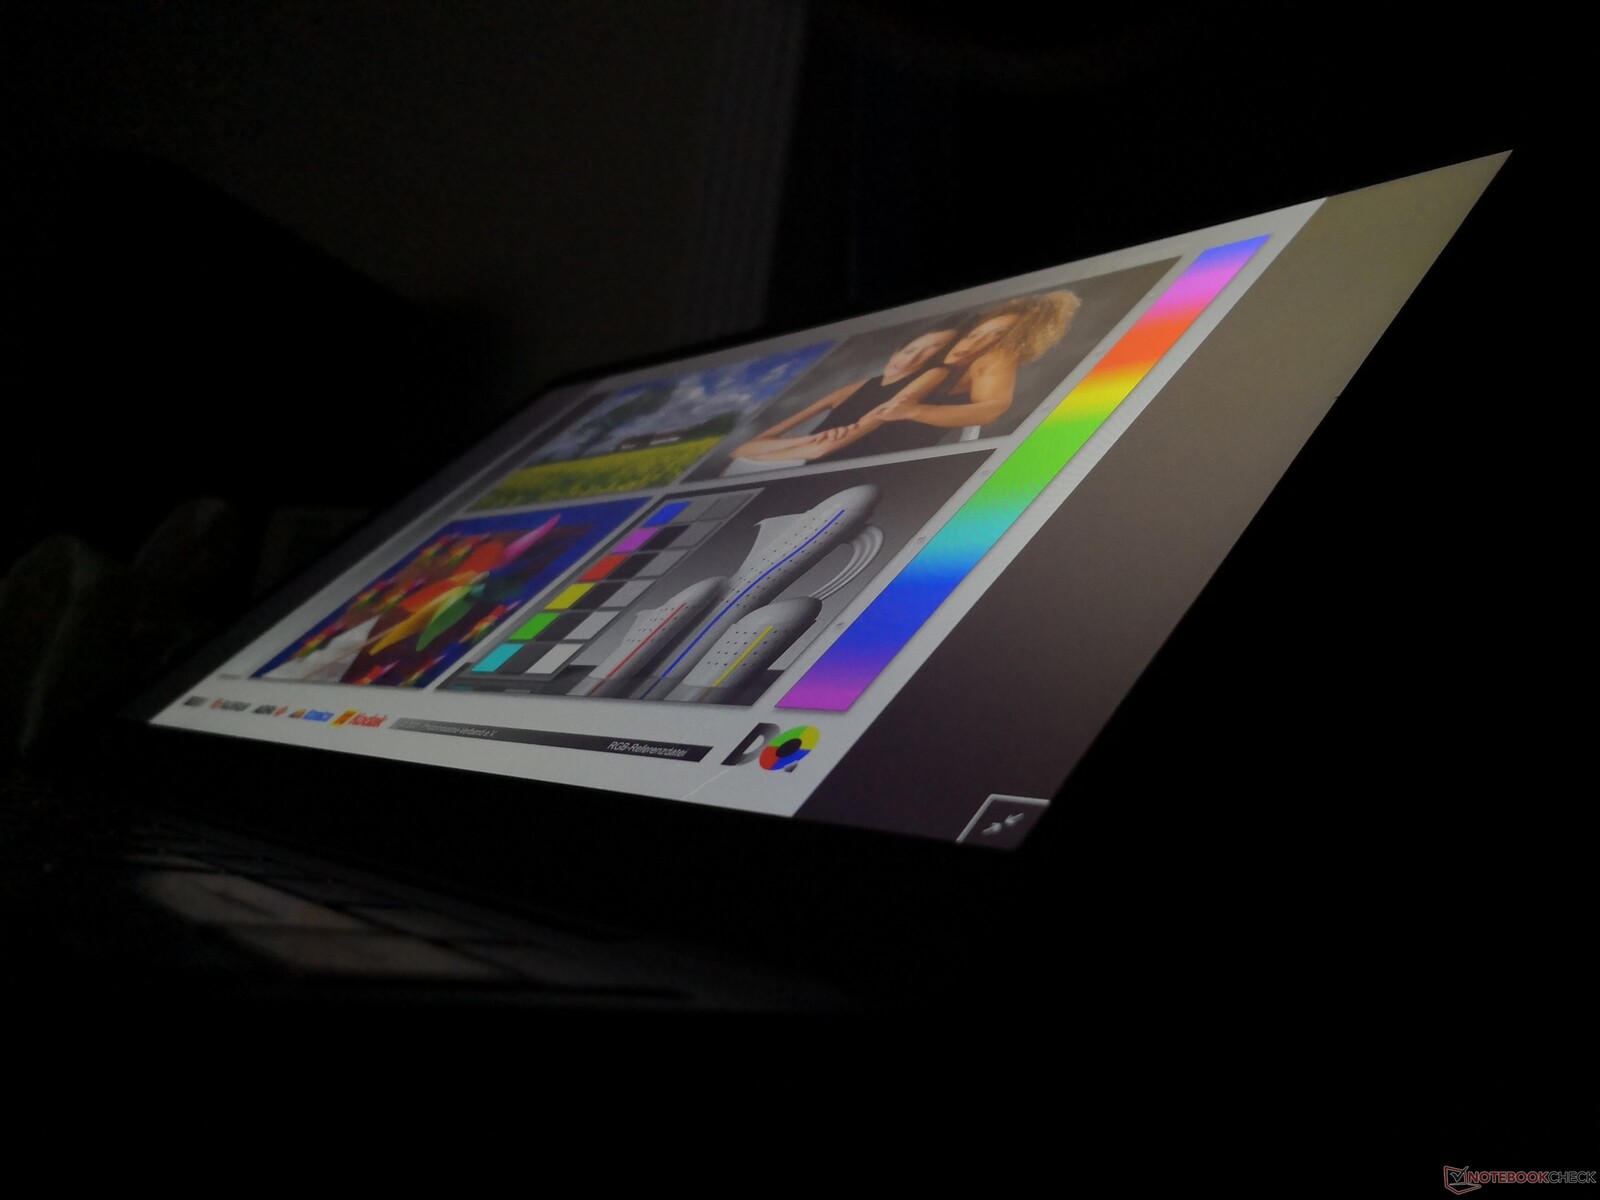
由于<300尼特的背光,户外能见度相对较差,最多只能算是一般。请确保在Radeon图形菜单下禁用AMD Vari-Bright,否则在电池供电的情况下,面板的最大亮度将只有166尼特。
业绩
测试条件
在运行以下任何基准测试之前,我们的设备被设置为性能模式,使用最新的AMD驱动程序和Windows更新,以获得尽可能高的分数。
处理器
原始多线程性能类似于第11代 酷睿i3-1115G4而单线程性能较慢,与第十代酷睿i5-1035G1最相似。 酷睿i5-1035G1.AMD的移动Zen系列直到Zen 2代才在性能方面真正起飞,因此Zen+ Ryzen 5 3450U只能与低端的英特尔酷睿CPU相媲美。
Cinebench R15 Multi Loop
Cinebench R23: Multi Core | Single Core
Cinebench R15: CPU Multi 64Bit | CPU Single 64Bit
Blender: v2.79 BMW27 CPU
7-Zip 18.03: 7z b 4 | 7z b 4 -mmt1
Geekbench 5.5: Multi-Core | Single-Core
HWBOT x265 Benchmark v2.2: 4k Preset
LibreOffice : 20 Documents To PDF
R Benchmark 2.5: Overall mean
| Cinebench R20 / CPU (Multi Core) | |
| Lenovo IdeaPad 5 Pro 14ACN6 | |
| Dell Inspiron 14 7400 7415 2-in-1 | |
| Asus VivoBook Flip 14 TM420IA | |
| Asus ExpertBook B7 Flip B7402FEA | |
| HP Pavilion 14-dv0357ng | |
| Acer Swift 3 SF314-42-R27B | |
| Infinix INBook X2 | |
| Lenovo ThinkBook 14 G2 ITL 20VDS02G00 | |
| BMAX X14 Pro | |
| Average AMD Ryzen 5 3450U (1089 - 1247, n=2) | |
| Lenovo IdeaPad 3 14IIL05 | |
| Cinebench R20 / CPU (Single Core) | |
| Asus ExpertBook B7 Flip B7402FEA | |
| Lenovo IdeaPad 5 Pro 14ACN6 | |
| Lenovo ThinkBook 14 G2 ITL 20VDS02G00 | |
| Dell Inspiron 14 7400 7415 2-in-1 | |
| Asus VivoBook Flip 14 TM420IA | |
| Acer Swift 3 SF314-42-R27B | |
| Infinix INBook X2 | |
| HP Pavilion 14-dv0357ng | |
| BMAX X14 Pro | |
| Lenovo IdeaPad 3 14IIL05 | |
| Average AMD Ryzen 5 3450U (292 - 351, n=2) | |
| Cinebench R23 / Multi Core | |
| Lenovo IdeaPad 5 Pro 14ACN6 | |
| Dell Inspiron 14 7400 7415 2-in-1 | |
| Asus ExpertBook B7 Flip B7402FEA | |
| HP Pavilion 14-dv0357ng | |
| Infinix INBook X2 | |
| Lenovo ThinkBook 14 G2 ITL 20VDS02G00 | |
| BMAX X14 Pro | |
| Average AMD Ryzen 5 3450U (2658 - 3195, n=2) | |
| Cinebench R23 / Single Core | |
| Asus ExpertBook B7 Flip B7402FEA | |
| Lenovo IdeaPad 5 Pro 14ACN6 | |
| Lenovo ThinkBook 14 G2 ITL 20VDS02G00 | |
| HP Pavilion 14-dv0357ng | |
| Dell Inspiron 14 7400 7415 2-in-1 | |
| Infinix INBook X2 | |
| BMAX X14 Pro | |
| Average AMD Ryzen 5 3450U (858 - 892, n=2) | |
| Cinebench R15 / CPU Multi 64Bit | |
| Lenovo IdeaPad 5 Pro 14ACN6 | |
| Dell Inspiron 14 7400 7415 2-in-1 | |
| Asus VivoBook Flip 14 TM420IA | |
| Asus ExpertBook B7 Flip B7402FEA | |
| HP Pavilion 14-dv0357ng | |
| Acer Swift 3 SF314-42-R27B | |
| Infinix INBook X2 | |
| Average AMD Ryzen 5 3450U (530 - 603, n=2) | |
| BMAX X14 Pro | |
| Lenovo ThinkBook 14 G2 ITL 20VDS02G00 | |
| Lenovo IdeaPad 3 14IIL05 | |
| Cinebench R15 / CPU Single 64Bit | |
| Asus ExpertBook B7 Flip B7402FEA | |
| Lenovo IdeaPad 5 Pro 14ACN6 | |
| Dell Inspiron 14 7400 7415 2-in-1 | |
| Asus VivoBook Flip 14 TM420IA | |
| Lenovo ThinkBook 14 G2 ITL 20VDS02G00 | |
| Acer Swift 3 SF314-42-R27B | |
| Lenovo IdeaPad 3 14IIL05 | |
| Infinix INBook X2 | |
| Average AMD Ryzen 5 3450U (137 - 138, n=2) | |
| BMAX X14 Pro | |
| Blender / v2.79 BMW27 CPU | |
| Lenovo IdeaPad 3 14IIL05 | |
| Lenovo ThinkBook 14 G2 ITL 20VDS02G00 | |
| Average AMD Ryzen 5 3450U (834 - 976, n=3) | |
| Acer Swift 3 SF314-42-R27B | |
| Infinix INBook X2 | |
| BMAX X14 Pro | |
| HP Pavilion 14-dv0357ng | |
| Asus ExpertBook B7 Flip B7402FEA | |
| Asus VivoBook Flip 14 TM420IA | |
| Dell Inspiron 14 7400 7415 2-in-1 | |
| Lenovo IdeaPad 5 Pro 14ACN6 | |
| 7-Zip 18.03 / 7z b 4 | |
| Lenovo IdeaPad 5 Pro 14ACN6 | |
| Dell Inspiron 14 7400 7415 2-in-1 | |
| Asus VivoBook Flip 14 TM420IA | |
| Asus ExpertBook B7 Flip B7402FEA | |
| HP Pavilion 14-dv0357ng | |
| BMAX X14 Pro | |
| Average AMD Ryzen 5 3450U (15163 - 16305, n=3) | |
| Infinix INBook X2 | |
| Acer Swift 3 SF314-42-R27B | |
| Lenovo ThinkBook 14 G2 ITL 20VDS02G00 | |
| Lenovo IdeaPad 3 14IIL05 | |
| 7-Zip 18.03 / 7z b 4 -mmt1 | |
| Asus ExpertBook B7 Flip B7402FEA | |
| Lenovo IdeaPad 5 Pro 14ACN6 | |
| HP Pavilion 14-dv0357ng | |
| Lenovo ThinkBook 14 G2 ITL 20VDS02G00 | |
| Dell Inspiron 14 7400 7415 2-in-1 | |
| Asus VivoBook Flip 14 TM420IA | |
| Lenovo IdeaPad 3 14IIL05 | |
| Acer Swift 3 SF314-42-R27B | |
| Average AMD Ryzen 5 3450U (3355 - 3411, n=3) | |
| BMAX X14 Pro | |
| Infinix INBook X2 | |
| Geekbench 5.5 / Multi-Core | |
| Asus VivoBook Flip 14 TM420IA | |
| Asus ExpertBook B7 Flip B7402FEA | |
| Infinix INBook X2 | |
| Acer Swift 3 SF314-42-R27B | |
| BMAX X14 Pro | |
| Average AMD Ryzen 5 3450U (2565 - 3123, n=5) | |
| Lenovo ThinkBook 14 G2 ITL 20VDS02G00 | |
| Lenovo IdeaPad 3 14IIL05 | |
| Geekbench 5.5 / Single-Core | |
| Asus ExpertBook B7 Flip B7402FEA | |
| Lenovo ThinkBook 14 G2 ITL 20VDS02G00 | |
| Infinix INBook X2 | |
| Lenovo IdeaPad 3 14IIL05 | |
| Asus VivoBook Flip 14 TM420IA | |
| Acer Swift 3 SF314-42-R27B | |
| BMAX X14 Pro | |
| Average AMD Ryzen 5 3450U (698 - 866, n=5) | |
| HWBOT x265 Benchmark v2.2 / 4k Preset | |
| Lenovo IdeaPad 5 Pro 14ACN6 | |
| Dell Inspiron 14 7400 7415 2-in-1 | |
| Asus VivoBook Flip 14 TM420IA | |
| Asus ExpertBook B7 Flip B7402FEA | |
| Infinix INBook X2 | |
| Acer Swift 3 SF314-42-R27B | |
| Lenovo IdeaPad 3 14IIL05 | |
| Lenovo ThinkBook 14 G2 ITL 20VDS02G00 | |
| BMAX X14 Pro | |
| Average AMD Ryzen 5 3450U (2.77 - 3.43, n=3) | |
| LibreOffice / 20 Documents To PDF | |
| Average AMD Ryzen 5 3450U (86.5 - 90.6, n=3) | |
| BMAX X14 Pro | |
| Infinix INBook X2 | |
| Acer Swift 3 SF314-42-R27B | |
| Dell Inspiron 14 7400 7415 2-in-1 | |
| Asus VivoBook Flip 14 TM420IA | |
| Lenovo IdeaPad 3 14IIL05 | |
| Lenovo IdeaPad 5 Pro 14ACN6 | |
| Asus ExpertBook B7 Flip B7402FEA | |
| Lenovo ThinkBook 14 G2 ITL 20VDS02G00 | |
| R Benchmark 2.5 / Overall mean | |
| Average AMD Ryzen 5 3450U (0.76 - 0.806, n=3) | |
| BMAX X14 Pro | |
| Lenovo IdeaPad 3 14IIL05 | |
| Infinix INBook X2 | |
| Acer Swift 3 SF314-42-R27B | |
| Lenovo ThinkBook 14 G2 ITL 20VDS02G00 | |
| Asus VivoBook Flip 14 TM420IA | |
| Dell Inspiron 14 7400 7415 2-in-1 | |
| Asus ExpertBook B7 Flip B7402FEA | |
| Lenovo IdeaPad 5 Pro 14ACN6 | |
* ... smaller is better
AIDA64: FP32 Ray-Trace | FPU Julia | CPU SHA3 | CPU Queen | FPU SinJulia | FPU Mandel | CPU AES | CPU ZLib | FP64 Ray-Trace | CPU PhotoWorxx
| Performance rating | |
| Lenovo IdeaPad 5 Pro 14ACN6 | |
| Dell Inspiron 14 7400 7415 2-in-1 | |
| Infinix INBook X2 | |
| Huawei MateBook 14 2020 Intel | |
| BMAX X14 Pro | |
| Average AMD Ryzen 5 3450U | |
| AIDA64 / FP32 Ray-Trace | |
| Lenovo IdeaPad 5 Pro 14ACN6 | |
| Dell Inspiron 14 7400 7415 2-in-1 | |
| Infinix INBook X2 | |
| Huawei MateBook 14 2020 Intel | |
| BMAX X14 Pro | |
| Average AMD Ryzen 5 3450U (2205 - 2813, n=3) | |
| AIDA64 / FPU Julia | |
| Lenovo IdeaPad 5 Pro 14ACN6 | |
| Dell Inspiron 14 7400 7415 2-in-1 | |
| Huawei MateBook 14 2020 Intel | |
| Infinix INBook X2 | |
| BMAX X14 Pro | |
| Average AMD Ryzen 5 3450U (12782 - 15357, n=3) | |
| AIDA64 / CPU SHA3 | |
| Lenovo IdeaPad 5 Pro 14ACN6 | |
| Dell Inspiron 14 7400 7415 2-in-1 | |
| Infinix INBook X2 | |
| Huawei MateBook 14 2020 Intel | |
| BMAX X14 Pro | |
| Average AMD Ryzen 5 3450U (671 - 798, n=3) | |
| AIDA64 / CPU Queen | |
| Dell Inspiron 14 7400 7415 2-in-1 | |
| Lenovo IdeaPad 5 Pro 14ACN6 | |
| Huawei MateBook 14 2020 Intel | |
| Average AMD Ryzen 5 3450U (41757 - 43786, n=3) | |
| BMAX X14 Pro | |
| Infinix INBook X2 | |
| AIDA64 / FPU SinJulia | |
| Dell Inspiron 14 7400 7415 2-in-1 | |
| Lenovo IdeaPad 5 Pro 14ACN6 | |
| BMAX X14 Pro | |
| Average AMD Ryzen 5 3450U (4760 - 5335, n=3) | |
| Huawei MateBook 14 2020 Intel | |
| Infinix INBook X2 | |
| AIDA64 / FPU Mandel | |
| Lenovo IdeaPad 5 Pro 14ACN6 | |
| Dell Inspiron 14 7400 7415 2-in-1 | |
| Infinix INBook X2 | |
| Huawei MateBook 14 2020 Intel | |
| BMAX X14 Pro | |
| Average AMD Ryzen 5 3450U (6504 - 7962, n=3) | |
| AIDA64 / CPU AES | |
| Lenovo IdeaPad 5 Pro 14ACN6 | |
| Dell Inspiron 14 7400 7415 2-in-1 | |
| Infinix INBook X2 | |
| BMAX X14 Pro | |
| Average AMD Ryzen 5 3450U (23172 - 26298, n=3) | |
| Huawei MateBook 14 2020 Intel | |
| AIDA64 / CPU ZLib | |
| Dell Inspiron 14 7400 7415 2-in-1 | |
| Lenovo IdeaPad 5 Pro 14ACN6 | |
| BMAX X14 Pro | |
| Average AMD Ryzen 5 3450U (271 - 295, n=3) | |
| Infinix INBook X2 | |
| Huawei MateBook 14 2020 Intel | |
| AIDA64 / FP64 Ray-Trace | |
| Dell Inspiron 14 7400 7415 2-in-1 | |
| Lenovo IdeaPad 5 Pro 14ACN6 | |
| Infinix INBook X2 | |
| Huawei MateBook 14 2020 Intel | |
| BMAX X14 Pro | |
| Average AMD Ryzen 5 3450U (1181 - 1472, n=3) | |
| AIDA64 / CPU PhotoWorxx | |
| Infinix INBook X2 | |
| Huawei MateBook 14 2020 Intel | |
| Dell Inspiron 14 7400 7415 2-in-1 | |
| Lenovo IdeaPad 5 Pro 14ACN6 | |
| BMAX X14 Pro | |
| Average AMD Ryzen 5 3450U (7659 - 15275, n=3) | |
系统性能
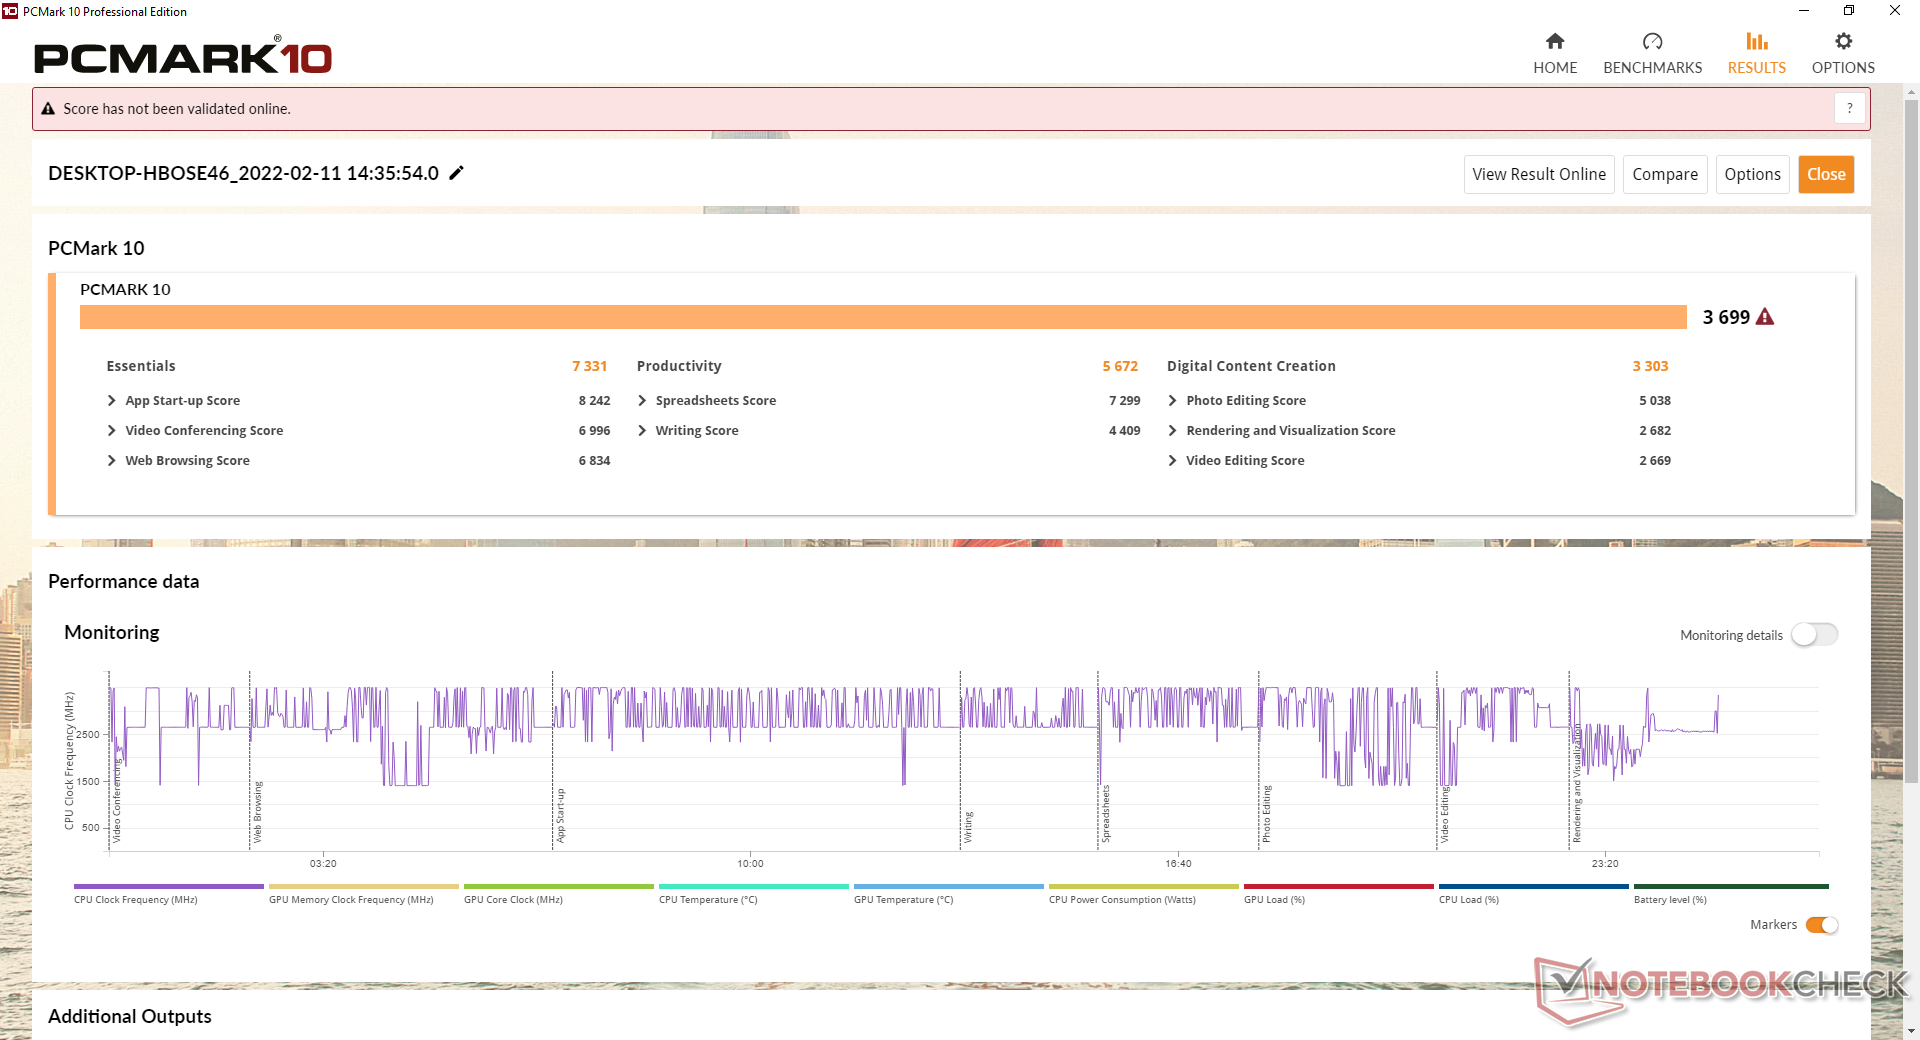
PCMark结果低于许多Core i3或Core i5替代品,可能是由于Ryzen 3450U处理器的单线程和集成图形性能较慢。
令人讨厌的是,AMD Radeon软件偶尔会在我们的设备上崩溃,从而迫使我们重新安装驱动程序。
| PCMark 10 / Score | |
| Lenovo IdeaPad 5 Pro 14ACN6 | |
| Dell Inspiron 14 7400 7415 2-in-1 | |
| HP Pavilion 14-dv0357ng | |
| Huawei MateBook 14 2020 Intel | |
| Infinix INBook X2 | |
| BMAX X14 Pro | |
| Average AMD Ryzen 5 3450U, AMD Radeon RX Vega 8 (Ryzen 2000/3000) (3485 - 3699, n=2) | |
| PCMark 10 / Essentials | |
| Lenovo IdeaPad 5 Pro 14ACN6 | |
| HP Pavilion 14-dv0357ng | |
| Dell Inspiron 14 7400 7415 2-in-1 | |
| Huawei MateBook 14 2020 Intel | |
| Infinix INBook X2 | |
| BMAX X14 Pro | |
| Average AMD Ryzen 5 3450U, AMD Radeon RX Vega 8 (Ryzen 2000/3000) (7067 - 7331, n=2) | |
| PCMark 10 / Productivity | |
| Lenovo IdeaPad 5 Pro 14ACN6 | |
| Dell Inspiron 14 7400 7415 2-in-1 | |
| Huawei MateBook 14 2020 Intel | |
| HP Pavilion 14-dv0357ng | |
| Average AMD Ryzen 5 3450U, AMD Radeon RX Vega 8 (Ryzen 2000/3000) (5672 - 5801, n=2) | |
| BMAX X14 Pro | |
| Infinix INBook X2 | |
| PCMark 10 / Digital Content Creation | |
| Lenovo IdeaPad 5 Pro 14ACN6 | |
| Dell Inspiron 14 7400 7415 2-in-1 | |
| HP Pavilion 14-dv0357ng | |
| Infinix INBook X2 | |
| Huawei MateBook 14 2020 Intel | |
| BMAX X14 Pro | |
| Average AMD Ryzen 5 3450U, AMD Radeon RX Vega 8 (Ryzen 2000/3000) (2802 - 3303, n=2) | |
| PCMark 10 Score | 3699 points | |
Help | ||
| AIDA64 / Memory Copy | |
| Infinix INBook X2 | |
| Dell Inspiron 14 7400 7415 2-in-1 | |
| Lenovo IdeaPad 5 Pro 14ACN6 | |
| Huawei MateBook 14 2020 Intel | |
| BMAX X14 Pro | |
| Average AMD Ryzen 5 3450U (15343 - 28077, n=3) | |
| AIDA64 / Memory Read | |
| Infinix INBook X2 | |
| Dell Inspiron 14 7400 7415 2-in-1 | |
| Lenovo IdeaPad 5 Pro 14ACN6 | |
| Huawei MateBook 14 2020 Intel | |
| BMAX X14 Pro | |
| Average AMD Ryzen 5 3450U (17983 - 33524, n=3) | |
| AIDA64 / Memory Write | |
| Infinix INBook X2 | |
| Dell Inspiron 14 7400 7415 2-in-1 | |
| Lenovo IdeaPad 5 Pro 14ACN6 | |
| Huawei MateBook 14 2020 Intel | |
| BMAX X14 Pro | |
| Average AMD Ryzen 5 3450U (17811 - 33371, n=3) | |
| AIDA64 / Memory Latency | |
| BMAX X14 Pro | |
| Average AMD Ryzen 5 3450U (100 - 125, n=3) | |
| Infinix INBook X2 | |
| Dell Inspiron 14 7400 7415 2-in-1 | |
| Lenovo IdeaPad 5 Pro 14ACN6 | |
| Huawei MateBook 14 2020 Intel | |
* ... smaller is better
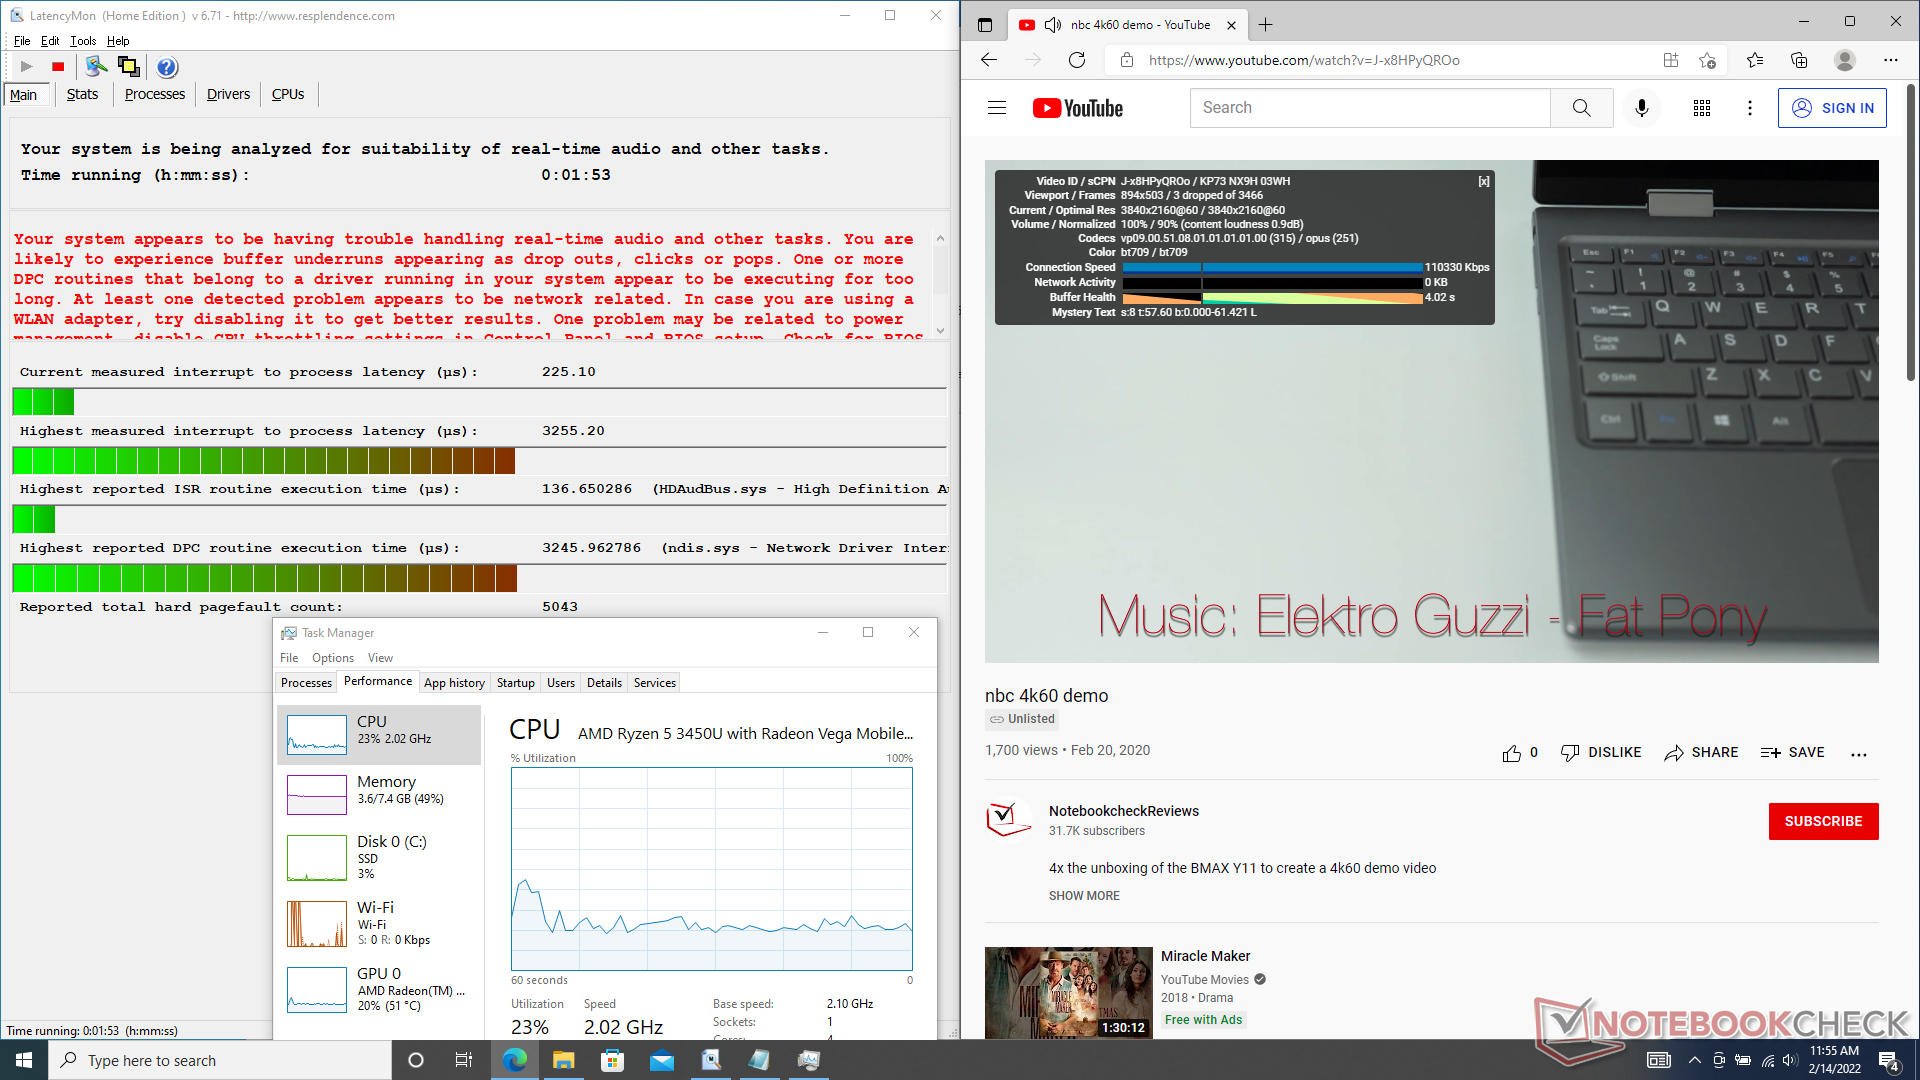
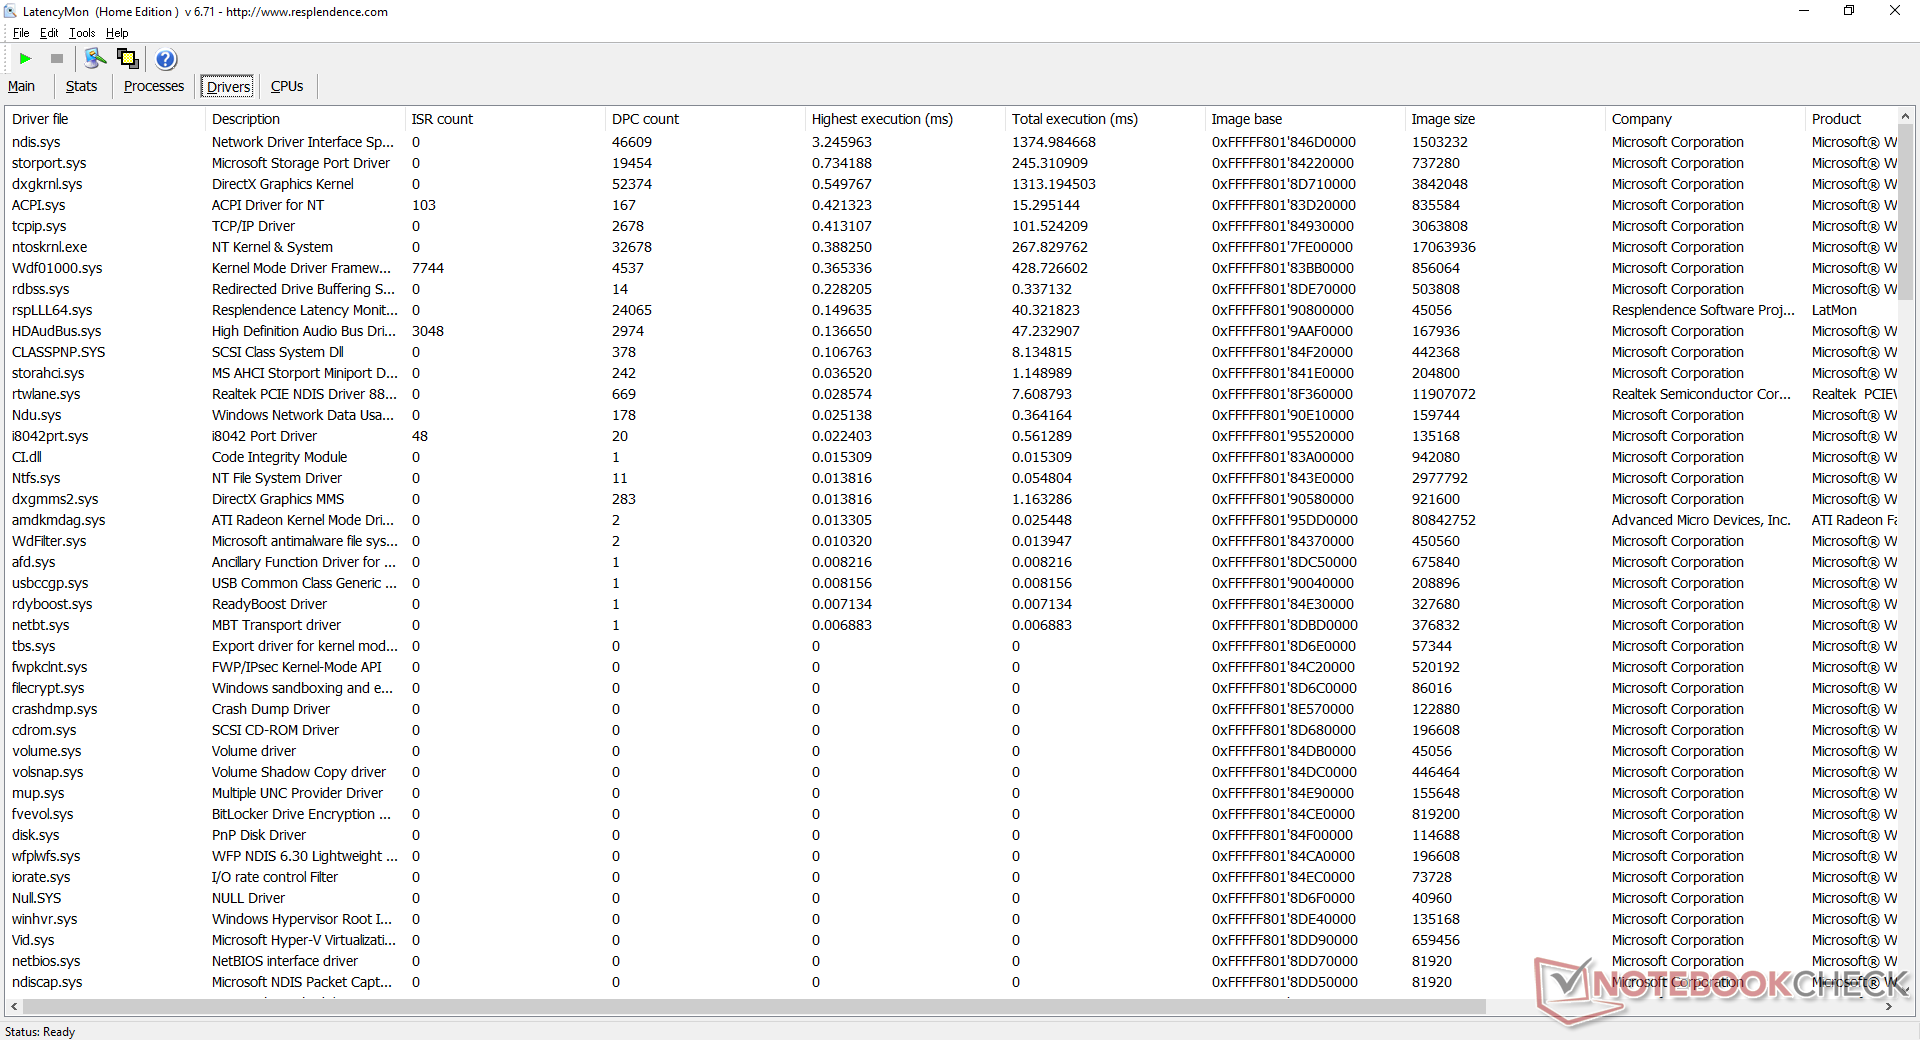
DPC延时
LatencyMon显示了在我们的主页上打开多个标签时的DPC问题。在60 FPS下的4K视频播放很流畅,在我们长达1分钟的测试视频中只有3个丢帧。
| DPC Latencies / LatencyMon - interrupt to process latency (max), Web, Youtube, Prime95 | |
| BMAX X14 Pro | |
| HP Pavilion 14-dv0357ng | |
| Dell Inspiron 14 7400 7415 2-in-1 | |
| Lenovo IdeaPad 5 Pro 14ACN6 | |
| Infinix INBook X2 | |
| Huawei MateBook 14 2020 Intel | |
* ... smaller is better
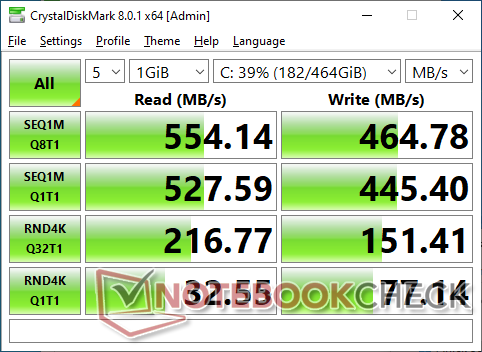
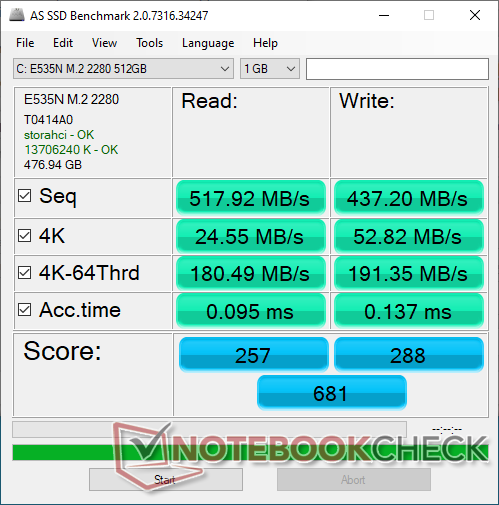
存储设备
的产品 SEAPIY M.2固态硬盘提供450MB/s至550MB/s的连续读写速率,这是大多数SATA III SSD的标准。然而,正如我们下面的DiskSpd循环测试结果所显示的那样,该硬盘似乎在维持这些较高的传输速率方面有问题。

| Drive Performance rating - Percent | |
| Huawei MateBook 14 2020 Intel | |
| Lenovo IdeaPad 5 Pro 14ACN6 | |
| Infinix INBook X2 | |
| Dell Inspiron 14 7400 7415 2-in-1 | |
| HP Pavilion 14-dv0357ng -8! | |
| BMAX X14 Pro | |
* ... smaller is better
Disk Throttling: DiskSpd Read Loop, Queue Depth 8
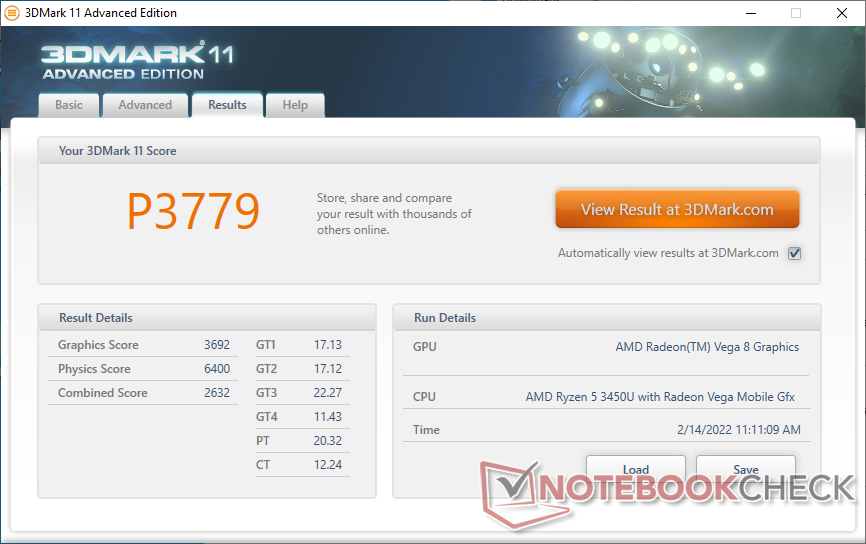
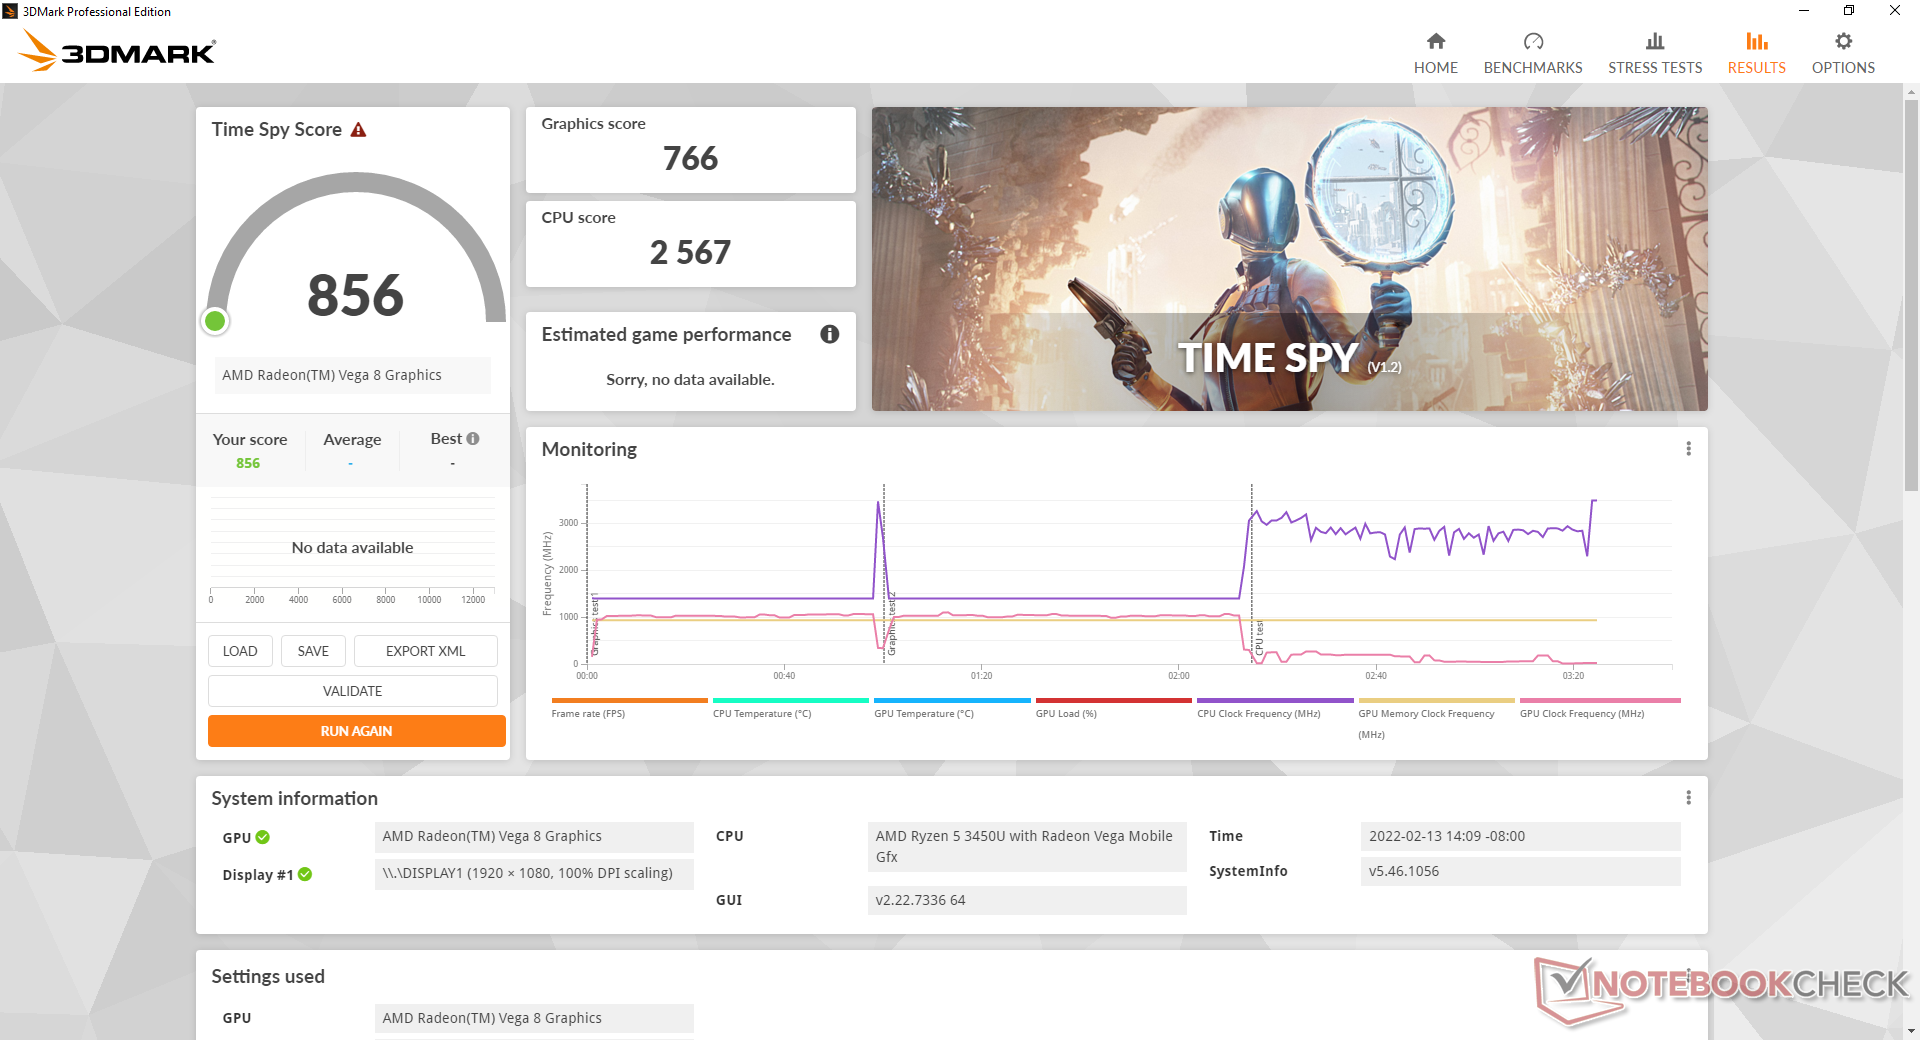
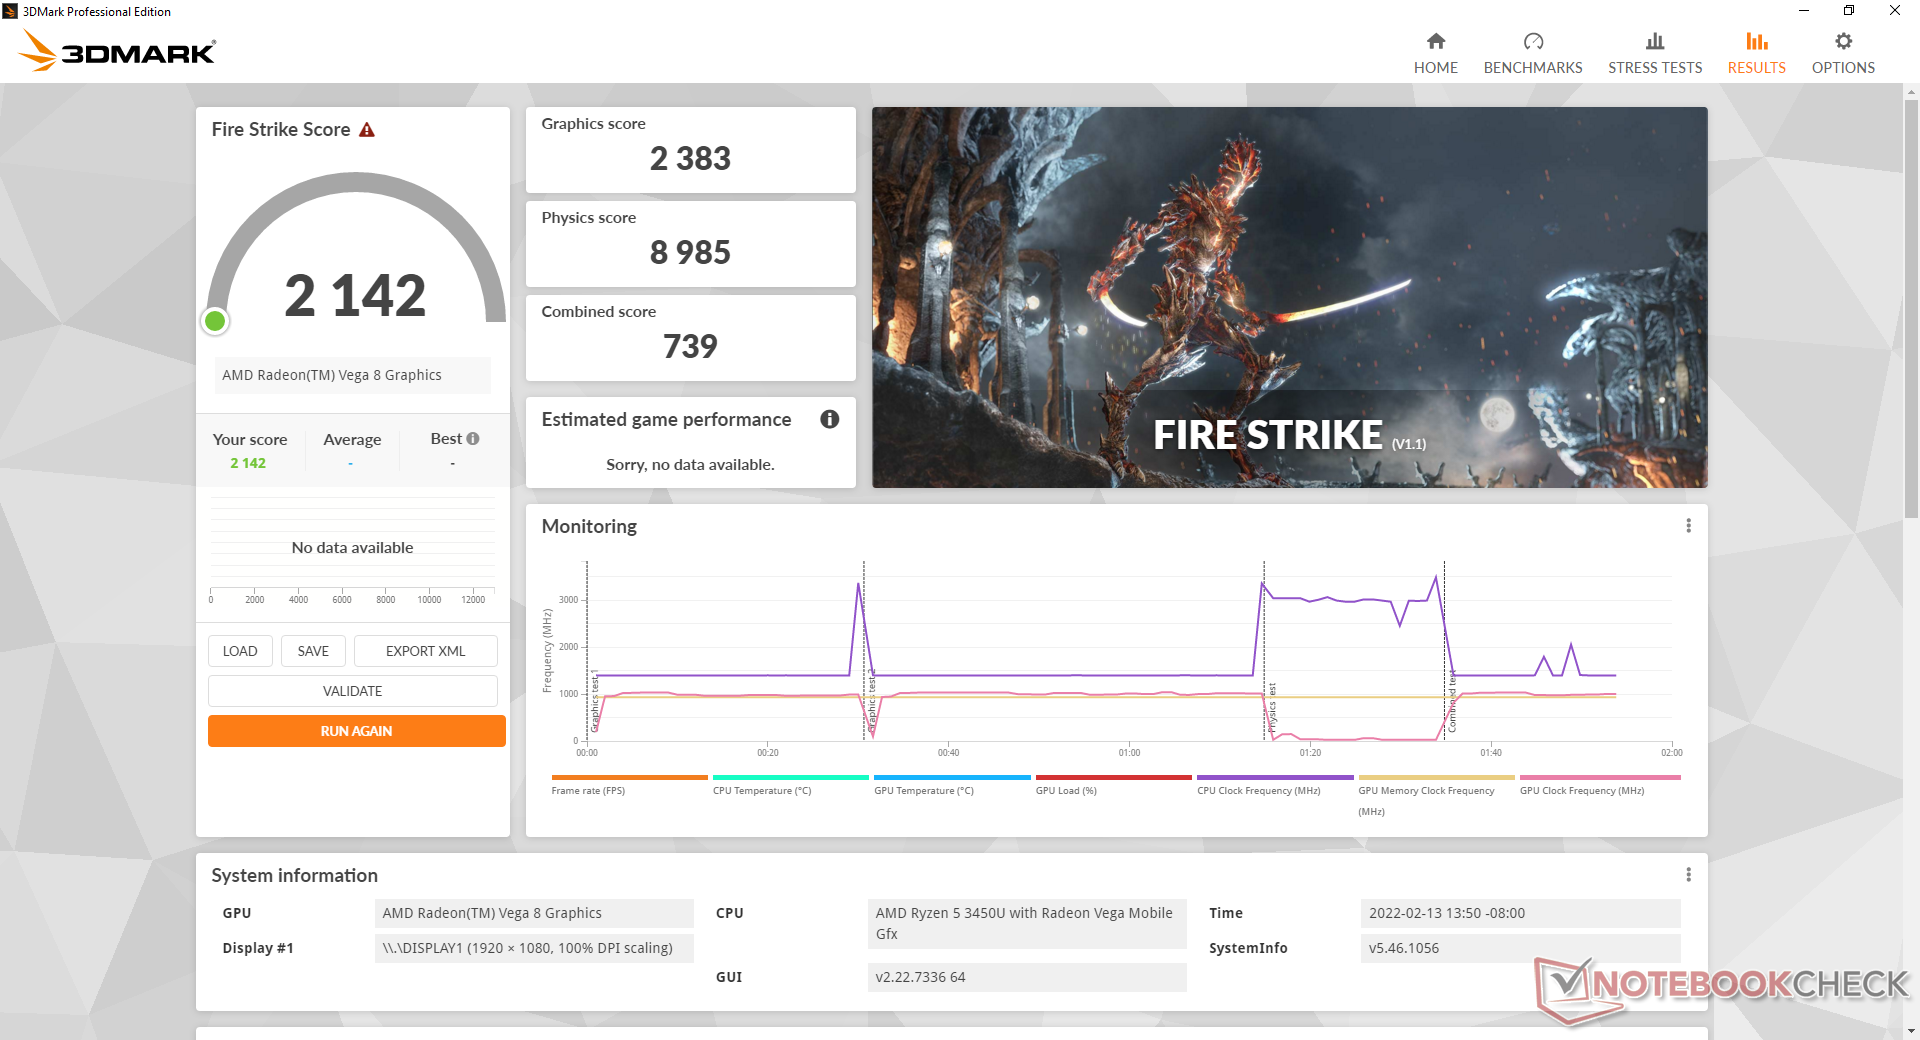
GPU性能
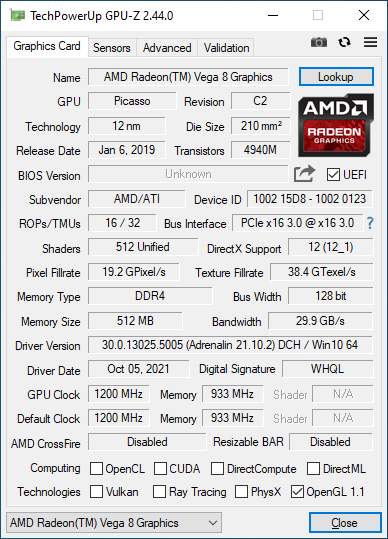
图形性能略微比集成的 Iris Plus Graphics G7在第十代英特尔Ice Lake 系列上发现。虽然已经过时,而且一般不适合游戏,但我们的Radeon RX Vega 8仍然明显快于常见的UHD Graphics 解决方案。
| 3DMark 11 - 1280x720 Performance GPU | |
| Asus ExpertBook B7 Flip B7402FEA | |
| Dell Inspiron 14 7400 7415 2-in-1 | |
| HP Pavilion 14-dv0357ng | |
| Lenovo IdeaPad 5 Pro 14ACN6 | |
| Asus VivoBook Flip 14 TM420IA | |
| Infinix INBook X2 | |
| BMAX X14 Pro | |
| Acer Swift 3 SF314-42-R27B | |
| Average AMD Radeon RX Vega 8 (Ryzen 2000/3000) (1668 - 4317, n=44) | |
| Lenovo ThinkBook 14 G2 ITL 20VDS02G00 | |
| Lenovo IdeaPad 3 14IIL05 | |
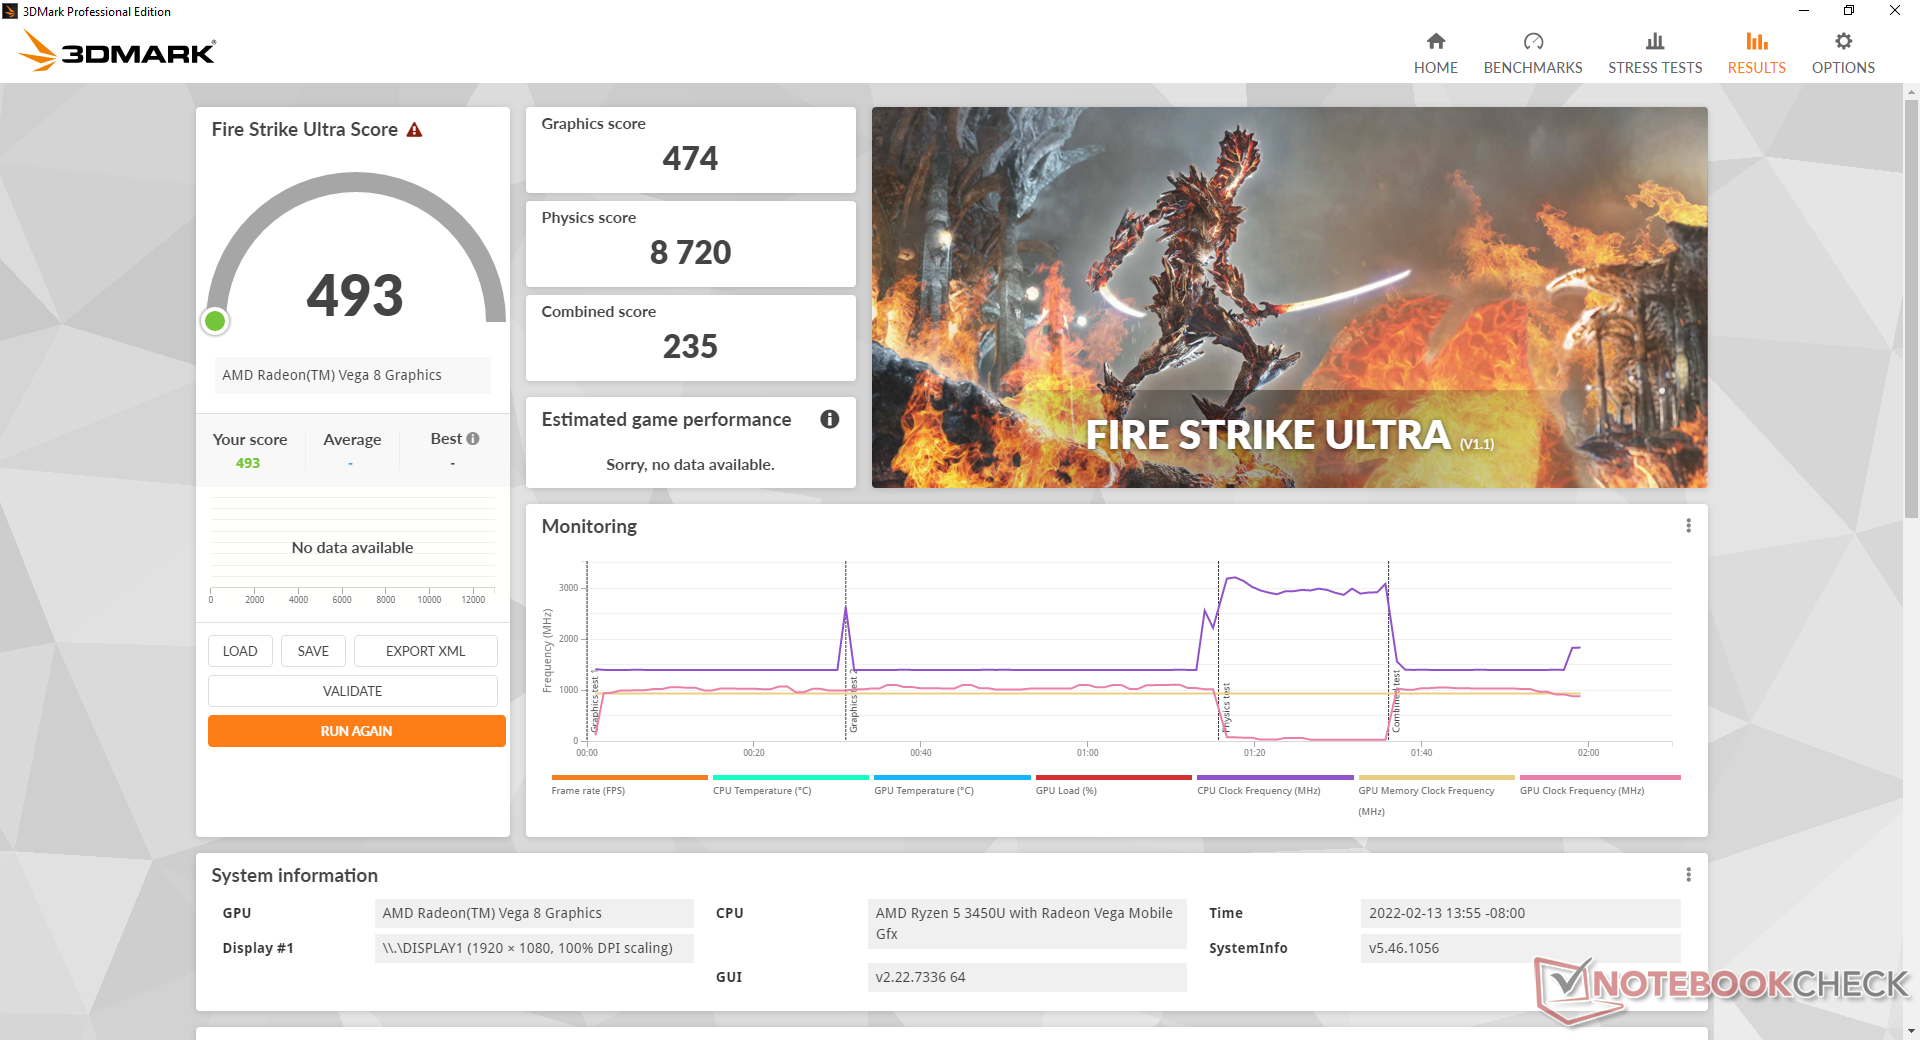
| 3DMark 11 Performance | 3779 points | |
| 3DMark Cloud Gate Standard Score | 12145 points | |
| 3DMark Fire Strike Score | 2142 points | |
| 3DMark Time Spy Score | 856 points | |
Help | ||
| X-Plane 11.11 | |
| 1280x720 low (fps_test=1) | |
| Lenovo IdeaPad 5 Pro 14ACN6 | |
| Asus VivoBook Flip 14 TM420IA | |
| Dell Inspiron 14 7400 7415 2-in-1 | |
| Acer Swift 3 SF314-42-R27B | |
| Lenovo ThinkBook 14 G2 ITL 20VDS02G00 | |
| Average AMD Radeon RX Vega 8 (Ryzen 2000/3000) (11.5 - 39.9, n=26) | |
| BMAX X14 Pro | |
| Asus ExpertBook B7 Flip B7402FEA | |
| Lenovo IdeaPad 3 14IIL05 | |
| Infinix INBook X2 | |
| 1920x1080 med (fps_test=2) | |
| Lenovo IdeaPad 5 Pro 14ACN6 | |
| Asus VivoBook Flip 14 TM420IA | |
| Dell Inspiron 14 7400 7415 2-in-1 | |
| Acer Swift 3 SF314-42-R27B | |
| Asus ExpertBook B7 Flip B7402FEA | |
| Infinix INBook X2 | |
| Lenovo ThinkBook 14 G2 ITL 20VDS02G00 | |
| Average AMD Radeon RX Vega 8 (Ryzen 2000/3000) (10.5 - 31, n=26) | |
| BMAX X14 Pro | |
| Lenovo IdeaPad 3 14IIL05 | |
| 1920x1080 high (fps_test=3) | |
| Lenovo IdeaPad 5 Pro 14ACN6 | |
| Asus VivoBook Flip 14 TM420IA | |
| Dell Inspiron 14 7400 7415 2-in-1 | |
| Acer Swift 3 SF314-42-R27B | |
| Asus ExpertBook B7 Flip B7402FEA | |
| Lenovo ThinkBook 14 G2 ITL 20VDS02G00 | |
| Infinix INBook X2 | |
| Average AMD Radeon RX Vega 8 (Ryzen 2000/3000) (9.58 - 27.3, n=25) | |
| BMAX X14 Pro | |
| Lenovo IdeaPad 3 14IIL05 | |
Witcher 3 FPS Chart
| low | med. | high | ultra | |
|---|---|---|---|---|
| The Witcher 3 (2015) | 41.9 | 27.9 | 13.9 | 8.9 |
| Dota 2 Reborn (2015) | 68.5 | 57.6 | 36.1 | 31.2 |
| Final Fantasy XV Benchmark (2018) | 21.2 | 10.7 | 7.28 | |
| X-Plane 11.11 (2018) | 25.2 | 18.4 | 16.6 | |
| Far Cry 5 (2018) | 29 | 11 | 10 | 9 |
排放
系统噪音
在简单的网络浏览或流媒体视频时,风扇的噪音是明显的,但可以忍受。在这样的负载下,风扇的最高值为30分贝(A),而像游戏这样的高负载将在35至40分贝(A)之间。对于采用U系列CPU的超极本来说,这些是相当标准的范围。
Noise level
| Idle |
| 25.7 / 25.7 / 25.7 dB(A) |
| Load |
| 34.5 / 40 dB(A) |
 | ||
30 dB silent 40 dB(A) audible 50 dB(A) loud |
||
min: | ||
| BMAX X14 Pro Vega 8, R5 3450U, SEAPIY E535N 512GB | Lenovo IdeaPad 5 Pro 14ACN6 Vega 7, R5 5600U, WDC PC SN730 SDBPNTY-512G | Dell Inspiron 14 7400 7415 2-in-1 Vega 8, R7 5700U, WDC PC SN530 SDBPTPZ-512G | HP Pavilion 14-dv0357ng Iris Xe G7 80EUs, i5-1135G7, Intel Optane Memory H10 with Solid State Storage 32GB + 1TB HBRPEKNX0203AH(L/H) | Huawei MateBook 14 2020 Intel GeForce MX350, i7-10510U, Lite-On CA5-8D512 | Infinix INBook X2 Iris Plus Graphics G7 (Ice Lake 64 EU), i7-1065G7, Foresee GSYAPGC-512G | |
|---|---|---|---|---|---|---|
| Noise | 5% | 4% | 2% | -7% | 4% | |
| off / environment * (dB) | 25.2 | 24.6 2% | 24.3 4% | 25.4 -1% | 29.3 -16% | 23.1 8% |
| Idle Minimum * (dB) | 25.7 | 24.6 4% | 24.3 5% | 25.4 1% | 29.3 -14% | 24.3 5% |
| Idle Average * (dB) | 25.7 | 24.6 4% | 24.3 5% | 25.4 1% | 29.3 -14% | 24.3 5% |
| Idle Maximum * (dB) | 25.7 | 25.1 2% | 24.3 5% | 25.4 1% | 30.8 -20% | 24.5 5% |
| Load Average * (dB) | 34.5 | 29.6 14% | 35.7 -3% | 35.4 -3% | 35.7 -3% | 35.2 -2% |
| Witcher 3 ultra * (dB) | 40 | 31.9 20% | 37.5 6% | 35.7 11% | 38 5% | |
| Load Maximum * (dB) | 40 | 45.5 -14% | 37.3 7% | 35.5 11% | 37.9 5% | 38 5% |
* ... smaller is better
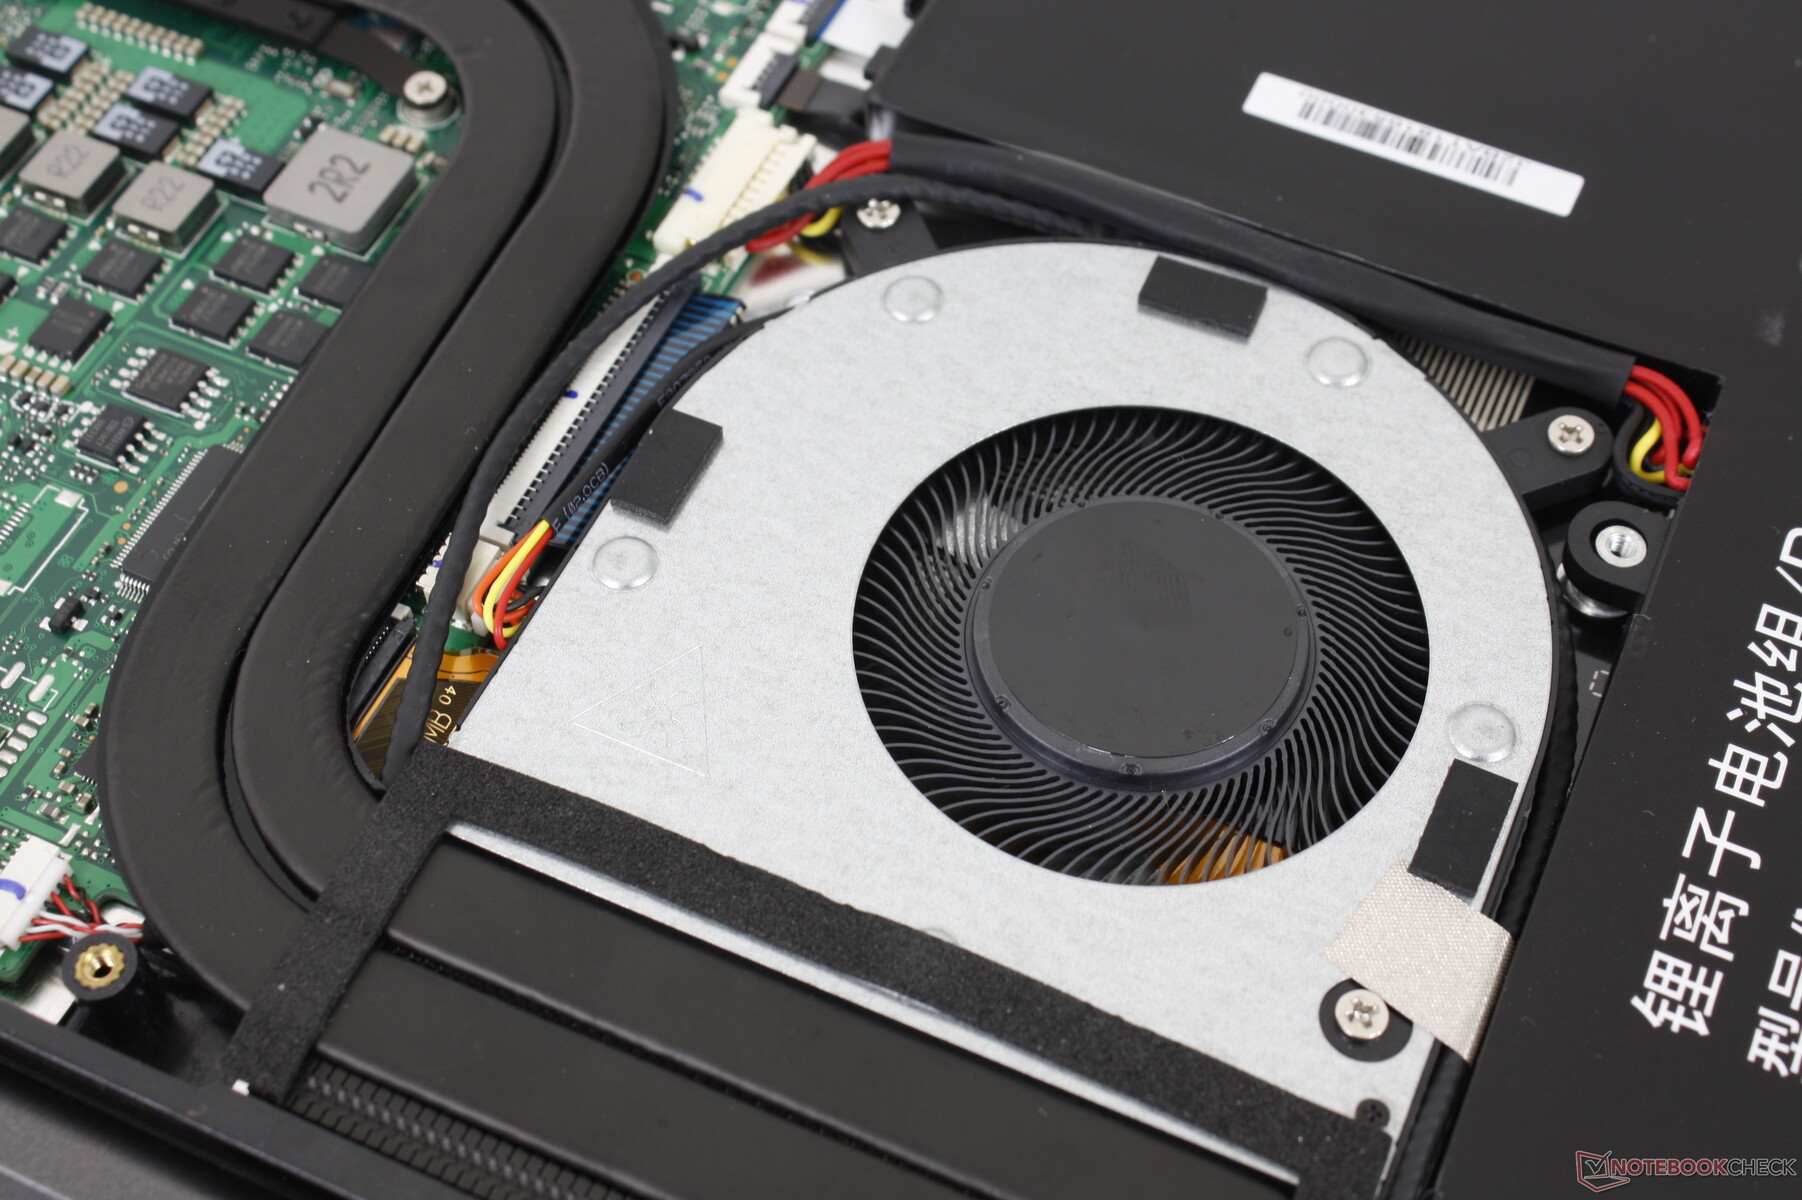
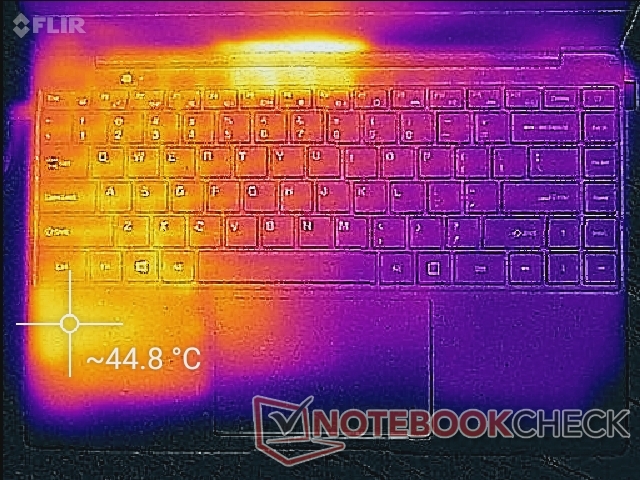
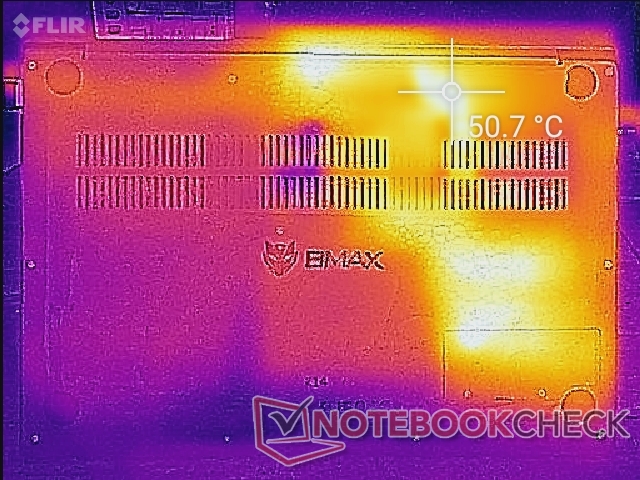
温度
笔记本电脑的左半边总是比右半边更热,因为处理器、固态硬盘和内存模块都集中在系统的一侧。机箱两边的温度差异可能会让一些用户感到不舒服。例如,当长时间运行高负荷时,左手掌托的温度可高达45℃,而右手掌托的温度只有30℃。大多数其他超极本没有这个问题,因为它们的处理器和热管几乎总是朝向机箱的后部。
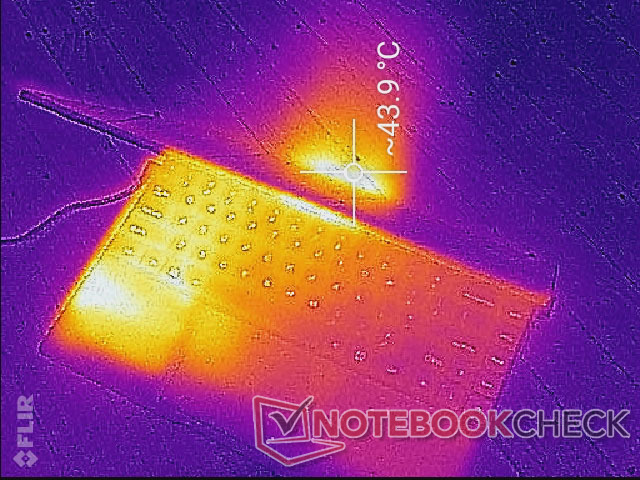
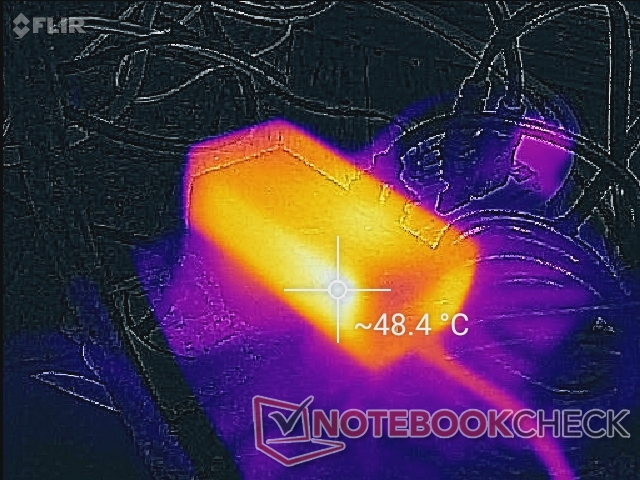
(-) The maximum temperature on the upper side is 48.4 °C / 119 F, compared to the average of 35.9 °C / 97 F, ranging from 21.4 to 59 °C for the class Subnotebook.
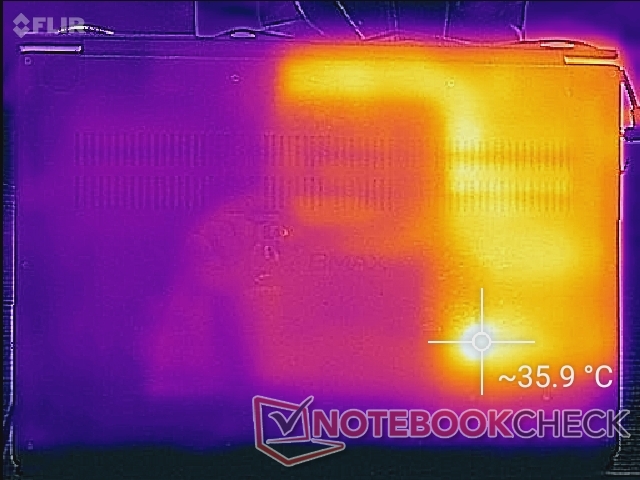
(-) The bottom heats up to a maximum of 51.6 °C / 125 F, compared to the average of 39.2 °C / 103 F
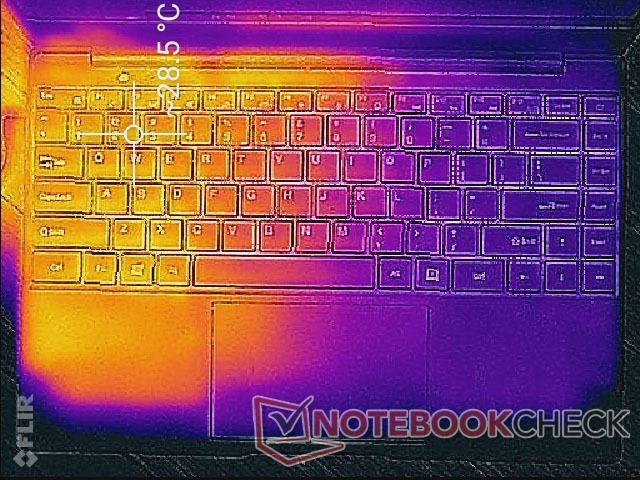
(+) In idle usage, the average temperature for the upper side is 25 °C / 77 F, compared to the device average of 30.8 °C / 87 F.
(-) The palmrests and touchpad can get very hot to the touch with a maximum of 44.8 °C / 112.6 F.
(-) The average temperature of the palmrest area of similar devices was 28.2 °C / 82.8 F (-16.6 °C / -29.8 F).
| BMAX X14 Pro AMD Ryzen 5 3450U, AMD Radeon RX Vega 8 (Ryzen 2000/3000) | Lenovo IdeaPad 5 Pro 14ACN6 AMD Ryzen 5 5600U, AMD Radeon RX Vega 7 | Dell Inspiron 14 7400 7415 2-in-1 AMD Ryzen 7 5700U, AMD Radeon RX Vega 8 (Ryzen 4000/5000) | HP Pavilion 14-dv0357ng Intel Core i5-1135G7, Intel Iris Xe Graphics G7 80EUs | Huawei MateBook 14 2020 Intel Intel Core i7-10510U, NVIDIA GeForce MX350 | Infinix INBook X2 Intel Core i7-1065G7, Intel Iris Plus Graphics G7 (Ice Lake 64 EU) | |
|---|---|---|---|---|---|---|
| Heat | 21% | 10% | 11% | 13% | 12% | |
| Maximum Upper Side * (°C) | 48.4 | 35.8 26% | 39.4 19% | 40.5 16% | 44 9% | 45 7% |
| Maximum Bottom * (°C) | 51.6 | 42.8 17% | 51 1% | 39.9 23% | 51.3 1% | 44.2 14% |
| Idle Upper Side * (°C) | 28.4 | 25 12% | 26.2 8% | 31.3 -10% | 25.1 12% | 26.2 8% |
| Idle Bottom * (°C) | 36.6 | 26.2 28% | 32.4 11% | 31.1 15% | 26.1 29% | 29.2 20% |
* ... smaller is better
压力测试
当运行Prime95对CPU施加压力时,时钟频率会在短短几秒钟内提升到2.9GHz,然后下降到2.5GHz,几分钟后最终稳定在2.2GHz。当受到游戏等紧张条件的影响时,核心温度也出现在59℃的高位。
当运行Witcher 3 ,GPU时钟速率开始时相对较高,在800至900MHz范围内,最终可能由于散热限制而降至800MHz以下。因此,在游戏的第一分钟左右,帧率会略高。
用电池供电运行不会限制性能。在电池上进行的3DMark 11测试将返回几乎相同的结果。
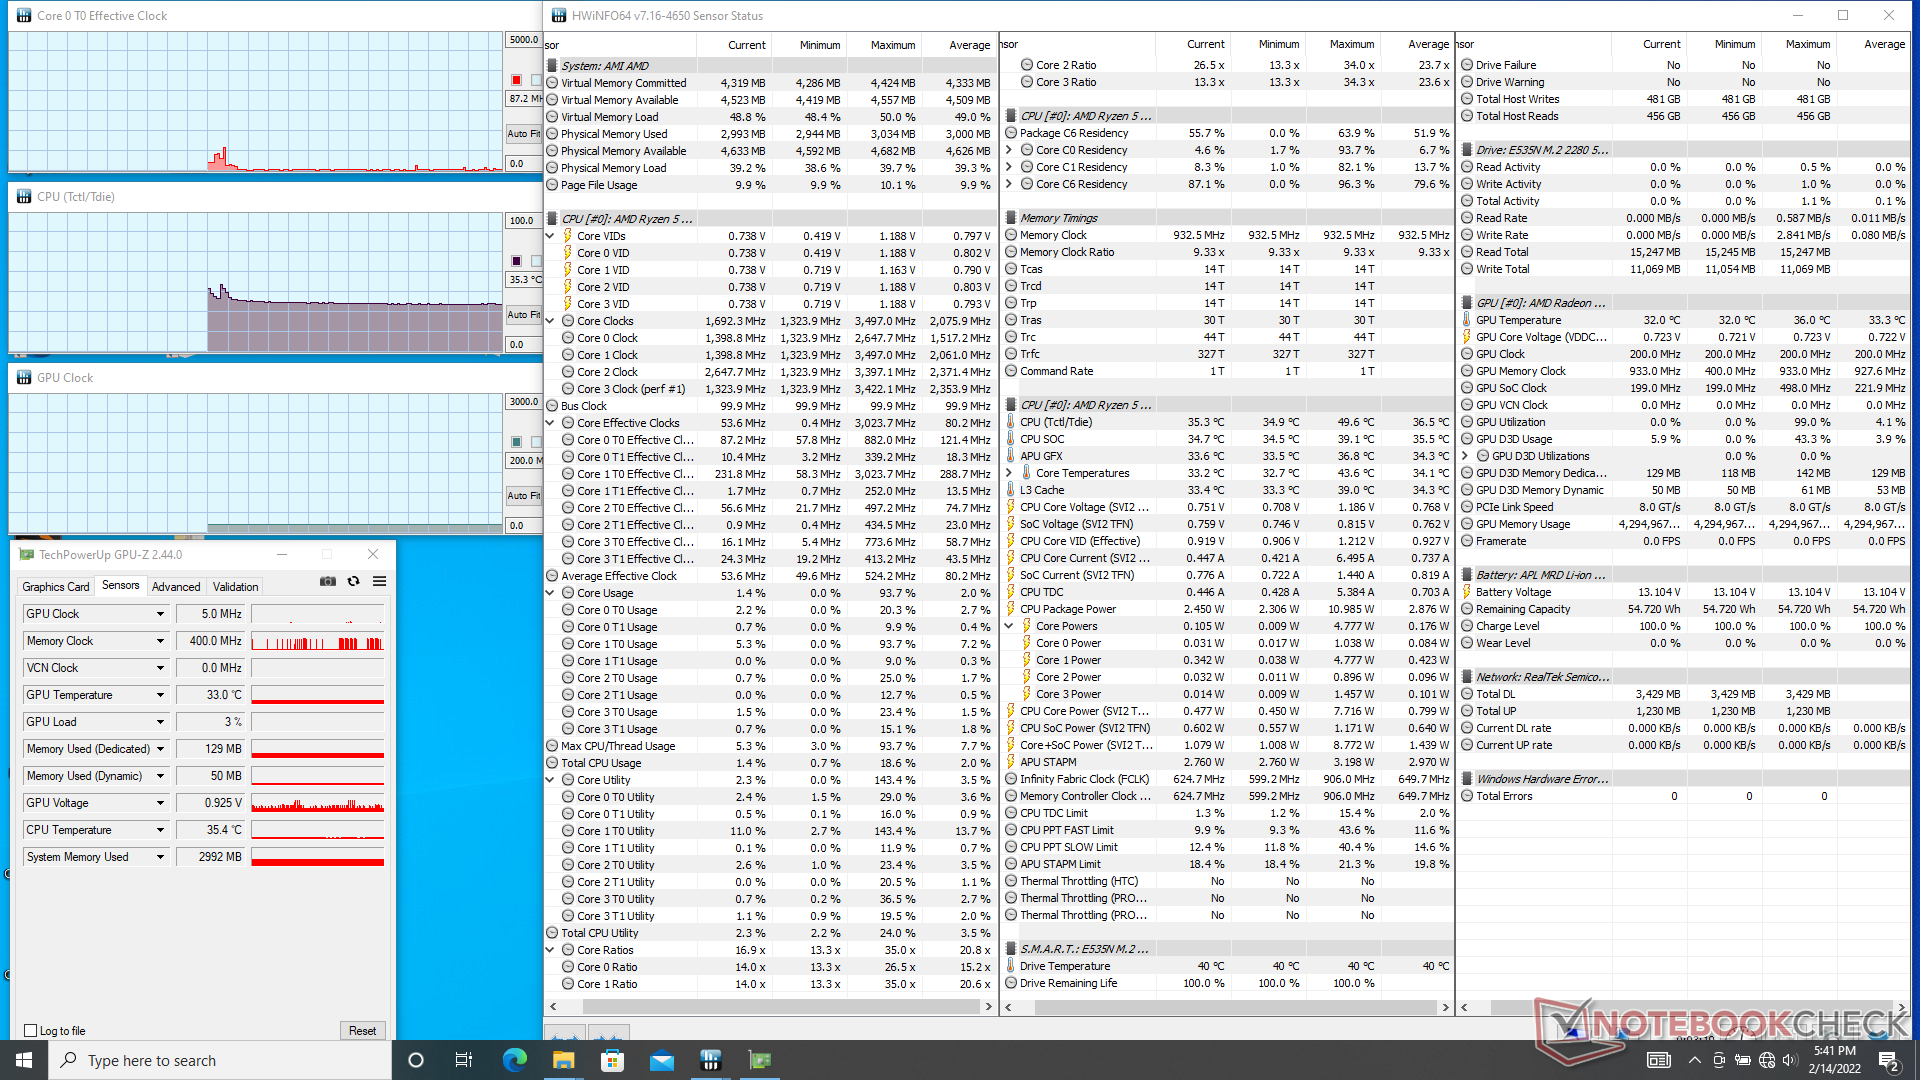
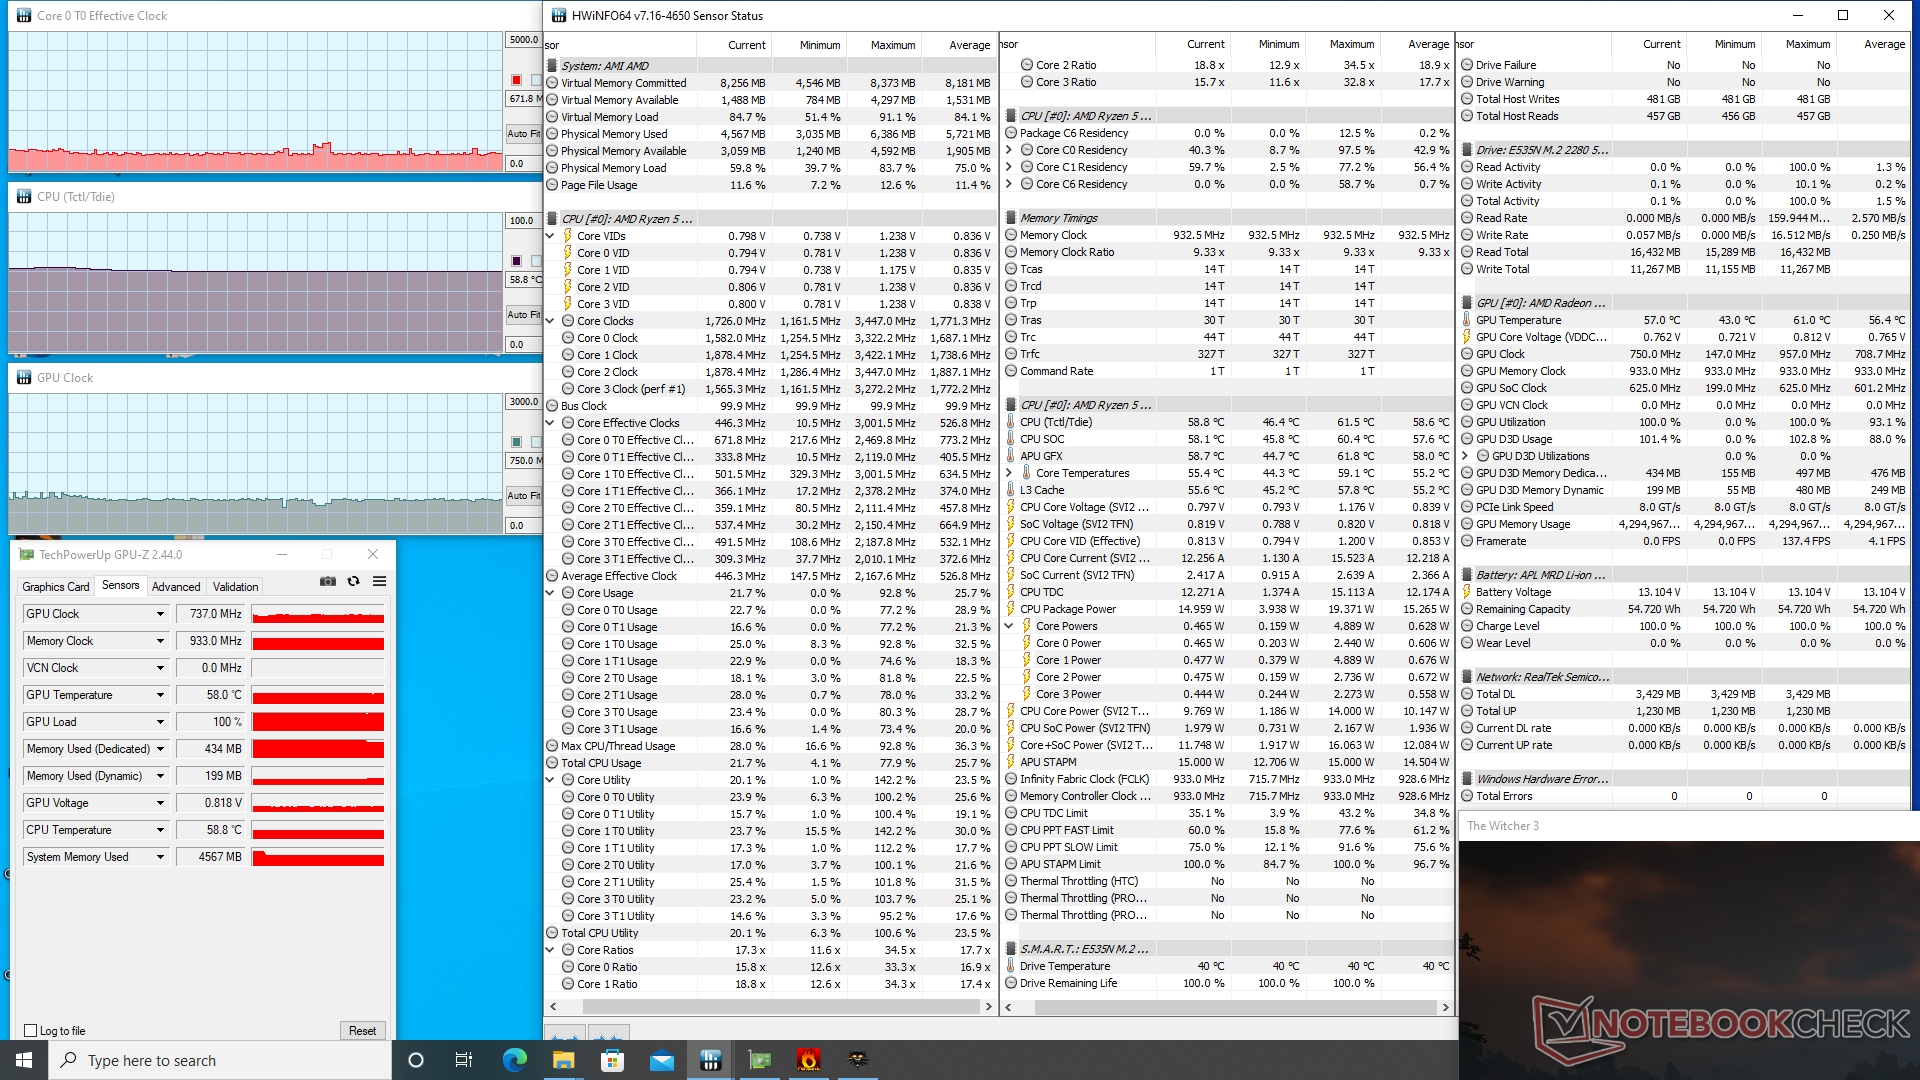
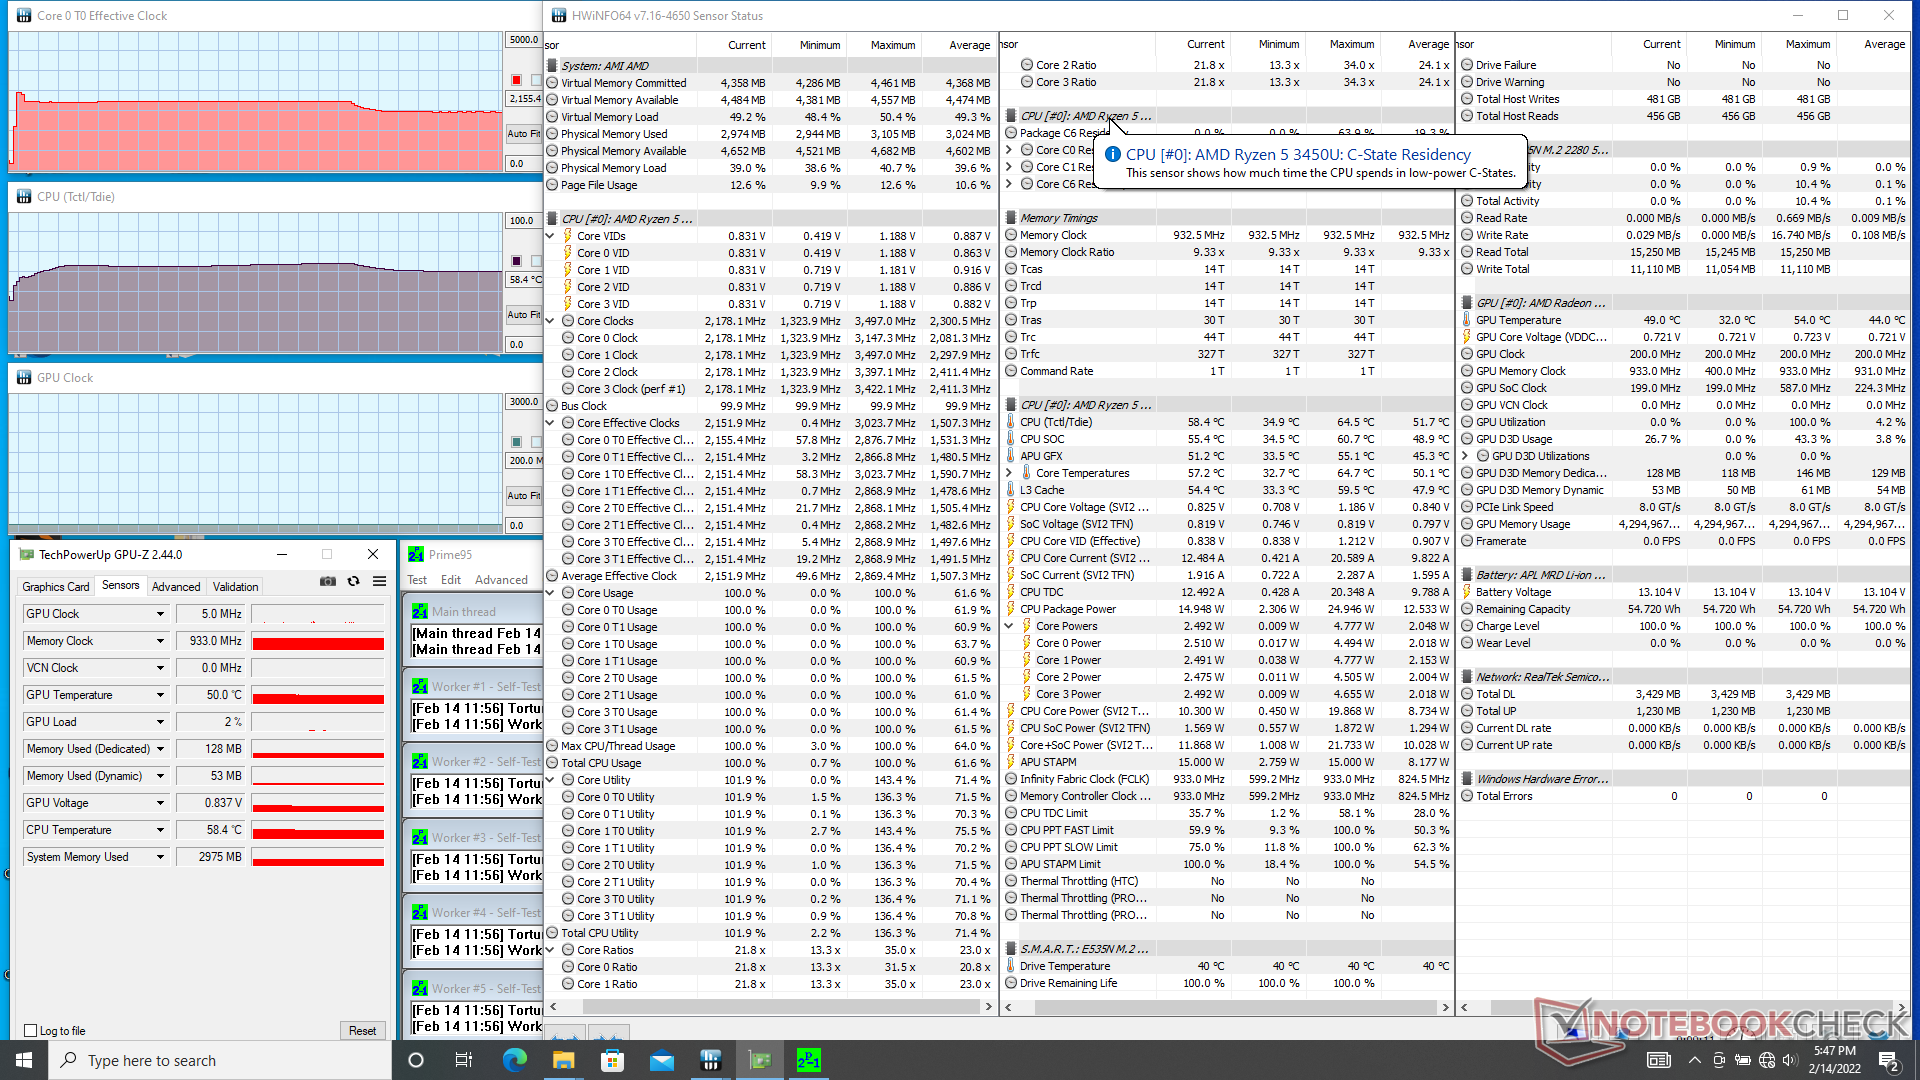
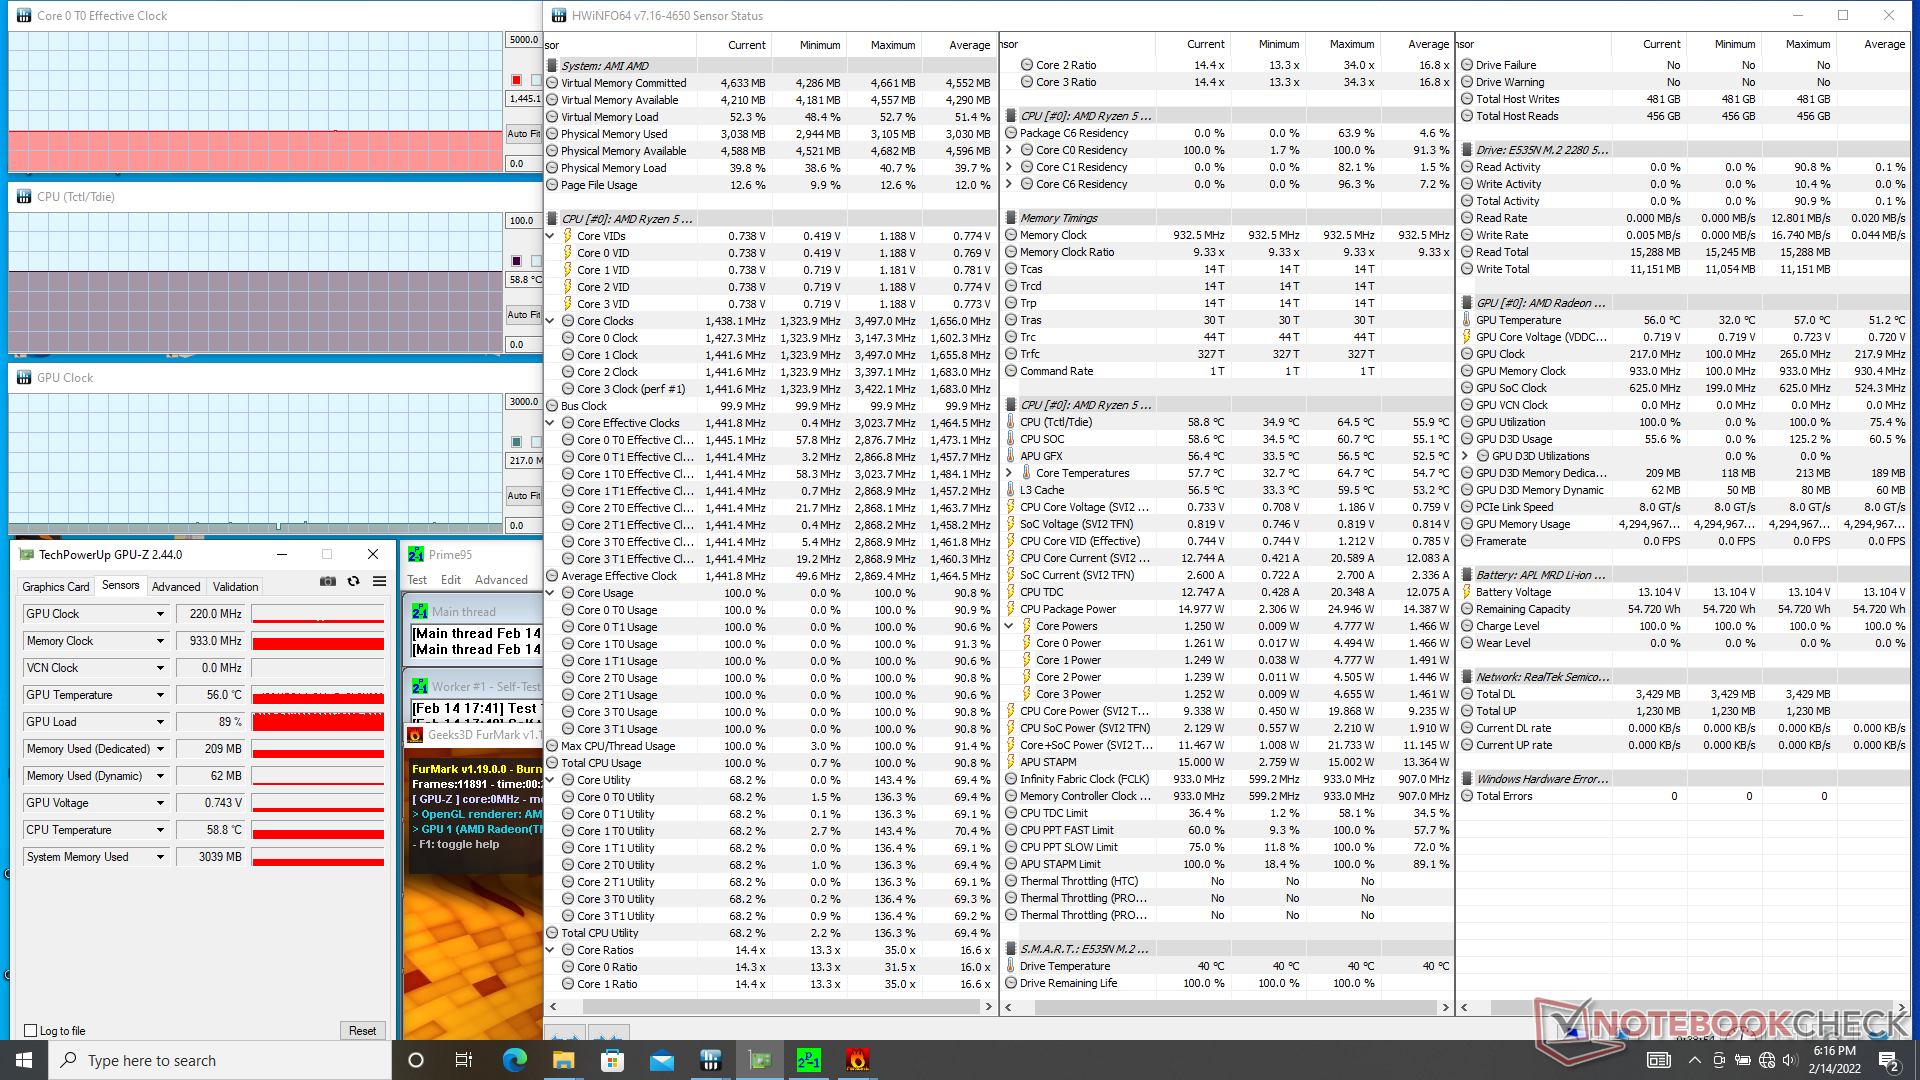
| CPU时钟(GHz) | GPU时钟(MHz) | CPU平均温度Tctl/怠速(°C) | |
| 系统空闲 | -- | -- | 35 |
| Prime95压力 | 2.2 | -- | 59 |
| Prime95 + FurMark压力 | 1.5 | 220 | 59 |
| Witcher 3 应力 | 0.7 | 737 | 59 |
发言人
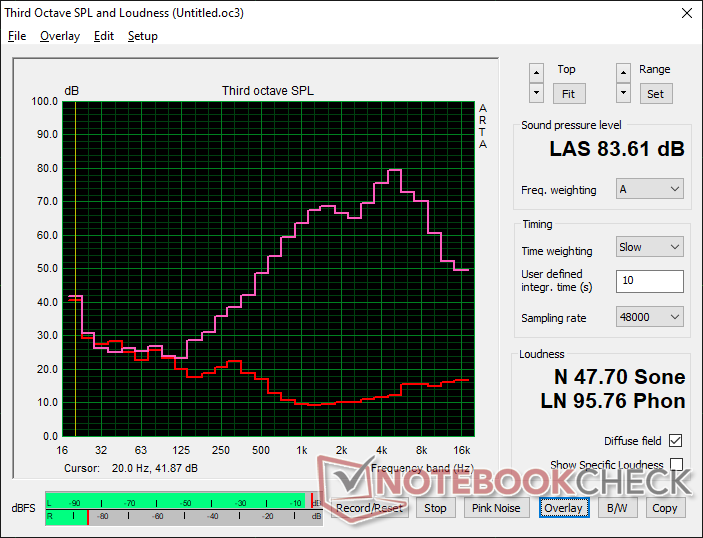
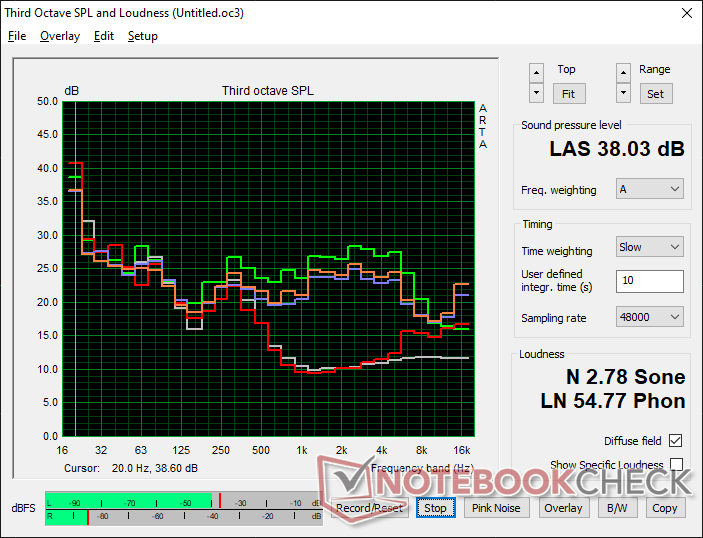
BMAX X14 Pro audio analysis
(+) | speakers can play relatively loud (83.6 dB)
Bass 100 - 315 Hz
(-) | nearly no bass - on average 29.2% lower than median
(±) | linearity of bass is average (7% delta to prev. frequency)
Mids 400 - 2000 Hz
(±) | reduced mids - on average 7.8% lower than median
(±) | linearity of mids is average (9.2% delta to prev. frequency)
Highs 2 - 16 kHz
(±) | higher highs - on average 11.1% higher than median
(±) | linearity of highs is average (11.2% delta to prev. frequency)
Overall 100 - 16.000 Hz
(-) | overall sound is not linear (33.5% difference to median)
Compared to same class
» 95% of all tested devices in this class were better, 1% similar, 3% worse
» The best had a delta of 5%, average was 18%, worst was 53%
Compared to all devices tested
» 92% of all tested devices were better, 1% similar, 6% worse
» The best had a delta of 4%, average was 23%, worst was 134%
Apple MacBook Pro 16 2021 M1 Pro audio analysis
(+) | speakers can play relatively loud (84.7 dB)
Bass 100 - 315 Hz
(+) | good bass - only 3.8% away from median
(+) | bass is linear (5.2% delta to prev. frequency)
Mids 400 - 2000 Hz
(+) | balanced mids - only 1.3% away from median
(+) | mids are linear (2.1% delta to prev. frequency)
Highs 2 - 16 kHz
(+) | balanced highs - only 1.9% away from median
(+) | highs are linear (2.7% delta to prev. frequency)
Overall 100 - 16.000 Hz
(+) | overall sound is linear (4.6% difference to median)
Compared to same class
» 0% of all tested devices in this class were better, 0% similar, 100% worse
» The best had a delta of 5%, average was 17%, worst was 45%
Compared to all devices tested
» 0% of all tested devices were better, 0% similar, 100% worse
» The best had a delta of 4%, average was 23%, worst was 134%
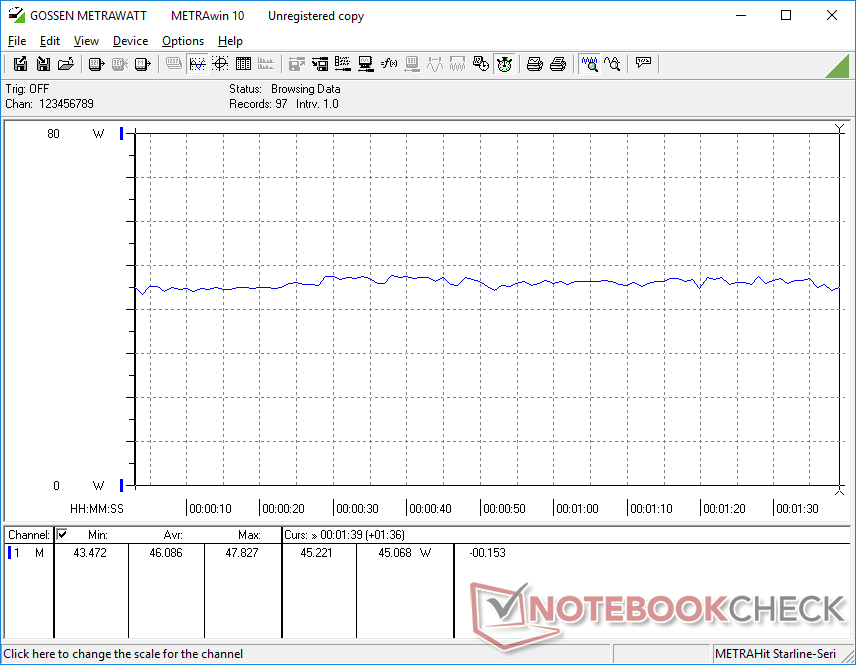
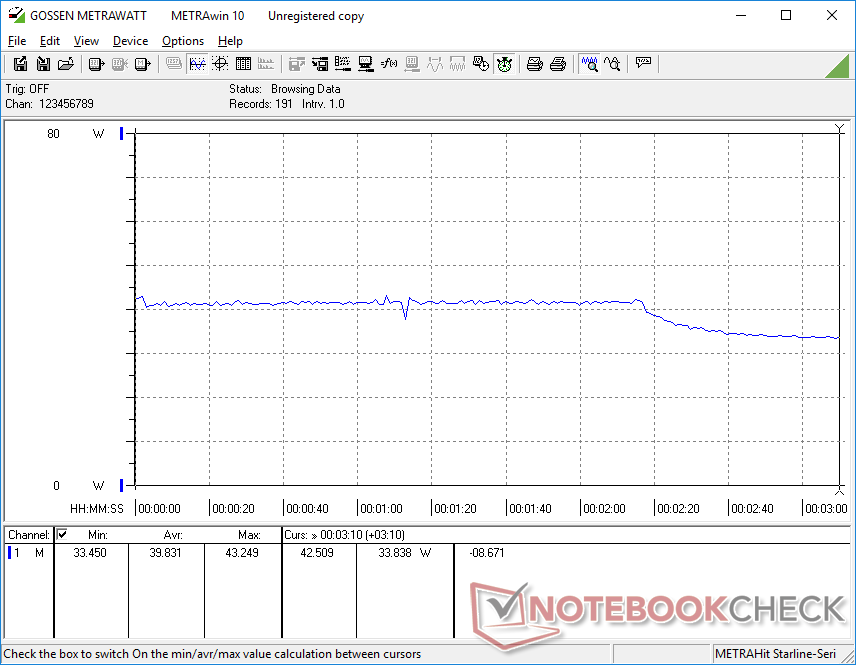
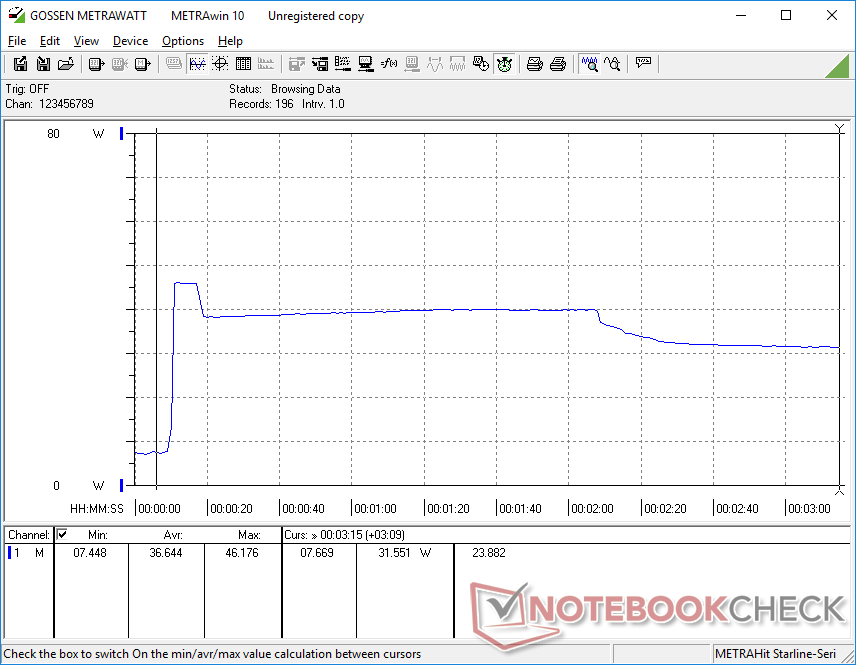
能源管理
消耗功率
该系统比大多数其他较新的超极本的耗电量略高,因为它使用的是老一代的AMD CPU。运行高要求的负载将耗费40瓦至46瓦,而戴尔Inspiron 14 7400则为35瓦至42瓦。 戴尔Inspiron 14 7400或惠普Pavilion 14即使BMax的性能较慢。每瓦性能较低是选择老一代CPU时需要付出的共同代价。
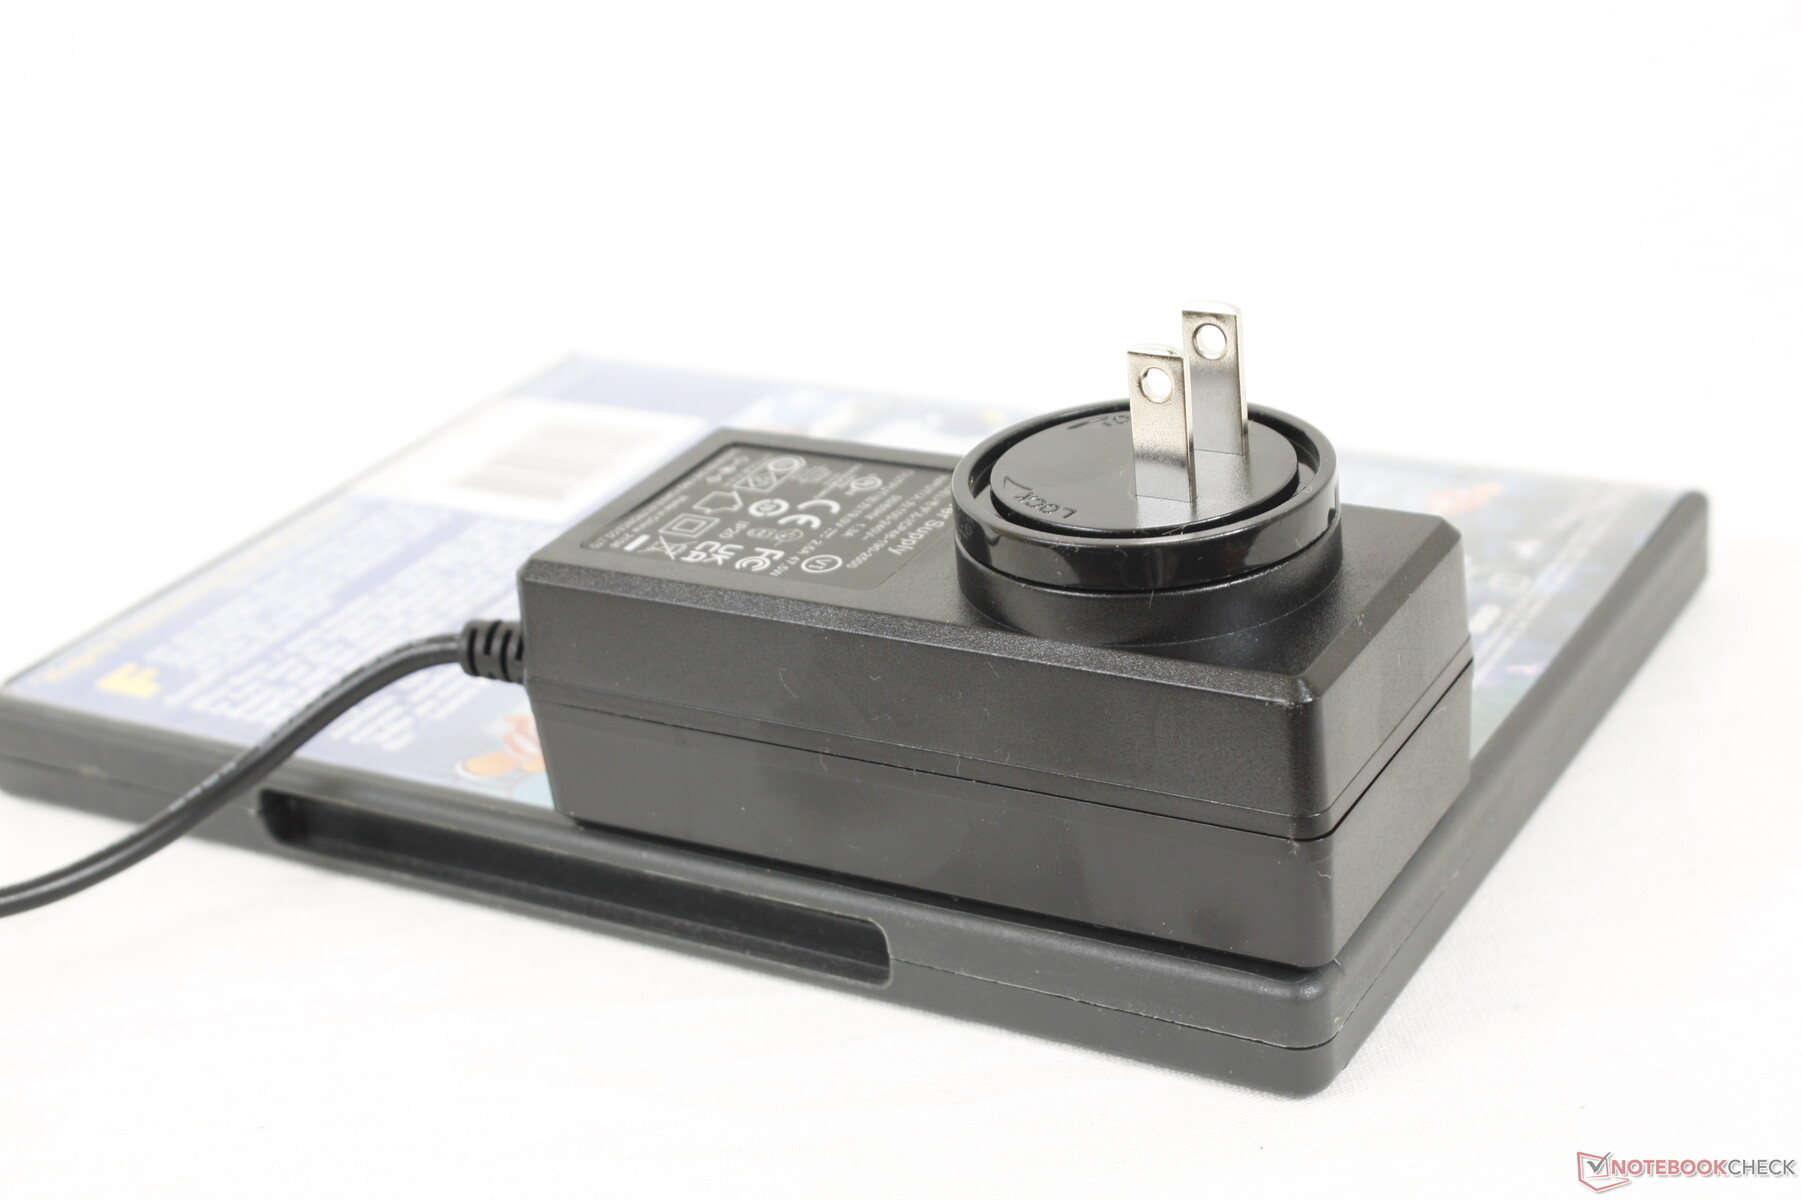
在同时运行Prime95和FurMark时,我们能够从小型(约9.5 x 4.1 x 6厘米)47.5瓦的交流适配器中记录到50瓦的临时最大耗电。

| Off / Standby | |
| Idle | |
| Load |
|
Key:
min: | |
| BMAX X14 Pro R5 3450U, Vega 8, SEAPIY E535N 512GB, IPS, 1920x1080, 14" | Lenovo IdeaPad 5 Pro 14ACN6 R5 5600U, Vega 7, WDC PC SN730 SDBPNTY-512G, IPS, 2240x1400, 14" | Dell Inspiron 14 7400 7415 2-in-1 R7 5700U, Vega 8, WDC PC SN530 SDBPTPZ-512G, IPS, 1920x1080, 14" | HP Pavilion 14-dv0357ng i5-1135G7, Iris Xe G7 80EUs, Intel Optane Memory H10 with Solid State Storage 32GB + 1TB HBRPEKNX0203AH(L/H), IPS, 1920x1080, 14" | Huawei MateBook 14 2020 Intel i7-10510U, GeForce MX350, Lite-On CA5-8D512, IPS LED, 2160x1440, 14" | Infinix INBook X2 i7-1065G7, Iris Plus Graphics G7 (Ice Lake 64 EU), Foresee GSYAPGC-512G, IPS, 1920x1080, 14" | |
|---|---|---|---|---|---|---|
| Power Consumption | 9% | 19% | 8% | -9% | 17% | |
| Idle Minimum * (Watt) | 6.3 | 3.8 40% | 4.5 29% | 4.8 24% | 3 52% | 4.3 32% |
| Idle Average * (Watt) | 9.6 | 6.9 28% | 6.5 32% | 8.5 11% | 9 6% | 6.3 34% |
| Idle Maximum * (Watt) | 9.9 | 8.8 11% | 7.1 28% | 12.4 -25% | 11 -11% | 9.6 3% |
| Load Average * (Watt) | 46 | 42.2 8% | 40.4 12% | 37.7 18% | 60.8 -32% | 40.7 12% |
| Witcher 3 ultra * (Watt) | 39.8 | 37.7 5% | 31.7 20% | 35.4 11% | 56 -41% | 36.9 7% |
| Load Maximum * (Watt) | 50.3 | 68.4 -36% | 54.3 -8% | 45.3 10% | 65.6 -30% | 44.4 12% |
* ... smaller is better
Power Consumption Witcher 3 / Stresstest
Power Consumption external Monitor
电池寿命
WLAN运行时间相当不错,充满电后约为6.5小时。然而,从空电到满电的充电时间相对较慢,为3.5小时,而大多数其他超极本只有1.5小时。
| BMAX X14 Pro R5 3450U, Vega 8, 55 Wh | Lenovo IdeaPad 5 Pro 14ACN6 R5 5600U, Vega 7, 57 Wh | Dell Inspiron 14 7400 7415 2-in-1 R7 5700U, Vega 8, 54 Wh | HP Pavilion 14-dv0357ng i5-1135G7, Iris Xe G7 80EUs, 43 Wh | Huawei MateBook 14 2020 Intel i7-10510U, GeForce MX350, 56 Wh | Infinix INBook X2 i7-1065G7, Iris Plus Graphics G7 (Ice Lake 64 EU), 50 Wh | |
|---|---|---|---|---|---|---|
| Battery runtime | 39% | 64% | -9% | 94% | 2% | |
| WiFi v1.3 (h) | 6.6 | 9.2 39% | 10.8 64% | 6 -9% | 12.8 94% | 6.7 2% |
| Reader / Idle (h) | 21.6 | 18.6 | ||||
| Load (h) | 1 | 2.3 | 2 | |||
| H.264 (h) | 5.9 | 13.9 | ||||
| Witcher 3 ultra (h) | 2 |
Pros
Cons
判决书
BMax X14 Pro最好的方面是其低于500美元的低价和相对于这个价格来说比较快的AMD Ryzen 5 CPU。与戴尔Inspiron 3000系列等其他廉价机型相比,它看起来也比实际价格要高。 惠普14系列,或联想IdeaPad 3系列。
X14 Pro的缺点与许多Chuwi笔记本电脑相似,该机型注重视觉设计,牺牲了质量保证或其他硬件的削减。例如,我们的空格键比其他所有的键都要松软,而反馈应该是统一的,同时机箱的弯曲、扭曲和吱吱作响比我们希望的更容易。它的显示屏也只覆盖了59%的sRGB,尽管它声称有100%的覆盖率。
如果你正在寻找一台廉价的14英寸笔记本电脑,使性能和便携性最大化,那么Max X14 Pro可以填补这一空白。然而,要想获得更饱满的色彩和更好的可靠性,你必须花更多钱购买更知名的制造商的中档超极本,如 联想IdeaPad 5系列或 HP Envy系列.
价格和可用性
BMax X14 Pro是,现在亚马逊上发货售价为499美元,使用60美元的优惠券代码后为439美元。
BMAX X14 Pro
- 02/16/2022 v7 (old)
Allen Ngo
Price comparison

