惠普ProBook G6 (i7, 512 GB, FHD) 笔记本电脑评测

| SD Card Reader | |
| average JPG Copy Test (av. of 3 runs) | |
| HP ProBook 440 G5-3KX87ES (Toshiba Exceria Pro SDXC 64 GB UHS-II) | |
| HP ProBook 440 G6-5TK01EA (Toshiba Exceria Pro SDXC 64 GB UHS-II) | |
| Lenovo ThinkPad E480-20KNCTO1WW (Toshiba Exceria Pro M501) | |
| Lenovo ThinkPad A485-20MU000CGE (Toshiba Exceria Pro SDXC 64 GB UHS-II) | |
| Fujitsu Lifebook E548 (Toshiba Exceria Pro SDXC 64 GB UHS-II) | |
| Average of class Office (19.8 - 198.5, n=22, last 2 years) | |
| Acer TravelMate X3410-M-866T (Toshiba Exceria Pro SDXC 64 GB UHS-II) | |
| maximum AS SSD Seq Read Test (1GB) | |
| HP ProBook 440 G5-3KX87ES (Toshiba Exceria Pro SDXC 64 GB UHS-II) | |
| Lenovo ThinkPad E480-20KNCTO1WW (Toshiba Exceria Pro M501) | |
| Lenovo ThinkPad A485-20MU000CGE (Toshiba Exceria Pro SDXC 64 GB UHS-II) | |
| HP ProBook 440 G6-5TK01EA (Toshiba Exceria Pro SDXC 64 GB UHS-II) | |
| Average of class Office (27.4 - 249, n=21, last 2 years) | |
| Fujitsu Lifebook E548 (Toshiba Exceria Pro SDXC 64 GB UHS-II) | |
| Acer TravelMate X3410-M-866T (Toshiba Exceria Pro SDXC 64 GB UHS-II) | |
| Networking | |
| iperf3 transmit AX12 | |
| HP ProBook 440 G6-5TK01EA | |
| Fujitsu Lifebook E548 | |
| HP ProBook 440 G5-3KX87ES | |
| Huawei MateBook D 14 W50F | |
| Lenovo ThinkPad A485-20MU000CGE | |
| Acer TravelMate X3410-M-866T | |
| Lenovo ThinkPad E480-20KNCTO1WW | |
| iperf3 receive AX12 | |
| HP ProBook 440 G5-3KX87ES | |
| HP ProBook 440 G6-5TK01EA | |
| Acer TravelMate X3410-M-866T | |
| Lenovo ThinkPad A485-20MU000CGE | |
| Fujitsu Lifebook E548 | |
| Huawei MateBook D 14 W50F | |
| Lenovo ThinkPad E480-20KNCTO1WW | |
| |||||||||||||||||||||||||
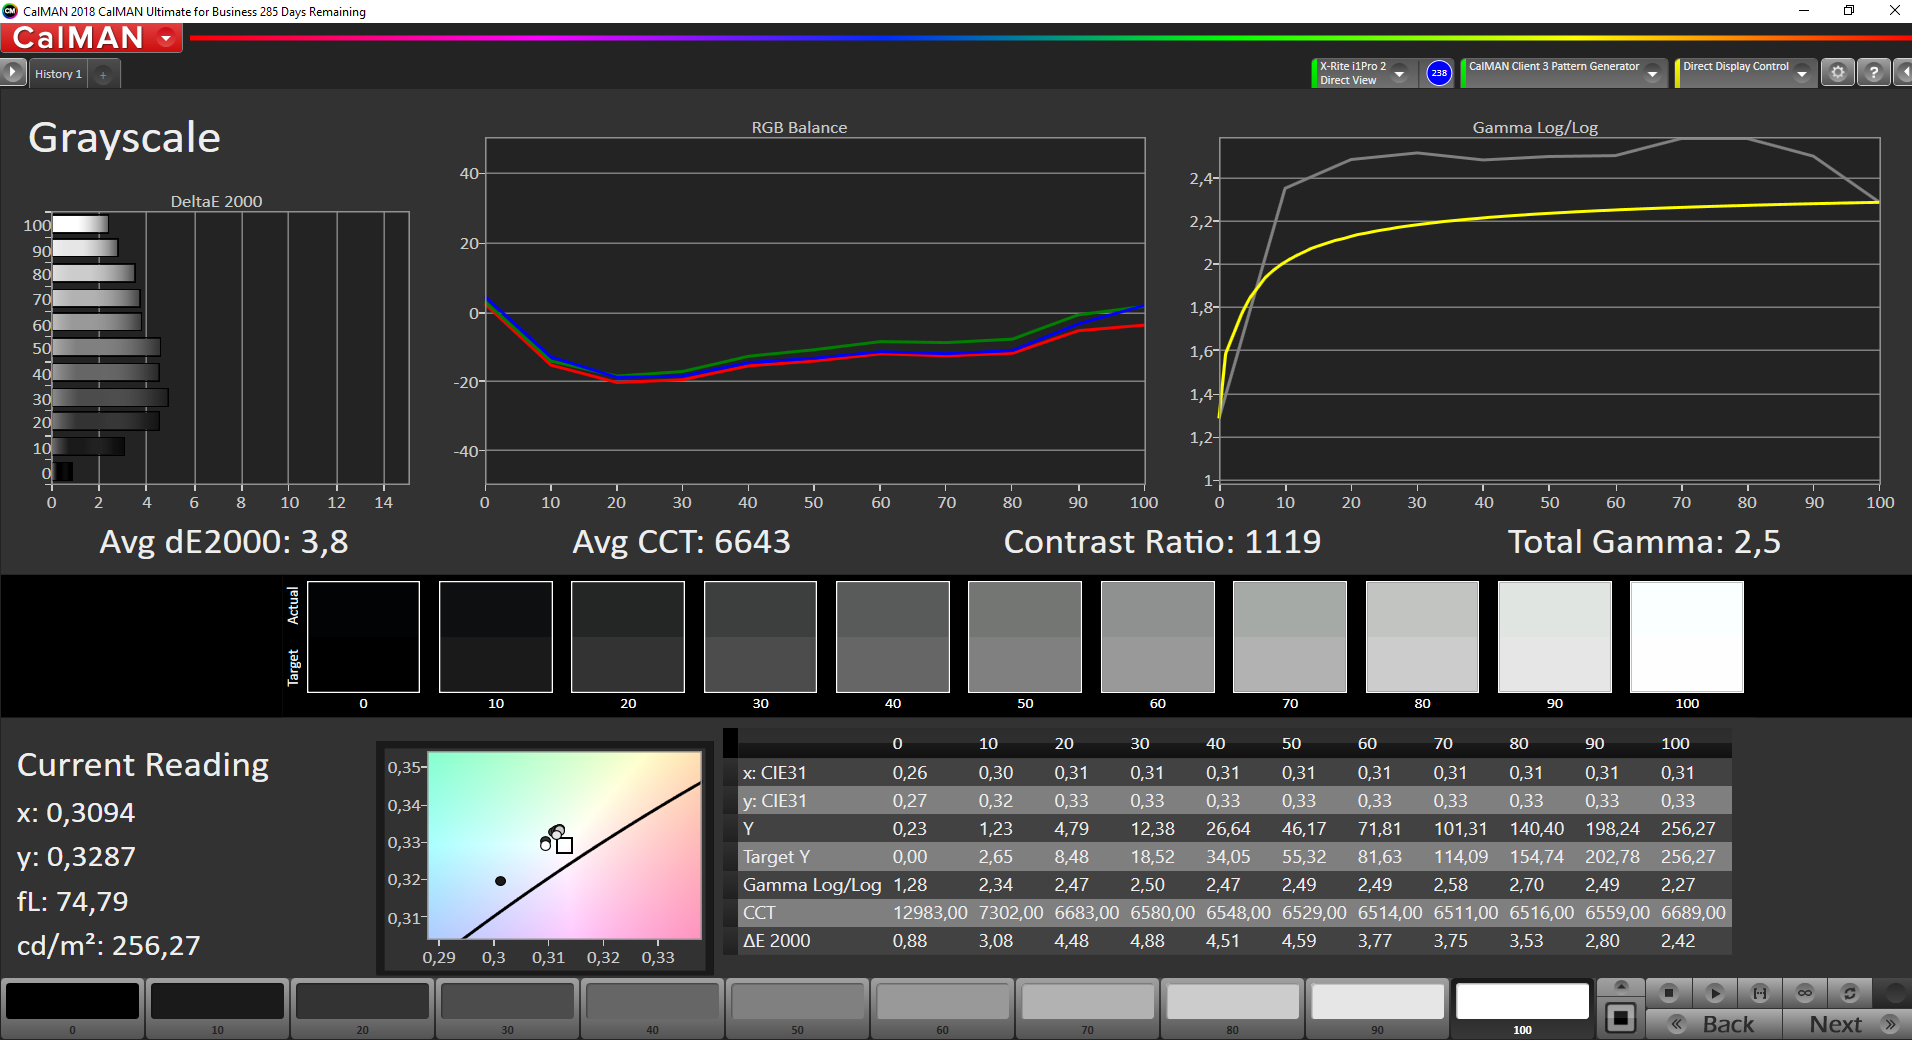
Brightness Distribution: 85 %
Center on Battery: 257 cd/m²
Contrast: 1113:1 (Black: 0.23 cd/m²)
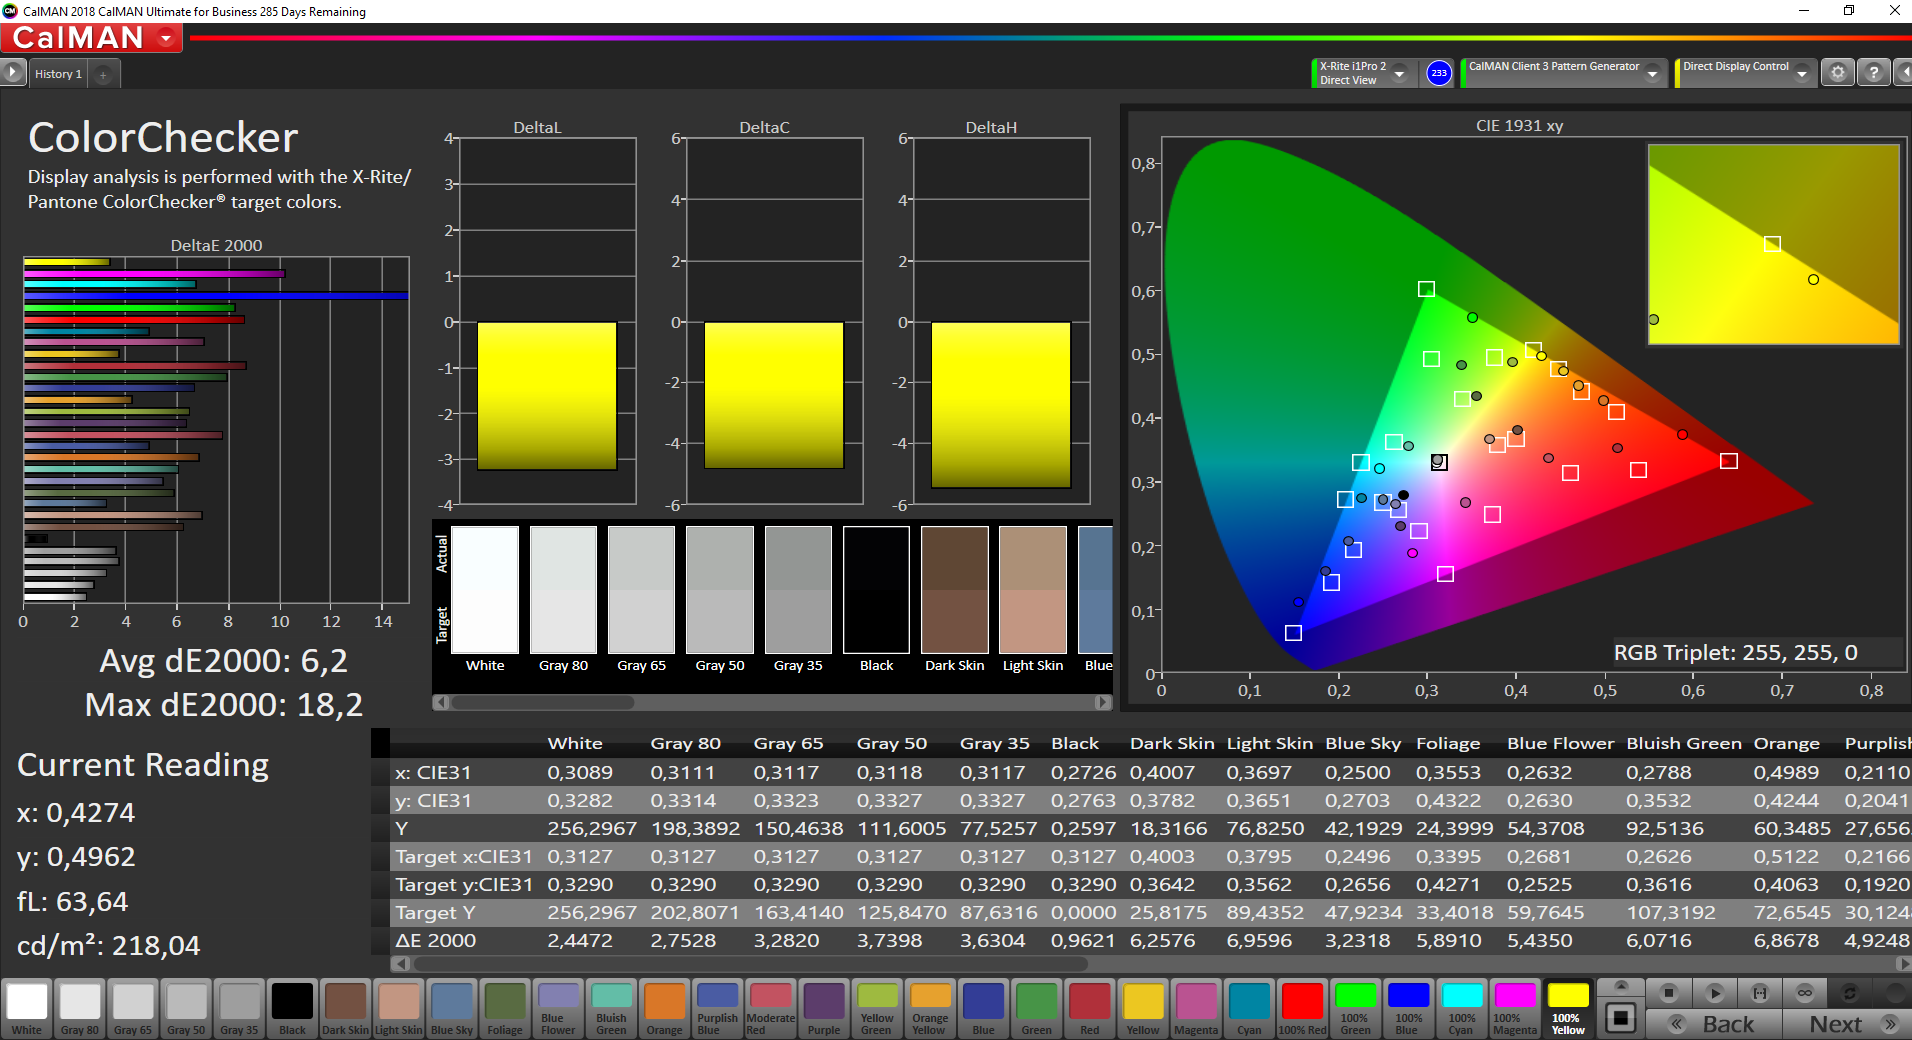
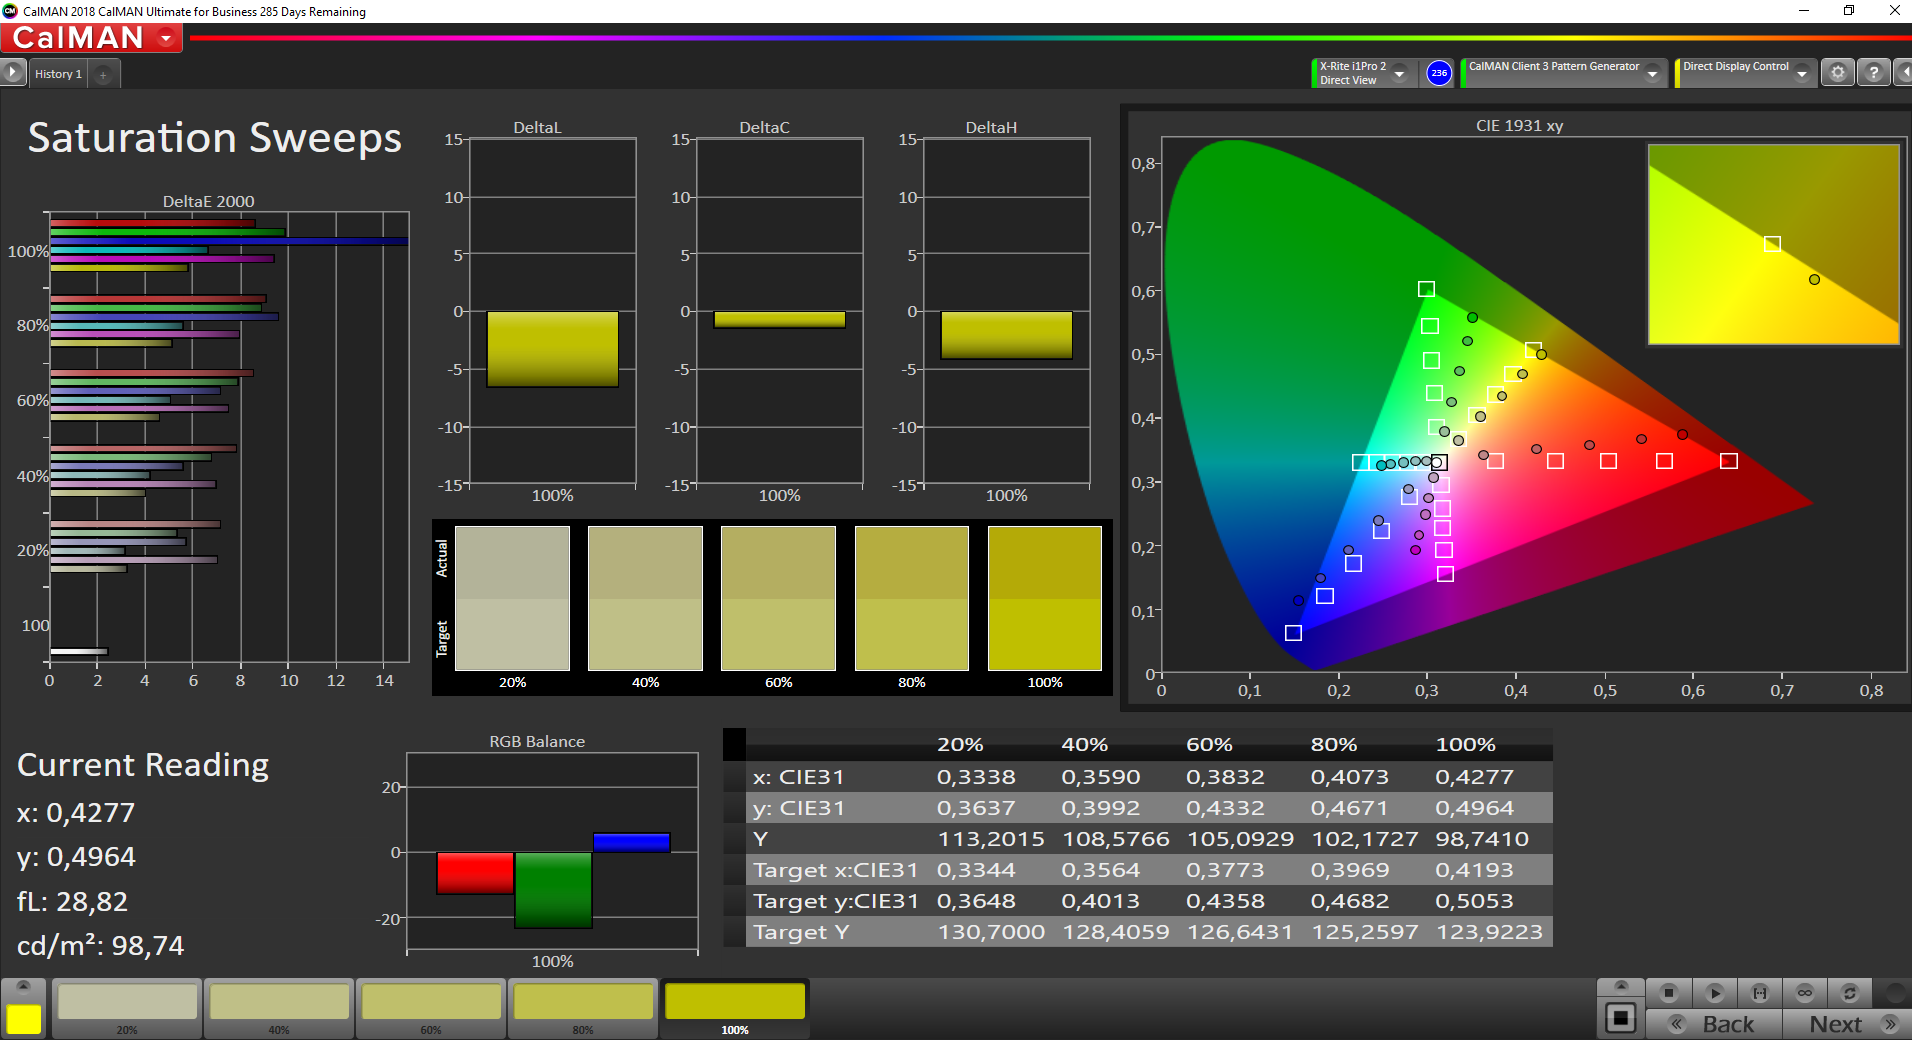
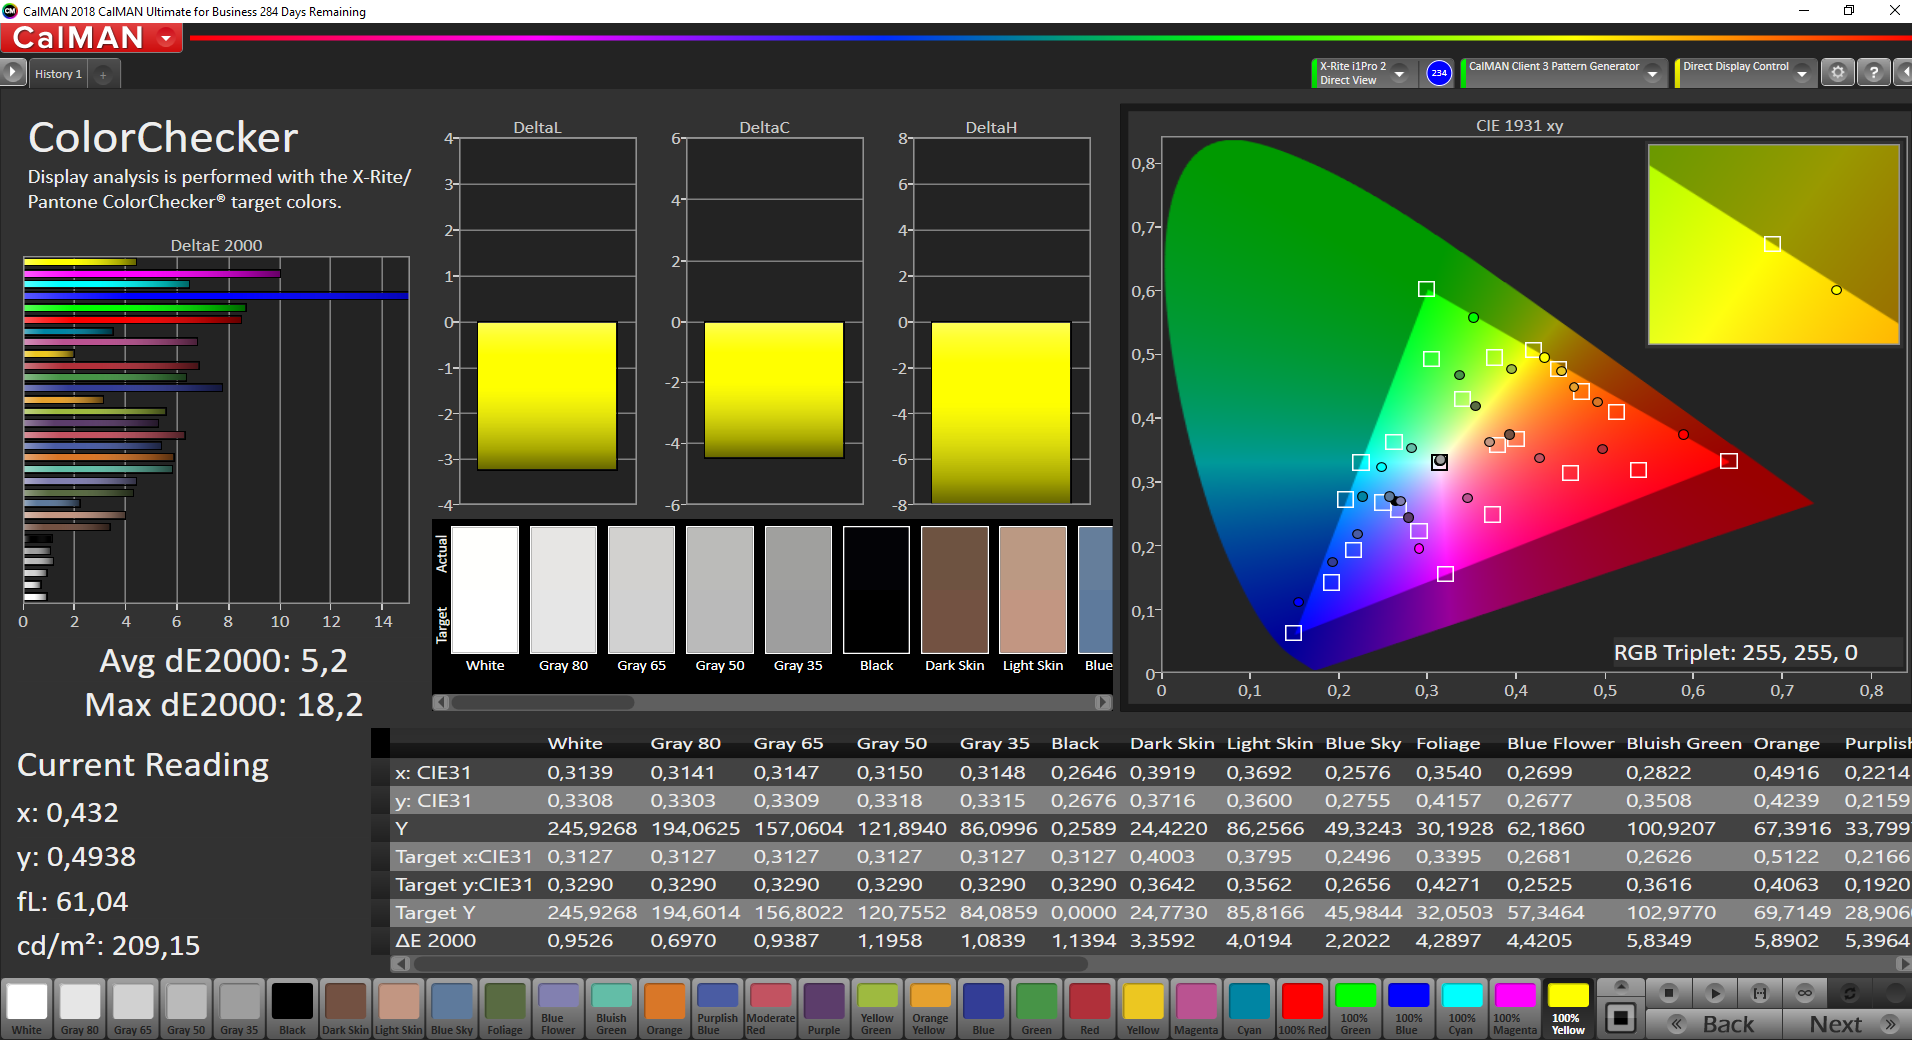
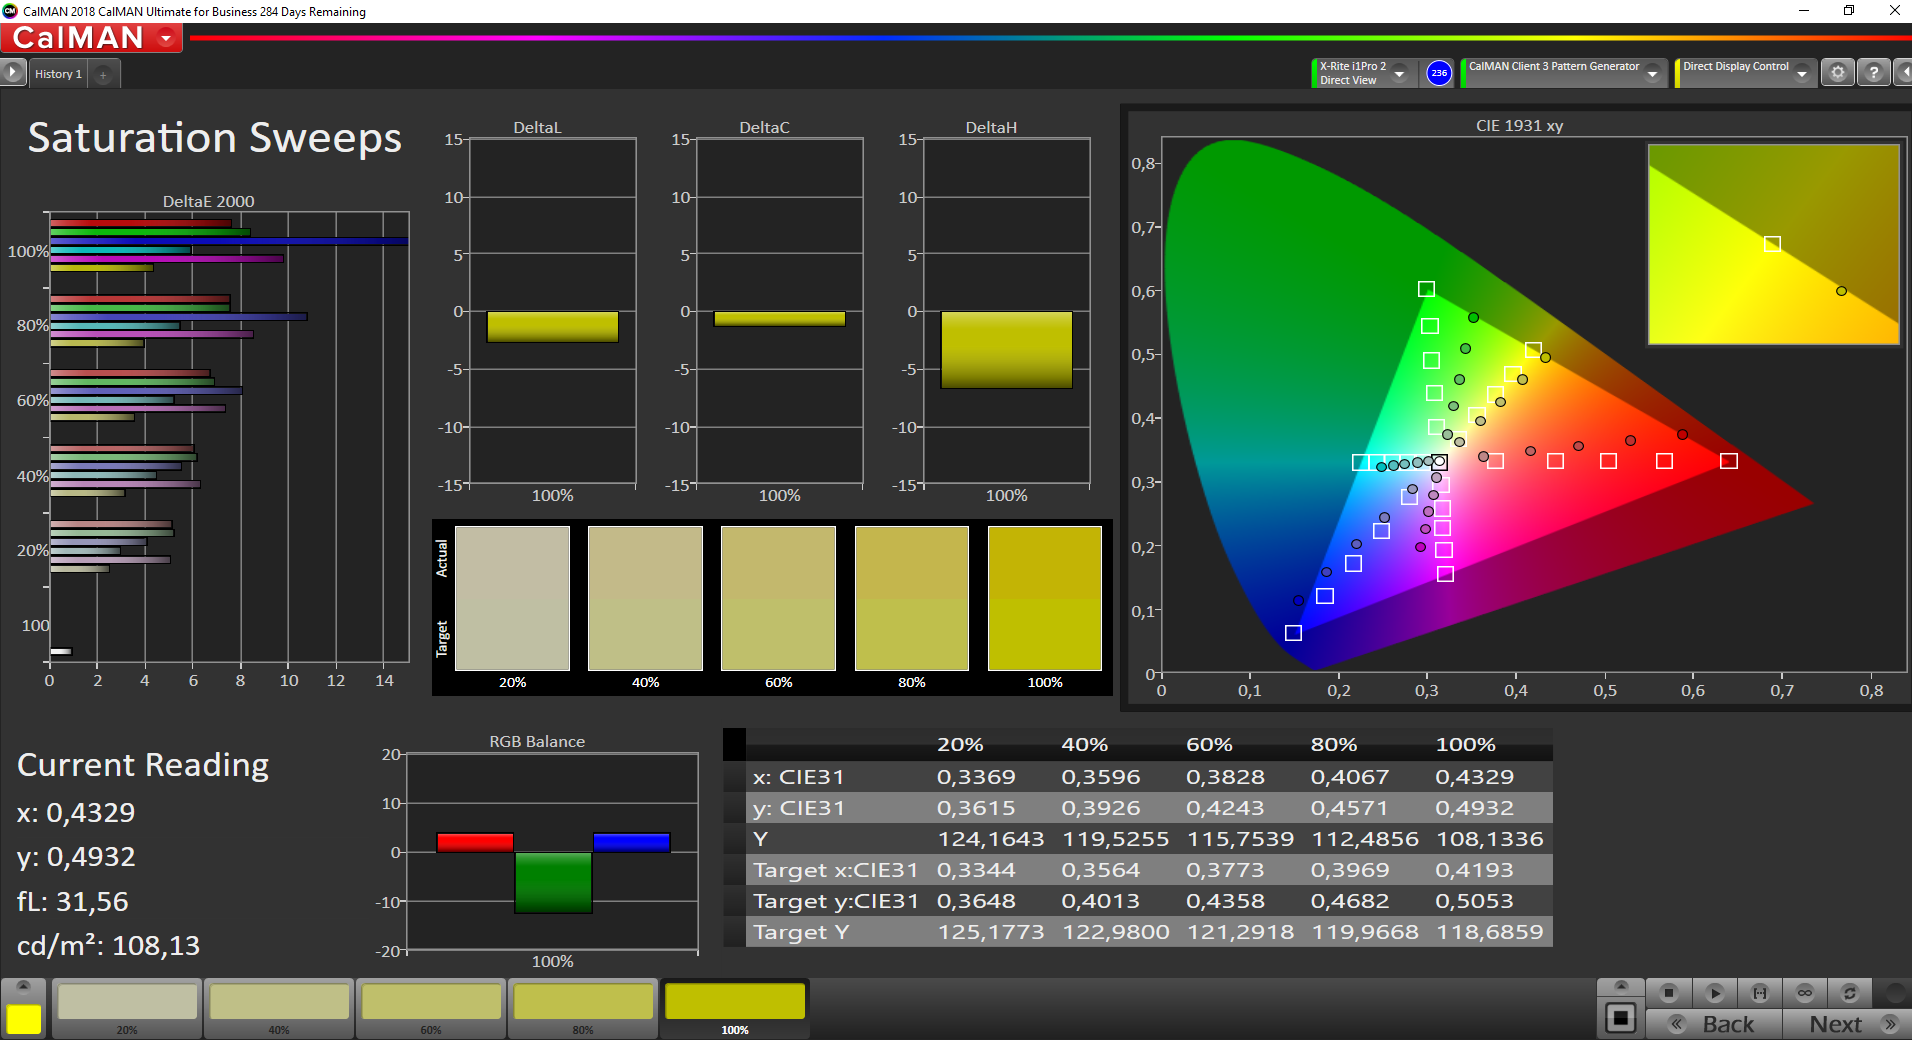
ΔE ColorChecker Calman: 6.2 | ∀{0.5-29.43 Ø4.71}
calibrated: 5.2
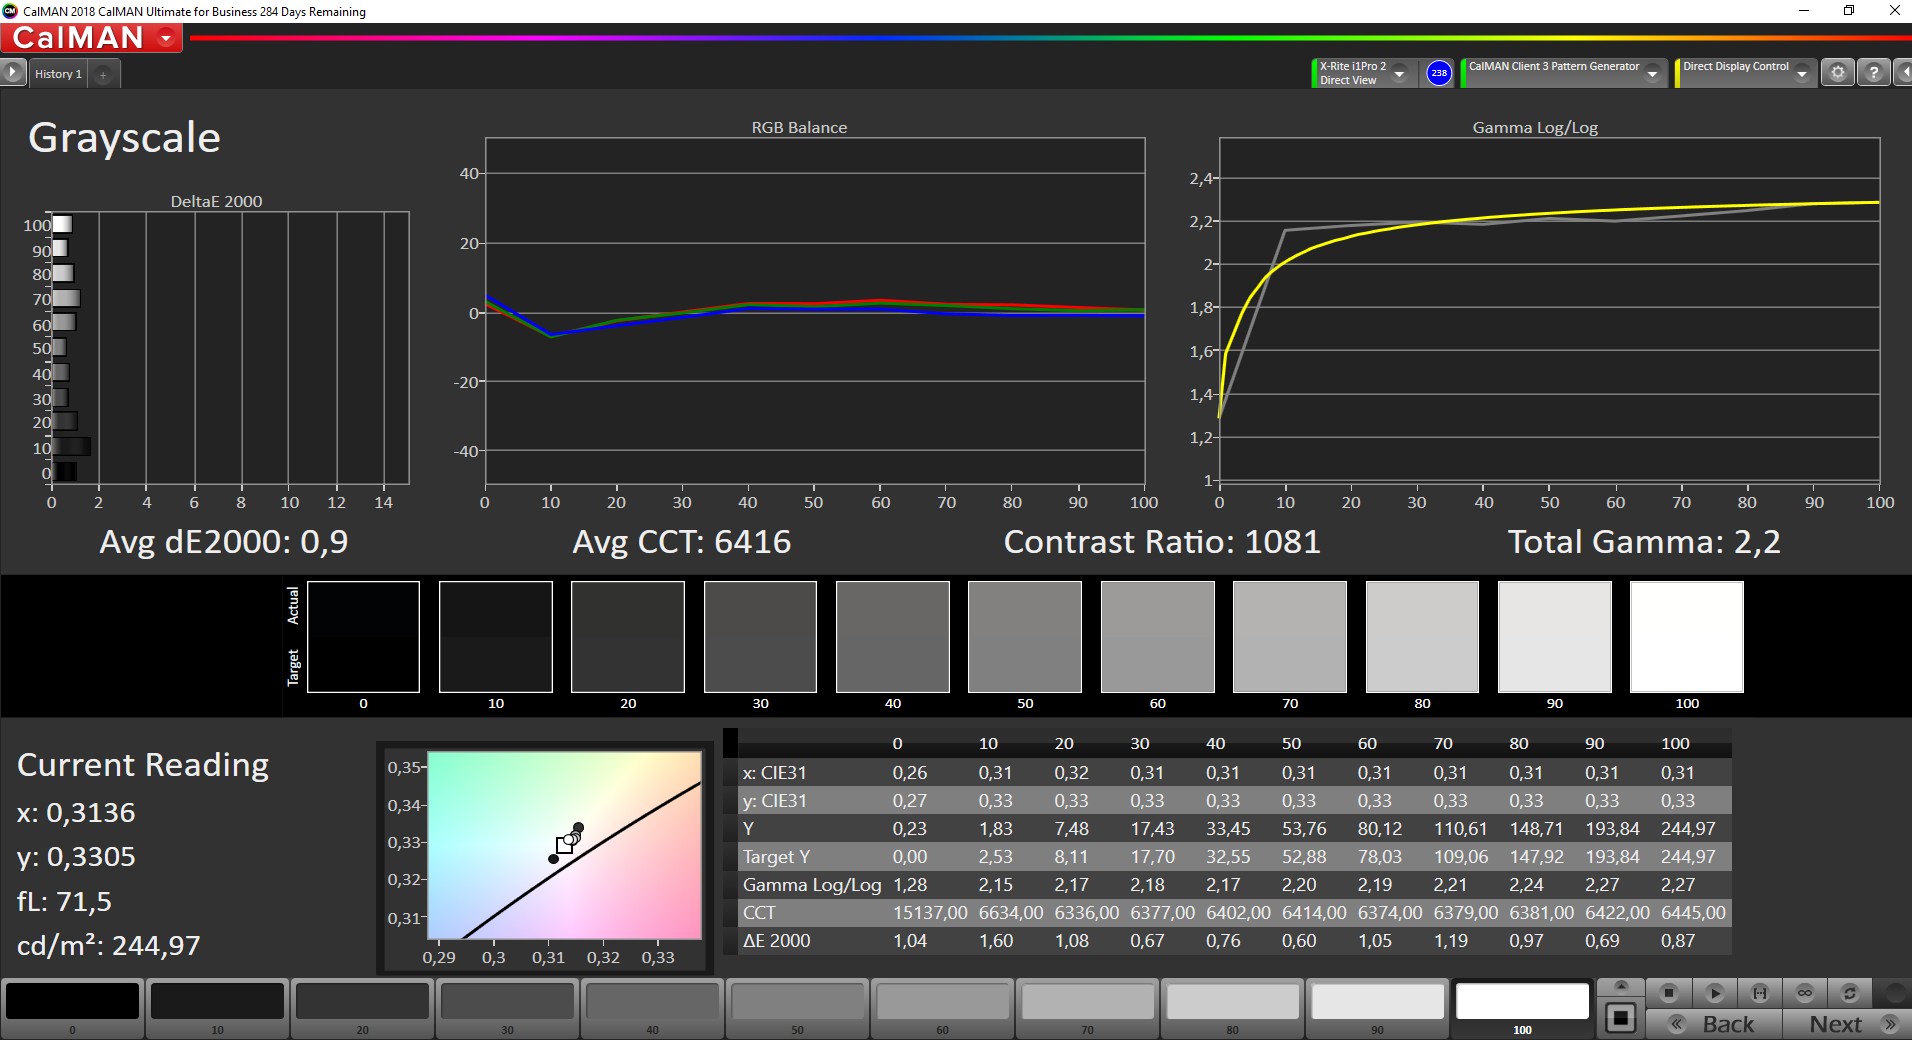
ΔE Greyscale Calman: 3.8 | ∀{0.09-98 Ø4.96}
56.9% sRGB (Argyll 1.6.3 3D)
36.1% AdobeRGB 1998 (Argyll 1.6.3 3D)
39.37% AdobeRGB 1998 (Argyll 3D)
57.2% sRGB (Argyll 3D)
38.08% Display P3 (Argyll 3D)
Gamma: 2.5
CCT: 6643 K
| HP ProBook 440 G6-5TK01EA LG Philips, LGD05F1, IPS, 1920x1080, 14" | HP ProBook 440 G5-3KX87ES LGD04B2, IPS LED, 1920x1080, 14" | Lenovo ThinkPad E480-20KNCTO1WW Innolux N140HCA-EAC, IPS LED, 1920x1080, 14" | Lenovo ThinkPad A485-20MU000CGE NV140FHM-N46, IPS LED, 1920x1080, 14" | Acer TravelMate X3410-M-866T Chi Mei CMN14D4, IPS, 1920x1080, 14" | Fujitsu Lifebook E548 LG Philips LGD05B6, IPS, 1920x1080, 14" | Huawei MateBook D 14 W50F BOE0764 / TV140FHM-NH0, IPS, 1920x1080, 14" | |
|---|---|---|---|---|---|---|---|
| Display | 4% | 9% | 6% | 9% | 3% | 13% | |
| Display P3 Coverage (%) | 38.08 | 39.56 4% | 41.56 9% | 40.24 6% | 41.59 9% | 39.21 3% | 43.19 13% |
| sRGB Coverage (%) | 57.2 | 59.3 4% | 62.2 9% | 60 5% | 62.4 9% | 58.5 2% | 64 12% |
| AdobeRGB 1998 Coverage (%) | 39.37 | 40.88 4% | 42.96 9% | 41.57 6% | 42.99 9% | 40.56 3% | 44.62 13% |
| Response Times | -1% | -12% | -19% | -13% | 21% | -18% | |
| Response Time Grey 50% / Grey 80% * (ms) | 41.6 ? | 40 ? 4% | 44.8 ? -8% | 44.8 ? -8% | 40.4 ? 3% | 34 ? 18% | 41 ? 1% |
| Response Time Black / White * (ms) | 27.2 ? | 28.8 ? -6% | 31.2 ? -15% | 35.2 ? -29% | 35.2 ? -29% | 21 ? 23% | 37 ? -36% |
| PWM Frequency (Hz) | 25000 ? | 1000 ? | 25000 ? | 200 ? | |||
| Screen | -5% | -5% | 2% | 1% | -1% | 2% | |
| Brightness middle (cd/m²) | 256 | 236 -8% | 262 2% | 275 7% | 253.1 -1% | 278 9% | 291 14% |
| Brightness (cd/m²) | 238 | 221 -7% | 245 3% | 272 14% | 230 -3% | 240 1% | 276 16% |
| Brightness Distribution (%) | 85 | 88 4% | 83 -2% | 85 0% | 77 -9% | 78 -8% | 85 0% |
| Black Level * (cd/m²) | 0.23 | 0.26 -13% | 0.19 17% | 0.26 -13% | 0.3 -30% | 0.27 -17% | 0.46 -100% |
| Contrast (:1) | 1113 | 908 -18% | 1379 24% | 1058 -5% | 844 -24% | 1030 -7% | 633 -43% |
| Colorchecker dE 2000 * | 6.2 | 5.7 8% | 7 -13% | 5.9 5% | 4.71 24% | 5.57 10% | 4.3 31% |
| Colorchecker dE 2000 max. * | 18.2 | 22 -21% | 23.6 -30% | 20 -10% | 20.72 -14% | 11.01 40% | 10.01 45% |
| Colorchecker dE 2000 calibrated * | 5.2 | 4.9 6% | 3.44 34% | 5.63 -8% | 3.18 39% | ||
| Greyscale dE 2000 * | 3.8 | 3.8 -0% | 6.4 -68% | 3.6 5% | 3.4 11% | 4.94 -30% | 4.21 -11% |
| Gamma | 2.5 88% | 2.1 105% | 2.14 103% | 2.36 93% | 1.997 110% | 2.6 85% | 2.46 89% |
| CCT | 6643 98% | 7318 89% | 6065 107% | 6798 96% | 6266 104% | 7322 89% | 6867 95% |
| Color Space (Percent of AdobeRGB 1998) (%) | 36.1 | 37.7 4% | 39.5 9% | 38.1 6% | 40 11% | 37 2% | 41 14% |
| Color Space (Percent of sRGB) (%) | 56.9 | 59.2 4% | 61.9 9% | 59.6 5% | 62 9% | 58 2% | 64 12% |
| Total Average (Program / Settings) | -1% /
-2% | -3% /
-3% | -4% /
0% | -1% /
1% | 8% /
3% | -1% /
1% |
* ... smaller is better
Display Response Times
| ↔ Response Time Black to White | ||
|---|---|---|
| 27.2 ms ... rise ↗ and fall ↘ combined | ↗ 15.6 ms rise | 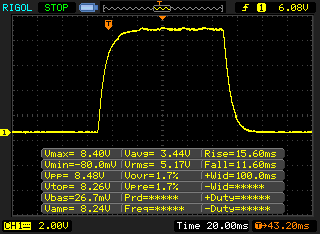 |
| ↘ 11.6 ms fall | ||
| The screen shows relatively slow response rates in our tests and may be too slow for gamers. In comparison, all tested devices range from 0.1 (minimum) to 240 (maximum) ms. » 69 % of all devices are better. This means that the measured response time is worse than the average of all tested devices (19.8 ms). | ||
| ↔ Response Time 50% Grey to 80% Grey | ||
| 41.6 ms ... rise ↗ and fall ↘ combined | ↗ 22.8 ms rise | 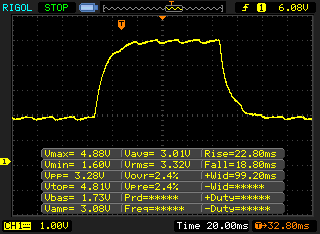 |
| ↘ 18.8 ms fall | ||
| The screen shows slow response rates in our tests and will be unsatisfactory for gamers. In comparison, all tested devices range from 0.165 (minimum) to 636 (maximum) ms. » 67 % of all devices are better. This means that the measured response time is worse than the average of all tested devices (30.9 ms). | ||
Screen Flickering / PWM (Pulse-Width Modulation)
| Screen flickering / PWM not detected | 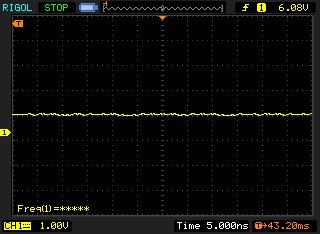 | ||
In comparison: 52 % of all tested devices do not use PWM to dim the display. If PWM was detected, an average of 7741 (minimum: 5 - maximum: 343500) Hz was measured. | |||
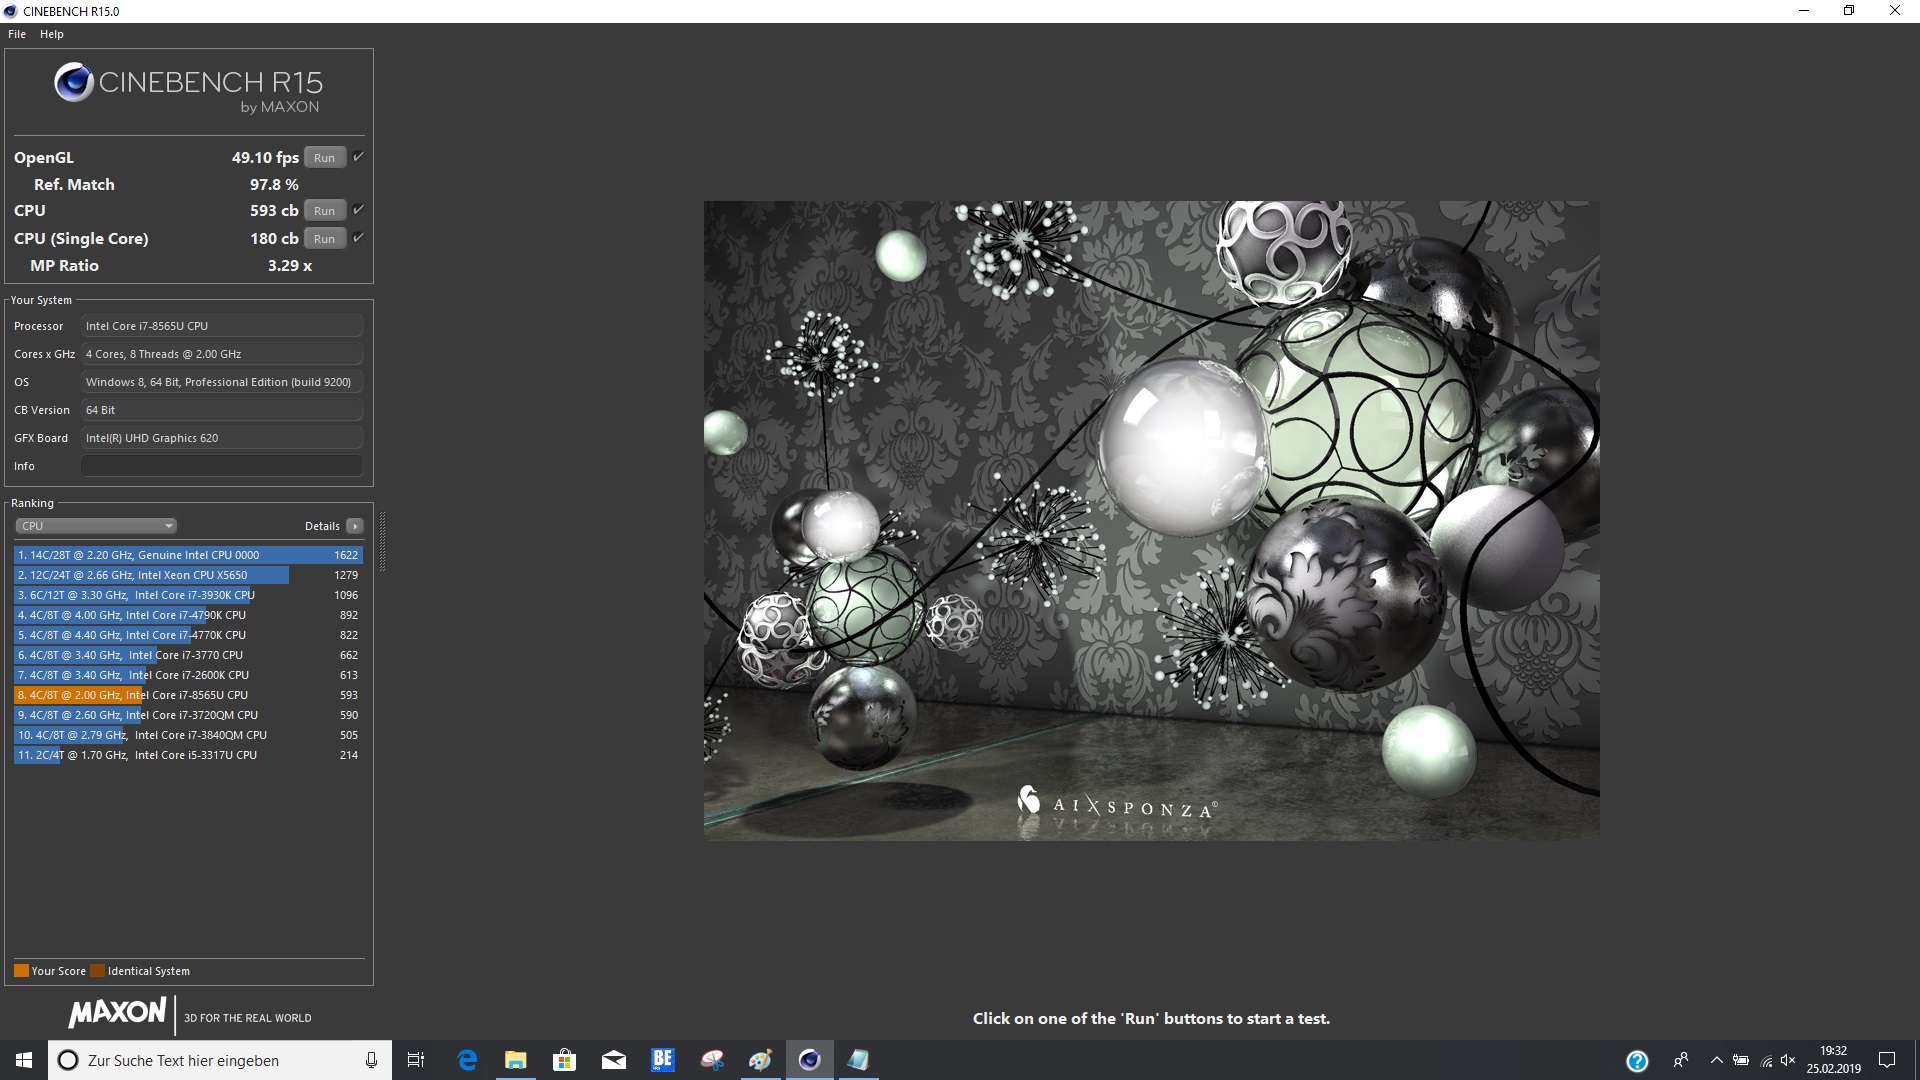
| Cinebench R15 | |
| CPU Single 64Bit | |
| Average of class Office (99.5 - 316, n=77, last 2 years) | |
| HP ProBook 440 G6-5TK01EA | |
| Average Intel Core i7-8565U (138.3 - 193, n=51) | |
| Acer TravelMate X3410-M-866T | |
| HP ProBook 440 G5-3KX87ES | |
| Lenovo ThinkPad E480-20KNCTO1WW | |
| Fujitsu Lifebook E548 | |
| Huawei MateBook D 14 W50F | |
| Lenovo ThinkPad A485-20MU000CGE | |
| CPU Multi 64Bit | |
| Average of class Office (250 - 3380, n=77, last 2 years) | |
| HP ProBook 440 G5-3KX87ES | |
| Average Intel Core i7-8565U (452 - 815, n=52) | |
| HP ProBook 440 G6-5TK01EA | |
| Huawei MateBook D 14 W50F | |
| Lenovo ThinkPad A485-20MU000CGE | |
| Lenovo ThinkPad E480-20KNCTO1WW | |
| Fujitsu Lifebook E548 | |
| Acer TravelMate X3410-M-866T | |
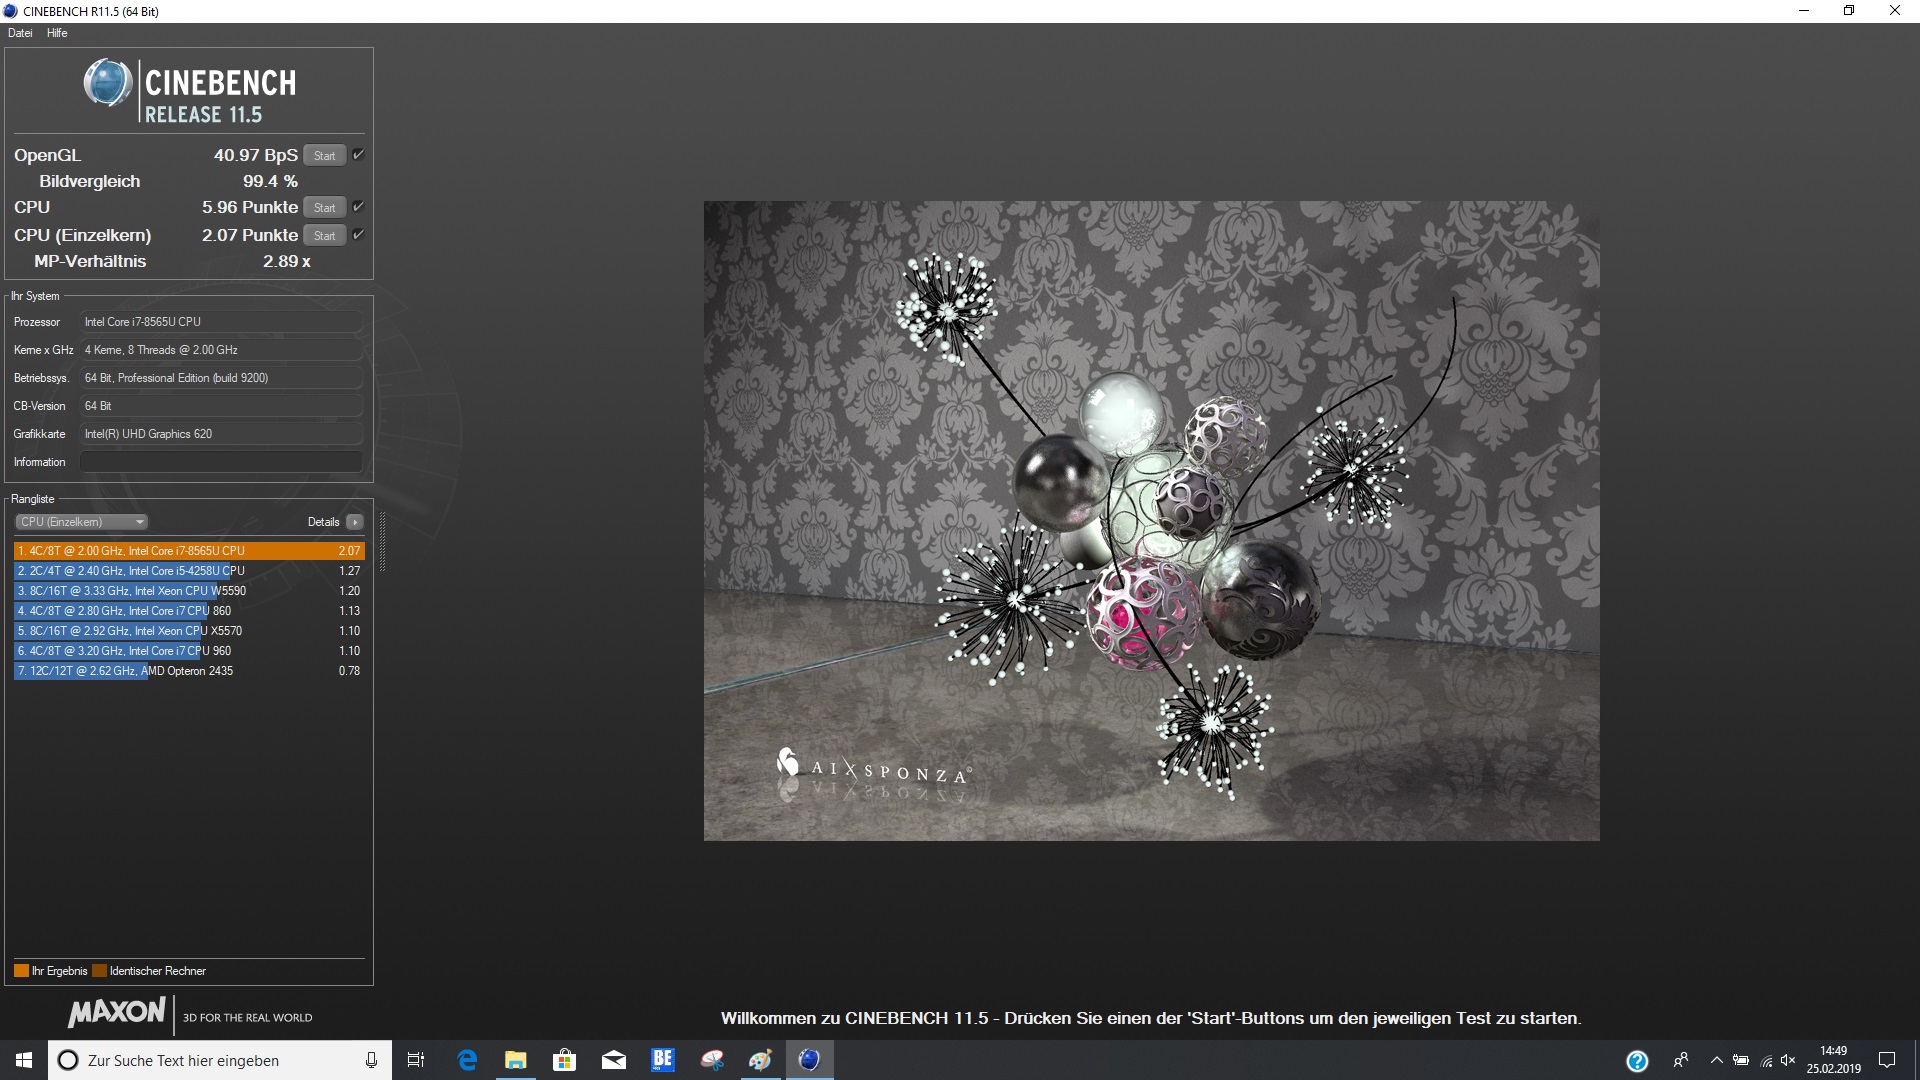
| Cinebench R11.5 | |
| CPU Single 64Bit | |
| Average of class Office (2 - 3.6, n=14, last 2 years) | |
| HP ProBook 440 G6-5TK01EA | |
| Average Intel Core i7-8565U (0.65 - 2.16, n=11) | |
| Lenovo ThinkPad E480-20KNCTO1WW | |
| Lenovo ThinkPad A485-20MU000CGE | |
| CPU Multi 64Bit | |
| Average of class Office (9.76 - 31.5, n=14, last 2 years) | |
| Average Intel Core i7-8565U (4.09 - 7.4, n=11) | |
| Lenovo ThinkPad E480-20KNCTO1WW | |
| Lenovo ThinkPad A485-20MU000CGE | |
| HP ProBook 440 G6-5TK01EA | |
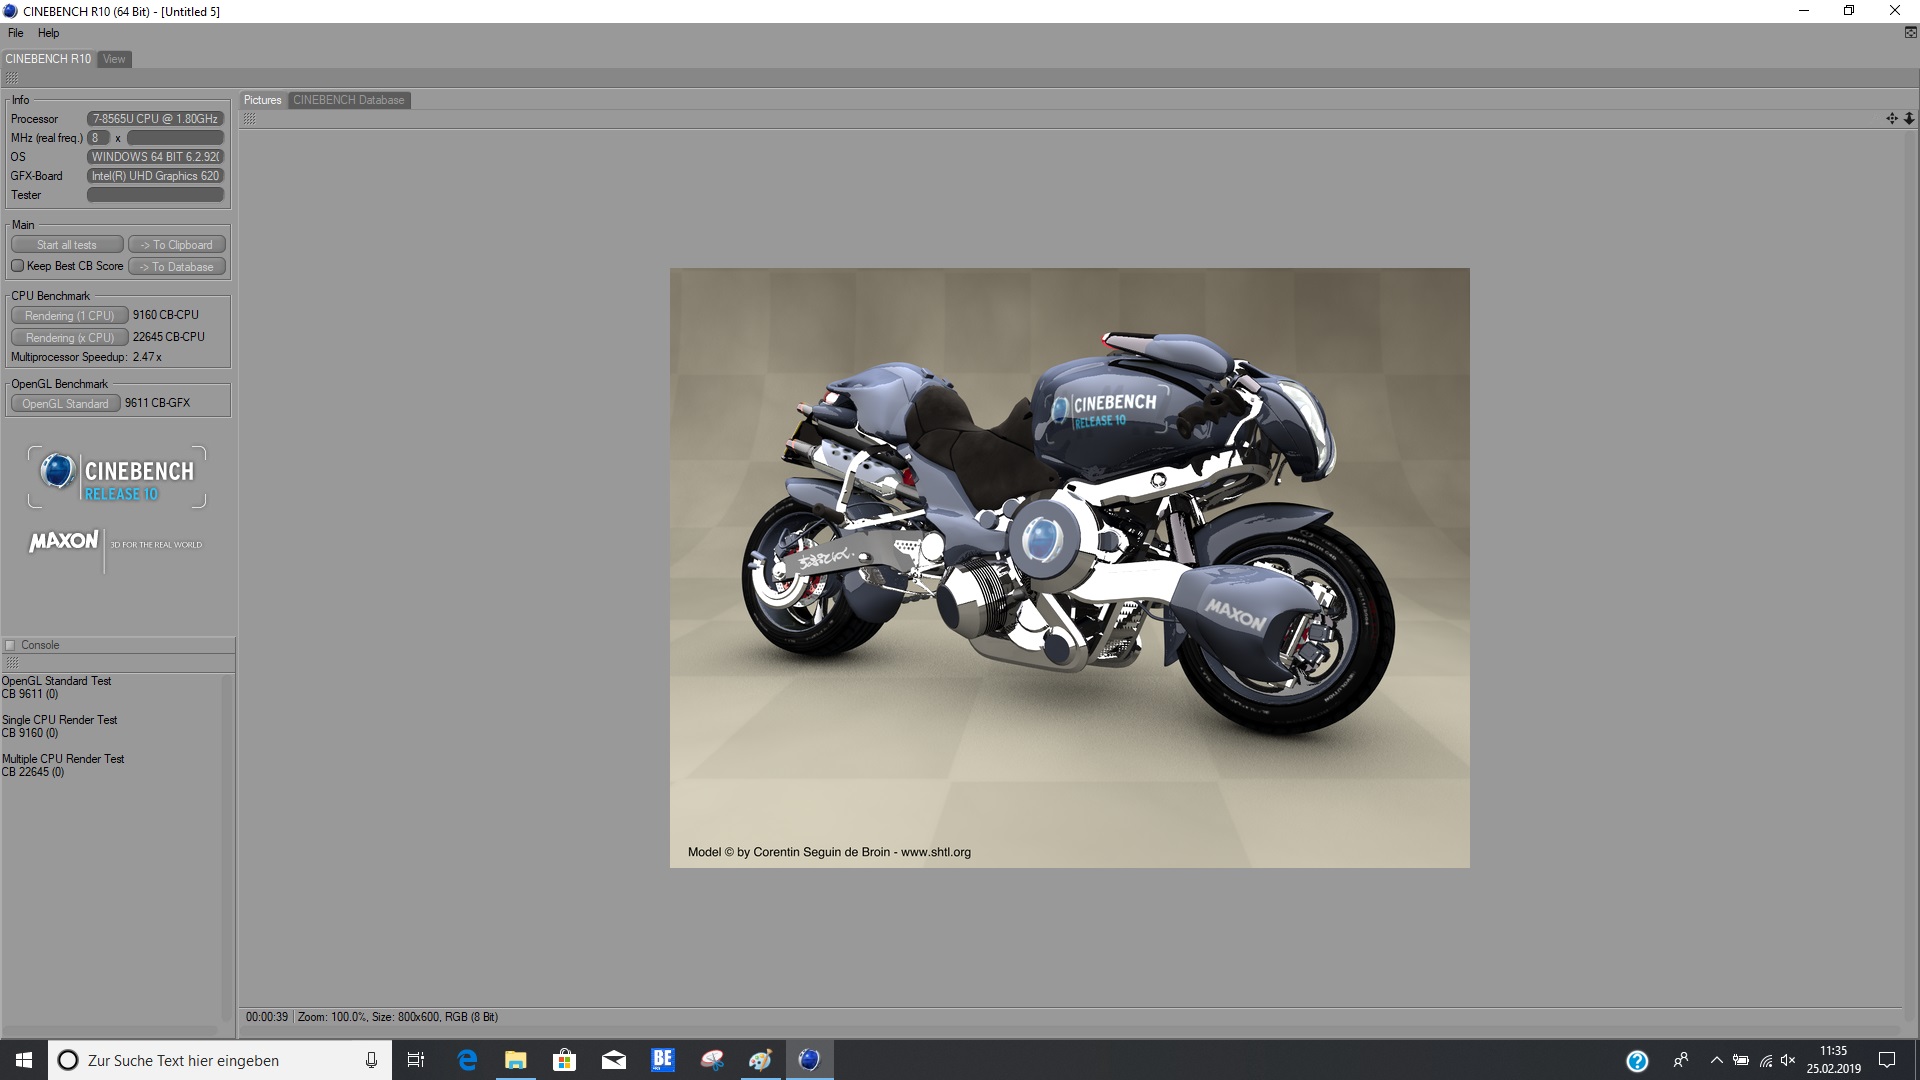
| Cinebench R10 | |
| Rendering Single CPUs 64Bit | |
| Average of class Office (11106 - 15443, n=7, last 2 years) | |
| HP ProBook 440 G6-5TK01EA | |
| Average Intel Core i7-8565U (5474 - 9435, n=6) | |
| Lenovo ThinkPad E480-20KNCTO1WW | |
| Lenovo ThinkPad A485-20MU000CGE | |
| Rendering Multiple CPUs 64Bit | |
| Average of class Office (48700 - 80160, n=7, last 2 years) | |
| Lenovo ThinkPad E480-20KNCTO1WW | |
| HP ProBook 440 G6-5TK01EA | |
| Average Intel Core i7-8565U (14542 - 26851, n=6) | |
| Lenovo ThinkPad A485-20MU000CGE | |
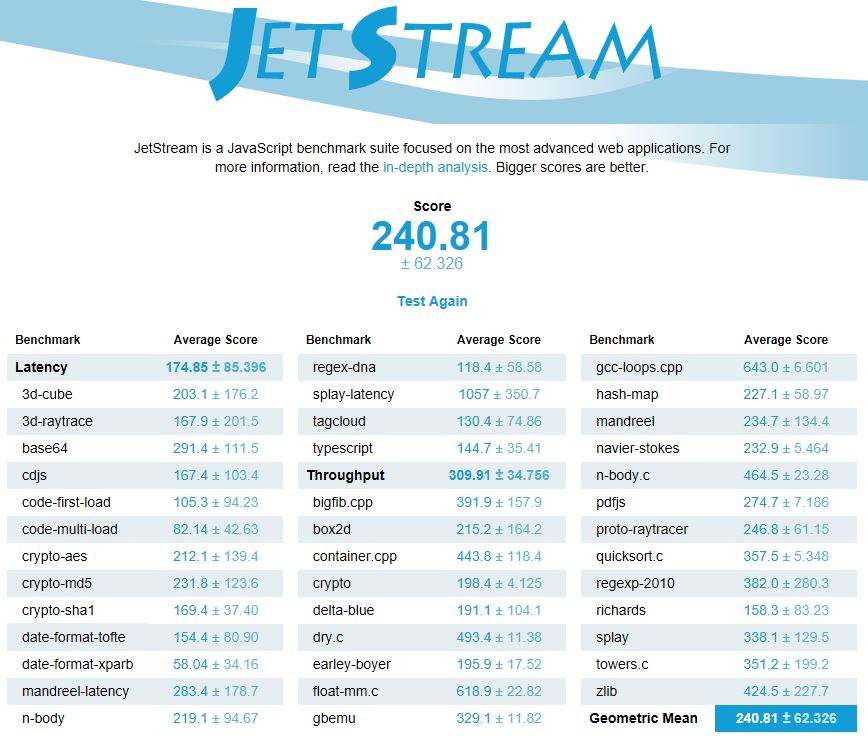
| JetStream 1.1 - 1.1 Total | |
| HP ProBook 440 G6-5TK01EA | |
| Average Intel Core i7-8565U (107.6 - 277, n=37) | |
| Acer TravelMate X3410-M-866T | |
| HP ProBook 440 G5-3KX87ES | |
| Lenovo ThinkPad E480-20KNCTO1WW | |
| Fujitsu Lifebook E548 | |
| Lenovo ThinkPad A485-20MU000CGE | |
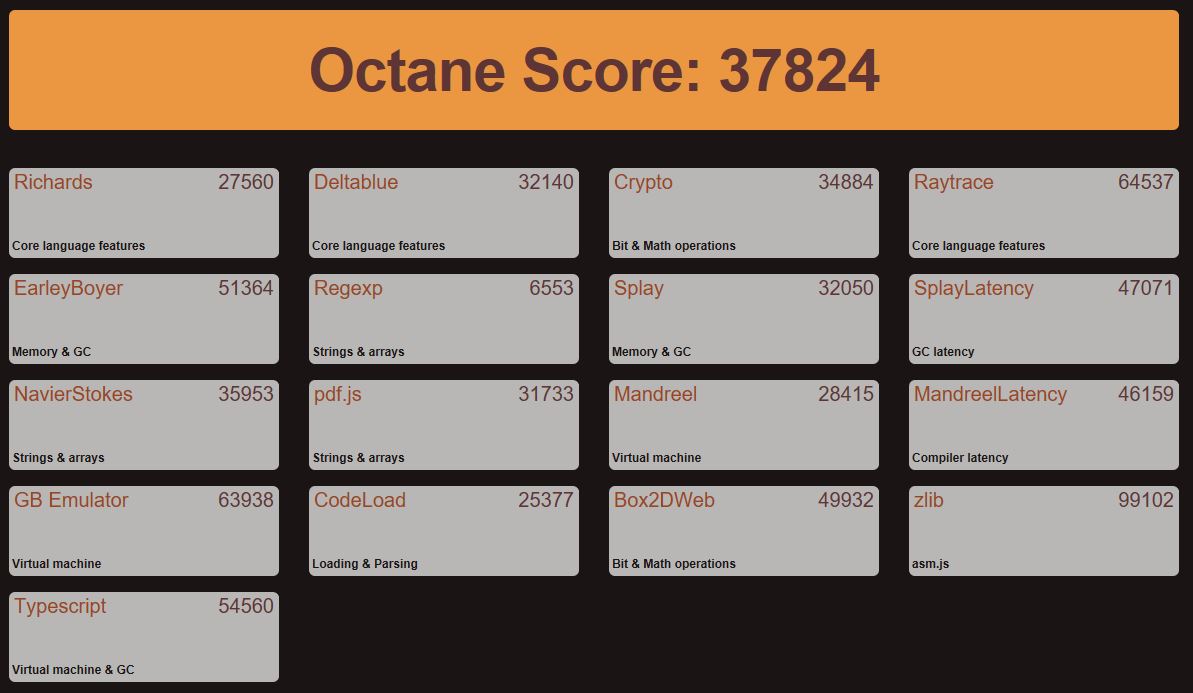
| Octane V2 - Total Score | |
| Average of class Office (49011 - 126830, n=20, last 2 years) | |
| HP ProBook 440 G6-5TK01EA | |
| Average Intel Core i7-8565U (13935 - 49795, n=42) | |
| HP ProBook 440 G5-3KX87ES | |
| Lenovo ThinkPad E480-20KNCTO1WW | |
| Acer TravelMate X3410-M-866T | |
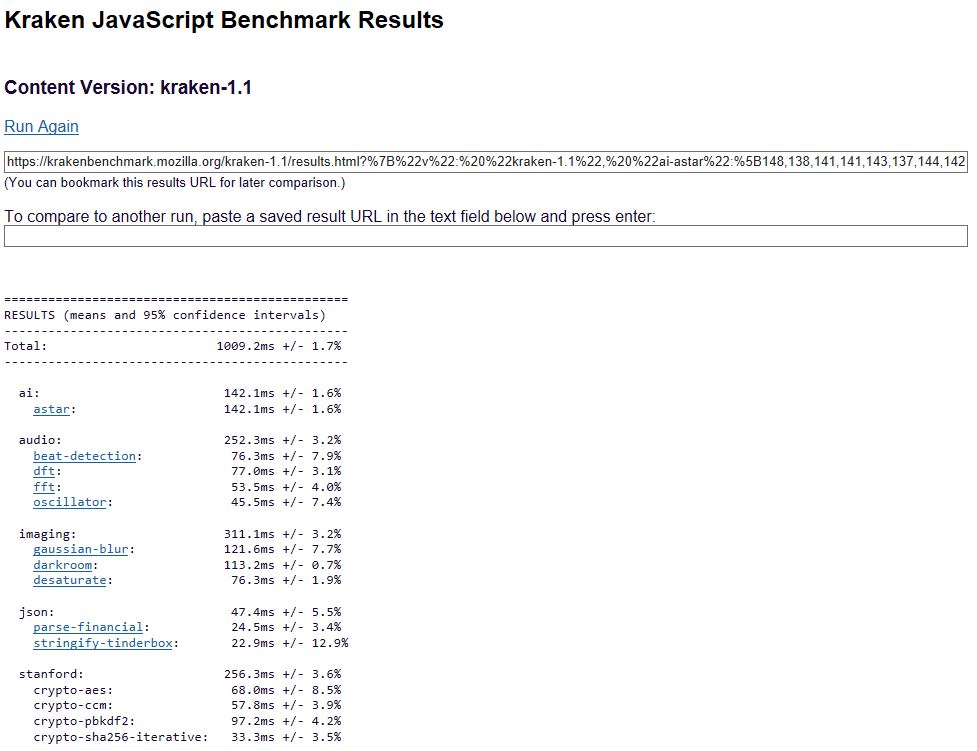
| Mozilla Kraken 1.1 - Total | |
| Lenovo ThinkPad A485-20MU000CGE | |
| Lenovo ThinkPad E480-20KNCTO1WW | |
| Acer TravelMate X3410-M-866T | |
| Average Intel Core i7-8565U (730 - 2622, n=43) | |
| HP ProBook 440 G5-3KX87ES | |
| HP ProBook 440 G6-5TK01EA | |
| Average of class Office (391 - 1297, n=78, last 2 years) | |
| Blender - v2.79 BMW27 CPU | |
| Lenovo ThinkPad A485-20MU000CGE | |
| HP ProBook 440 G6-5TK01EA | |
| Average Intel Core i7-8565U (687 - 1175, n=22) | |
| Average of class Office (158 - 1940, n=76, last 2 years) | |
* ... smaller is better
| PCMark 8 | |
| Home Score Accelerated v2 | |
| Average of class Office (n=1last 2 years) | |
| HP ProBook 440 G6-5TK01EA | |
| HP ProBook 440 G5-3KX87ES | |
| Lenovo ThinkPad E480-20KNCTO1WW | |
| Average Intel Core i7-8565U, Intel UHD Graphics 620 (2577 - 4179, n=20) | |
| Acer TravelMate X3410-M-866T | |
| Fujitsu Lifebook E548 | |
| Lenovo ThinkPad A485-20MU000CGE | |
| Work Score Accelerated v2 | |
| Average of class Office (n=1last 2 years) | |
| HP ProBook 440 G6-5TK01EA | |
| HP ProBook 440 G5-3KX87ES | |
| Acer TravelMate X3410-M-866T | |
| Lenovo ThinkPad E480-20KNCTO1WW | |
| Average Intel Core i7-8565U, Intel UHD Graphics 620 (3596 - 5189, n=19) | |
| Lenovo ThinkPad A485-20MU000CGE | |
| PCMark 8 Home Score Accelerated v2 | 4071 points | |
| PCMark 8 Creative Score Accelerated v2 | 5124 points | |
| PCMark 8 Work Score Accelerated v2 | 5160 points | |
| PCMark 10 Score | 4015 points | |
Help | ||
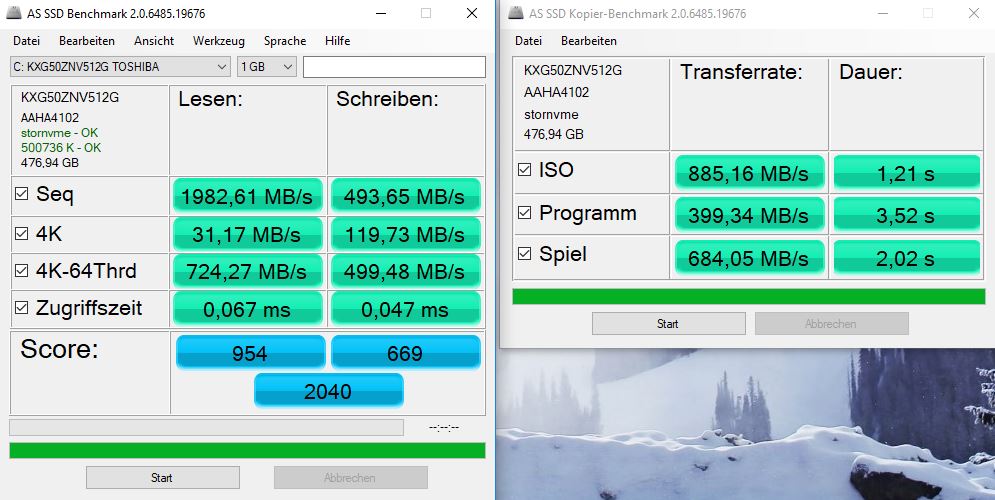
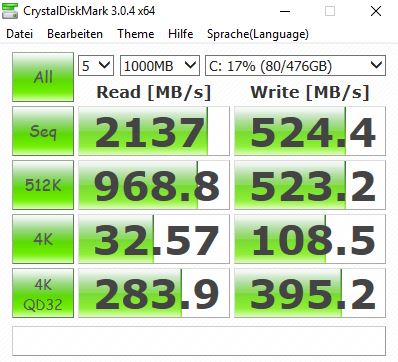
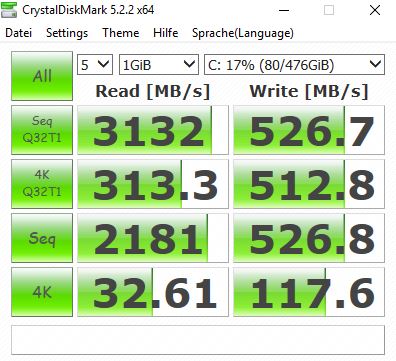
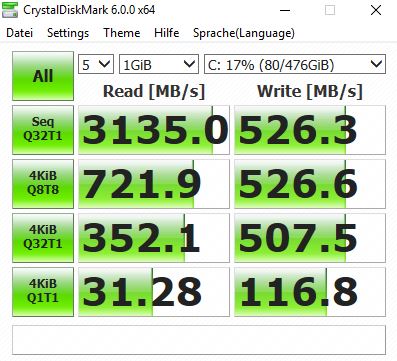
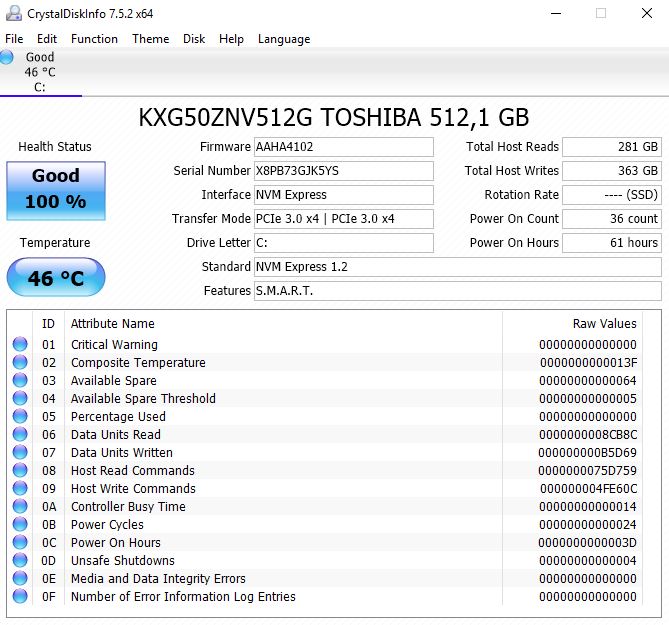
| HP ProBook 440 G6-5TK01EA Toshiba XG5 KXG50ZNV512G | HP ProBook 440 G5-3KX87ES Intel SSD 600p SSDPEKKW256G7 | Lenovo ThinkPad E480-20KNCTO1WW Toshiba KBG30ZMT128G | Lenovo ThinkPad A485-20MU000CGE Samsung SSD PM981 MZVLB256HAHQ | Acer TravelMate X3410-M-866T Micron SSD 1100 SED 512GB, M.2 (MTFDDAV512TBN) | Fujitsu Lifebook E548 Samsung SSD PM871b MZNLN256HAJQ | Huawei MateBook D 14 W50F SanDisk SD9SN8W256G1027 | Average Toshiba XG5 KXG50ZNV512G | |
|---|---|---|---|---|---|---|---|---|
| CrystalDiskMark 5.2 / 6 | -12% | -54% | 34% | -32% | -42% | -41% | 18% | |
| Write 4K (MB/s) | 117.6 | 135.3 15% | 81.4 -31% | 114.8 -2% | 113.3 -4% | 83.2 -29% | 60.5 -49% | 114 ? -3% |
| Read 4K (MB/s) | 32.61 | 34.35 5% | 33.74 3% | 41.33 27% | 28.65 -12% | 16.66 -49% | 21.63 -34% | 35.6 ? 9% |
| Write Seq (MB/s) | 527 | 601 14% | 129 -76% | 1271 141% | 428.7 -19% | 384.3 -27% | 450.9 -14% | 684 ? 30% |
| Read Seq (MB/s) | 2181 | 1175 -46% | 905 -59% | 1171 -46% | 435.2 -80% | 466.8 -79% | 482.3 -78% | 1612 ? -26% |
| Write 4K Q32T1 (MB/s) | 508 | 377.6 -26% | 107.2 -79% | 218.4 -57% | 274.6 -46% | 269.7 -47% | 248.9 -51% | 401 ? -21% |
| Read 4K Q32T1 (MB/s) | 352.1 | 288.3 -18% | 197.1 -44% | 308.5 -12% | 326.5 -7% | 260 -26% | 267.6 -24% | 427 ? 21% |
| Write Seq Q32T1 (MB/s) | 526 | 591 12% | 128.9 -75% | 1460 178% | 505 -4% | 532 1% | 534 2% | 830 ? 58% |
| Read Seq Q32T1 (MB/s) | 3135 | 1574 -50% | 906 -71% | 1529 -51% | 530 -83% | 545 -83% | 563 -82% | 2950 ? -6% |
| Write 4K Q8T8 (MB/s) | 527 | 1208 129% | 887 ? 68% | |||||
| Read 4K Q8T8 (MB/s) | 722 | 983 36% | 1060 ? 47% | |||||
| AS SSD | -28% | -88% | -10% | -36% | -48% | -65% | -14% | |
| Seq Read (MB/s) | 1983 | 1282 -35% | 1015 -49% | 1224 -38% | 464.9 -77% | 448.4 -77% | 458.3 -77% | 2137 ? 8% |
| Seq Write (MB/s) | 493.6 | 430 -13% | 115.4 -77% | 1118 126% | 465.2 -6% | 246.1 -50% | 268.6 -46% | 744 ? 51% |
| 4K Read (MB/s) | 31.17 | 31.9 2% | 31.13 0% | 42.46 36% | 22.96 -26% | 14.13 -55% | 26.87 -14% | 30.1 ? -3% |
| 4K Write (MB/s) | 119.7 | 106.5 -11% | 78.9 -34% | 77.4 -35% | 89.1 -26% | 72.1 -40% | 51.7 -57% | 93.6 ? -22% |
| 4K-64 Read (MB/s) | 724 | 277.5 -62% | 190.9 -74% | 559 -23% | 350.5 -52% | 375.2 -48% | 364.2 -50% | 784 ? 8% |
| 4K-64 Write (MB/s) | 499.5 | 485 -3% | 92.1 -82% | 378.1 -24% | 313.3 -37% | 288.8 -42% | 137.3 -73% | 515 ? 3% |
| Access Time Read * (ms) | 0.067 | 0.119 -78% | 0.106 -58% | 0.081 -21% | 0.123 -84% | 0.092 -37% | 0.09253 ? -38% | |
| Access Time Write * (ms) | 0.047 | 0.032 32% | 0.235 -400% | 0.049 -4% | 0.047 -0% | 0.041 13% | 0.13 -177% | 0.1653 ? -252% |
| Score Read (Points) | 954 | 438 -54% | 324 -66% | 724 -24% | 420 -56% | 434 -55% | 437 -54% | 1028 ? 8% |
| Score Write (Points) | 669 | 634 -5% | 182 -73% | 567 -15% | 449 -33% | 385 -42% | 216 -68% | 683 ? 2% |
| Score Total (Points) | 2040 | 1264 -38% | 638 -69% | 1669 -18% | 1090 -47% | 1034 -49% | 875 -57% | 2170 ? 6% |
| Copy ISO MB/s (MB/s) | 885 | 522 -41% | 108.2 -88% | 812 -8% | 1109 ? 25% | |||
| Copy Program MB/s (MB/s) | 399.3 | 229.6 -42% | 78 -80% | 209.4 -48% | 380 ? -5% | |||
| Copy Game MB/s (MB/s) | 684 | 395.8 -42% | 105.5 -85% | 356.1 -48% | 738 ? 8% | |||
| Total Average (Program / Settings) | -20% /
-22% | -71% /
-76% | 12% /
8% | -34% /
-34% | -45% /
-46% | -53% /
-55% | 2% /
-1% |
* ... smaller is better

| 3DMark 11 - 1280x720 Performance GPU | |
| Average of class Office (2551 - 18313, n=73, last 2 years) | |
| Lenovo ThinkPad A485-20MU000CGE | |
| HP ProBook 440 G6-5TK01EA | |
| Huawei MateBook D 14 W50F | |
| Average Intel UHD Graphics 620 (1144 - 3432, n=244) | |
| HP ProBook 440 G5-3KX87ES | |
| Acer TravelMate X3410-M-866T | |
| Fujitsu Lifebook E548 | |
| Lenovo ThinkPad E480-20KNCTO1WW | |
| 3DMark | |
| 1280x720 Cloud Gate Standard Graphics | |
| Average of class Office (11640 - 118515, n=39, last 2 years) | |
| Lenovo ThinkPad A485-20MU000CGE | |
| Huawei MateBook D 14 W50F | |
| HP ProBook 440 G6-5TK01EA | |
| Average Intel UHD Graphics 620 (6205 - 16400, n=225) | |
| Acer TravelMate X3410-M-866T | |
| HP ProBook 440 G5-3KX87ES | |
| Lenovo ThinkPad E480-20KNCTO1WW | |
| 1920x1080 Fire Strike Graphics | |
| Average of class Office (736 - 21871, n=76, last 2 years) | |
| Lenovo ThinkPad A485-20MU000CGE | |
| Huawei MateBook D 14 W50F | |
| HP ProBook 440 G6-5TK01EA | |
| Average Intel UHD Graphics 620 (557 - 2608, n=213) | |
| Acer TravelMate X3410-M-866T | |
| HP ProBook 440 G5-3KX87ES | |
| Lenovo ThinkPad E480-20KNCTO1WW | |
| 2560x1440 Time Spy Graphics | |
| Average of class Office (493 - 6679, n=71, last 2 years) | |
| Average Intel UHD Graphics 620 (299 - 797, n=88) | |
| Lenovo ThinkPad E480-20KNCTO1WW | |
| 3DMark 11 Performance | 1997 points | |
| 3DMark Ice Storm Standard Score | 45682 points | |
| 3DMark Cloud Gate Standard Score | 8458 points | |
| 3DMark Fire Strike Score | 1090 points | |
| 3DMark Fire Strike Extreme Score | 506 points | |
Help | ||
| low | med. | high | ultra | |
|---|---|---|---|---|
| BioShock Infinite (2013) | 59.8 | 34.3 | 27.4 | 8.2 |
| Dota 2 Reborn (2015) | 70 | 42.5 | 19.7 | 17.5 |
| Rise of the Tomb Raider (2016) | 20.6 | 13.4 | 6.9 | |
| Rocket League (2017) | 25.5 | 16.9 | ||
| X-Plane 11.11 (2018) | 30.3 | 22.7 | 19.1 |
Noise level
| Idle |
| 29.4 / 29.4 / 30.2 dB(A) |
| Load |
| 31.8 / 33.1 dB(A) |
 | ||
30 dB silent 40 dB(A) audible 50 dB(A) loud |
||
min: | ||
| HP ProBook 440 G6-5TK01EA UHD Graphics 620, i7-8565U, Toshiba XG5 KXG50ZNV512G | HP ProBook 440 G5-3KX87ES UHD Graphics 620, i5-8250U, Intel SSD 600p SSDPEKKW256G7 | Lenovo ThinkPad E480-20KNCTO1WW UHD Graphics 620, i5-8250U, Toshiba KBG30ZMT128G | Lenovo ThinkPad A485-20MU000CGE Vega 8, R5 PRO 2500U, Samsung SSD PM981 MZVLB256HAHQ | Acer TravelMate X3410-M-866T UHD Graphics 620, i5-8550U, Micron SSD 1100 SED 512GB, M.2 (MTFDDAV512TBN) | Fujitsu Lifebook E548 UHD Graphics 620, i5-8250U, Samsung SSD PM871b MZNLN256HAJQ | Huawei MateBook D 14 W50F UHD Graphics 620, i5-8250U, SanDisk SD9SN8W256G1027 | |
|---|---|---|---|---|---|---|---|
| Noise | -3% | 0% | 1% | 1% | -3% | -3% | |
| off / environment * (dB) | 29.4 | 29.1 1% | 29.1 1% | 29.3 -0% | 28.2 4% | 30 -2% | 30.5 -4% |
| Idle Minimum * (dB) | 29.4 | 29.1 1% | 29.1 1% | 29.3 -0% | 28.2 4% | 30 -2% | 30.5 -4% |
| Idle Average * (dB) | 29.4 | 29.1 1% | 29.1 1% | 29.3 -0% | 28.2 4% | 30 -2% | 30.5 -4% |
| Idle Maximum * (dB) | 30.2 | 30.7 -2% | 30.3 -0% | 29.6 2% | 28.2 7% | 30 1% | 30.5 -1% |
| Load Average * (dB) | 31.8 | 34.5 -8% | 31.8 -0% | 31.6 1% | 33.2 -4% | 35.3 -11% | 33.6 -6% |
| Load Maximum * (dB) | 33.1 | 36 -9% | 33.8 -2% | 31.6 5% | 35.6 -8% | 33.9 -2% | 32.6 2% |
* ... smaller is better
(+) The maximum temperature on the upper side is 38.3 °C / 101 F, compared to the average of 34.3 °C / 94 F, ranging from 21.2 to 62.5 °C for the class Office.
(-) The bottom heats up to a maximum of 50.5 °C / 123 F, compared to the average of 36.8 °C / 98 F
(+) In idle usage, the average temperature for the upper side is 24.1 °C / 75 F, compared to the device average of 29.5 °C / 85 F.
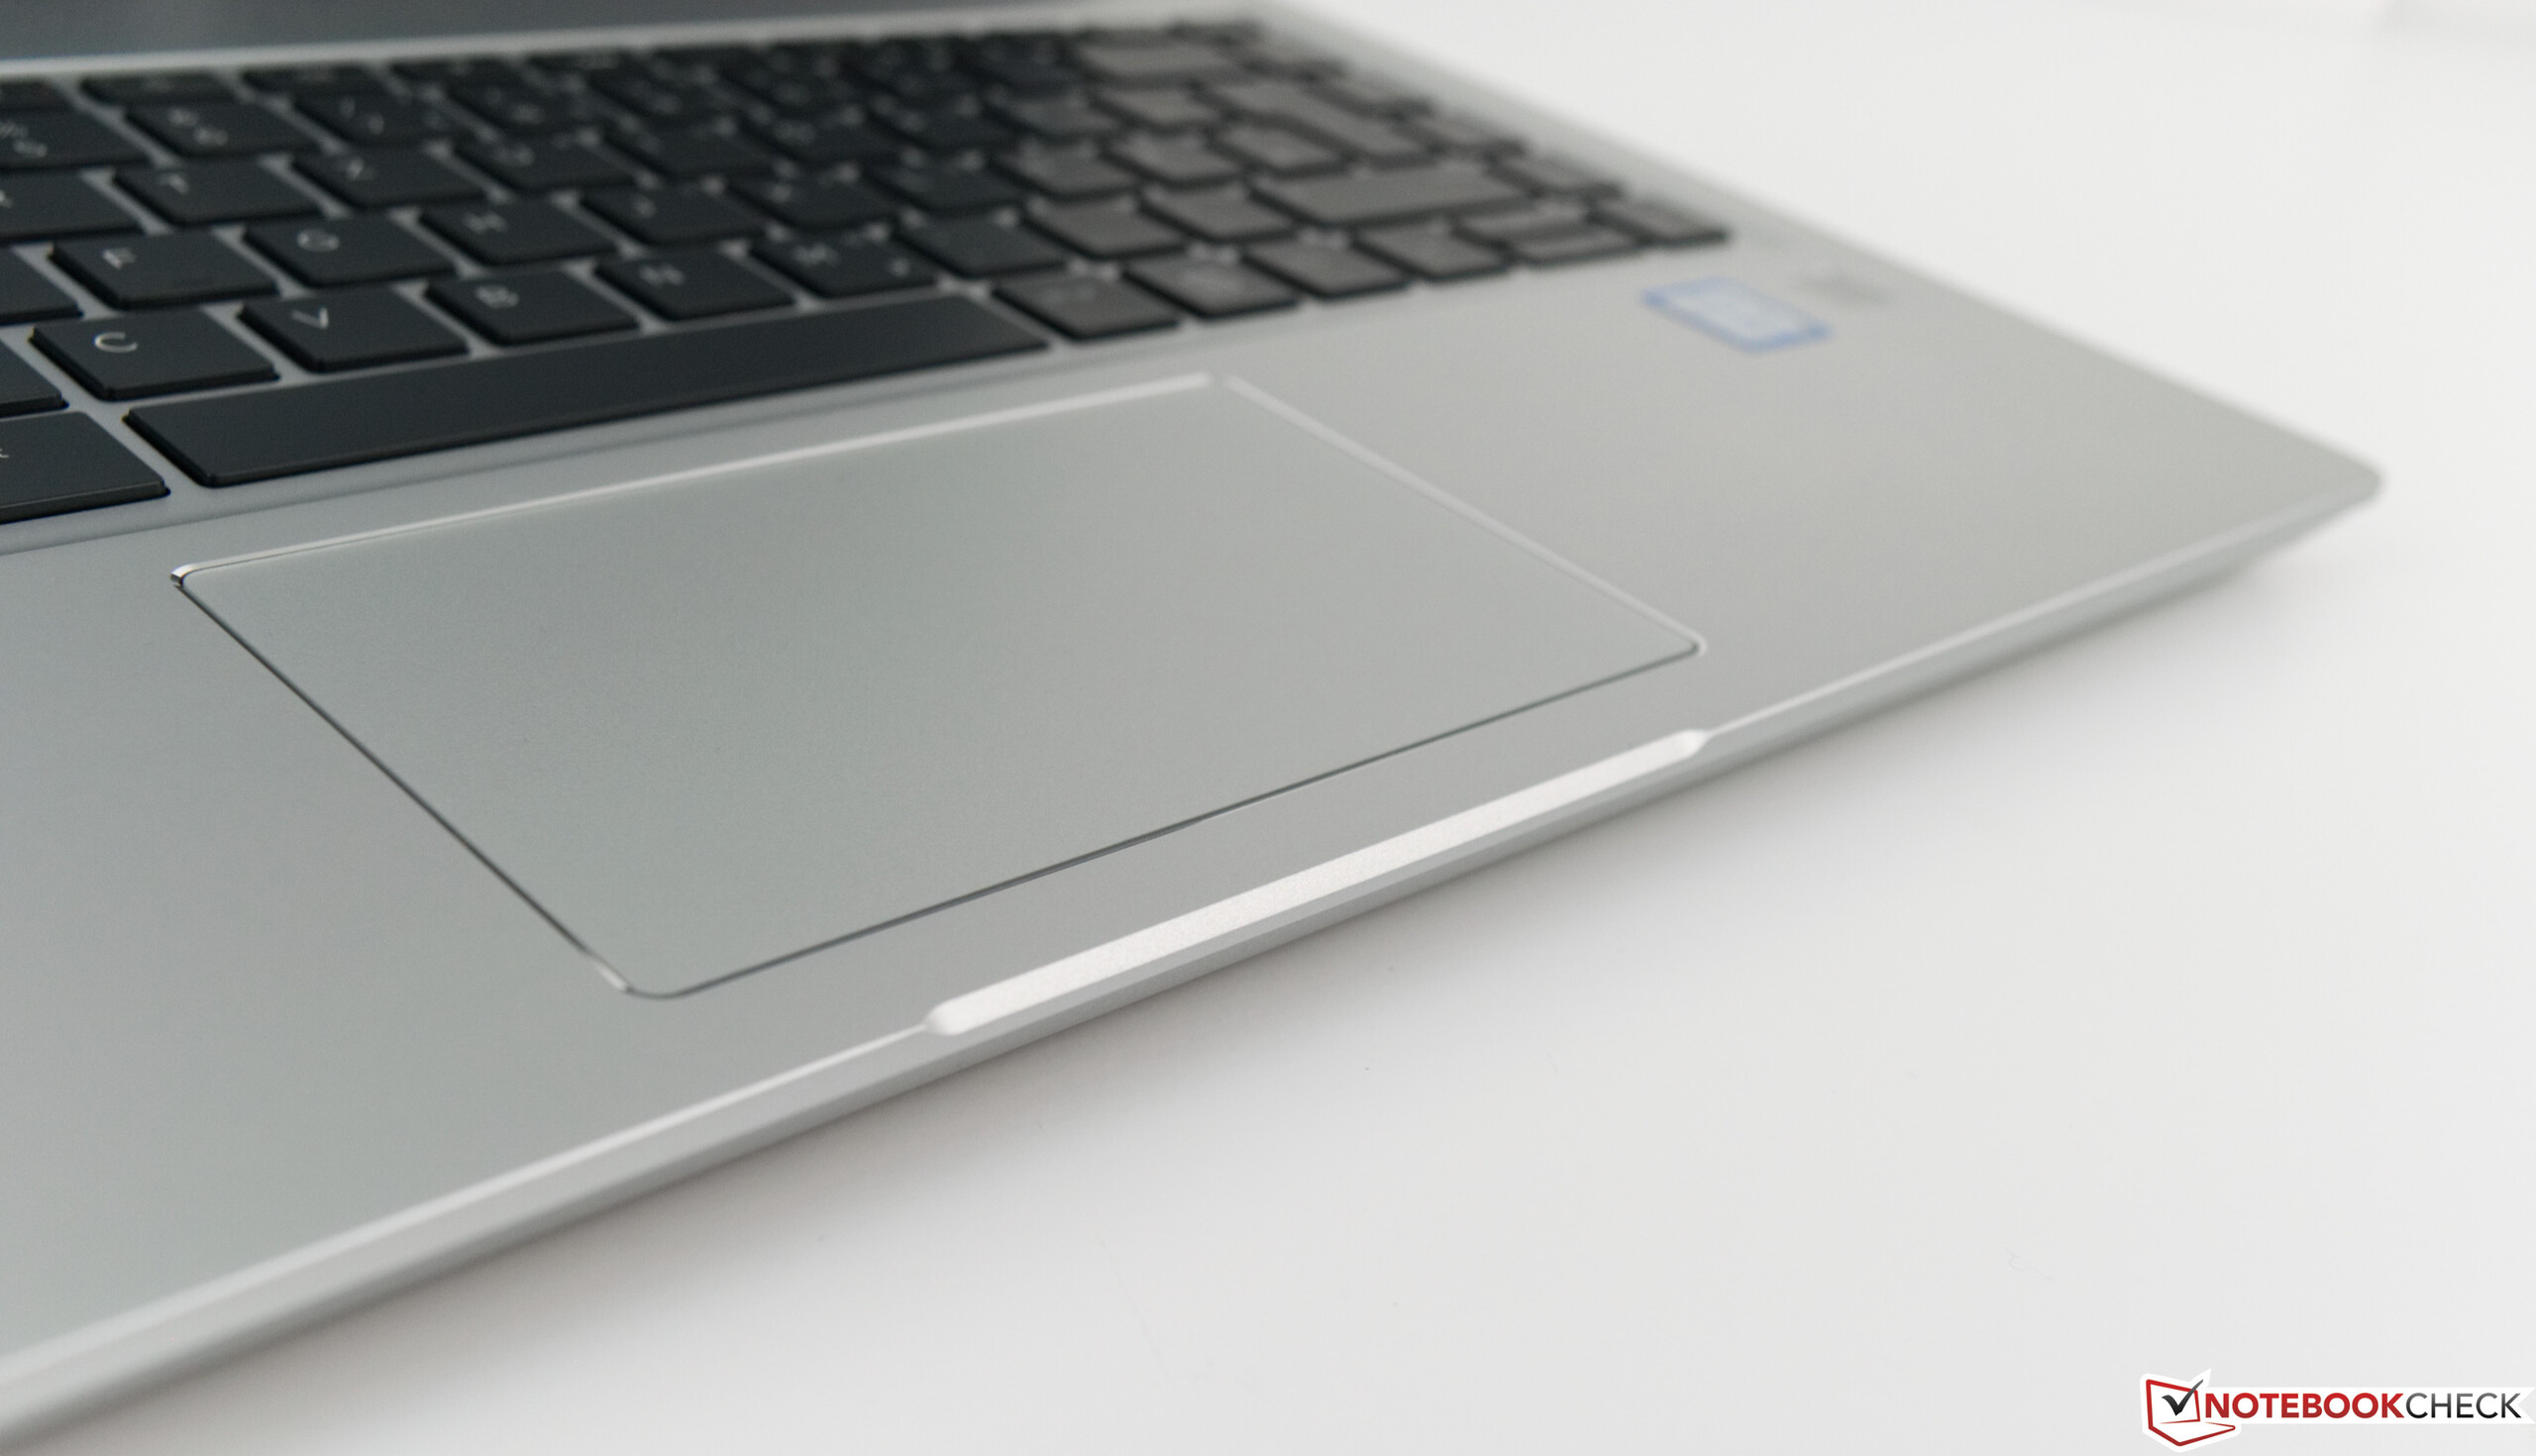
(+) The palmrests and touchpad are cooler than skin temperature with a maximum of 30.3 °C / 86.5 F and are therefore cool to the touch.
(-) The average temperature of the palmrest area of similar devices was 27.6 °C / 81.7 F (-2.7 °C / -4.8 F).
| HP ProBook 440 G6-5TK01EA UHD Graphics 620, i7-8565U, Toshiba XG5 KXG50ZNV512G | HP ProBook 440 G5-3KX87ES UHD Graphics 620, i5-8250U, Intel SSD 600p SSDPEKKW256G7 | Lenovo ThinkPad E480-20KNCTO1WW UHD Graphics 620, i5-8250U, Toshiba KBG30ZMT128G | Lenovo ThinkPad A485-20MU000CGE Vega 8, R5 PRO 2500U, Samsung SSD PM981 MZVLB256HAHQ | Acer TravelMate X3410-M-866T UHD Graphics 620, i5-8550U, Micron SSD 1100 SED 512GB, M.2 (MTFDDAV512TBN) | Fujitsu Lifebook E548 UHD Graphics 620, i5-8250U, Samsung SSD PM871b MZNLN256HAJQ | Huawei MateBook D 14 W50F UHD Graphics 620, i5-8250U, SanDisk SD9SN8W256G1027 | |
|---|---|---|---|---|---|---|---|
| Heat | 2% | 9% | -9% | 2% | -6% | -4% | |
| Maximum Upper Side * (°C) | 38.3 | 39 -2% | 36.7 4% | 39.1 -2% | 35.2 8% | 40.3 -5% | 41.6 -9% |
| Maximum Bottom * (°C) | 50.5 | 45.5 10% | 42.8 15% | 49.9 1% | 39.4 22% | 42.6 16% | 44.2 12% |
| Idle Upper Side * (°C) | 24.6 | 24.8 -1% | 23.4 5% | 28 -14% | 27.6 -12% | 28 -14% | 27.4 -11% |
| Idle Bottom * (°C) | 25.4 | 25 2% | 22.8 10% | 30.5 -20% | 27.8 -9% | 31 -22% | 27.6 -9% |
* ... smaller is better
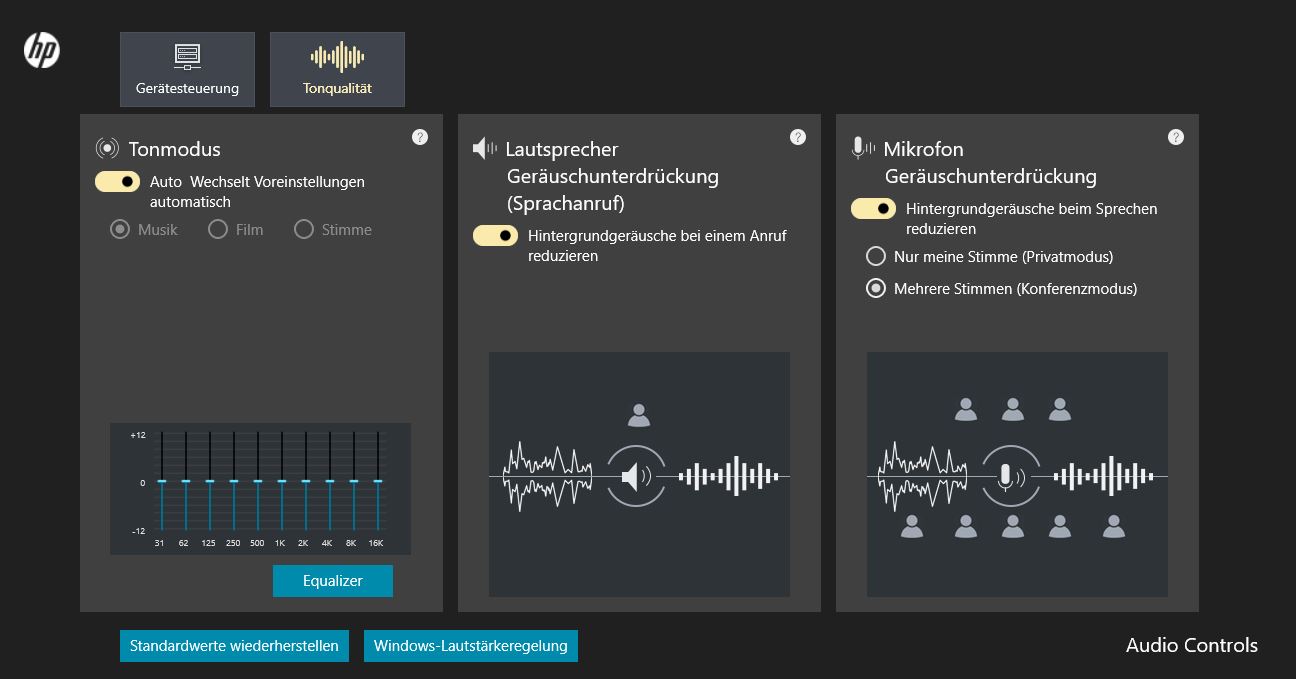
HP ProBook 440 G6-5TK01EA audio analysis
(±) | speaker loudness is average but good (78.1 dB)
Bass 100 - 315 Hz
(-) | nearly no bass - on average 17.2% lower than median
(±) | linearity of bass is average (12.1% delta to prev. frequency)
Mids 400 - 2000 Hz
(+) | balanced mids - only 3.3% away from median
(+) | mids are linear (6.7% delta to prev. frequency)
Highs 2 - 16 kHz
(±) | higher highs - on average 5.7% higher than median
(±) | linearity of highs is average (7.1% delta to prev. frequency)
Overall 100 - 16.000 Hz
(±) | linearity of overall sound is average (20.8% difference to median)
Compared to same class
» 49% of all tested devices in this class were better, 9% similar, 42% worse
» The best had a delta of 7%, average was 21%, worst was 53%
Compared to all devices tested
» 56% of all tested devices were better, 8% similar, 36% worse
» The best had a delta of 4%, average was 23%, worst was 134%
Lenovo ThinkPad A485-20MU000CGE audio analysis
(±) | speaker loudness is average but good (74.1 dB)
Bass 100 - 315 Hz
(-) | nearly no bass - on average 24.7% lower than median
(±) | linearity of bass is average (11.9% delta to prev. frequency)
Mids 400 - 2000 Hz
(+) | balanced mids - only 2.9% away from median
(±) | linearity of mids is average (7.5% delta to prev. frequency)
Highs 2 - 16 kHz
(+) | balanced highs - only 2.2% away from median
(+) | highs are linear (6.8% delta to prev. frequency)
Overall 100 - 16.000 Hz
(±) | linearity of overall sound is average (23.8% difference to median)
Compared to same class
» 68% of all tested devices in this class were better, 8% similar, 23% worse
» The best had a delta of 7%, average was 21%, worst was 53%
Compared to all devices tested
» 71% of all tested devices were better, 6% similar, 22% worse
» The best had a delta of 4%, average was 23%, worst was 134%
| Off / Standby | |
| Idle | |
| Load |
|
Key:
min: | |
| HP ProBook 440 G6-5TK01EA i7-8565U, UHD Graphics 620, Toshiba XG5 KXG50ZNV512G, IPS, 1920x1080, 14" | HP ProBook 440 G5-3KX87ES i5-8250U, UHD Graphics 620, Intel SSD 600p SSDPEKKW256G7, IPS LED, 1920x1080, 14" | Lenovo ThinkPad E480-20KNCTO1WW i5-8250U, UHD Graphics 620, Toshiba KBG30ZMT128G, IPS LED, 1920x1080, 14" | Lenovo ThinkPad A485-20MU000CGE R5 PRO 2500U, Vega 8, Samsung SSD PM981 MZVLB256HAHQ, IPS LED, 1920x1080, 14" | Acer TravelMate X3410-M-866T i5-8550U, UHD Graphics 620, Micron SSD 1100 SED 512GB, M.2 (MTFDDAV512TBN), IPS, 1920x1080, 14" | Fujitsu Lifebook E548 i5-8250U, UHD Graphics 620, Samsung SSD PM871b MZNLN256HAJQ, IPS, 1920x1080, 14" | Huawei MateBook D 14 W50F i5-8250U, UHD Graphics 620, SanDisk SD9SN8W256G1027, IPS, 1920x1080, 14" | Average Intel UHD Graphics 620 | Average of class Office | |
|---|---|---|---|---|---|---|---|---|---|
| Power Consumption | -25% | 5% | -42% | -19% | 16% | -5% | -16% | -32% | |
| Idle Minimum * (Watt) | 2.98 | 4.4 -48% | 3.5 -17% | 5.3 -78% | 4.5 -51% | 3.1 -4% | 3.7 -24% | 3.81 ? -28% | 4.25 ? -43% |
| Idle Average * (Watt) | 5.4 | 7.1 -31% | 5.3 2% | 8.3 -54% | 6.3 -17% | 5 7% | 6.9 -28% | 6.94 ? -29% | 7.3 ? -35% |
| Idle Maximum * (Watt) | 7.9 | 10.2 -29% | 6.1 23% | 11.4 -44% | 7 11% | 6.1 23% | 8.4 -6% | 8.75 ? -11% | 8.57 ? -8% |
| Load Average * (Watt) | 34.5 | 36.5 -6% | 30 13% | 42 -22% | 28.7 17% | 27 22% | 32 7% | 35 ? -1% | 43.8 ? -27% |
| Load Maximum * (Watt) | 43.3 | 48.7 -12% | 42.3 2% | 48.8 -13% | 67.7 -56% | 29.7 31% | 32.6 25% | 47.5 ? -10% | 64.5 ? -49% |
* ... smaller is better

| HP ProBook 440 G6-5TK01EA i7-8565U, UHD Graphics 620, 45 Wh | HP ProBook 440 G5-3KX87ES i5-8250U, UHD Graphics 620, 48 Wh | Lenovo ThinkPad E480-20KNCTO1WW i5-8250U, UHD Graphics 620, 45 Wh | Lenovo ThinkPad A485-20MU000CGE R5 PRO 2500U, Vega 8, 48 Wh | Acer TravelMate X3410-M-866T i5-8550U, UHD Graphics 620, 57 Wh | Fujitsu Lifebook E548 i5-8250U, UHD Graphics 620, 50 Wh | Huawei MateBook D 14 W50F i5-8250U, UHD Graphics 620, 57 Wh | Average of class Office | |
|---|---|---|---|---|---|---|---|---|
| Battery runtime | -16% | -7% | -37% | 11% | 1% | 26% | 41% | |
| Reader / Idle (h) | 17.1 | 13.7 -20% | 18.4 8% | 11.2 -35% | 20.8 22% | 23.6 38% | 22.2 ? 30% | |
| H.264 (h) | 7.6 | 3.7 -51% | 7.2 -5% | 6.1 -20% | 12.1 59% | 15.4 ? 103% | ||
| WiFi v1.3 (h) | 8.4 | 6.9 -18% | 8.3 -1% | 5.5 -35% | 10.3 23% | 8.5 1% | 10 19% | 13.2 ? 57% |
| Load (h) | 2.5 | 3.1 24% | 1.8 -28% | 1.1 -56% | 2.2 -12% | 2.2 -12% | 1.808 ? -28% |
Pros
Cons
Verdict - a modern HP ProBook
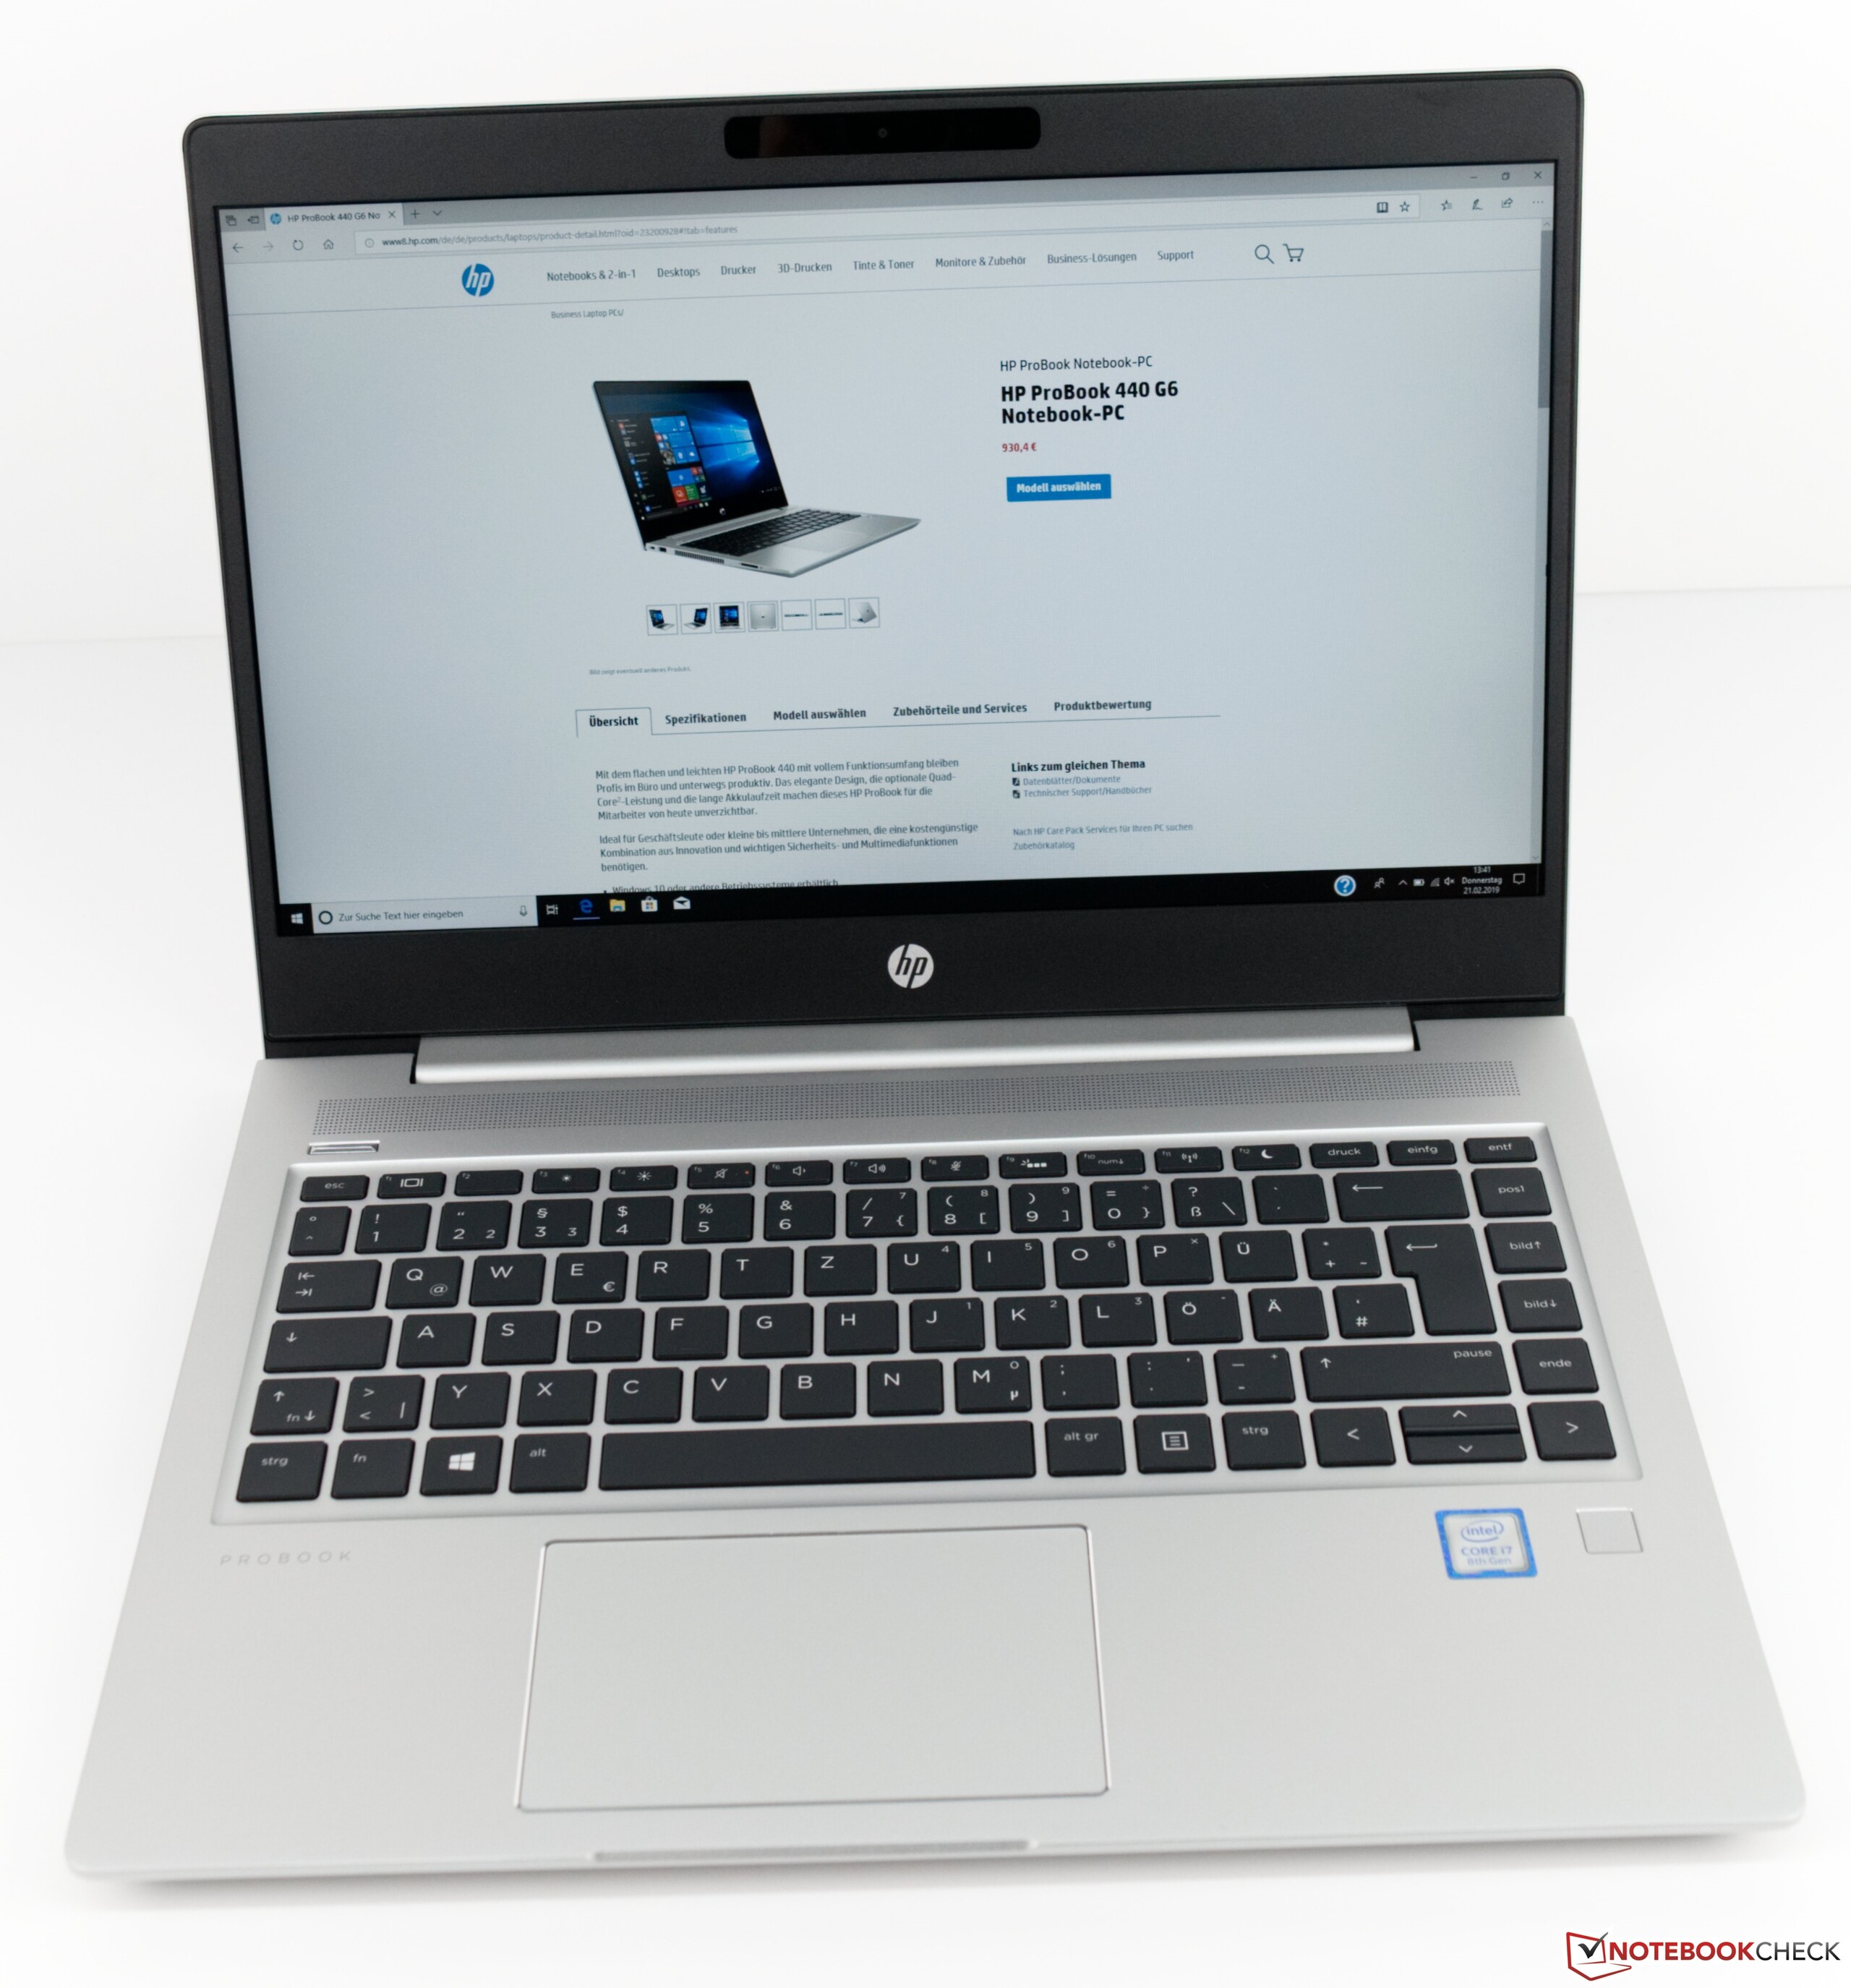
HP ProBook 440 G6是一款主要面向中小型企业客户的设备。但该设备也适用于普通终端用户,因为该设备非常适合日常办公和网页浏览。
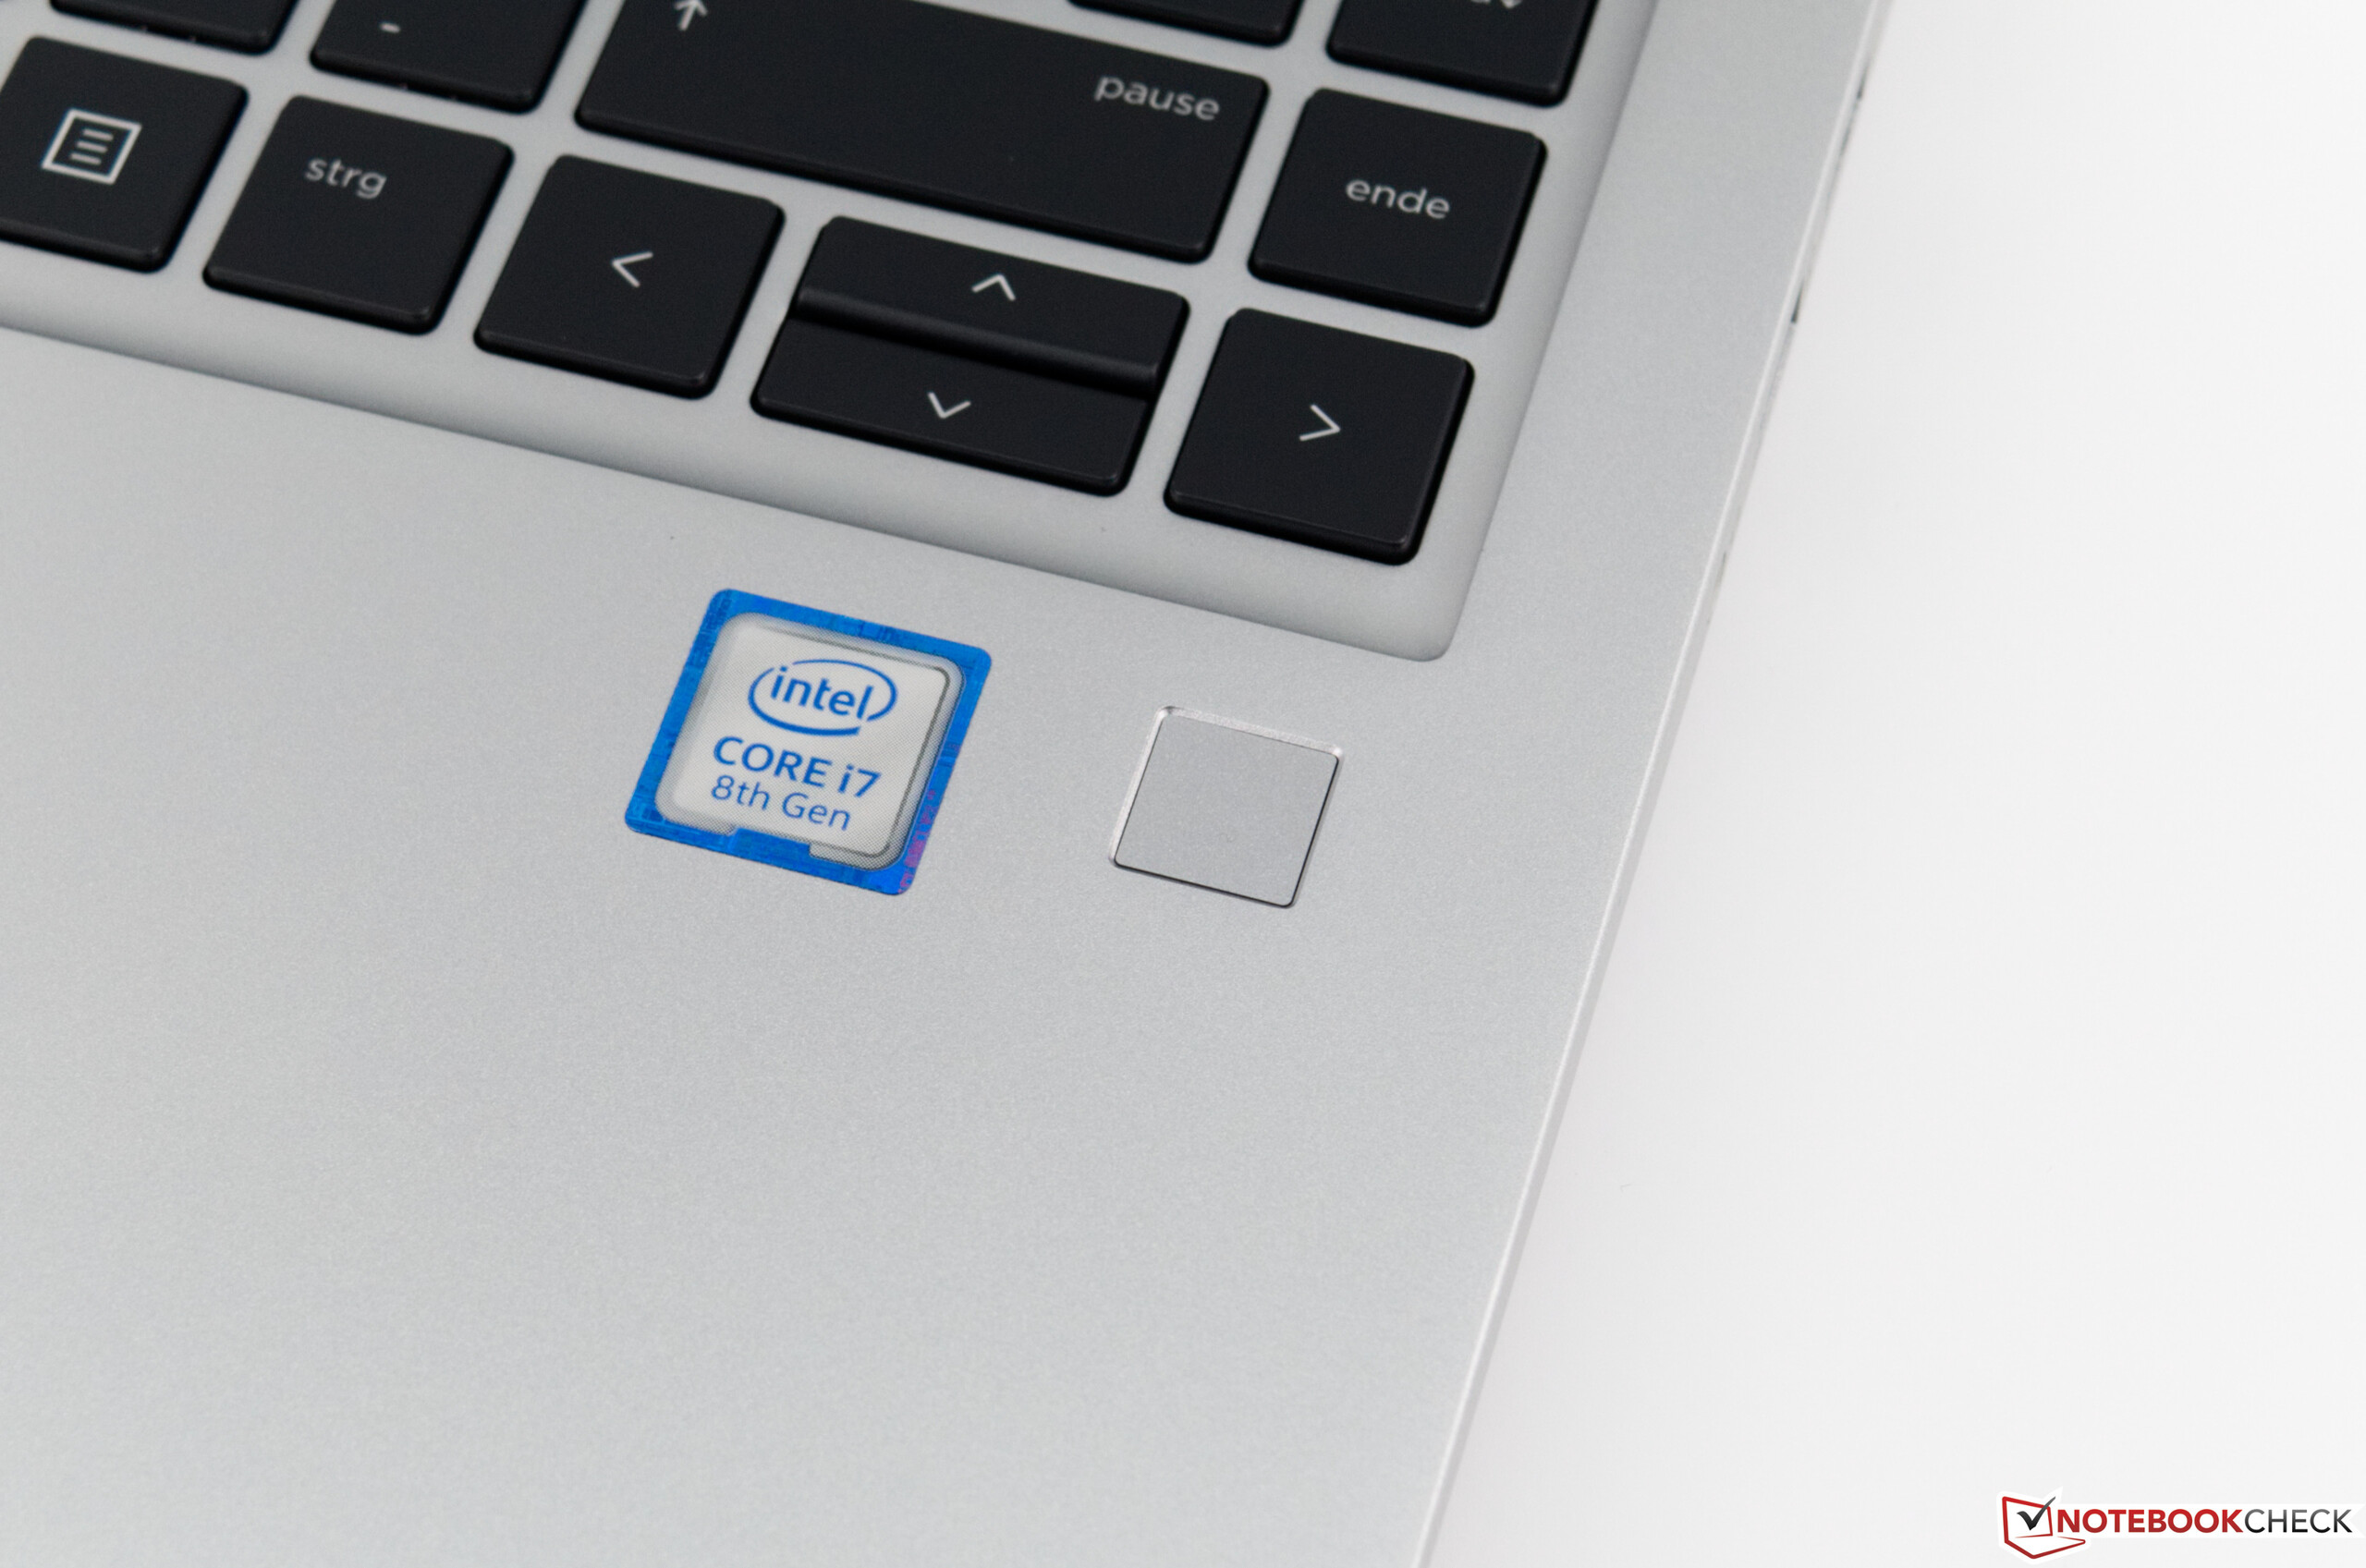
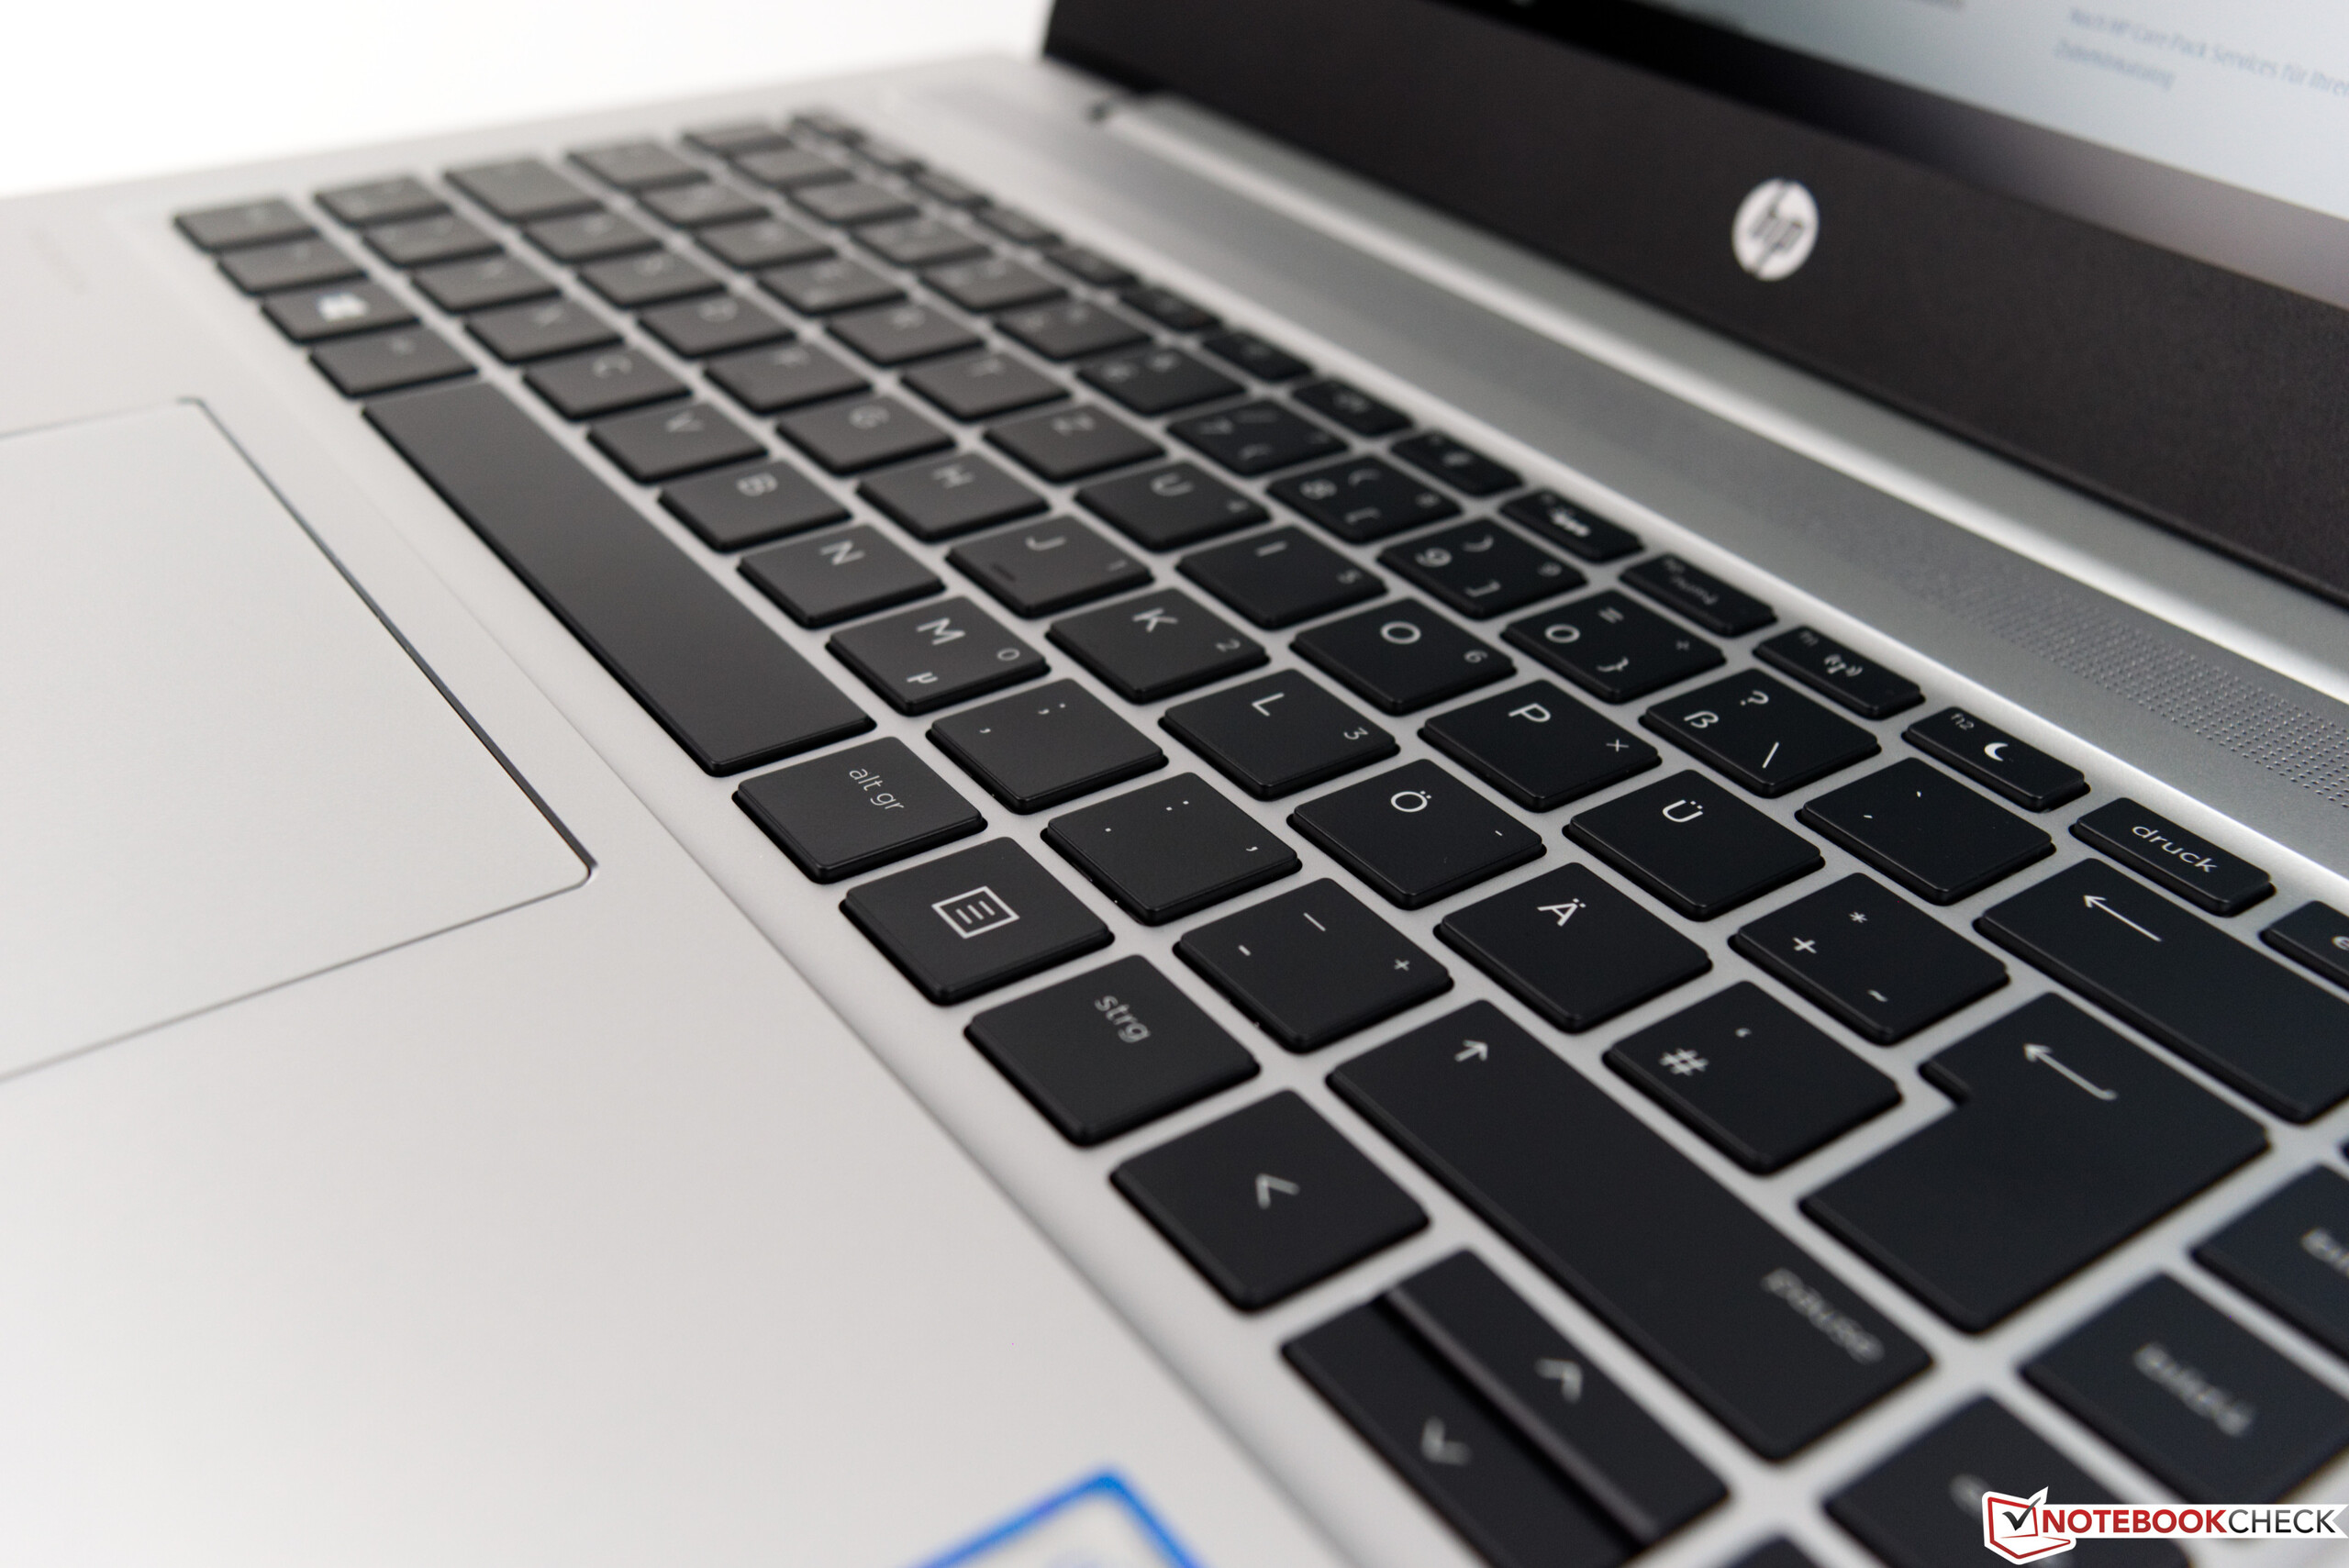
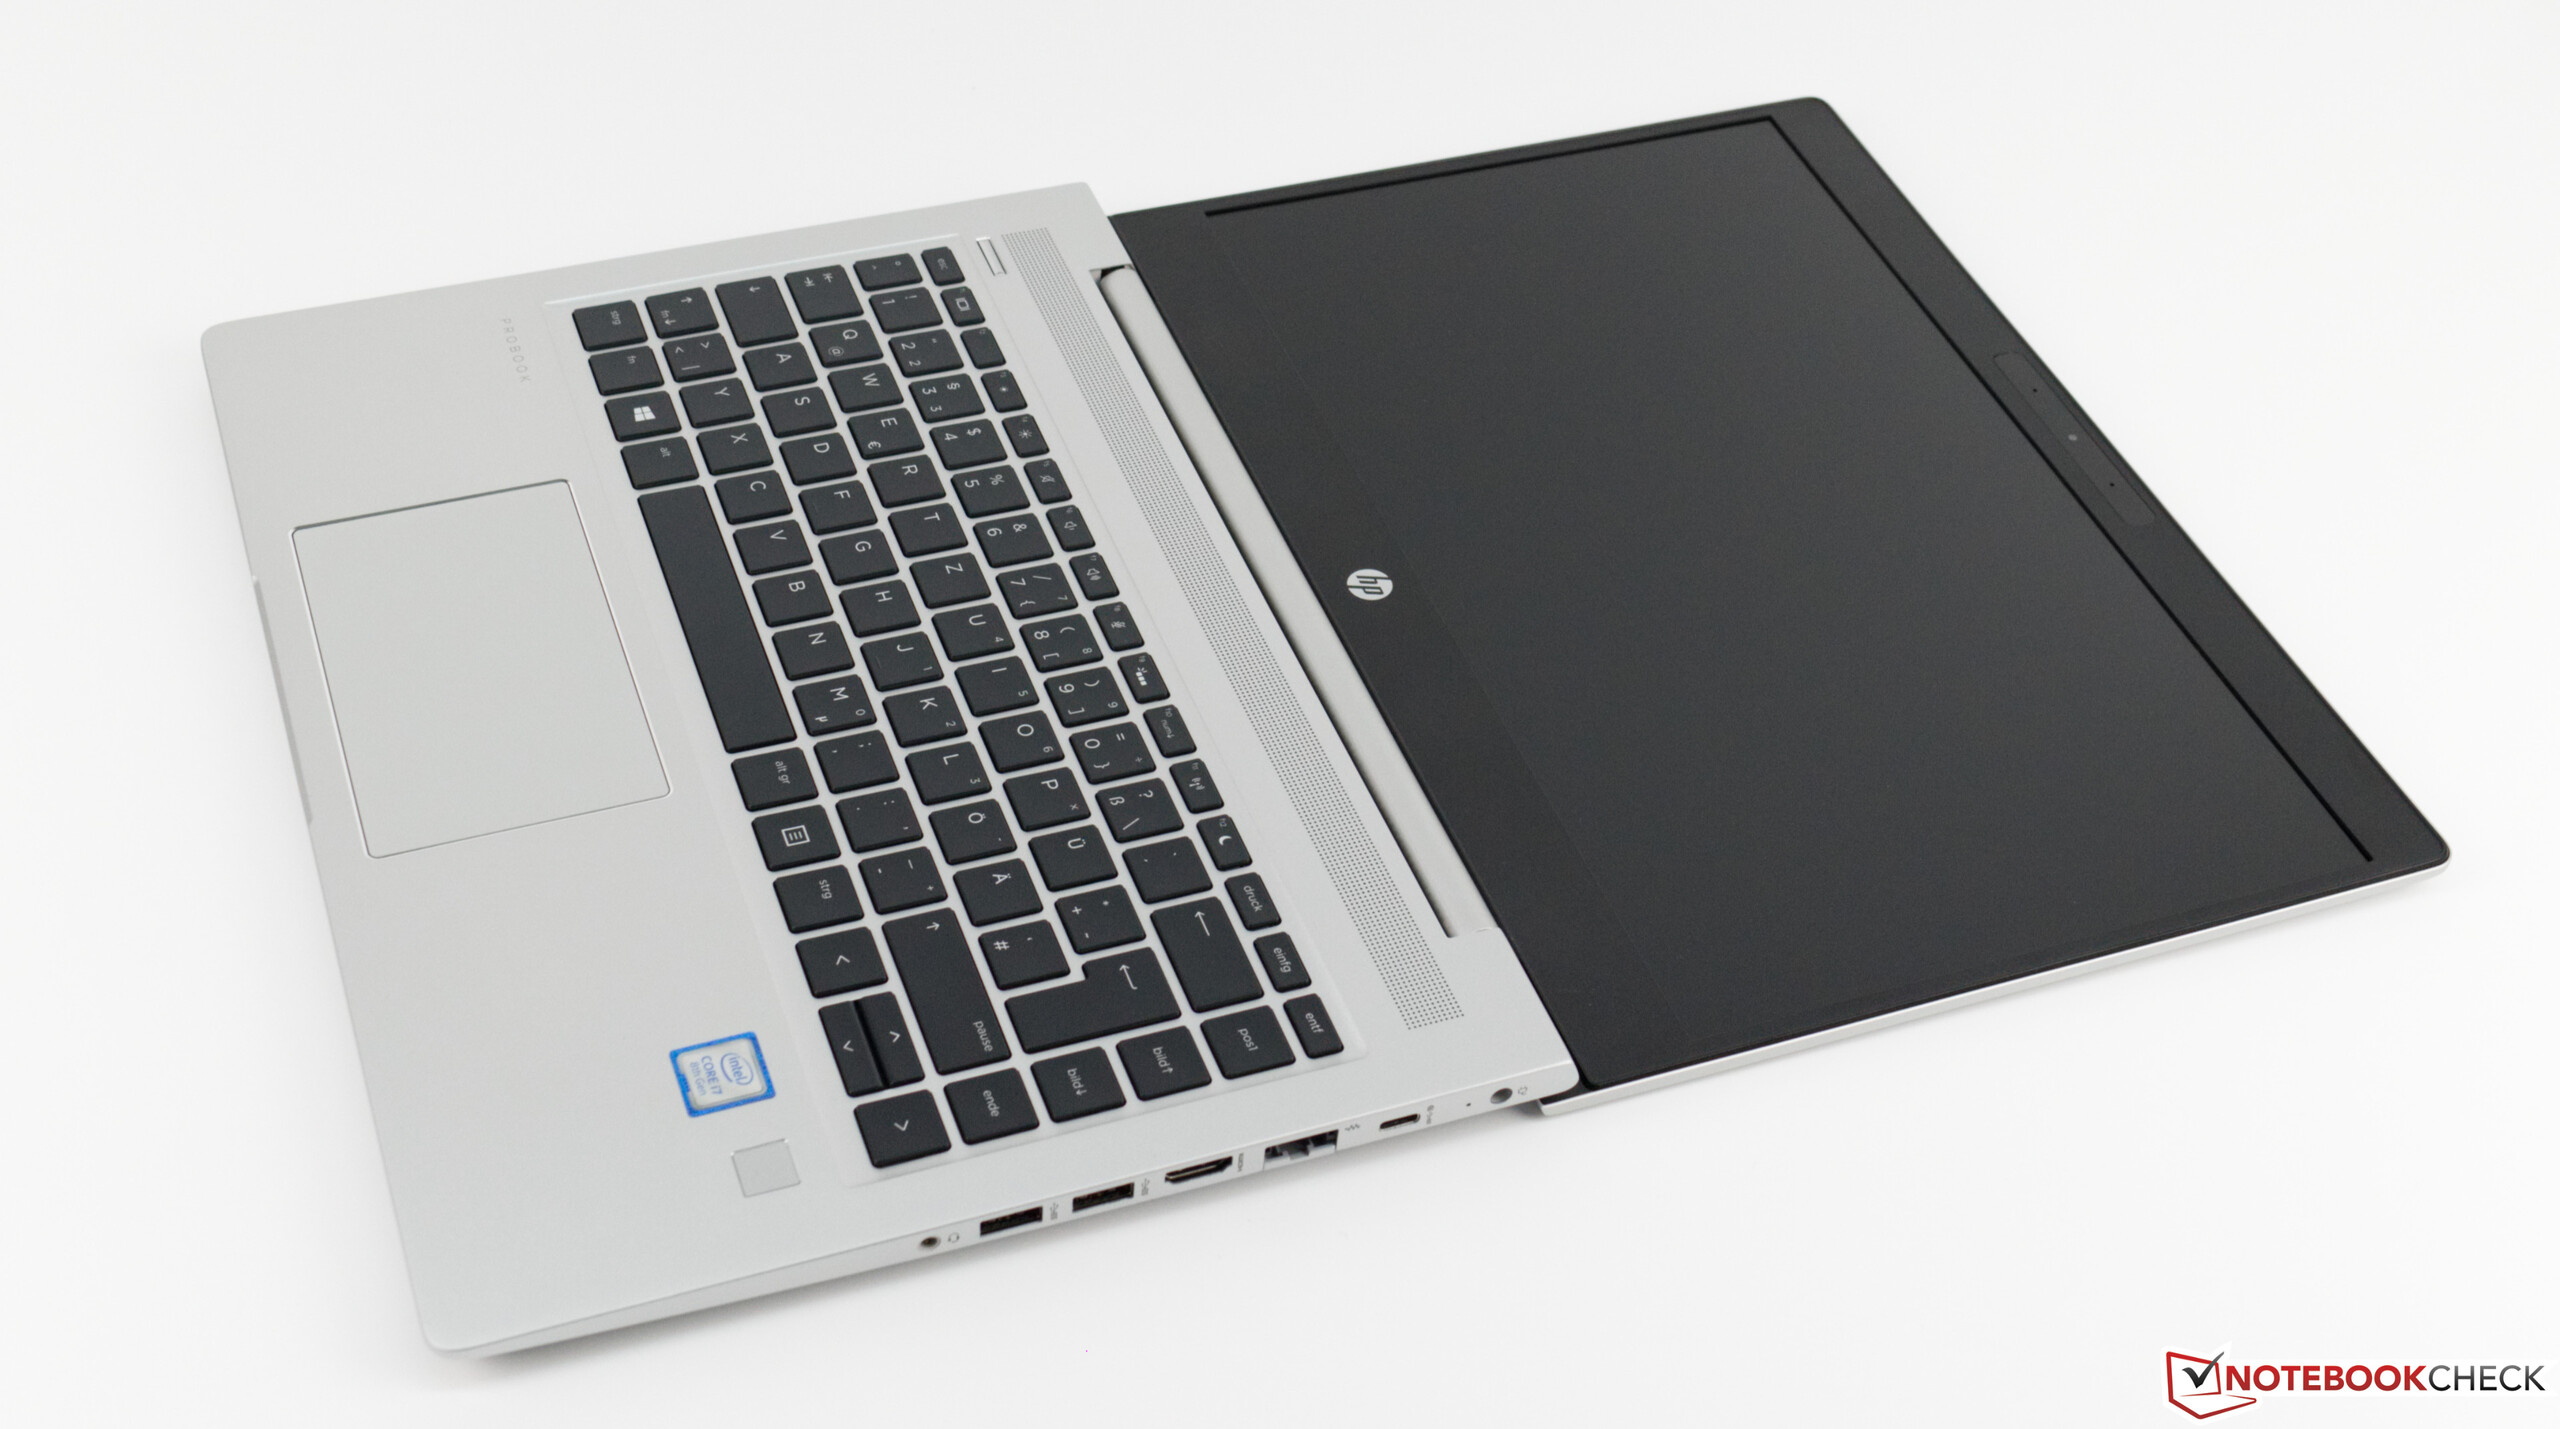
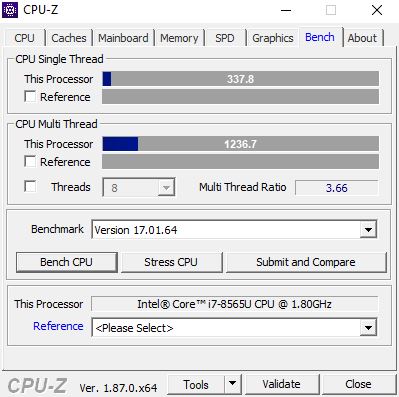
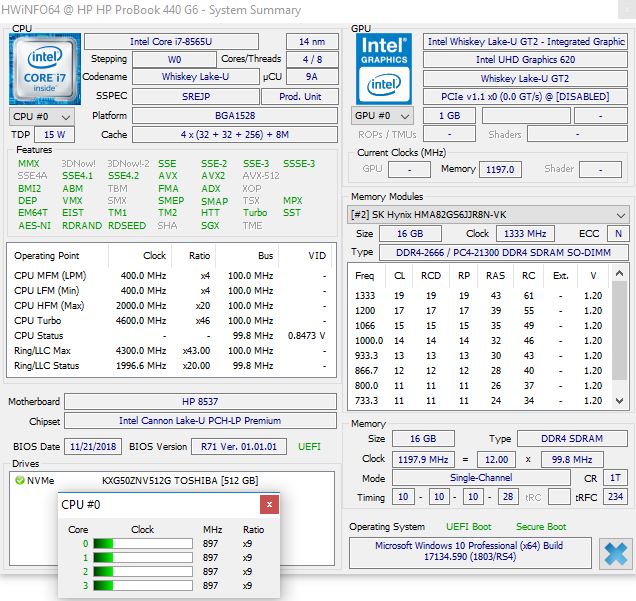
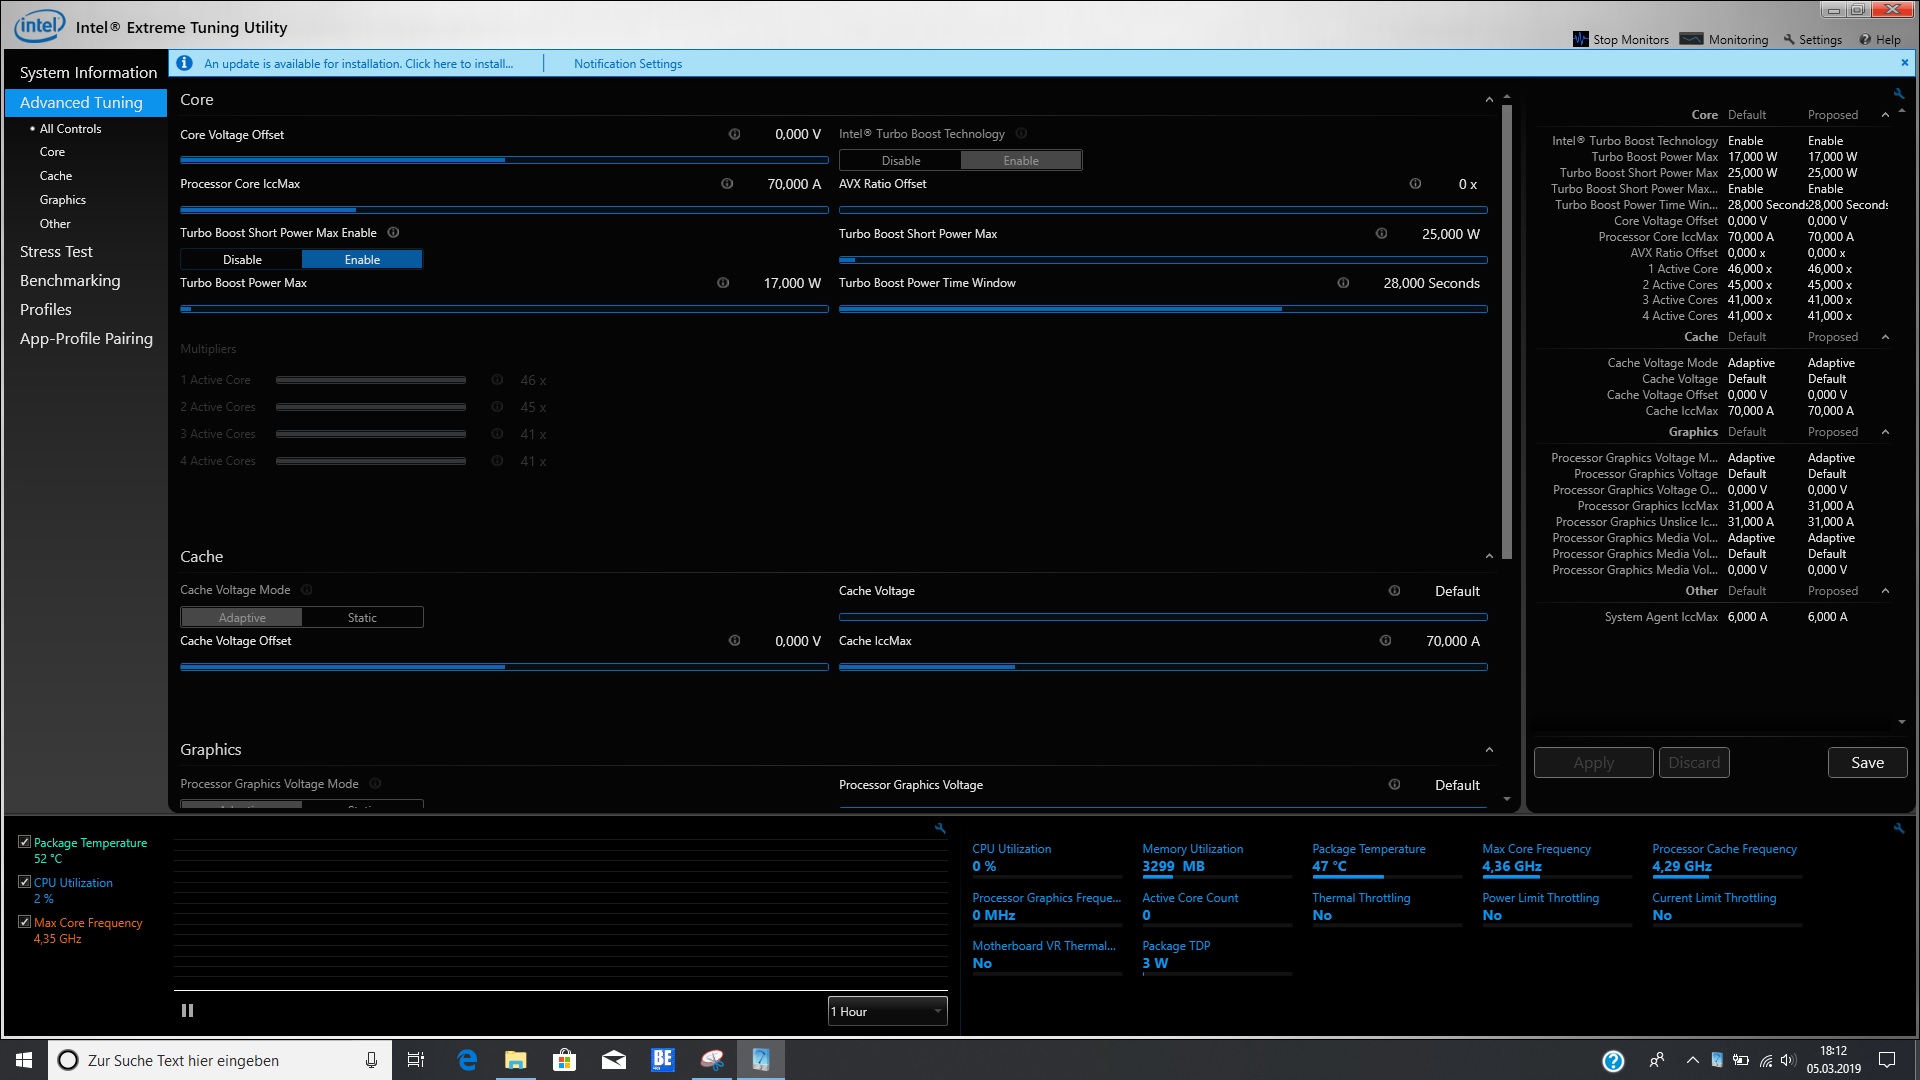
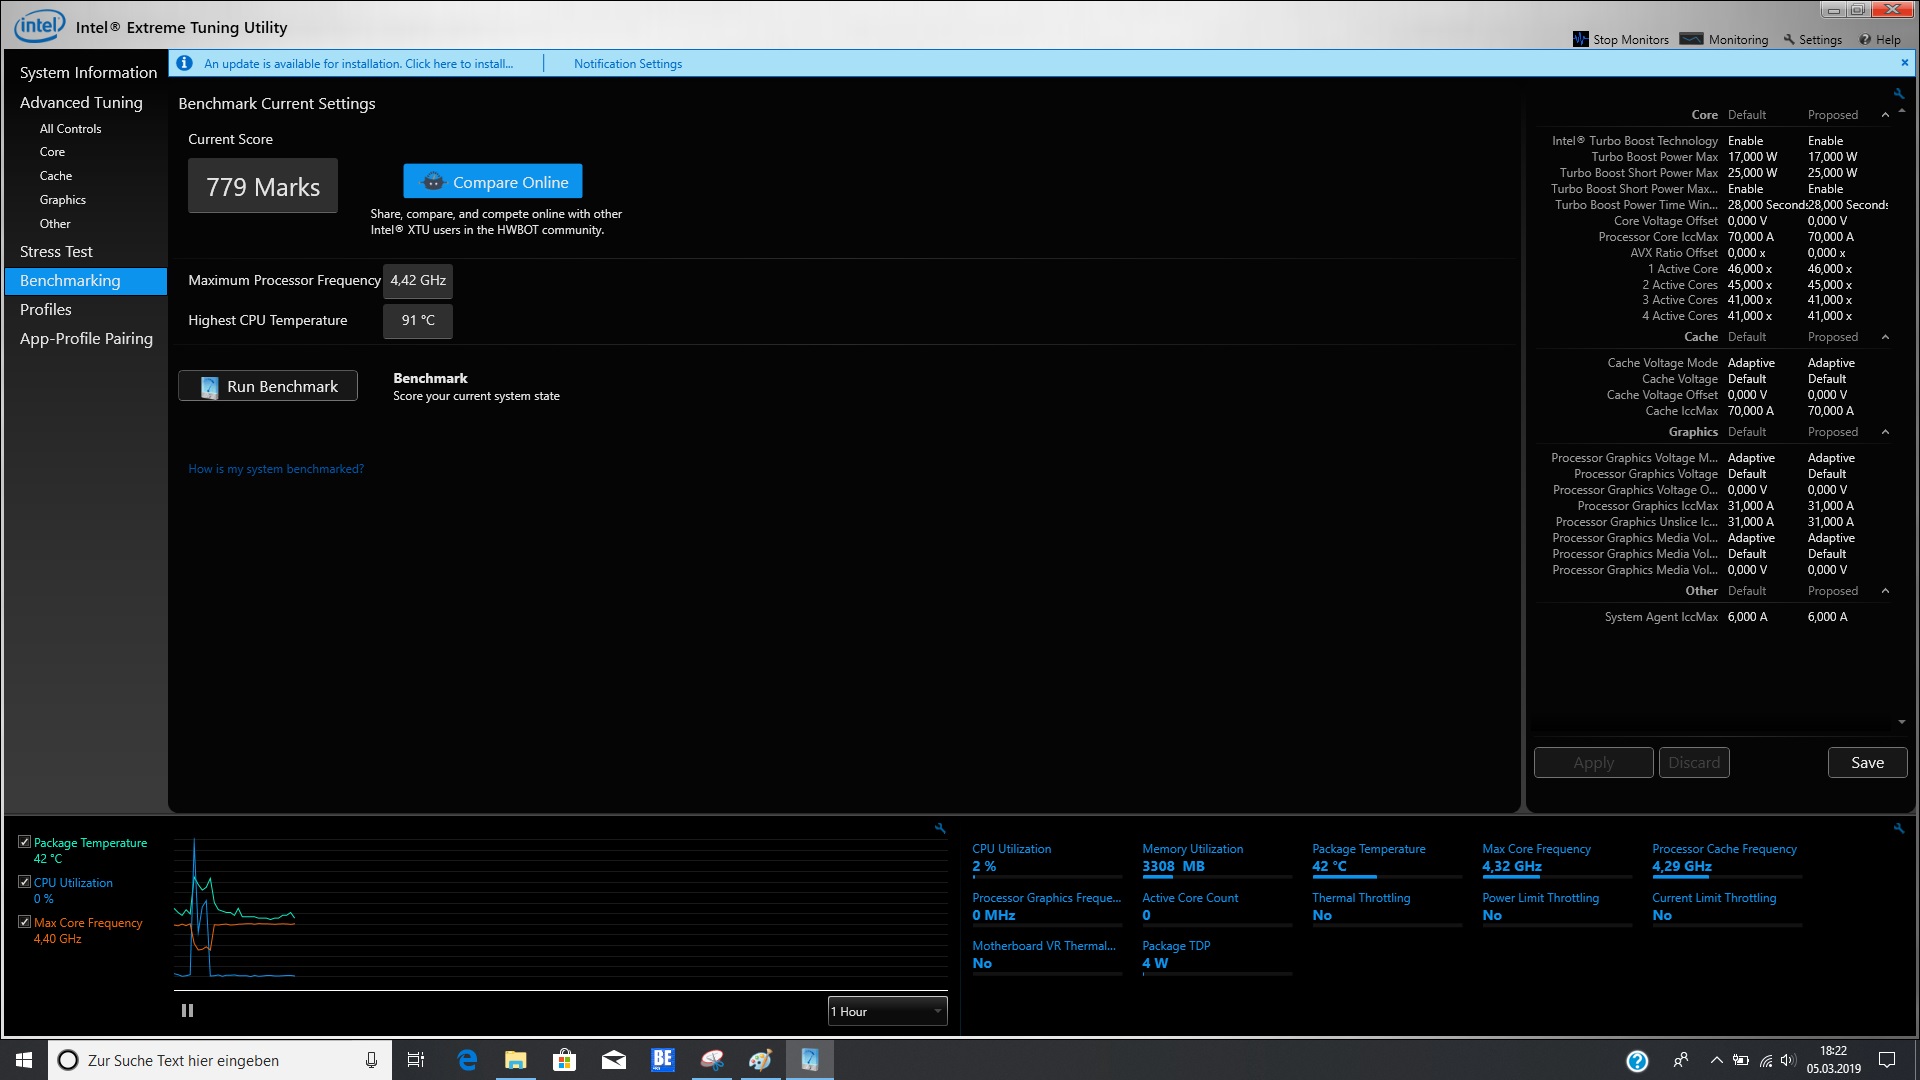
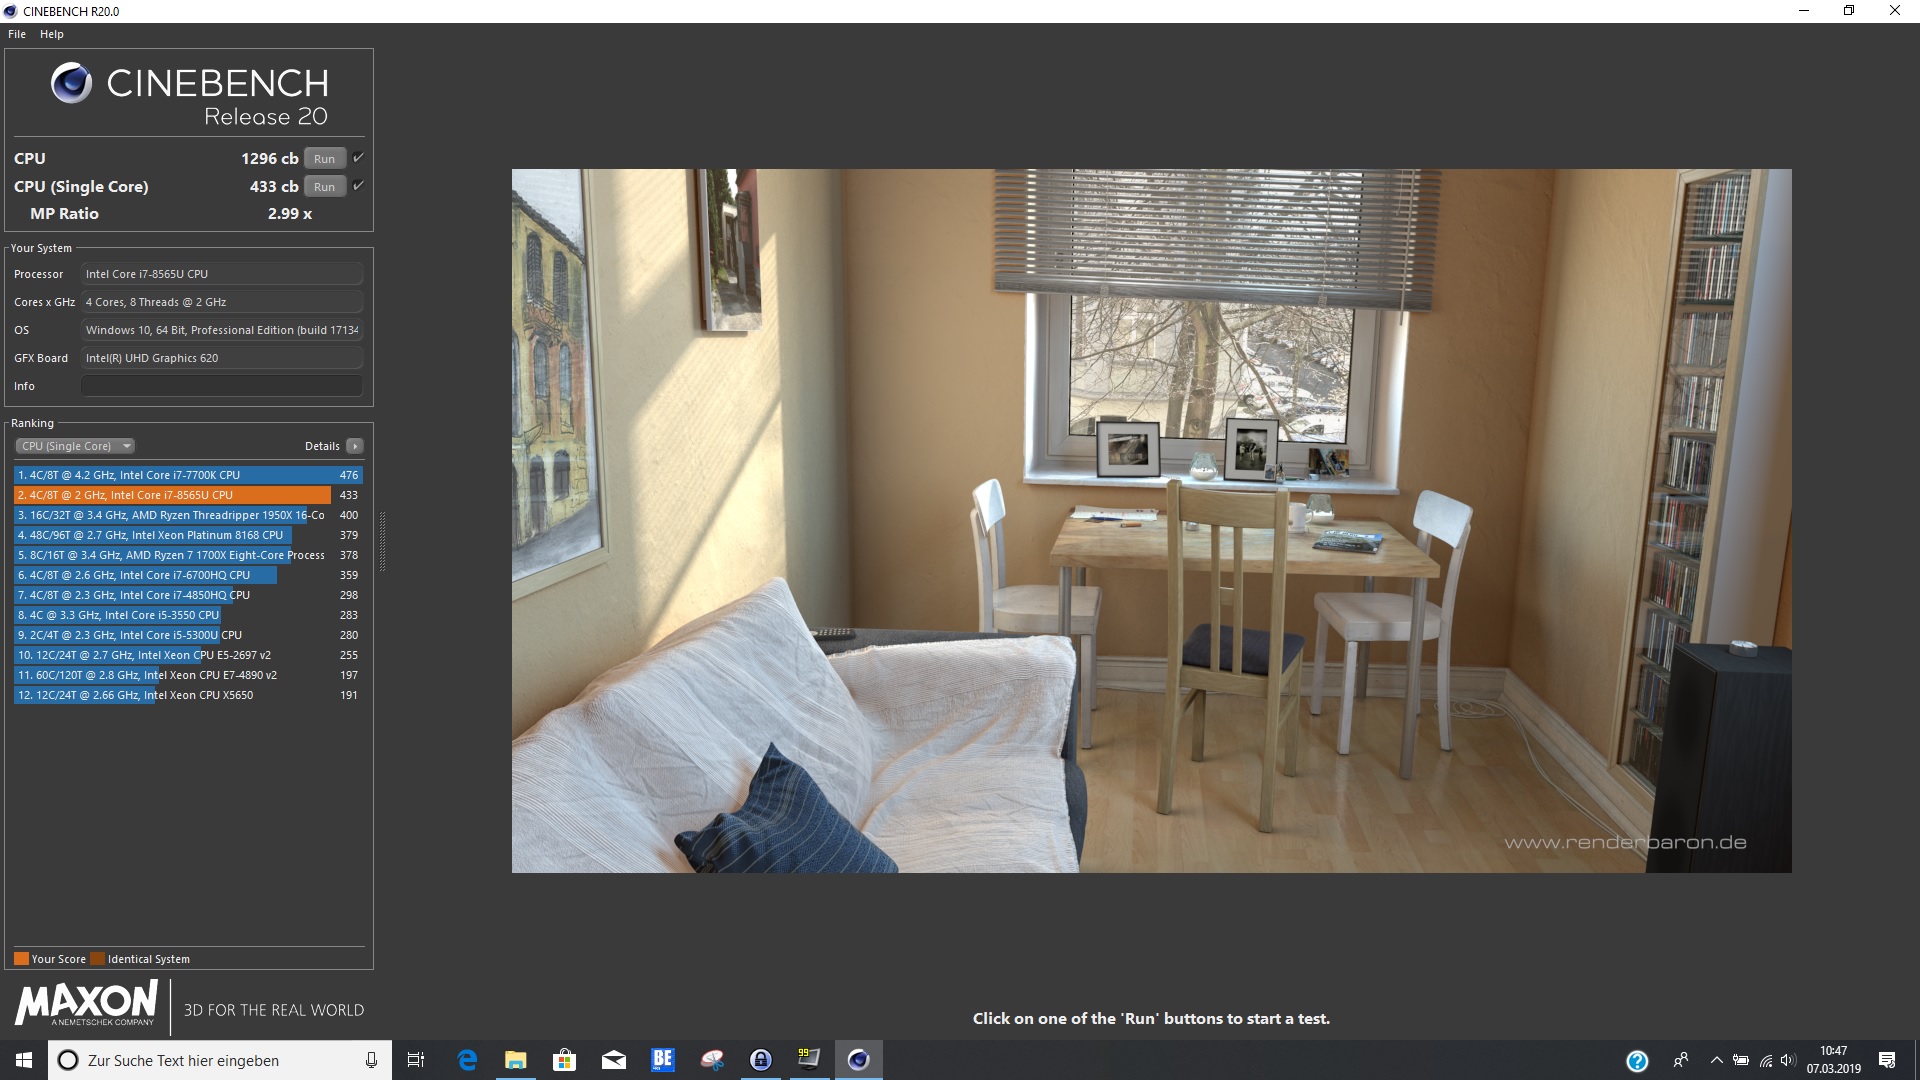
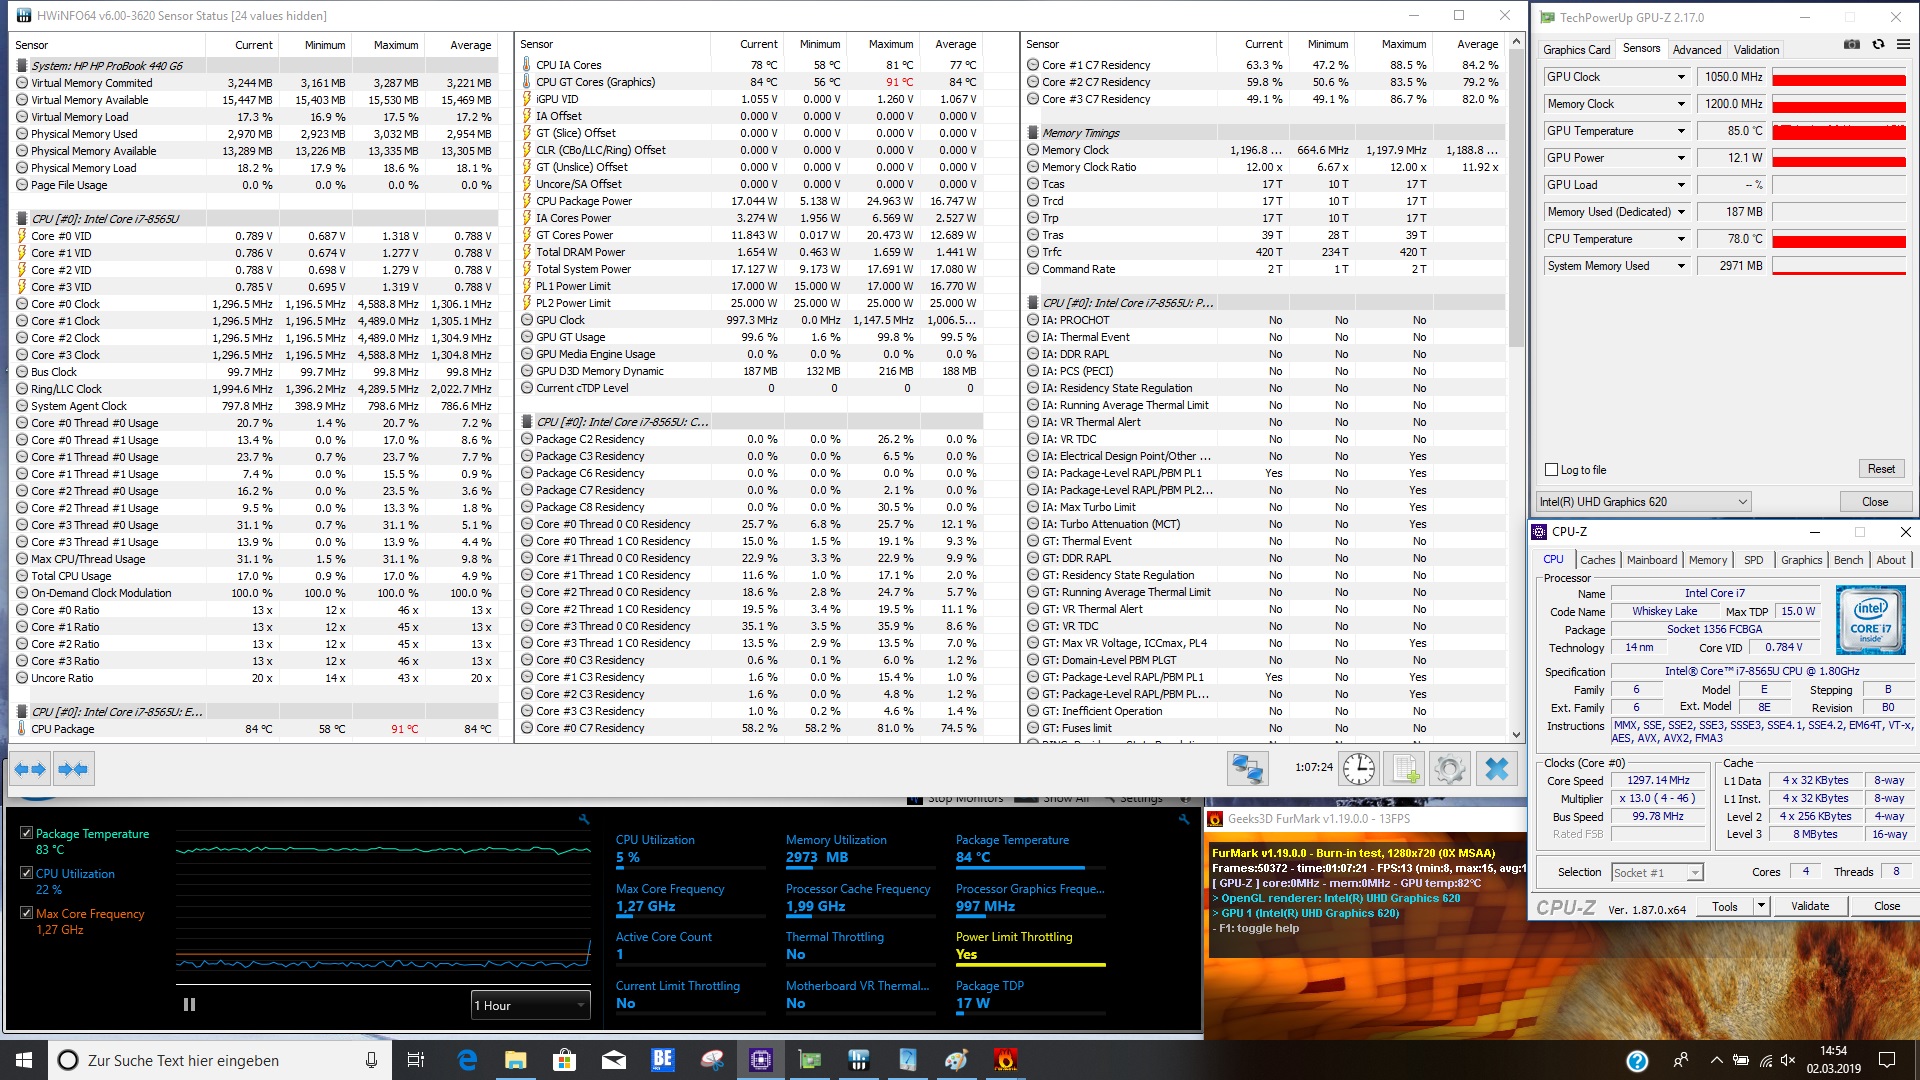
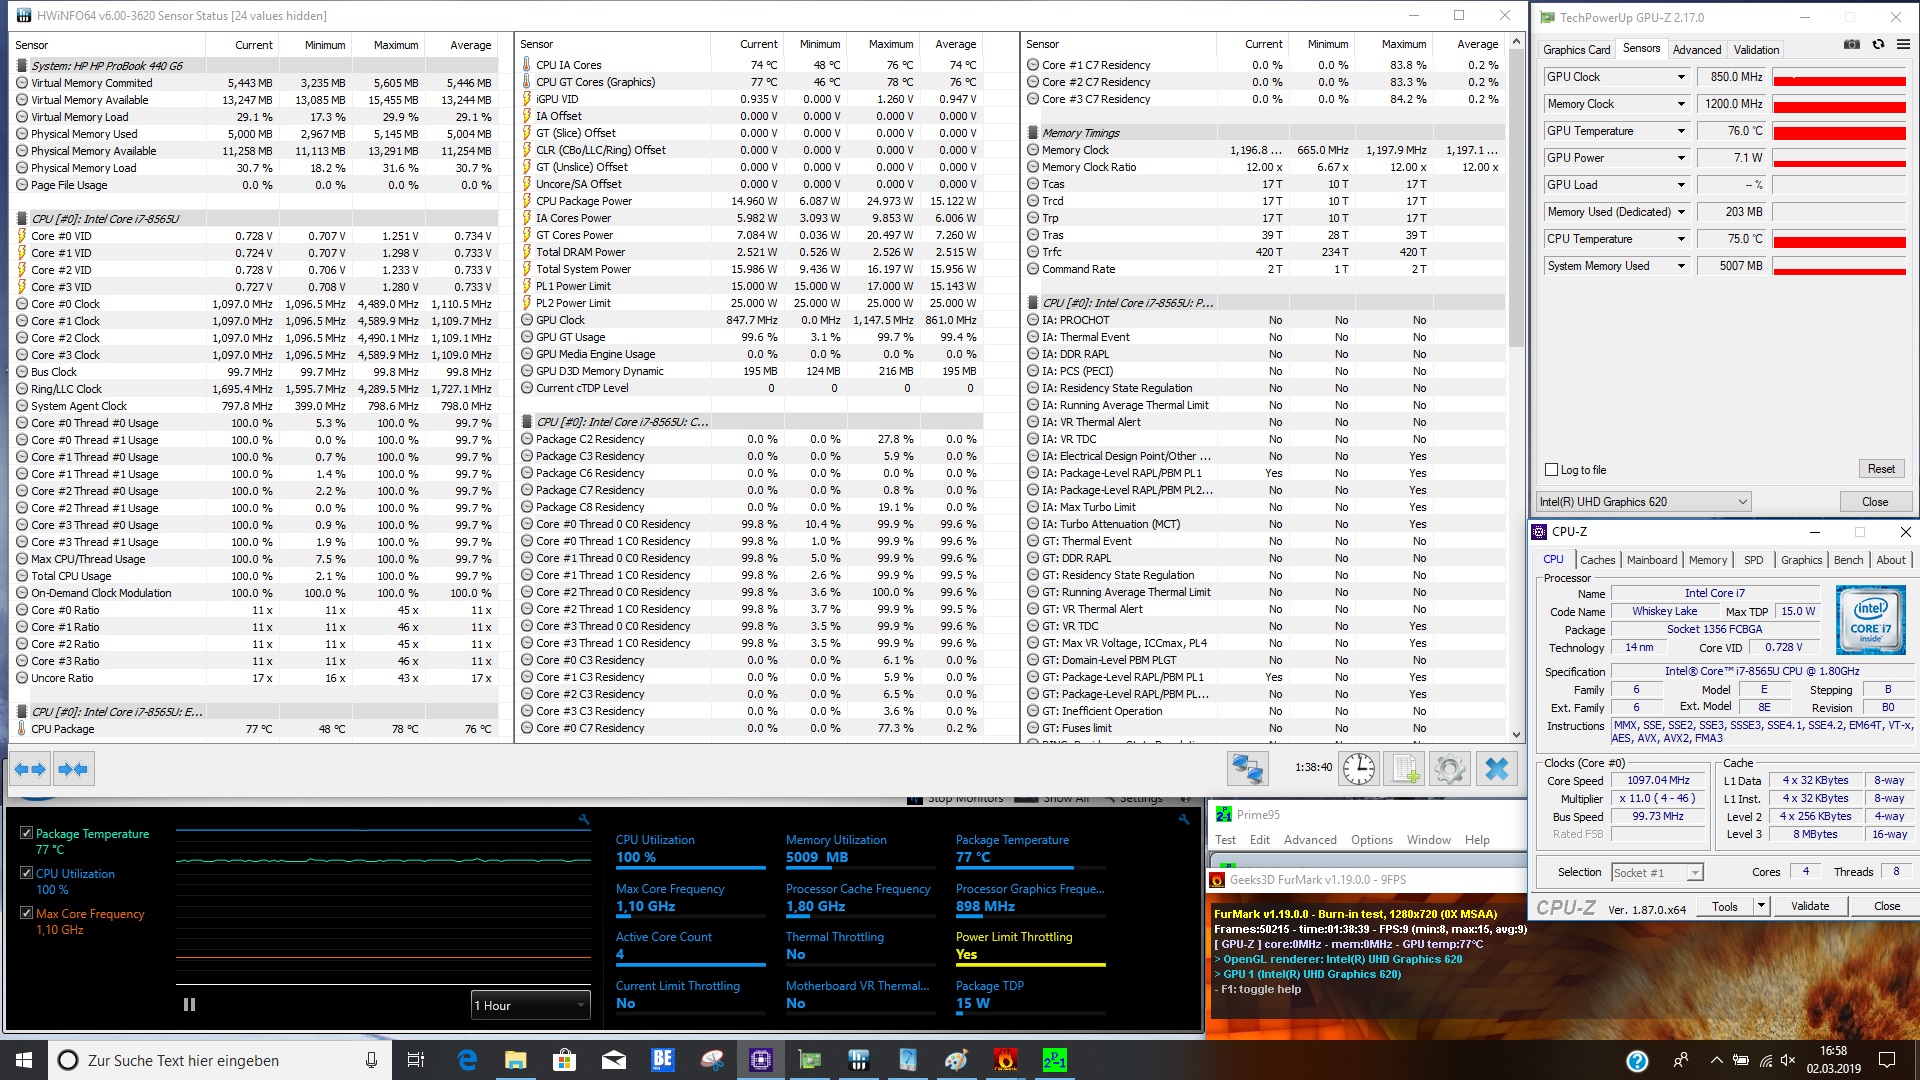
惠普重新设计了ProBook 440 G6的外壳,使其更加纤薄,并赋予其更现代的外观。制造商通过铝质表面做出了很好的材料选择,使设备具有高品质的机身。但不仅仅是外观上的更新;惠普也采用了英特尔最新的处理器——尽管我们并不赞赏测试设备中的英特尔酷睿i7-8565U的Cinebench R15多线程分数。尽管如此,单线程性能非常好,我们的HP测试设备在我们的整体系统性能比较表中排名第一。
HP ProBook 440 G6的测试配置售价约为8000元。这包括Core i7处理器,16 GB RAM和512 GB SSD。我们很欣赏屏幕的选择,但这对于此价格范围内的设备来说还不够。如果有着低于色彩空间的覆盖范围和明显的模糊,雾面IPS面板意义并不大。
惠普的ProBook 440 G6正处于正确的方向上。尽管如此,该设备仍难以跟上来自其他制造商的激烈竞争。
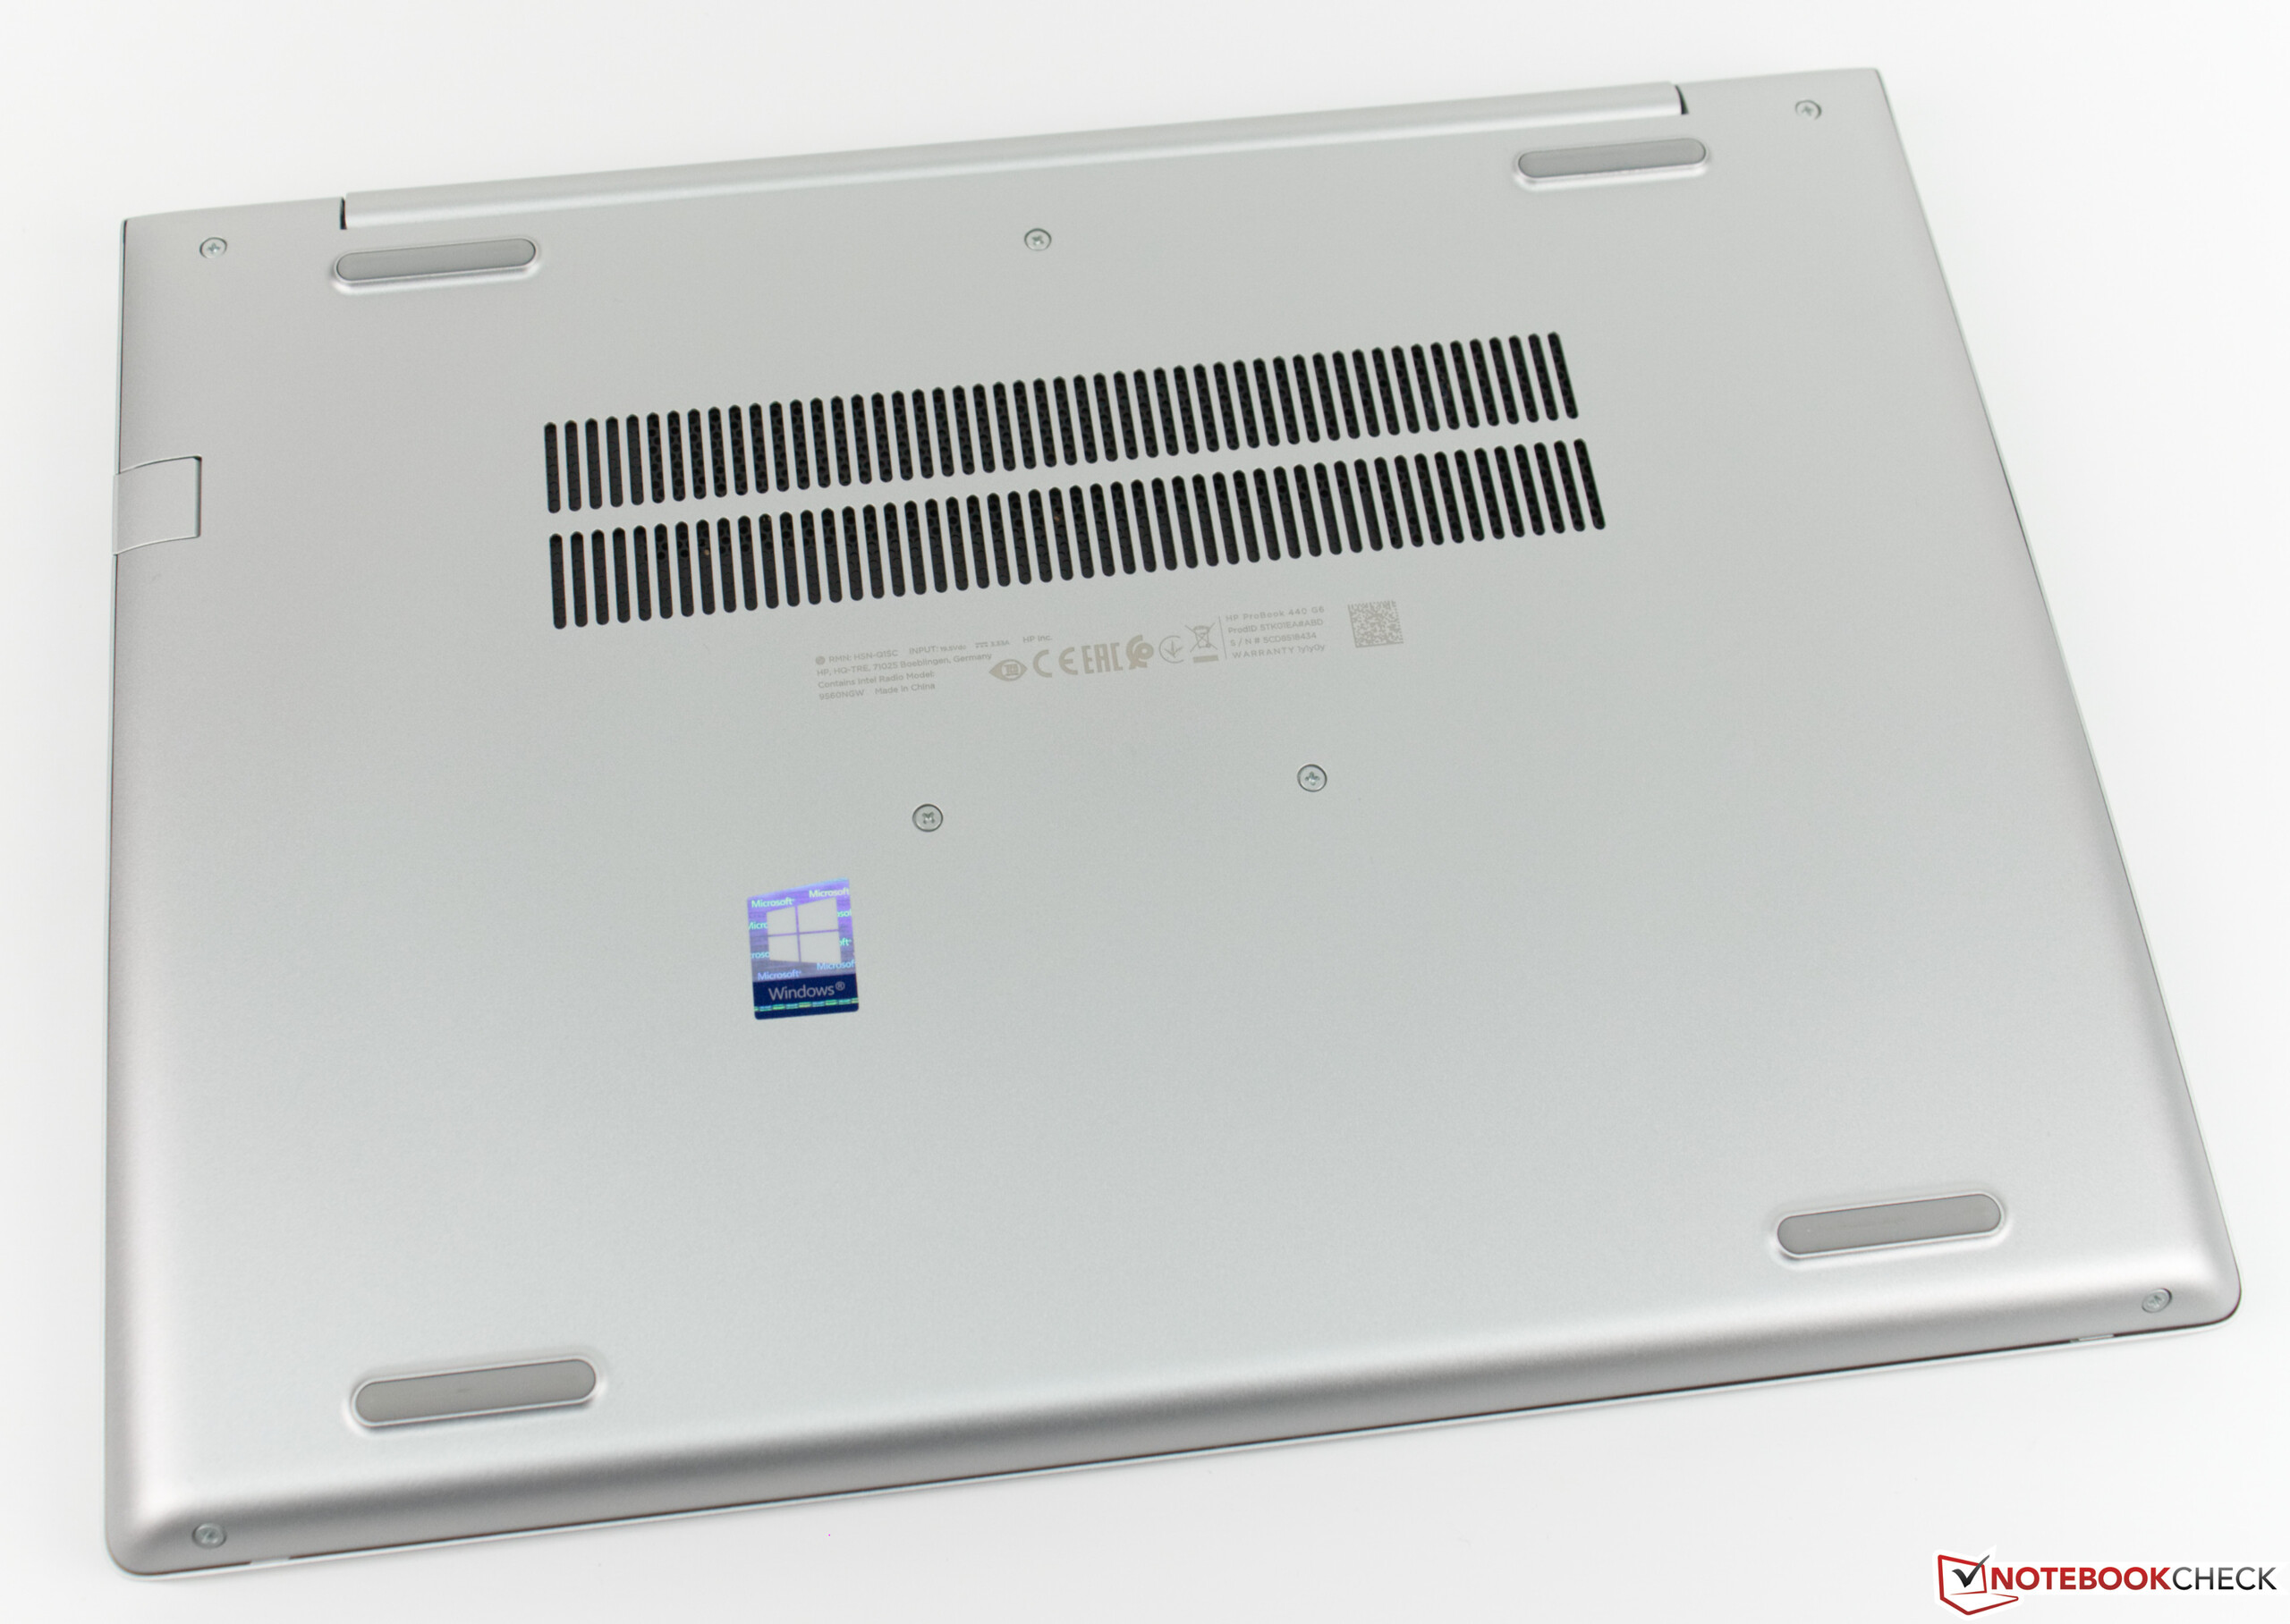
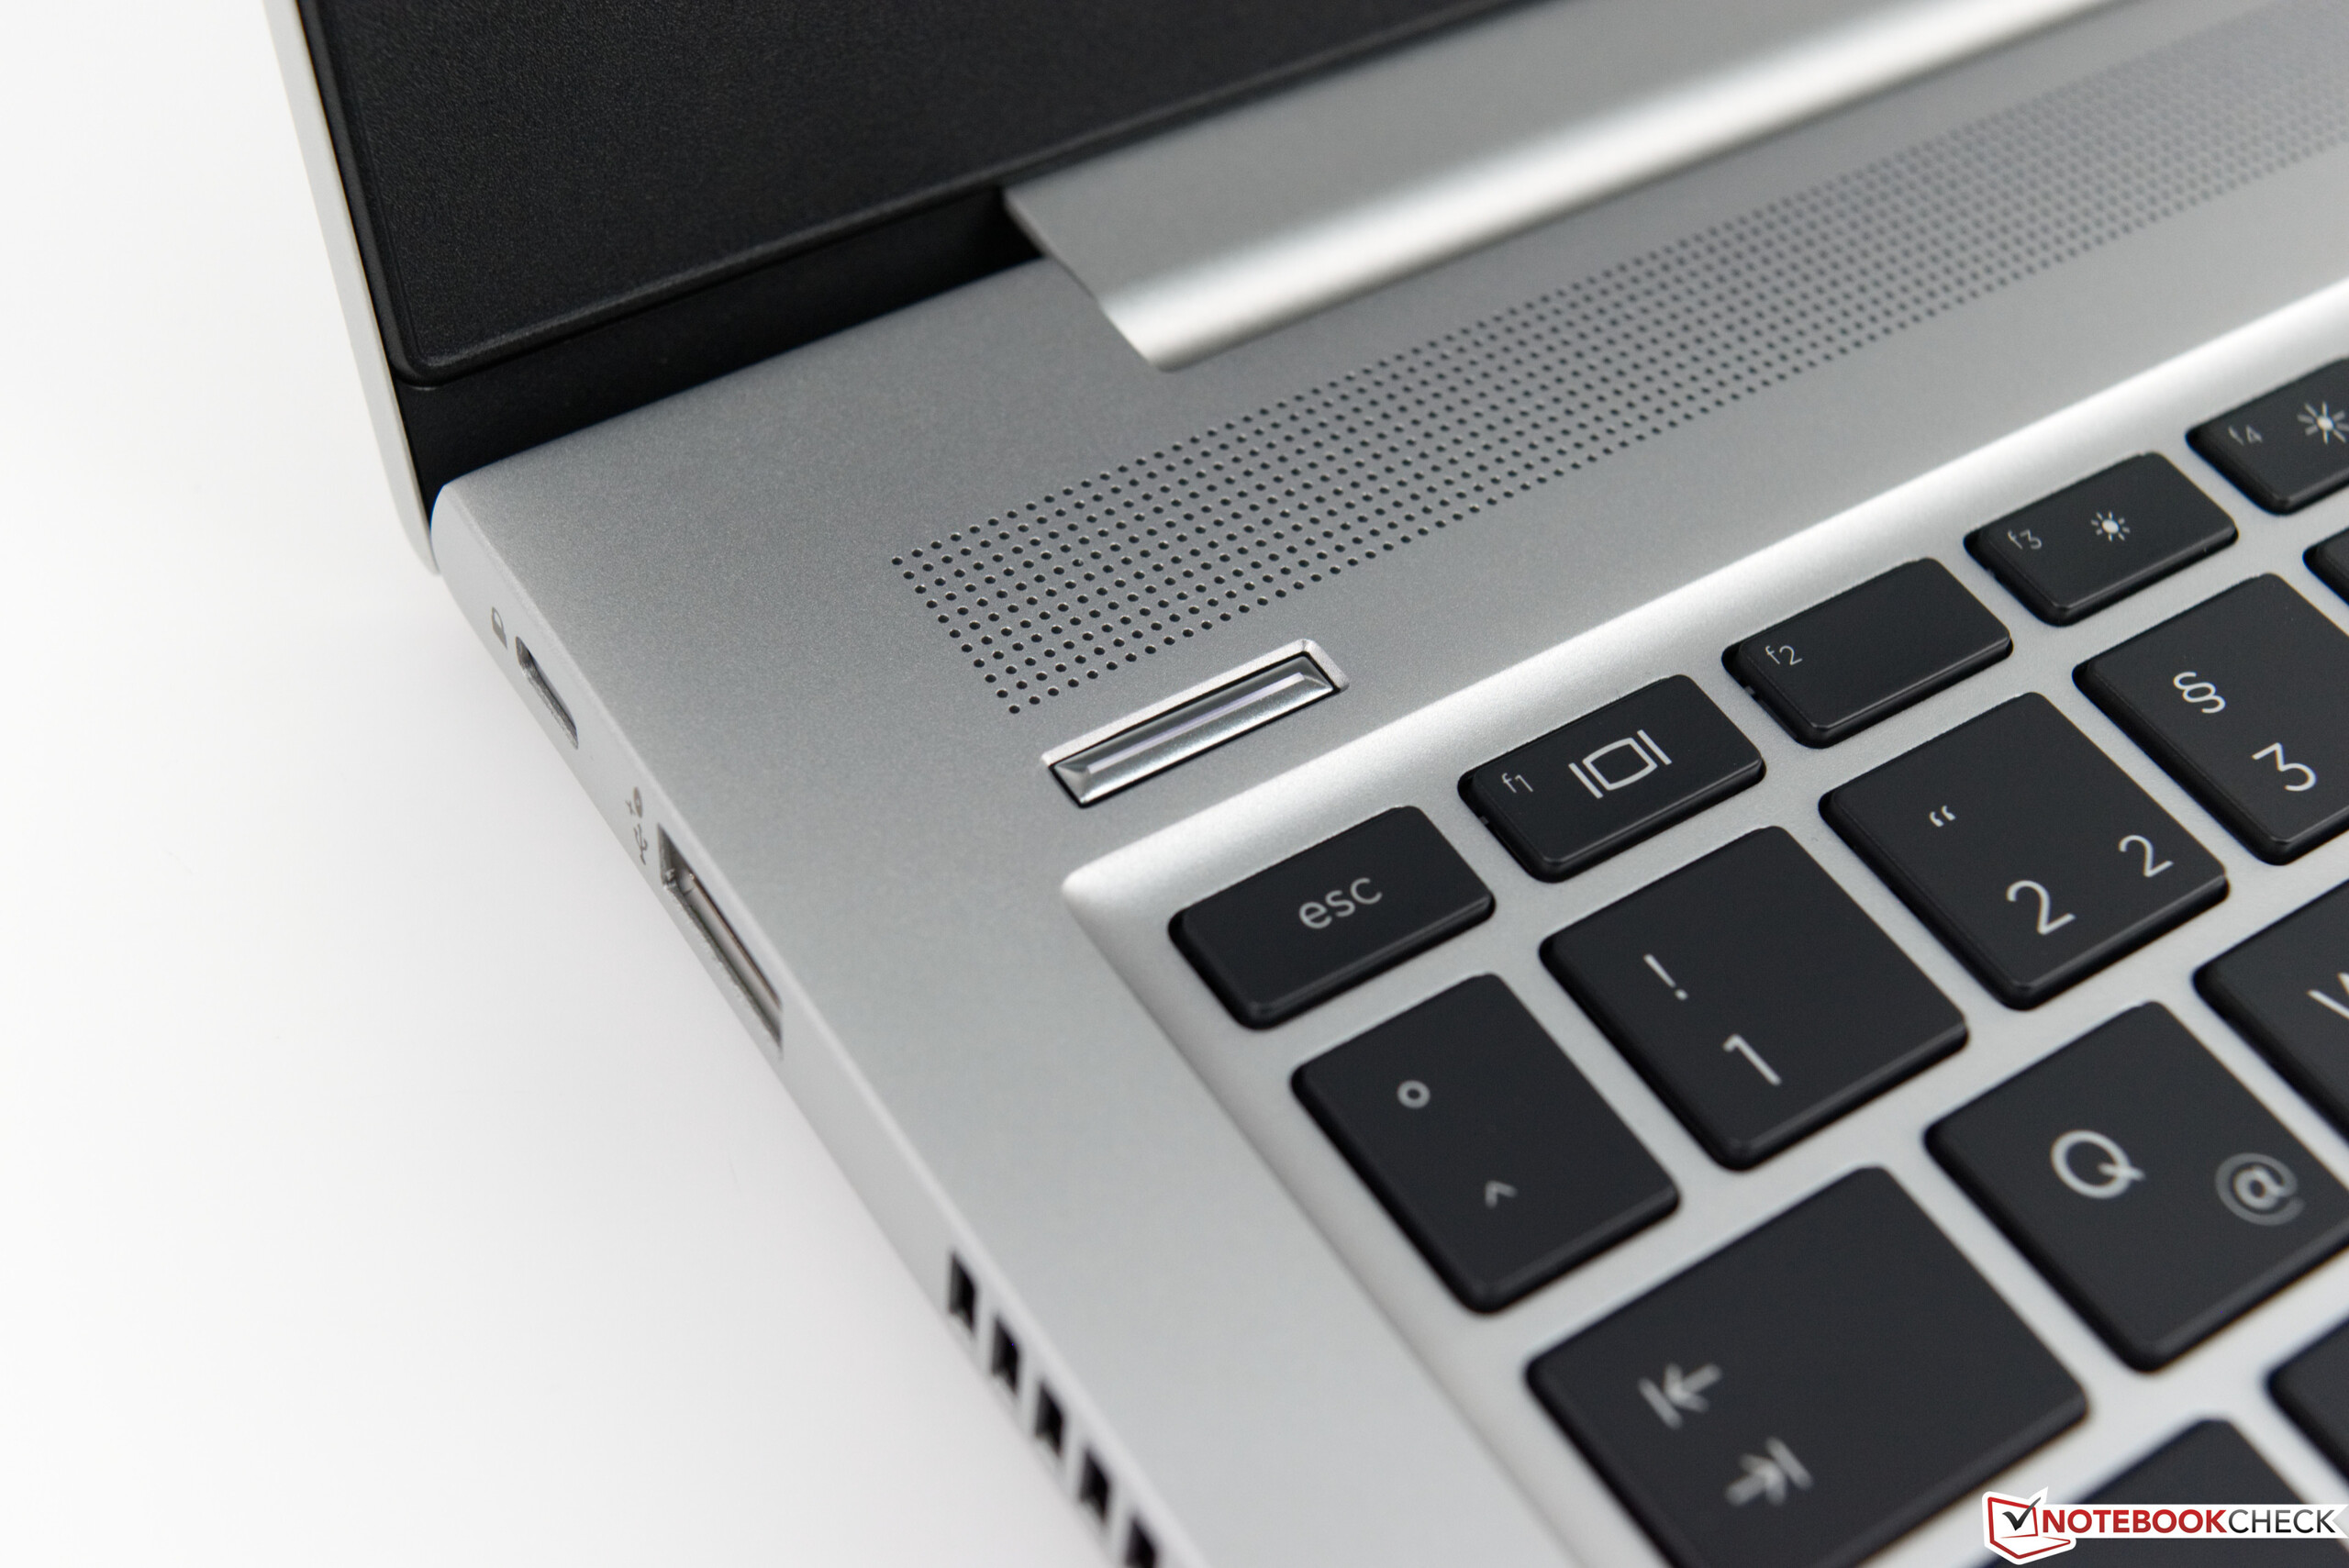
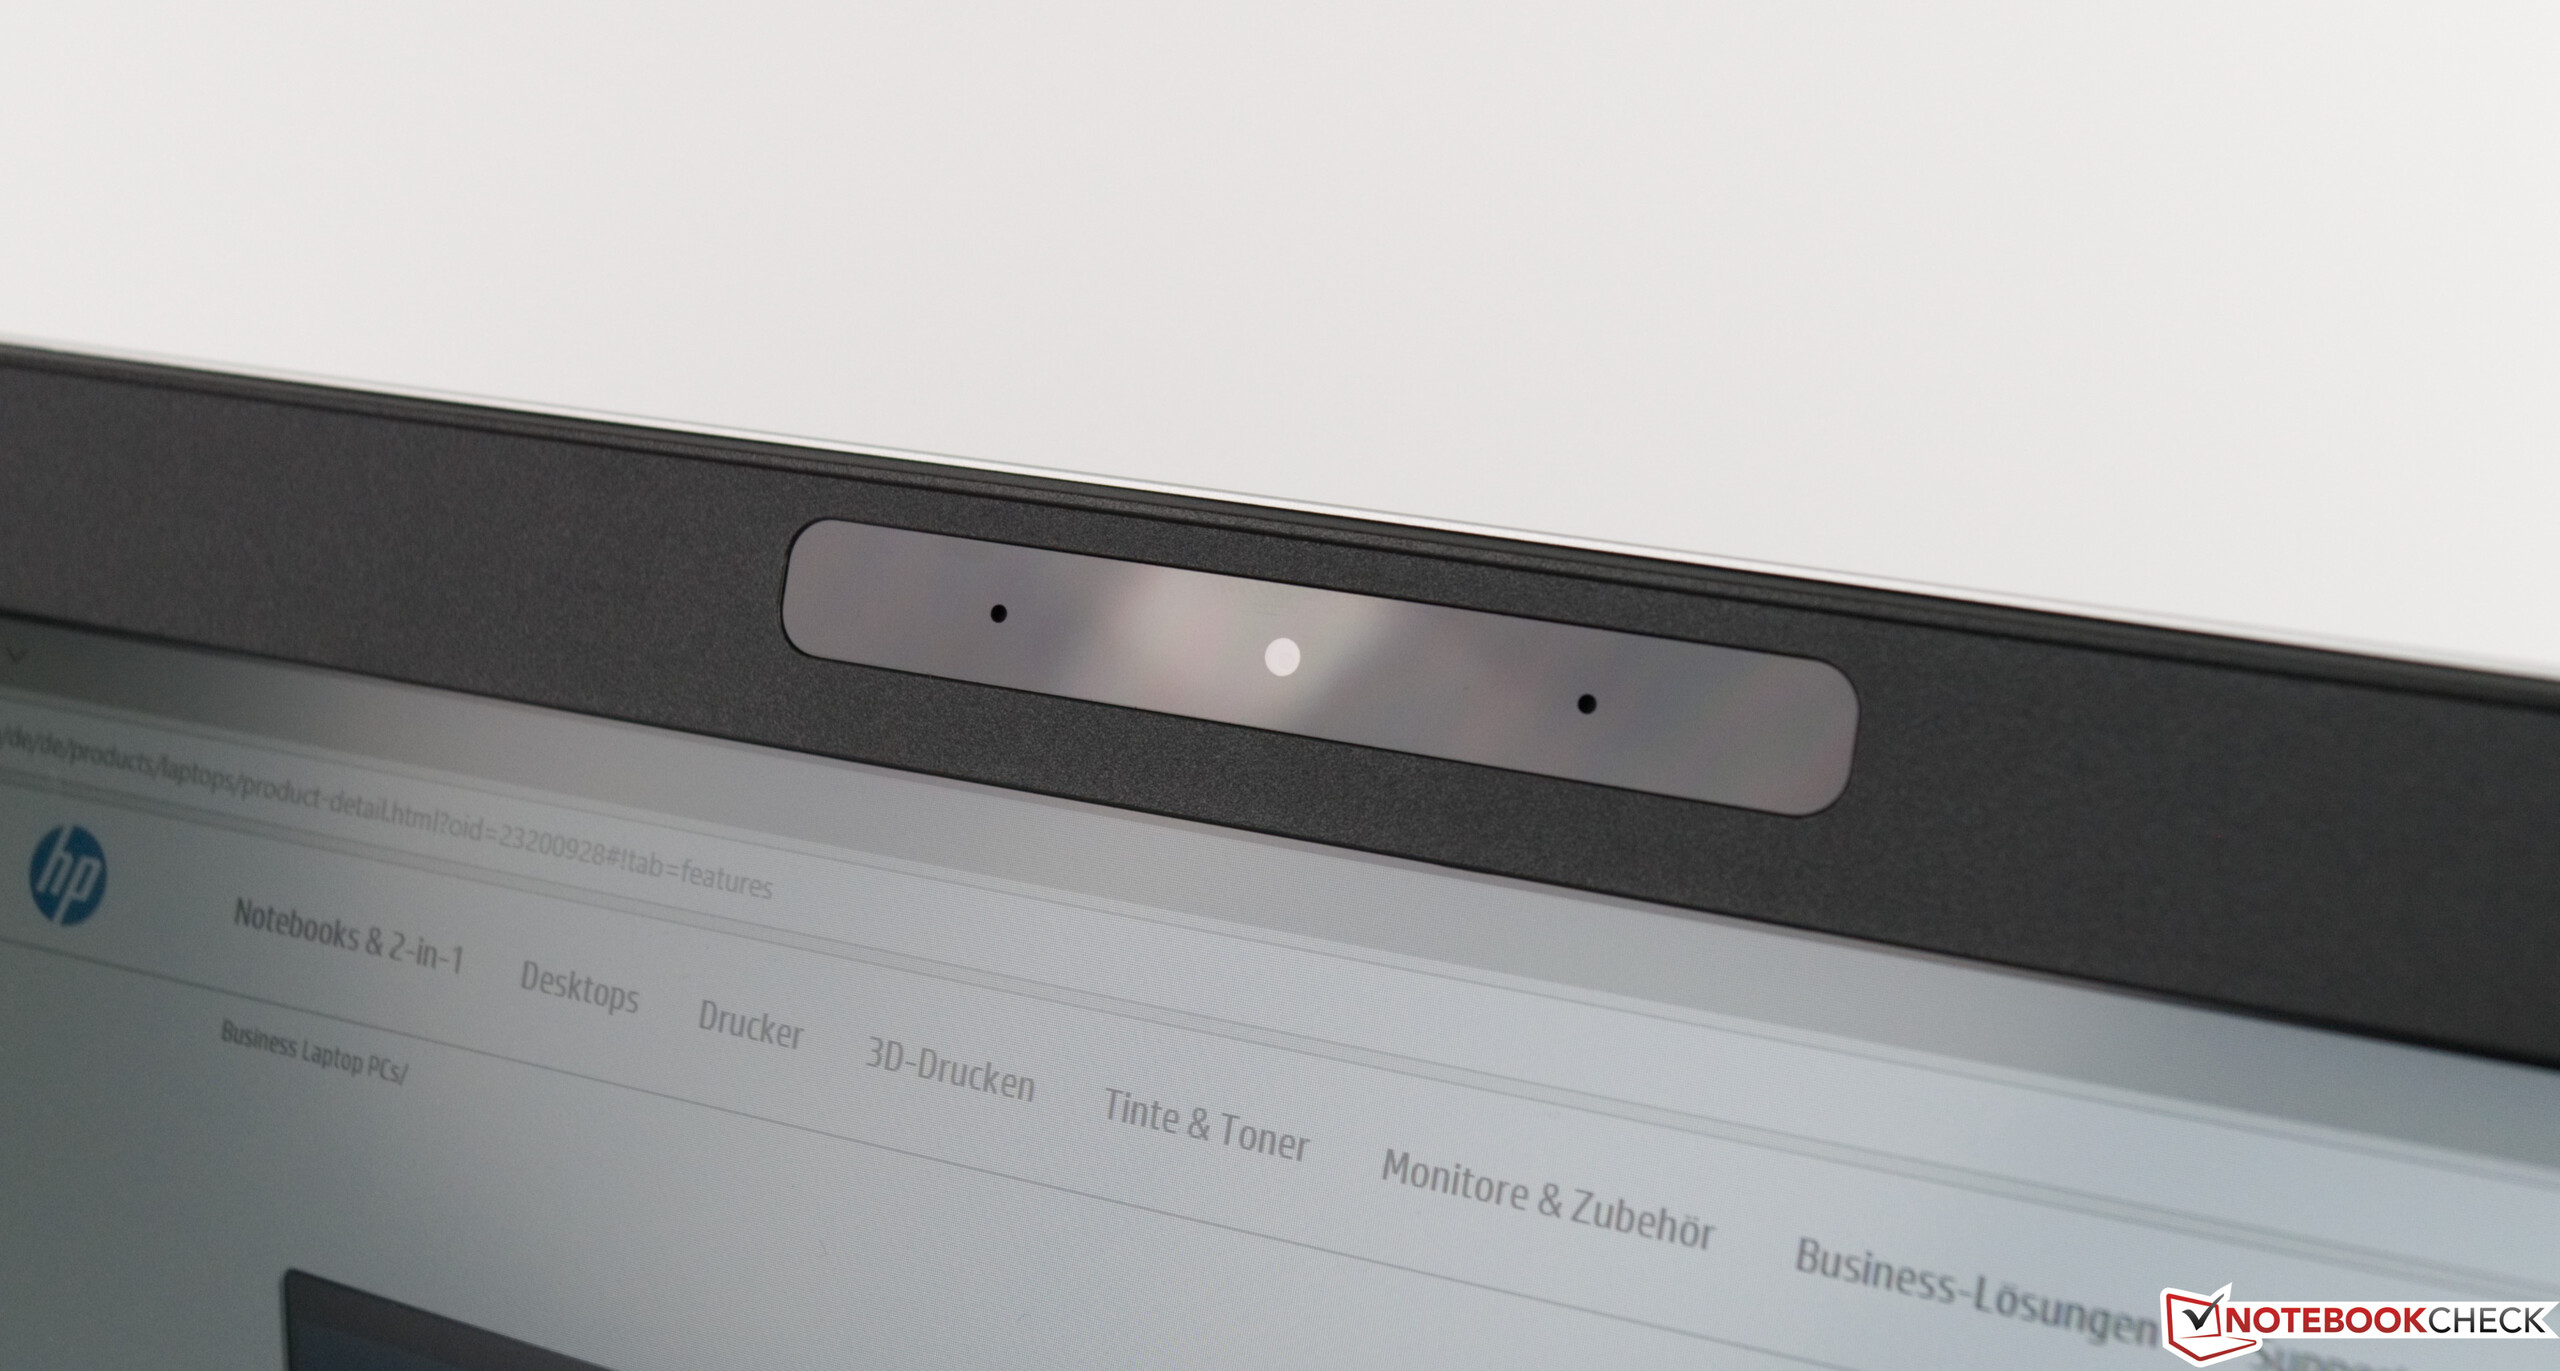
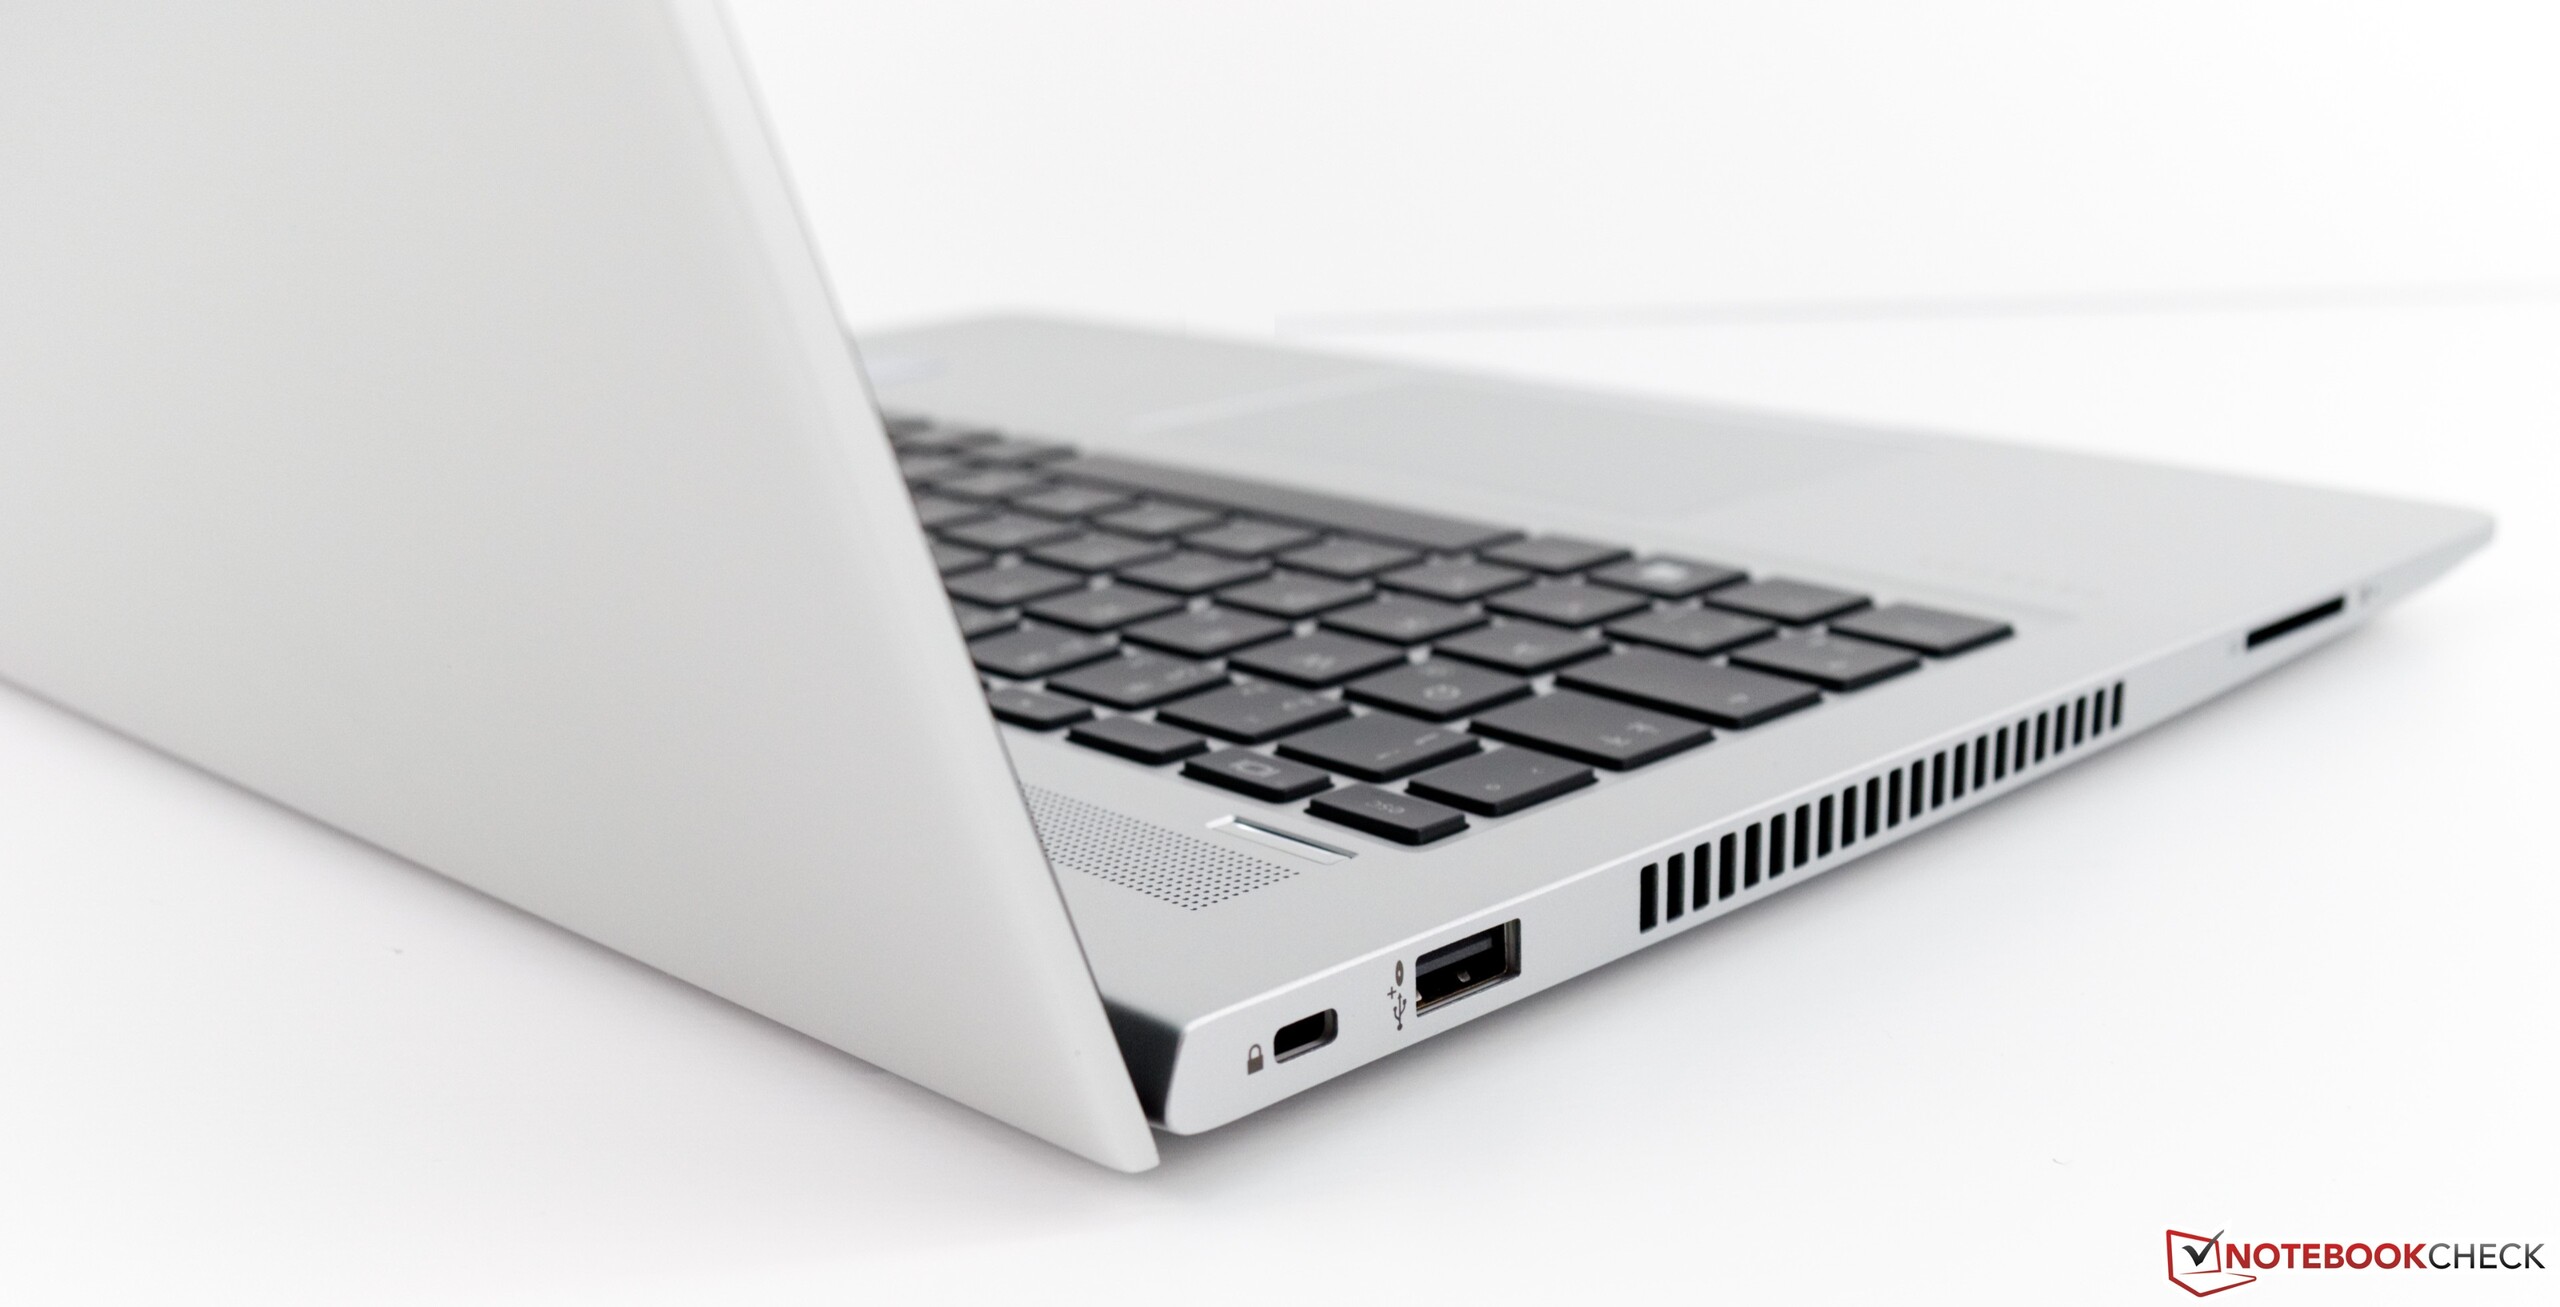
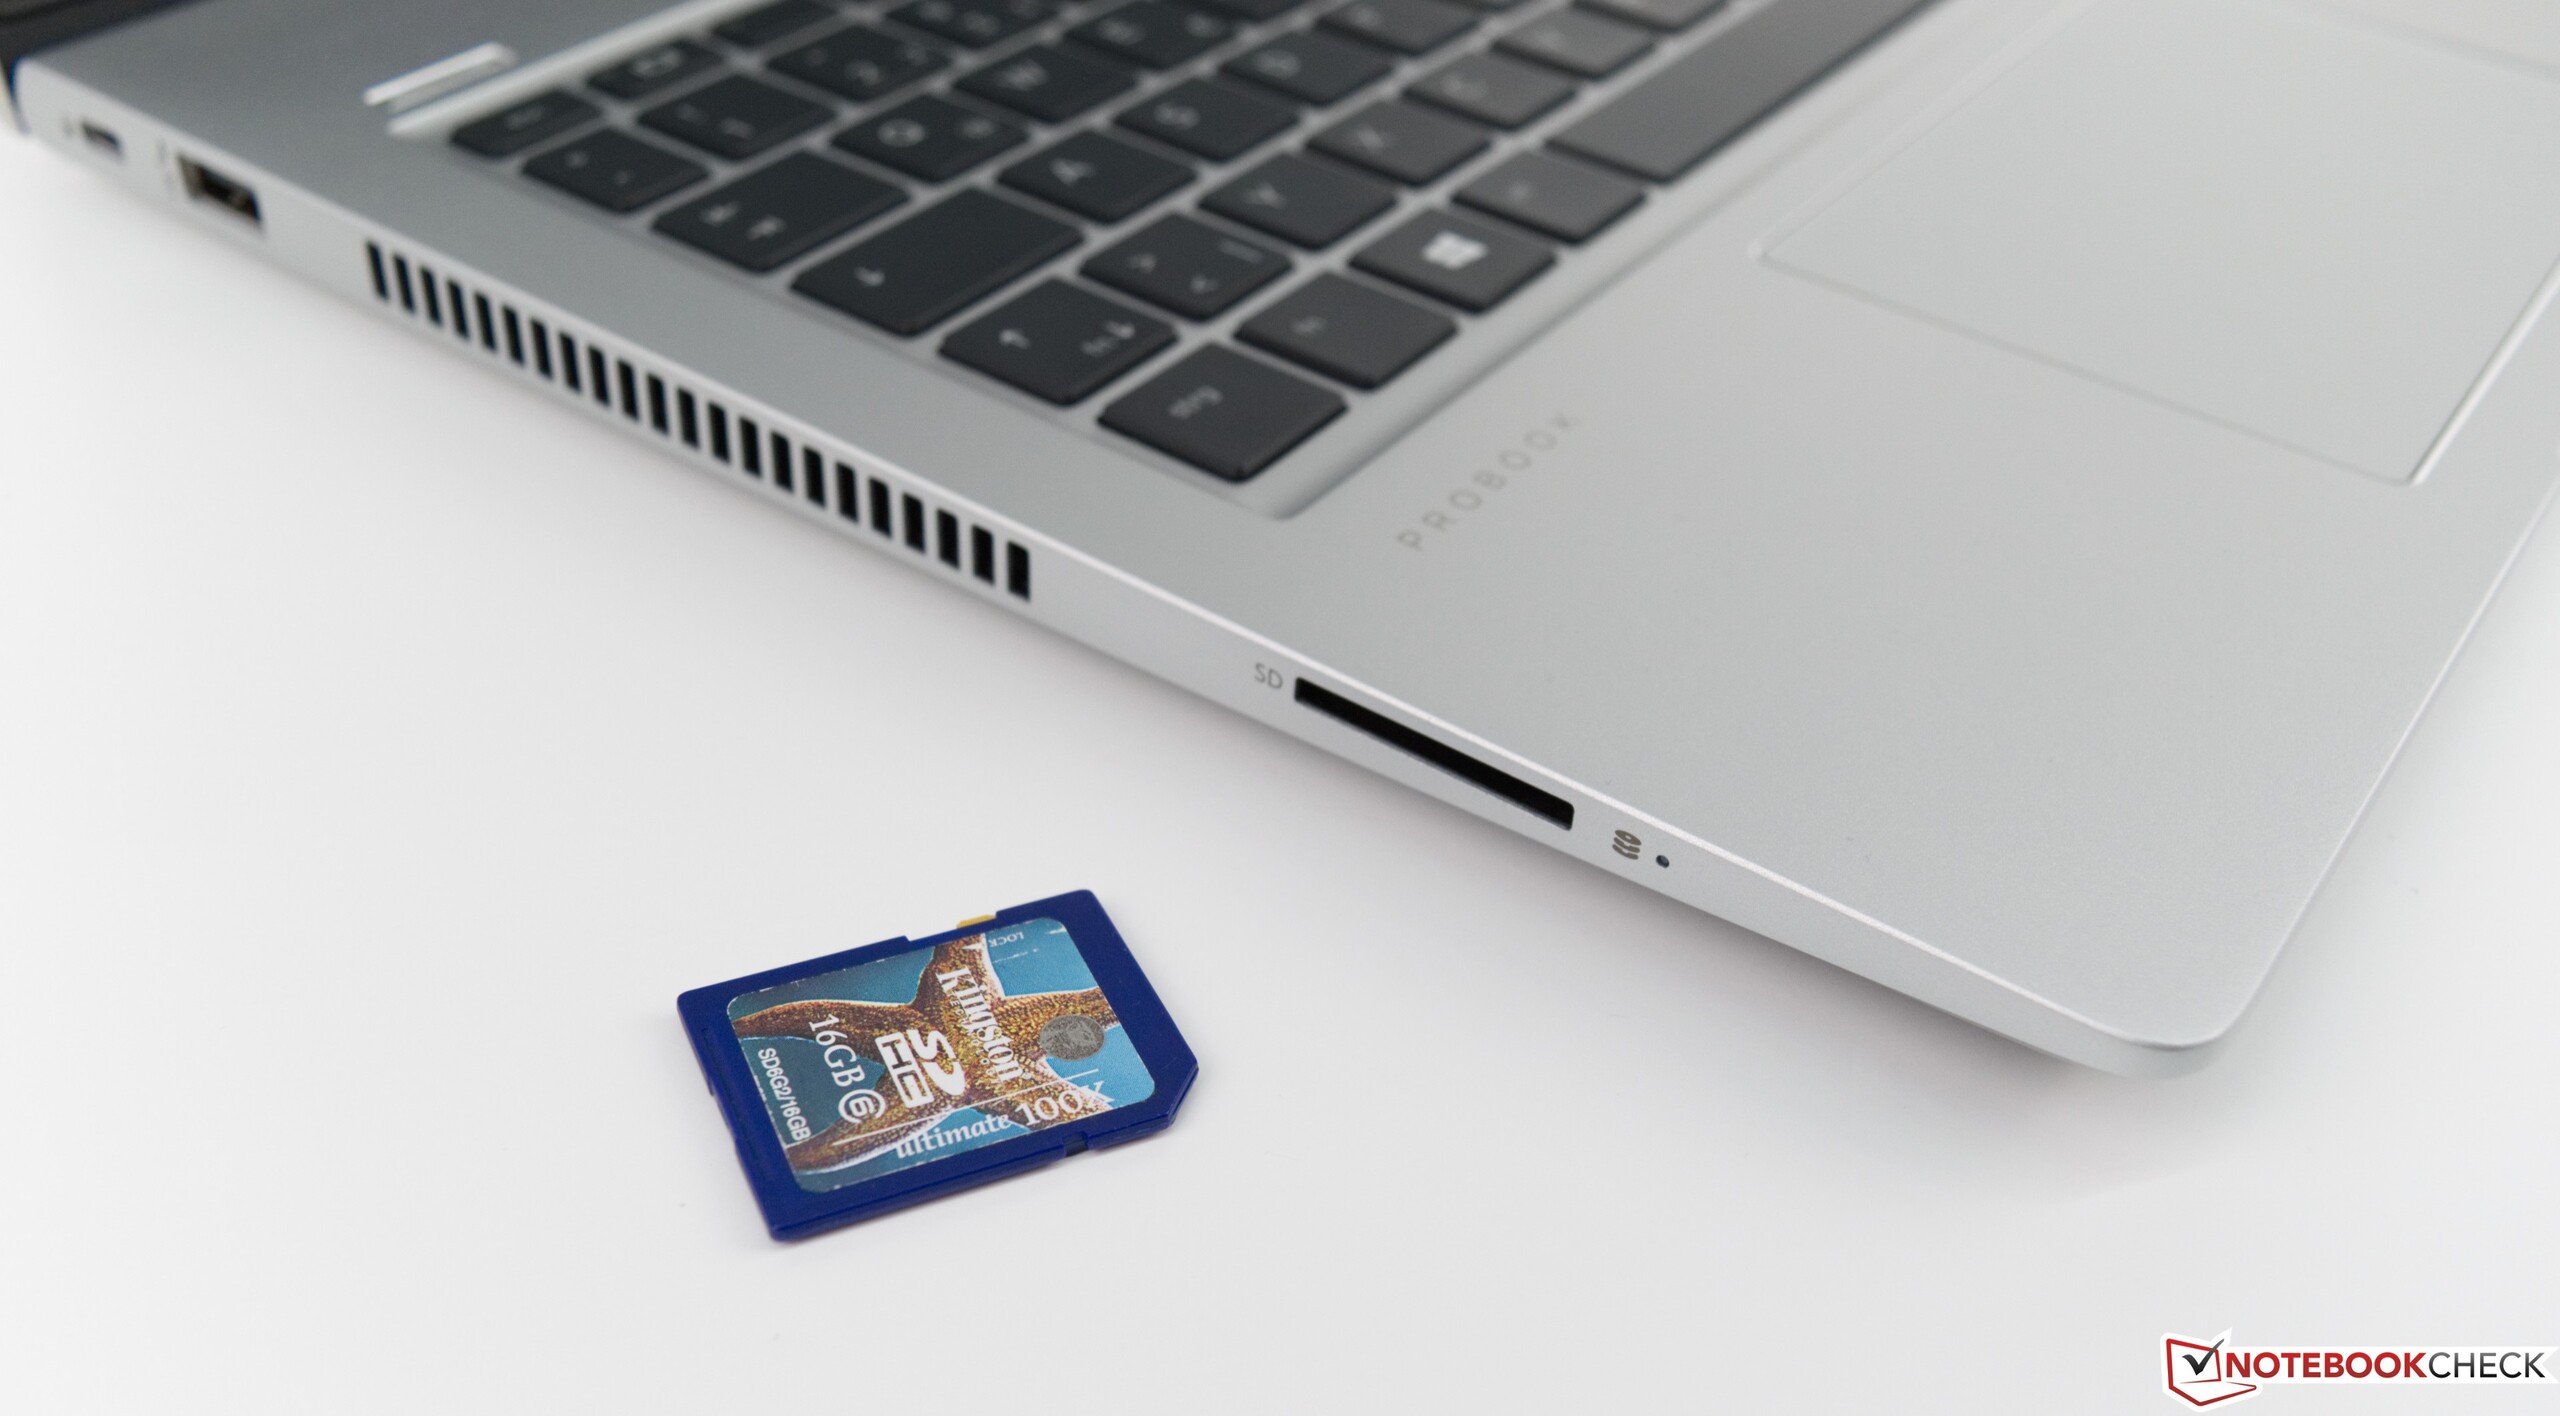
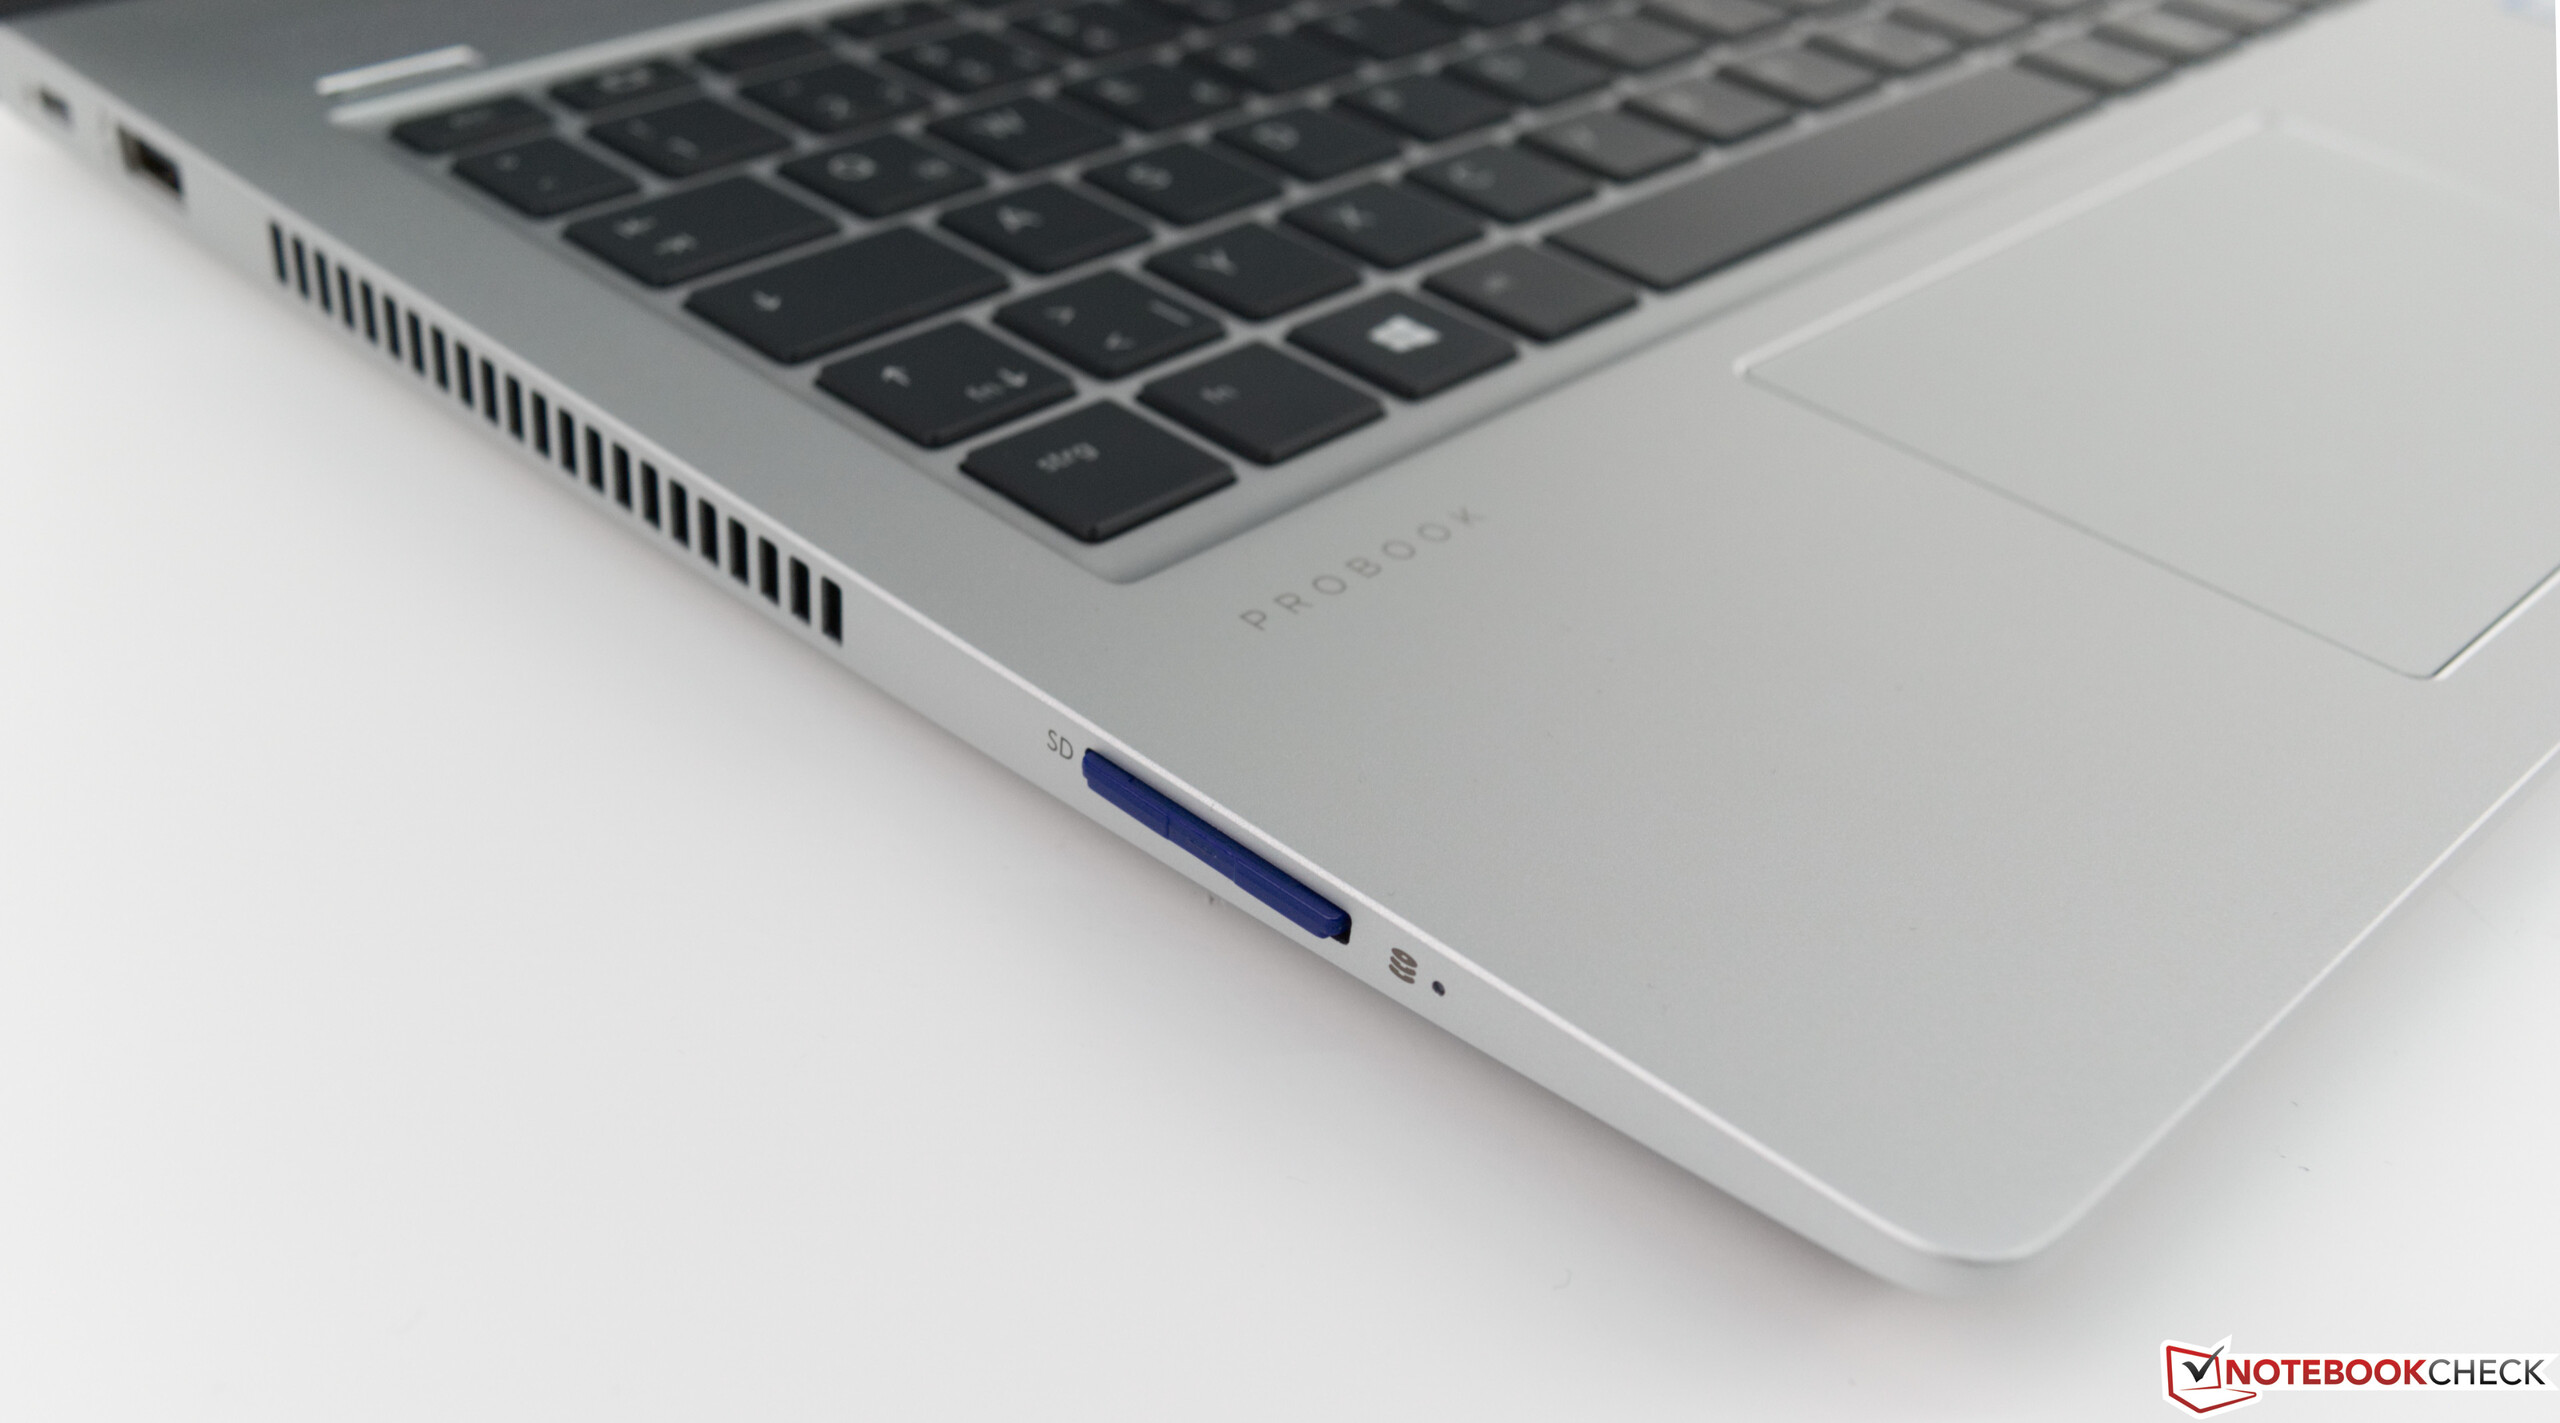
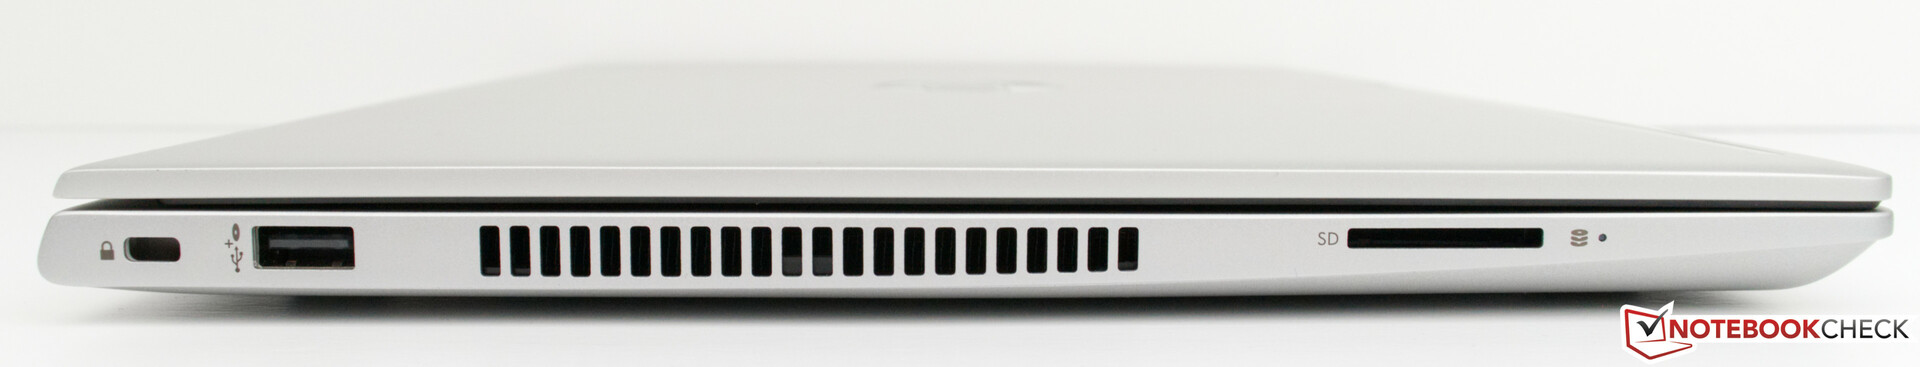
我们想强调良好噪音表现。低功耗确保了长时间的续航时间,深思熟虑的冷却风扇意味着低噪音排放。安全功能(指纹识别器和红外摄像头)也给我们留下了深刻的印象。还应该提到SD卡读卡器的存在,因为许多制造商倾向于将其排除在外或者现在只提供microSD卡读卡器。
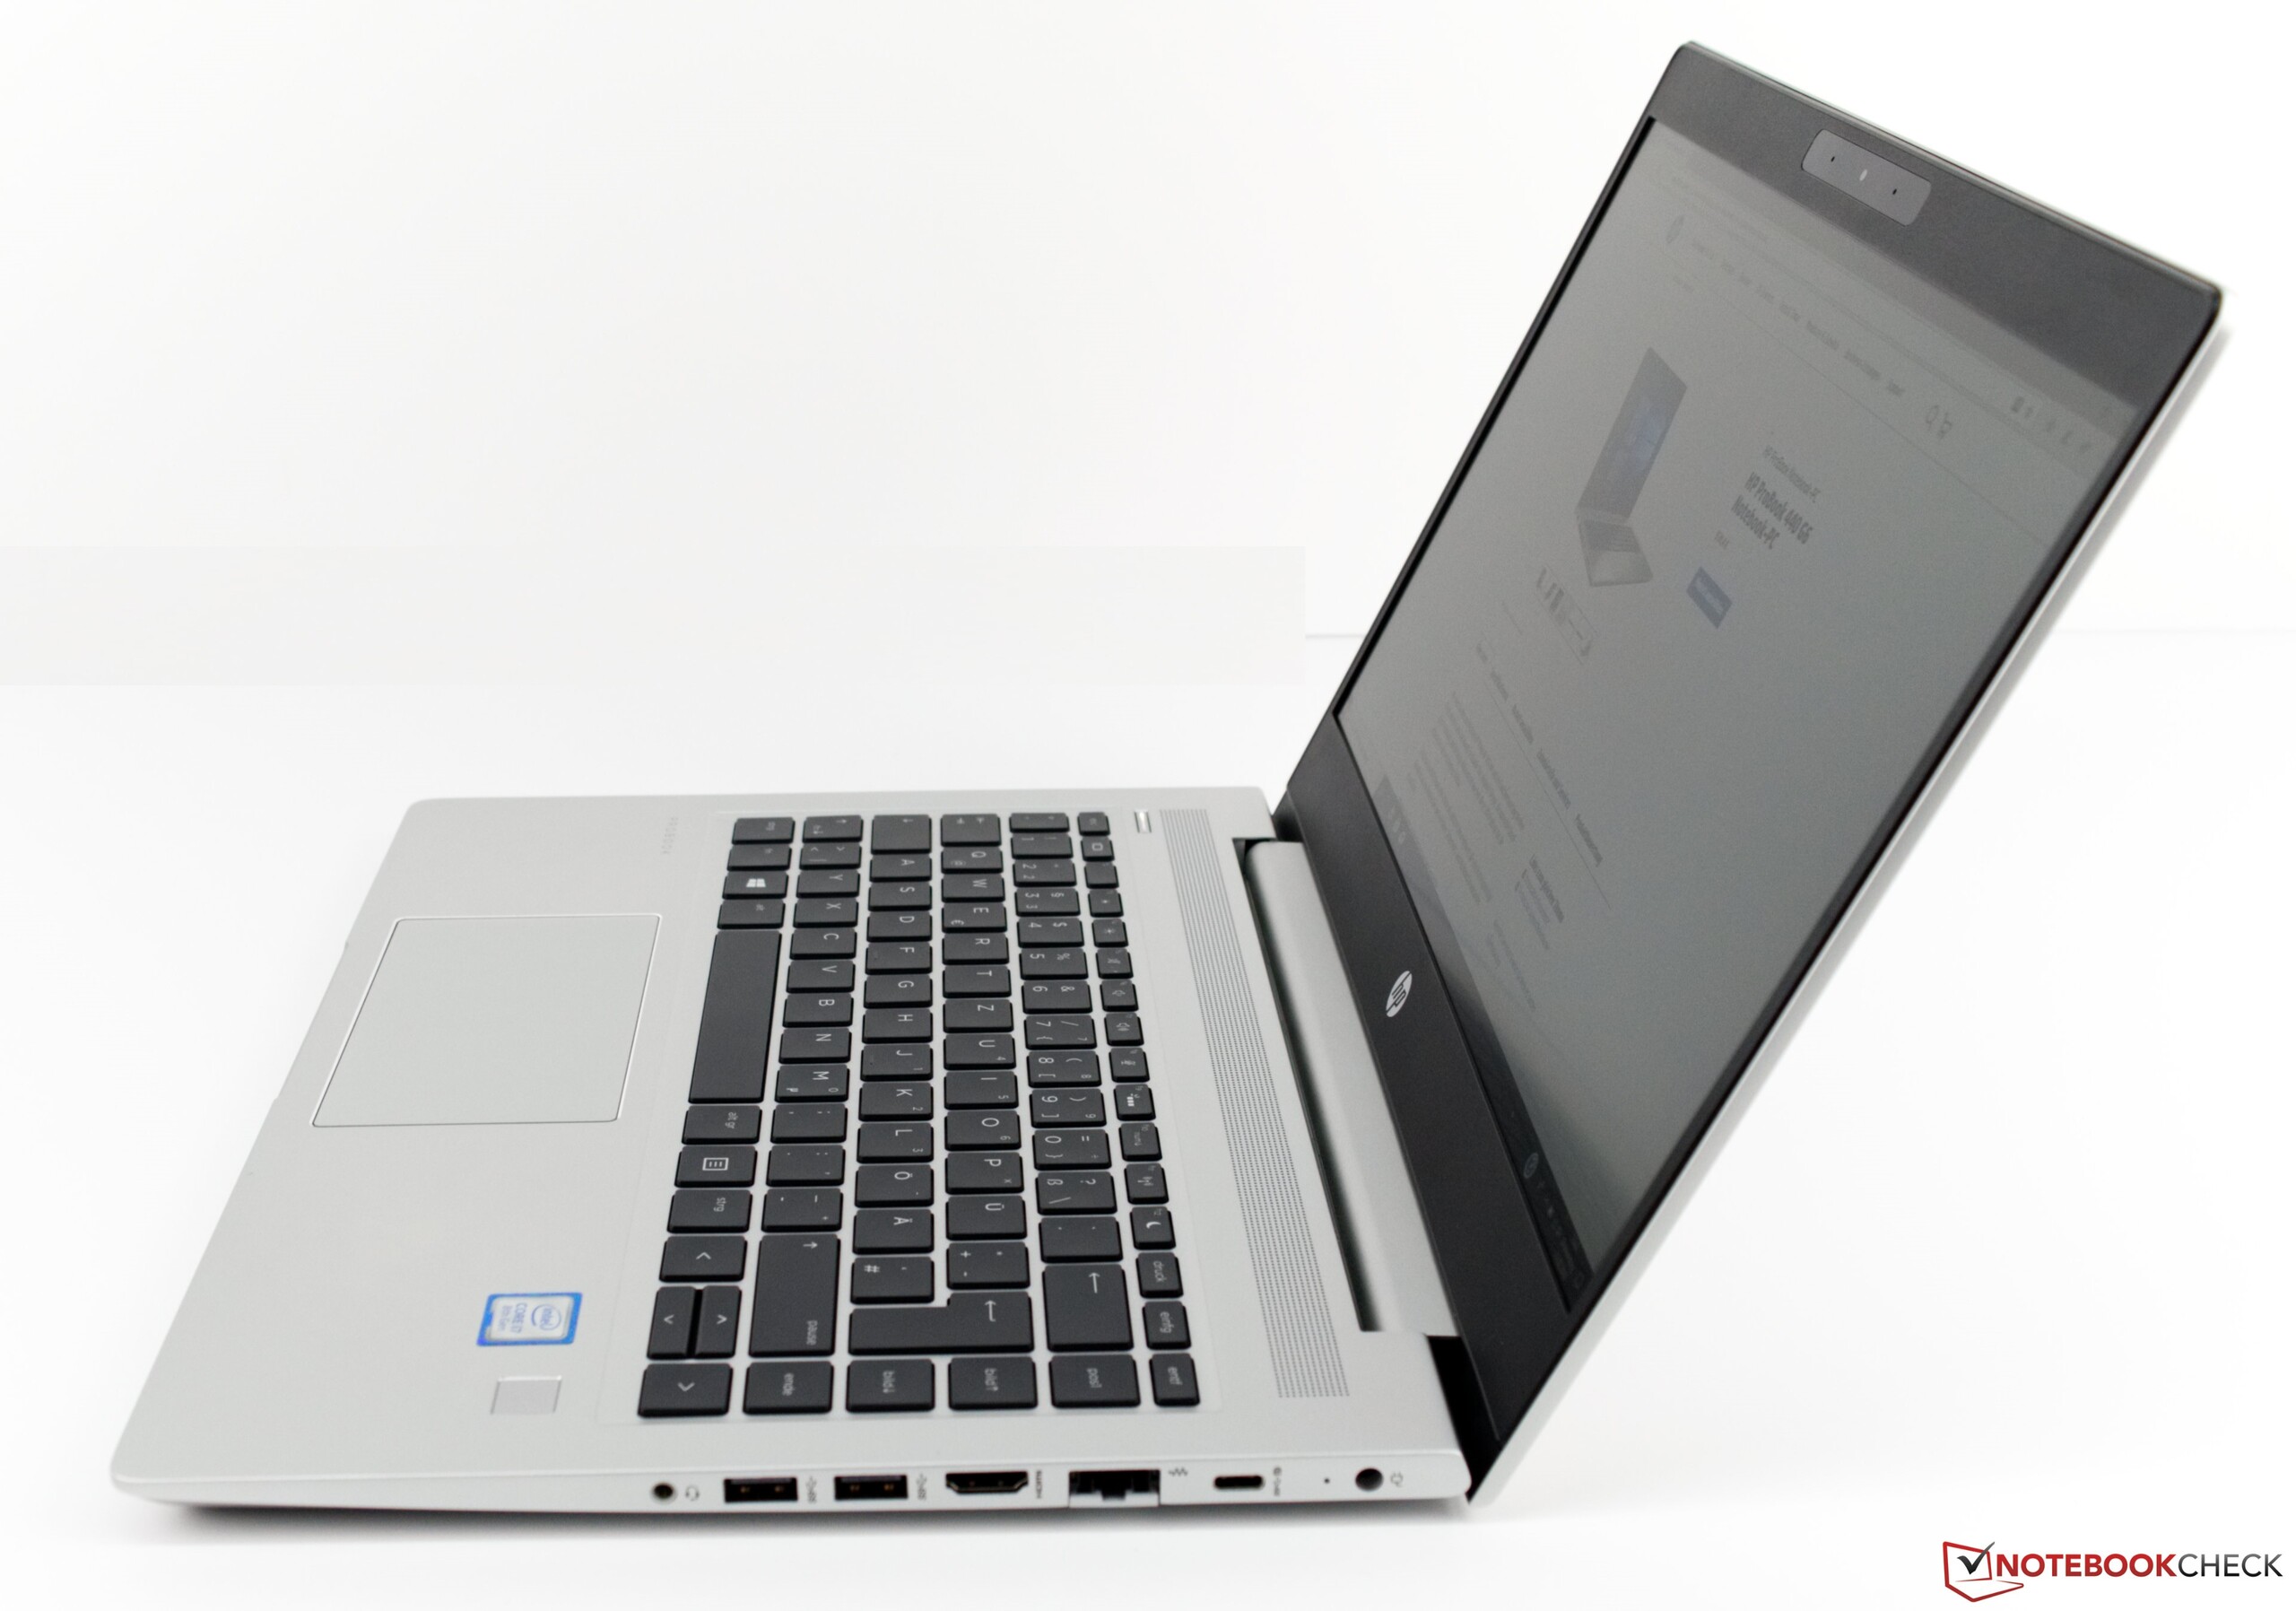
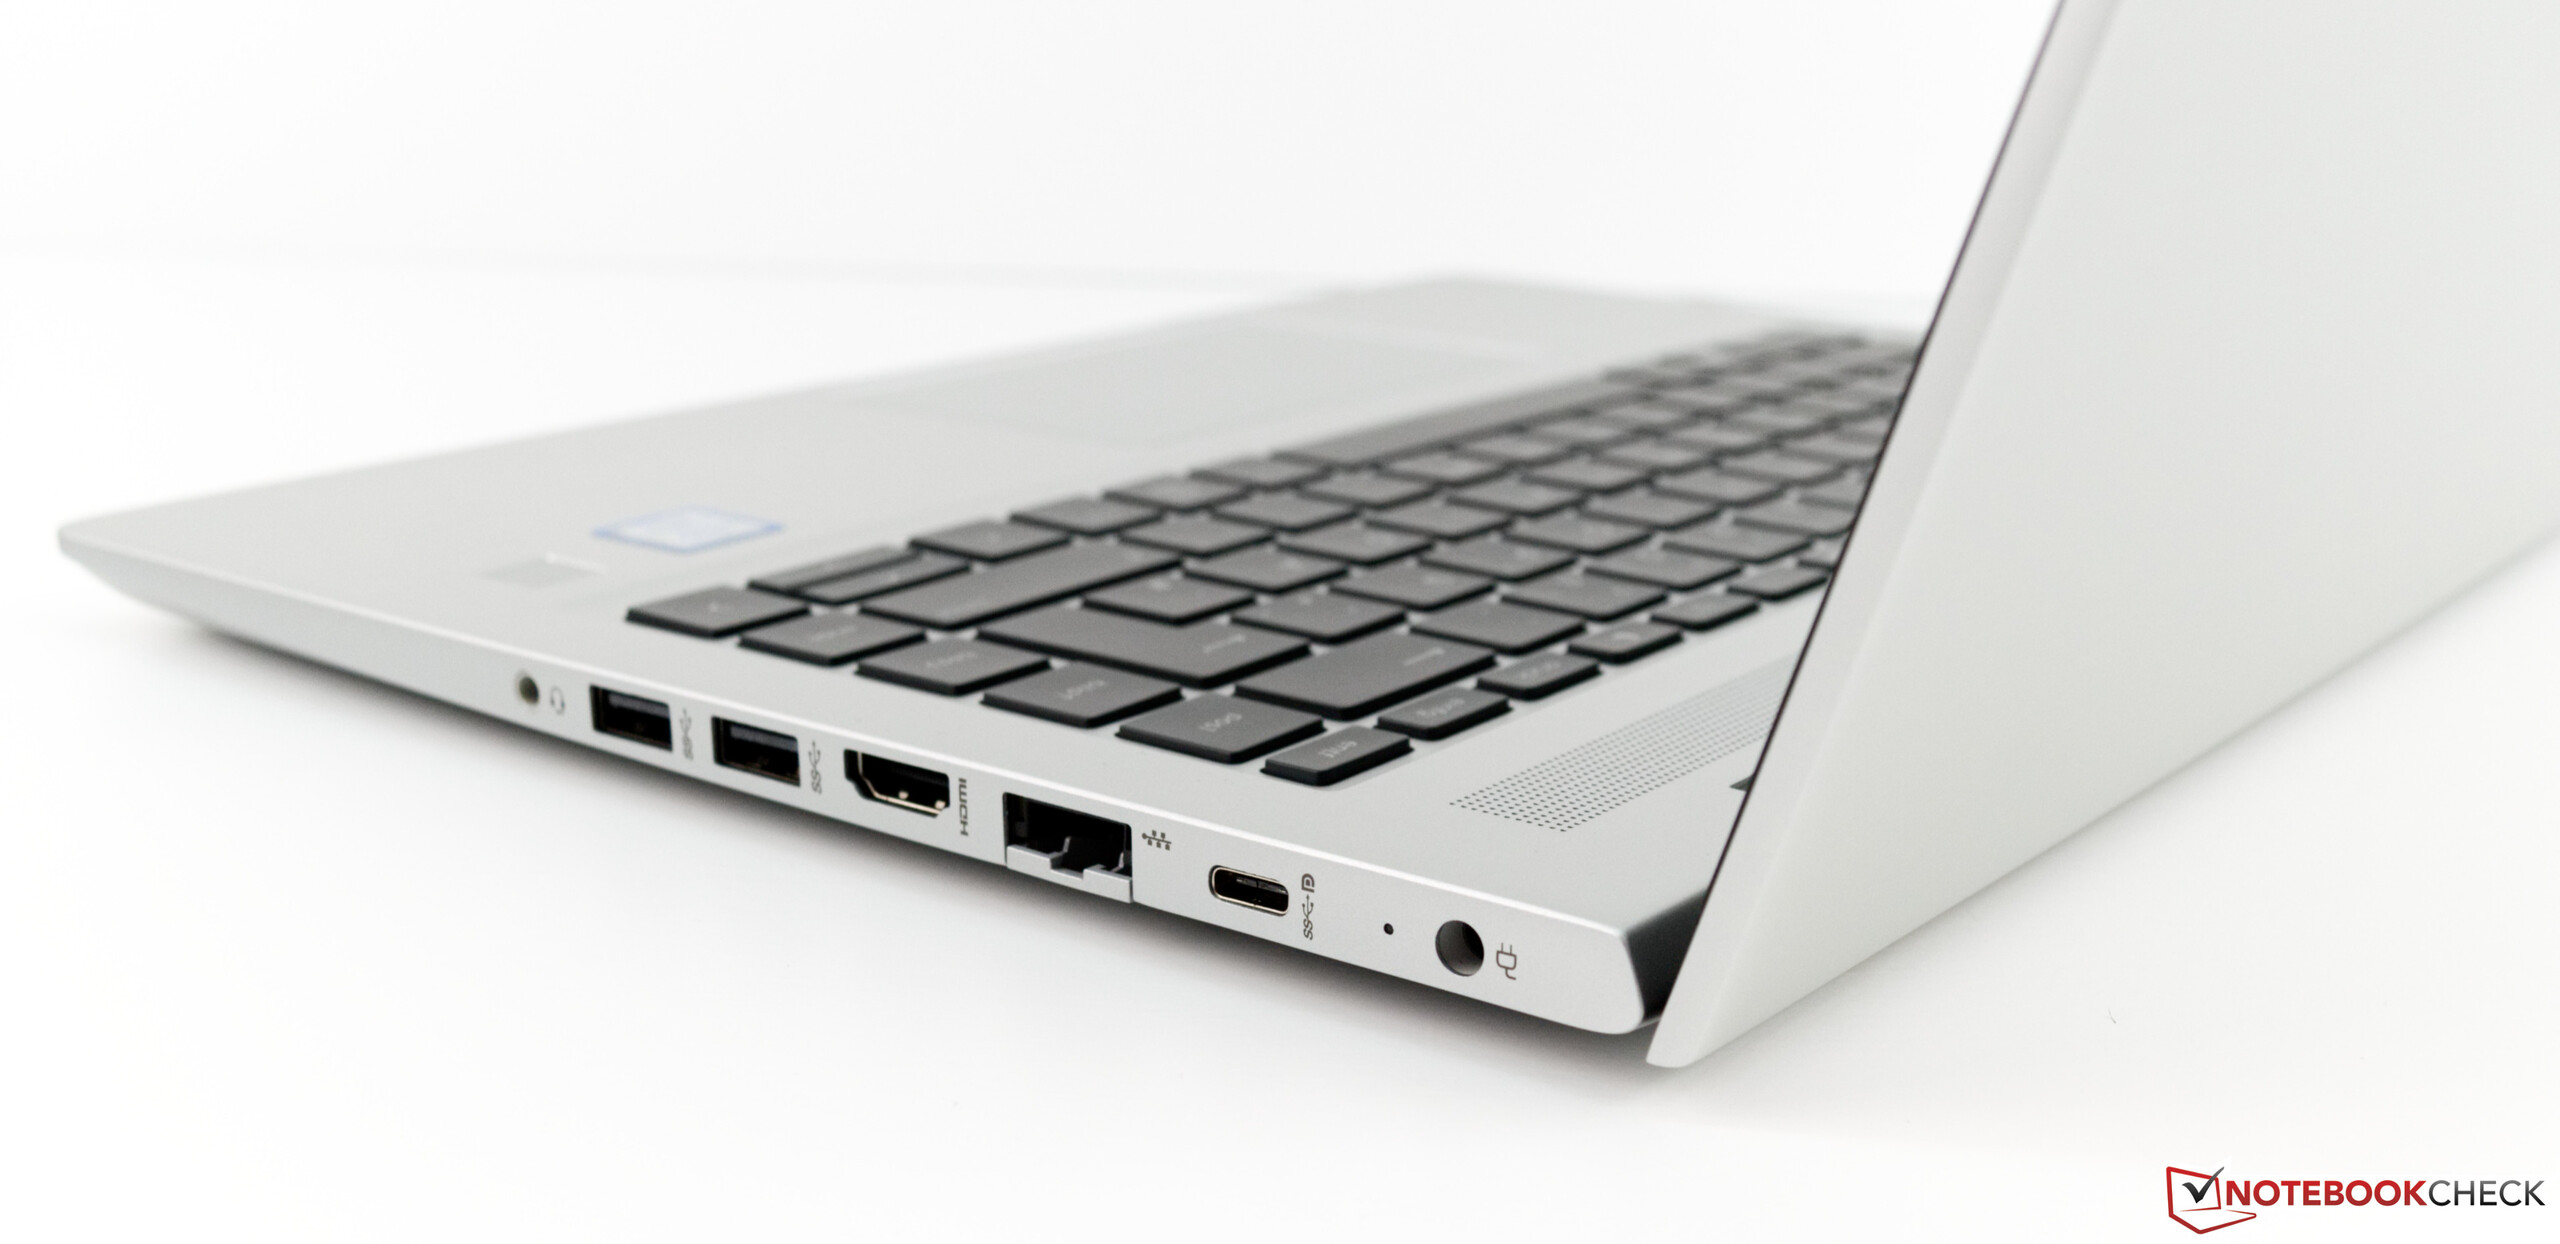
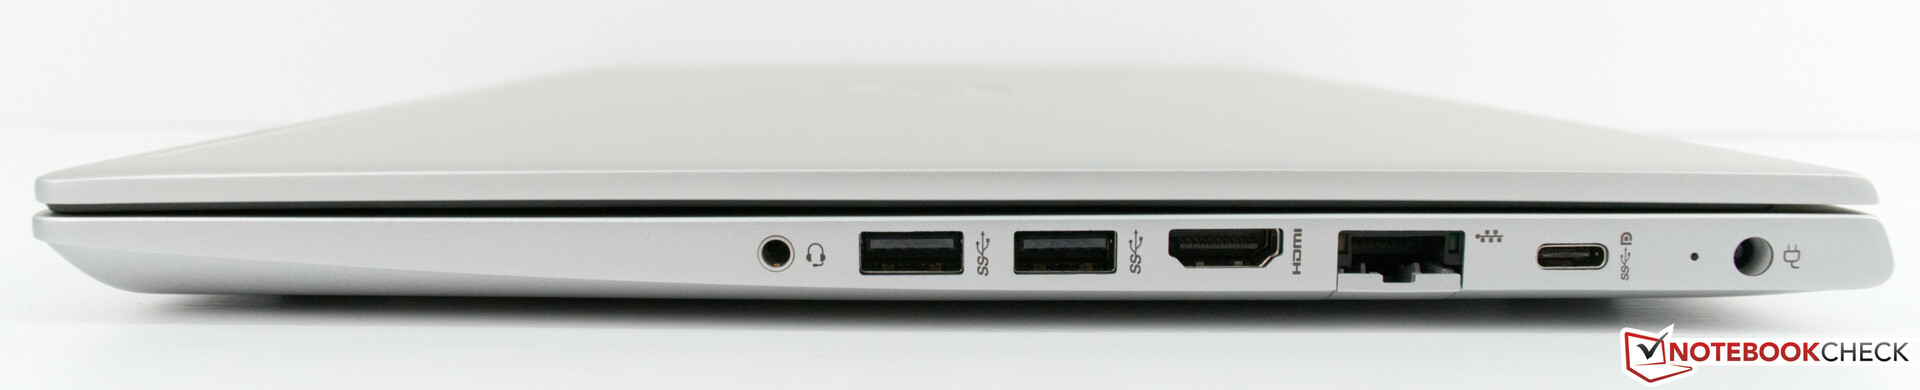
然而,一个成熟的商务笔记本还应该包括一个智能卡读卡器——惠普ProBook 440 G6没有。配备一个支持雷电3的Type-C端口可能也是一个好主意。
HP ProBook 440 G6-5TK01EA
- 03/08/2019 v6 (old)
Sebastian Bade
Price comparison

