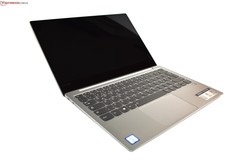
联想Yoga S730-13IWL(全高清,酷睿i7-8565U)笔记本电脑评测

| |||||||||||||||||||||||||
Brightness Distribution: 85 %
Center on Battery: 343 cd/m²
Contrast: 1039:1 (Black: 0.33 cd/m²)
ΔE ColorChecker Calman: 2.38 | ∀{0.5-29.43 Ø4.71}
ΔE Greyscale Calman: 3.01 | ∀{0.09-98 Ø4.96}
98% sRGB (Argyll 1.6.3 3D)
62% AdobeRGB 1998 (Argyll 1.6.3 3D)
67.8% AdobeRGB 1998 (Argyll 3D)
98.2% sRGB (Argyll 3D)
66.3% Display P3 (Argyll 3D)
Gamma: 2.44
CCT: 7198 K
| Lenovo Yoga S730-13IWL B133HAN05.1, , 1920x1080, 13.3" | Lenovo Ideapad 720S-13IKB LG Philips LGD04EF, , 1920x1080, 13.3" | Dell XPS 13 9370 FHD i5 SHP1484, , 1920x1080, 13.3" | HP Envy 13-ah0003ng M133NVF3 R0, , 1920x1080, 13.3" | Asus ZenBook S UX391U AUO B133HAN04.9, , 1920x1080, 13.3" | Apple MacBook Air 2018 APPA039, , 2560x1600, 13.3" | |
|---|---|---|---|---|---|---|
| Display | -10% | 2% | -17% | -5% | 1% | |
| Display P3 Coverage (%) | 66.3 | 64.3 -3% | 68.9 4% | 54.8 -17% | 64.4 -3% | 67.8 2% |
| sRGB Coverage (%) | 98.2 | 82.3 -16% | 96.6 -2% | 82.5 -16% | 90.5 -8% | 96.1 -2% |
| AdobeRGB 1998 Coverage (%) | 67.8 | 60.2 -11% | 69.6 3% | 56.6 -17% | 65.2 -4% | 69.8 3% |
| Response Times | 27% | -33% | 33% | 11% | 18% | |
| Response Time Grey 50% / Grey 80% * (ms) | 53 ? | 35 ? 34% | 62.4 ? -18% | 31 ? 42% | 44.8 ? 15% | 39.6 ? 25% |
| Response Time Black / White * (ms) | 31 ? | 25 ? 19% | 45.6 ? -47% | 24 ? 23% | 29.2 ? 6% | 28 ? 10% |
| PWM Frequency (Hz) | 131000 ? | 1008 ? | 1000 ? | 113600 ? | ||
| Screen | -46% | -8% | 8% | -37% | 15% | |
| Brightness middle (cd/m²) | 343 | 335 -2% | 428 25% | 289 -16% | 299 -13% | 320 -7% |
| Brightness (cd/m²) | 323 | 303 -6% | 405 25% | 310 -4% | 300 -7% | 315 -2% |
| Brightness Distribution (%) | 85 | 85 0% | 87 2% | 85 0% | 92 8% | 95 12% |
| Black Level * (cd/m²) | 0.33 | 0.46 -39% | 0.26 21% | 0.23 30% | 0.26 21% | 0.29 12% |
| Contrast (:1) | 1039 | 728 -30% | 1646 58% | 1257 21% | 1150 11% | 1103 6% |
| Colorchecker dE 2000 * | 2.38 | 5.09 -114% | 3.8 -60% | 1.64 31% | 5.6 -135% | 1.2 50% |
| Colorchecker dE 2000 max. * | 3.55 | 11.92 -236% | 7.2 -103% | 3.31 7% | 9.1 -156% | 3.2 10% |
| Greyscale dE 2000 * | 3.01 | 3.23 -7% | 4.4 -46% | 1.71 43% | 5.5 -83% | 0.8 73% |
| Gamma | 2.44 90% | 2.18 101% | 2.21 100% | 2.32 95% | 2.47 89% | 2.2 100% |
| CCT | 7198 90% | 6214 105% | 7067 92% | 6291 103% | 7533 86% | 6548 99% |
| Color Space (Percent of AdobeRGB 1998) (%) | 62 | 54 -13% | 62.8 1% | 52 -16% | 58.9 -5% | 62.1 0% |
| Color Space (Percent of sRGB) (%) | 98 | 82 -16% | 96.4 -2% | 82 -16% | 90.3 -8% | 96 -2% |
| Colorchecker dE 2000 calibrated * | 0.99 | 2.6 | 0.5 | |||
| Total Average (Program / Settings) | -10% /
-29% | -13% /
-9% | 8% /
6% | -10% /
-24% | 11% /
13% |
* ... smaller is better
Display Response Times
| ↔ Response Time Black to White | ||
|---|---|---|
| 31 ms ... rise ↗ and fall ↘ combined | ↗ 16 ms rise | 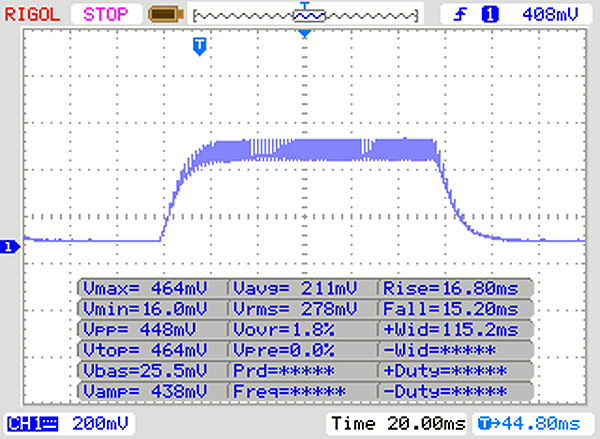 |
| ↘ 15 ms fall | ||
| The screen shows slow response rates in our tests and will be unsatisfactory for gamers. In comparison, all tested devices range from 0.1 (minimum) to 240 (maximum) ms. » 84 % of all devices are better. This means that the measured response time is worse than the average of all tested devices (19.8 ms). | ||
| ↔ Response Time 50% Grey to 80% Grey | ||
| 53 ms ... rise ↗ and fall ↘ combined | ↗ 27 ms rise | 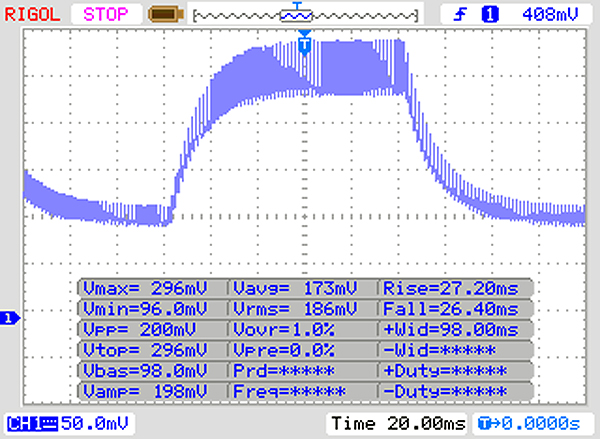 |
| ↘ 26 ms fall | ||
| The screen shows slow response rates in our tests and will be unsatisfactory for gamers. In comparison, all tested devices range from 0.165 (minimum) to 636 (maximum) ms. » 90 % of all devices are better. This means that the measured response time is worse than the average of all tested devices (30.9 ms). | ||
Screen Flickering / PWM (Pulse-Width Modulation)
| Screen flickering / PWM not detected | 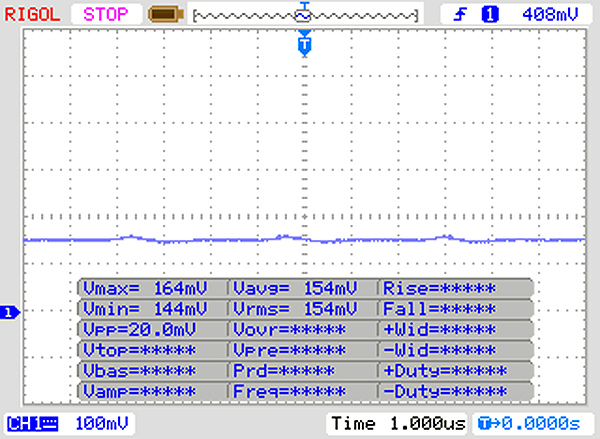 | ||
In comparison: 52 % of all tested devices do not use PWM to dim the display. If PWM was detected, an average of 7748 (minimum: 5 - maximum: 343500) Hz was measured. | |||
| PCMark 8 Home Score Accelerated v2 | 3096 points | |
| PCMark 8 Work Score Accelerated v2 | 4733 points | |
| PCMark 10 Score | 4022 points | |
Help | ||
| Lenovo Yoga S730-13IWL Samsung SSD PM981 MZVLB1T0HALR | Dell XPS 13 9370 FHD i5 Toshiba XG5 KXG50ZNV256G | HP Envy 13-ah0003ng SK Hynix BC501 HFM512GDJTNG | Asus ZenBook S UX391U Samsung PM961 NVMe MZVLW512HMJP | Lenovo Ideapad 720S-13IKB Samsung PM961 MZVLW256HEHP | Average Samsung SSD PM981 MZVLB1T0HALR | |
|---|---|---|---|---|---|---|
| CrystalDiskMark 5.2 / 6 | -0% | -30% | -12% | -5% | 16% | |
| Write 4K (MB/s) | 139.6 | 128.2 -8% | 112.9 -19% | 98.9 -29% | 115 -18% | 165.7 ? 19% |
| Read 4K (MB/s) | 36.97 | 48.09 30% | 38.69 5% | 38.33 4% | 41.36 12% | 44.6 ? 21% |
| Write Seq (MB/s) | 1490 | 1088 -27% | 654 -56% | 1414 -5% | 1208 -19% | 1982 ? 33% |
| Read Seq (MB/s) | 1321 | 1877 42% | 642 -51% | 1051 -20% | 1448 10% | 1764 ? 34% |
| Write 4K Q32T1 (MB/s) | 302.4 | 367.1 21% | 305.9 1% | 370.7 23% | 395 31% | 395 ? 31% |
| Read 4K Q32T1 (MB/s) | 375.4 | 411.9 10% | 351.6 -6% | 251.4 -33% | 373.9 0% | 434 ? 16% |
| Write Seq Q32T1 (MB/s) | 2391 | 1078 -55% | 869 -64% | 1606 -33% | 1217 -49% | 2351 ? -2% |
| Read Seq Q32T1 (MB/s) | 3272 | 2771 -15% | 1683 -49% | 3218 -2% | 3167 -3% | 3234 ? -1% |
| Write 4K Q8T8 (MB/s) | 1254 | 1408 ? 12% | ||||
| Read 4K Q8T8 (MB/s) | 1525 | 1449 ? -5% |

| 3DMark 11 Performance | 2025 points | |
| 3DMark Cloud Gate Standard Score | 6769 points | |
| 3DMark Fire Strike Score | 1073 points | |
| 3DMark Time Spy Score | 444 points | |
Help | ||
| low | med. | high | ultra | |
|---|---|---|---|---|
| BioShock Infinite (2013) | 81.7 | 41 | 34.1 | 10.38 |
| Rise of the Tomb Raider (2016) | 19 | |||
| Civilization 6 (2016) | 39.9 | 17.2 |
Noise level
| Idle |
| 30.6 / 30.6 / 30.6 dB(A) |
| Load |
| 37.5 / 34.5 dB(A) |
 | ||
30 dB silent 40 dB(A) audible 50 dB(A) loud |
||
min: | ||
(-) The maximum temperature on the upper side is 46.1 °C / 115 F, compared to the average of 34.3 °C / 94 F, ranging from 21.2 to 62.5 °C for the class Office.
(±) The bottom heats up to a maximum of 43.9 °C / 111 F, compared to the average of 36.8 °C / 98 F
(+) In idle usage, the average temperature for the upper side is 26.4 °C / 80 F, compared to the device average of 29.5 °C / 85 F.
(+) The palmrests and touchpad are cooler than skin temperature with a maximum of 30 °C / 86 F and are therefore cool to the touch.
(-) The average temperature of the palmrest area of similar devices was 27.5 °C / 81.5 F (-2.5 °C / -4.5 F).
Lenovo Yoga S730-13IWL audio analysis
(-) | not very loud speakers (68.9 dB)
Bass 100 - 315 Hz
(±) | reduced bass - on average 10.4% lower than median
(-) | bass is not linear (15.9% delta to prev. frequency)
Mids 400 - 2000 Hz
(±) | higher mids - on average 6.3% higher than median
(+) | mids are linear (4.7% delta to prev. frequency)
Highs 2 - 16 kHz
(+) | balanced highs - only 3.1% away from median
(+) | highs are linear (4.9% delta to prev. frequency)
Overall 100 - 16.000 Hz
(±) | linearity of overall sound is average (17.7% difference to median)
Compared to same class
» 29% of all tested devices in this class were better, 6% similar, 65% worse
» The best had a delta of 7%, average was 21%, worst was 53%
Compared to all devices tested
» 35% of all tested devices were better, 8% similar, 57% worse
» The best had a delta of 4%, average was 23%, worst was 134%
Apple MacBook Air 2018 audio analysis
(±) | speaker loudness is average but good (75 dB)
Bass 100 - 315 Hz
(±) | reduced bass - on average 8.1% lower than median
(±) | linearity of bass is average (10% delta to prev. frequency)
Mids 400 - 2000 Hz
(+) | balanced mids - only 2.9% away from median
(+) | mids are linear (5.6% delta to prev. frequency)
Highs 2 - 16 kHz
(+) | balanced highs - only 2.2% away from median
(+) | highs are linear (4.5% delta to prev. frequency)
Overall 100 - 16.000 Hz
(+) | overall sound is linear (12.3% difference to median)
Compared to same class
» 16% of all tested devices in this class were better, 5% similar, 79% worse
» The best had a delta of 5%, average was 18%, worst was 53%
Compared to all devices tested
» 10% of all tested devices were better, 3% similar, 87% worse
» The best had a delta of 4%, average was 23%, worst was 134%
Lenovo Yoga C930-13IKB audio analysis
(±) | speaker loudness is average but good (77.4 dB)
Bass 100 - 315 Hz
(+) | good bass - only 4.8% away from median
(±) | linearity of bass is average (8.8% delta to prev. frequency)
Mids 400 - 2000 Hz
(+) | balanced mids - only 3% away from median
(+) | mids are linear (4.6% delta to prev. frequency)
Highs 2 - 16 kHz
(±) | reduced highs - on average 5.1% lower than median
(+) | highs are linear (5.4% delta to prev. frequency)
Overall 100 - 16.000 Hz
(+) | overall sound is linear (14.1% difference to median)
Compared to same class
» 20% of all tested devices in this class were better, 4% similar, 76% worse
» The best had a delta of 6%, average was 20%, worst was 57%
Compared to all devices tested
» 17% of all tested devices were better, 4% similar, 79% worse
» The best had a delta of 4%, average was 23%, worst was 134%
| Off / Standby | |
| Idle | |
| Load |
|
Key:
min: | |
| Lenovo Yoga S730-13IWL i7-8565U, UHD Graphics 620, Samsung SSD PM981 MZVLB1T0HALR, IPS LED, 1920x1080, 13.3" | Dell XPS 13 9370 FHD i5 i5-8250U, UHD Graphics 620, Toshiba XG5 KXG50ZNV256G, IPS, 1920x1080, 13.3" | HP Envy 13-ah0003ng i5-8550U, GeForce MX150, SK Hynix BC501 HFM512GDJTNG, IPS, 1920x1080, 13.3" | Asus ZenBook S UX391U i5-8550U, UHD Graphics 620, Samsung PM961 NVMe MZVLW512HMJP, IPS, 1920x1080, 13.3" | Apple MacBook Air 2018 i5-8210Y, UHD Graphics 617, Apple SSD AP0256, IPS, 2560x1600, 13.3" | Lenovo Ideapad 720S-13IKB i5-8250U, UHD Graphics 620, Samsung PM961 MZVLW256HEHP, IPS, 1920x1080, 13.3" | Average Intel UHD Graphics 620 | Average of class Office | |
|---|---|---|---|---|---|---|---|---|
| Power Consumption | 10% | -16% | -0% | 21% | -3% | -3% | -18% | |
| Idle Minimum * (Watt) | 3 | 3.14 -5% | 5.3 -77% | 3.24 -8% | 2.2 27% | 3.9 -30% | 3.81 ? -27% | 4.26 ? -42% |
| Idle Average * (Watt) | 5.6 | 5.22 7% | 7.3 -30% | 6.1 -9% | 5.7 -2% | 7.7 -38% | 6.94 ? -24% | 7.31 ? -31% |
| Idle Maximum * (Watt) | 11 | 6 45% | 9.3 15% | 9.2 16% | 10.3 6% | 10.4 5% | 8.75 ? 20% | 8.55 ? 22% |
| Load Average * (Watt) | 38 | 38.5 -1% | 39 -3% | 38.8 -2% | 25.6 33% | 33.3 12% | 35 ? 8% | 43.8 ? -15% |
| Load Maximum * (Watt) | 53 | 50.4 5% | 46 13% | 52.6 1% | 30.6 42% | 34 36% | 47.5 ? 10% | 64.5 ? -22% |
* ... smaller is better
| Lenovo Yoga S730-13IWL i7-8565U, UHD Graphics 620, 42 Wh | Dell XPS 13 9370 FHD i5 i5-8250U, UHD Graphics 620, 52 Wh | HP Envy 13-ah0003ng i5-8550U, GeForce MX150, 53.2 Wh | Asus ZenBook S UX391U i5-8550U, UHD Graphics 620, 50 Wh | Apple MacBook Air 2018 i5-8210Y, UHD Graphics 617, 50.3 Wh | Lenovo Ideapad 720S-13IKB i5-8250U, UHD Graphics 620, 46 Wh | Average of class Office | |
|---|---|---|---|---|---|---|---|
| Battery runtime | 44% | -1% | 22% | 43% | 14% | 56% | |
| Reader / Idle (h) | 15.9 | 23.6 48% | 15.5 -3% | 22.3 40% | 17.3 9% | 24.5 ? 54% | |
| H.264 (h) | 8.9 | 13.9 56% | 6.3 -29% | 10.4 17% | 12.3 38% | 15.5 ? 74% | |
| WiFi v1.3 (h) | 6.9 | 10.7 55% | 8 16% | 8.2 19% | 11.1 61% | 10.1 46% | 13.2 ? 91% |
| Load (h) | 1.7 | 2 18% | 1.9 12% | 1.9 12% | 2.2 29% | 1.5 -12% | 1.808 ? 6% |
Pros
Cons
“联想在Yoga S730-13IWL上做出了太多妥协,导致它落后于联想拼命想要超越的超极本竞品。”
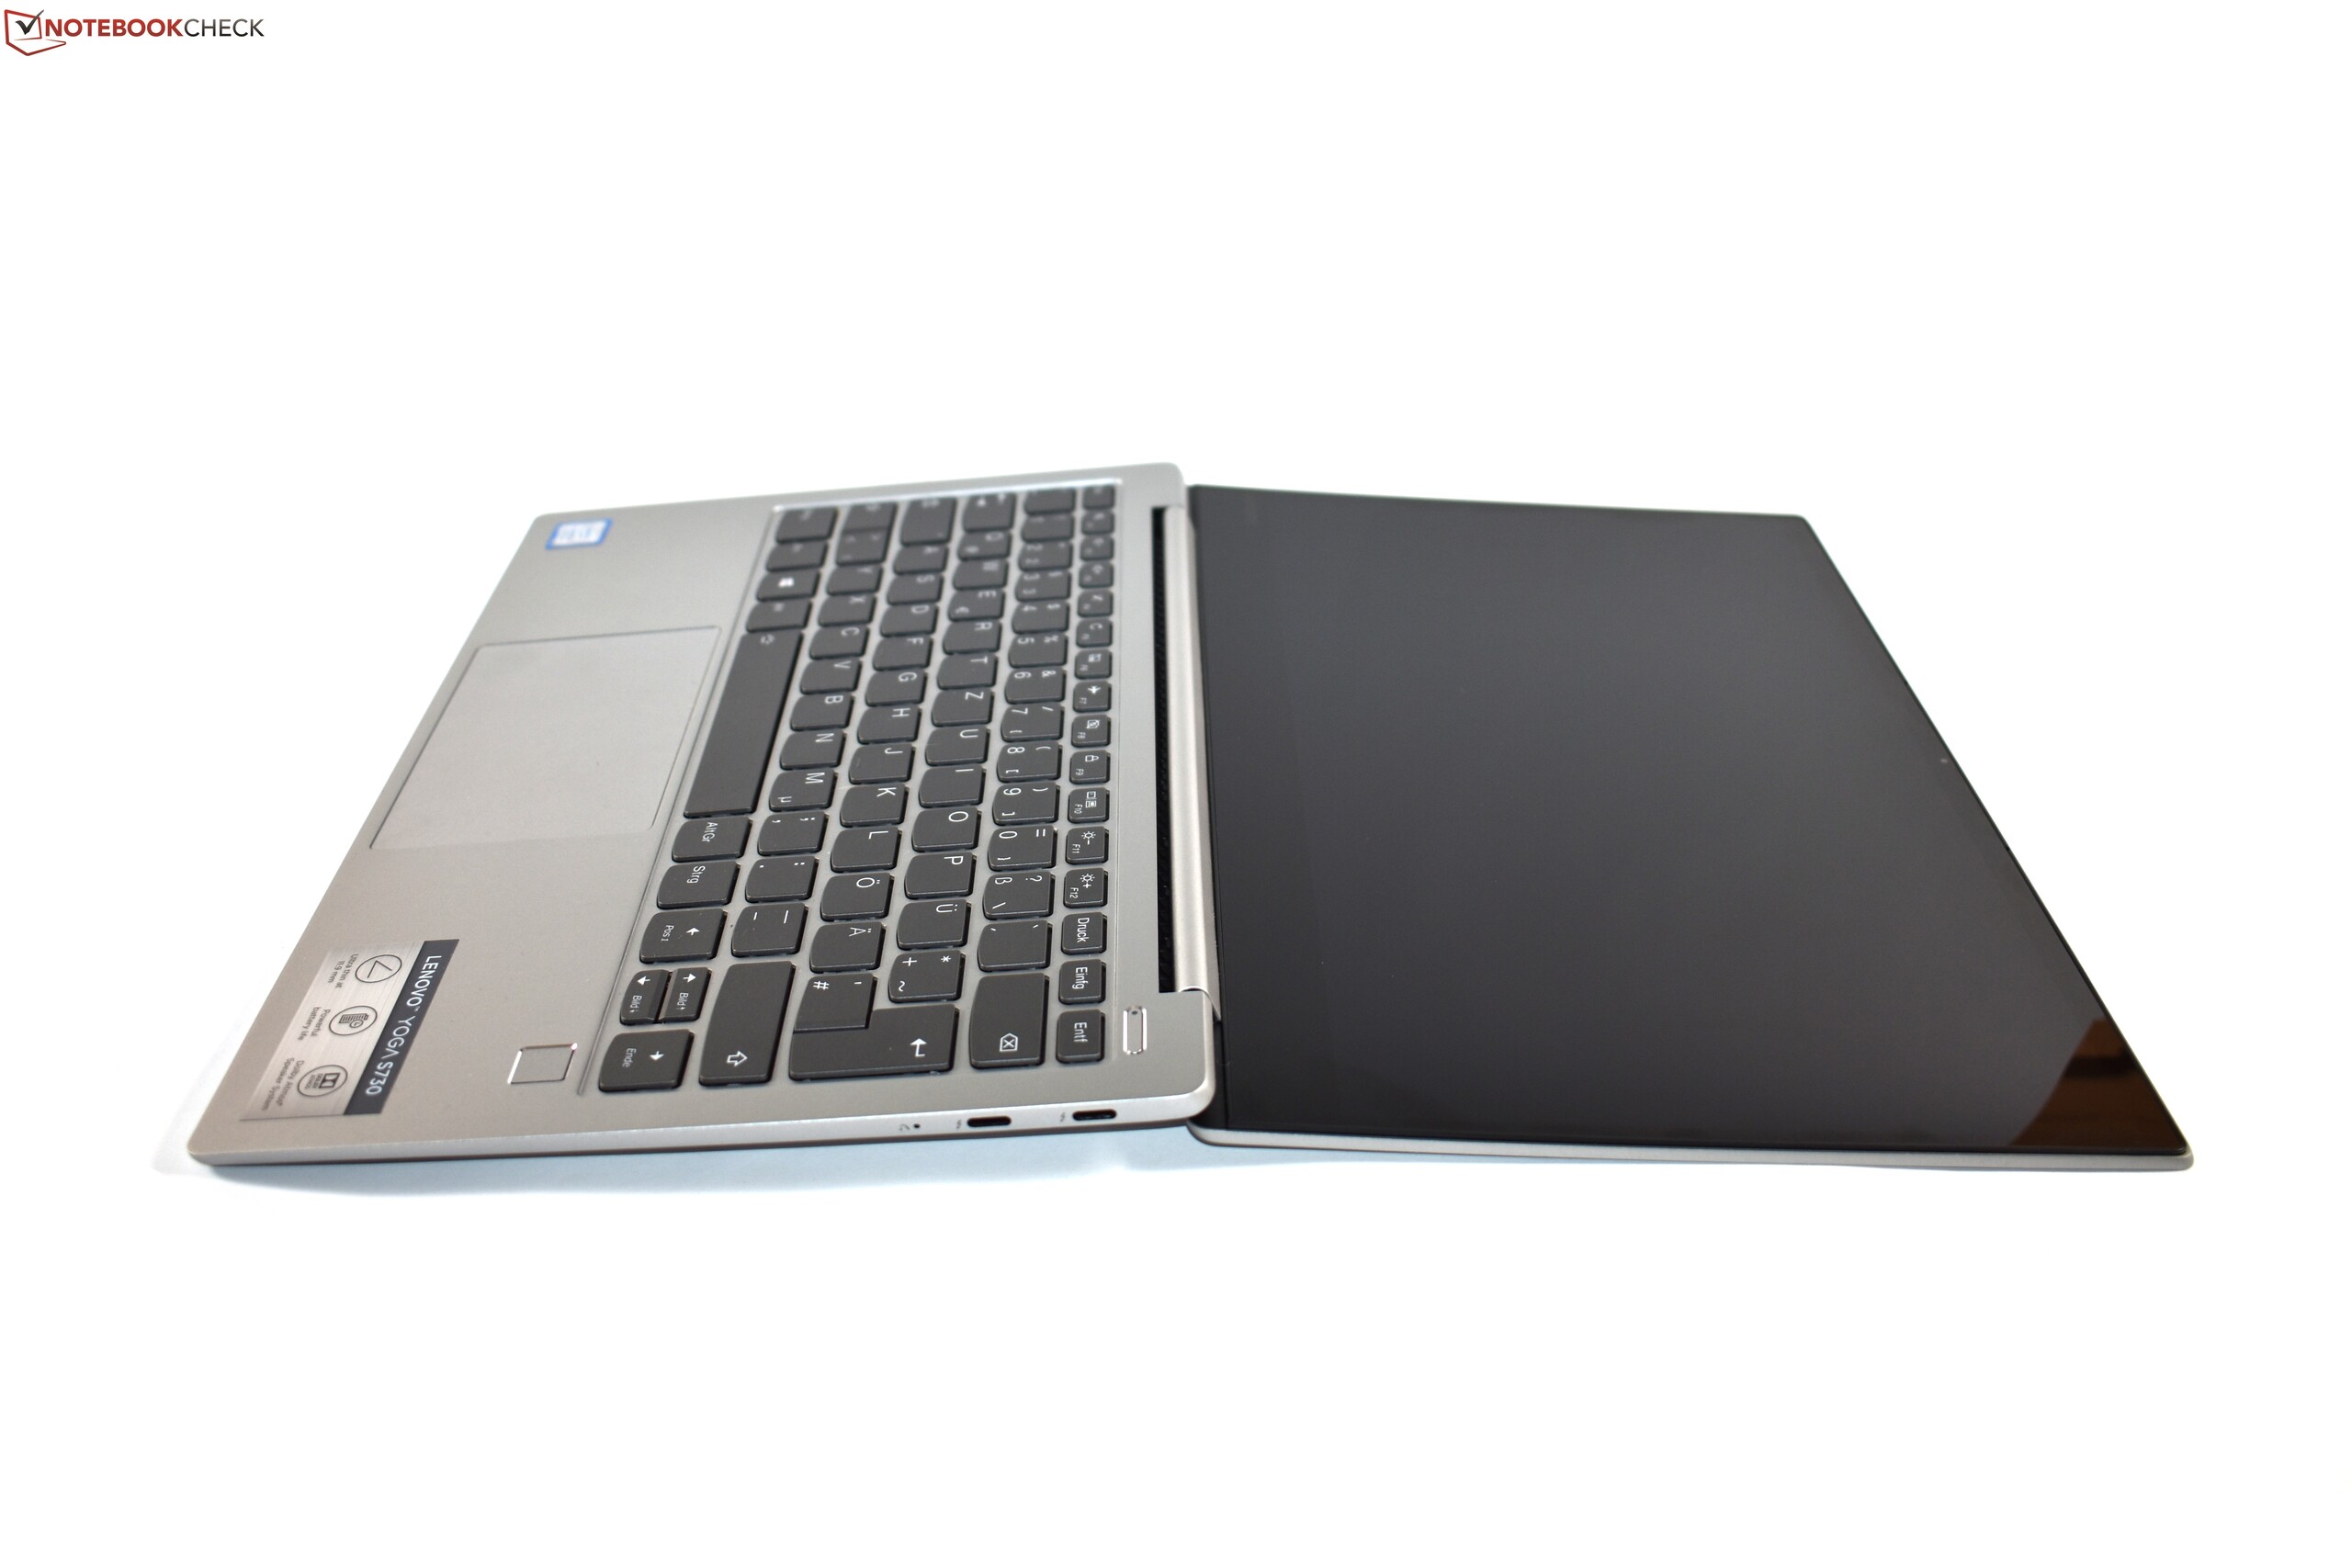
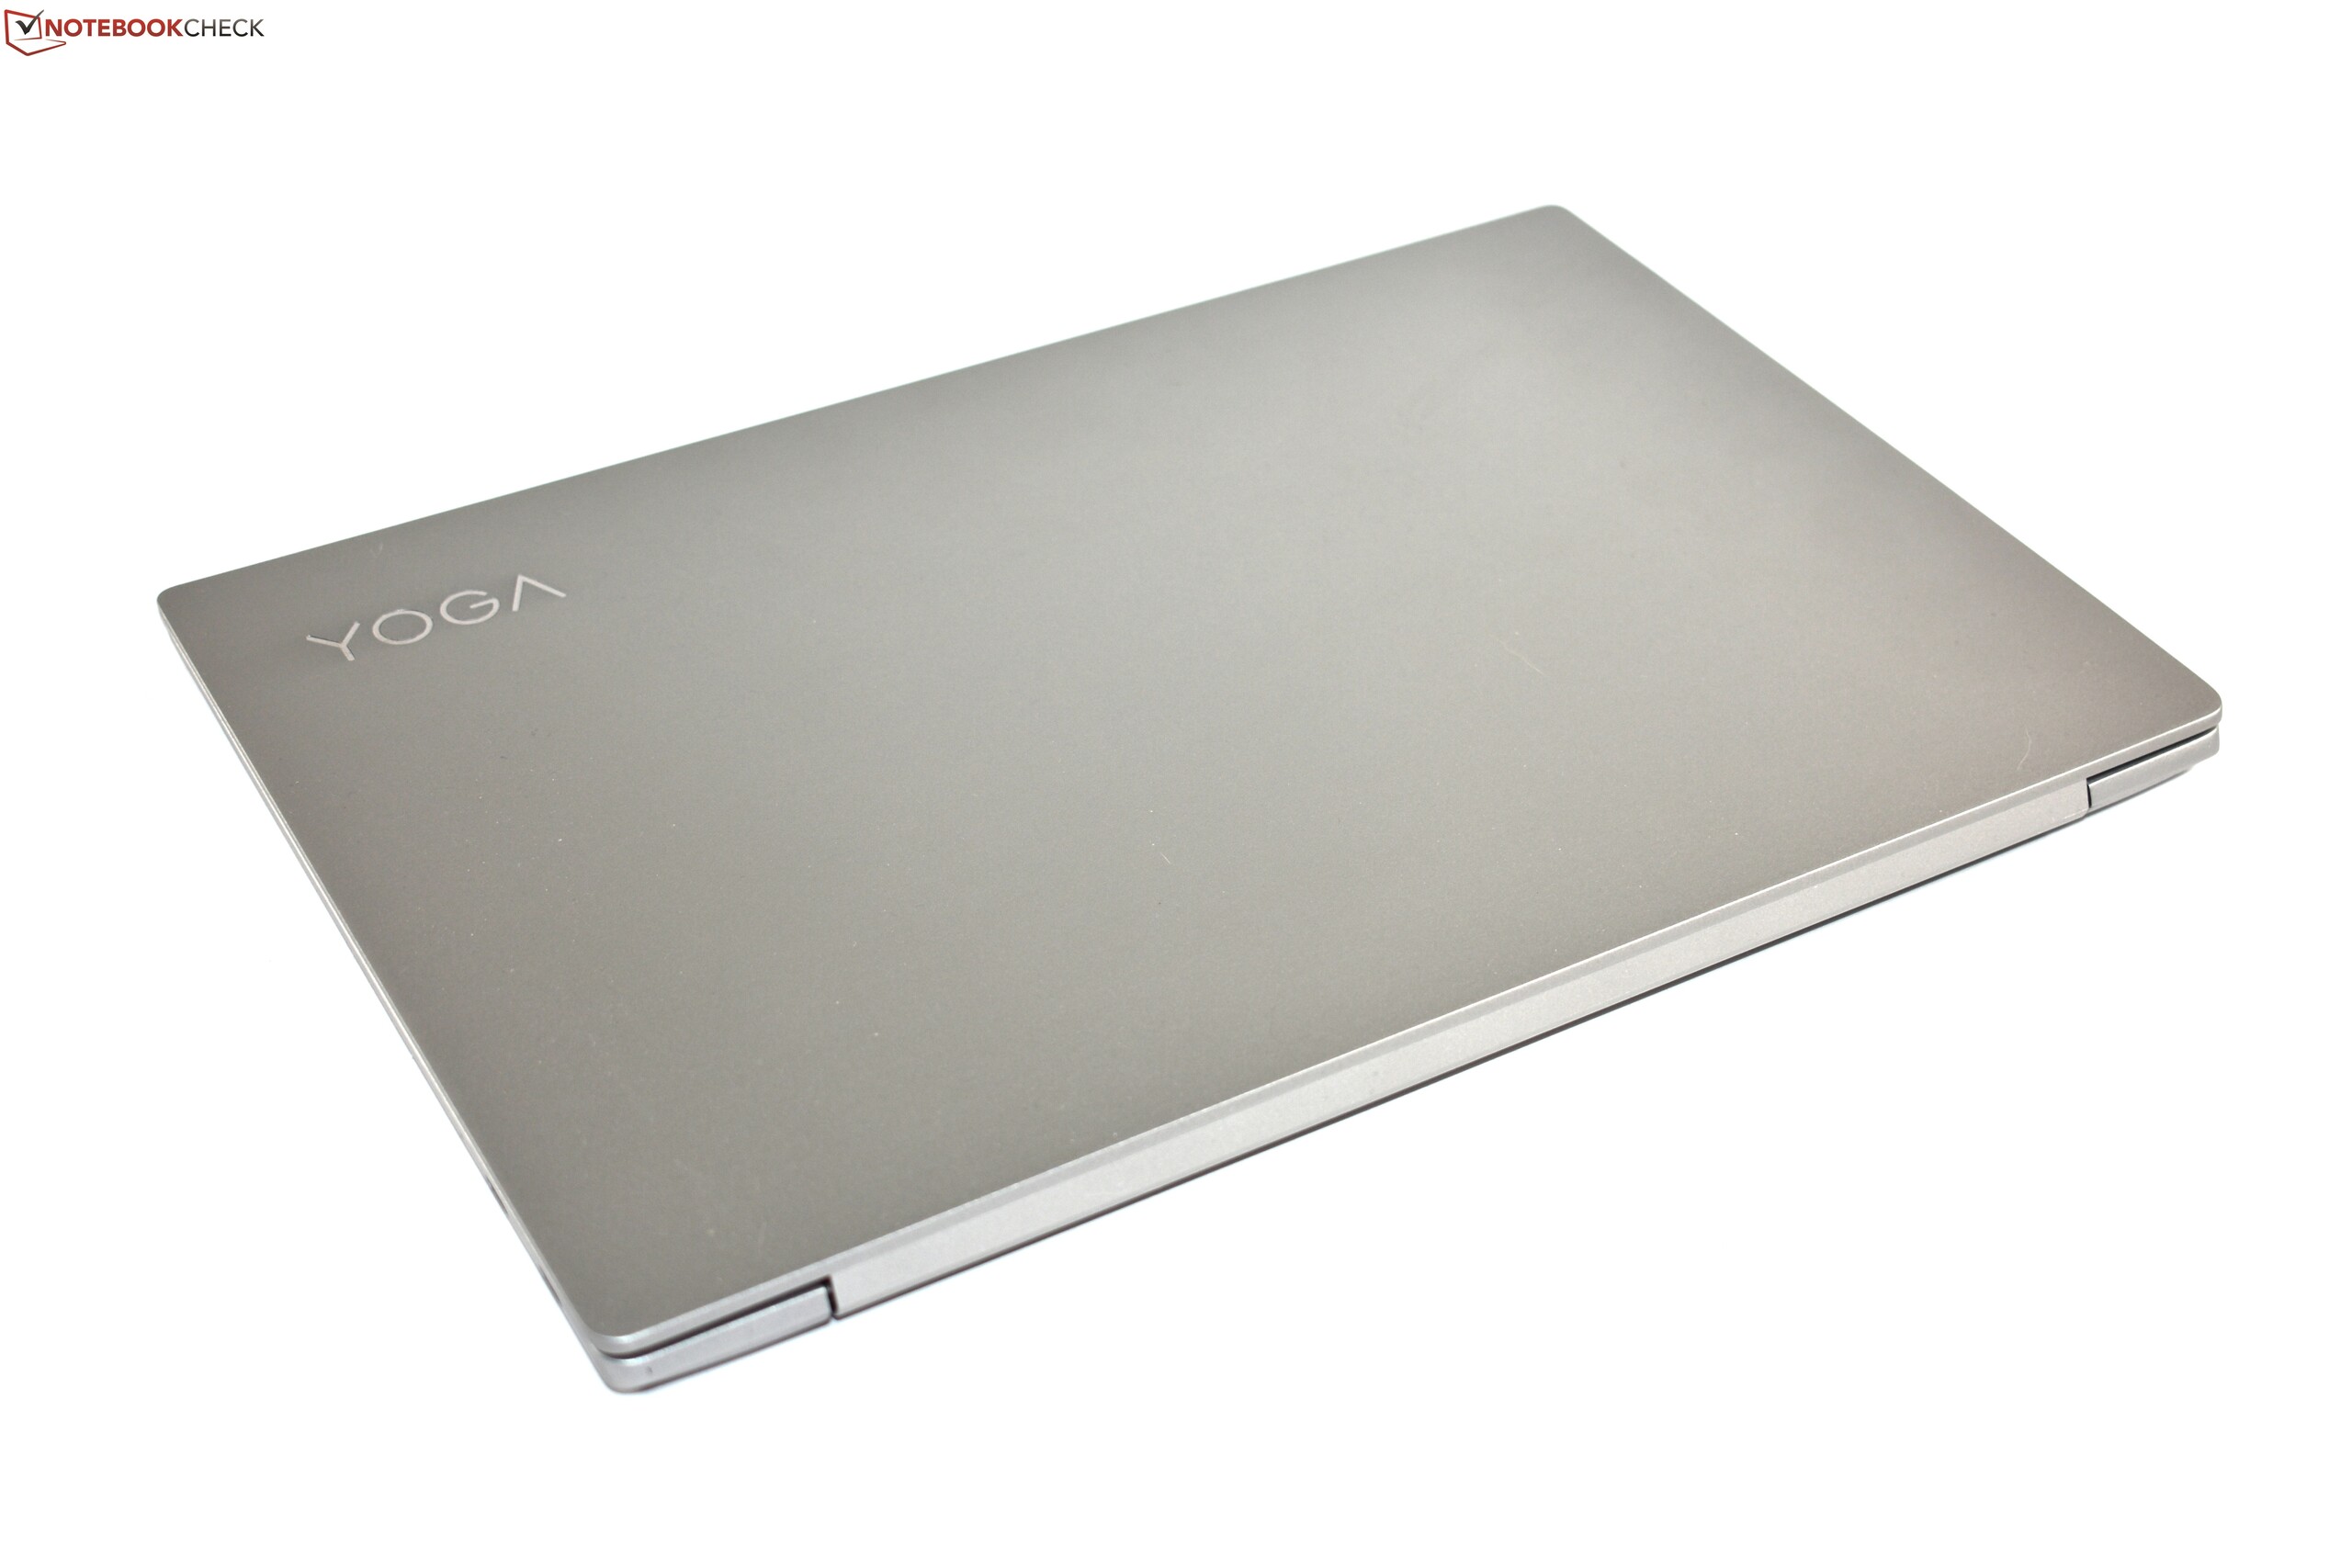
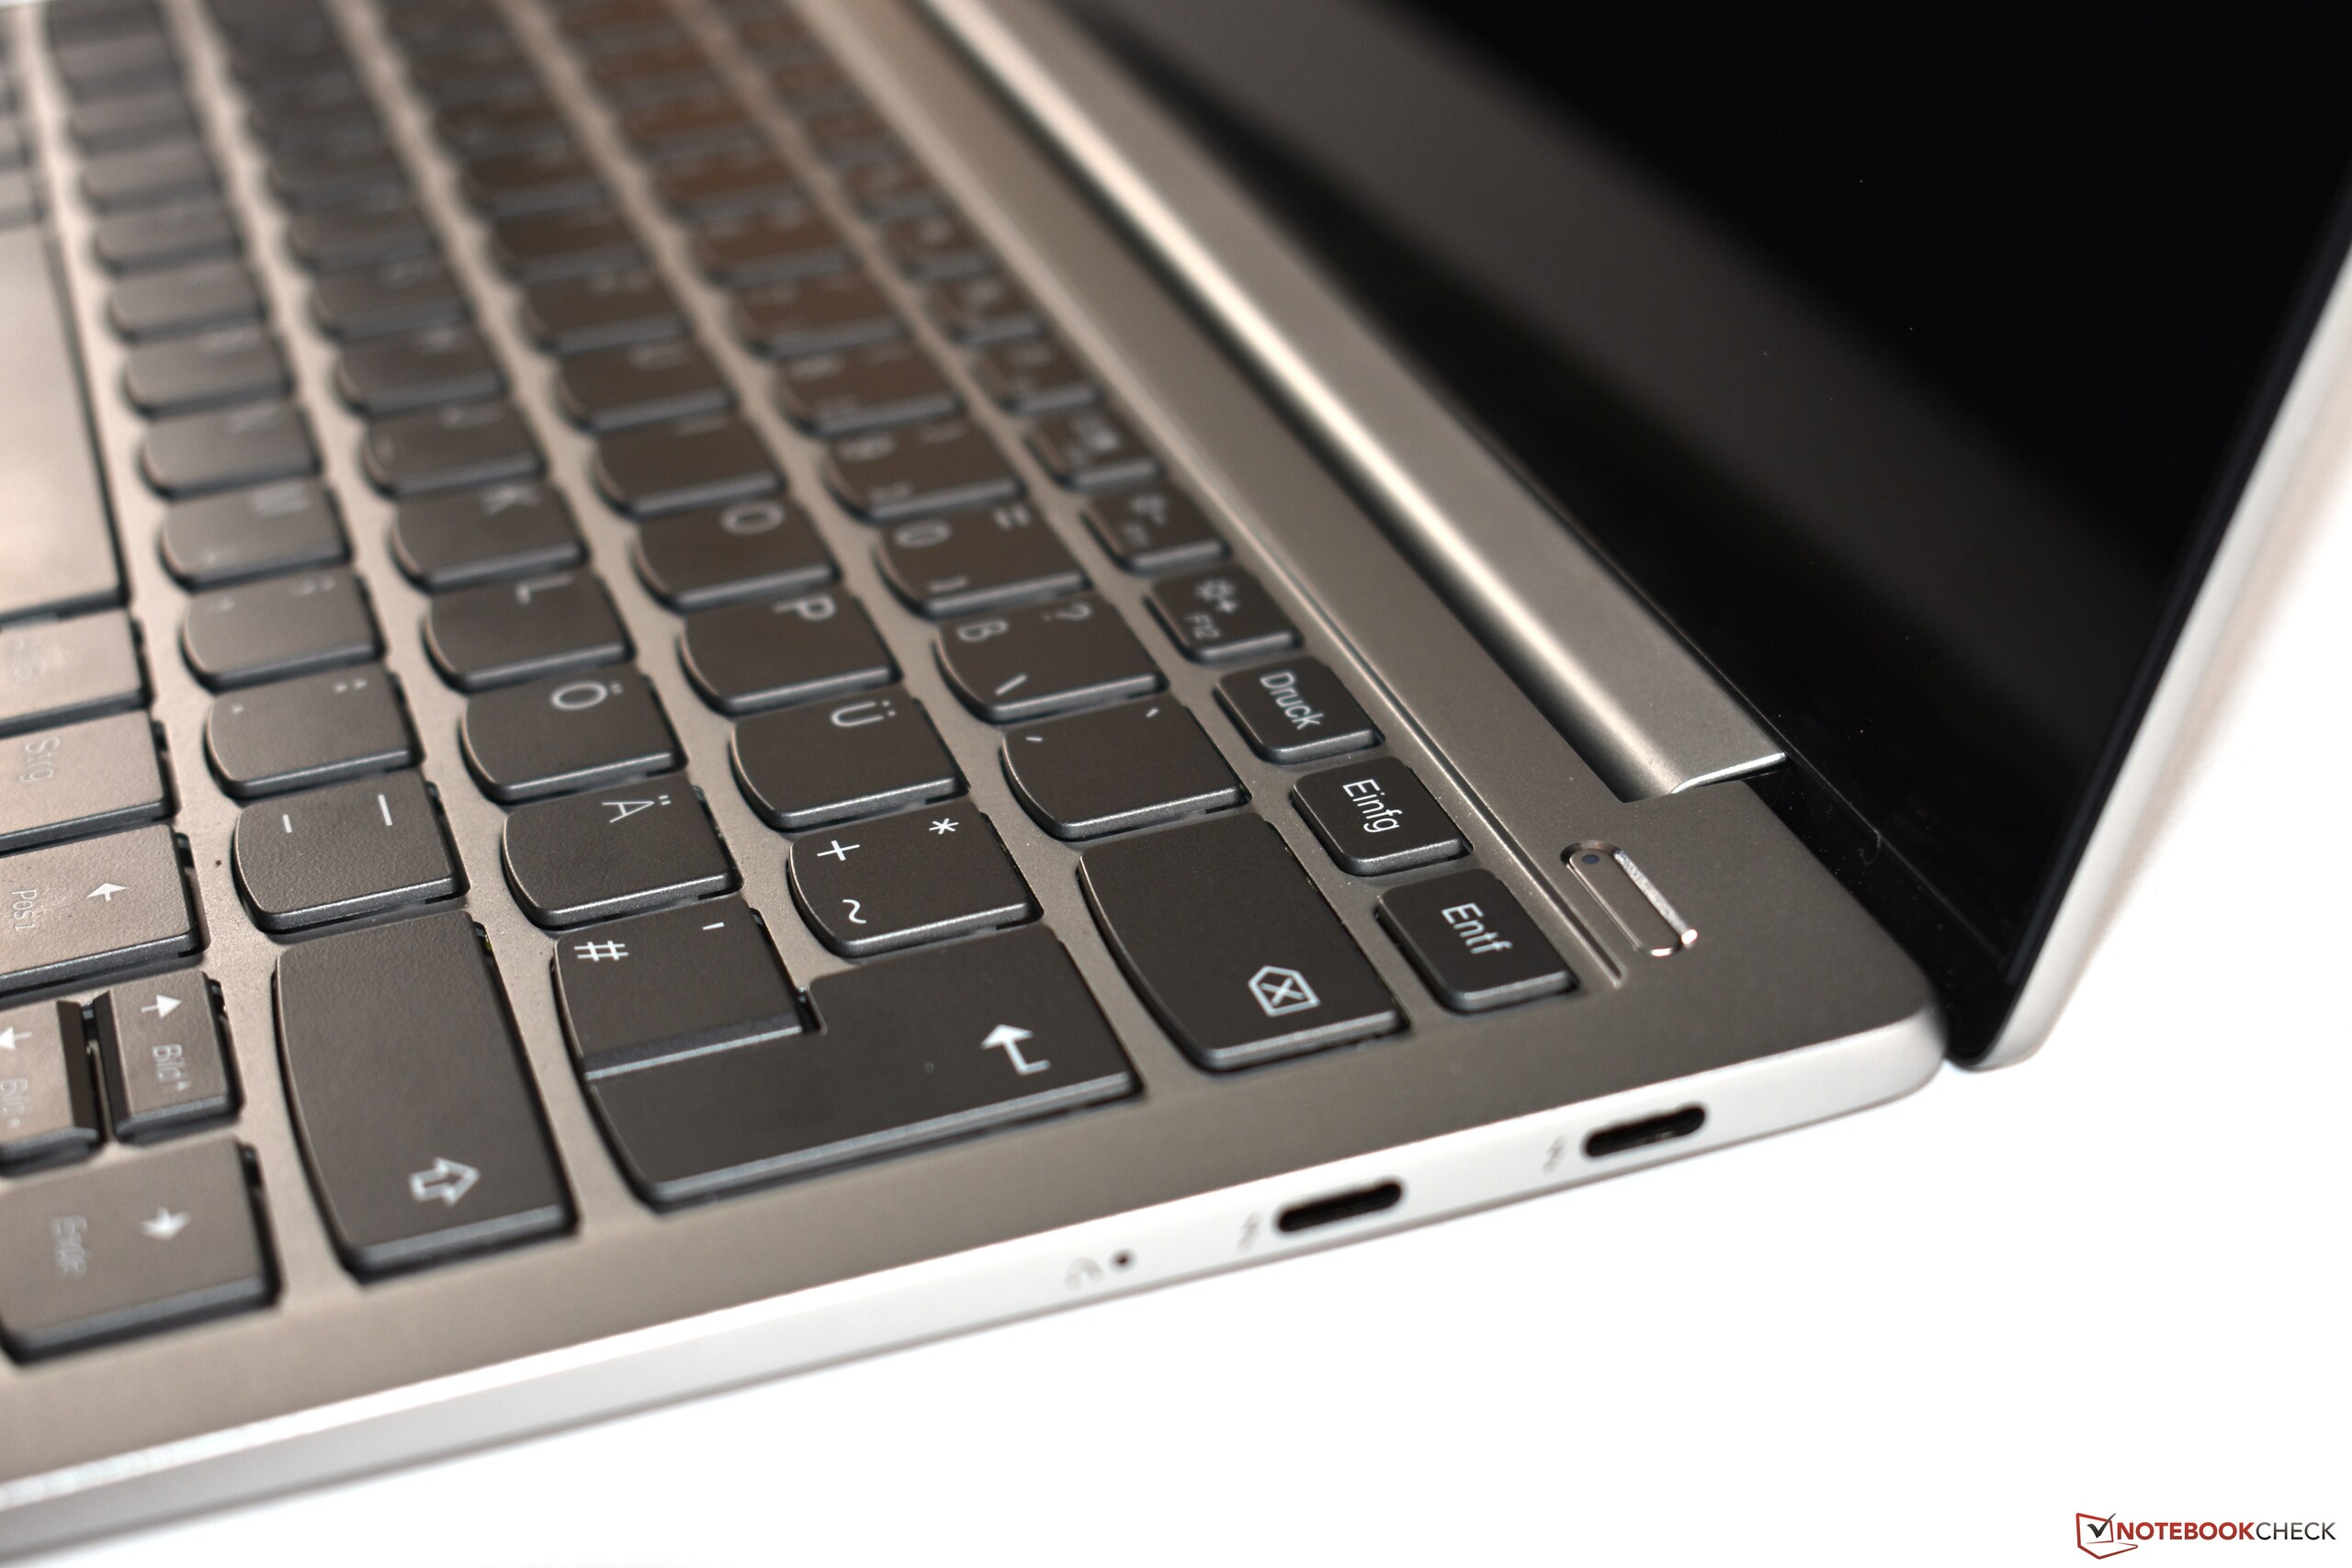
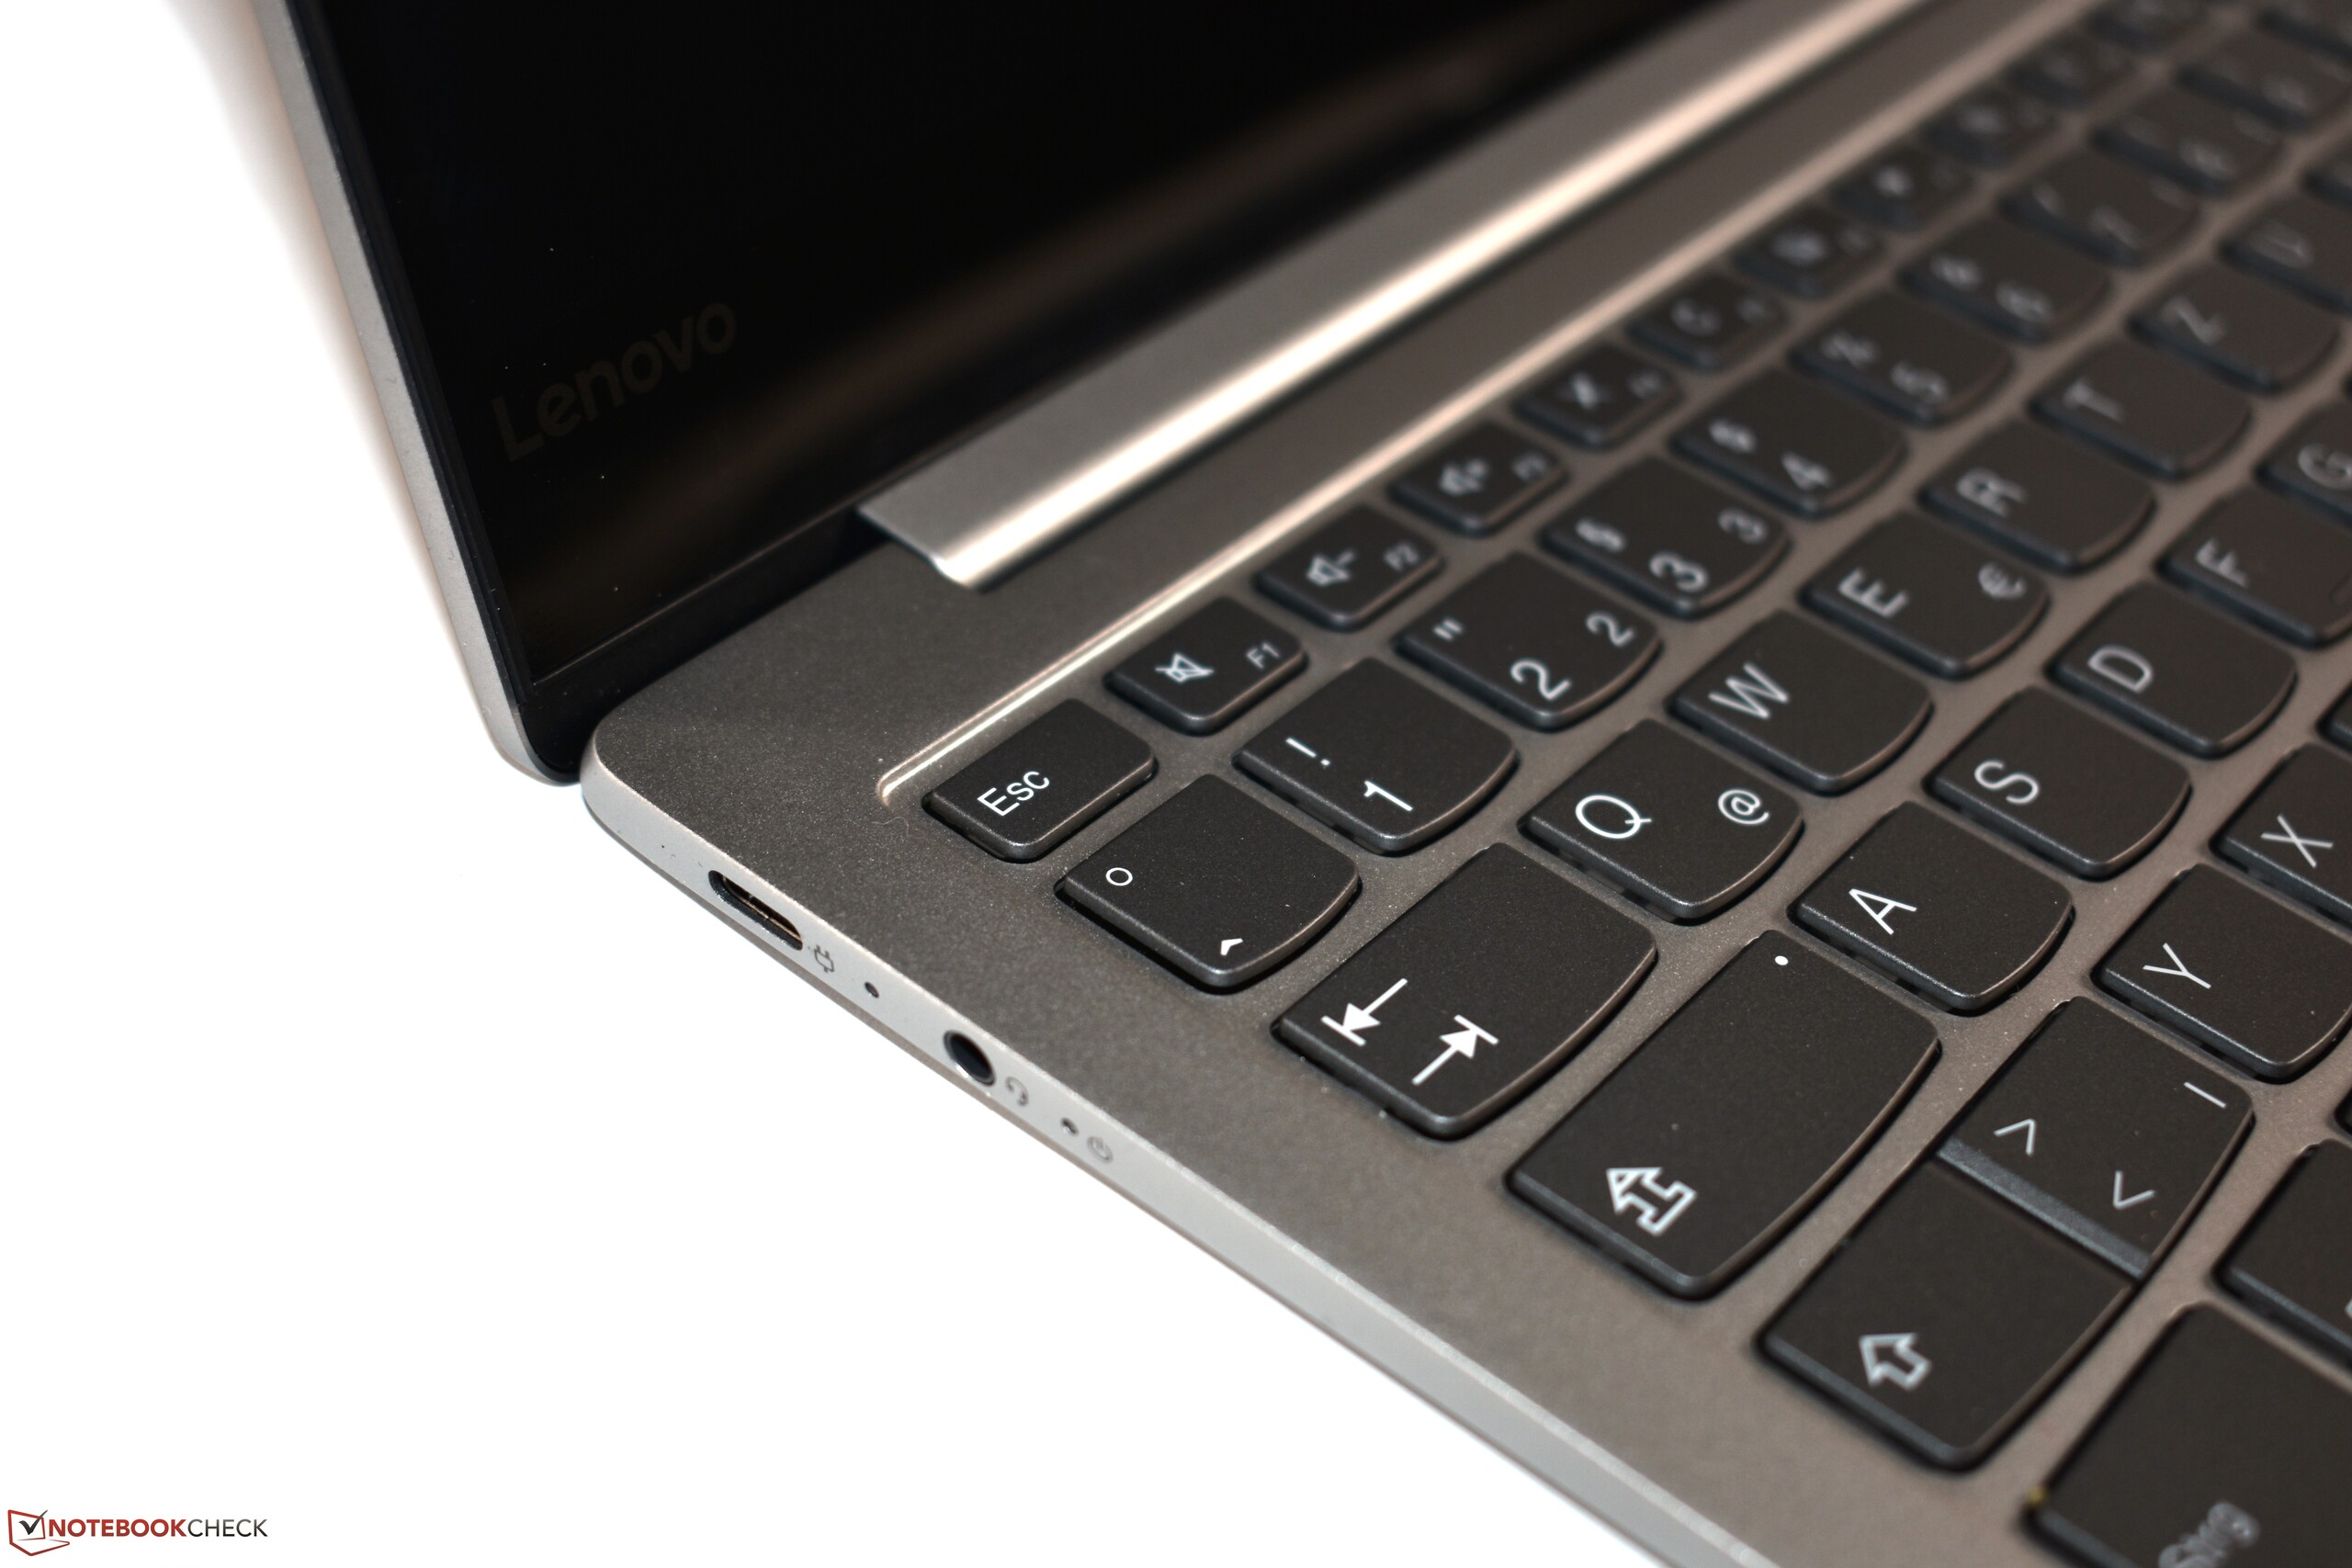
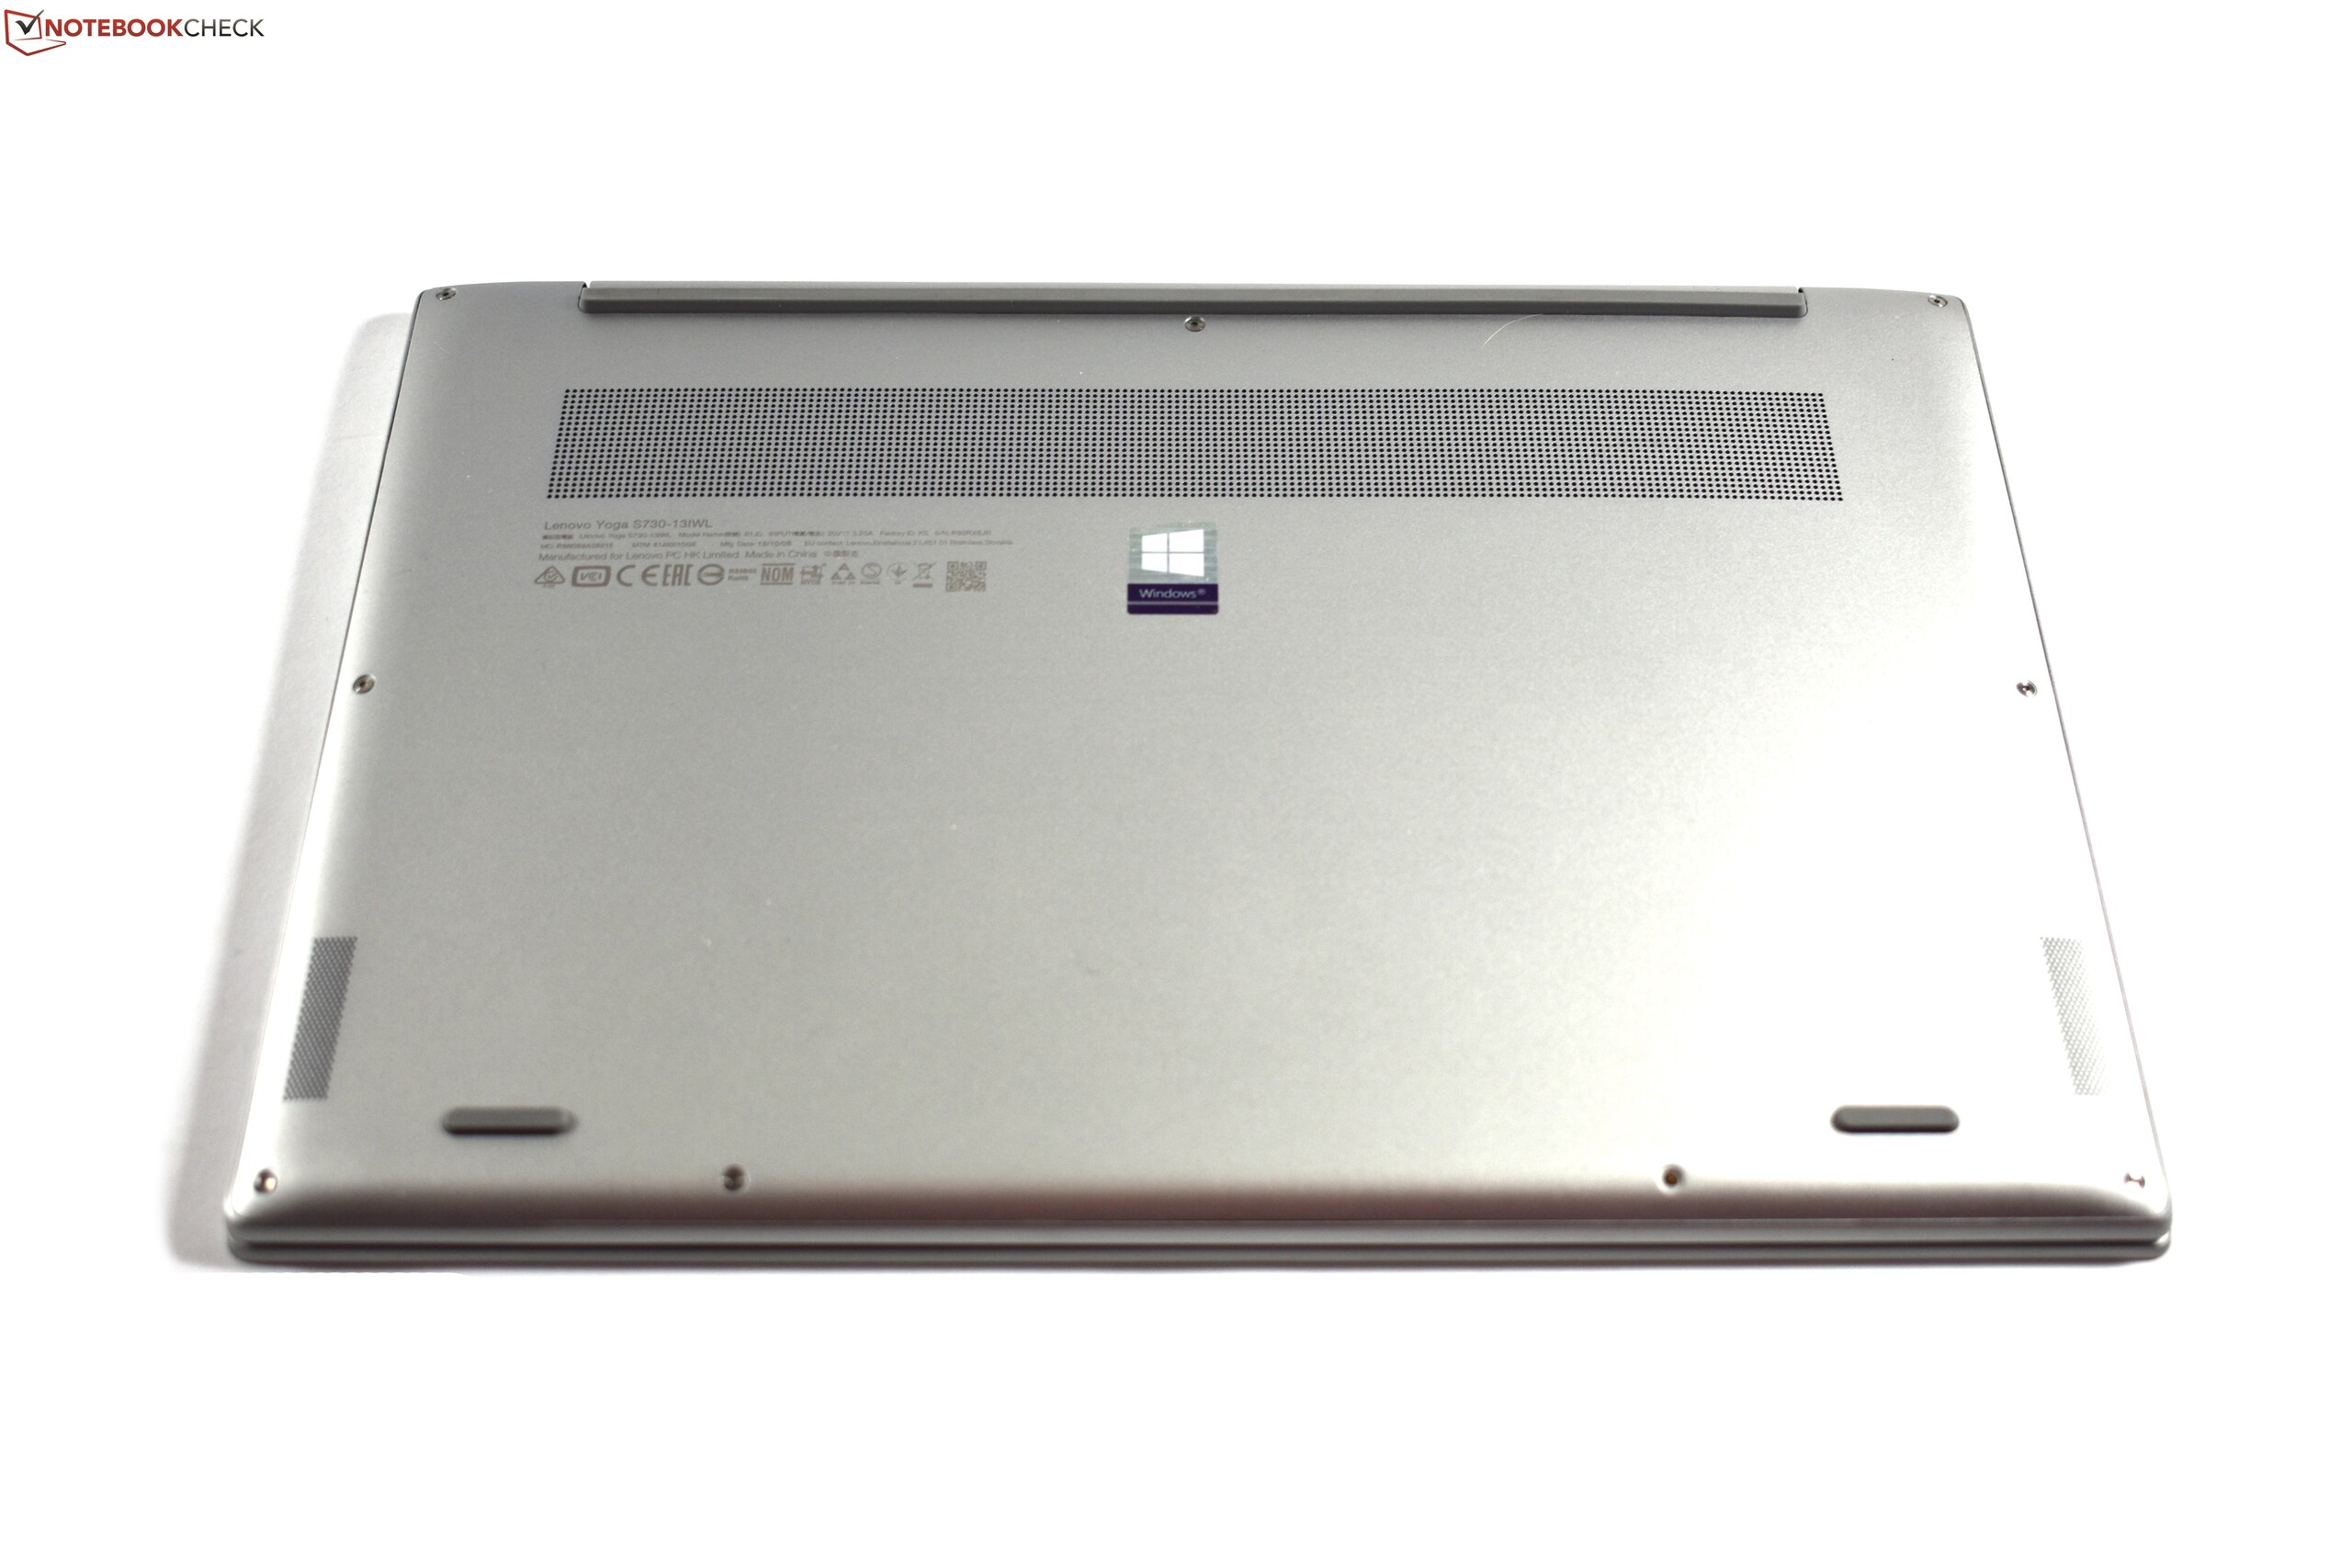
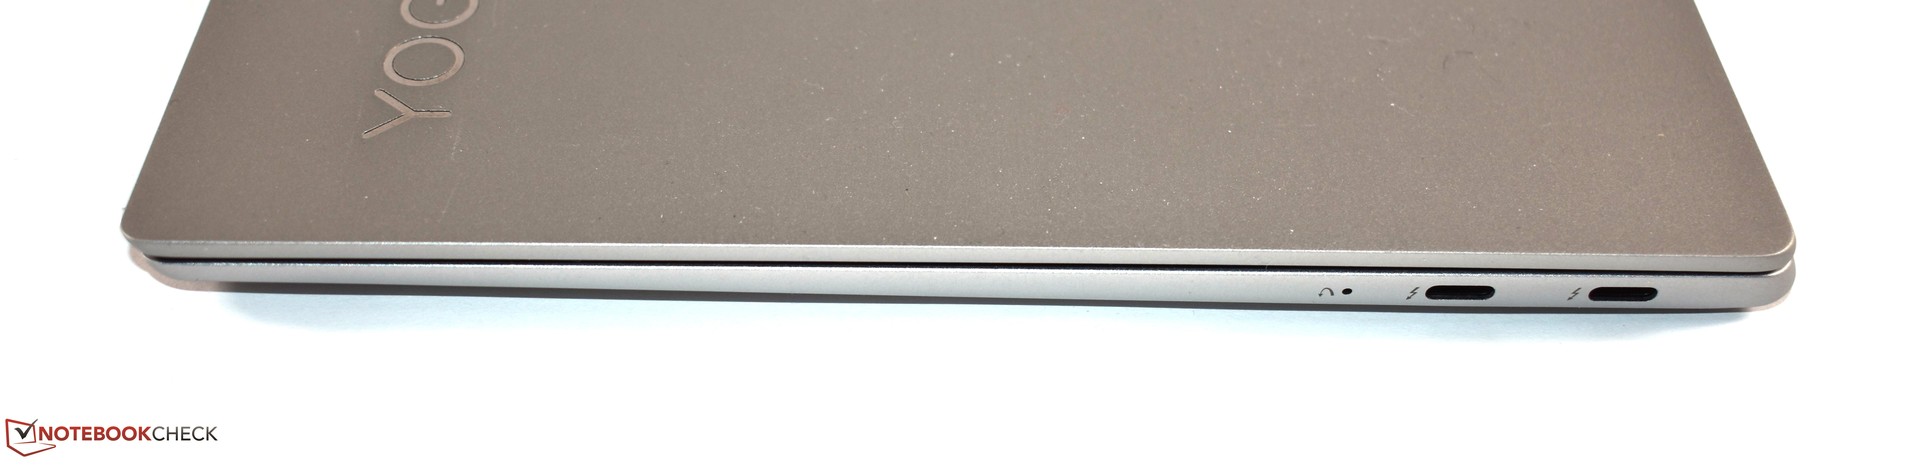
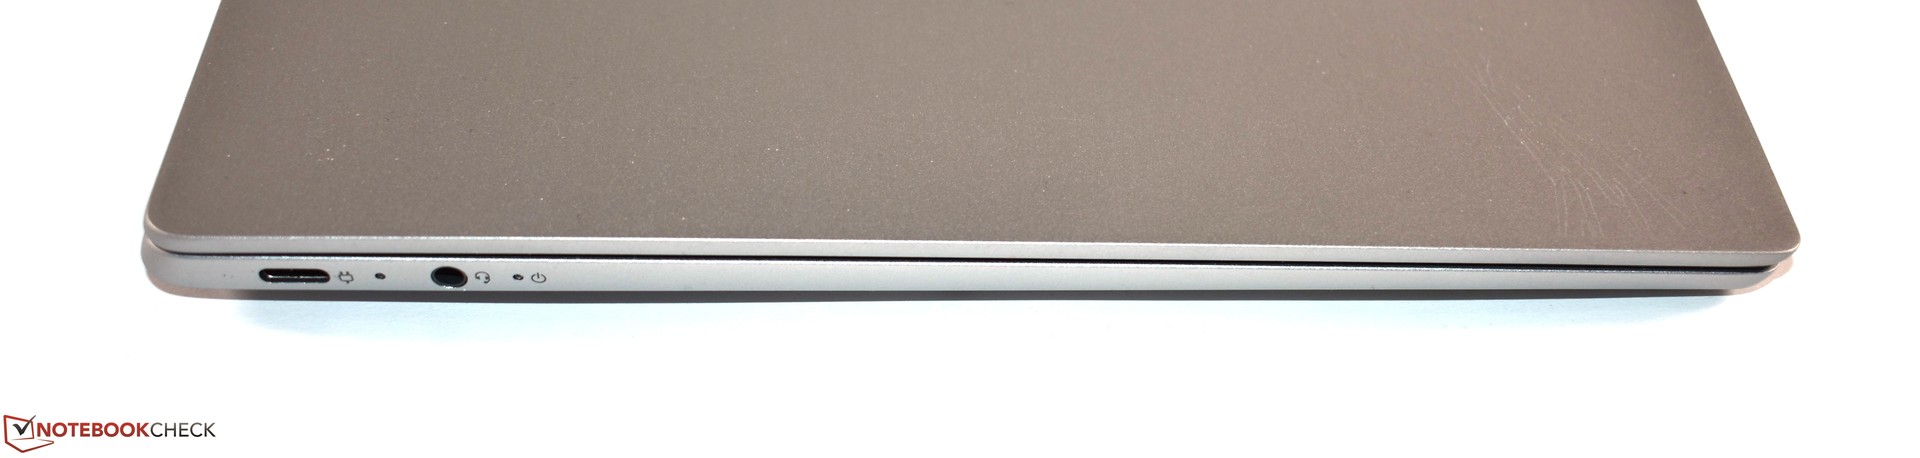
尽管如此,一些变化还是不错的,例如高级的铝制外壳,由于薄了几毫米,握持更加舒适。此外,我们不得不赞扬它配备了USB Type-C端口,并有两个雷电3接口。设备两侧的USB Type-C端口允许您从任何一侧充电,这使得选择更为灵活。
显示效果更好,色彩覆盖率高,无PWM。键盘也有很长的行程,虽然和ThinkPad还是不在一个级别。同样,我们喜欢玻璃表面的触控板,配备三星PM981 SSD也是值得称赞的,因为它目前是NVMe硬盘的标杆。最后,180°铰链开口很有用,这个功能在消费级笔记本电脑上并不多见。
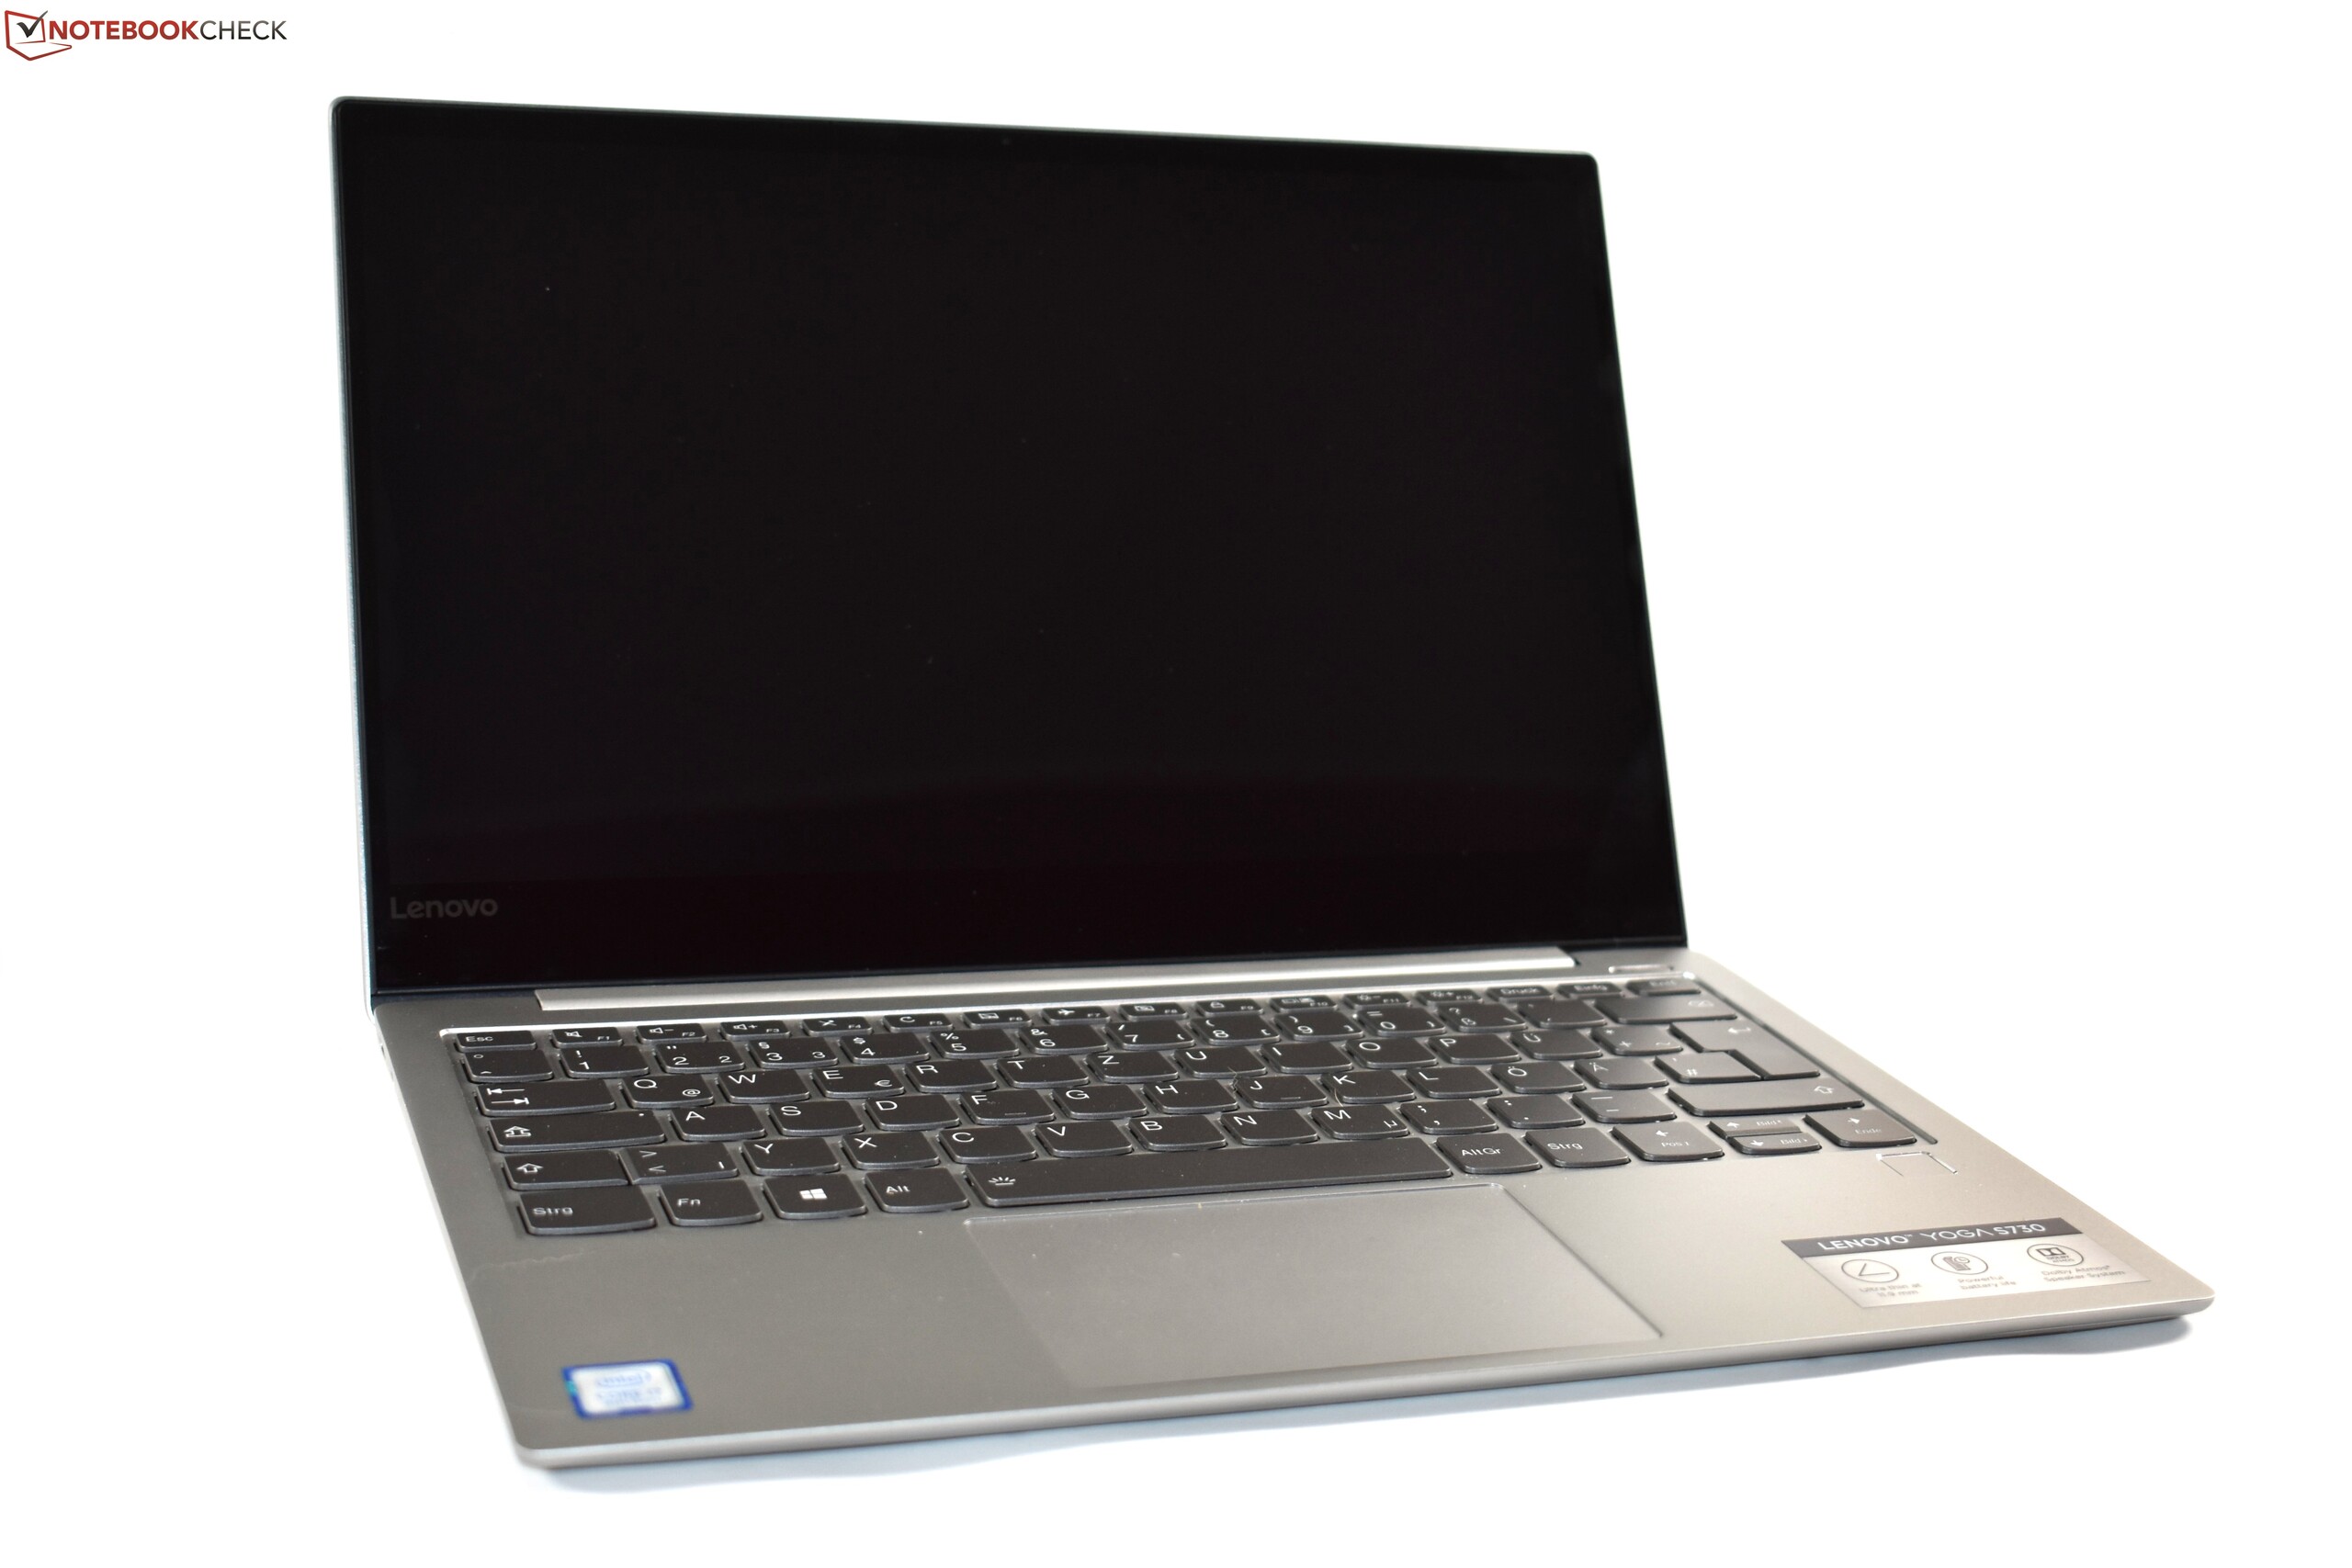
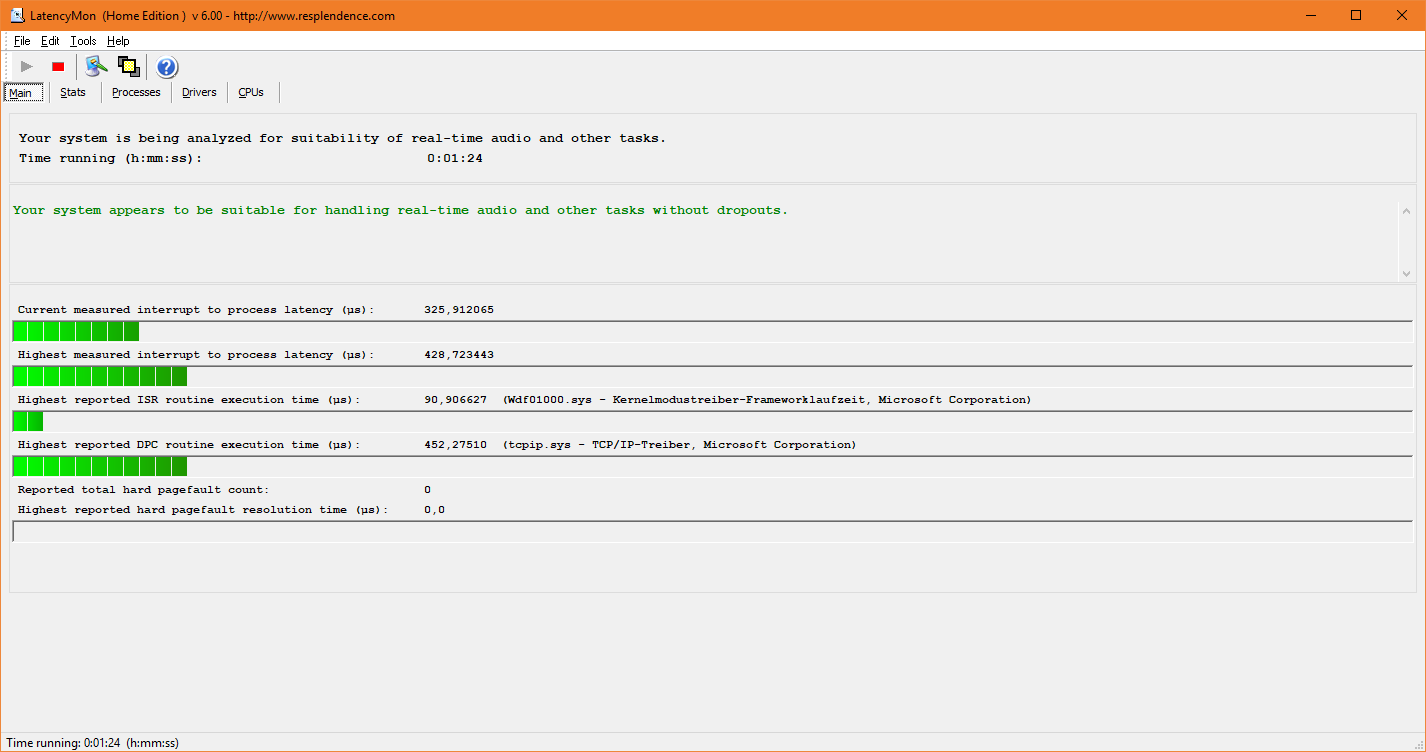
不幸的是,还是会有一些缺点,主要来源于小巧的机身。电池相对较小,续航令人失望。同样,USB Type-A的缺乏可能会让一些人感到沮丧,同时还没有独立GPU可选。此外,联想只为该设备配备了一个风扇,这使得处理器不断降频。我们更加倾向于哑光或4K显示选项,因为亮面屏会吸引指纹和反射。此外,这块无线网卡对于这种价位的笔记本电脑来说非常弱,电流噪音从长远来看可能会变得很烦人。
联想Yoga S730-13IWL整体上是一款不错的笔记本电脑,但它不是我们推荐的型号。它的确是一款坚固的超级本,但戴尔XPS 13 9370等设备更加完善,更加全能,而其他竞争对手如HP Envy 13则拥有4K显示选项和独立GPU。简而言之,在您考虑购买联想Yoga S730-13IWL之前,我们建议您先考虑其竞品。
Lenovo Yoga S730-13IWL
- 12/22/2018 v6 (old)
Benjamin Herzig
Price comparison
