惠普 ProBook 650 G2 笔记本电脑(全高清)简短评测
Connectivity
| SD Card Reader | |
| average JPG Copy Test (av. of 3 runs) | |
| Dell Latitude 15 E5570 | |
| Lenovo ThinkPad L560-20F10026GE | |
| Acer TravelMate P658-M-537B | |
| HP ProBook 650 G2-T9X61ET | |
| HP ProBook 650 G2 V1A44ET | |
| maximum AS SSD Seq Read Test (1GB) | |
| HP ProBook 650 G2-T9X61ET | |
| Lenovo ThinkPad L560-20F10026GE | |
| Networking | |
| iperf Server (receive) TCP 1 m | |
| HP ProBook 650 G2 V1A44ET (jseb) | |
| Dell Latitude 15 E5570 | |
| iperf Client (transmit) TCP 1 m | |
| HP ProBook 650 G2 V1A44ET (jseb) | |
| Dell Latitude 15 E5570 | |
| |||||||||||||||||||||||||
Brightness Distribution: 90 %
Center on Battery: 313 cd/m²
Contrast: 531:1 (Black: 0.59 cd/m²)
ΔE ColorChecker Calman: 11.89 | ∀{0.5-29.43 Ø4.71}
ΔE Greyscale Calman: 12.95 | ∀{0.09-98 Ø4.96}
78% sRGB (Argyll 1.6.3 3D)
50% AdobeRGB 1998 (Argyll 1.6.3 3D)
53.7% AdobeRGB 1998 (Argyll 3D)
78.3% sRGB (Argyll 3D)
52.1% Display P3 (Argyll 3D)
Gamma: 2.4
CCT: 15063 K
| HP ProBook 650 G2 V1A44ET TN LED, 1920x1080 | HP ProBook 650 G2-T9X61ET TN LED, 1366x768 | Acer TravelMate P658-M-537B IPS, 1920x1080 | Dell Latitude 15 E5570 TN LED, 1366x768 | Lenovo ThinkPad L560-20F10026GE AH-IPS, 1920x1080 | |
|---|---|---|---|---|---|
| Display | -20% | 18% | -22% | -25% | |
| Display P3 Coverage (%) | 52.1 | 41.59 -20% | 66.6 28% | 40.48 -22% | 39 -25% |
| sRGB Coverage (%) | 78.3 | 62.3 -20% | 85.7 9% | 60.9 -22% | 58.3 -26% |
| AdobeRGB 1998 Coverage (%) | 53.7 | 43 -20% | 62.8 17% | 41.82 -22% | 40.33 -25% |
| Response Times | -9% | 7% | -8% | 0% | |
| Response Time Grey 50% / Grey 80% * (ms) | 41 ? | 40.4 ? 1% | 38 ? 7% | 47 ? -15% | 39.2 ? 4% |
| Response Time Black / White * (ms) | 27 ? | 32 ? -19% | 25 ? 7% | 27 ? -0% | 28 ? -4% |
| PWM Frequency (Hz) | 200 ? | 200 ? | |||
| Screen | -5% | 19% | -5% | 12% | |
| Brightness middle (cd/m²) | 313 | 247 -21% | 308 -2% | 228 -27% | 262 -16% |
| Brightness (cd/m²) | 296 | 223 -25% | 319 8% | 236 -20% | 250 -16% |
| Brightness Distribution (%) | 90 | 85 -6% | 71 -21% | 90 0% | 92 2% |
| Black Level * (cd/m²) | 0.59 | 0.61 -3% | 0.61 -3% | 0.56 5% | 0.29 51% |
| Contrast (:1) | 531 | 405 -24% | 505 -5% | 407 -23% | 903 70% |
| Colorchecker dE 2000 * | 11.89 | 8.8 26% | 4.51 62% | 10.02 16% | 8.49 29% |
| Colorchecker dE 2000 max. * | 20.81 | 15.98 23% | 10.19 51% | 15.93 23% | 17.99 14% |
| Greyscale dE 2000 * | 12.95 | 10.13 22% | 2.91 78% | 10.66 18% | 8.11 37% |
| Gamma | 2.4 92% | 2.34 94% | 2.4 92% | 2.48 89% | 2.37 93% |
| CCT | 15063 43% | 12581 52% | 6740 96% | 11800 55% | 6300 103% |
| Color Space (Percent of AdobeRGB 1998) (%) | 50 | 39.6 -21% | 56 12% | 39 -22% | 37.07 -26% |
| Color Space (Percent of sRGB) (%) | 78 | 62.2 -20% | 86 10% | 61 -22% | 57.94 -26% |
| Total Average (Program / Settings) | -11% /
-8% | 15% /
17% | -12% /
-9% | -4% /
3% |
* ... smaller is better
Screen Flickering / PWM (Pulse-Width Modulation)
| Screen flickering / PWM detected | 200 Hz | ≤ 90 % brightness setting | 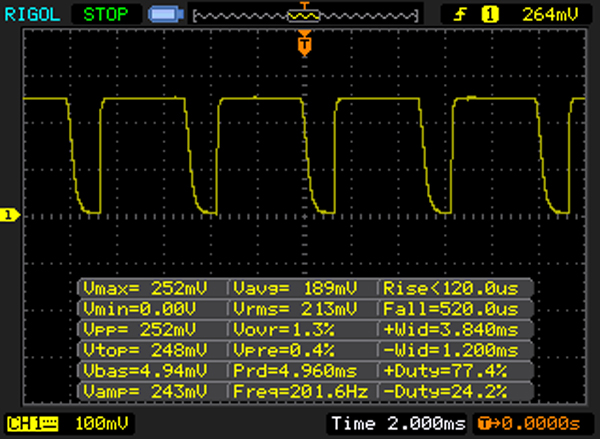 |
The display backlight flickers at 200 Hz (worst case, e.g., utilizing PWM) Flickering detected at a brightness setting of 90 % and below. There should be no flickering or PWM above this brightness setting. The frequency of 200 Hz is relatively low, so sensitive users will likely notice flickering and experience eyestrain at the stated brightness setting and below. In comparison: 52 % of all tested devices do not use PWM to dim the display. If PWM was detected, an average of 7754 (minimum: 5 - maximum: 343500) Hz was measured. | |||
Display Response Times
| ↔ Response Time Black to White | ||
|---|---|---|
| 27 ms ... rise ↗ and fall ↘ combined | ↗ 10 ms rise | 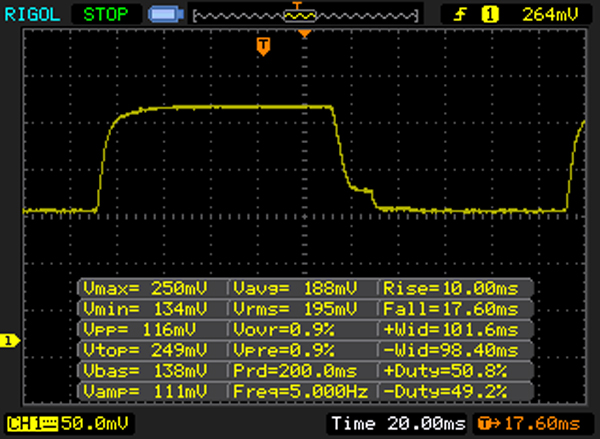 |
| ↘ 17 ms fall | ||
| The screen shows relatively slow response rates in our tests and may be too slow for gamers. In comparison, all tested devices range from 0.1 (minimum) to 240 (maximum) ms. » 67 % of all devices are better. This means that the measured response time is worse than the average of all tested devices (19.8 ms). | ||
| ↔ Response Time 50% Grey to 80% Grey | ||
| 41 ms ... rise ↗ and fall ↘ combined | ↗ 23 ms rise | 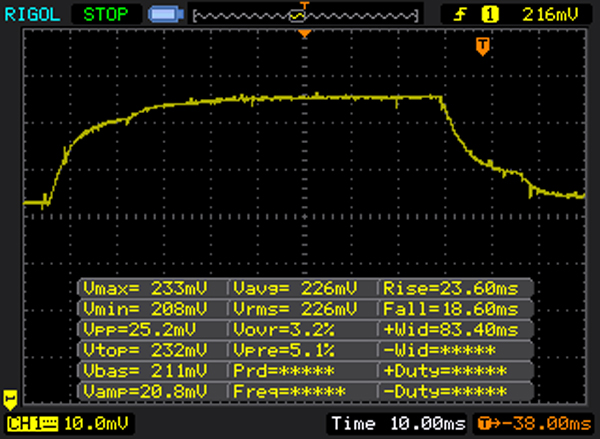 |
| ↘ 18 ms fall | ||
| The screen shows slow response rates in our tests and will be unsatisfactory for gamers. In comparison, all tested devices range from 0.165 (minimum) to 636 (maximum) ms. » 65 % of all devices are better. This means that the measured response time is worse than the average of all tested devices (31 ms). | ||
| Cinebench R15 | |
| CPU Single 64Bit | |
| Dell Latitude 15 E5570 | |
| Lenovo ThinkPad L560-20F10026GE | |
| HP ProBook 650 G2 V1A44ET | |
| HP ProBook 650 G2-T9X61ET | |
| Acer TravelMate P658-M-537B | |
| CPU Multi 64Bit | |
| Dell Latitude 15 E5570 | |
| HP ProBook 650 G2 V1A44ET | |
| Lenovo ThinkPad L560-20F10026GE | |
| HP ProBook 650 G2-T9X61ET | |
| Acer TravelMate P658-M-537B | |
| Geekbench 3 | |
| 32 Bit Single-Core Score | |
| Dell Latitude 15 E5570 | |
| HP ProBook 650 G2 V1A44ET | |
| 32 Bit Multi-Core Score | |
| Dell Latitude 15 E5570 | |
| HP ProBook 650 G2 V1A44ET | |
| JetStream 1.1 - 1.1 Total | |
| HP ProBook 650 G2-T9X61ET | |
| Dell Latitude 15 E5570 | |
| HP ProBook 650 G2 V1A44ET | |
| Lenovo ThinkPad L560-20F10026GE | |
| PCMark 8 Home Score Accelerated v2 | 3234 points | |
Help | ||
| PCMark 8 - Home Score Accelerated v2 | |
| Acer TravelMate P658-M-537B | |
| Dell Latitude 15 E5570 | |
| HP ProBook 650 G2 V1A44ET | |
| HP ProBook 650 G2-T9X61ET | |
| Lenovo ThinkPad L560-20F10026GE | |

| HP ProBook 650 G2 V1A44ET Sandisk X300 SD7SN6S-256G-1006 | HP ProBook 650 G2-T9X61ET Hitachi Travelstar Z7K500 HTS725050A7E630 | Acer TravelMate P658-M-537B Kingston RBU-SNS8152S3256GG2 | Dell Latitude 15 E5570 Samsung SSD PM871 MZ7LN128HCHP | Lenovo ThinkPad L560-20F10026GE WDC Slim WD10SPCX-21KHST0 | |
|---|---|---|---|---|---|
| CrystalDiskMark 3.0 | -90% | -1% | -13% | -89% | |
| Read Seq (MB/s) | 475 | 109.6 -77% | 479.1 1% | 474.7 0% | 113.6 -76% |
| Write Seq (MB/s) | 435 | 109.1 -75% | 333.1 -23% | 155 -64% | 111.7 -74% |
| Read 512 (MB/s) | 280.4 | 30.66 -89% | 418 49% | 393.6 40% | 39.65 -86% |
| Write 512 (MB/s) | 265.5 | 45.71 -83% | 320.5 21% | 119.7 -55% | 55.3 -79% |
| Read 4k (MB/s) | 32.71 | 0.351 -99% | 25.66 -22% | 34 4% | 0.488 -99% |
| Write 4k (MB/s) | 98.7 | 0.798 -99% | 64.7 -34% | 96.6 -2% | 1.022 -99% |
| Read 4k QD32 (MB/s) | 347.2 | 0.656 -100% | 226.2 -35% | 383.3 10% | 1.367 -100% |
| Write 4k QD32 (MB/s) | 154.1 | 0.787 -99% | 211.4 37% | 100.2 -35% | 1.036 -99% |
| 3DMark 11 Performance | 1344 points | |
Help | ||
| 3DMark 11 - 1280x720 Performance GPU | |
| Acer TravelMate P658-M-537B | |
| HP ProBook 650 G2-T9X61ET | |
| Dell Latitude 15 E5570 | |
| Lenovo ThinkPad L560-20F10026GE | |
| HP ProBook 650 G2 V1A44ET | |
| low | med. | high | ultra | |
|---|---|---|---|---|
| BioShock Infinite (2013) | 38.3 | 21.7 | 17.9 |
Noise level
| Idle |
| 30.5 / 31.6 / 31.9 dB(A) |
| Load |
| 34.7 / 34.5 dB(A) |
 | ||
30 dB silent 40 dB(A) audible 50 dB(A) loud |
||
min: | ||
(+) The maximum temperature on the upper side is 39.6 °C / 103 F, compared to the average of 34.3 °C / 94 F, ranging from 21.2 to 62.5 °C for the class Office.
(±) The bottom heats up to a maximum of 41.8 °C / 107 F, compared to the average of 36.8 °C / 98 F
(+) In idle usage, the average temperature for the upper side is 26.4 °C / 80 F, compared to the device average of 29.5 °C / 85 F.
(+) The palmrests and touchpad are cooler than skin temperature with a maximum of 29.7 °C / 85.5 F and are therefore cool to the touch.
(-) The average temperature of the palmrest area of similar devices was 27.5 °C / 81.5 F (-2.2 °C / -4 F).
HP ProBook 650 G2 V1A44ET audio analysis
(±) | speaker loudness is average but good (72 dB)
Bass 100 - 315 Hz
(-) | nearly no bass - on average 36.7% lower than median
(±) | linearity of bass is average (7.4% delta to prev. frequency)
Mids 400 - 2000 Hz
(±) | reduced mids - on average 6.7% lower than median
(±) | linearity of mids is average (11.4% delta to prev. frequency)
Highs 2 - 16 kHz
(+) | balanced highs - only 2.6% away from median
(+) | highs are linear (4.7% delta to prev. frequency)
Overall 100 - 16.000 Hz
(±) | linearity of overall sound is average (26.4% difference to median)
Compared to same class
» 81% of all tested devices in this class were better, 6% similar, 12% worse
» The best had a delta of 7%, average was 21%, worst was 53%
Compared to all devices tested
» 81% of all tested devices were better, 4% similar, 15% worse
» The best had a delta of 4%, average was 23%, worst was 134%
Apple MacBook 12 (Early 2016) 1.1 GHz audio analysis
(+) | speakers can play relatively loud (83.6 dB)
Bass 100 - 315 Hz
(±) | reduced bass - on average 11.3% lower than median
(±) | linearity of bass is average (14.2% delta to prev. frequency)
Mids 400 - 2000 Hz
(+) | balanced mids - only 2.4% away from median
(+) | mids are linear (5.5% delta to prev. frequency)
Highs 2 - 16 kHz
(+) | balanced highs - only 2% away from median
(+) | highs are linear (4.5% delta to prev. frequency)
Overall 100 - 16.000 Hz
(+) | overall sound is linear (10.2% difference to median)
Compared to same class
» 7% of all tested devices in this class were better, 2% similar, 90% worse
» The best had a delta of 5%, average was 18%, worst was 53%
Compared to all devices tested
» 5% of all tested devices were better, 1% similar, 94% worse
» The best had a delta of 4%, average was 23%, worst was 134%
| Off / Standby | |
| Idle | |
| Load |
|
Key:
min: | |
| Battery Runtime - WiFi Websurfing | |
| Dell Latitude 15 E5570 | |
| Acer TravelMate P658-M-537B | |
| HP ProBook 650 G2 V1A44ET | |
| HP ProBook 650 G2-T9X61ET | |
| Lenovo ThinkPad L560-20F10026GE | |
Pros
Cons
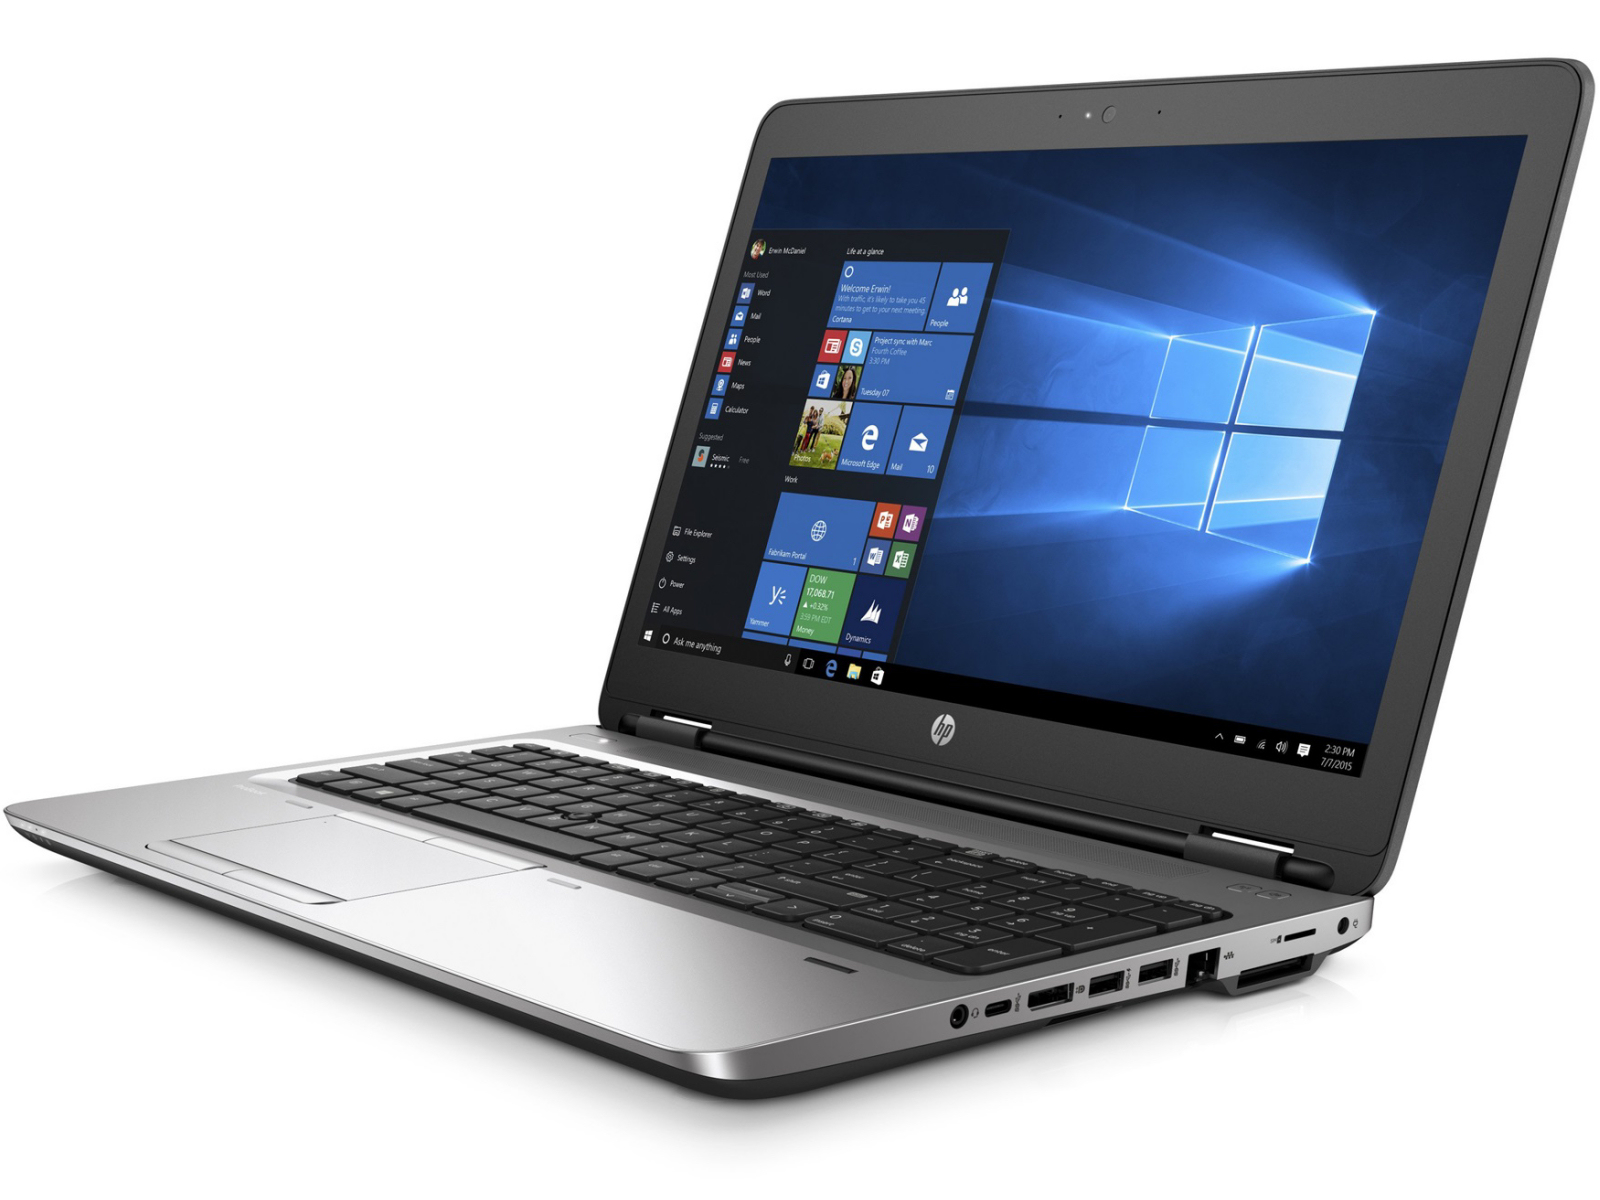
惠普ProBook 650 G2是一台中端笔记本电脑,对于大部分日常用途它都可以提供足够的运算性能。这台笔记本运行安静,几乎不会变热。一块高速固态硬盘带来了流畅的系统运行,用户可以自行打开笔记本电脑底盖更换,实际操作并不复杂。它搭配的键盘可以让人满意,不过没有背光,对ProBook来说这也应该成为标准配置才对。它的电池续航十分不错。
惠普的ProBook 650 G2在定位上有些模糊不清,因为它和ProBook 450系列的差价很小,不过由于定位更高它也应该有更好的表现。
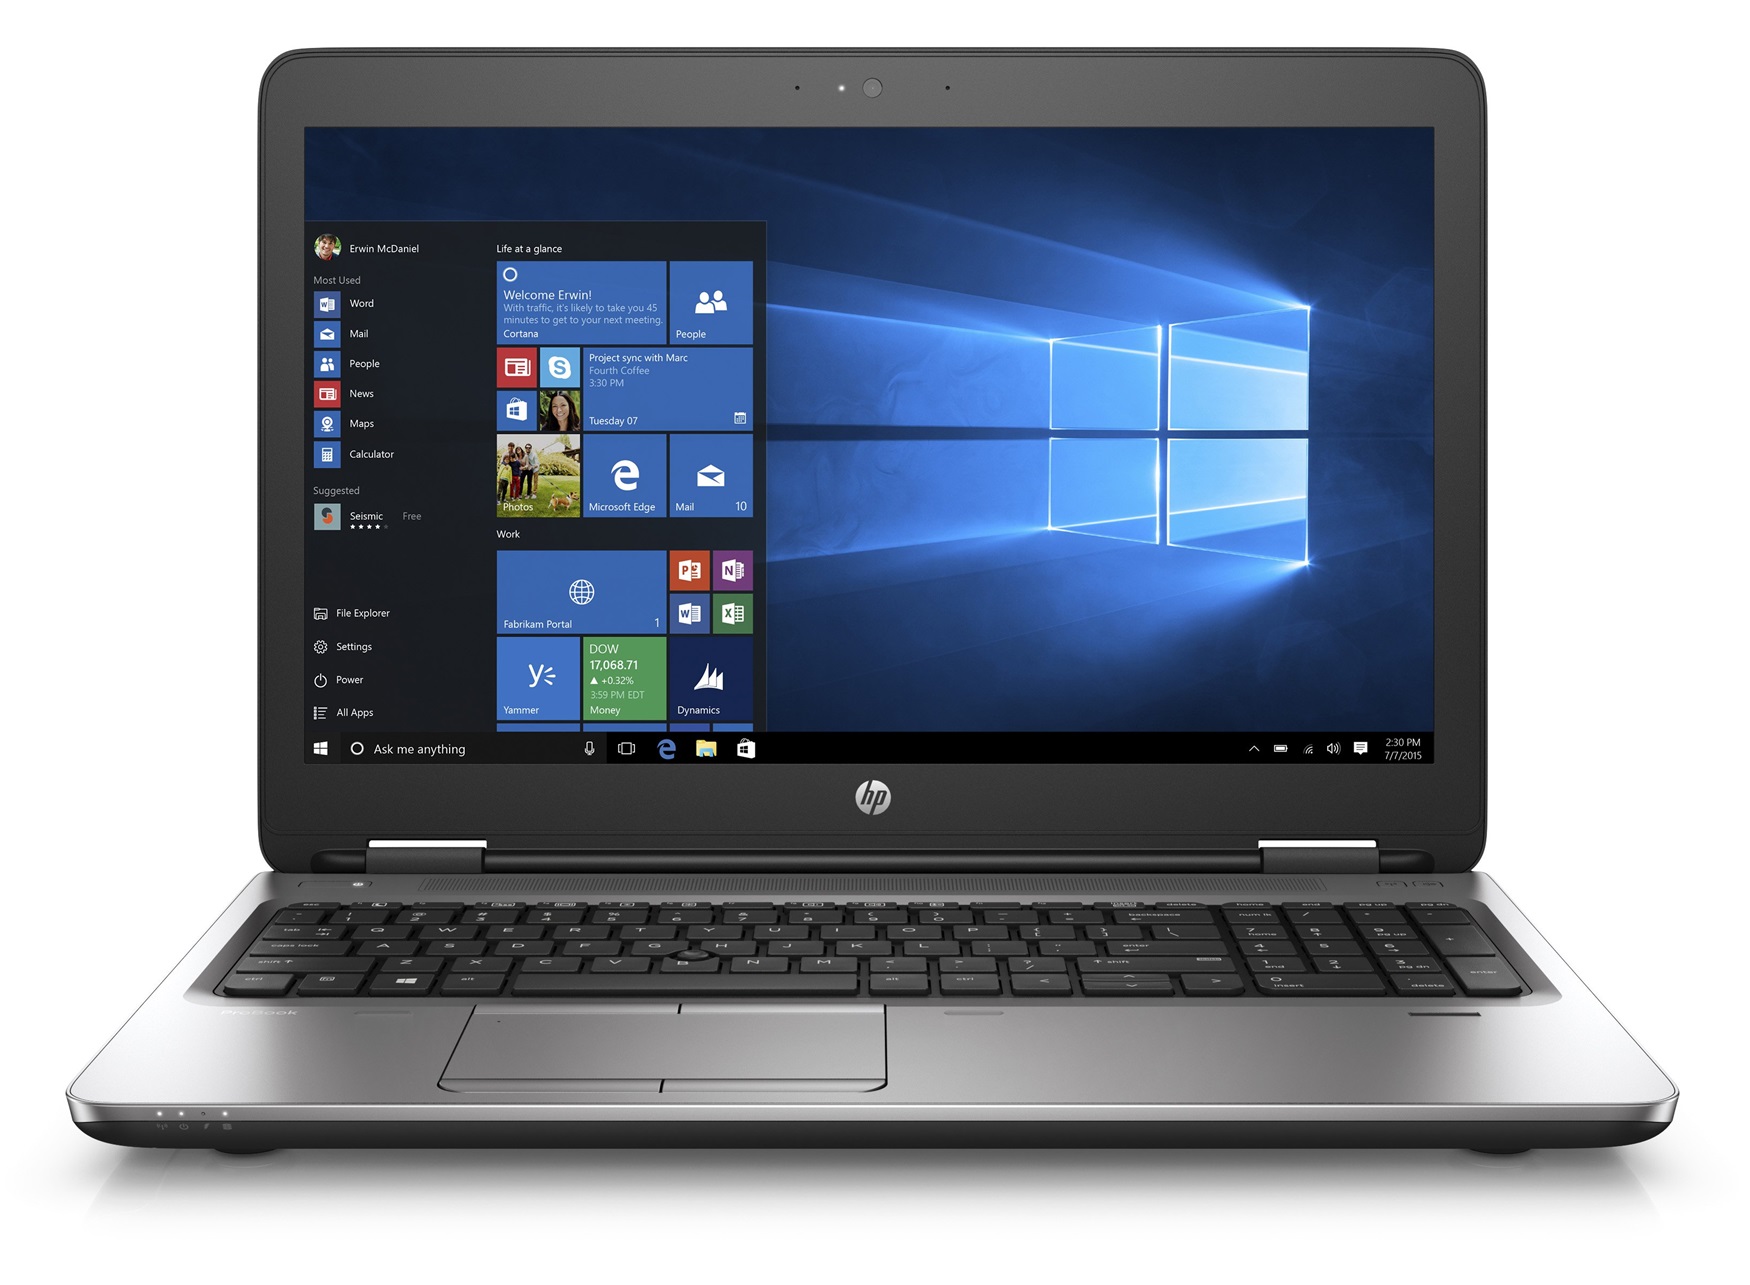
对于它搭配的全高清屏幕我们很难满意。它的对比度较低,可视角度也较窄,色彩准确度也不够优秀,同时色域覆盖十分窄。这样的屏幕在这个价位上显得十分让人难以理解,另一方面也很难达到惠普对ProBook 650系列所宣传的水准。
注:本文是基于完整评测的缩减版本,阅读完整的英文评测,请点击这里。
HP ProBook 650 G2 V1A44ET
- 10/02/2016 v5.1 (old)
Sascha Mölck