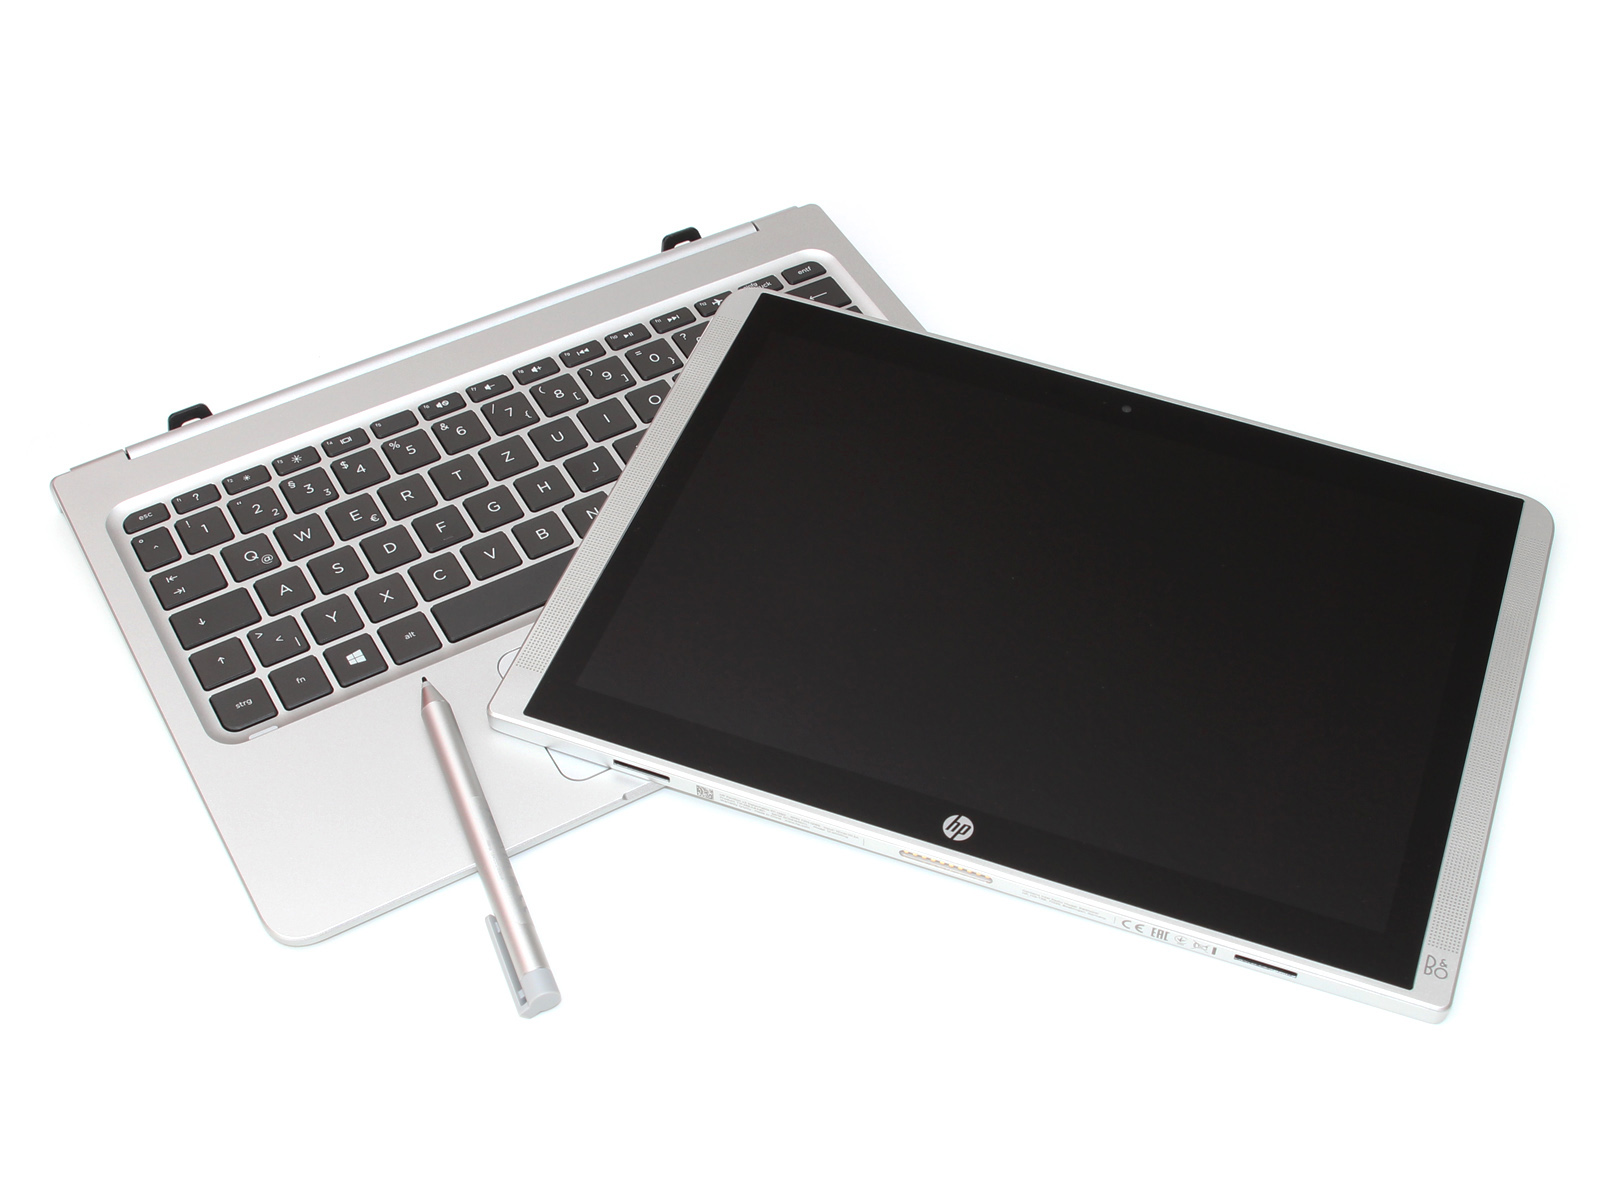
惠普 Pavilion x2 12 变形本简短评测
| Networking | |
| iperf Server (receive) TCP 1 m | |
| Apple MacBook 12 (Early 2016) 1.1 GHz | |
| Lenovo IdeaPad MIIX 310-10ICR | |
| iperf Client (transmit) TCP 1 m | |
| Apple MacBook 12 (Early 2016) 1.1 GHz | |
| Lenovo IdeaPad MIIX 310-10ICR | |
| |||||||||||||||||||||||||
Brightness Distribution: 93 %
Center on Battery: 314 cd/m²
Contrast: 654:1 (Black: 0.48 cd/m²)
ΔE ColorChecker Calman: 6.12 | ∀{0.5-29.43 Ø4.71}
ΔE Greyscale Calman: 6.1 | ∀{0.09-98 Ø4.96}
71.74% sRGB (Argyll 1.6.3 3D)
46.81% AdobeRGB 1998 (Argyll 1.6.3 3D)
52.9% AdobeRGB 1998 (Argyll 3D)
72.4% sRGB (Argyll 3D)
53.2% Display P3 (Argyll 3D)
Gamma: 2.35
CCT: 7391 K
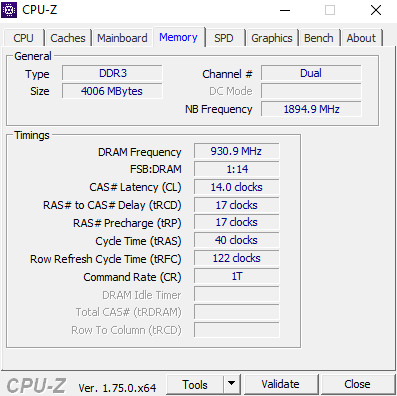
| HP Pavilion x2 12-b000ng LG Philips LGD04A5, IPS, 1920x1280, 12" | Microsoft Surface Pro 4, Core m3 Samsung SDC3853, IPS, 2736x1824, 12.3" | Acer Aspire Switch Alpha 12 SA5-271-56HM Panasonic VVX12T041N00, IPS, 2160x1440, 12" | Lenovo IdeaPad Miix 700 Samsung L_QLLTN120QL01L01, IPS, 2160x1440, 12" | Samsung Galaxy Tab Pro S W700N Digital Flat Panel (NoName), sAMOLED, 2160x1440, 12.1" | |
|---|---|---|---|---|---|
| Display | 30% | 27% | 32% | ||
| Display P3 Coverage (%) | 53.2 | 67.5 27% | 65.5 23% | 68.1 28% | |
| sRGB Coverage (%) | 72.4 | 96.6 33% | 96.1 33% | 97.4 35% | |
| AdobeRGB 1998 Coverage (%) | 52.9 | 69 30% | 66.9 26% | 70.2 33% | |
| Response Times | -18% | 11% | 31% | ||
| Response Time Grey 50% / Grey 80% * (ms) | 38 ? | 46 ? -21% | 20 ? 47% | 30 ? 21% | |
| Response Time Black / White * (ms) | 27 ? | 31 ? -15% | 34 ? -26% | 16 ? 41% | |
| PWM Frequency (Hz) | 50 ? | 1000 ? | 200 ? | ||
| Screen | 40% | 10% | 13% | 224% | |
| Brightness middle (cd/m²) | 314 | 389.2 24% | 345 10% | 341 9% | 363 16% |
| Brightness (cd/m²) | 308 | 392 27% | 328 6% | 318 3% | 378 23% |
| Brightness Distribution (%) | 93 | 92 -1% | 91 -2% | 87 -6% | 90 -3% |
| Black Level * (cd/m²) | 0.48 | 0.27 44% | 0.38 21% | 0.36 25% | 0.03 94% |
| Contrast (:1) | 654 | 1441 120% | 908 39% | 947 45% | 12100 1750% |
| Colorchecker dE 2000 * | 6.12 | 3.61 41% | 8.4 -37% | 6 2% | 4.8 22% |
| Colorchecker dE 2000 max. * | 10.92 | 11.9 -9% | 6.91 37% | ||
| Greyscale dE 2000 * | 6.1 | 3.8 38% | 4.3 30% | 8.12 -33% | 5.04 17% |
| Gamma | 2.35 94% | 2.16 102% | 2.63 84% | 2.23 99% | 2.57 86% |
| CCT | 7391 88% | 5969 109% | 7368 88% | 7011 93% | 7255 90% |
| Color Space (Percent of AdobeRGB 1998) (%) | 46.81 | 63 35% | 62 32% | 63.4 35% | 73 56% |
| Color Space (Percent of sRGB) (%) | 71.74 | 97 35% | 97.4 36% | ||
| Total Average (Program / Settings) | 17% /
30% | 16% /
14% | 25% /
20% | 224% /
224% |
* ... smaller is better
Display Response Times
| ↔ Response Time Black to White | ||
|---|---|---|
| 27 ms ... rise ↗ and fall ↘ combined | ↗ 14 ms rise | 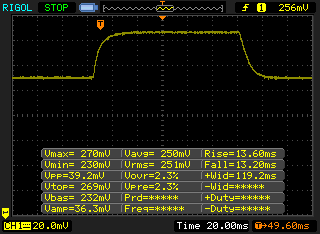 |
| ↘ 13 ms fall | ||
| The screen shows relatively slow response rates in our tests and may be too slow for gamers. In comparison, all tested devices range from 0.1 (minimum) to 240 (maximum) ms. » 67 % of all devices are better. This means that the measured response time is worse than the average of all tested devices (19.8 ms). | ||
| ↔ Response Time 50% Grey to 80% Grey | ||
| 38 ms ... rise ↗ and fall ↘ combined | ↗ 17 ms rise | 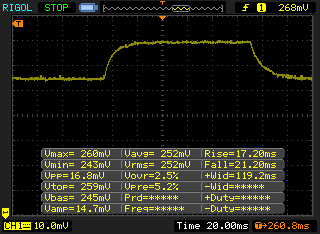 |
| ↘ 21 ms fall | ||
| The screen shows slow response rates in our tests and will be unsatisfactory for gamers. In comparison, all tested devices range from 0.165 (minimum) to 636 (maximum) ms. » 55 % of all devices are better. This means that the measured response time is worse than the average of all tested devices (31 ms). | ||
Screen Flickering / PWM (Pulse-Width Modulation)
| Screen flickering / PWM not detected | ||
In comparison: 52 % of all tested devices do not use PWM to dim the display. If PWM was detected, an average of 7754 (minimum: 5 - maximum: 343500) Hz was measured. | ||
| HP Pavilion x2 12-b000ng SanDisk Z400s SD8SNAT-128G | Microsoft Surface Pro 4, Core m3 Samsung MZFLV128 NVMe | Acer Aspire Switch Alpha 12 SA5-271-56HM Kingston RBU-SNS8152S3256GG2 | Lenovo IdeaPad Miix 700 Samsung MZNLN128HCGR-000L2 | Apple MacBook 12 (Early 2016) 1.1 GHz Apple SSD AP0256 | |
|---|---|---|---|---|---|
| CrystalDiskMark 3.0 | 22% | 35% | 45% | 123% | |
| Read Seq (MB/s) | 477.3 | 663 39% | 518 9% | 497.9 4% | 754 58% |
| Write Seq (MB/s) | 184.3 | 158.2 -14% | 199.9 8% | 153.5 -17% | 638 246% |
| Read 512 (MB/s) | 226.2 | 313.1 38% | 374.9 66% | 401.2 77% | 616 172% |
| Write 512 (MB/s) | 176.2 | 158.2 -10% | 201 14% | 154.5 -12% | 678 285% |
| Read 4k (MB/s) | 21.12 | 30.14 43% | 29.3 39% | 36.2 71% | 14.6 -31% |
| Write 4k (MB/s) | 57.9 | 68 17% | 76.8 33% | 95.5 65% | 20.5 -65% |
| Read 4k QD32 (MB/s) | 136.4 | 243.7 79% | 272 99% | 389.5 186% | 464 240% |
| Write 4k QD32 (MB/s) | 173.2 | 149.2 -14% | 197.1 14% | 154 -11% | 315 82% |

| PCMark 7 Score | 4275 points | |
| PCMark 8 Home Score Accelerated v2 | 2831 points | |
| PCMark 8 Creative Score Accelerated v2 | 3198 points | |
| PCMark 8 Work Score Accelerated v2 | 3773 points | |
Help | ||
| 3DMark 11 - 1280x720 Performance GPU | |
| Acer Aspire Switch Alpha 12 SA5-271-56HM | |
| Microsoft Surface Pro 4, Core m3 | |
| HP Pavilion x2 12-b000ng | |
| Lenovo IdeaPad Miix 700 | |
| Samsung Galaxy Tab Pro S W700N | |
| 3DMark | |
| 1280x720 Cloud Gate Standard Graphics | |
| Acer Aspire Switch Alpha 12 SA5-271-56HM | |
| Microsoft Surface Pro 4, Core m3 | |
| HP Pavilion x2 12-b000ng | |
| Lenovo IdeaPad Miix 700 | |
| Samsung Galaxy Tab Pro S W700N | |
| 1920x1080 Fire Strike Graphics | |
| Microsoft Surface Pro 4, Core m3 | |
| HP Pavilion x2 12-b000ng | |
| Lenovo IdeaPad Miix 700 | |
| Samsung Galaxy Tab Pro S W700N | |
| 3DMark 06 Standard Score | 7530 points | |
| 3DMark 11 Performance | 1260 points | |
| 3DMark Ice Storm Standard Score | 41366 points | |
| 3DMark Cloud Gate Standard Score | 4330 points | |
| 3DMark Fire Strike Score | 671 points | |
Help | ||
| low | med. | high | ultra | |
|---|---|---|---|---|
| BioShock Infinite (2013) | 48 | 23.8 | 21.9 | |
| Battlefield 4 (2013) | 34.3 | 23.2 | 15.2 | |
| Dirt Rally (2015) | 57.8 | 16 | 12.5 |
(-) The maximum temperature on the upper side is 49.6 °C / 121 F, compared to the average of 35.4 °C / 96 F, ranging from 19.6 to 60 °C for the class Convertible.
(-) The bottom heats up to a maximum of 46.5 °C / 116 F, compared to the average of 36.9 °C / 98 F
(+) In idle usage, the average temperature for the upper side is 31.6 °C / 89 F, compared to the device average of 30.3 °C / 87 F.
(-) The palmrests and touchpad can get very hot to the touch with a maximum of 44.1 °C / 111.4 F.
(-) The average temperature of the palmrest area of similar devices was 28 °C / 82.4 F (-16.1 °C / -29 F).
HP Pavilion x2 12-b000ng audio analysis
(±) | speaker loudness is average but good (74 dB)
Bass 100 - 315 Hz
(-) | nearly no bass - on average 20.3% lower than median
(±) | linearity of bass is average (12.5% delta to prev. frequency)
Mids 400 - 2000 Hz
(±) | higher mids - on average 5.4% higher than median
(±) | linearity of mids is average (12.8% delta to prev. frequency)
Highs 2 - 16 kHz
(+) | balanced highs - only 3.4% away from median
(±) | linearity of highs is average (9.3% delta to prev. frequency)
Overall 100 - 16.000 Hz
(±) | linearity of overall sound is average (27.6% difference to median)
Compared to same class
» 84% of all tested devices in this class were better, 3% similar, 13% worse
» The best had a delta of 6%, average was 20%, worst was 57%
Compared to all devices tested
» 84% of all tested devices were better, 3% similar, 13% worse
» The best had a delta of 4%, average was 23%, worst was 134%
Apple MacBook 12 (Early 2016) 1.1 GHz audio analysis
(+) | speakers can play relatively loud (83.6 dB)
Bass 100 - 315 Hz
(±) | reduced bass - on average 11.3% lower than median
(±) | linearity of bass is average (14.2% delta to prev. frequency)
Mids 400 - 2000 Hz
(+) | balanced mids - only 2.4% away from median
(+) | mids are linear (5.5% delta to prev. frequency)
Highs 2 - 16 kHz
(+) | balanced highs - only 2% away from median
(+) | highs are linear (4.5% delta to prev. frequency)
Overall 100 - 16.000 Hz
(+) | overall sound is linear (10.2% difference to median)
Compared to same class
» 7% of all tested devices in this class were better, 2% similar, 90% worse
» The best had a delta of 5%, average was 18%, worst was 53%
Compared to all devices tested
» 5% of all tested devices were better, 1% similar, 94% worse
» The best had a delta of 4%, average was 23%, worst was 134%
| Off / Standby | |
| Idle | |
| Load |
|
Key:
min: | |
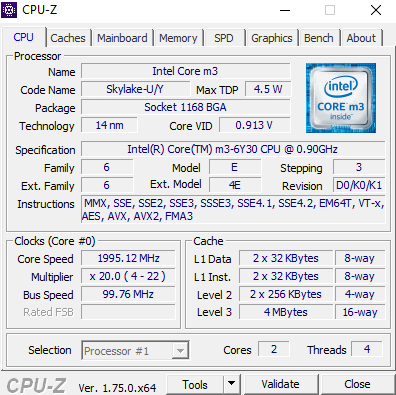
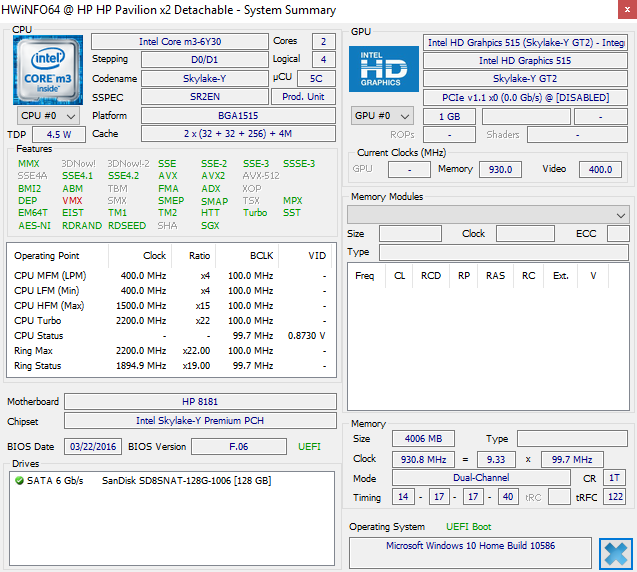
| HP Pavilion x2 12-b000ng 6Y30, HD Graphics 515, SanDisk Z400s SD8SNAT-128G, IPS, 1920x1280, 12" | Acer Aspire Switch Alpha 12 SA5-271-56HM 6200U, HD Graphics 520, Kingston RBU-SNS8152S3256GG2, IPS, 2160x1440, 12" | Lenovo IdeaPad Miix 700 6Y54, HD Graphics 515, Samsung MZNLN128HCGR-000L2, IPS, 2160x1440, 12" | Apple MacBook 12 (Early 2016) 1.1 GHz 6Y30, HD Graphics 515, Apple SSD AP0256, IPS, 2304x1440, 12" | Samsung Galaxy Tab Pro S W700N 6Y30, HD Graphics 515, Lite-On CV1-8B128, sAMOLED, 2160x1440, 12.1" | |
|---|---|---|---|---|---|
| Power Consumption | -26% | -9% | 27% | 21% | |
| Idle Minimum * (Watt) | 5.3 | 7.3 -38% | 4 25% | 2.7 49% | 3.4 36% |
| Idle Average * (Watt) | 8.2 | 10 -22% | 8.6 -5% | 2.7 67% | 8 2% |
| Idle Maximum * (Watt) | 9 | 10.15 -13% | 9.3 -3% | 7.2 20% | 9 -0% |
| Load Average * (Watt) | 20.7 | 25.2 -22% | 18.6 10% | 22 -6% | 12 42% |
| Load Maximum * (Watt) | 21.4 | 29.3 -37% | 36.3 -70% | 20.5 4% | 16.1 25% |
* ... smaller is better
| HP Pavilion x2 12-b000ng 6Y30, HD Graphics 515, 33 Wh | Microsoft Surface Pro 4, Core m3 6Y30, HD Graphics 515, 38 Wh | Acer Aspire Switch Alpha 12 SA5-271-56HM 6200U, HD Graphics 520, 37 Wh | Lenovo IdeaPad Miix 700 6Y54, HD Graphics 515, 41 Wh | Apple MacBook 12 (Early 2016) 1.1 GHz 6Y30, HD Graphics 515, 41.4 Wh | Samsung Galaxy Tab Pro S W700N 6Y30, HD Graphics 515, 39.5 Wh | |
|---|---|---|---|---|---|---|
| Battery runtime | 55% | 26% | 56% | 85% | 94% | |
| Reader / Idle (h) | 7.9 | 13.2 67% | 10.7 35% | 14.4 82% | 18.5 134% | |
| H.264 (h) | 5.2 | 7.8 50% | 7.5 44% | 8.5 63% | 8.6 65% | |
| WiFi v1.3 (h) | 4.8 | 8.1 69% | 5.4 13% | 7.3 52% | 8.4 75% | 8.8 83% |
| Load (h) | 1.8 | 2.3 28% | 1.9 6% | 2.6 44% | 3.9 117% |
Pros
Cons
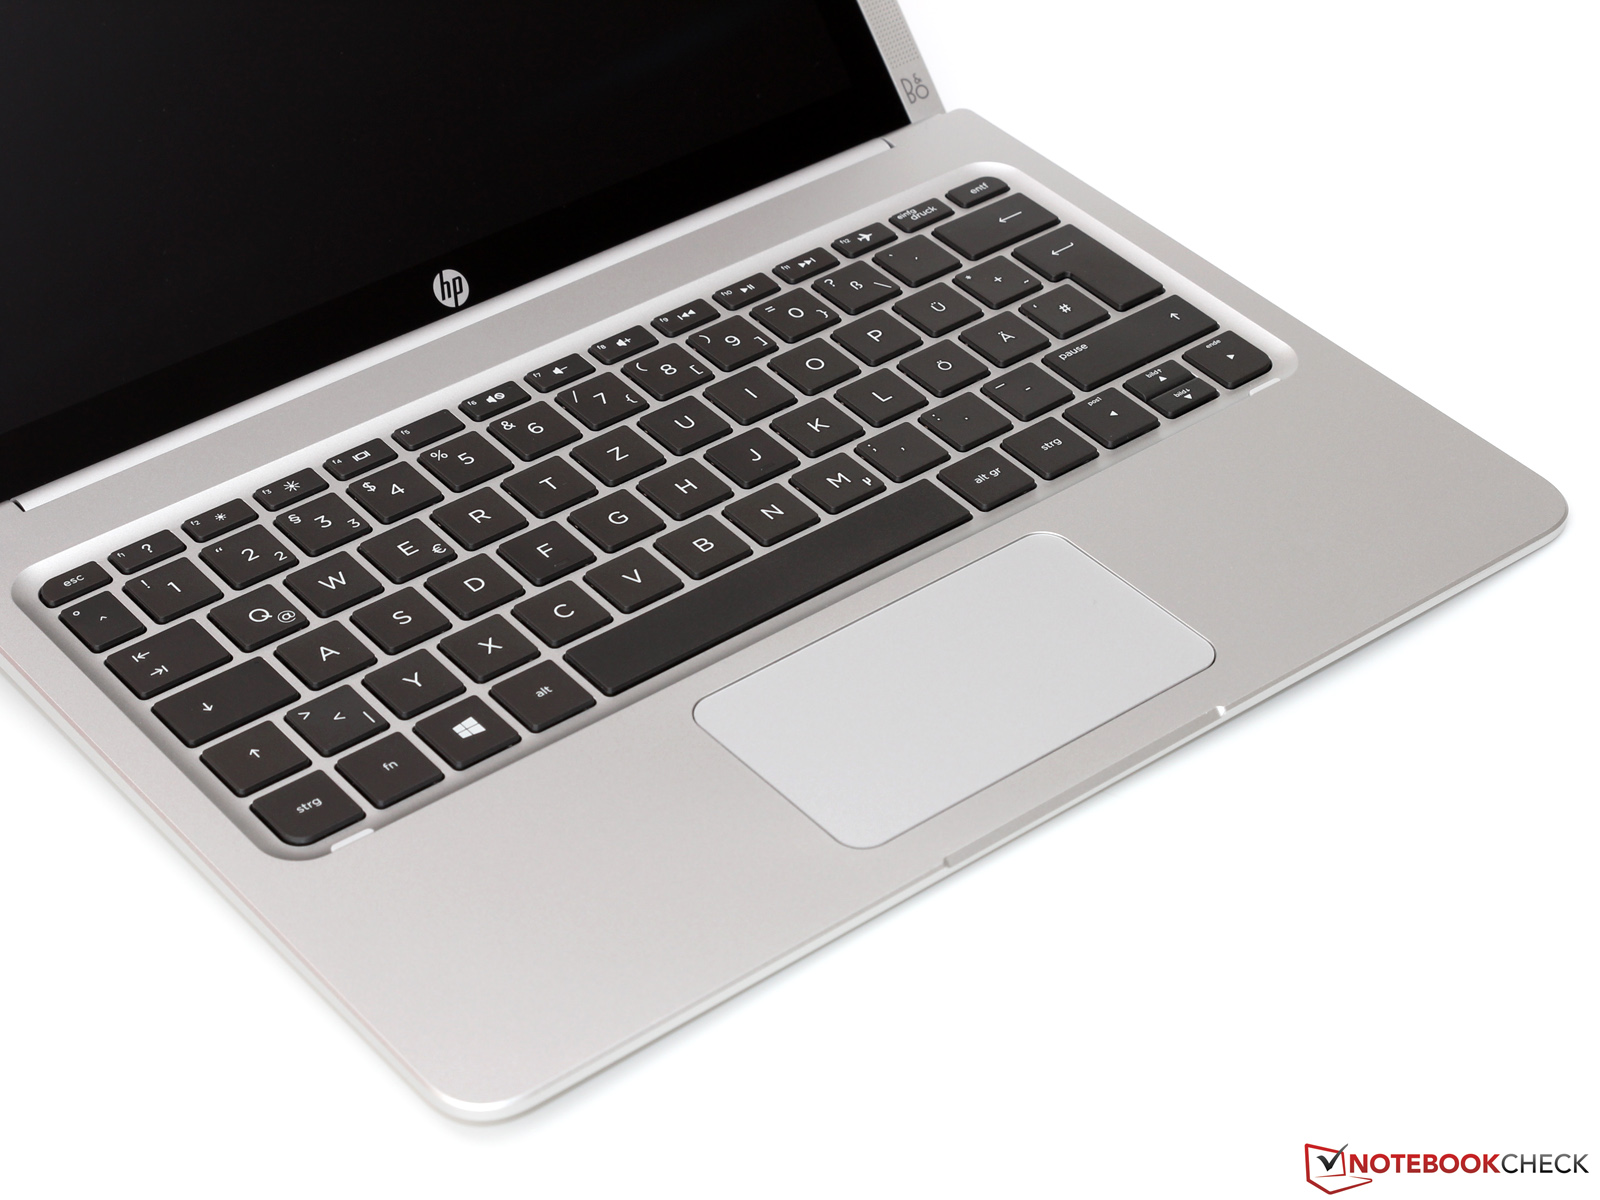
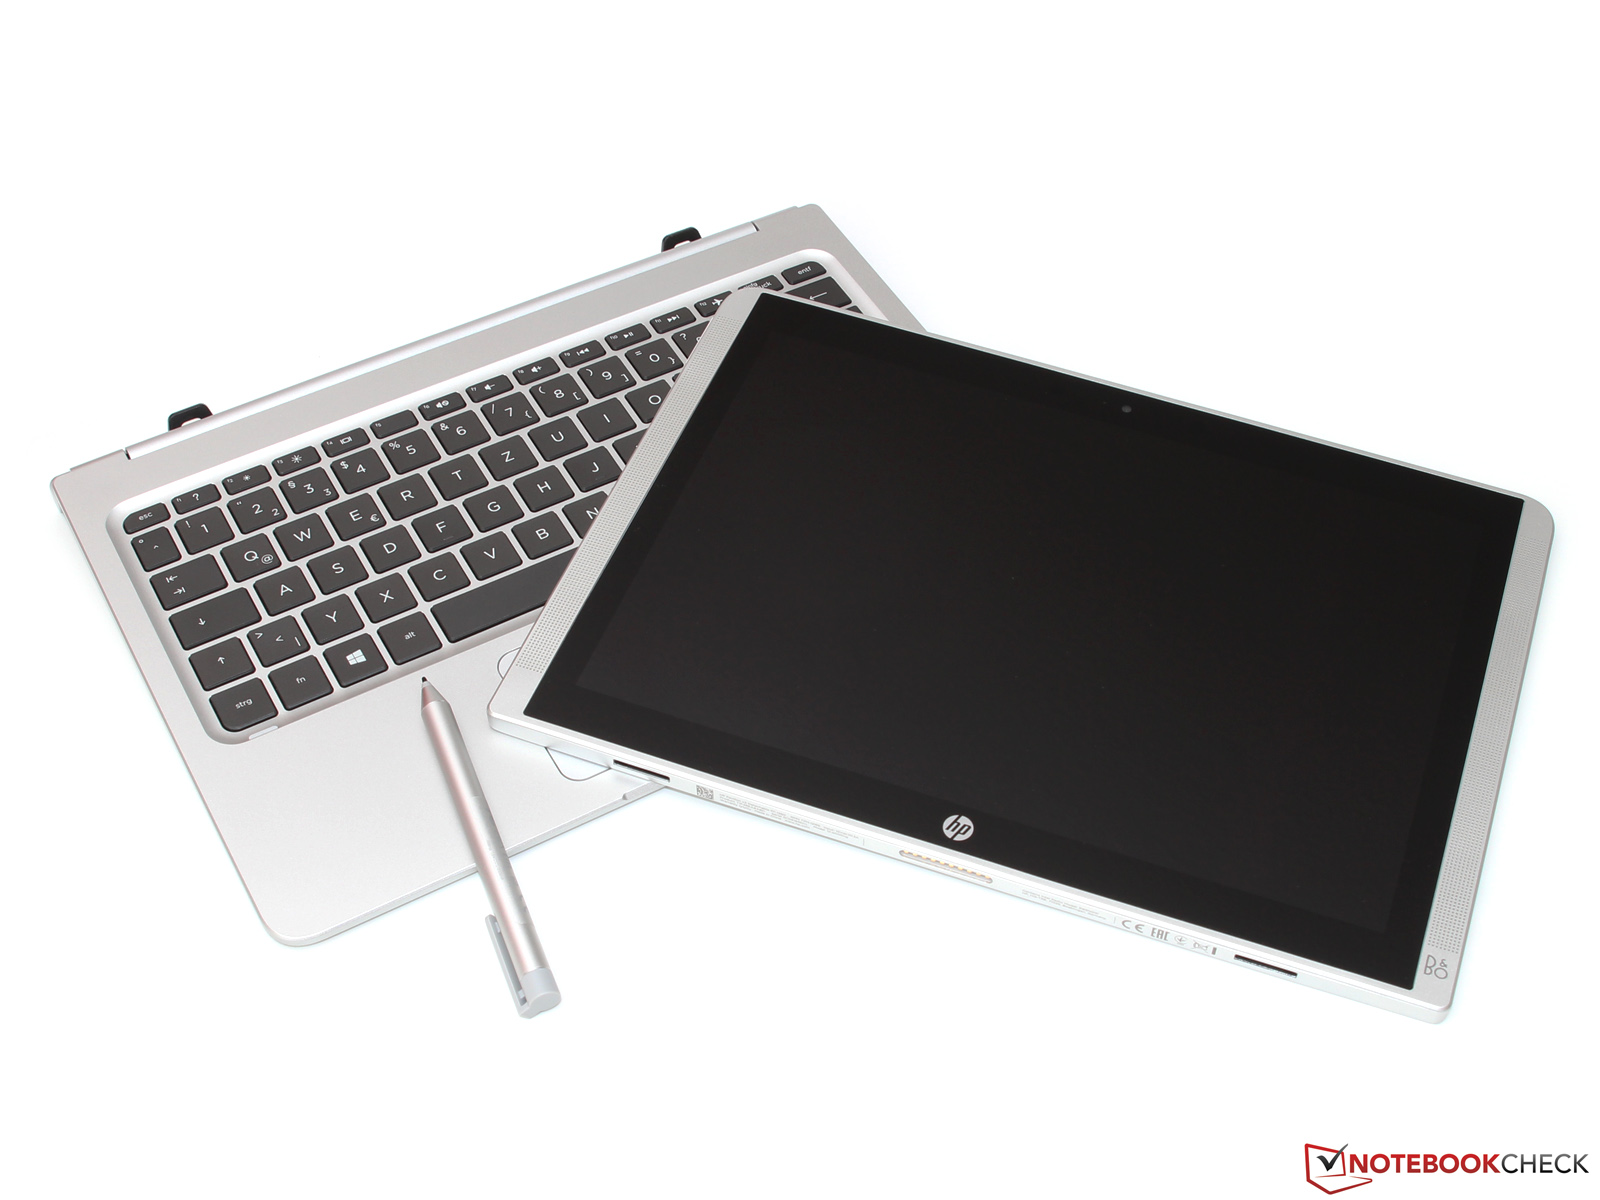
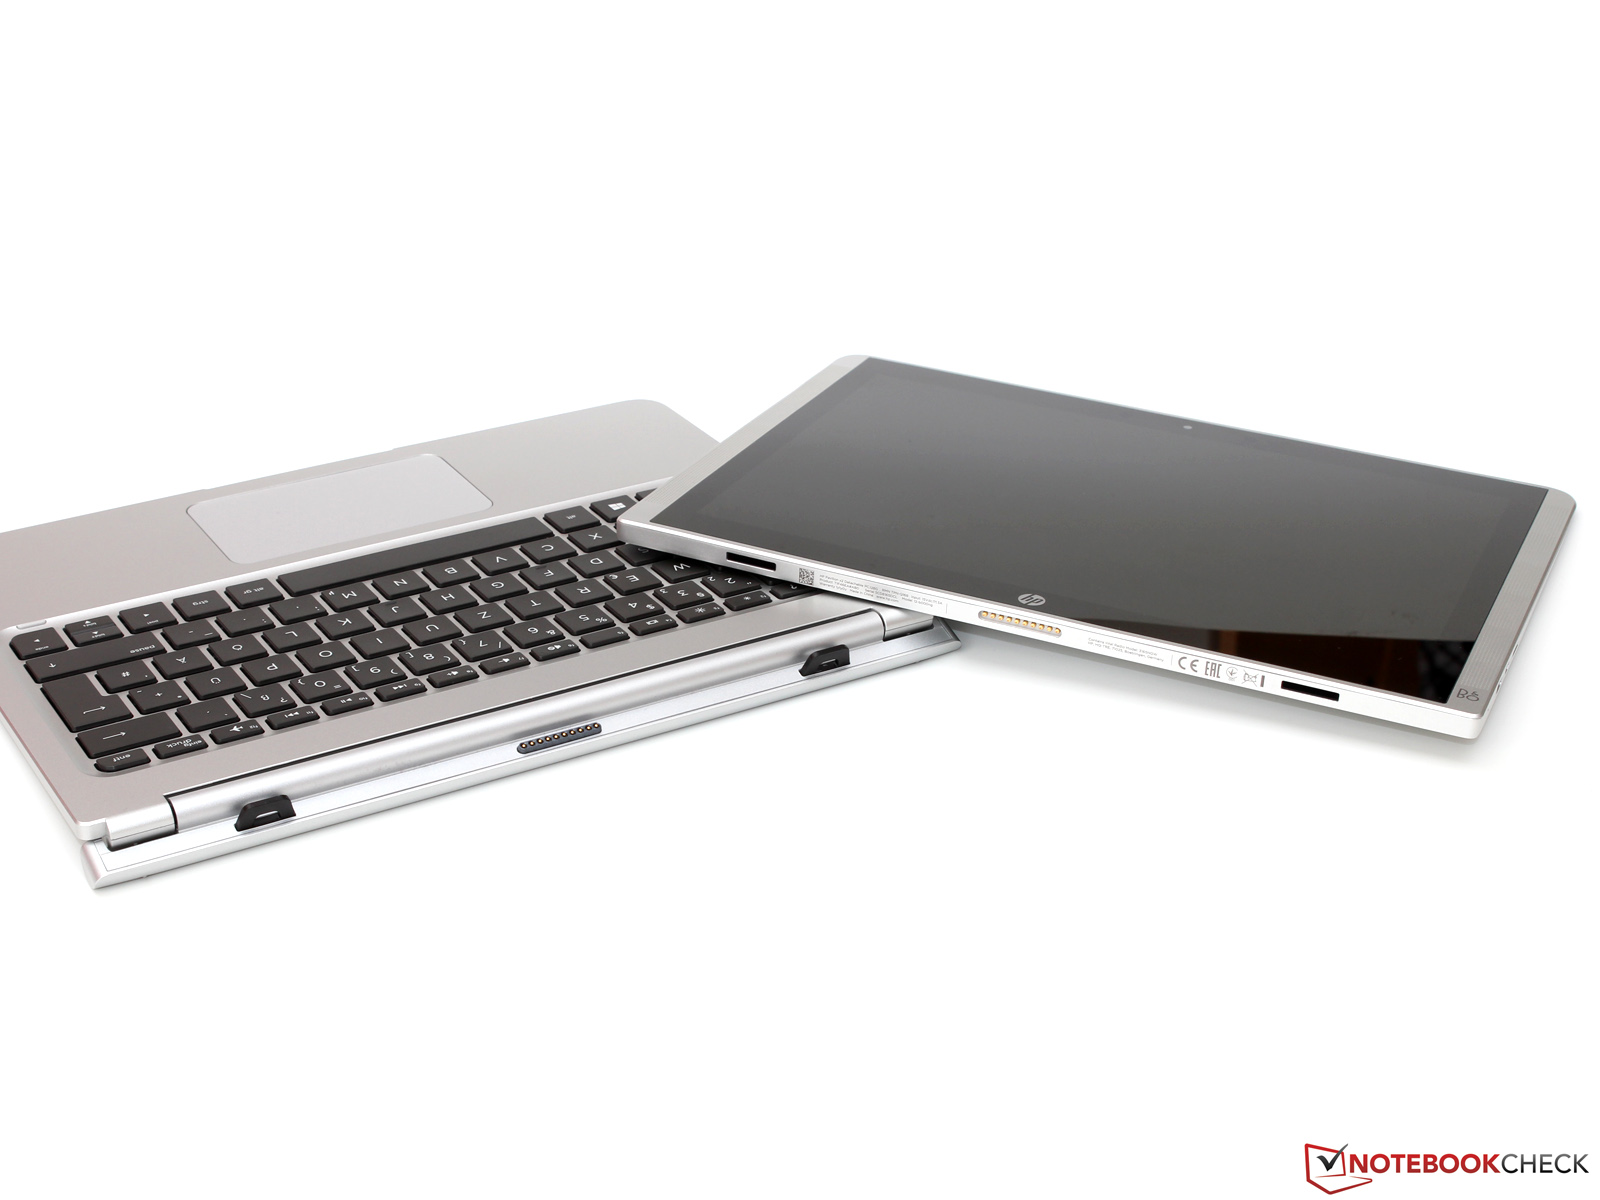
惠普Pavilion x2 12-b000ng是一款相对实惠的二合一笔记本电脑,它在许多方面都可以和更昂贵的机型相竞争。这台变形本的亮点在于屏幕转轴,稳定的键盘和近乎完美的酷睿m处理器加速利用率。它的屏幕表现也不错,不过一些竞争机型采用了更高的分辨率。它也是目前同价位产品中不多的几台没有屏幕闪烁的机型之一。
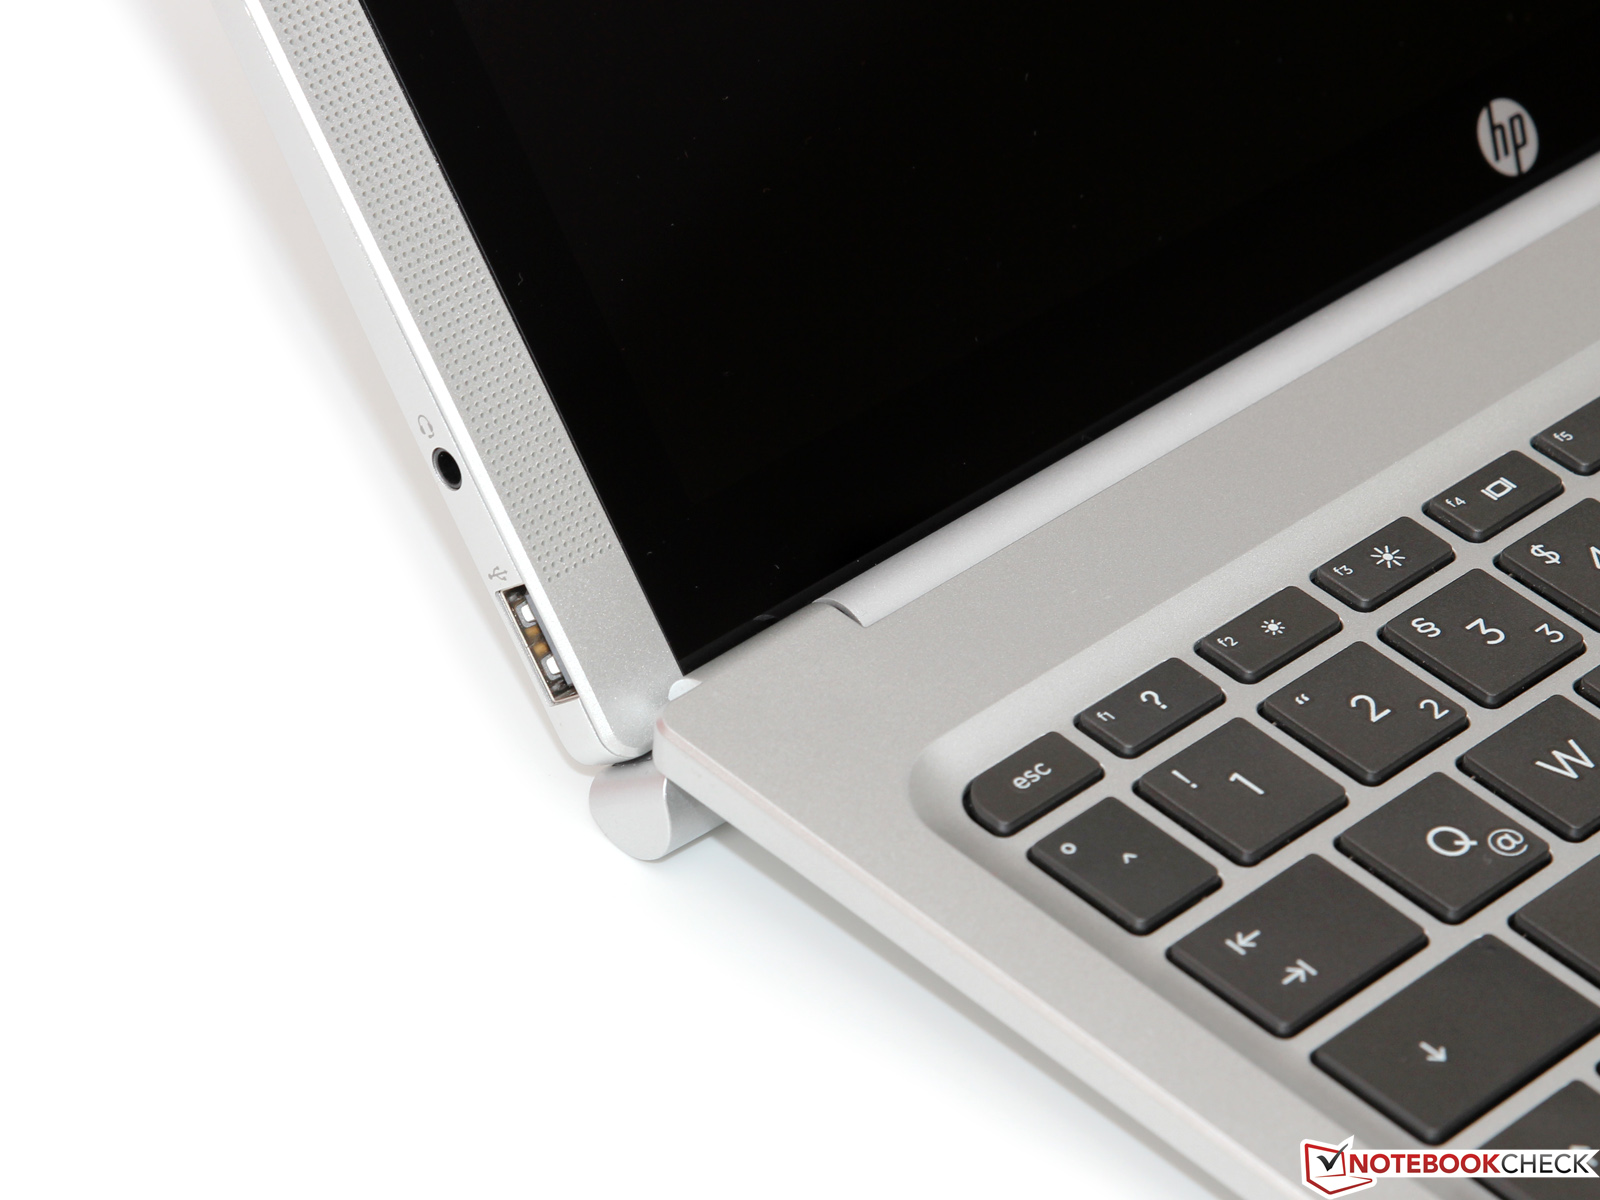
我们在测试中发现了它的一些问题,这也略微影响了它的整体印象。虽然你可能不会对有限的内存以及缺少LTE模组有太大的怨言,但较少的接口——它甚至连一个USB 3.0 A型接口都没有提供——则会是个让人难以忍受的设计缺陷。更大的电池容量,在键盘底座中提供第二块电池,也都会为它带来更好的表现。
整体上,售价700欧元(约5217人民币)的Pavilion x2依然是一台高性价比设备,不过它的性能很难与更贵的微软Surface Pro 4抗衡。
注:本文是基于完整评测的缩减版本,阅读完整的英文评测,请点击这里。
HP Pavilion x2 12-b000ng
- 08/20/2016 v5.1 (old)
Till Schönborn
Price comparison
