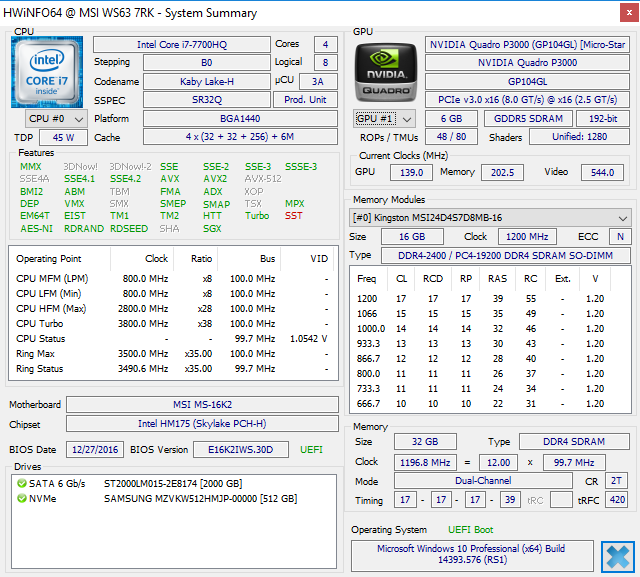
微星 WS63 7RF (i7-7700HQ, FHD, P3000) 工作站简短评测
| SD Card Reader | |
| average JPG Copy Test (av. of 3 runs) | |
| Dell Precision 5520 UHD | |
| Lenovo ThinkPad P51 20HH0016GE | |
| MSI WT72-6QM | |
| MSI WS63 7RF-290US | |
| maximum AS SSD Seq Read Test (1GB) | |
| Dell Precision 5520 UHD | |
| Lenovo ThinkPad P51 20HH0016GE | |
| MSI WT72-6QM | |
| MSI WS63 7RF-290US | |
| Networking | |
| iperf3 transmit AX12 | |
| MSI GS63VR 7RF-228US | |
| MSI WS63 7RF-290US | |
| Lenovo ThinkPad P51 20HH0016GE | |
| Dell Precision 5520 UHD | |
| iperf3 receive AX12 | |
| MSI GS63VR 7RF-228US | |
| Lenovo ThinkPad P51 20HH0016GE | |
| MSI WS63 7RF-290US | |
| Dell Precision 5520 UHD | |
| |||||||||||||||||||||||||
Brightness Distribution: 92 %
Center on Battery: 302.5 cd/m²
Contrast: 976:1 (Black: 0.31 cd/m²)
ΔE ColorChecker Calman: 4.3 | ∀{0.5-29.43 Ø4.73}
ΔE Greyscale Calman: 3.1 | ∀{0.09-98 Ø4.97}
84.3% sRGB (Argyll 1.6.3 3D)
55% AdobeRGB 1998 (Argyll 1.6.3 3D)
61.5% AdobeRGB 1998 (Argyll 3D)
84.2% sRGB (Argyll 3D)
63.6% Display P3 (Argyll 3D)
Gamma: 2.16
CCT: 7071 K
| MSI WS63 7RF-290US ID: LGD046F, Name: LG Philips LP156W6, Dell P/N: 3874Y, IPS, 15.6", 1920x1080 | Lenovo ThinkPad P51 20HH0016GE LEN40BD, B156ZAN02.1, IPS, 15.6", 3840x2160 | Dell Precision 5520 UHD SHP1476, IPS, 15.6", 3840x2160 | Fujitsu Celsius H760 LGD046F LP156WF6-SPP1, IPS LED, 15.6", 1920x1080 | MSI WS60-6QJE316H11 SDC424B, IPS, 15.6", 3840x2160 | |
|---|---|---|---|---|---|
| Display | 38% | 12% | -1% | -7% | |
| Display P3 Coverage (%) | 63.6 | 86.3 36% | 67.4 6% | 63.9 0% | 55.1 -13% |
| sRGB Coverage (%) | 84.2 | 99.5 18% | 98.5 17% | 82.4 -2% | 83 -1% |
| AdobeRGB 1998 Coverage (%) | 61.5 | 99.3 61% | 68.9 12% | 60.3 -2% | 56.9 -7% |
| Response Times | 9% | -41% | 11% | 19% | |
| Response Time Grey 50% / Grey 80% * (ms) | 38 ? | 40.8 ? -7% | 59.2 ? -56% | 38 ? -0% | 34 ? 11% |
| Response Time Black / White * (ms) | 33 ? | 25.2 ? 24% | 41.6 ? -26% | 26 ? 21% | 24 ? 27% |
| PWM Frequency (Hz) | 21740 ? | 1316 ? | |||
| Screen | 15% | 6% | 3% | -10% | |
| Brightness middle (cd/m²) | 302.5 | 317 5% | 372.4 23% | 341 13% | 237 -22% |
| Brightness (cd/m²) | 295 | 309 5% | 368 25% | 310 5% | 208 -29% |
| Brightness Distribution (%) | 92 | 89 -3% | 90 -2% | 82 -11% | 77 -16% |
| Black Level * (cd/m²) | 0.31 | 0.36 -16% | 0.48 -55% | 0.34 -10% | 0.26 16% |
| Contrast (:1) | 976 | 881 -10% | 776 -20% | 1003 3% | 912 -7% |
| Colorchecker dE 2000 * | 4.3 | 2.7 37% | 2.6 40% | 3.8 12% | 4.42 -3% |
| Colorchecker dE 2000 max. * | 9.4 | 4.1 56% | 5.6 40% | 10.8 -15% | 8.54 9% |
| Greyscale dE 2000 * | 3.1 | 3 3% | 3.7 -19% | 2 35% | 4.43 -43% |
| Gamma | 2.16 102% | 2.27 97% | 2.14 103% | 2.17 101% | 2.23 99% |
| CCT | 7071 92% | 6077 107% | 7096 92% | 6581 99% | 6133 106% |
| Color Space (Percent of AdobeRGB 1998) (%) | 55 | 87.6 59% | 63 15% | 54 -2% | 52.5 -5% |
| Color Space (Percent of sRGB) (%) | 84.3 | 99.5 18% | 99 17% | 82.2 -2% | 82.9 -2% |
| Total Average (Program / Settings) | 21% /
19% | -8% /
1% | 4% /
3% | 1% /
-6% |
* ... smaller is better
Display Response Times
| ↔ Response Time Black to White | ||
|---|---|---|
| 33 ms ... rise ↗ and fall ↘ combined | ↗ 20 ms rise | 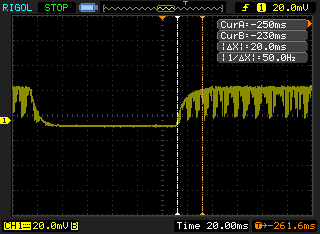 |
| ↘ 13 ms fall | ||
| The screen shows slow response rates in our tests and will be unsatisfactory for gamers. In comparison, all tested devices range from 0.1 (minimum) to 240 (maximum) ms. » 89 % of all devices are better. This means that the measured response time is worse than the average of all tested devices (19.9 ms). | ||
| ↔ Response Time 50% Grey to 80% Grey | ||
| 38 ms ... rise ↗ and fall ↘ combined | ↗ 20 ms rise | 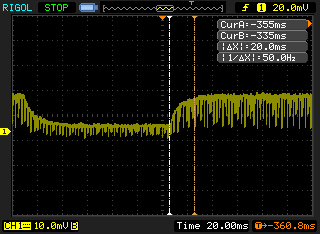 |
| ↘ 18 ms fall | ||
| The screen shows slow response rates in our tests and will be unsatisfactory for gamers. In comparison, all tested devices range from 0.165 (minimum) to 636 (maximum) ms. » 55 % of all devices are better. This means that the measured response time is worse than the average of all tested devices (31.1 ms). | ||
Screen Flickering / PWM (Pulse-Width Modulation)
| Screen flickering / PWM detected | 21740 Hz | ≤ 100 % brightness setting | 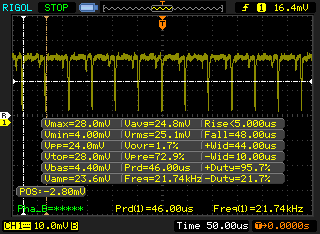 |
The display backlight flickers at 21740 Hz (worst case, e.g., utilizing PWM) Flickering detected at a brightness setting of 100 % and below. There should be no flickering or PWM above this brightness setting. The frequency of 21740 Hz is quite high, so most users sensitive to PWM should not notice any flickering. In comparison: 52 % of all tested devices do not use PWM to dim the display. If PWM was detected, an average of 7810 (minimum: 5 - maximum: 343500) Hz was measured. | |||
| Cinebench R15 | |
| CPU Single 64Bit | |
| Dell Precision 5520 UHD | |
| Lenovo ThinkPad P71-20HK0004GE | |
| MSI GS63VR 7RF-228US | |
| MSI WS63 7RF-290US | |
| MSI WS60 6QJ-535VPL | |
| MSI GE62 2QC-468XPL | |
| MSI GE72VR-6RF16H21 | |
| Nvidia Titan X (Pascal) | |
| CPU Multi 64Bit | |
| Nvidia Titan X (Pascal) | |
| Lenovo ThinkPad P71-20HK0004GE | |
| MSI WS63 7RF-290US | |
| MSI GS63VR 7RF-228US | |
| MSI GE62 2QC-468XPL | |
| MSI GE72VR-6RF16H21 | |
| MSI WS60 6QJ-535VPL | |
| Dell Precision 5520 UHD | |
| Cinebench R11.5 | |
| CPU Single 64Bit | |
| Dell Precision 5520 UHD | |
| Lenovo ThinkPad P71-20HK0004GE | |
| MSI WS63 7RF-290US | |
| MSI GS63VR 7RF-228US | |
| MSI GE62 2QC-468XPL | |
| MSI GE72VR-6RF16H21 | |
| Nvidia Titan X (Pascal) | |
| CPU Multi 64Bit | |
| Nvidia Titan X (Pascal) | |
| Lenovo ThinkPad P71-20HK0004GE | |
| MSI GS63VR 7RF-228US | |
| MSI WS63 7RF-290US | |
| MSI GE62 2QC-468XPL | |
| Dell Precision 5520 UHD | |
| MSI GE72VR-6RF16H21 | |
| Cinebench R10 | |
| Rendering Multiple CPUs 32Bit | |
| Nvidia Titan X (Pascal) | |
| Lenovo ThinkPad P71-20HK0004GE | |
| MSI WS63 7RF-290US | |
| MSI GS63VR 7RF-228US | |
| MSI GE62 2QC-468XPL | |
| MSI GE72VR-6RF16H21 | |
| Rendering Single 32Bit | |
| Lenovo ThinkPad P71-20HK0004GE | |
| MSI WS63 7RF-290US | |
| MSI GS63VR 7RF-228US | |
| MSI GE62 2QC-468XPL | |
| MSI GE72VR-6RF16H21 | |
| Nvidia Titan X (Pascal) | |
| wPrime 2.10 - 1024m | |
| MSI WS60 6QJ-535VPL | |
| Dell Precision 5520 UHD | |
| MSI GS63VR 7RF-228US | |
| MSI WS63 7RF-290US | |
| MSI GE62 2QC-468XPL | |
* ... smaller is better
| PCMark 8 | |
| Home Score Accelerated v2 | |
| EVGA SC15 | |
| MSI WS63 7RF-290US | |
| Lenovo ThinkPad P51 20HH0016GE | |
| MSI WS60-6QJE316H11 | |
| Work Score Accelerated v2 | |
| EVGA SC15 | |
| MSI WS63 7RF-290US | |
| Lenovo ThinkPad P51 20HH0016GE | |
| MSI WS60-6QJE316H11 | |
| Creative Score Accelerated v2 | |
| EVGA SC15 | |
| Lenovo ThinkPad P51 20HH0016GE | |
| MSI WS63 7RF-290US | |
| PCMark 8 Home Score Accelerated v2 | 4284 points | |
| PCMark 8 Creative Score Accelerated v2 | 5348 points | |
| PCMark 8 Work Score Accelerated v2 | 5331 points | |
Help | ||
| MSI WS63 7RF-290US Samsung SM961 MZVKW512HMJP m.2 PCI-e | MSI WS60 6QJ-535VPL 2x Plextor PX512M6GV-2280 (RAID 0) | Lenovo ThinkPad P51 20HH0016GE Samsung PM961 NVMe MZVLW512HMJP | Dell Precision 5520 UHD Samsung SM961 MZVKW512HMJP m.2 PCI-e | Fujitsu Celsius H760 Samsung SM951 MZVPV512 m.2 PCI-e | |
|---|---|---|---|---|---|
| AS SSD | -55% | -4% | -1% | -17% | |
| Copy Game MB/s (MB/s) | 1121 | 1140 2% | 921 -18% | 978 -13% | |
| Copy Program MB/s (MB/s) | 447.3 | 425.6 -5% | 372.8 -17% | 571 28% | |
| Copy ISO MB/s (MB/s) | 1760 | 1607 -9% | 1659 -6% | 1325 -25% | |
| Score Total (Points) | 3759 | 1392 -63% | 3424 -9% | 3681 -2% | 2201 -41% |
| Score Write (Points) | 1440 | 543 -62% | 917 -36% | 1379 -4% | 623 -57% |
| Score Read (Points) | 1568 | 557 -64% | 1690 8% | 1554 -1% | 1048 -33% |
| Access Time Write * (ms) | 0.028 | 0.041 -46% | 0.025 11% | 0.023 18% | 0.018 36% |
| Access Time Read * (ms) | 0.036 | 0.054 -50% | 0.032 11% | 0.038 -6% | 0.036 -0% |
| 4K-64 Write (MB/s) | 1151 | 375.8 -67% | 623 -46% | 1055 -8% | 285 -75% |
| 4K-64 Read (MB/s) | 1244 | 437.1 -65% | 1372 10% | 1223 -2% | 801 -36% |
| 4K Write (MB/s) | 128.5 | 85 -34% | 143.1 11% | 155.3 21% | 188 46% |
| 4K Read (MB/s) | 49.02 | 32.19 -34% | 55.6 13% | 51.5 5% | 34 -31% |
| Seq Write (MB/s) | 1603 | 821 -49% | 1506 -6% | 1694 6% | 1492 -7% |
| Seq Read (MB/s) | 2750 | 880 -68% | 2624 -5% | 2799 2% | 1916 -30% |
* ... smaller is better

| 3DMark | |
| 1920x1080 Fire Strike Graphics | |
| Desktop PC Intel Xeon E5 2680v4 KFA2 GTX 1060 6GB | |
| Fujitsu Celsius H970 | |
| Asus Strix GL502VY-DS71 | |
| MSI WS63 7RF-290US | |
| MSI WT72-6QM | |
| Lenovo ThinkPad P71-20HK0004GE | |
| Lenovo ThinkPad P70-20ER000XUS | |
| HP ZBook 17 G3 TZV66eA | |
| Fujitsu Celsius H760 | |
| Fire Strike Extreme Graphics | |
| Desktop PC Intel Xeon E5 2680v4 KFA2 GTX 1060 6GB | |
| Fujitsu Celsius H970 | |
| Asus Strix GL502VY-DS71 | |
| MSI WS63 7RF-290US | |
| MSI WT72-6QM | |
| Lenovo ThinkPad P71-20HK0004GE | |
| Lenovo ThinkPad P70-20ER000XUS | |
| 3DMark 11 | |
| 1280x720 Performance GPU | |
| Desktop PC Intel Xeon E5 2680v4 KFA2 GTX 1060 6GB | |
| Fujitsu Celsius H970 | |
| Asus Strix GL502VY-DS71 | |
| MSI WS63 7RF-290US | |
| MSI WT72-6QM | |
| Lenovo ThinkPad P71-20HK0004GE | |
| Lenovo ThinkPad P70-20ER000XUS | |
| HP ZBook 17 G3 TZV66eA | |
| 1280x720 Performance Combined | |
| Desktop PC Intel Xeon E5 2680v4 KFA2 GTX 1060 6GB | |
| Lenovo ThinkPad P71-20HK0004GE | |
| MSI WT72-6QM | |
| MSI WS63 7RF-290US | |
| HP ZBook 17 G3 TZV66eA | |
| Asus Strix GL502VY-DS71 | |
| Lenovo ThinkPad P70-20ER000XUS | |
| Fujitsu Celsius H970 | |
| Rise of the Tomb Raider - 1920x1080 Very High Preset AA:FX AF:16x | |
| EVGA SC15 | |
| Asus Strix GL502VY-DS71 | |
| MSI WS63 7RF-290US | |
| Lenovo ThinkPad P70-20ER000XUS | |
| Asus GL753VE-DS74 | |
| HP ZBook 17 G3 TZV66eA | |
| HP Pavilion 15 Power 1GK62AV | |
| low | med. | high | ultra | |
|---|---|---|---|---|
| BioShock Infinite (2013) | 92.1 | |||
| Metro: Last Light (2013) | 67.5 | |||
| Thief (2014) | 65 | |||
| The Witcher 3 (2015) | 66 | 33 | ||
| Batman: Arkham Knight (2015) | 73 | 49 | ||
| Metal Gear Solid V (2015) | 60 | |||
| Fallout 4 (2015) | 51.9 | |||
| Rise of the Tomb Raider (2016) | 53.6 | |||
| Ashes of the Singularity (2016) | 52.5 | 47.8 | ||
| Doom (2016) | 73 | |||
| Overwatch (2016) | 89.9 | |||
| Mafia 3 (2016) | 36.5 | |||
| Prey (2017) | 89.3 |
Noise level
| Idle |
| 28.1 / 28.1 / 32 dB(A) |
| Load |
| 38 / 47.2 dB(A) |
 | ||
30 dB silent 40 dB(A) audible 50 dB(A) loud |
||
min: | ||
| MSI WS63 7RF-290US Quadro P3000, i7-7700HQ, Samsung SM961 MZVKW512HMJP m.2 PCI-e | Lenovo ThinkPad P51 20HH0016GE Quadro M2200, E3-1505M v6, Samsung PM961 NVMe MZVLW512HMJP | Dell Precision 5520 UHD Quadro M1200, E3-1505M v6, Samsung SM961 MZVKW512HMJP m.2 PCI-e | MSI WS60-6QJE316H11 Quadro M2000M, E3-1505M v5, Toshiba NVMe THNSN5128GP | HP ZBook 15 G3 Quadro M2000M, E3-1505M v5, Samsung SM951 MZVPV512HDGL m.2 PCI-e | Fujitsu Celsius H760 Quadro M2000M, E3-1505M v5, Samsung SM951 MZVPV512 m.2 PCI-e | |
|---|---|---|---|---|---|---|
| Noise | 5% | -7% | -20% | -7% | -3% | |
| off / environment * (dB) | 28.1 | 29.6 -5% | 28.7 -2% | 30 -7% | 29 -3% | |
| Idle Minimum * (dB) | 28.1 | 29.6 -5% | 28.7 -2% | 37.2 -32% | 30 -7% | 29 -3% |
| Idle Average * (dB) | 28.1 | 29.6 -5% | 32.1 -14% | 37.2 -32% | 30 -7% | 29 -3% |
| Idle Maximum * (dB) | 32 | 29.6 7% | 32.1 -0% | 37.2 -16% | 30 6% | 29 9% |
| Load Average * (dB) | 38 | 32.2 15% | 41.3 -9% | 42.1 -11% | 45.3 -19% | 43.1 -13% |
| Witcher 3 ultra * (dB) | 35.8 | 45.5 -27% | ||||
| Load Maximum * (dB) | 47.2 | 36.6 22% | 45.5 4% | 50.7 -7% | 49.7 -5% | 49.2 -4% |
* ... smaller is better
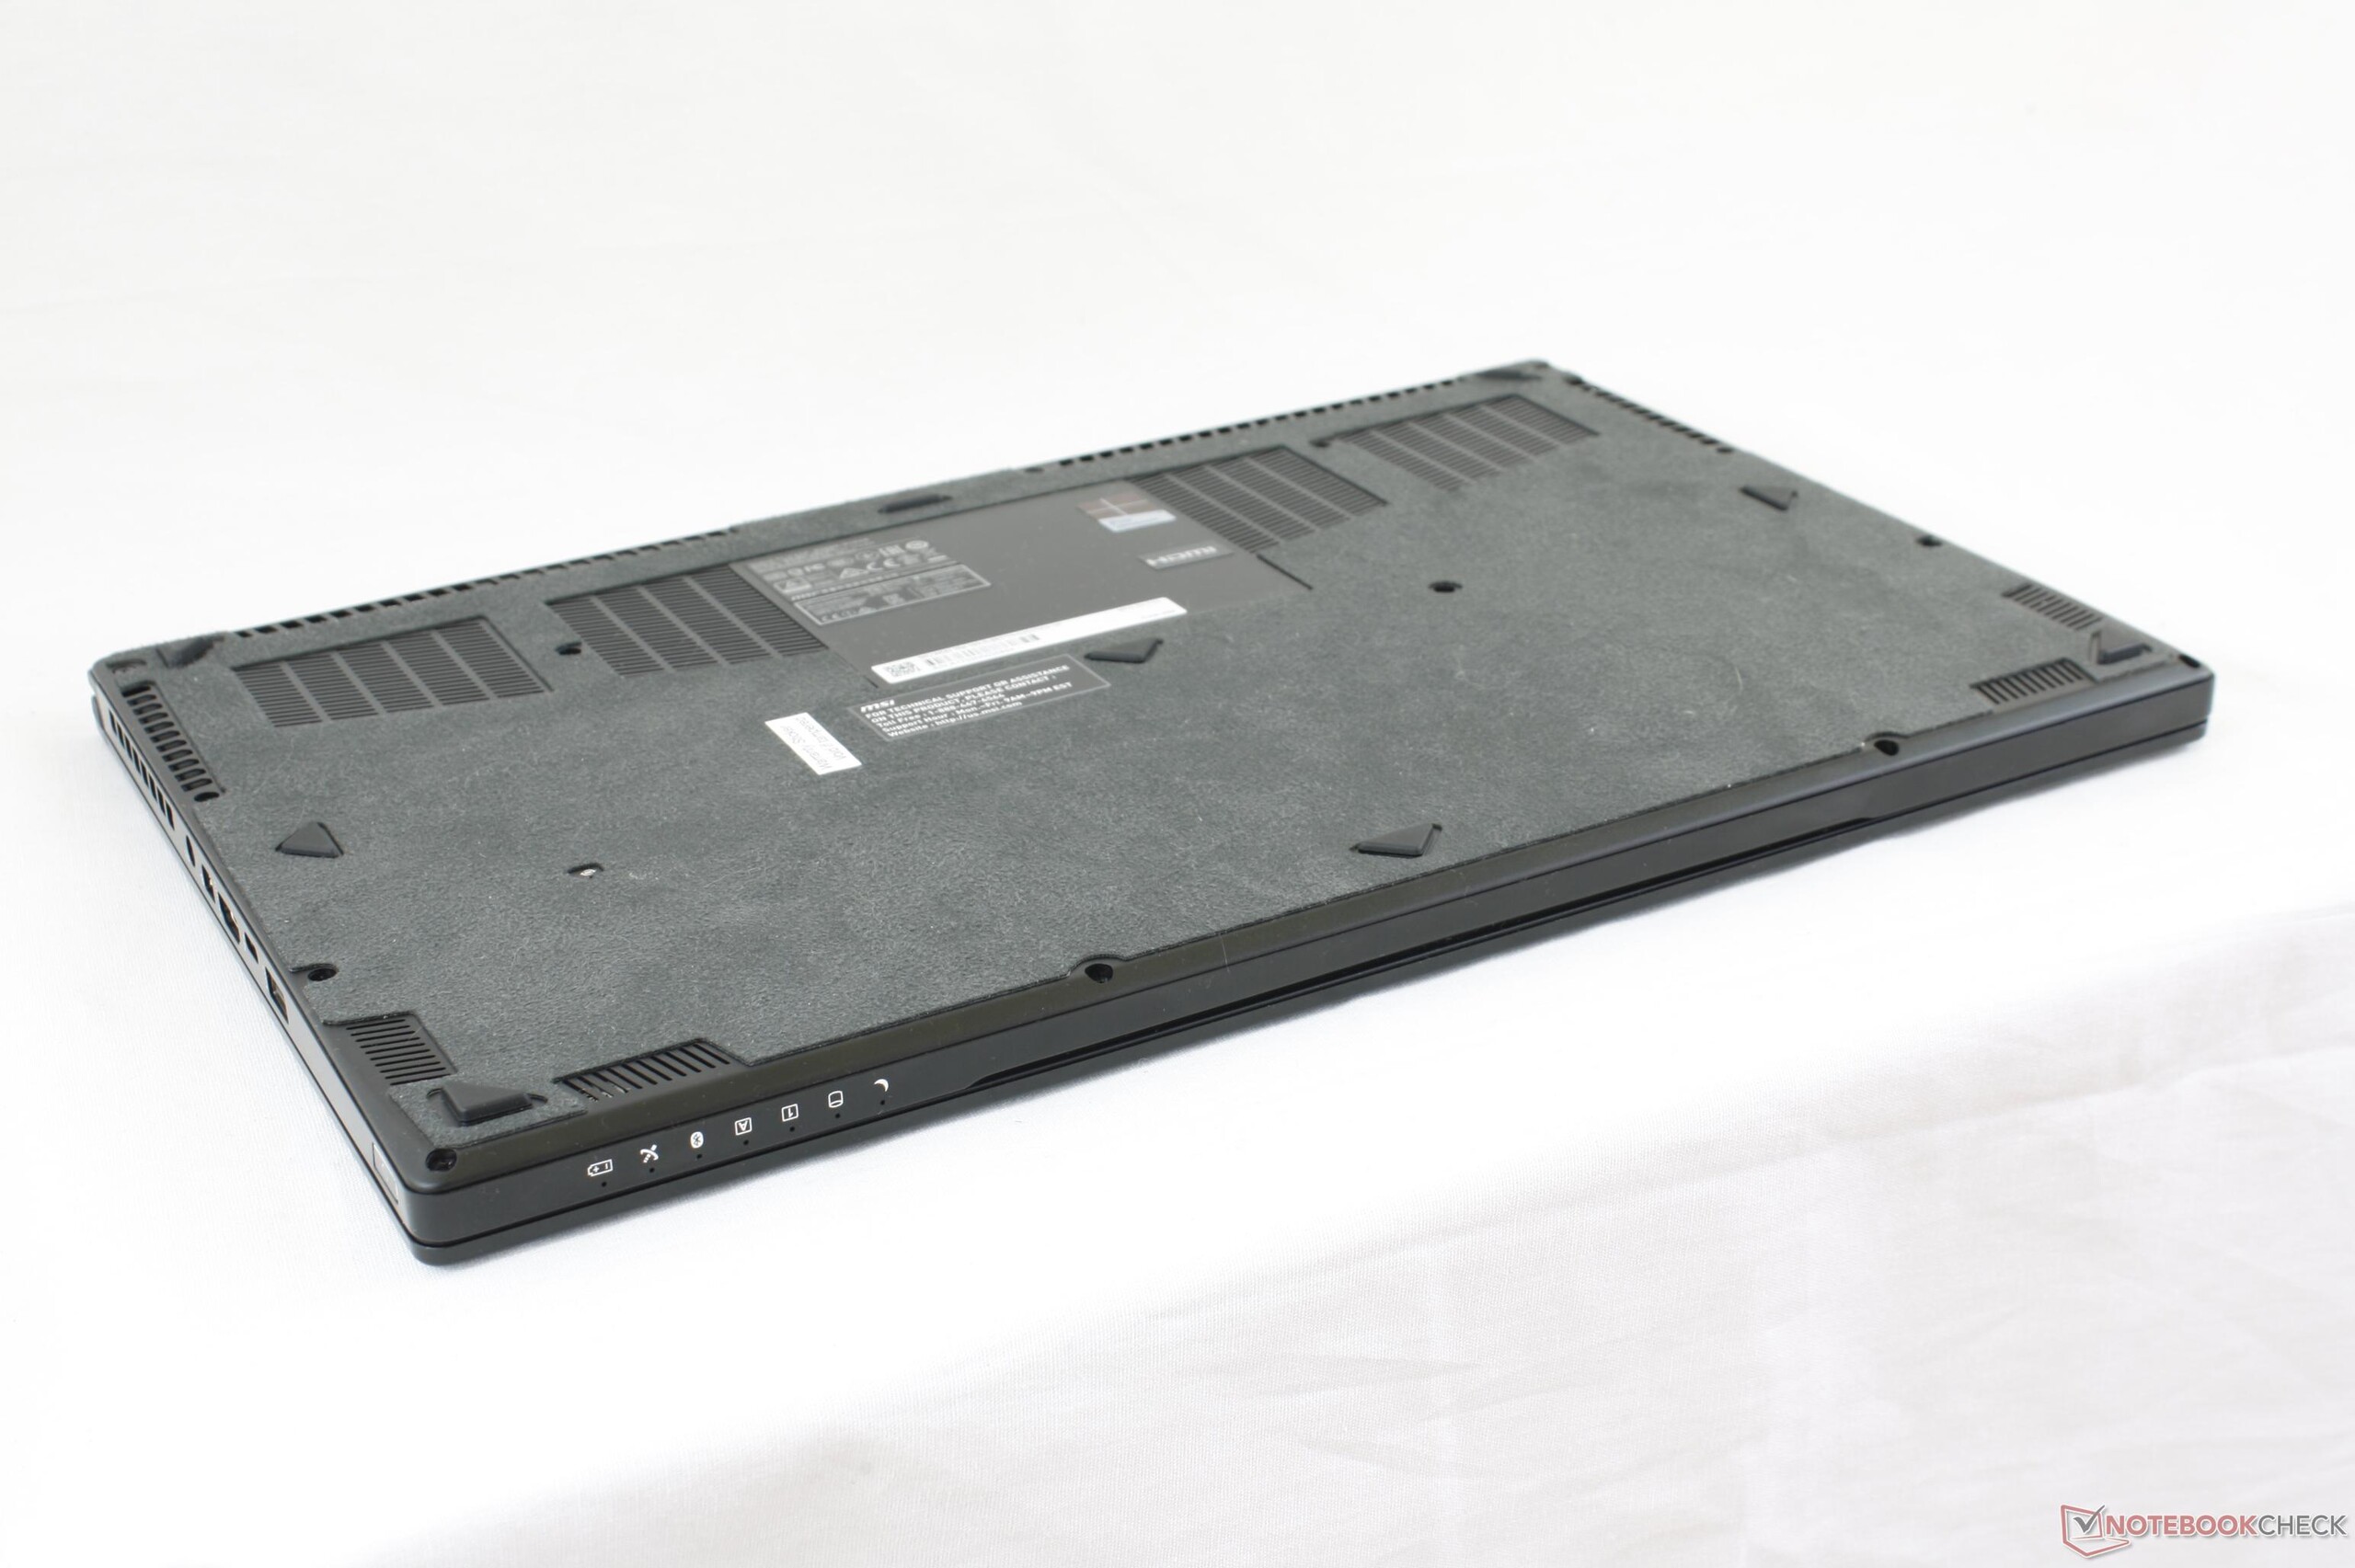
(-) The maximum temperature on the upper side is 46.4 °C / 116 F, compared to the average of 38.2 °C / 101 F, ranging from 22.2 to 69.8 °C for the class Workstation.
(-) The bottom heats up to a maximum of 62 °C / 144 F, compared to the average of 41.1 °C / 106 F
(+) In idle usage, the average temperature for the upper side is 27.2 °C / 81 F, compared to the device average of 32 °C / 90 F.
(±) Playing The Witcher 3, the average temperature for the upper side is 36.2 °C / 97 F, compared to the device average of 32 °C / 90 F.
(±) The palmrests and touchpad can get very hot to the touch with a maximum of 36.4 °C / 97.5 F.
(-) The average temperature of the palmrest area of similar devices was 27.8 °C / 82 F (-8.6 °C / -15.5 F).
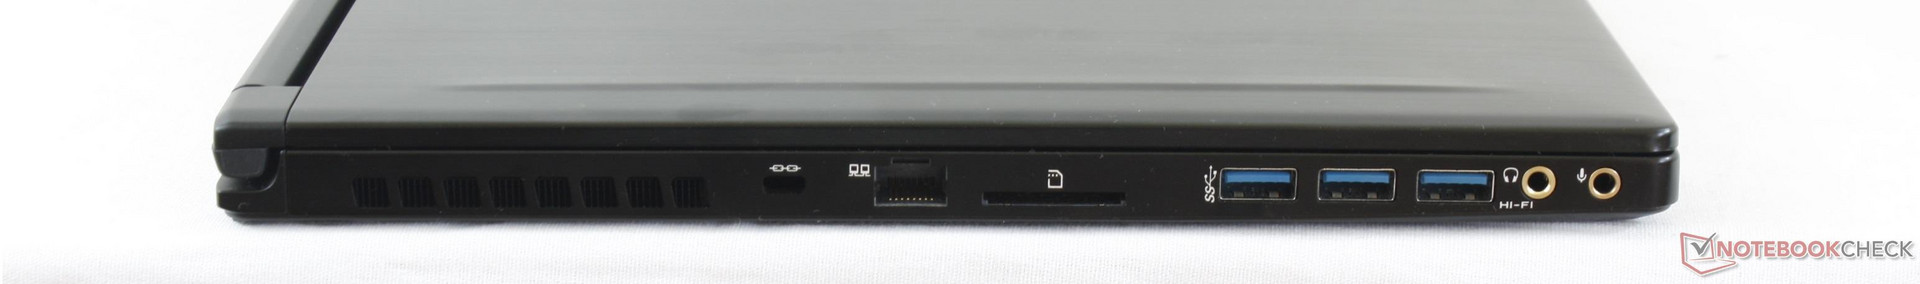
MSI WS63 7RF-290US audio analysis
(-) | not very loud speakers (66.6 dB)
Bass 100 - 315 Hz
(-) | nearly no bass - on average 17.1% lower than median
(±) | linearity of bass is average (11.9% delta to prev. frequency)
Mids 400 - 2000 Hz
(±) | higher mids - on average 6.4% higher than median
(-) | mids are not linear (15.4% delta to prev. frequency)
Highs 2 - 16 kHz
(+) | balanced highs - only 4.8% away from median
(±) | linearity of highs is average (10.8% delta to prev. frequency)
Overall 100 - 16.000 Hz
(-) | overall sound is not linear (35.1% difference to median)
Compared to same class
» 99% of all tested devices in this class were better, 1% similar, 0% worse
» The best had a delta of 7%, average was 17%, worst was 35%
Compared to all devices tested
» 93% of all tested devices were better, 1% similar, 6% worse
» The best had a delta of 4%, average was 24%, worst was 134%
Apple MacBook 12 (Early 2016) 1.1 GHz audio analysis
(+) | speakers can play relatively loud (83.6 dB)
Bass 100 - 315 Hz
(±) | reduced bass - on average 11.3% lower than median
(±) | linearity of bass is average (14.2% delta to prev. frequency)
Mids 400 - 2000 Hz
(+) | balanced mids - only 2.4% away from median
(+) | mids are linear (5.5% delta to prev. frequency)
Highs 2 - 16 kHz
(+) | balanced highs - only 2% away from median
(+) | highs are linear (4.5% delta to prev. frequency)
Overall 100 - 16.000 Hz
(+) | overall sound is linear (10.2% difference to median)
Compared to same class
» 7% of all tested devices in this class were better, 2% similar, 91% worse
» The best had a delta of 5%, average was 18%, worst was 53%
Compared to all devices tested
» 5% of all tested devices were better, 1% similar, 94% worse
» The best had a delta of 4%, average was 24%, worst was 134%
| Off / Standby | |
| Idle | |
| Load |
|
Key:
min: | |
| MSI WS63 7RF-290US i7-7700HQ, Quadro P3000, Samsung SM961 MZVKW512HMJP m.2 PCI-e, IPS, 1920x1080, 15.6" | MSI WS60-6QJE316H11 E3-1505M v5, Quadro M2000M, Toshiba NVMe THNSN5128GP, IPS, 3840x2160, 15.6" | EVGA SC15 i7-7700HQ, GeForce GTX 1060 Mobile, Toshiba NVMe THNSN5256GPU7, , 1920x1080, 15.6" | HP ZBook 17 G3 TZV66eA E3-1535M v5, Quadro M3000M, Samsung SM951 MZVPV256HDGL m.2 PCI-e, IPS, 1920x1080, 17.3" | MSI WT72-6QM E3-1505M v5, Quadro M5000M, Toshiba NVMe THNSN5256GPU7, IPS, 1920x1080, 17.3" | |
|---|---|---|---|---|---|
| Power Consumption | -59% | -57% | -0% | -79% | |
| Idle Minimum * (Watt) | 11 | 18.8 -71% | 25.8 -135% | 6.7 39% | 24.8 -125% |
| Idle Average * (Watt) | 14.2 | 29.6 -108% | 26.6 -87% | 12.5 12% | 29.7 -109% |
| Idle Maximum * (Watt) | 14.6 | 30.3 -108% | 26.7 -83% | 13.2 10% | 30.1 -106% |
| Load Average * (Watt) | 77.7 | 90.4 -16% | 80.3 -3% | 128.2 -65% | 105.2 -35% |
| Witcher 3 ultra * (Watt) | 89.1 | 121.2 -36% | |||
| Load Maximum * (Watt) | 161.7 | 150.2 7% | 159.3 1% | 158.9 2% | 192.2 -19% |
* ... smaller is better
| MSI WS63 7RF-290US i7-7700HQ, Quadro P3000, 65 Wh | MSI WS60-6QJE316H11 E3-1505M v5, Quadro M2000M, 47 Wh | Lenovo ThinkPad P51 20HH0016GE E3-1505M v6, Quadro M2200, 90 Wh | Dell Precision 5520 UHD E3-1505M v6, Quadro M1200, 97 Wh | MSI WT72-6QM E3-1505M v5, Quadro M5000M, Wh | HP ZBook 15 G3 E3-1505M v5, Quadro M2000M, 90 Wh | |
|---|---|---|---|---|---|---|
| Battery runtime | -50% | 70% | 14% | -3% | 60% | |
| Reader / Idle (h) | 7.1 | 2.7 -62% | 16.4 131% | 12.1 70% | 6.9 -3% | 13.7 93% |
| WiFi v1.3 (h) | 4.7 | 1.8 -62% | 6.9 47% | 4.2 -11% | 4.1 -13% | 6.4 36% |
| Load (h) | 1.2 | 0.9 -25% | 1.6 33% | 1 -17% | 1.3 8% | 1.8 50% |
Pros
Cons
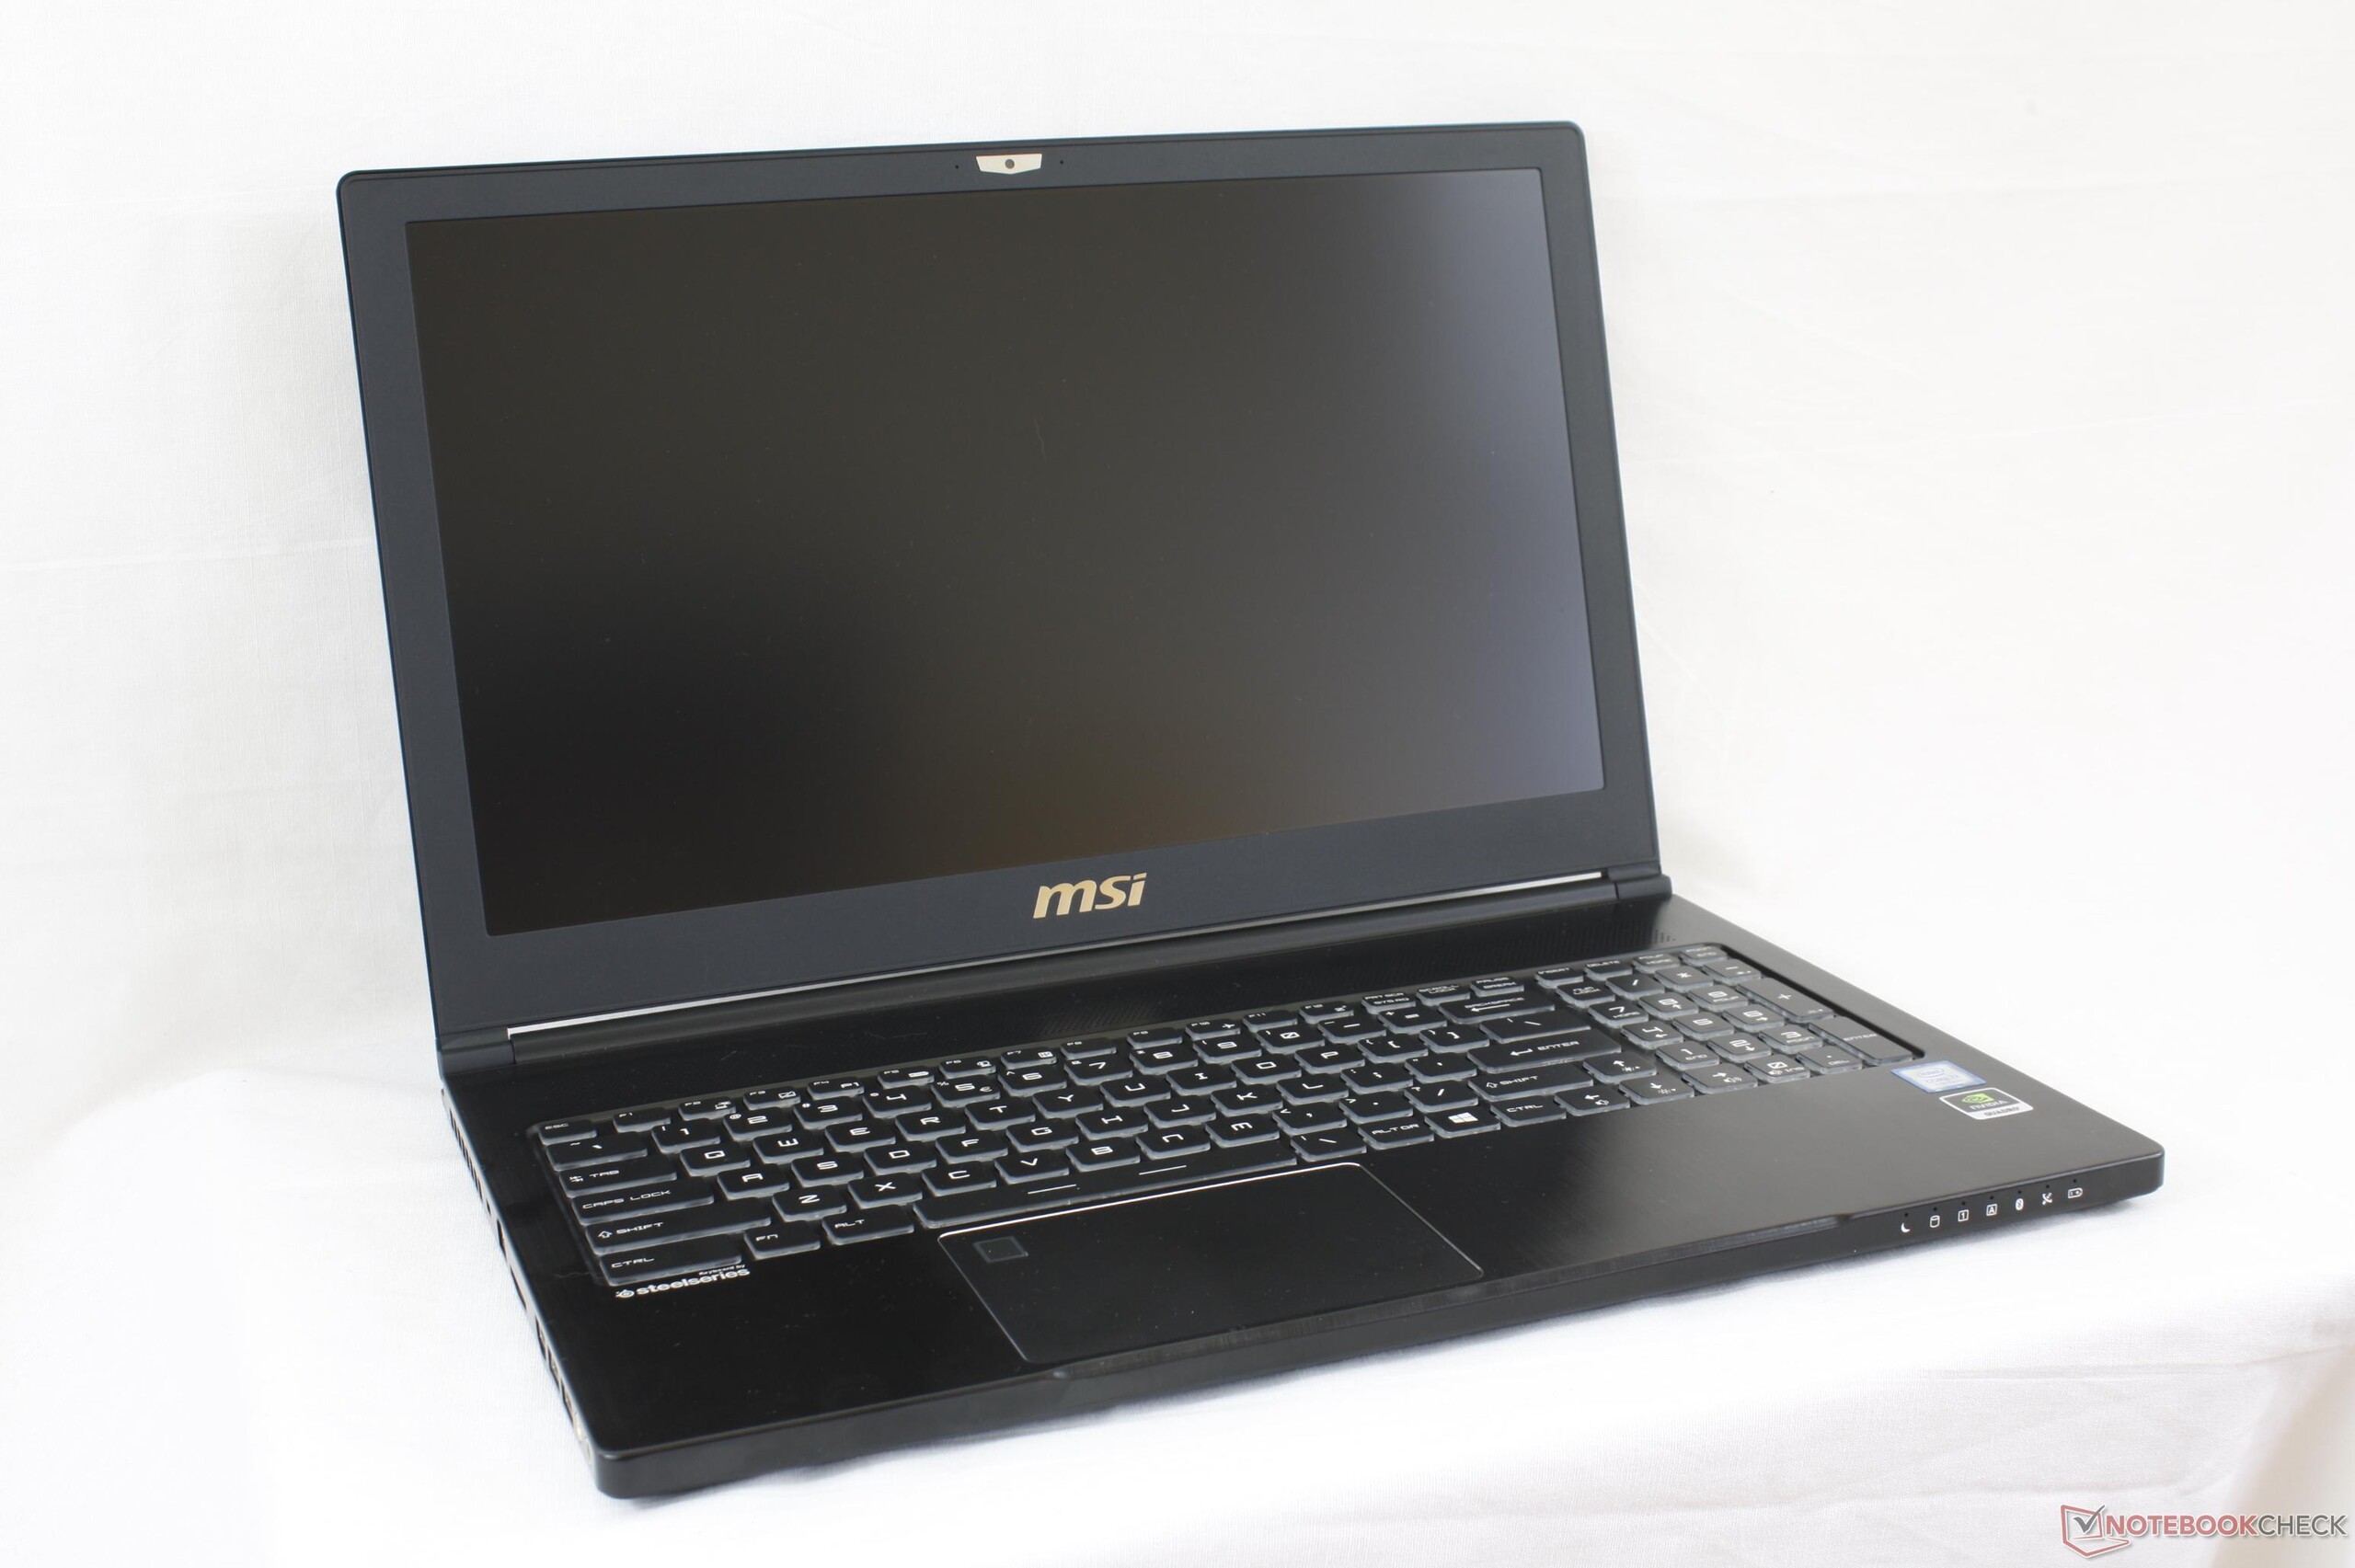
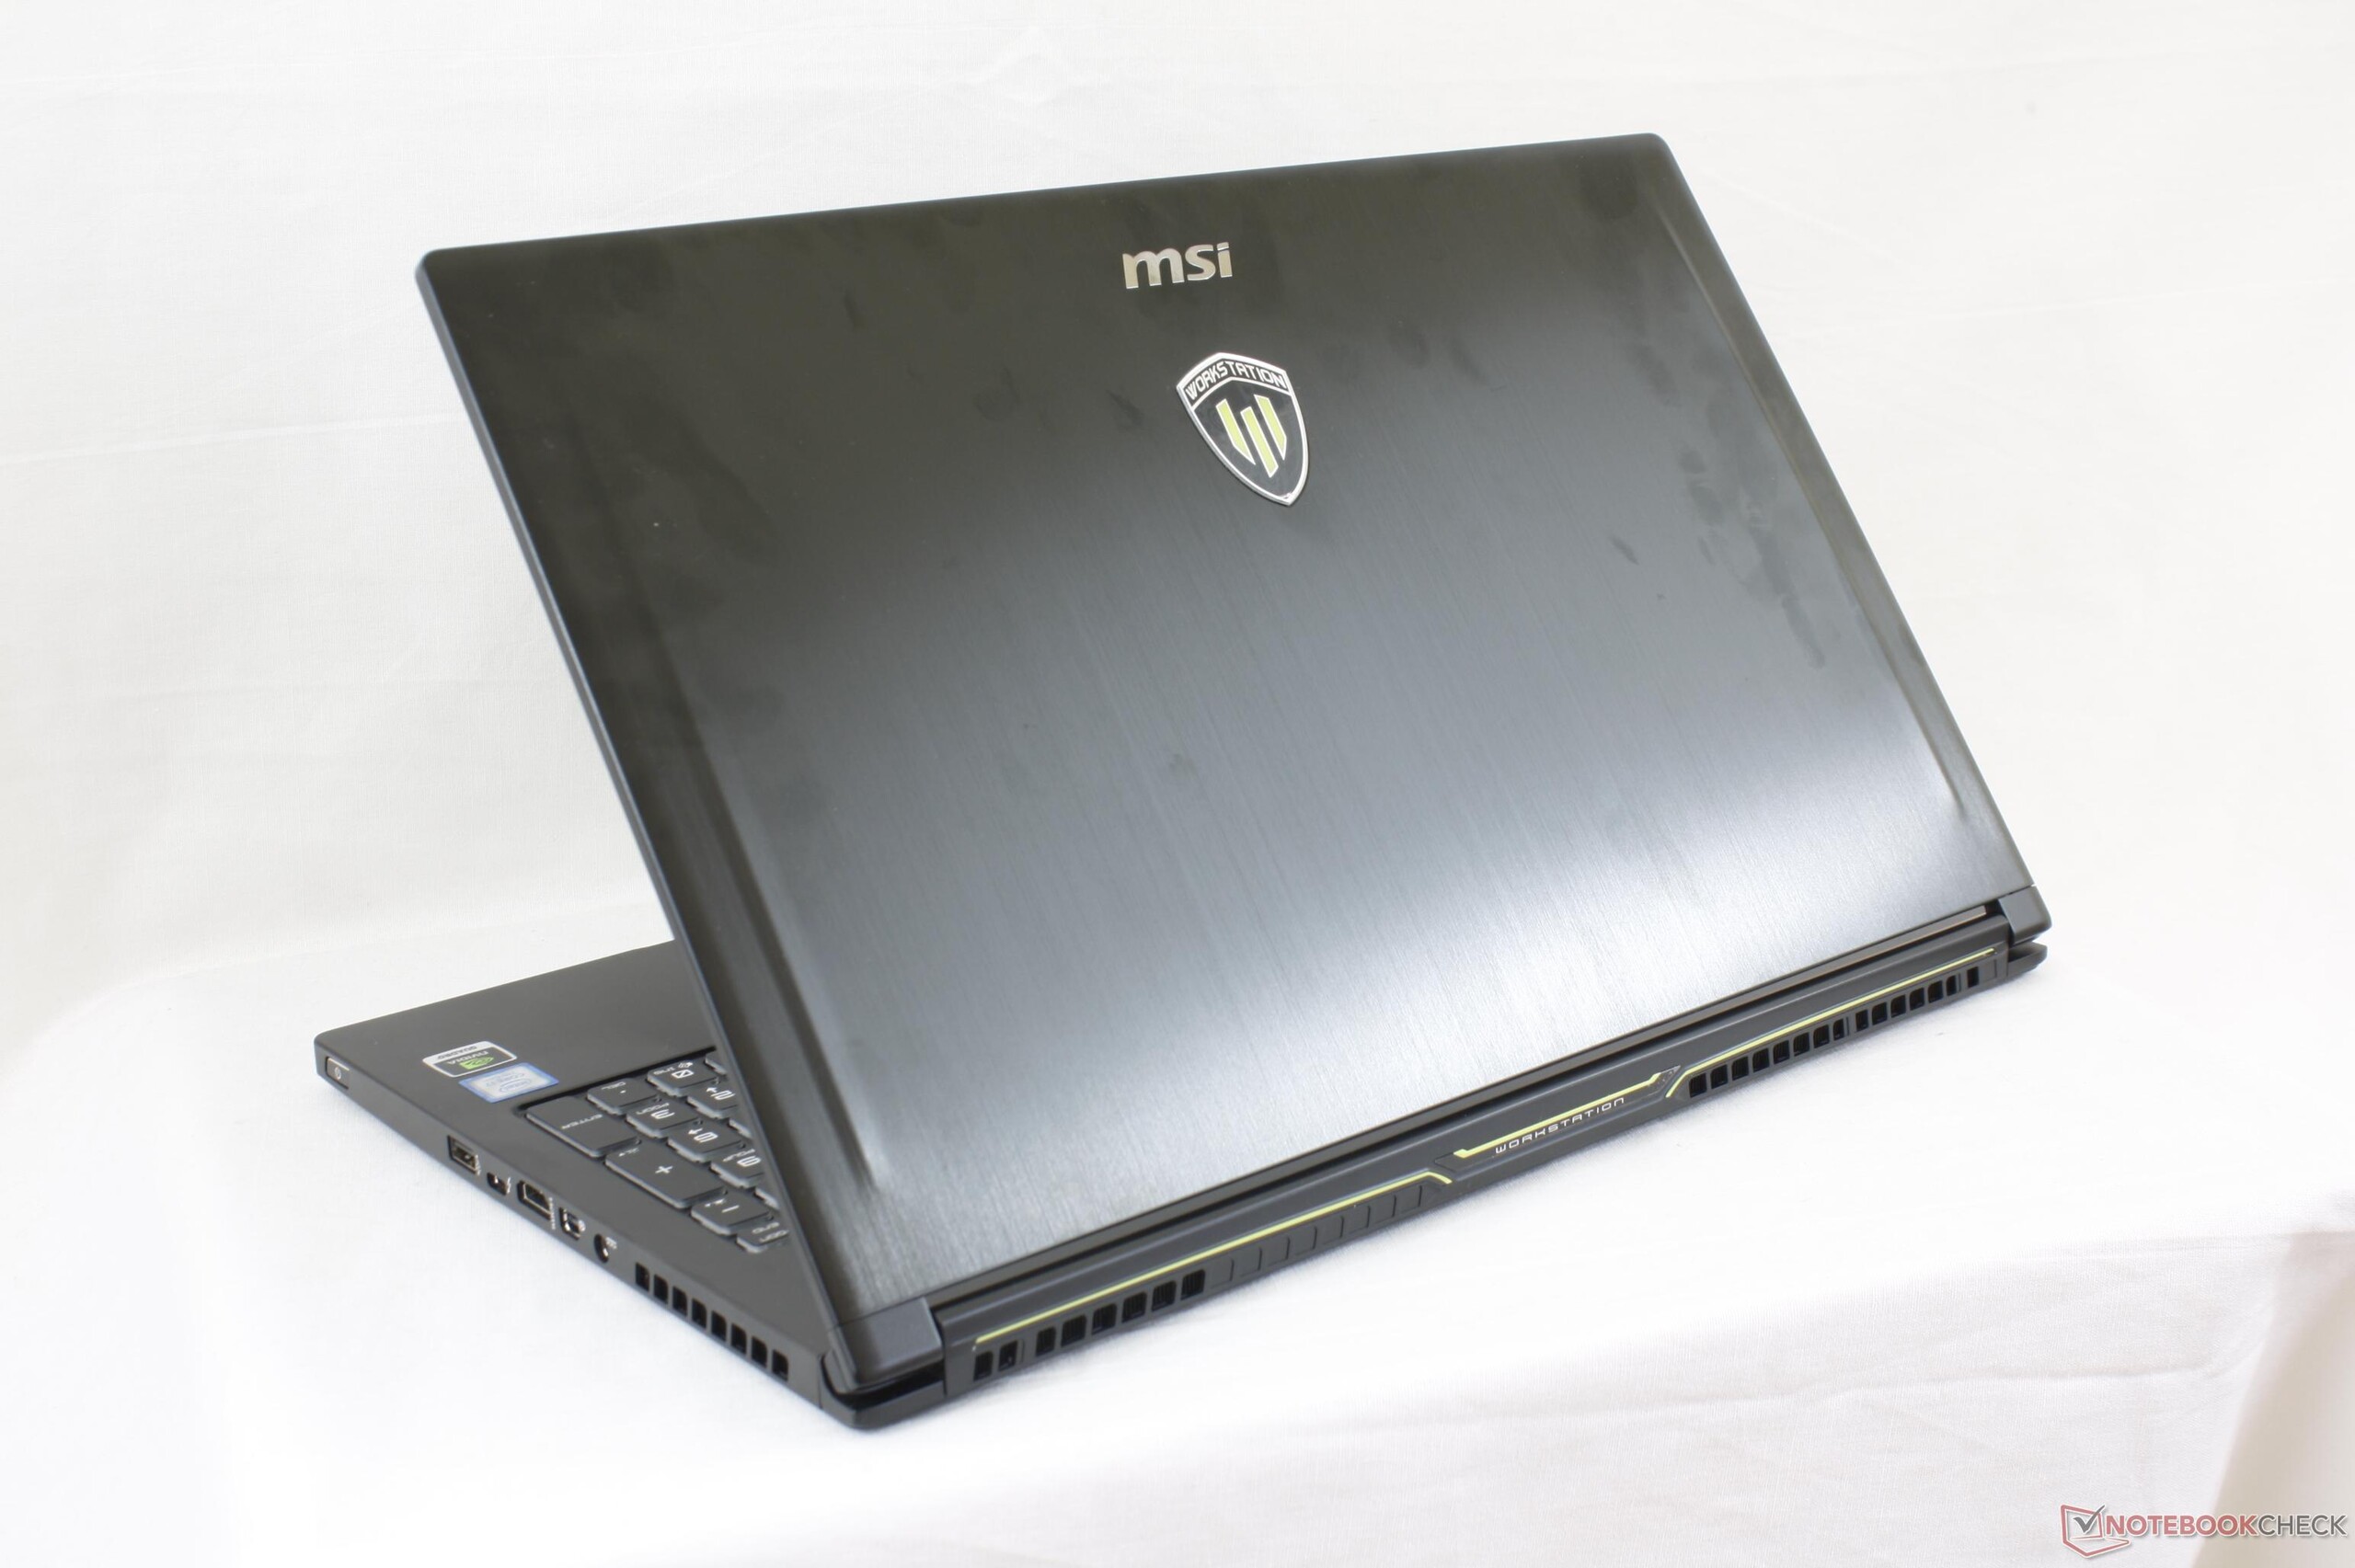
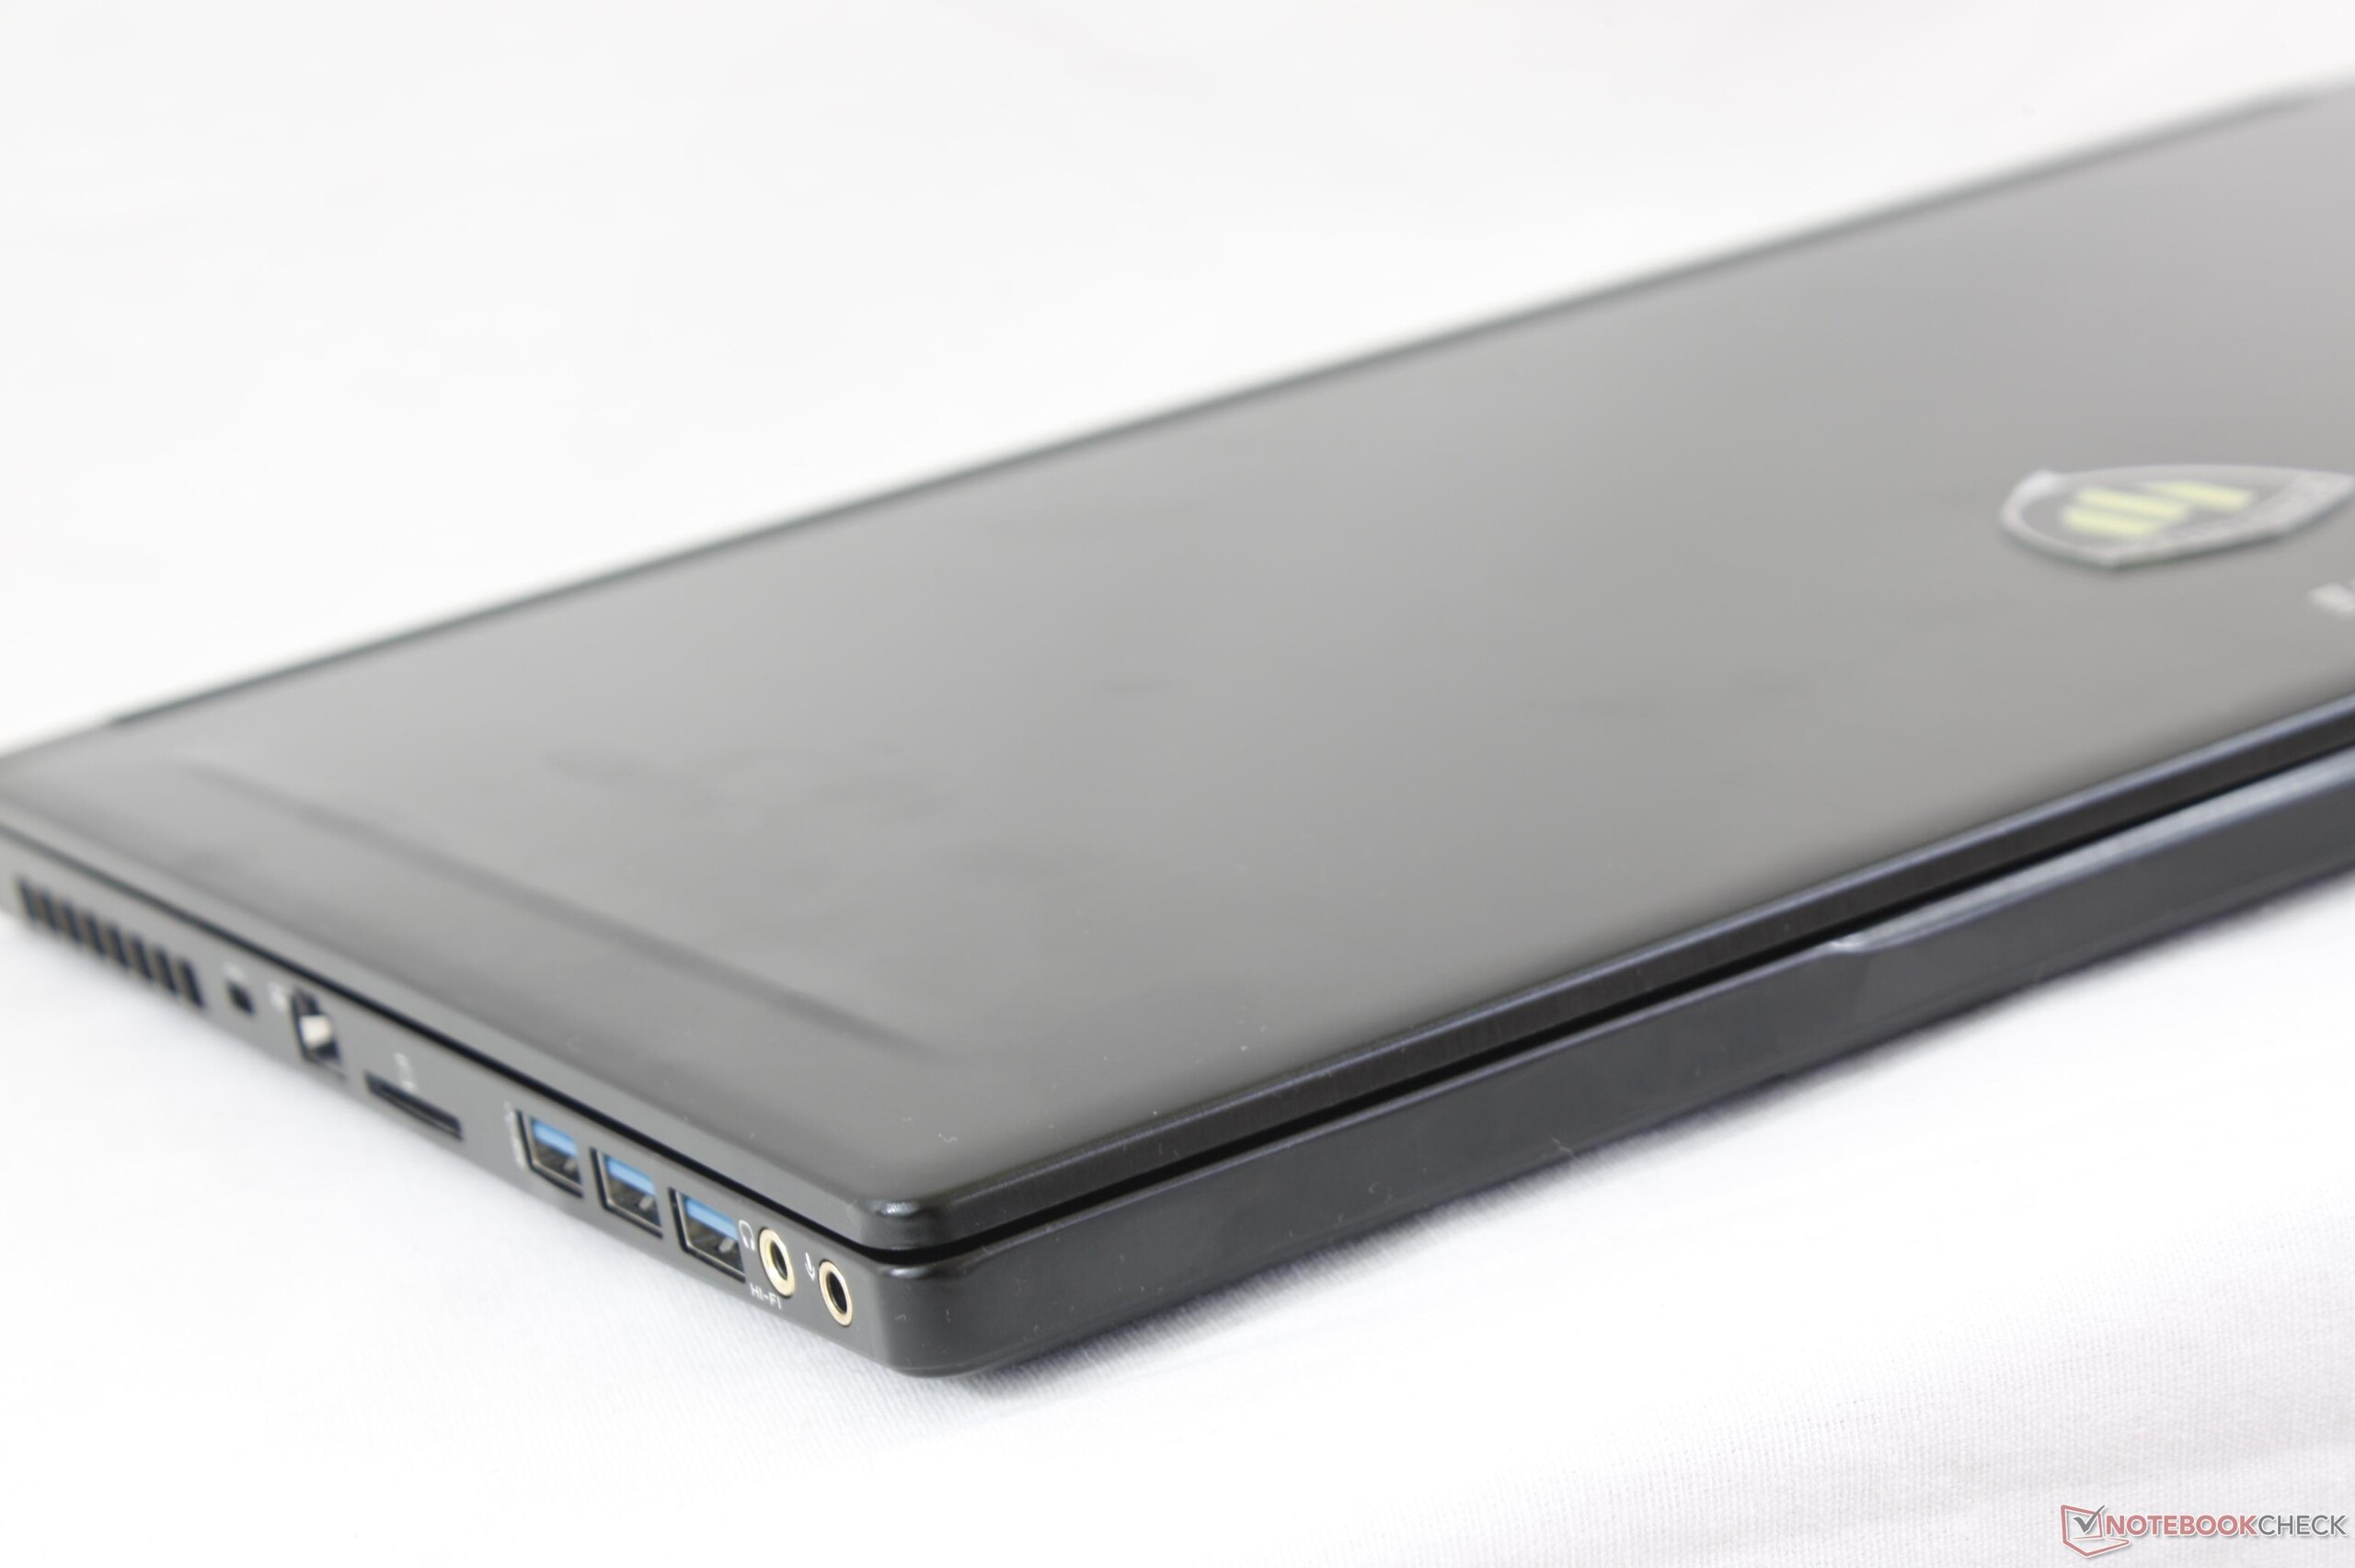
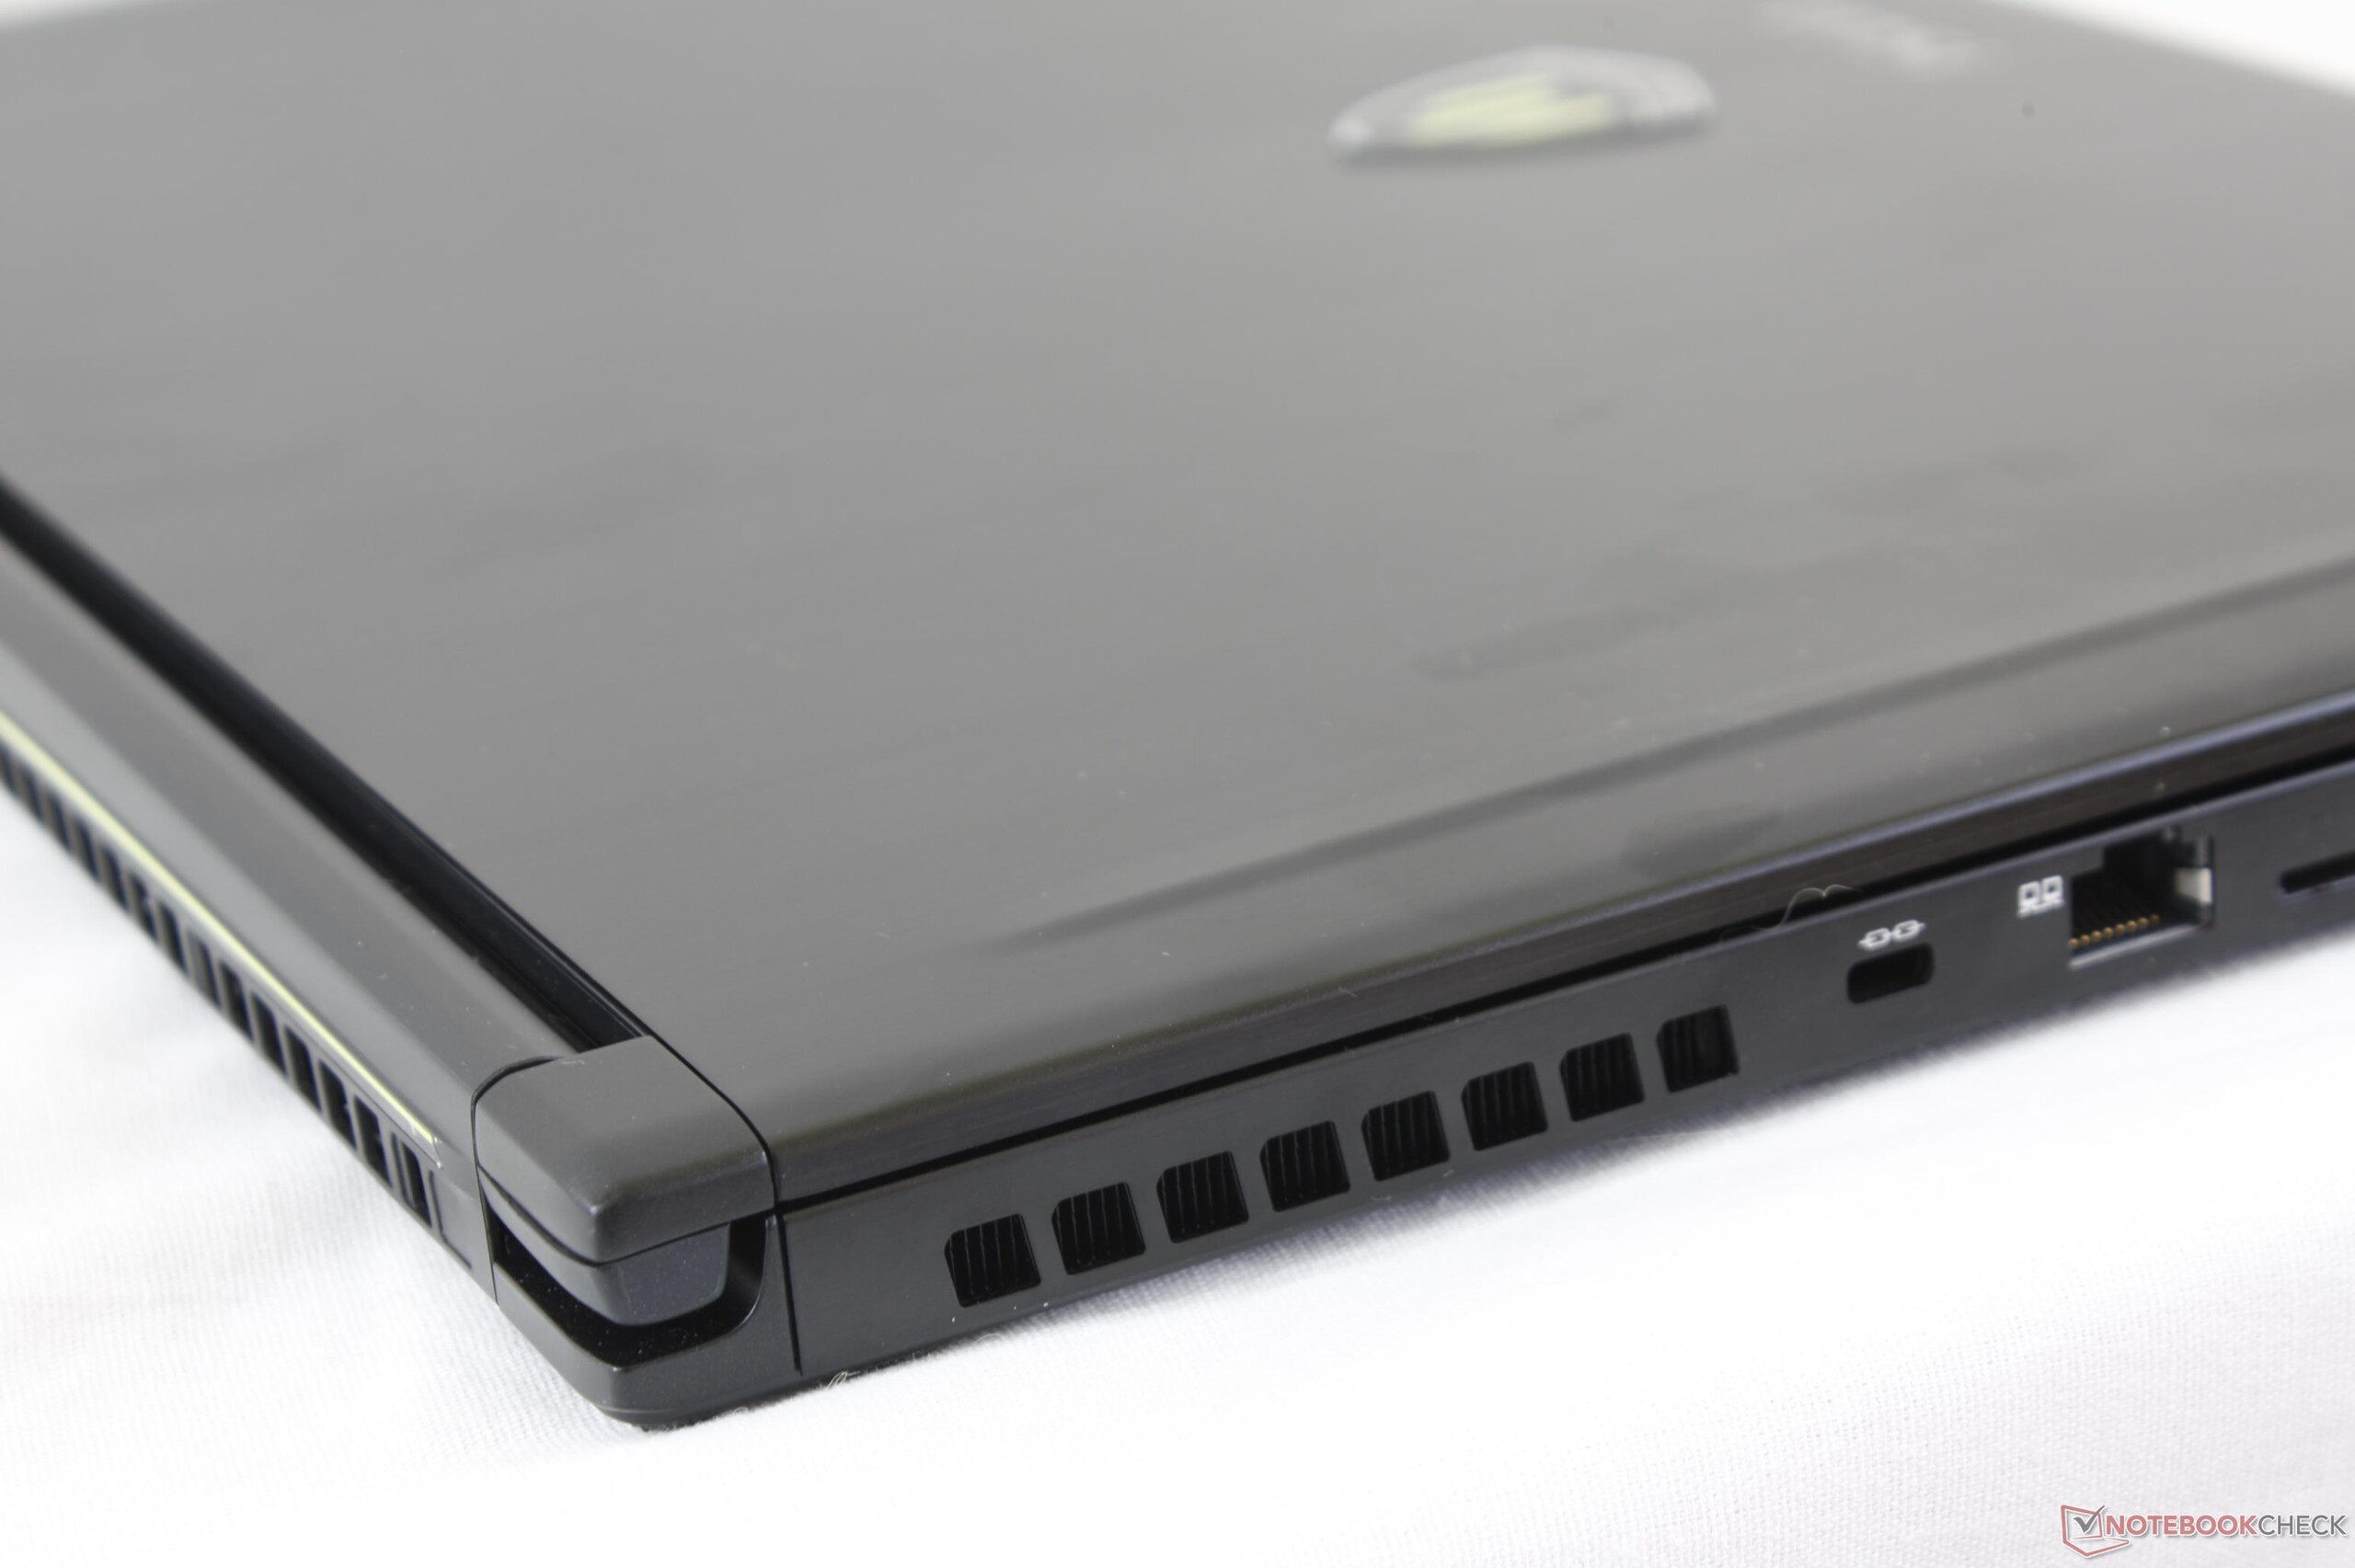
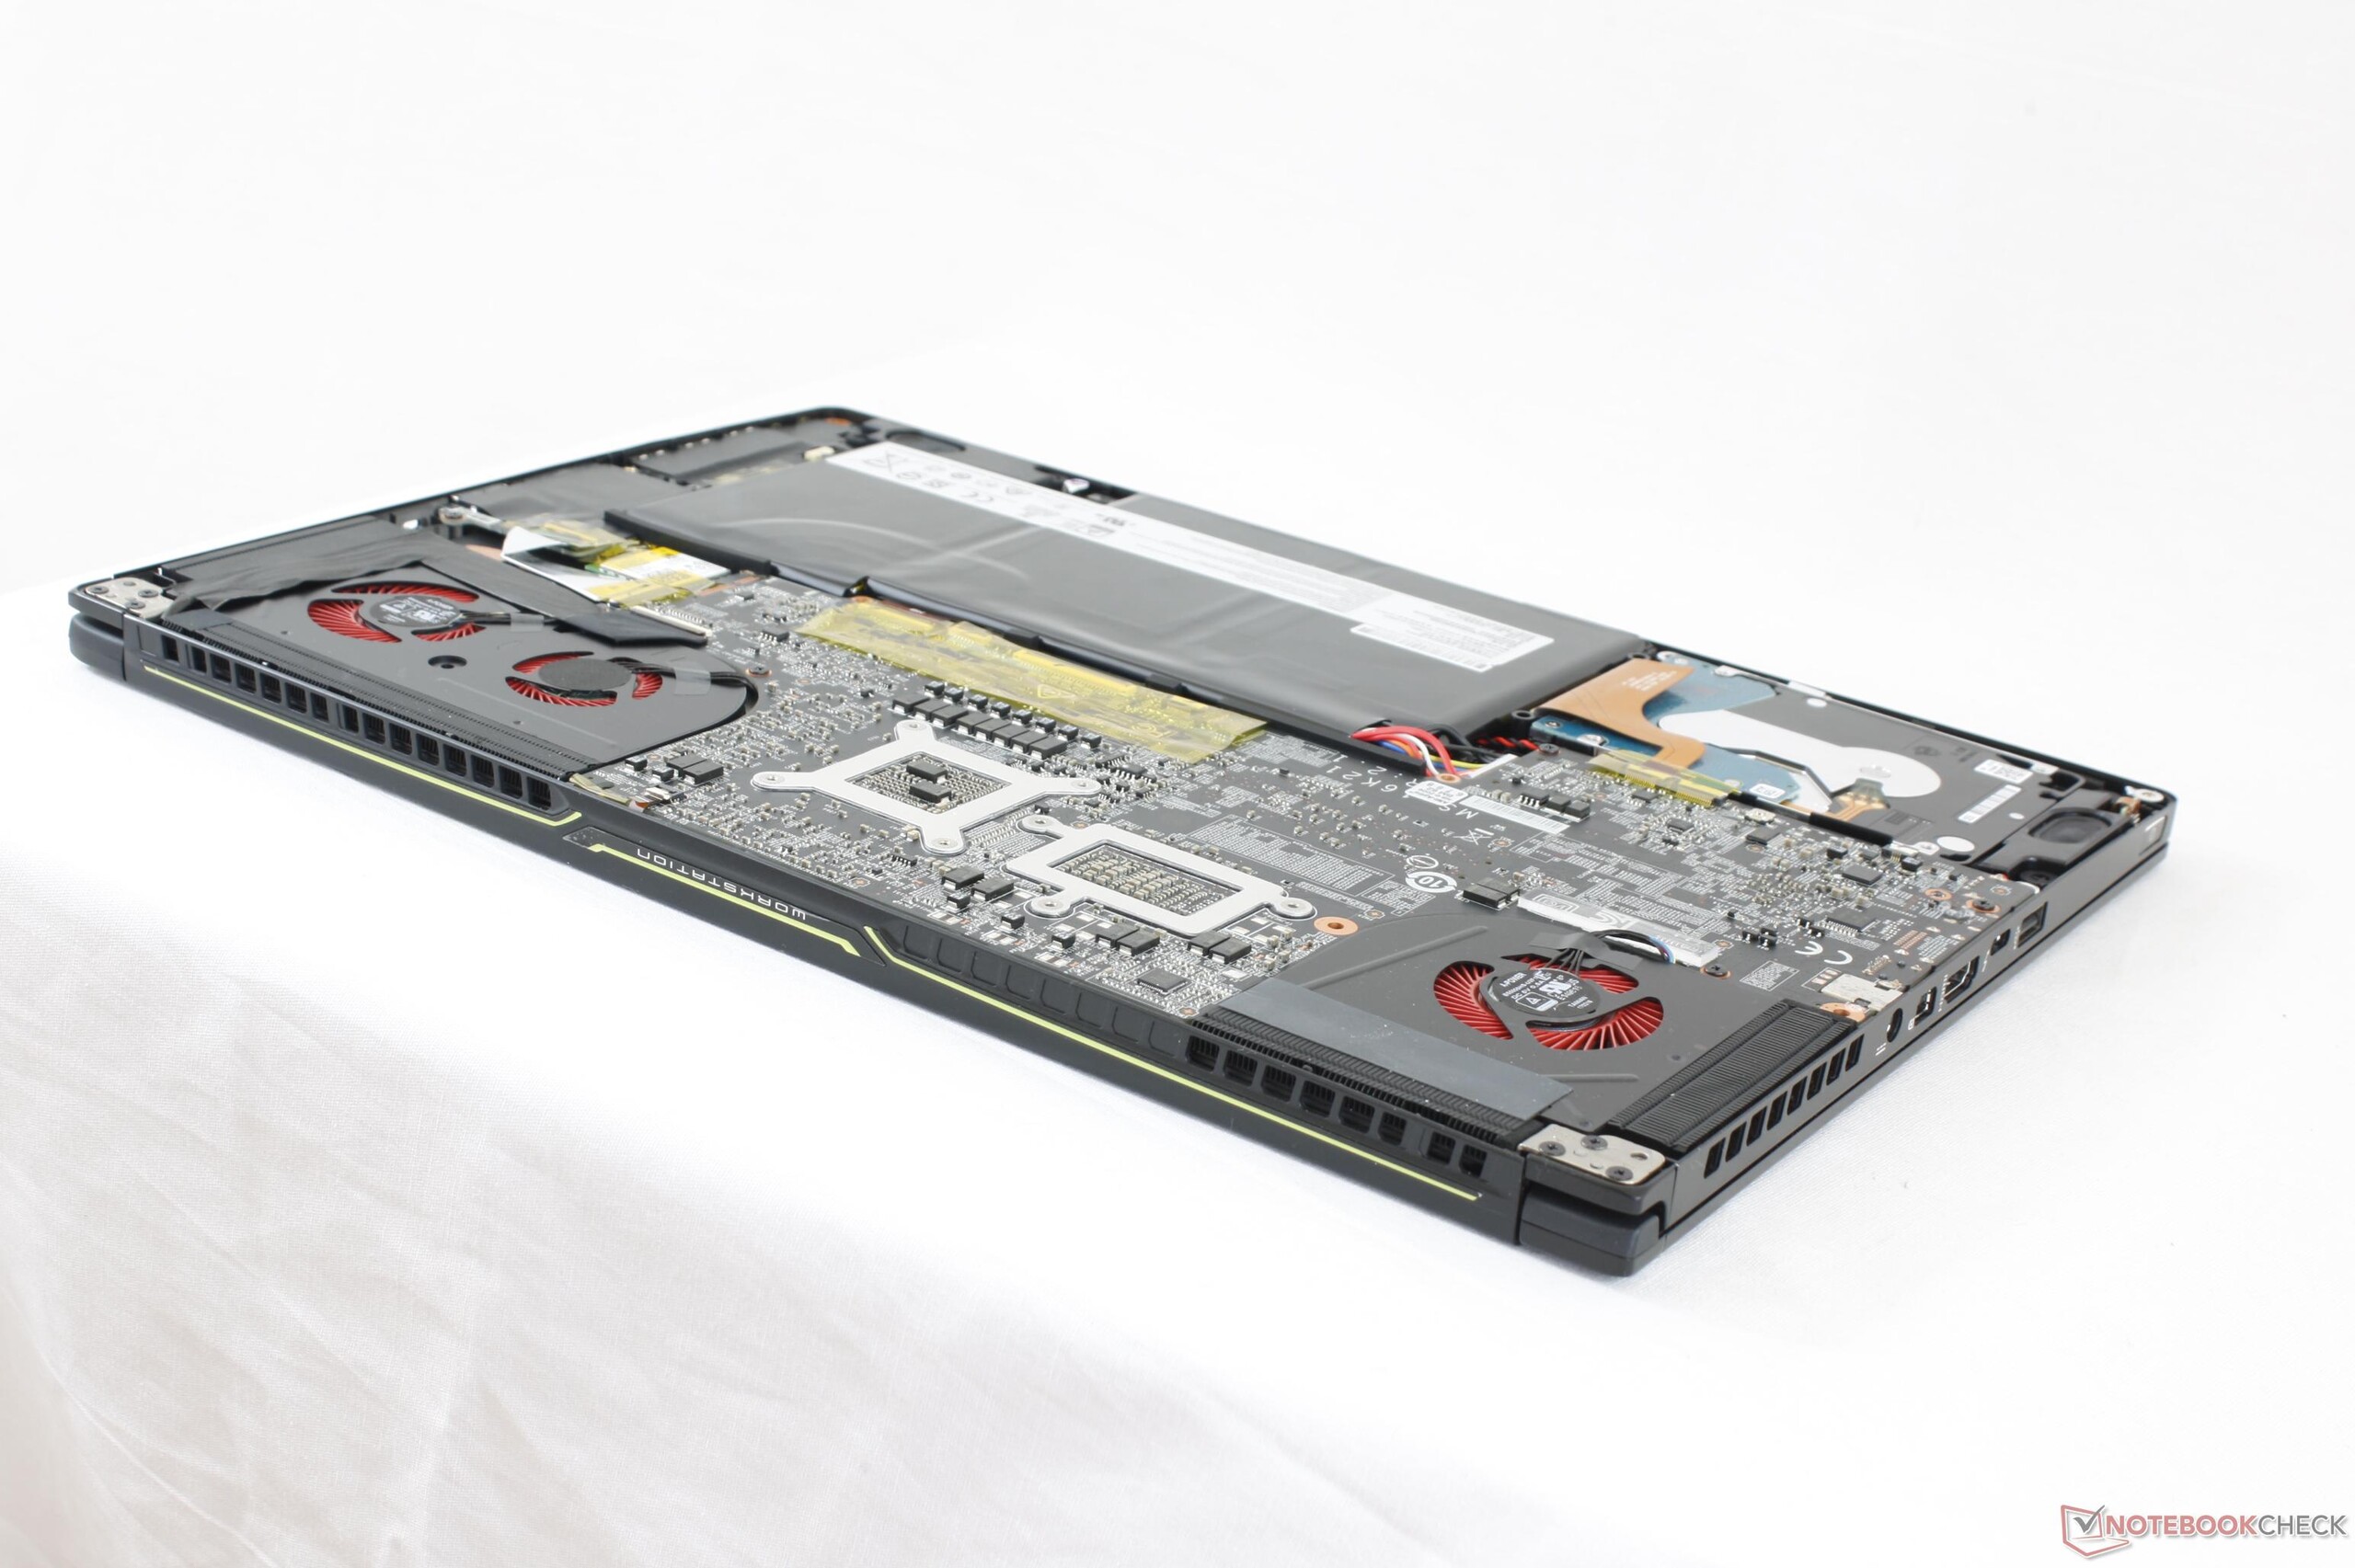
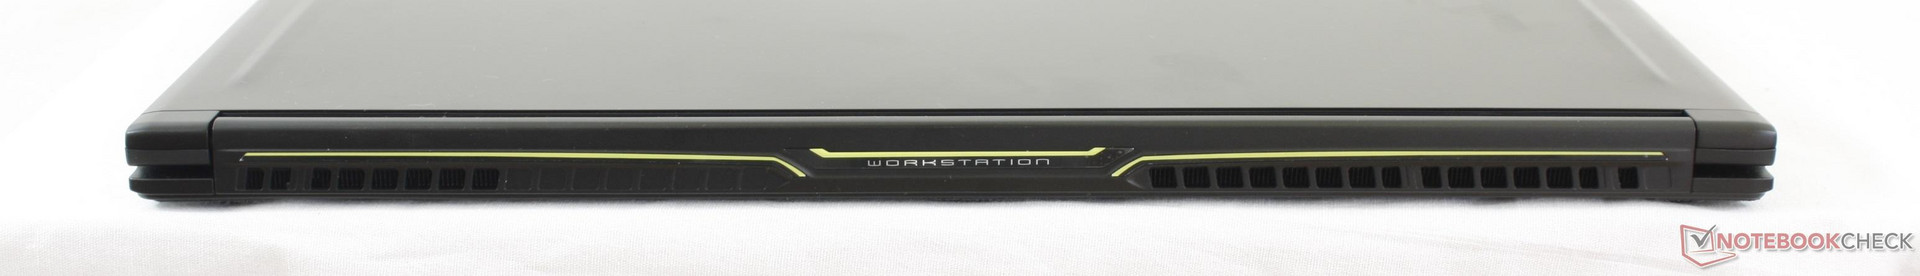
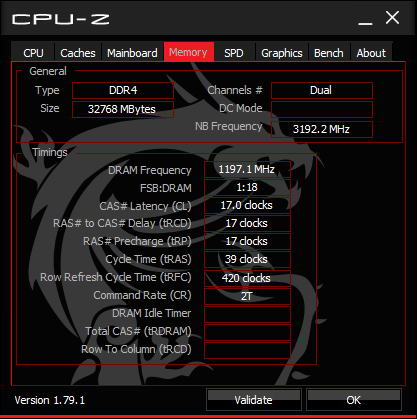
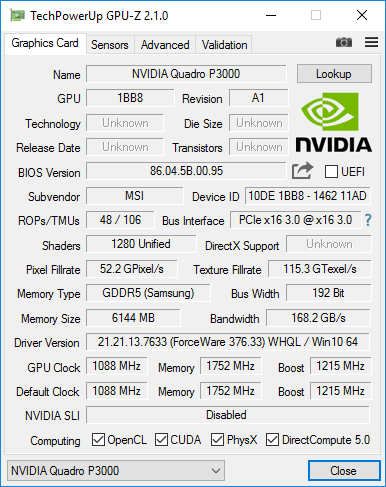
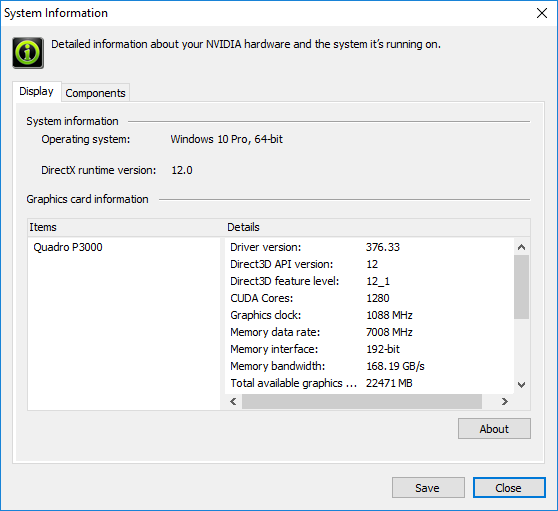
传统的戴尔 Precision, 联想 ThinkPad P以及惠普 ZBOOK系列移动工作站基本上都是又厚又重。而微星的WS系列从另一角度下手,提供更加轻薄但不牺牲核心性能的工作站。英伟达新的Quadro P3000使得WS63成为了一个引人注目的购买选项。P3000在提供与GTX980M同等性能的同时,其功耗依旧低于Quadro M5000M。让人最震惊的是新的WS63性能超越了去年的ZBOOK 15 G3,后者比前者贵了上千美元。极其看重GPU性能和便携性的专业用户不需要考虑更多了。
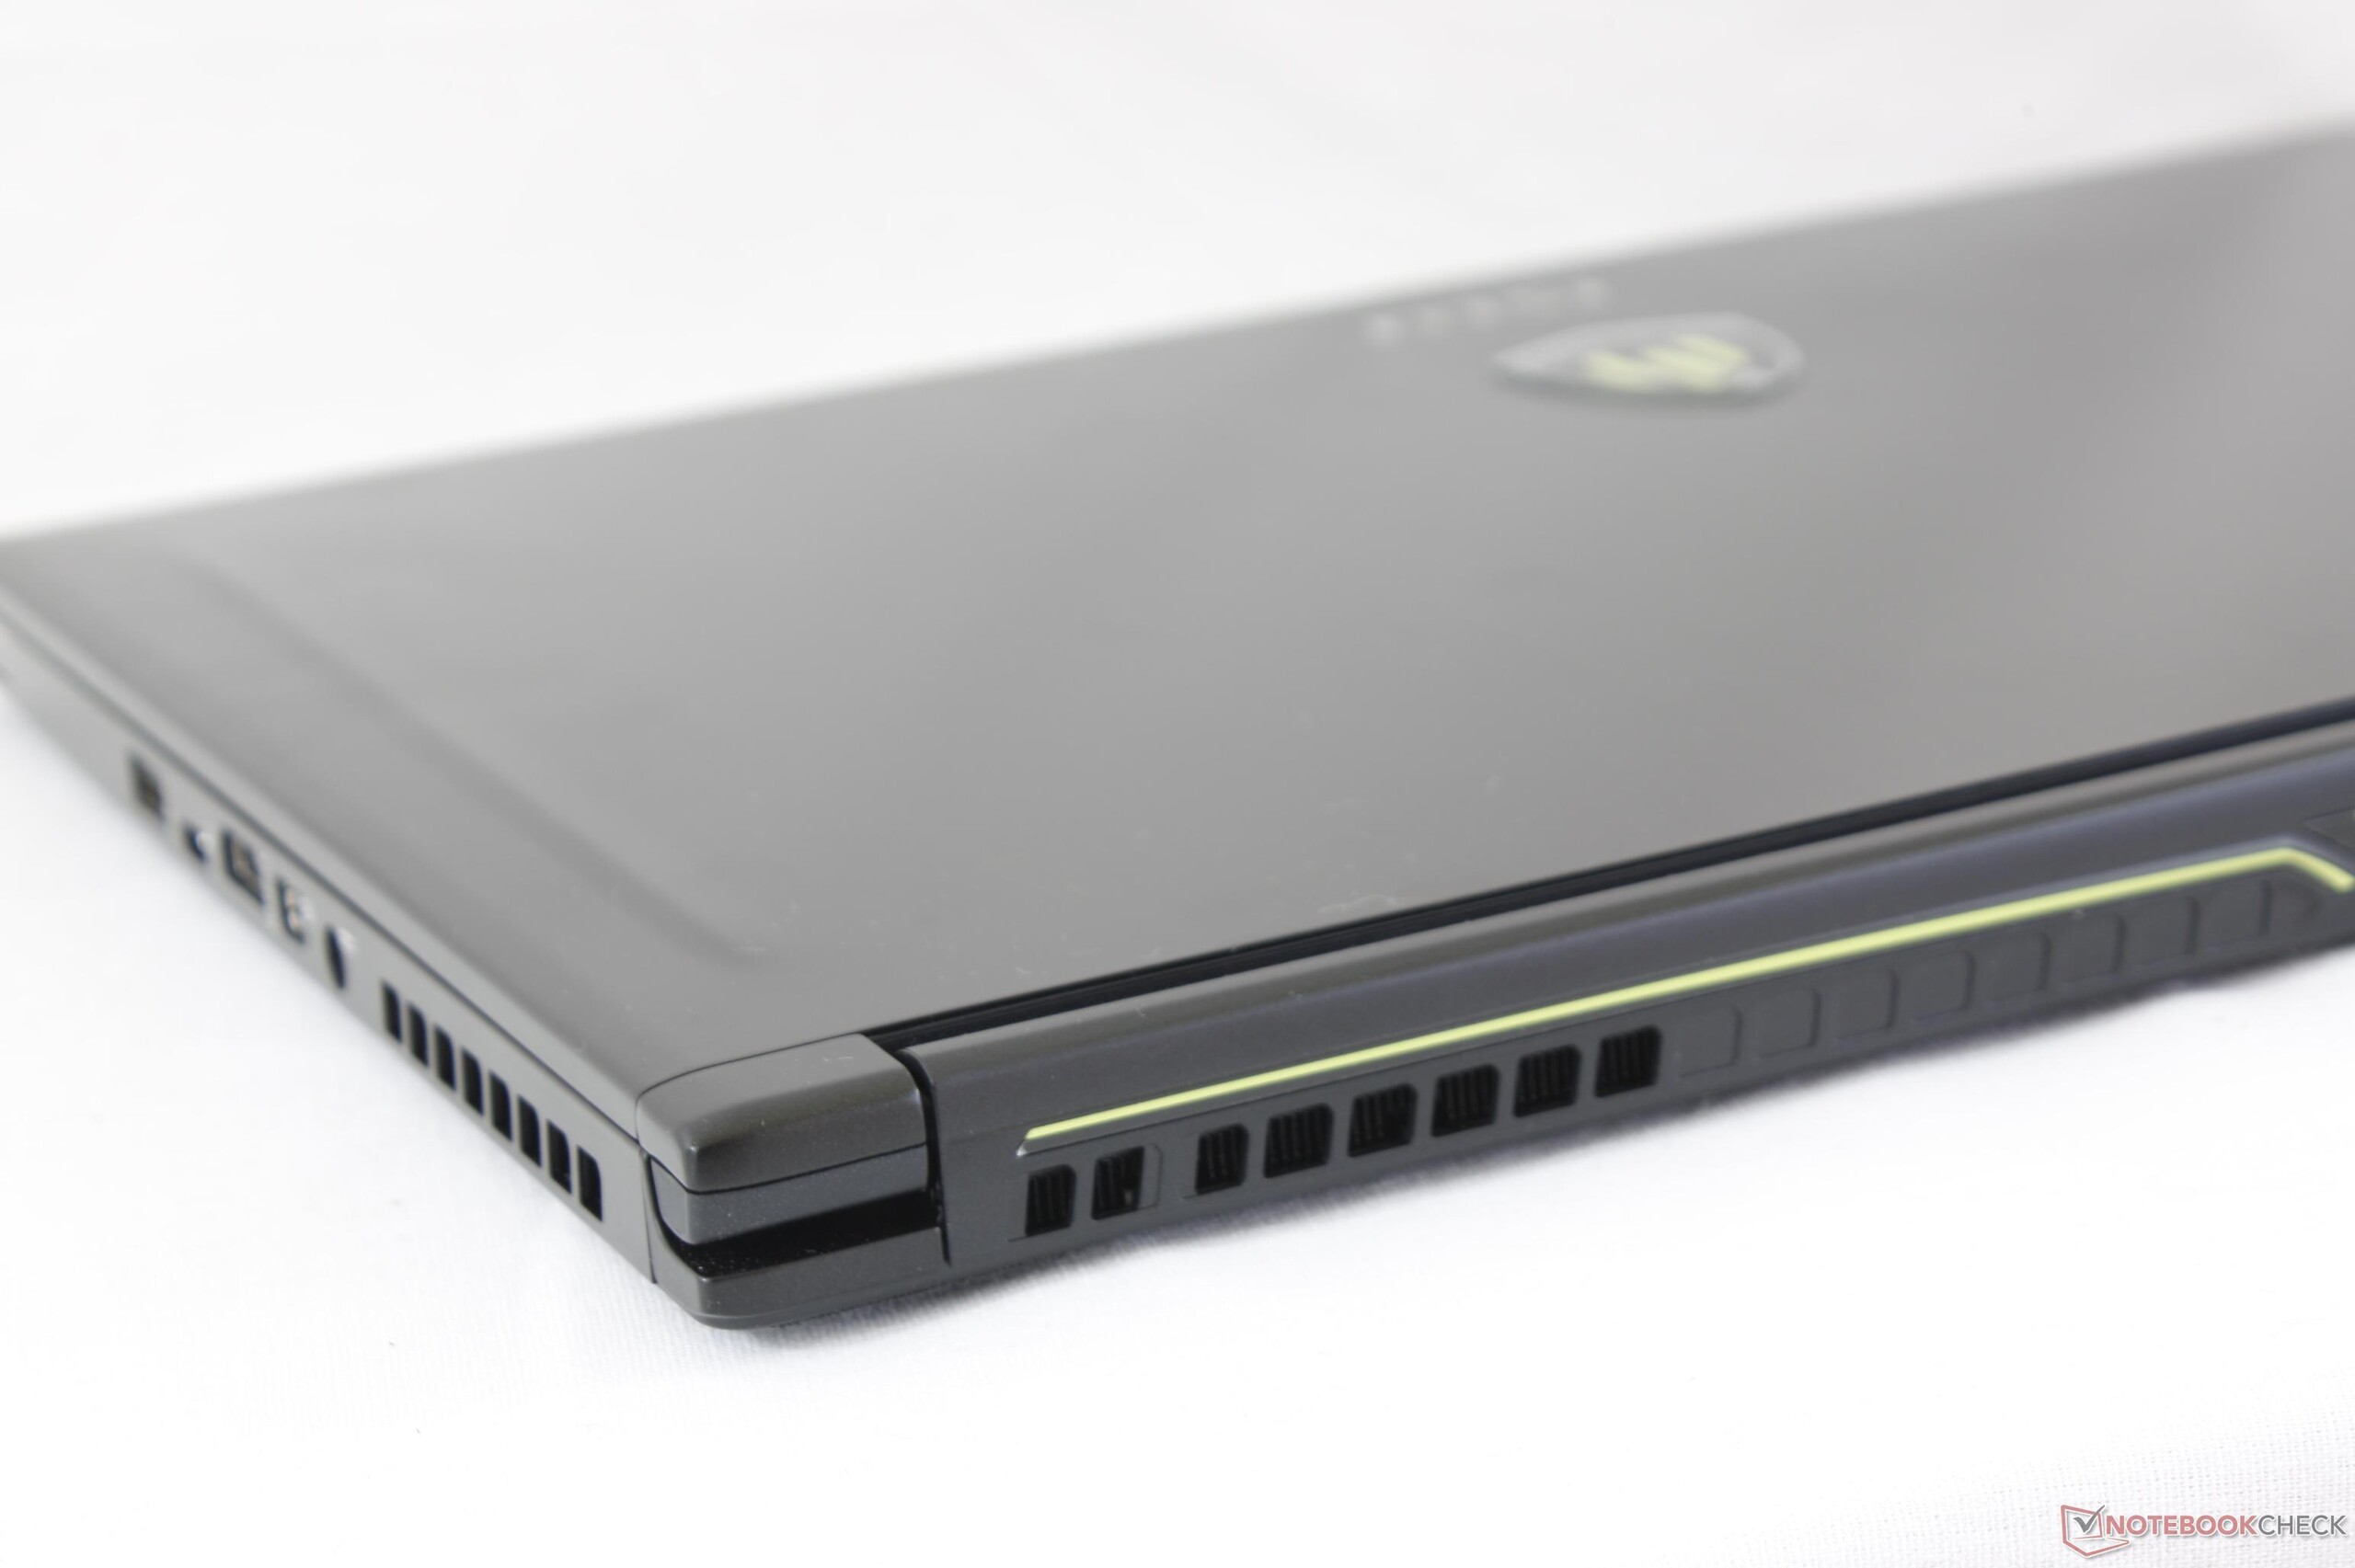
轻薄化的设计通常会带来主要缺点是可以预期的。外壳不那么坚固,风扇噪音偏大以及更加糟糕的可维护性是可以预期的当考虑到更小的机身时。CPU在极端负载下的温度高了很多且Turbo Boost的频率也因此波动。对于高亮度屏幕的缺失可能导致其失去了从一台高便携笔记本成为一台旅行伴侣的机会。我们希望将来的改进能够带来全sRGB或AdobeRGB色域覆盖屏幕,Xeon 处理器以及ECC内存的选项,让WS6S在工作站的分类中更深入一些。
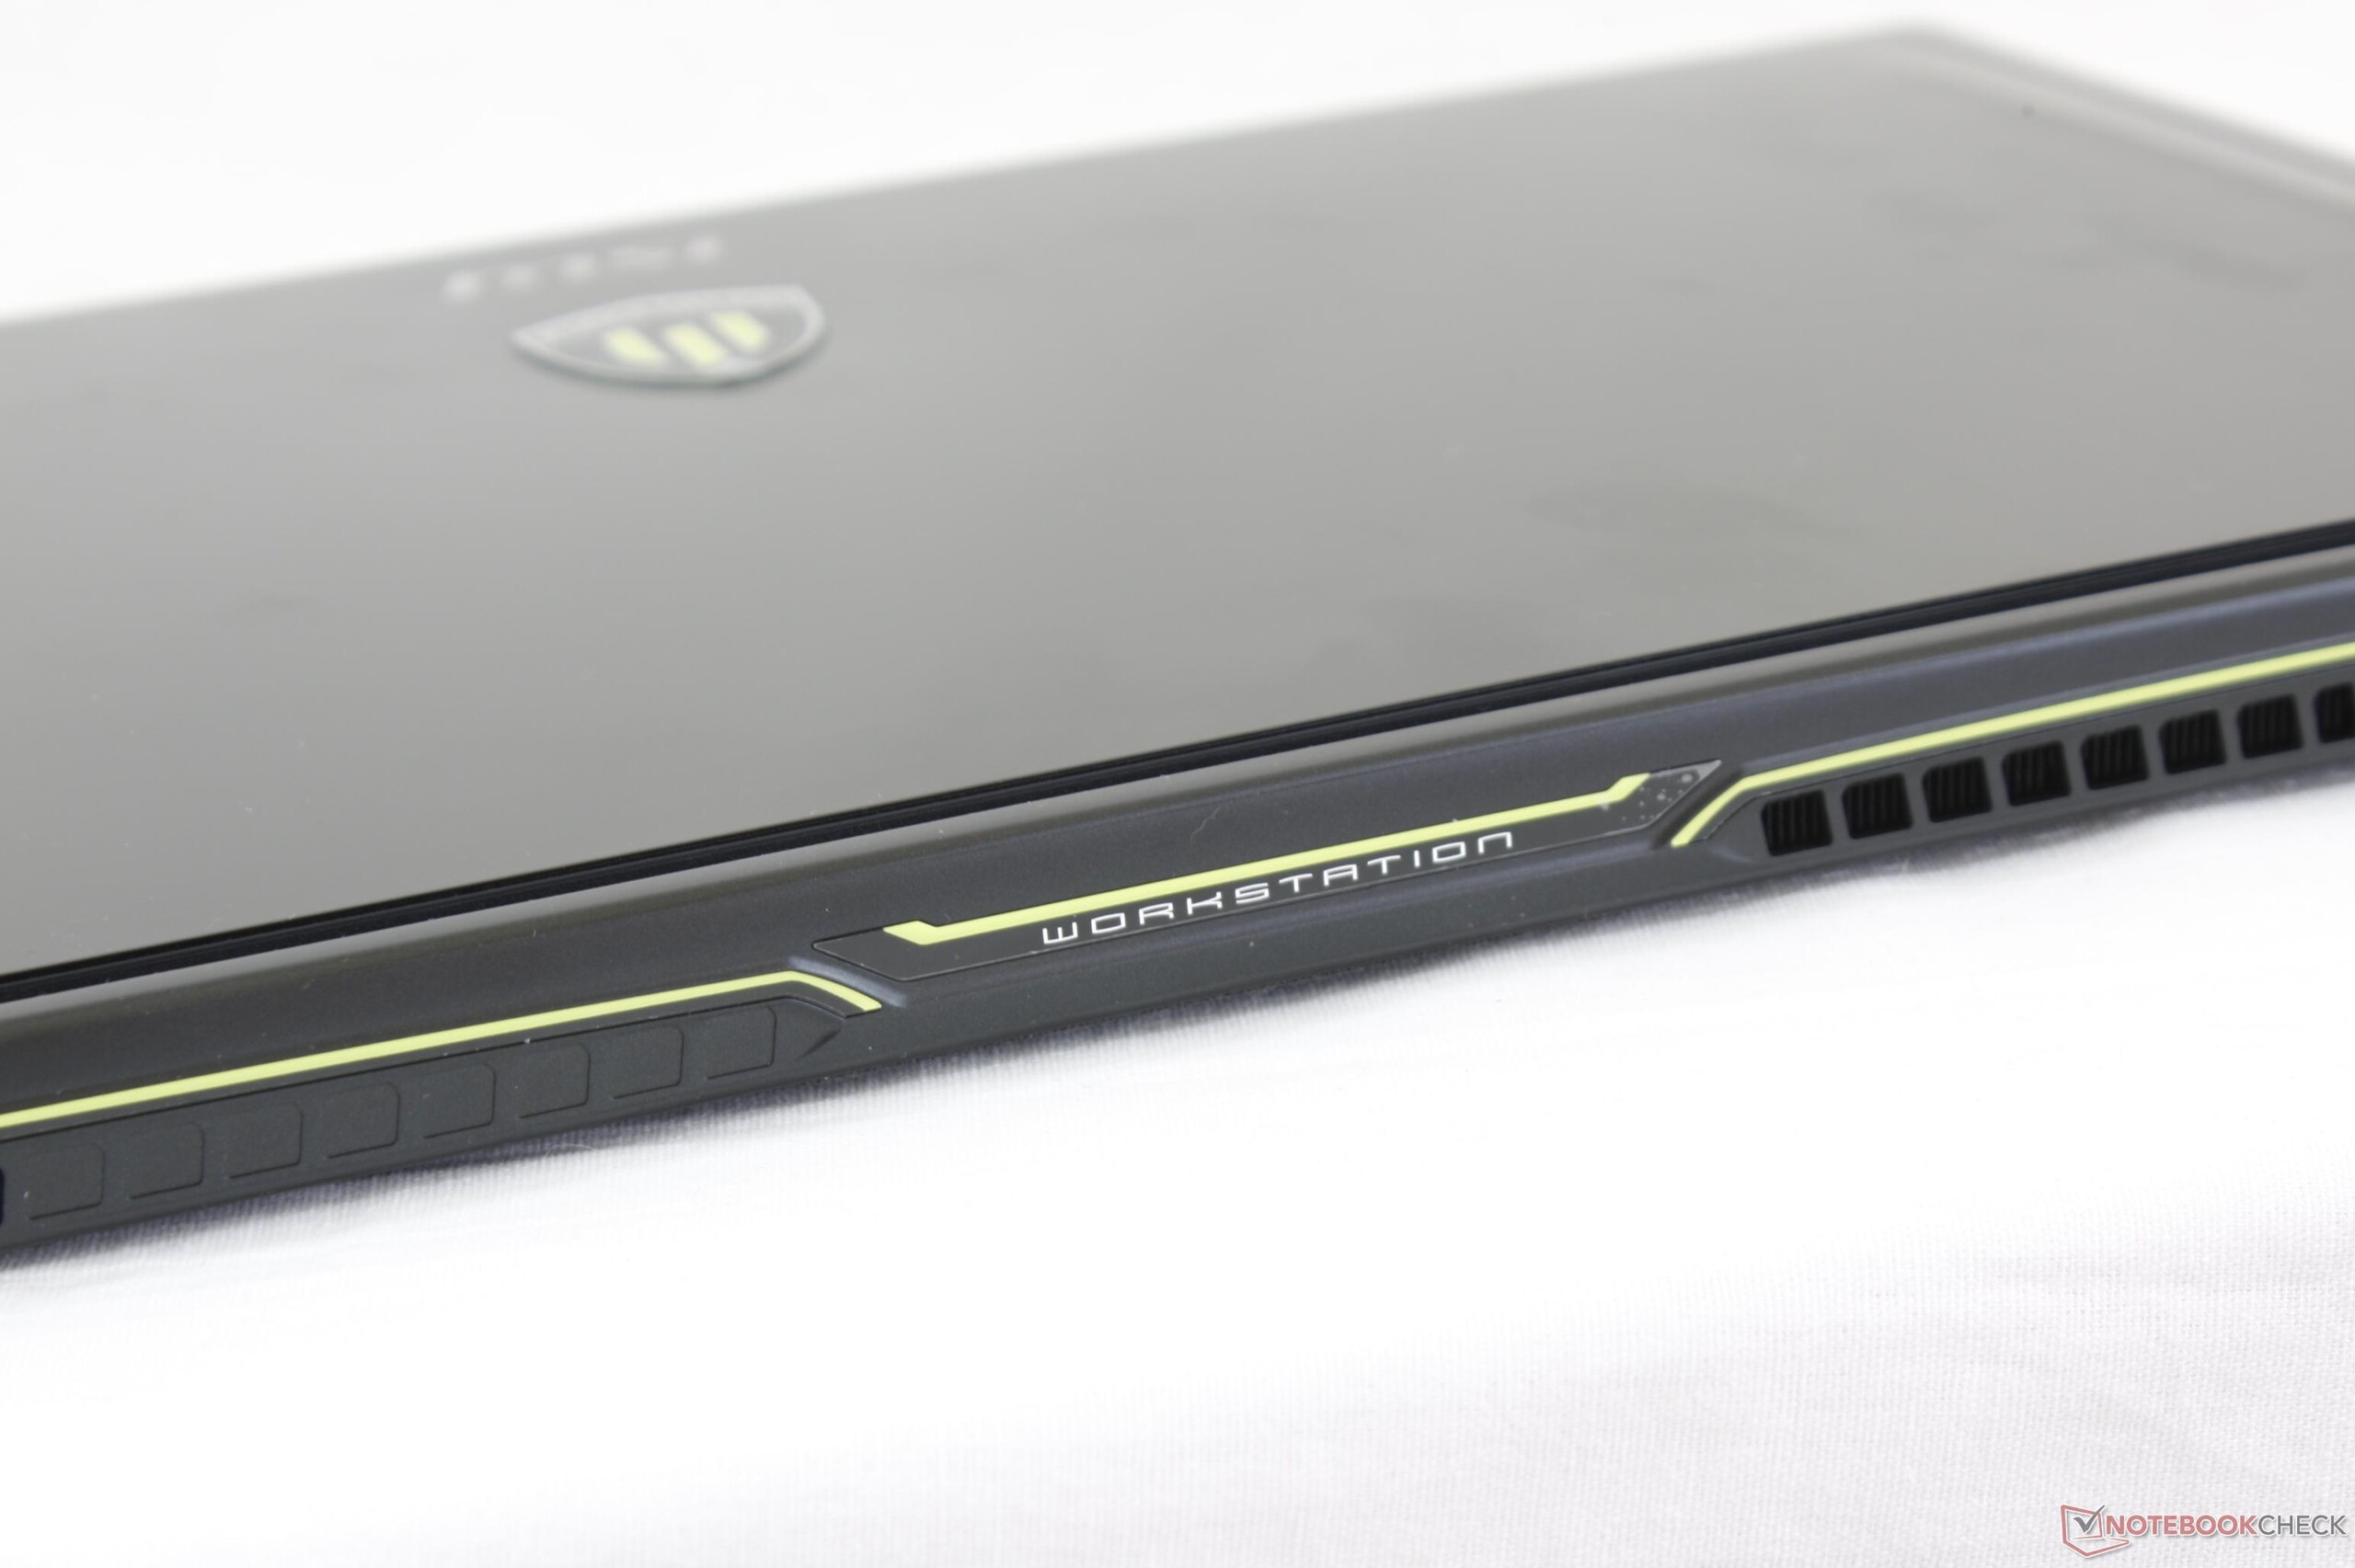
从性能和设计的角度上来说,WS63相比起WS60可以说是一次大进步。但它仍然缺乏一些特定的功能且感觉更像是一台工作站游戏本混合品而不是单单的工作站。
注:本文是基于完整评测的缩减版本,阅读完整的英文评测,请点击这里。
MSI WS63 7RF-290US
- 07/09/2017 v6 (old)
Allen Ngo
Price comparison
