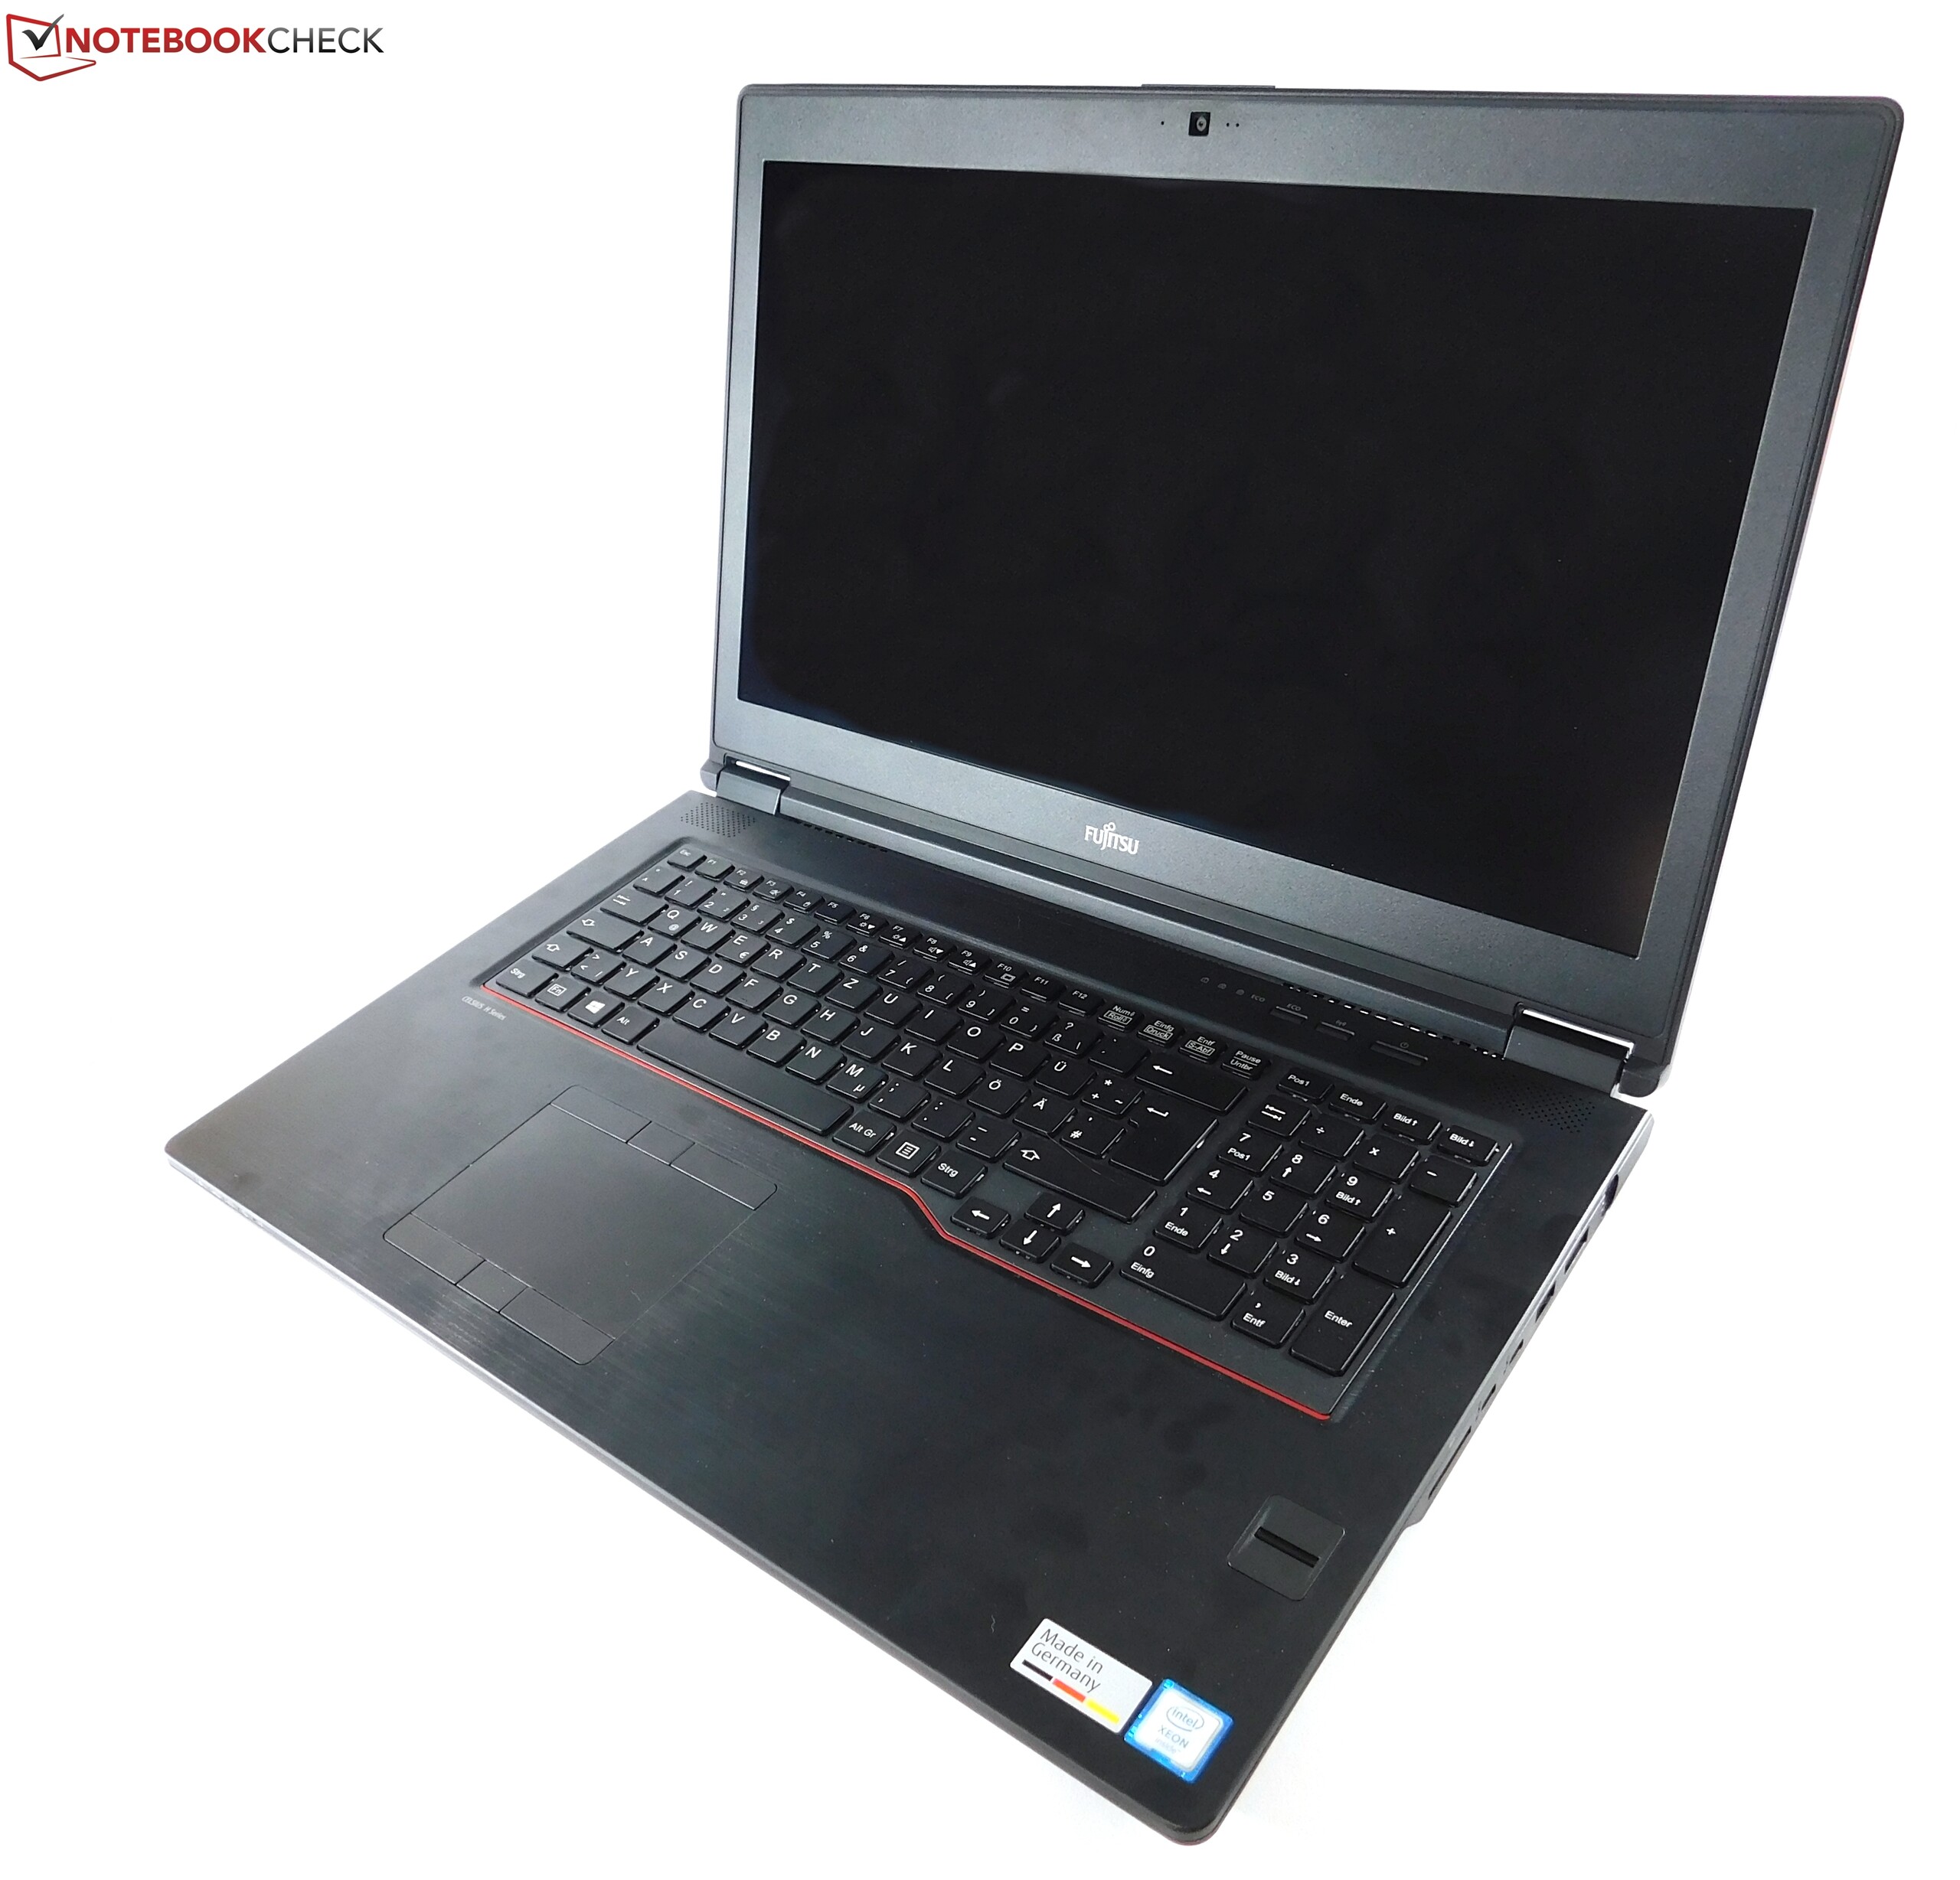
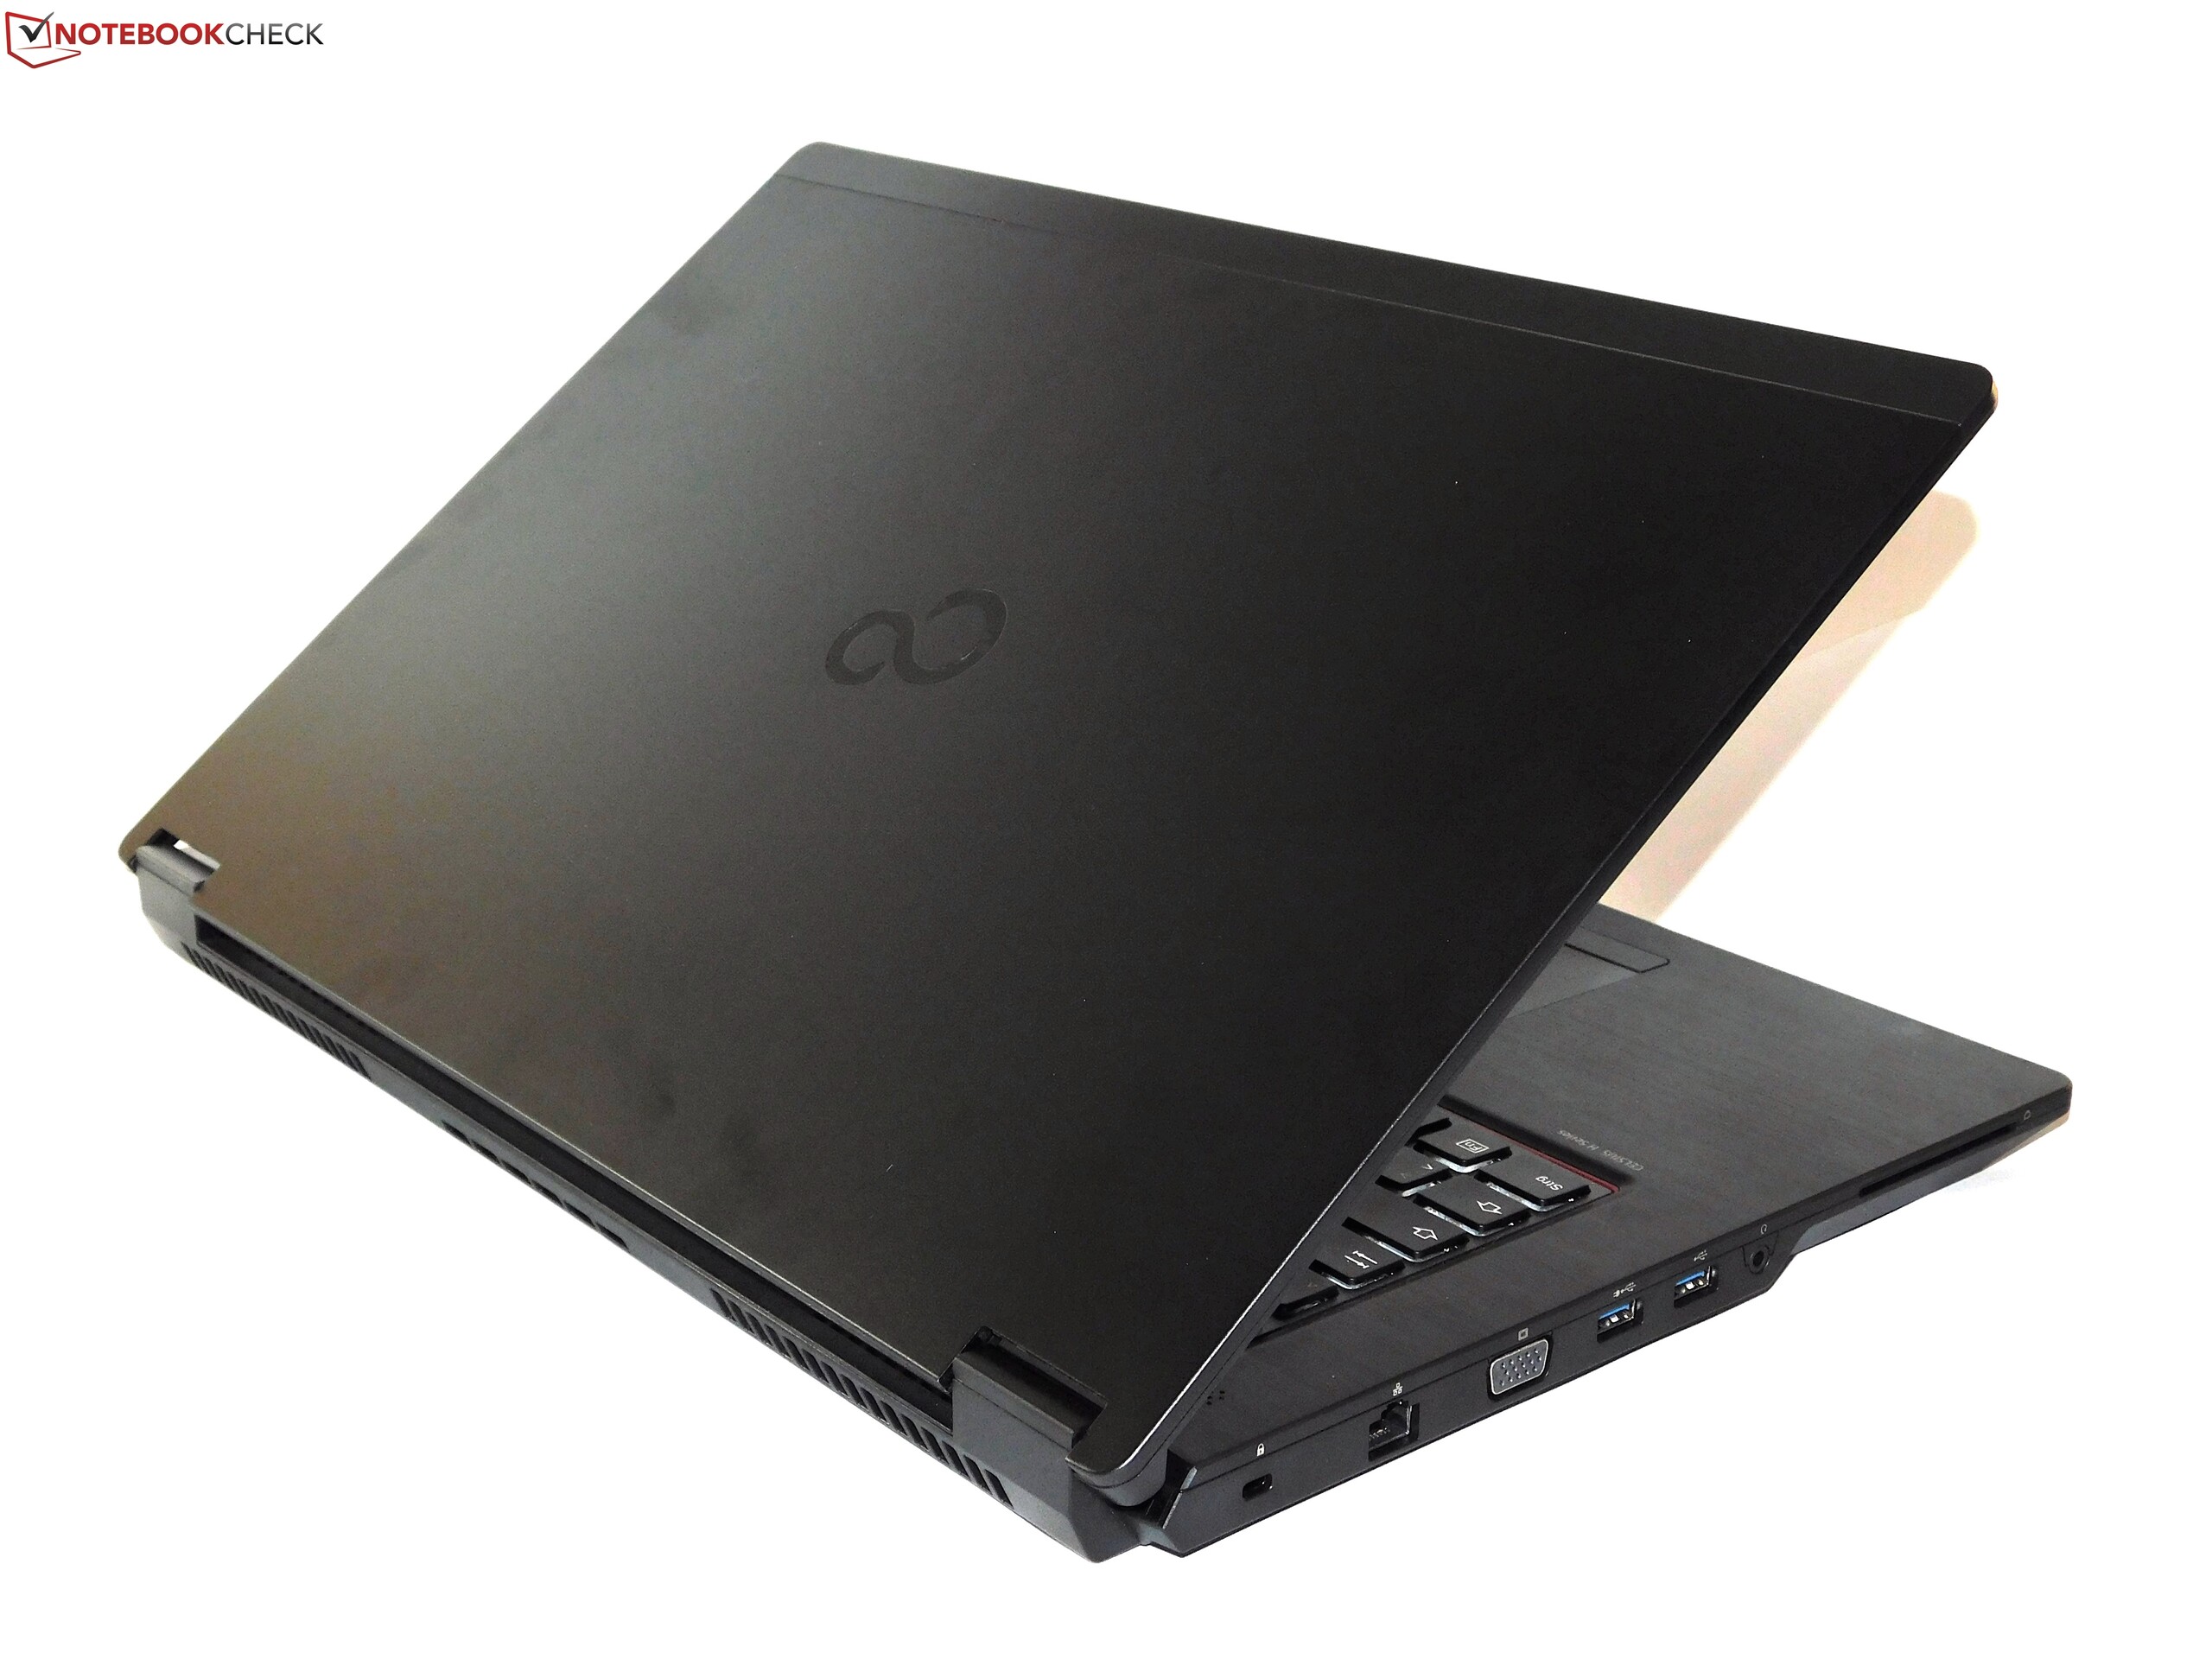
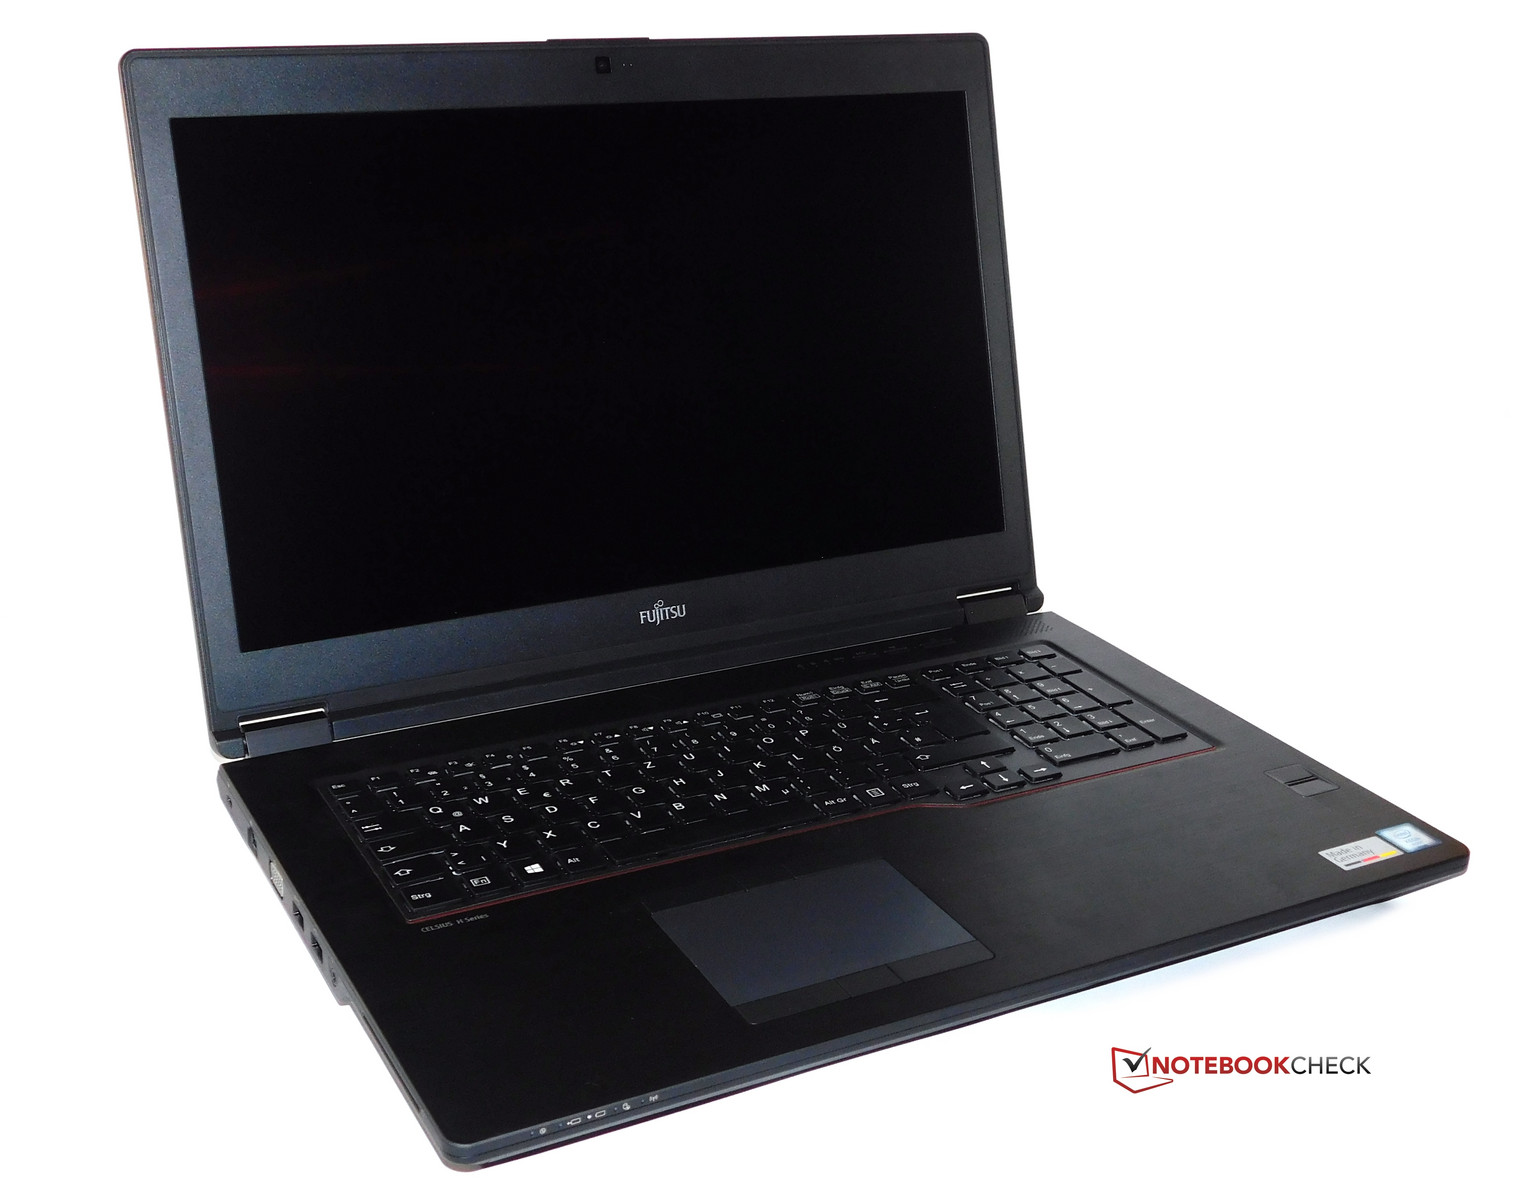
富士通 Celsius H970 (E3-1535M v6, P4000) 工作站简短评测

| SD Card Reader | |
| average JPG Copy Test (av. of 3 runs) | |
| Dell Precision 7710 | |
| Lenovo ThinkPad P71-20HK0004GE | |
| Fujitsu Celsius H970 | |
| HP ZBook 17 G3 TZV66eA | |
| maximum AS SSD Seq Read Test (1GB) | |
| Lenovo ThinkPad P71-20HK0004GE | |
| HP ZBook 17 G3 TZV66eA | |
| Fujitsu Celsius H970 | |
| Dell Precision 7710 | |
| Networking | |
| iperf3 transmit AX12 | |
| Lenovo ThinkPad P71-20HK0004GE | |
| Fujitsu Celsius H970 | |
| MSI WE72 7RJ | |
| iperf3 receive AX12 | |
| Fujitsu Celsius H970 | |
| Lenovo ThinkPad P71-20HK0004GE | |
| MSI WE72 7RJ | |
| |||||||||||||||||||||||||
Brightness Distribution: 91 %
Center on Battery: 373 cd/m²
Contrast: 1227:1 (Black: 0.3 cd/m²)
ΔE ColorChecker Calman: 6.4 | ∀{0.5-29.43 Ø4.71}
ΔE Greyscale Calman: 7.2 | ∀{0.09-98 Ø4.96}
84.4% sRGB (Argyll 1.6.3 3D)
55.5% AdobeRGB 1998 (Argyll 1.6.3 3D)
61.8% AdobeRGB 1998 (Argyll 3D)
84.6% sRGB (Argyll 3D)
66.8% Display P3 (Argyll 3D)
Gamma: 2.02
CCT: 6882 K
| Fujitsu Celsius H970 LP173WF4-SPF3, , 1920x1080, 17.3" | Lenovo ThinkPad P71-20HK0004GE LEN4123, VVX17P051J00, , 3840x2160, 17.3" | HP ZBook 17 G3 TZV66eA SDC3854, , 1920x1080, 17.3" | Dell Precision 7710 SDC8151, VHN17_173HL, , 1920x1080, 17.3" | MSI WE72 7RJ LP173WF4-SPF1, , 1920x1080, 17.3" | Schenker W706 LP173WF4-SPD1, LGD046C, , 1920x1080, 17.3" | |
|---|---|---|---|---|---|---|
| Display | 9% | 9% | 1% | -0% | ||
| Display P3 Coverage (%) | 66.8 | 67.3 1% | 66.6 0% | 67.4 1% | 66.2 -1% | |
| sRGB Coverage (%) | 84.6 | 95.9 13% | 96.9 15% | 85.3 1% | 84.2 0% | |
| AdobeRGB 1998 Coverage (%) | 61.8 | 69 12% | 68.6 11% | 62.4 1% | 61.5 0% | |
| Response Times | -6% | -33% | -46% | -21% | -25% | |
| Response Time Grey 50% / Grey 80% * (ms) | 32 ? | 39.2 ? -23% | 50.4 ? -58% | 50 ? -56% | 45.2 ? -41% | 44 ? -38% |
| Response Time Black / White * (ms) | 26.4 ? | 23.2 ? 12% | 28.4 ? -8% | 36 ? -36% | 26.4 ? -0% | 29.2 ? -11% |
| PWM Frequency (Hz) | 1412 ? | 200 ? | 198 ? | |||
| Screen | 23% | 18% | 7% | -6% | -4% | |
| Brightness middle (cd/m²) | 368 | 358 -3% | 252 -32% | 332 -10% | 302 -18% | 356 -3% |
| Brightness (cd/m²) | 360 | 338 -6% | 243 -32% | 307 -15% | 306 -15% | 331 -8% |
| Brightness Distribution (%) | 91 | 83 -9% | 86 -5% | 83 -9% | 93 2% | 86 -5% |
| Black Level * (cd/m²) | 0.3 | 0.31 -3% | 0.21 30% | 0.33 -10% | 0.31 -3% | 0.48 -60% |
| Contrast (:1) | 1227 | 1155 -6% | 1200 -2% | 1006 -18% | 974 -21% | 742 -40% |
| Colorchecker dE 2000 * | 6.4 | 2.1 67% | 2.2 66% | 3 53% | 6.2 3% | 4.64 28% |
| Colorchecker dE 2000 max. * | 10.1 | 3.6 64% | 3.8 62% | 10.6 -5% | ||
| Greyscale dE 2000 * | 7.2 | 2 72% | 2.7 62% | 4 44% | 7.3 -1% | 3.65 49% |
| Gamma | 2.02 109% | 2.16 102% | 2.28 96% | 2 110% | 2.08 106% | 2.02 109% |
| CCT | 6882 94% | 6216 105% | 6686 97% | 7089 92% | 7020 93% | 6393 102% |
| Color Space (Percent of AdobeRGB 1998) (%) | 55.5 | 77 39% | 62 12% | 62 12% | 56 1% | 55 -1% |
| Color Space (Percent of sRGB) (%) | 84.4 | 99.97 18% | 96 14% | 97 15% | 85.2 1% | 84 0% |
| Total Average (Program / Settings) | 9% /
19% | -2% /
9% | -10% /
-0% | -9% /
-6% | -10% /
-6% |
* ... smaller is better
Display Response Times
| ↔ Response Time Black to White | ||
|---|---|---|
| 26.4 ms ... rise ↗ and fall ↘ combined | ↗ 14.8 ms rise | 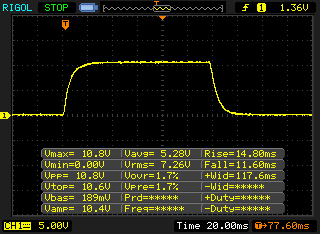 |
| ↘ 11.6 ms fall | ||
| The screen shows relatively slow response rates in our tests and may be too slow for gamers. In comparison, all tested devices range from 0.1 (minimum) to 240 (maximum) ms. » 66 % of all devices are better. This means that the measured response time is worse than the average of all tested devices (19.8 ms). | ||
| ↔ Response Time 50% Grey to 80% Grey | ||
| 32 ms ... rise ↗ and fall ↘ combined | ↗ 14.8 ms rise | 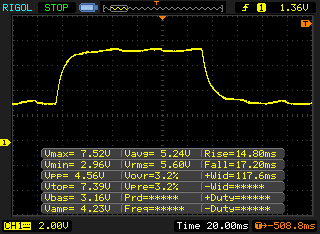 |
| ↘ 17.2 ms fall | ||
| The screen shows slow response rates in our tests and will be unsatisfactory for gamers. In comparison, all tested devices range from 0.165 (minimum) to 636 (maximum) ms. » 43 % of all devices are better. This means that the measured response time is similar to the average of all tested devices (31 ms). | ||
Screen Flickering / PWM (Pulse-Width Modulation)
| Screen flickering / PWM not detected |  | ||
In comparison: 52 % of all tested devices do not use PWM to dim the display. If PWM was detected, an average of 7754 (minimum: 5 - maximum: 343500) Hz was measured. | |||
| Cinebench R15 | |
| CPU Single 64Bit | |
| Fujitsu Celsius H970 | |
| Lenovo ThinkPad P71-20HK0004GE | |
| Dell Precision 7710 | |
| MSI WE72 7RJ | |
| HP ZBook 17 G3 TZV66eA | |
| Schenker W706 | |
| CPU Multi 64Bit | |
| Lenovo ThinkPad P71-20HK0004GE | |
| Dell Precision 7710 | |
| Schenker W706 | |
| MSI WE72 7RJ | |
| HP ZBook 17 G3 TZV66eA | |
| Fujitsu Celsius H970 | |
| PCMark 8 | |
| Work Score Accelerated v2 | |
| Dell Precision 7710 | |
| Fujitsu Celsius H970 | |
| HP ZBook 17 G3 TZV66eA | |
| Schenker W706 | |
| MSI WE72 7RJ | |
| Creative Score Accelerated v2 | |
| Fujitsu Celsius H970 | |
| Schenker W706 | |
| Lenovo ThinkPad P71-20HK0004GE | |
| Dell Precision 7710 | |
| HP ZBook 17 G3 TZV66eA | |
| PCMark 8 Creative Score Accelerated v2 | 7135 points | |
| PCMark 8 Work Score Accelerated v2 | 5277 points | |
| PCMark 10 Score | 5041 points | |
Help | ||
| Fujitsu Celsius H970 Samsung SM961 MZVKW512HMJP m.2 PCI-e | HP ZBook 17 G3 TZV66eA Samsung SM951 MZVPV256HDGL m.2 PCI-e | MSI WE72 7RJ Samsung SM961 MZVPW256 m.2 PCI-e | Lenovo ThinkPad P71-20HK0004GE Samsung PM961 NVMe MZVLW512HMJP | Dell Precision 7710 Samsung SM951 MZVPV256HDGL m.2 PCI-e | Schenker W706 Samsung SM951 MZVPV512HDGL m.2 PCI-e | |
|---|---|---|---|---|---|---|
| AS SSD | -15% | 18% | 14% | -7% | -2% | |
| Seq Read (MB/s) | 2726 | 1596 -41% | 2586 -5% | 2447 -10% | 1886 -31% | 1915 -30% |
| Seq Write (MB/s) | 1609 | 703 -56% | 1441 -10% | 1596 -1% | 626 -61% | 1511 -6% |
| 4K Read (MB/s) | 38.88 | 51.1 31% | 53 36% | 53.3 37% | 51 31% | 49.71 28% |
| 4K Write (MB/s) | 78.1 | 148.2 90% | 148.1 90% | 144.1 85% | 179 129% | 146.2 87% |
| 4K-64 Read (MB/s) | 1246 | 1037 -17% | 1517 22% | 1362 9% | 1064 -15% | 1115 -11% |
| 4K-64 Write (MB/s) | 971 | 230.4 -76% | 826 -15% | 740 -24% | 275 -72% | 375 -61% |
| Score Total (Points) | 3509 | 2302 -34% | 3831 9% | 3517 0% | 2435 -31% | 2712 -23% |

| 3DMark 11 - 1280x720 Performance GPU | |
| Fujitsu Celsius H970 | |
| Schenker W706 | |
| Lenovo ThinkPad P71-20HK0004GE | |
| Lenovo ThinkPad P70-20ER000XUS | |
| Dell Precision 7710 | |
| HP ZBook 17 G3 TZV66eA | |
| MSI WE72 7RJ | |
| 3DMark | |
| 1280x720 Cloud Gate Standard Graphics | |
| Schenker W706 | |
| Lenovo ThinkPad P71-20HK0004GE | |
| Fujitsu Celsius H970 | |
| HP ZBook 17 G3 TZV66eA | |
| Lenovo ThinkPad P70-20ER000XUS | |
| Dell Precision 7710 | |
| MSI WE72 7RJ | |
| 1920x1080 Fire Strike Graphics | |
| Fujitsu Celsius H970 | |
| Schenker W706 | |
| Lenovo ThinkPad P71-20HK0004GE | |
| Lenovo ThinkPad P70-20ER000XUS | |
| Dell Precision 7710 | |
| HP ZBook 17 G3 TZV66eA | |
| MSI WE72 7RJ | |
| LuxMark v2.0 64Bit | |
| Room GPUs-only | |
| Fujitsu Celsius H970 | |
| Lenovo ThinkPad P71-20HK0004GE | |
| Schenker W706 | |
| HP ZBook 17 G3 TZV66eA | |
| MSI WE72 7RJ | |
| Dell Precision 7710 | |
| Sala GPUs-only | |
| Fujitsu Celsius H970 | |
| Lenovo ThinkPad P71-20HK0004GE | |
| HP ZBook 17 G3 TZV66eA | |
| Schenker W706 | |
| MSI WE72 7RJ | |
| Dell Precision 7710 | |
| ComputeMark v2.1 - 1024x600 Normal, Score | |
| Fujitsu Celsius H970 | |
| Lenovo ThinkPad P71-20HK0004GE | |
| Schenker W706 | |
| Lenovo ThinkPad P70-20ER000XUS | |
| MSI WE72 7RJ | |
| Dell Precision 7710 | |
| GFXBench | |
| 1920x1080 Car Chase Offscreen | |
| Fujitsu Celsius H970 | |
| Lenovo ThinkPad P71-20HK0004GE | |
| MSI WE72 7RJ | |
| on screen Car Chase Onscreen | |
| MSI WE72 7RJ | |
| Fujitsu Celsius H970 | |
| Lenovo ThinkPad P71-20HK0004GE | |
| 3DMark Vantage - 1280x1024 P Result | |
| Fujitsu Celsius H970 | |
| Lenovo ThinkPad P71-20HK0004GE | |
| Dell Precision 7710 | |
| MSI WE72 7RJ | |
| 3DMark 06 Standard Score | 29155 points | |
| 3DMark Vantage P Result | 36260 points | |
| 3DMark 11 Performance | 12346 points | |
| 3DMark Ice Storm Standard Score | 68394 points | |
| 3DMark Cloud Gate Standard Score | 18726 points | |
| 3DMark Fire Strike Score | 10158 points | |
| 3DMark Fire Strike Extreme Score | 5526 points | |
| 3DMark Time Spy Score | 3825 points | |
Help | ||
| Rise of the Tomb Raider - 1920x1080 Very High Preset AA:FX AF:16x | |
| MSI GT62VR-6RE16H21 | |
| Fujitsu Celsius H970 | |
| Schenker XMG P507 | |
| Lenovo ThinkPad P71-20HK0004GE | |
| MSI GE72 7RE-046 | |
| MSI WE72 7RJ | |
| HP ZBook 17 G3 TZV66eA | |
| low | med. | high | ultra | |
|---|---|---|---|---|
| BioShock Infinite (2013) | 196.9 | 174.4 | 162.4 | 96 |
| Company of Heroes 2 (2013) | 67.6 | 61.1 | 59.7 | 44.94 |
| Total War: Rome II (2013) | 236.7 | 184.1 | 151.4 | 63.3 |
| GRID: Autosport (2014) | 153.8 | 106.3 | 96.9 | 84.5 |
| The Witcher 3 (2015) | 159.7 | 113.6 | 77.2 | 41.09 |
| Star Wars Battlefront (2015) | 122.5 | 116.4 | 89.2 | 85.7 |
| Rise of the Tomb Raider (2016) | 115.9 | 103.2 | 76.8 | 65.5 |
| Doom (2016) | 119.5 | 112.4 | 91 | 87.1 |
| Civilization 6 (2016) | 66.7 | 55.2 | 45.13 | 43.7 |
| Warhammer 40.000: Dawn of War III (2017) | 70.3 | 61.6 | 58.8 | 54 |
Noise level
| Idle |
| 30.2 / 32.8 / 32.8 dB(A) |
| Load |
| 47.3 / 47.3 dB(A) |
 | ||
30 dB silent 40 dB(A) audible 50 dB(A) loud |
||
min: | ||
(±) The maximum temperature on the upper side is 41.4 °C / 107 F, compared to the average of 38.2 °C / 101 F, ranging from 22.2 to 69.8 °C for the class Workstation.
(-) The bottom heats up to a maximum of 48.7 °C / 120 F, compared to the average of 41.1 °C / 106 F
(+) In idle usage, the average temperature for the upper side is 25.9 °C / 79 F, compared to the device average of 32 °C / 90 F.
(+) The palmrests and touchpad are cooler than skin temperature with a maximum of 26.6 °C / 79.9 F and are therefore cool to the touch.
(±) The average temperature of the palmrest area of similar devices was 27.8 °C / 82 F (+1.2 °C / 2.1 F).
Fujitsu Celsius H970 audio analysis
(±) | speaker loudness is average but good (73.8 dB)
Bass 100 - 315 Hz
(-) | nearly no bass - on average 26.7% lower than median
(+) | bass is linear (5.1% delta to prev. frequency)
Mids 400 - 2000 Hz
(±) | reduced mids - on average 5.4% lower than median
(±) | linearity of mids is average (8.3% delta to prev. frequency)
Highs 2 - 16 kHz
(+) | balanced highs - only 4.1% away from median
(+) | highs are linear (6.2% delta to prev. frequency)
Overall 100 - 16.000 Hz
(±) | linearity of overall sound is average (29.1% difference to median)
Compared to same class
» 96% of all tested devices in this class were better, 1% similar, 3% worse
» The best had a delta of 7%, average was 17%, worst was 35%
Compared to all devices tested
» 87% of all tested devices were better, 2% similar, 11% worse
» The best had a delta of 4%, average was 23%, worst was 134%
Lenovo ThinkPad P71-20HK0004GE audio analysis
(-) | not very loud speakers (70.9 dB)
Bass 100 - 315 Hz
(±) | reduced bass - on average 12.4% lower than median
(±) | linearity of bass is average (10.5% delta to prev. frequency)
Mids 400 - 2000 Hz
(±) | higher mids - on average 5.9% higher than median
(+) | mids are linear (6.4% delta to prev. frequency)
Highs 2 - 16 kHz
(±) | reduced highs - on average 5% lower than median
(±) | linearity of highs is average (13.6% delta to prev. frequency)
Overall 100 - 16.000 Hz
(±) | linearity of overall sound is average (26.6% difference to median)
Compared to same class
» 90% of all tested devices in this class were better, 4% similar, 6% worse
» The best had a delta of 7%, average was 17%, worst was 35%
Compared to all devices tested
» 82% of all tested devices were better, 3% similar, 15% worse
» The best had a delta of 4%, average was 23%, worst was 134%
| Off / Standby | |
| Idle | |
| Load |
|
Key:
min: | |
| Fujitsu Celsius H970 E3-1535M v6, Quadro P4000, Samsung SM961 MZVKW512HMJP m.2 PCI-e, IPS LED, 1920x1080, 17.3" | HP ZBook 17 G3 TZV66eA E3-1535M v5, Quadro M3000M, Samsung SM951 MZVPV256HDGL m.2 PCI-e, IPS, 1920x1080, 17.3" | Dell Precision 7710 E3-1535M v5, FirePro W7170M, Samsung SM951 MZVPV256HDGL m.2 PCI-e, IPS LED, 1920x1080, 17.3" | MSI WE72 7RJ i7-7700HQ, Quadro M2200, Samsung SM961 MZVPW256 m.2 PCI-e, IPS, 1920x1080, 17.3" | Schenker W706 6700, Quadro M5000M, Samsung SM951 MZVPV512HDGL m.2 PCI-e, IPS LED, 1920x1080, 17.3" | Lenovo ThinkPad P71-20HK0004GE i7-7820HQ, Quadro P3000, Samsung PM961 NVMe MZVLW512HMJP, IPS, 3840x2160, 17.3" | |
|---|---|---|---|---|---|---|
| Power Consumption | 6% | -29% | -17% | -74% | 0% | |
| Idle Minimum * (Watt) | 10.7 | 6.7 37% | 6.04 44% | 15 -40% | 25.9 -142% | 7.44 30% |
| Idle Average * (Watt) | 15.8 | 12.5 21% | 15.2 4% | 20.1 -27% | 31 -96% | 18 -14% |
| Idle Maximum * (Watt) | 17.8 | 13.2 26% | 42.3 -138% | 23.8 -34% | 31.9 -79% | 21.8 -22% |
| Load Average * (Watt) | 92 | 128.2 -39% | 112.8 -23% | 85.6 7% | 104.7 -14% | 77.1 16% |
| Load Maximum * (Watt) | 137 | 158.9 -16% | 182.2 -33% | 128 7% | 193 -41% | 150.5 -10% |
* ... smaller is better
| Fujitsu Celsius H970 E3-1535M v6, Quadro P4000, 96 Wh | HP ZBook 17 G3 TZV66eA E3-1535M v5, Quadro M3000M, 96 Wh | Dell Precision 7710 E3-1535M v5, FirePro W7170M, 72 Wh | MSI WE72 7RJ i7-7700HQ, Quadro M2200, 51 Wh | Schenker W706 6700, Quadro M5000M, 82 Wh | Lenovo ThinkPad P71-20HK0004GE i7-7820HQ, Quadro P3000, 96 Wh | |
|---|---|---|---|---|---|---|
| Battery runtime | -13% | -22% | -63% | -47% | -16% | |
| Reader / Idle (h) | 16.7 | 15.9 -5% | 12.9 -23% | 4.5 -73% | 3.4 -80% | 14.5 -13% |
| H.264 (h) | 9.6 | 5 -48% | 4.7 -51% | 3 -69% | 2.5 -74% | 8.6 -10% |
| WiFi v1.3 (h) | 9 | 4.8 -47% | 6.1 -32% | 3 -67% | 3 -67% | 6 -33% |
| Load (h) | 1.2 | 1.8 50% | 1.4 17% | 0.7 -42% | 1.6 33% | 1.1 -8% |
Pros
Cons
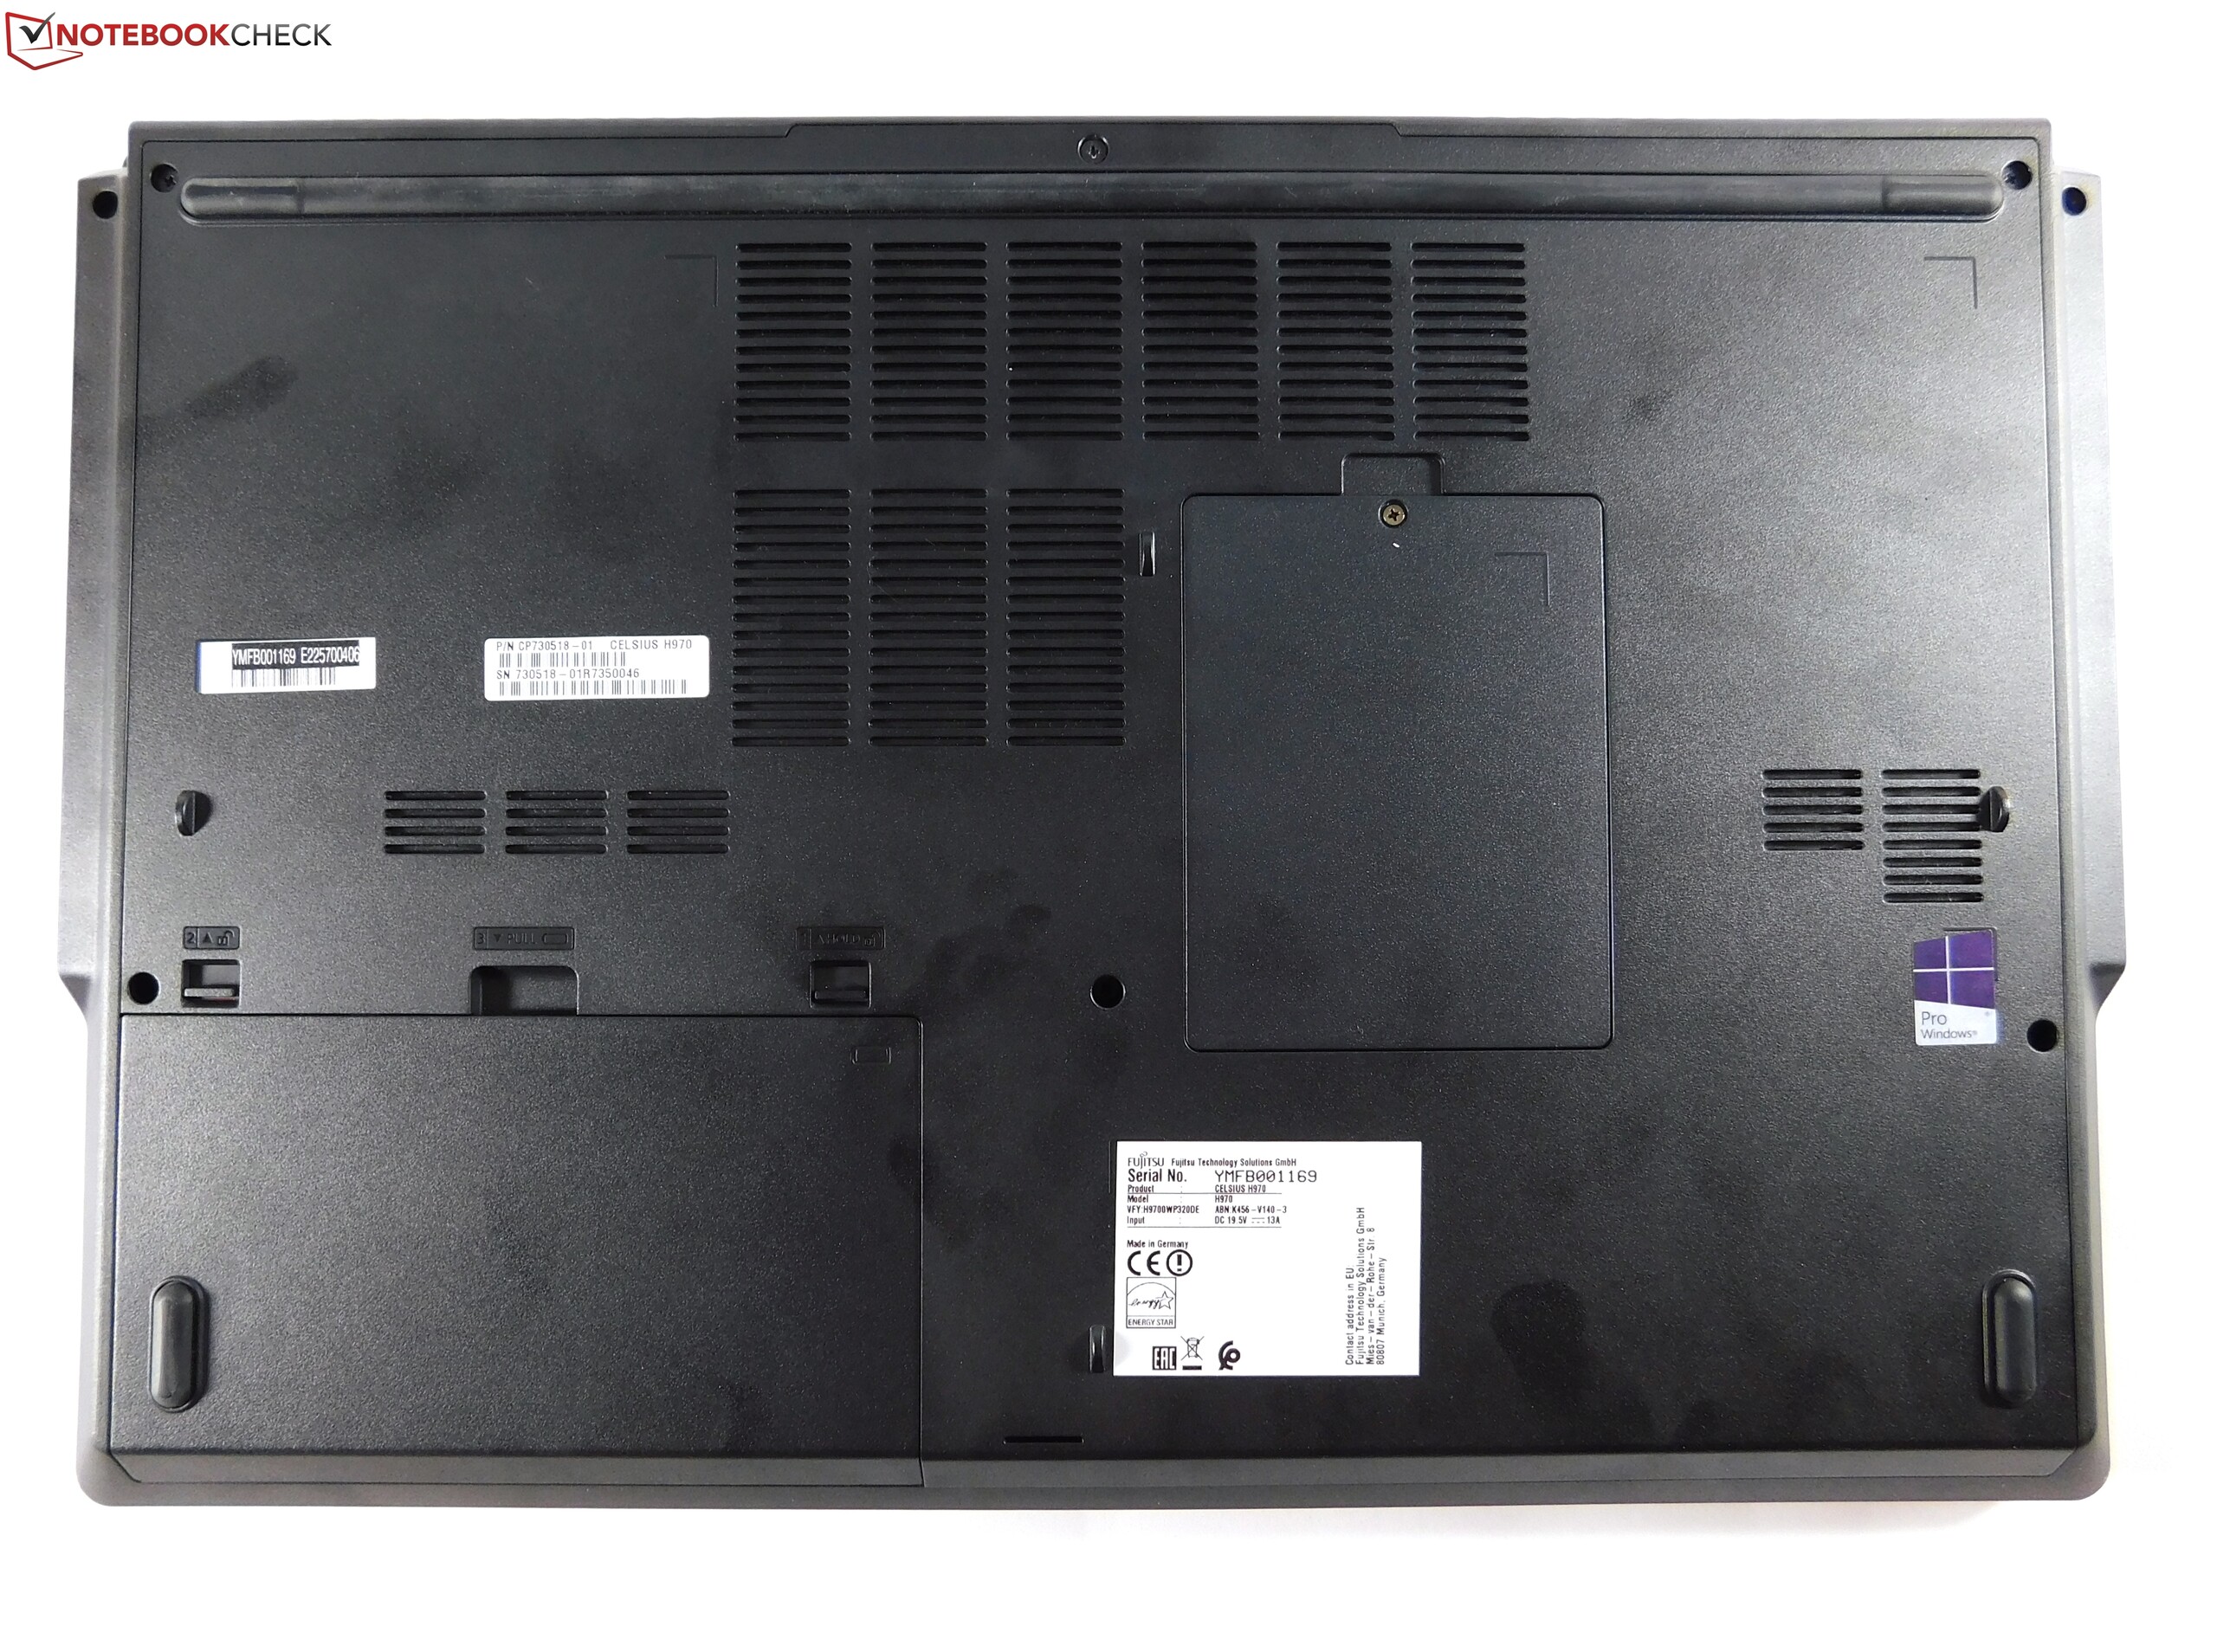
在工作站市场上取得成功并不容易。只有很少的几家生产商拥有足够的经验和口碑,可以在这个“尊贵”的笔记本类型中一展身手。富士通也希望成为这些生产商的其中之一——至少到现在为止。不过,富士通Celsius H970并不能让我们满意。富士通带来了一款在一些方面非常优秀的移动工作站,但它在其他一些方面却很弱。它的优势包括电池续航,对于一台工作站笔记本电脑来说十分出色。它证明了搭配最新的高能效处理器架构,即使是四核处理器也不一定需要在电池续航上作出牺牲。它的屏幕亮度也十分优秀,和电池续航一样在同类设备中Celsius数一数二。它的显卡性能也属于顶级,这也要归功于它有效的显卡散热系统。最后,我们还需要提到的是它的另一个优势,出色的可维护性。唯一的遗憾是用户需要使用特别的连接线才可以加装2.5寸硬盘。
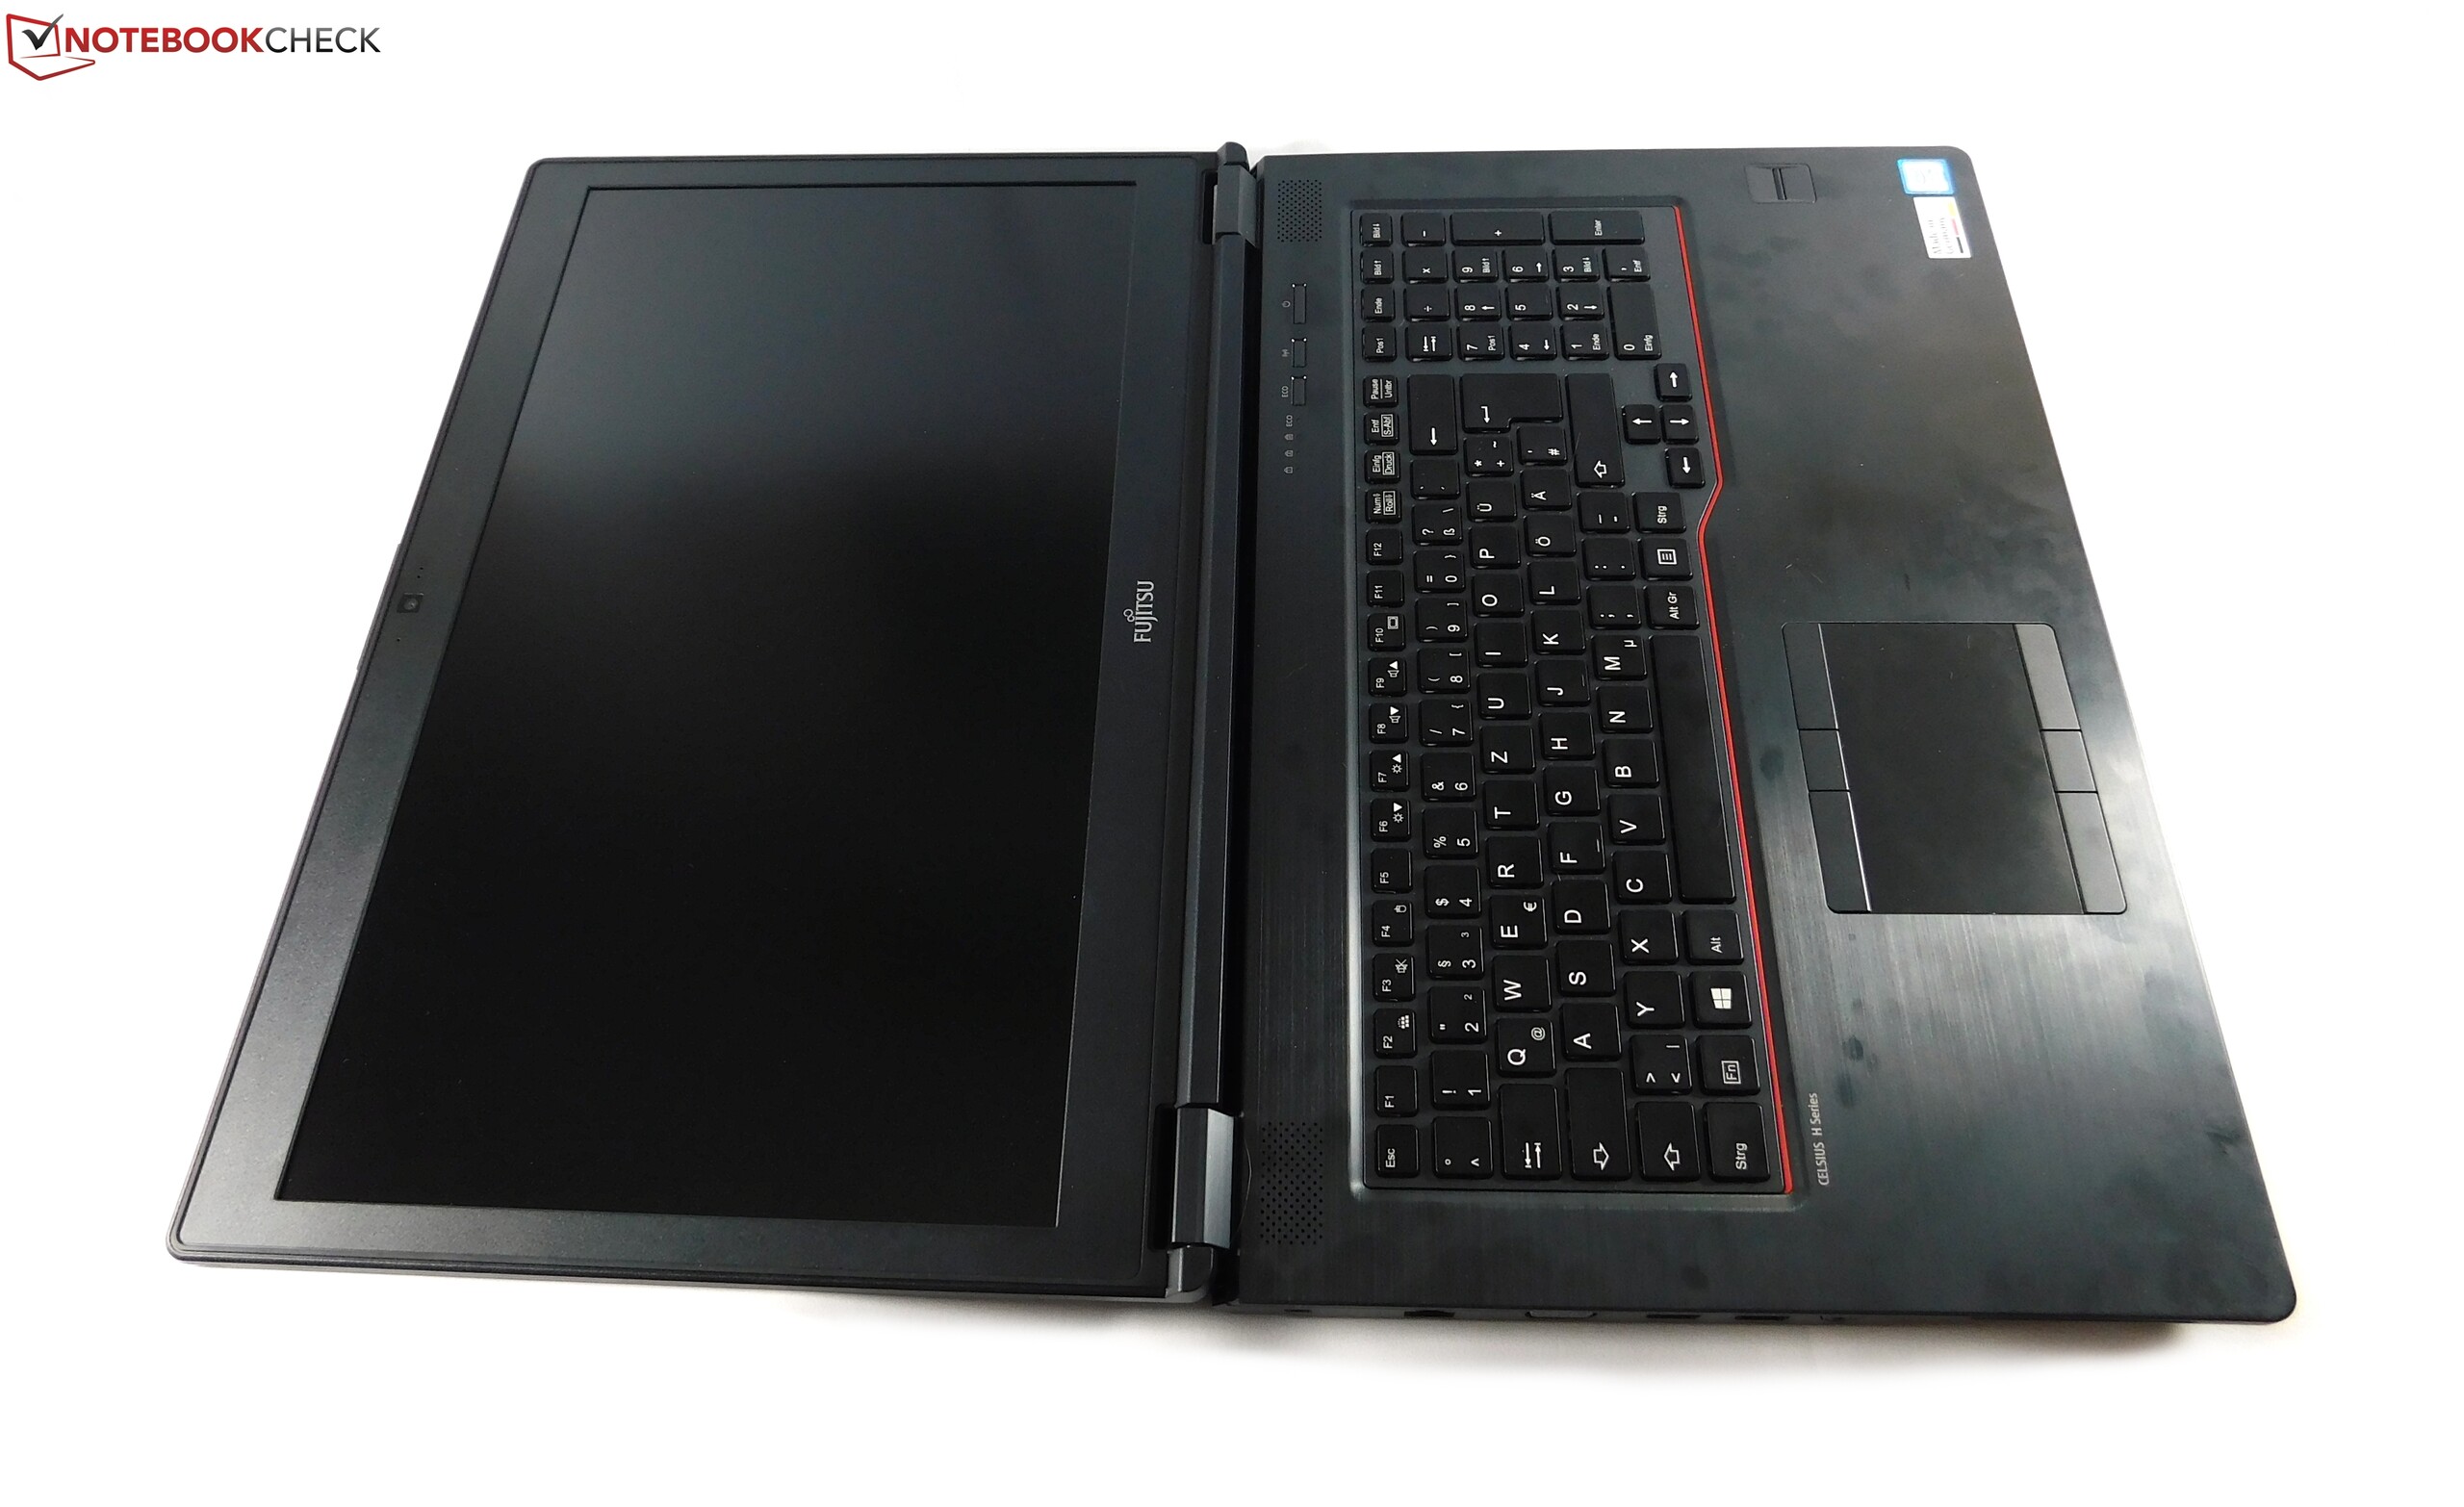
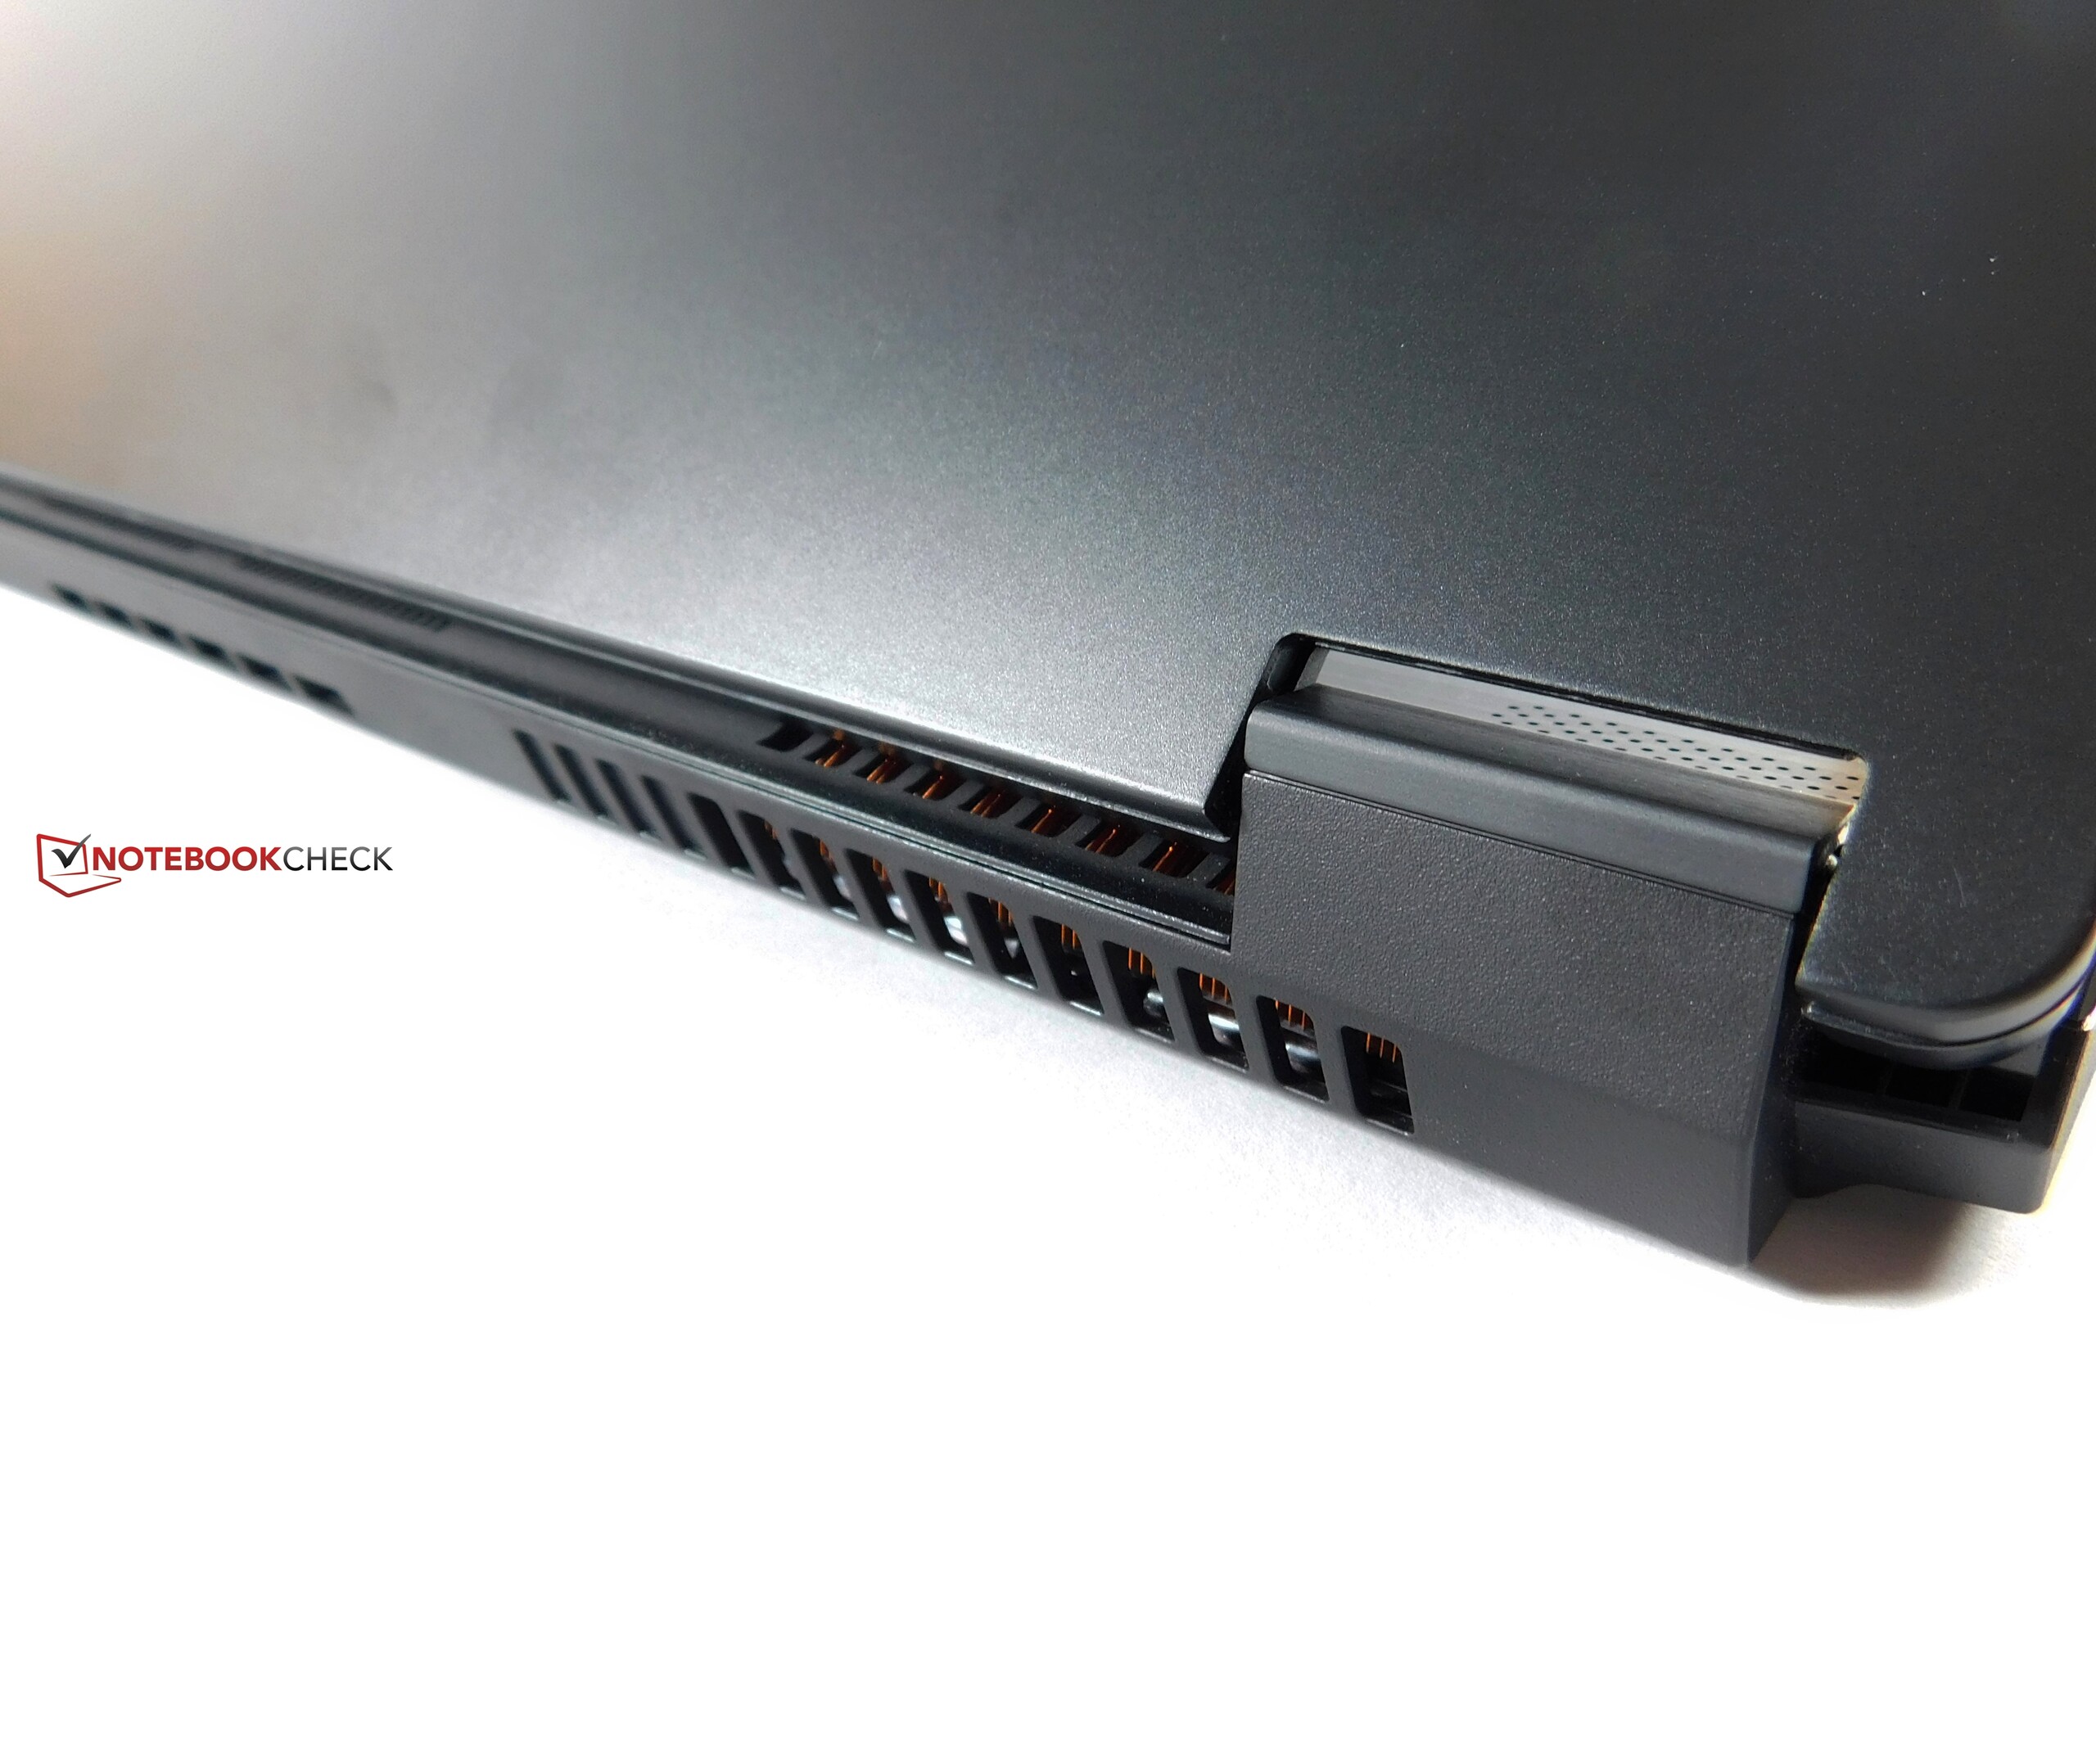
电池续航和屏幕亮度——这些是一台由于重量和体积大部分时间会固定在桌面上使用的设备所必需的特质吗?大概不是!遗憾的是,富士通在更重要的方面有所失误,比如处理器散热系统。尽管它的显卡散热表现出色,但处理器散热却让人担忧。它搭配的散热系统显然严重无法满足需要。这让它在使用中非常吵,因为处理器风扇需要开足马力才能保持芯片温度不会过高。尽管如此,它还是会遇到过热降频的情况。这在对系统压力较小的Cinebench测试中就已经露出征兆,因此即使是在日常使用中Celsius也很难完全发挥它搭载处理器的全部性能。从这方面来看,本应是最快Kaby Lake架构处理器的昂贵的至强 E3-1535M V6,在我们的对比中竟然是最慢的。不仅如此,不够稳固的键盘是富士通犯下的另一个错误。尽管它的屏幕十分明亮,但色彩并不出众,甚至无法完全覆盖sRGB色域。富士通也没有提供一块色域覆盖和分辨率更高的屏幕供用户选择。
不及格:尽管富士通的Celsius H970有它的优势,但严重不足的处理器散热系统让它无法成为一台称职的移动工作站。
由于这些问题,Celsius将在和ThinkPad P71,ZBook 17 G3或Precision 7710等各占胜场的对手竞争时遇到很大困难。它仅剩的优势是最新架构的高性能专业显卡。
注:本文是基于完整评测的缩减版本,阅读完整的英文评测,请点击这里。
Fujitsu Celsius H970
- 07/07/2017 v6 (old)
Benjamin Herzig