惠普 ZBook 17 G3 工作站简短评测
Screen Flickering / PWM (Pulse-Width Modulation)
| Screen flickering / PWM detected | 200 Hz | ≤ 40 % brightness setting | 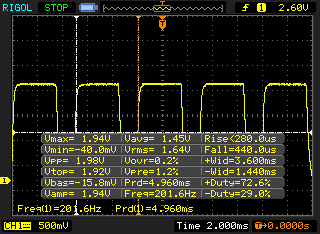 |
The display backlight flickers at 200 Hz (worst case, e.g., utilizing PWM) Flickering detected at a brightness setting of 40 % and below. There should be no flickering or PWM above this brightness setting. The frequency of 200 Hz is relatively low, so sensitive users will likely notice flickering and experience eyestrain at the stated brightness setting and below. In comparison: 52 % of all tested devices do not use PWM to dim the display. If PWM was detected, an average of 7754 (minimum: 5 - maximum: 343500) Hz was measured. | |||
| |||||||||||||||||||||||||
Brightness Distribution: 86 %
Center on Battery: 252 cd/m²
Contrast: 1200:1 (Black: 0.21 cd/m²)
ΔE ColorChecker Calman: 2.2 | ∀{0.5-29.43 Ø4.71}
ΔE Greyscale Calman: 2.7 | ∀{0.09-98 Ø4.96}
97% sRGB (Calman 2D)
96% sRGB (Argyll 1.6.3 3D)
62% AdobeRGB 1998 (Argyll 1.6.3 3D)
69% AdobeRGB 1998 (Argyll 3D)
95.9% sRGB (Argyll 3D)
67.3% Display P3 (Argyll 3D)
Gamma: 2.28
CCT: 6686 K
| HP ZBook 17 G3 TZV66eA IPS, 1920x1080 | Dell Precision 7710 IPS LED, 1920x1080 | Lenovo ThinkPad P70 IPS, 3840x2160 | MSI WT72-6QM IPS, 1920x1080 | Bullman E-Klasse 5 AH-IPS WLED, 1920x1080 | HP ZBook 17 E9X11AA-ABA LED IPS, 1920x1080 | |
|---|---|---|---|---|---|---|
| Display | -0% | 21% | -7% | -8% | 25% | |
| Display P3 Coverage (%) | 67.3 | 66.6 -1% | 90.8 35% | 67.3 0% | 66.5 -1% | 85.7 27% |
| sRGB Coverage (%) | 95.9 | 96.9 1% | 100 4% | 85.4 -11% | 84.5 -12% | 100 4% |
| AdobeRGB 1998 Coverage (%) | 69 | 68.6 -1% | 85.4 24% | 62.5 -9% | 61.8 -10% | 99.2 44% |
| Response Times | -13% | 8% | 13% | |||
| Response Time Grey 50% / Grey 80% * (ms) | 50.4 ? | 50 ? 1% | 44 ? 13% | 42 ? 17% | ||
| Response Time Black / White * (ms) | 28.4 ? | 36 ? -27% | 27.6 ? 3% | 26 ? 8% | ||
| PWM Frequency (Hz) | 200 ? | 198 ? | 228 ? | 86 ? | ||
| Screen | -11% | -22% | -42% | -18% | 3% | |
| Brightness middle (cd/m²) | 252 | 332 32% | 365 45% | 303 20% | 355 41% | 320 27% |
| Brightness (cd/m²) | 243 | 307 26% | 341 40% | 298 23% | 335 38% | 311 28% |
| Brightness Distribution (%) | 86 | 83 -3% | 85 -1% | 94 9% | 89 3% | 88 2% |
| Black Level * (cd/m²) | 0.21 | 0.33 -57% | 0.4 -90% | 0.46 -119% | 0.44 -110% | 0.359 -71% |
| Contrast (:1) | 1200 | 1006 -16% | 913 -24% | 659 -45% | 807 -33% | 891 -26% |
| Colorchecker dE 2000 * | 2.2 | 3 -36% | 3.8 -73% | 5.77 -162% | 3.73 -70% | 2.04 7% |
| Colorchecker dE 2000 max. * | 3.8 | |||||
| Greyscale dE 2000 * | 2.7 | 4 -48% | 6.09 -126% | 4.87 -80% | 2.84 -5% | 2.45 9% |
| Gamma | 2.28 96% | 2 110% | 2.3 96% | 1.99 111% | 2.12 104% | 2.28 96% |
| CCT | 6686 97% | 7089 92% | 6332 103% | 7363 88% | 6457 101% | 6518 100% |
| Color Space (Percent of AdobeRGB 1998) (%) | 62 | 62 0% | 76.01 23% | 56.04 -10% | 55.45 -11% | 93 50% |
| Color Space (Percent of sRGB) (%) | 96 | 97 1% | 99.97 4% | 85.27 -11% | 84.39 -12% | 100 4% |
| Total Average (Program / Settings) | -8% /
-9% | 2% /
-9% | -12% /
-26% | -13% /
-15% | 14% /
9% |
* ... smaller is better
Display Response Times
| ↔ Response Time Black to White | ||
|---|---|---|
| 28.4 ms ... rise ↗ and fall ↘ combined | ↗ 7.2 ms rise | 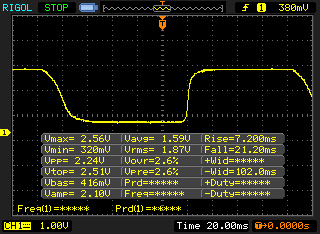 |
| ↘ 21.2 ms fall | ||
| The screen shows relatively slow response rates in our tests and may be too slow for gamers. In comparison, all tested devices range from 0.1 (minimum) to 240 (maximum) ms. » 75 % of all devices are better. This means that the measured response time is worse than the average of all tested devices (19.8 ms). | ||
| ↔ Response Time 50% Grey to 80% Grey | ||
| 50.4 ms ... rise ↗ and fall ↘ combined | ↗ 17.2 ms rise | 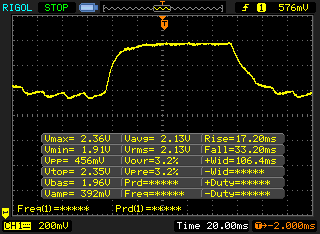 |
| ↘ 33.2 ms fall | ||
| The screen shows slow response rates in our tests and will be unsatisfactory for gamers. In comparison, all tested devices range from 0.165 (minimum) to 636 (maximum) ms. » 87 % of all devices are better. This means that the measured response time is worse than the average of all tested devices (31 ms). | ||
| Cinebench R15 | |
| CPU Multi 64Bit | |
| Bullman E-Klasse 5 | |
| Dell Precision 7710 | |
| HP ZBook 17 G3 TZV66eA | |
| MSI WT72-6QM | |
| Lenovo ThinkPad P70 | |
| HP ZBook 17 G2 J8Z55ET | |
| CPU Single 64Bit | |
| Bullman E-Klasse 5 | |
| Dell Precision 7710 | |
| MSI WT72-6QM | |
| HP ZBook 17 G3 TZV66eA | |
| Lenovo ThinkPad P70 | |
| HP ZBook 17 G2 J8Z55ET | |
| Cinebench R11.5 | |
| CPU Multi 64Bit | |
| Bullman E-Klasse 5 | |
| Dell Precision 7710 | |
| HP ZBook 17 G3 TZV66eA | |
| MSI WT72-6QM | |
| Lenovo ThinkPad P70 | |
| HP ZBook 17 G2 J8Z55ET | |
| CPU Single 64Bit | |
| Bullman E-Klasse 5 | |
| Dell Precision 7710 | |
| HP ZBook 17 G3 TZV66eA | |
| MSI WT72-6QM | |
| Lenovo ThinkPad P70 | |
| HP ZBook 17 G2 J8Z55ET | |
| Cinebench R10 | |
| Rendering Multiple CPUs 32Bit | |
| Bullman E-Klasse 5 | |
| Dell Precision 7710 | |
| HP ZBook 17 G3 TZV66eA | |
| MSI WT72-6QM | |
| Lenovo ThinkPad P70 | |
| HP ZBook 17 G2 J8Z55ET | |
| Rendering Single 32Bit | |
| Bullman E-Klasse 5 | |
| Dell Precision 7710 | |
| HP ZBook 17 G3 TZV66eA | |
| MSI WT72-6QM | |
| Lenovo ThinkPad P70 | |
| HP ZBook 17 G2 J8Z55ET | |
| Rendering Multiple CPUs 64Bit | |
| Bullman E-Klasse 5 | |
| HP ZBook 17 G3 TZV66eA | |
| Dell Precision 7710 | |
| MSI WT72-6QM | |
| Lenovo ThinkPad P70 | |
| HP ZBook 17 G2 J8Z55ET | |
| Rendering Single CPUs 64Bit | |
| Bullman E-Klasse 5 | |
| Dell Precision 7710 | |
| MSI WT72-6QM | |
| HP ZBook 17 G3 TZV66eA | |
| Lenovo ThinkPad P70 | |
| HP ZBook 17 G2 J8Z55ET | |
| PCMark 7 - Score | |
| MSI WT72-6QM | |
| Bullman E-Klasse 5 | |
| HP ZBook 17 G3 TZV66eA | |
| Dell Precision 7710 | |
| Lenovo ThinkPad P70 | |
| HP ZBook 17 G2 J8Z55ET | |
| PCMark 8 | |
| Work Score Accelerated v2 | |
| MSI WT72-6QM | |
| Dell Precision 7710 | |
| Bullman E-Klasse 5 | |
| HP ZBook 17 G3 TZV66eA | |
| HP ZBook 17 G2 J8Z55ET | |
| Lenovo ThinkPad P70 | |
| Creative Score Accelerated v2 | |
| Dell Precision 7710 | |
| HP ZBook 17 G2 J8Z55ET | |
| Bullman E-Klasse 5 | |
| HP ZBook 17 G3 TZV66eA | |
| Home Score Accelerated v2 | |
| Dell Precision 7710 | |
| MSI WT72-6QM | |
| HP ZBook 17 G2 J8Z55ET | |
| Bullman E-Klasse 5 | |
| HP ZBook 17 G3 TZV66eA | |
| Lenovo ThinkPad P70 | |
| PCMark 7 Score | 5487 points | |
| PCMark 8 Home Score Accelerated v2 | 4133 points | |
| PCMark 8 Creative Score Accelerated v2 | 4564 points | |
| PCMark 8 Work Score Accelerated v2 | 5271 points | |
Help | ||

| LuxMark v2.0 64Bit | |
| Room GPUs-only | |
| MSI WT72-6QM | |
| HP ZBook 17 G3 TZV66eA | |
| Lenovo ThinkPad P70 | |
| Dell Precision 7710 | |
| HP ZBook 17 G2 J8Z55ET | |
| Bullman E-Klasse 5 | |
| Sala GPUs-only | |
| HP ZBook 17 G3 TZV66eA | |
| Lenovo ThinkPad P70 | |
| MSI WT72-6QM | |
| Dell Precision 7710 | |
| HP ZBook 17 G2 J8Z55ET | |
| Bullman E-Klasse 5 | |
| SiSoft Sandra 2016 | |
| Image Processing | |
| Dell Precision 7710 | |
| Lenovo ThinkPad P70 | |
| HP ZBook 17 G3 TZV66eA | |
| GP Cryptography (Higher Security AES256+SHA2-512) | |
| HP ZBook 17 G3 TZV66eA | |
| Dell Precision 7710 | |
| Lenovo ThinkPad P70 | |
| GP Financial Analysis (FP High/Double Precision) | |
| Dell Precision 7710 | |
| Lenovo ThinkPad P70 | |
| HP ZBook 17 G3 TZV66eA | |
| Unigine Heaven 3.0 | |
| 1920x1080 DX 11, Normal Tessellation, High Shaders AA:Off AF:Off | |
| MSI WT72-6QM | |
| HP ZBook 17 G3 TZV66eA | |
| Lenovo ThinkPad P70 | |
| Dell Precision 7710 | |
| HP ZBook 17 G2 J8Z55ET | |
| Bullman E-Klasse 5 | |
| 1920x1080 OpenGL, Normal Tessellation, High Shaders AA:Off AF:Off | |
| MSI WT72-6QM | |
| HP ZBook 17 G3 TZV66eA | |
| Dell Precision 7710 | |
| HP ZBook 17 G2 J8Z55ET | |
| Lenovo ThinkPad P70 | |
| Bullman E-Klasse 5 | |
| Unigine Valley 1.0 | |
| 1920x1080 Extreme HD DirectX AA:x8 | |
| MSI WT72-6QM | |
| HP ZBook 17 G3 TZV66eA | |
| Lenovo ThinkPad P70 | |
| Dell Precision 7710 | |
| 1920x1080 Extreme HD Preset OpenGL AA:x8 | |
| HP ZBook 17 G3 TZV66eA | |
| Dell Precision 7710 | |
| Lenovo ThinkPad P70 | |
| 3DMark | |
| 1920x1080 Fire Strike Score | |
| MSI WT72-6QM | |
| Acer Predator 15 G9-592-7925 | |
| Dell Precision 7710 | |
| HP ZBook 17 G3 TZV66eA | |
| Lenovo ThinkPad P70 | |
| Schenker XMG A726 | |
| MSI GE62-6QD16H11 | |
| HP ZBook 17 G2 J8Z55ET | |
| Bullman E-Klasse 5 | |
| 1920x1080 Fire Strike Graphics | |
| MSI WT72-6QM | |
| Acer Predator 15 G9-592-7925 | |
| Dell Precision 7710 | |
| HP ZBook 17 G3 TZV66eA | |
| Lenovo ThinkPad P70 | |
| Schenker XMG A726 | |
| MSI GE62-6QD16H11 | |
| HP ZBook 17 G2 J8Z55ET | |
| Bullman E-Klasse 5 | |
| 3DMark 06 Standard Score | 27895 points | |
| 3DMark 11 Performance | 8586 points | |
| 3DMark Ice Storm Standard Score | 91685 points | |
| 3DMark Cloud Gate Standard Score | 23083 points | |
| 3DMark Fire Strike Score | 6108 points | |
Help | ||
| low | med. | high | ultra | |
|---|---|---|---|---|
| BioShock Infinite (2013) | 226.3 | 182.7 | 166.7 | 69.8 |
| The Witcher 3 (2015) | 122.7 | 74.6 | 42.4 | 22.5 |
| Rise of the Tomb Raider (2016) | 114.9 | 69.9 | 40.2 | 33.4 |
Noise level
| Idle |
| 30 / 30 / 30 dB(A) |
| Load |
| 48.9 / 48.9 dB(A) |
 | ||
30 dB silent 40 dB(A) audible 50 dB(A) loud |
||
min: | ||
| HP ZBook 17 G3 TZV66eA Quadro M3000M | Dell Precision 7710 FirePro W7170M | Lenovo ThinkPad P70 Quadro M3000M | MSI WT72-6QM Quadro M5000M | Bullman E-Klasse 5 Quadro K3100M | HP ZBook 17 G2 J8Z55ET FirePro M6100 | |
|---|---|---|---|---|---|---|
| Noise | 3% | 7% | 1% | 3% | 2% | |
| off / environment * (dB) | 30 | 30 -0% | 30 -0% | |||
| Idle Minimum * (dB) | 30 | 30 -0% | 30 -0% | 33.3 -11% | 28.5 5% | 29.2 3% |
| Idle Average * (dB) | 30 | 30 -0% | 30 -0% | 33.4 -11% | 28.5 5% | 29.9 -0% |
| Idle Maximum * (dB) | 30 | 30 -0% | 30 -0% | 33.5 -12% | 28.5 5% | 29.9 -0% |
| Load Average * (dB) | 48.9 | 43.2 12% | 36.5 25% | 38.8 21% | 47.8 2% | 46.8 4% |
| Load Maximum * (dB) | 48.9 | 47.13 4% | 40.8 17% | 40.2 18% | 50.8 -4% | 46.8 4% |
* ... smaller is better
(-) The maximum temperature on the upper side is 55.5 °C / 132 F, compared to the average of 38.2 °C / 101 F, ranging from 22.2 to 69.8 °C for the class Workstation.
(-) The bottom heats up to a maximum of 55.8 °C / 132 F, compared to the average of 41.1 °C / 106 F
(+) In idle usage, the average temperature for the upper side is 26.4 °C / 80 F, compared to the device average of 32 °C / 90 F.
(+) The palmrests and touchpad are cooler than skin temperature with a maximum of 29.4 °C / 84.9 F and are therefore cool to the touch.
(±) The average temperature of the palmrest area of similar devices was 27.8 °C / 82 F (-1.6 °C / -2.9 F).
| HP ZBook 17 G3 TZV66eA E3-1535M v5, Quadro M3000M | Dell Precision 7710 E3-1535M v5, FirePro W7170M | Lenovo ThinkPad P70 6820HQ, Quadro M3000M | MSI WT72-6QM E3-1505M v5, Quadro M5000M | Bullman E-Klasse 5 4790K, Quadro K3100M | HP ZBook 17 G2 J8Z55ET 4710MQ, FirePro M6100 | |
|---|---|---|---|---|---|---|
| Heat | 6% | 12% | 5% | -12% | 12% | |
| Maximum Upper Side * (°C) | 55.5 | 35.6 36% | 39 30% | 40.6 27% | 42.3 24% | 39.2 29% |
| Maximum Bottom * (°C) | 55.8 | 55 1% | 35.4 37% | 42.6 24% | 44.2 21% | 37.2 33% |
| Idle Upper Side * (°C) | 29.1 | 29.3 -1% | 30.8 -6% | 28.2 3% | 41.6 -43% | 28.9 1% |
| Idle Bottom * (°C) | 29 | 32.8 -13% | 33.1 -14% | 38.6 -33% | 43.9 -51% | 33 -14% |
* ... smaller is better
| Off / Standby | |
| Idle | |
| Load |
|
Key:
min: | |
| HP ZBook 17 G3 TZV66eA E3-1535M v5, Quadro M3000M, 1920x1080 | Dell Precision 7710 E3-1535M v5, FirePro W7170M, 1920x1080 | Lenovo ThinkPad P70 6820HQ, Quadro M3000M, 3840x2160 | MSI WT72-6QM E3-1505M v5, Quadro M5000M, 1920x1080 | Bullman E-Klasse 5 4790K, Quadro K3100M, 1920x1080 | HP ZBook 17 G2 J8Z55ET 4710MQ, FirePro M6100, 1920x1080 | |
|---|---|---|---|---|---|---|
| Power Consumption | -47% | -31% | -108% | -175% | -164% | |
| Idle Minimum * (Watt) | 6.7 | 6.04 10% | 12.1 -81% | 24.8 -270% | 33.7 -403% | 29.7 -343% |
| Idle Average * (Watt) | 12.5 | 15.2 -22% | 19.7 -58% | 29.7 -138% | 39.3 -214% | 41.6 -233% |
| Idle Maximum * (Watt) | 13.2 | 42.3 -220% | 20.5 -55% | 30.1 -128% | 40.2 -205% | 42.3 -220% |
| Load Average * (Watt) | 128.2 | 112.8 12% | 94.3 26% | 105.2 18% | 148 -15% | 136.1 -6% |
| Load Maximum * (Watt) | 158.9 | 182.2 -15% | 139.6 12% | 192.2 -21% | 221 -39% | 184 -16% |
* ... smaller is better
| HP ZBook 17 G3 TZV66eA 96 Wh, mAh | Dell Precision 7710 72 Wh, mAh | Lenovo ThinkPad P70 96 Wh, mAh | MSI WT72-6QM Wh, 86580 mAh | Bullman E-Klasse 5 82 Wh, mAh | HP ZBook 17 G2 J8Z55ET 75 Wh, mAh | |
|---|---|---|---|---|---|---|
| Battery runtime | -5% | -4% | -33% | -53% | -64% | |
| Reader / Idle (h) | 15.9 | 12.9 -19% | 7.7 -52% | 6.9 -57% | 2.8 -82% | 2.7 -83% |
| H.264 (h) | 5 | 4.7 -6% | 7.5 50% | 2.1 -58% | 2.4 -52% | |
| WiFi v1.3 (h) | 4.8 | 6.1 27% | 6 25% | 4.1 -15% | 2.4 -50% | |
| Load (h) | 1.8 | 1.4 -22% | 1.1 -39% | 1.3 -28% | 1.4 -22% | 0.8 -56% |
| WiFi (h) | 2.5 |
Pros
Cons
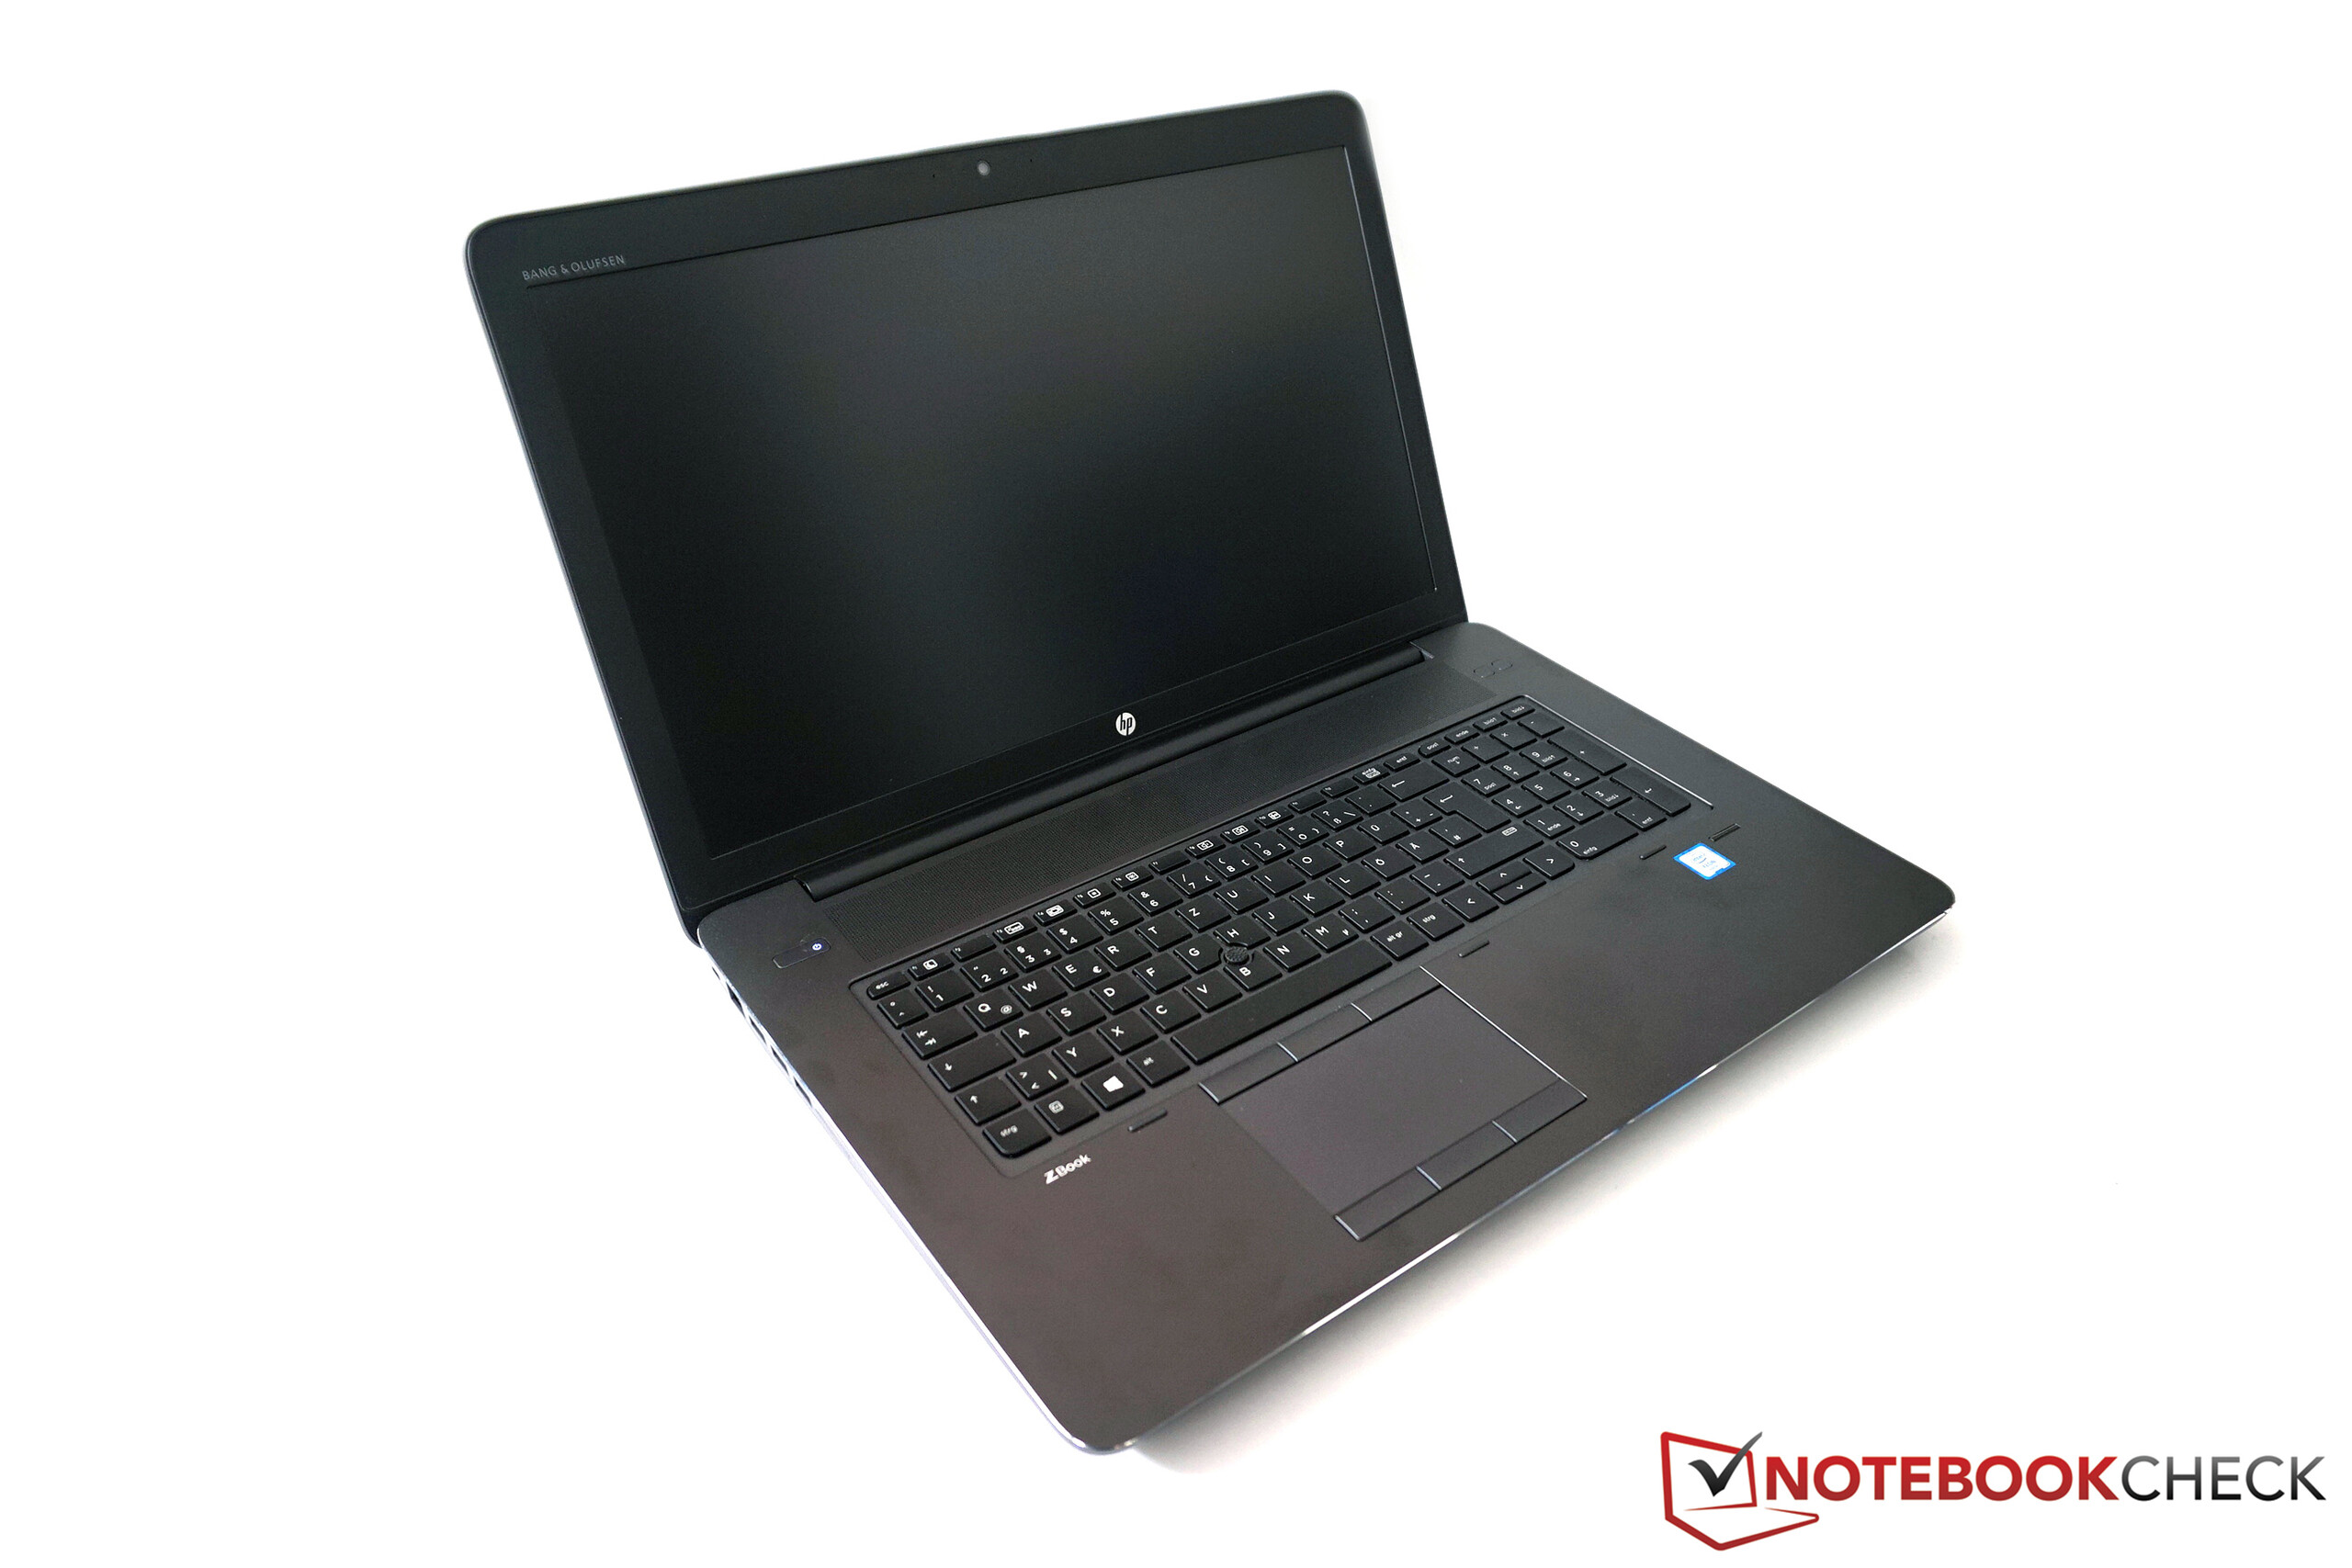
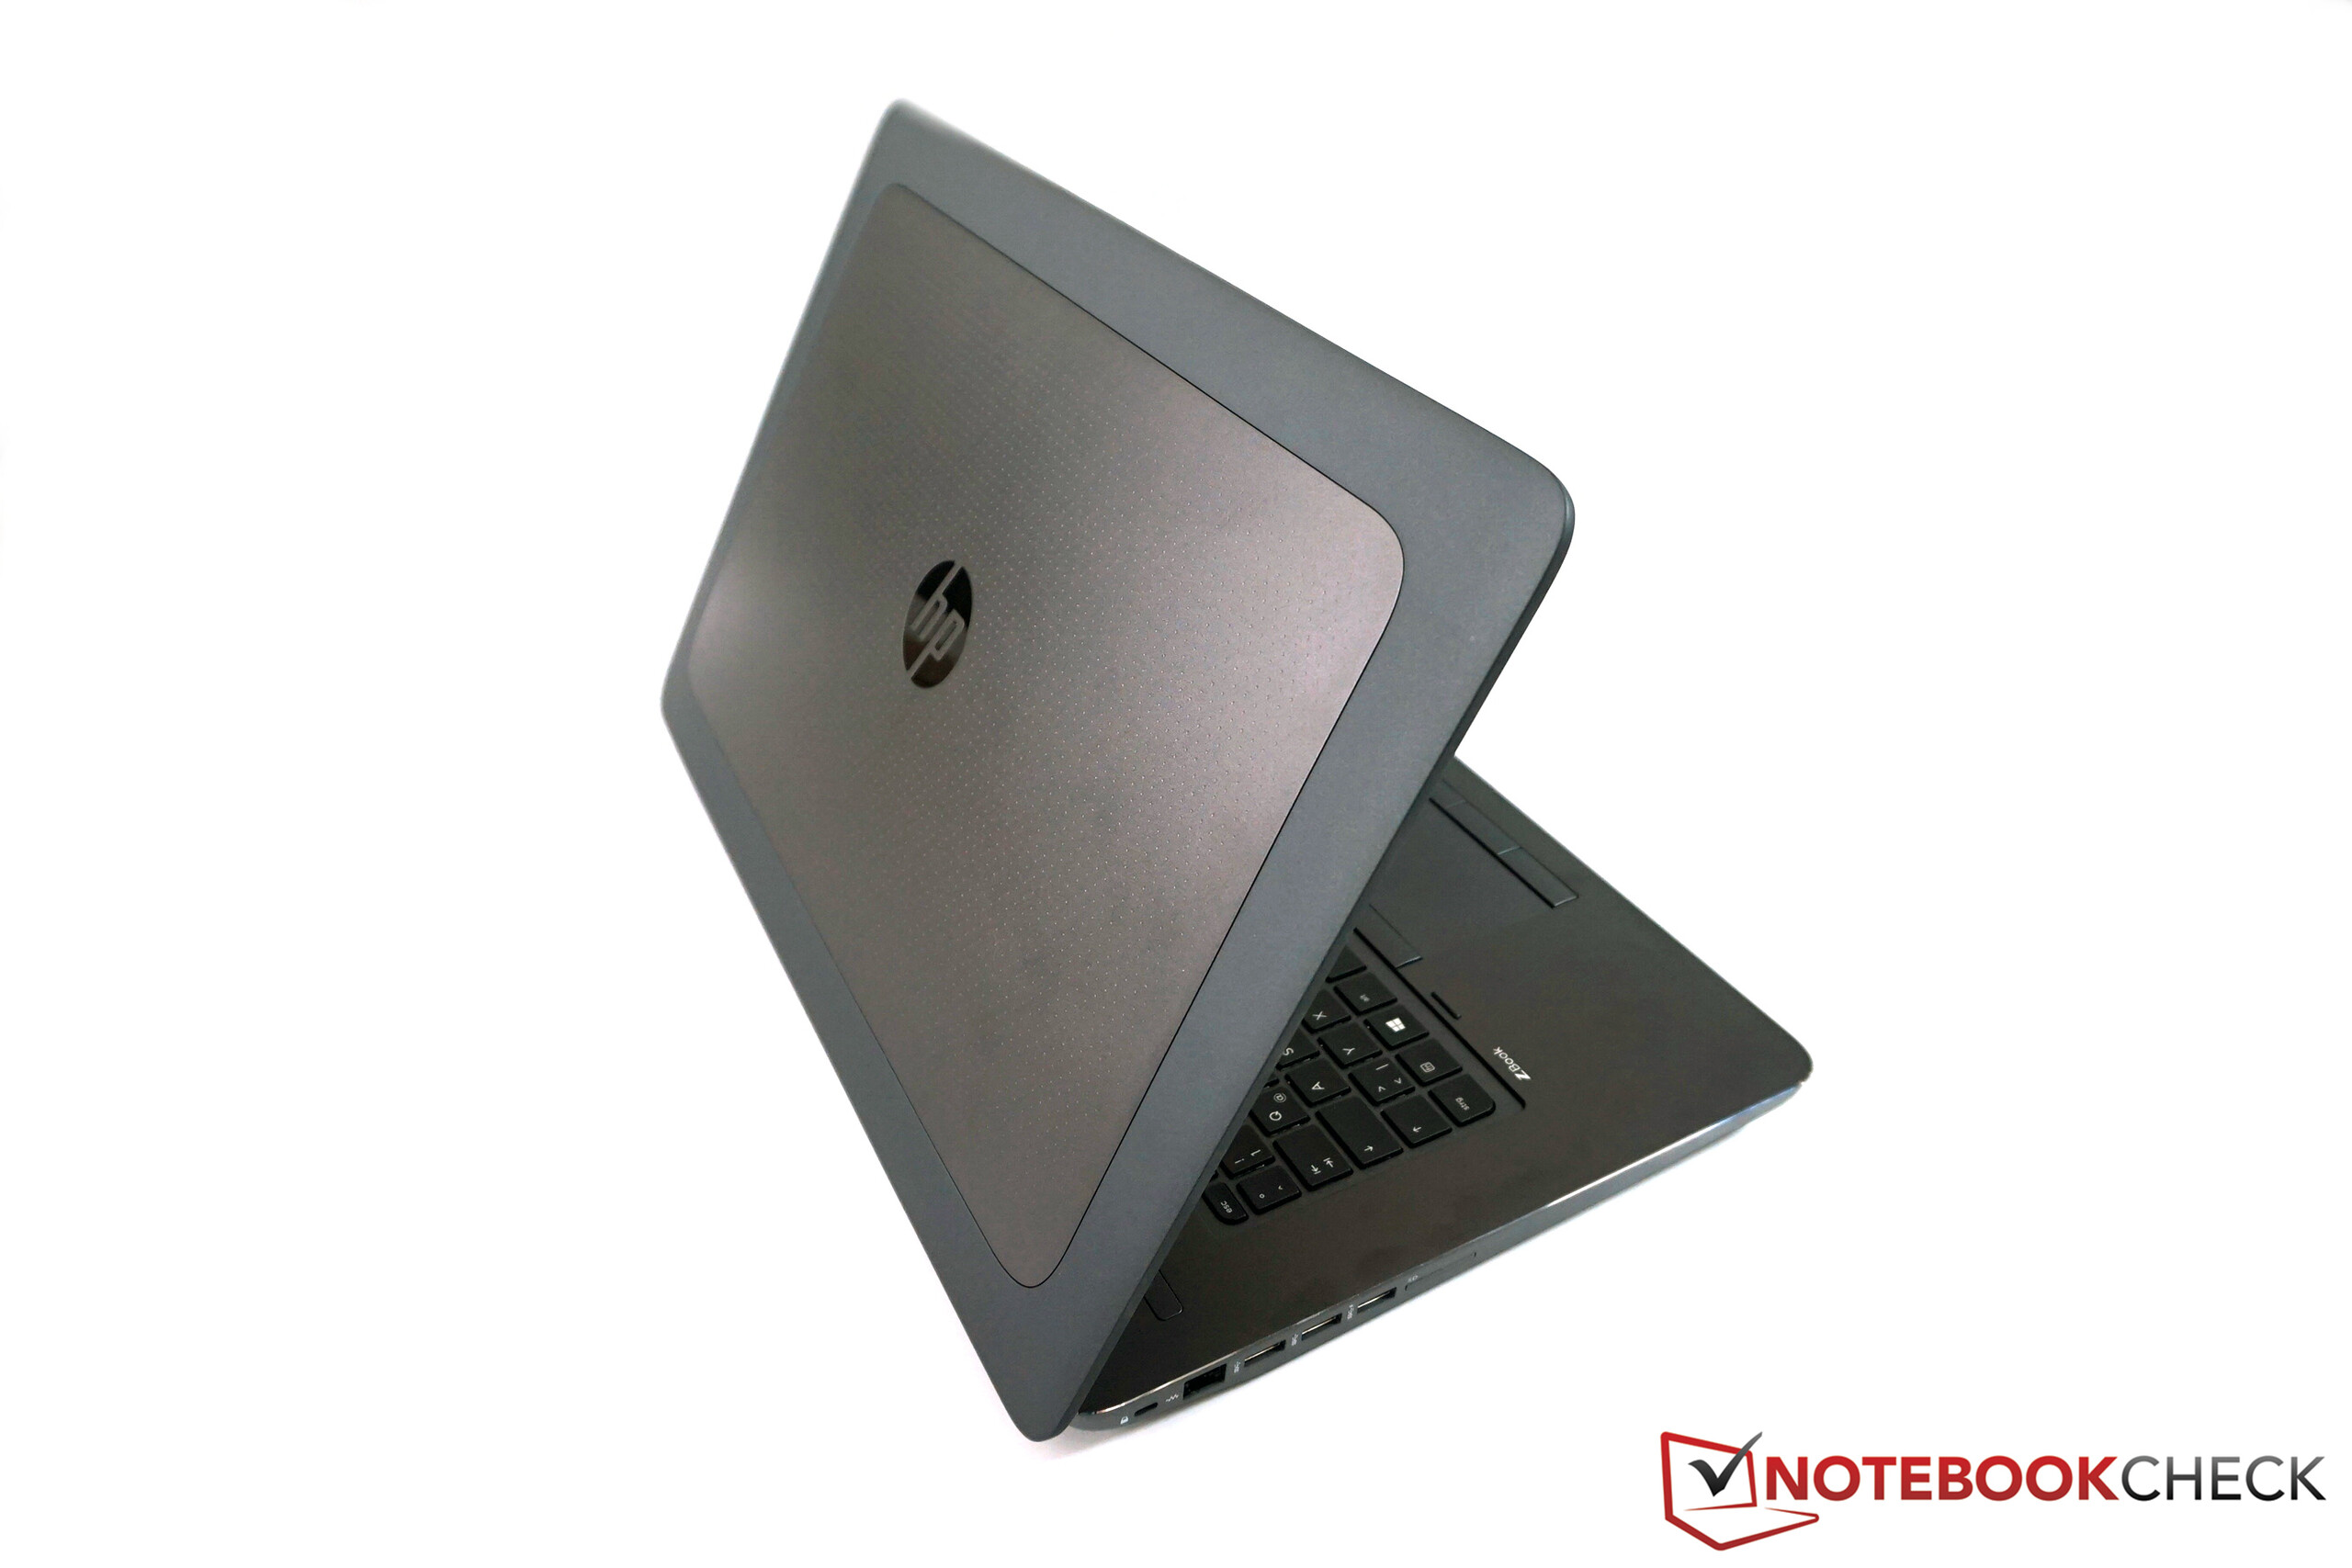
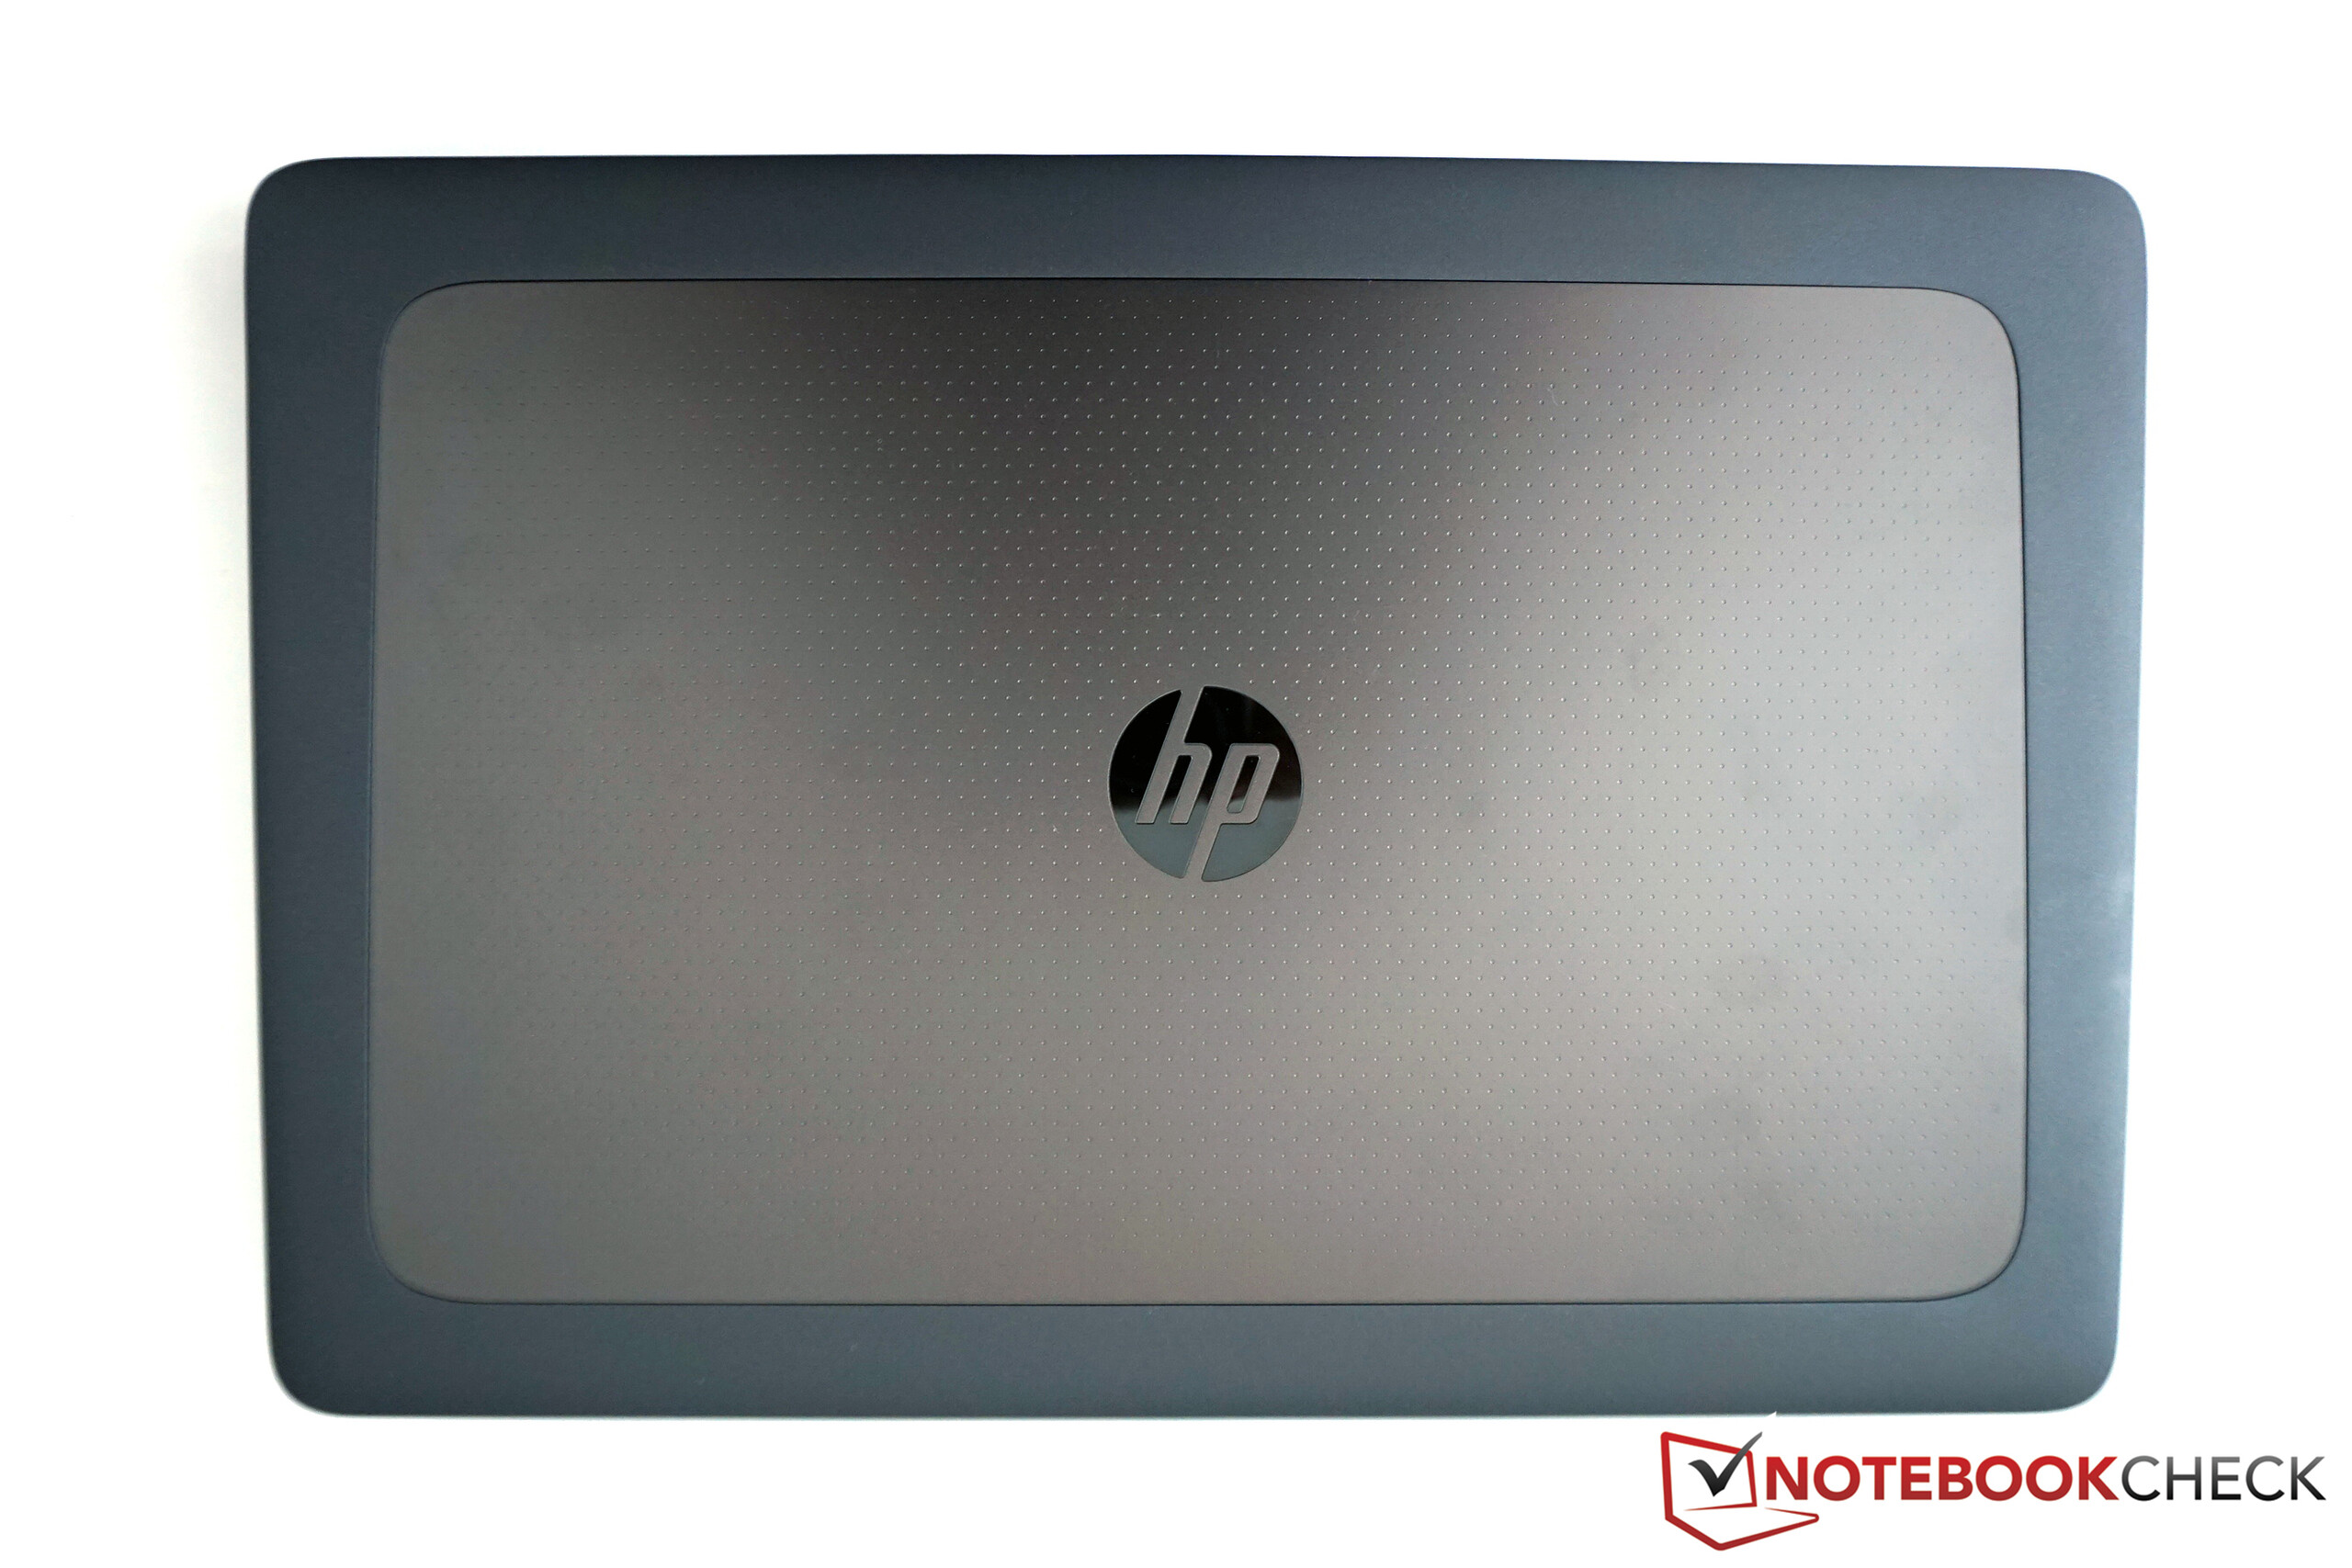
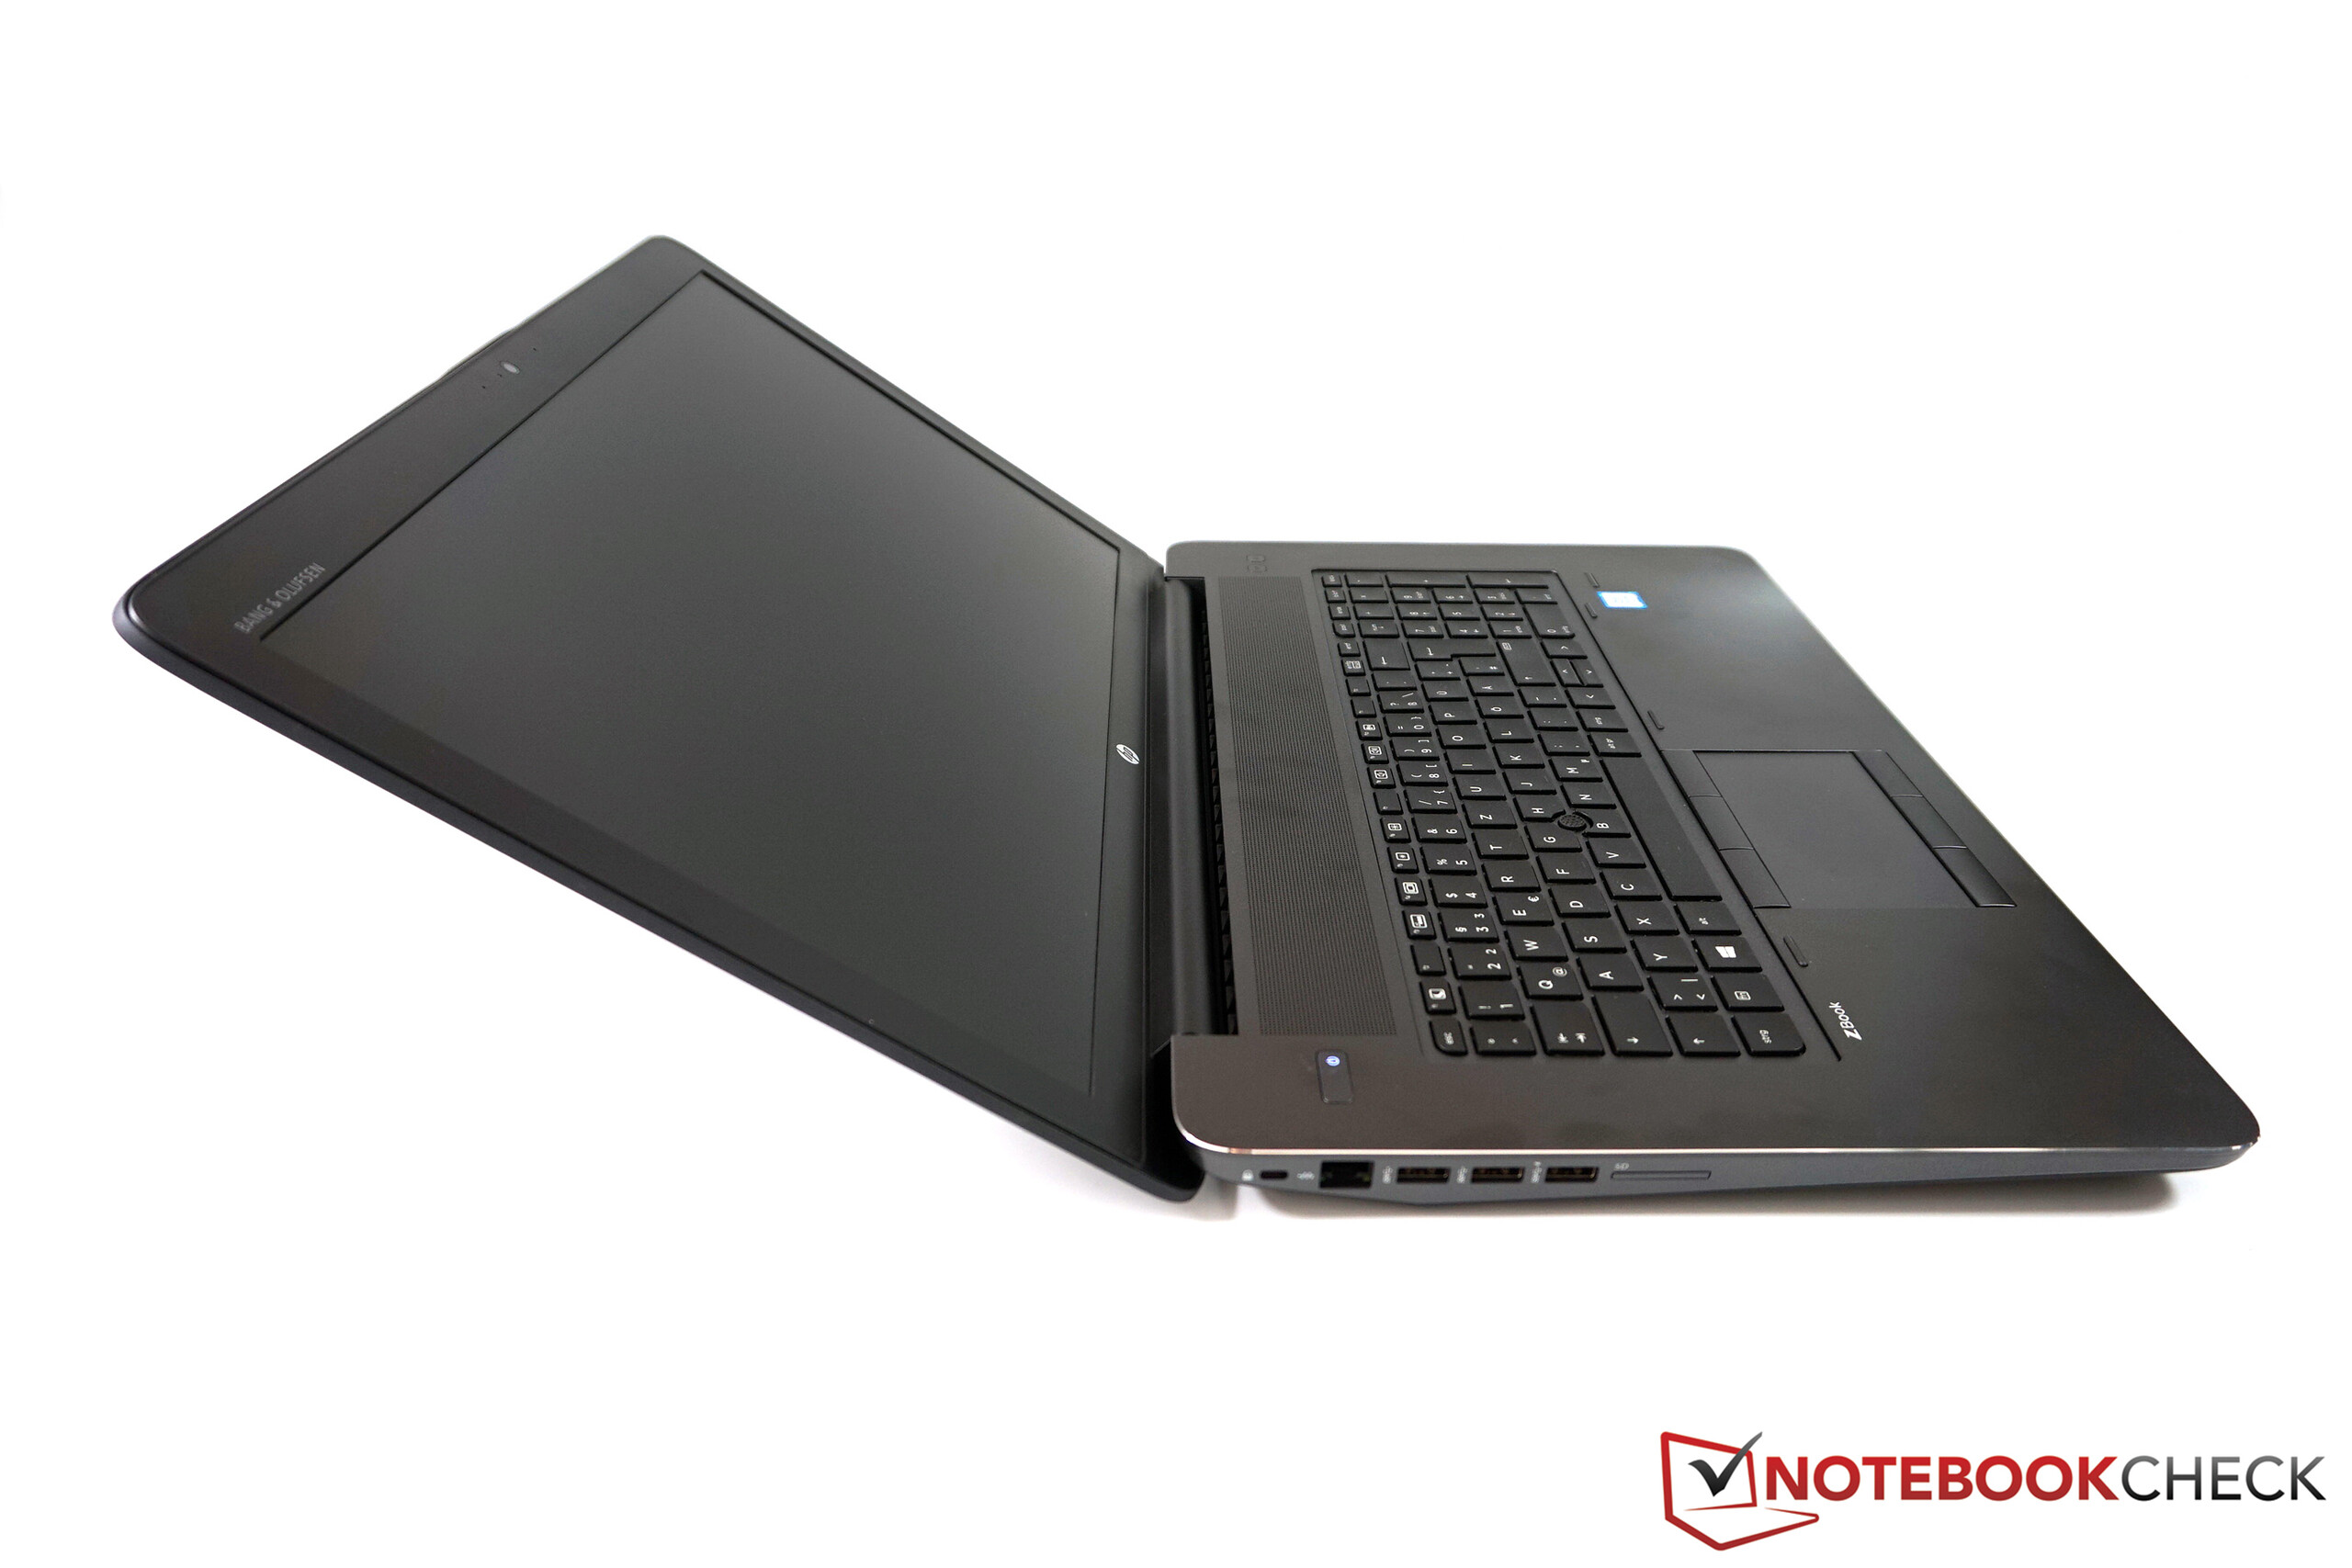
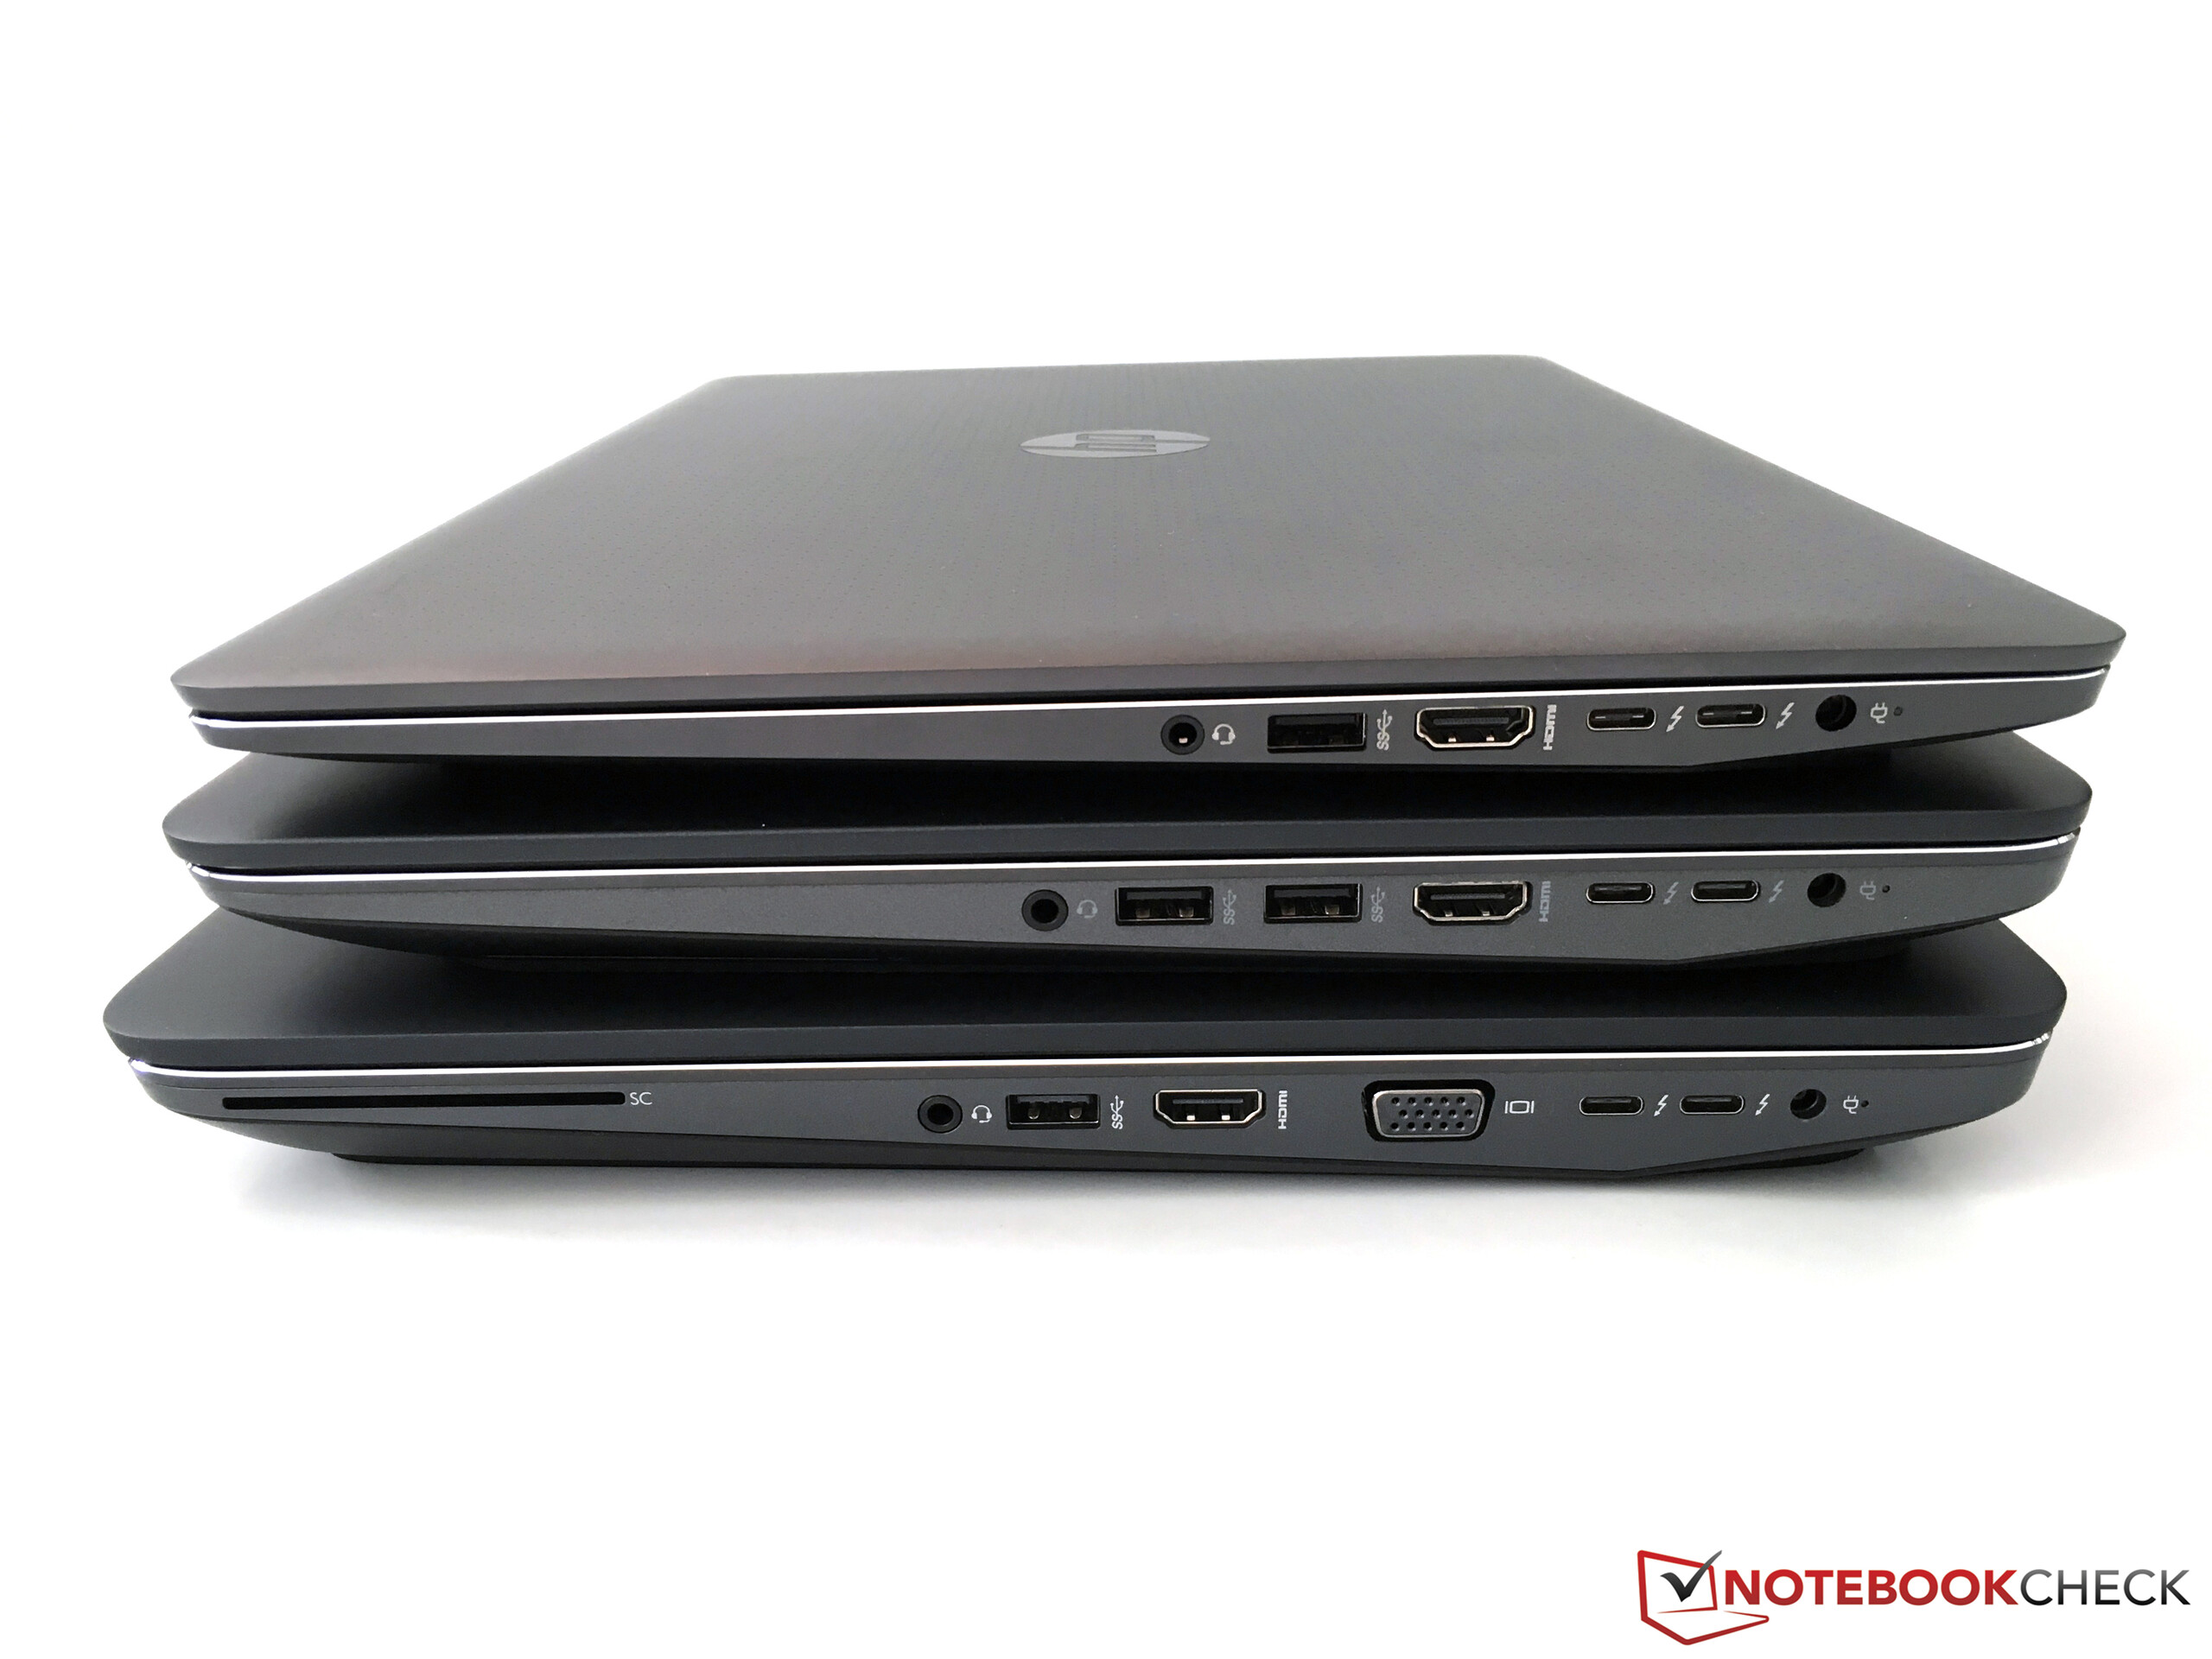
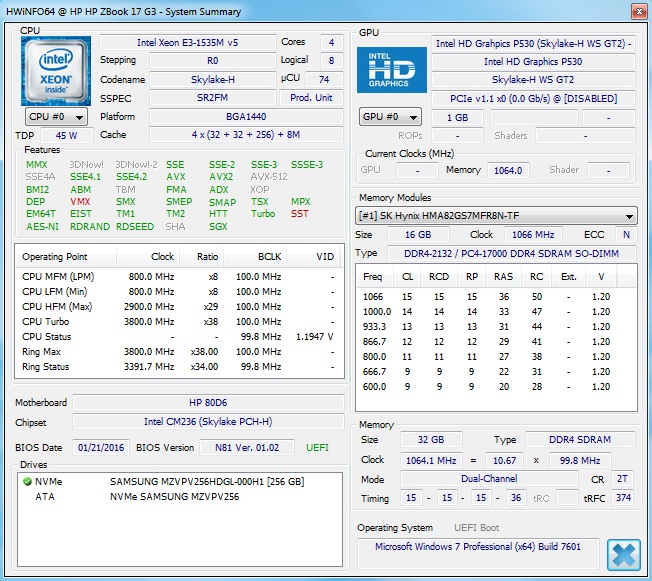
惠普ZBook 17 G3是完美的工作站吗?答案是否,不过惠普依然带来了一台非常优秀的设备。我们特别喜欢G3系列的机身设计,它的品质不输任何其他设备。它提供了最新的接口,丰富的可选组件,维护升级空间也十分出色。
它的一个主要缺点在于散热,一些竞争对手在这方面做得更好,同时搭配了性能相当的硬件。它的全高清屏幕的表现也无法完全说服我们。它的出厂色彩准确度十分优秀,对比度也很高,不过亮度相比竞争对手、以及前代产品就低了很多。可选的4K DreamColor屏幕应该在这方面表现更好,不过相应的配置目前还未上市。我们测试机的另外一个问题是脆弱的转轴,不过我们估计这是个体缺陷。
惠普ZBook 17 G3是一台非常优秀的工作站,搭配了最新接口和出色的机身。不过我们的目前价位最高的测试配置依然在一些方面落后于竞争机型。
它的另一个问题很明显是售价,我们的测试机型售价超过4500欧元(约33461人民币)。甚至是配置较低的入门级机型,起售价也达到了2100欧元(约15615人民币)。我们测试了目前来自所有大厂商的工作站产品,但很难决定哪款产品是最好的。ZBook 17 G3得到了略高的分数,不过每一台设备都有自己的优势和缺点,应该根据用户的个人喜好和实际需要选择。ZBook 17 G3的散热系统依然需要改进。
注:本文是基于完整评测的缩减版本,阅读完整的英文评测,请点击这里。
HP ZBook 17 G3 TZV66eA
- 05/24/2016 v5.1 (old)
Andreas Osthoff
Price comparison
