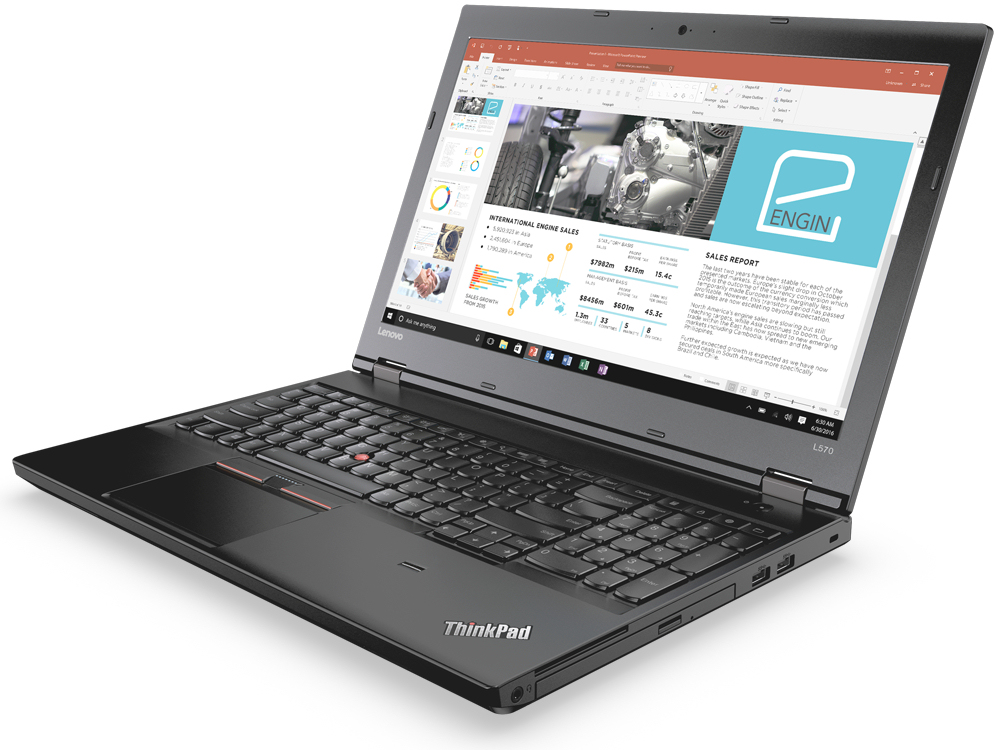
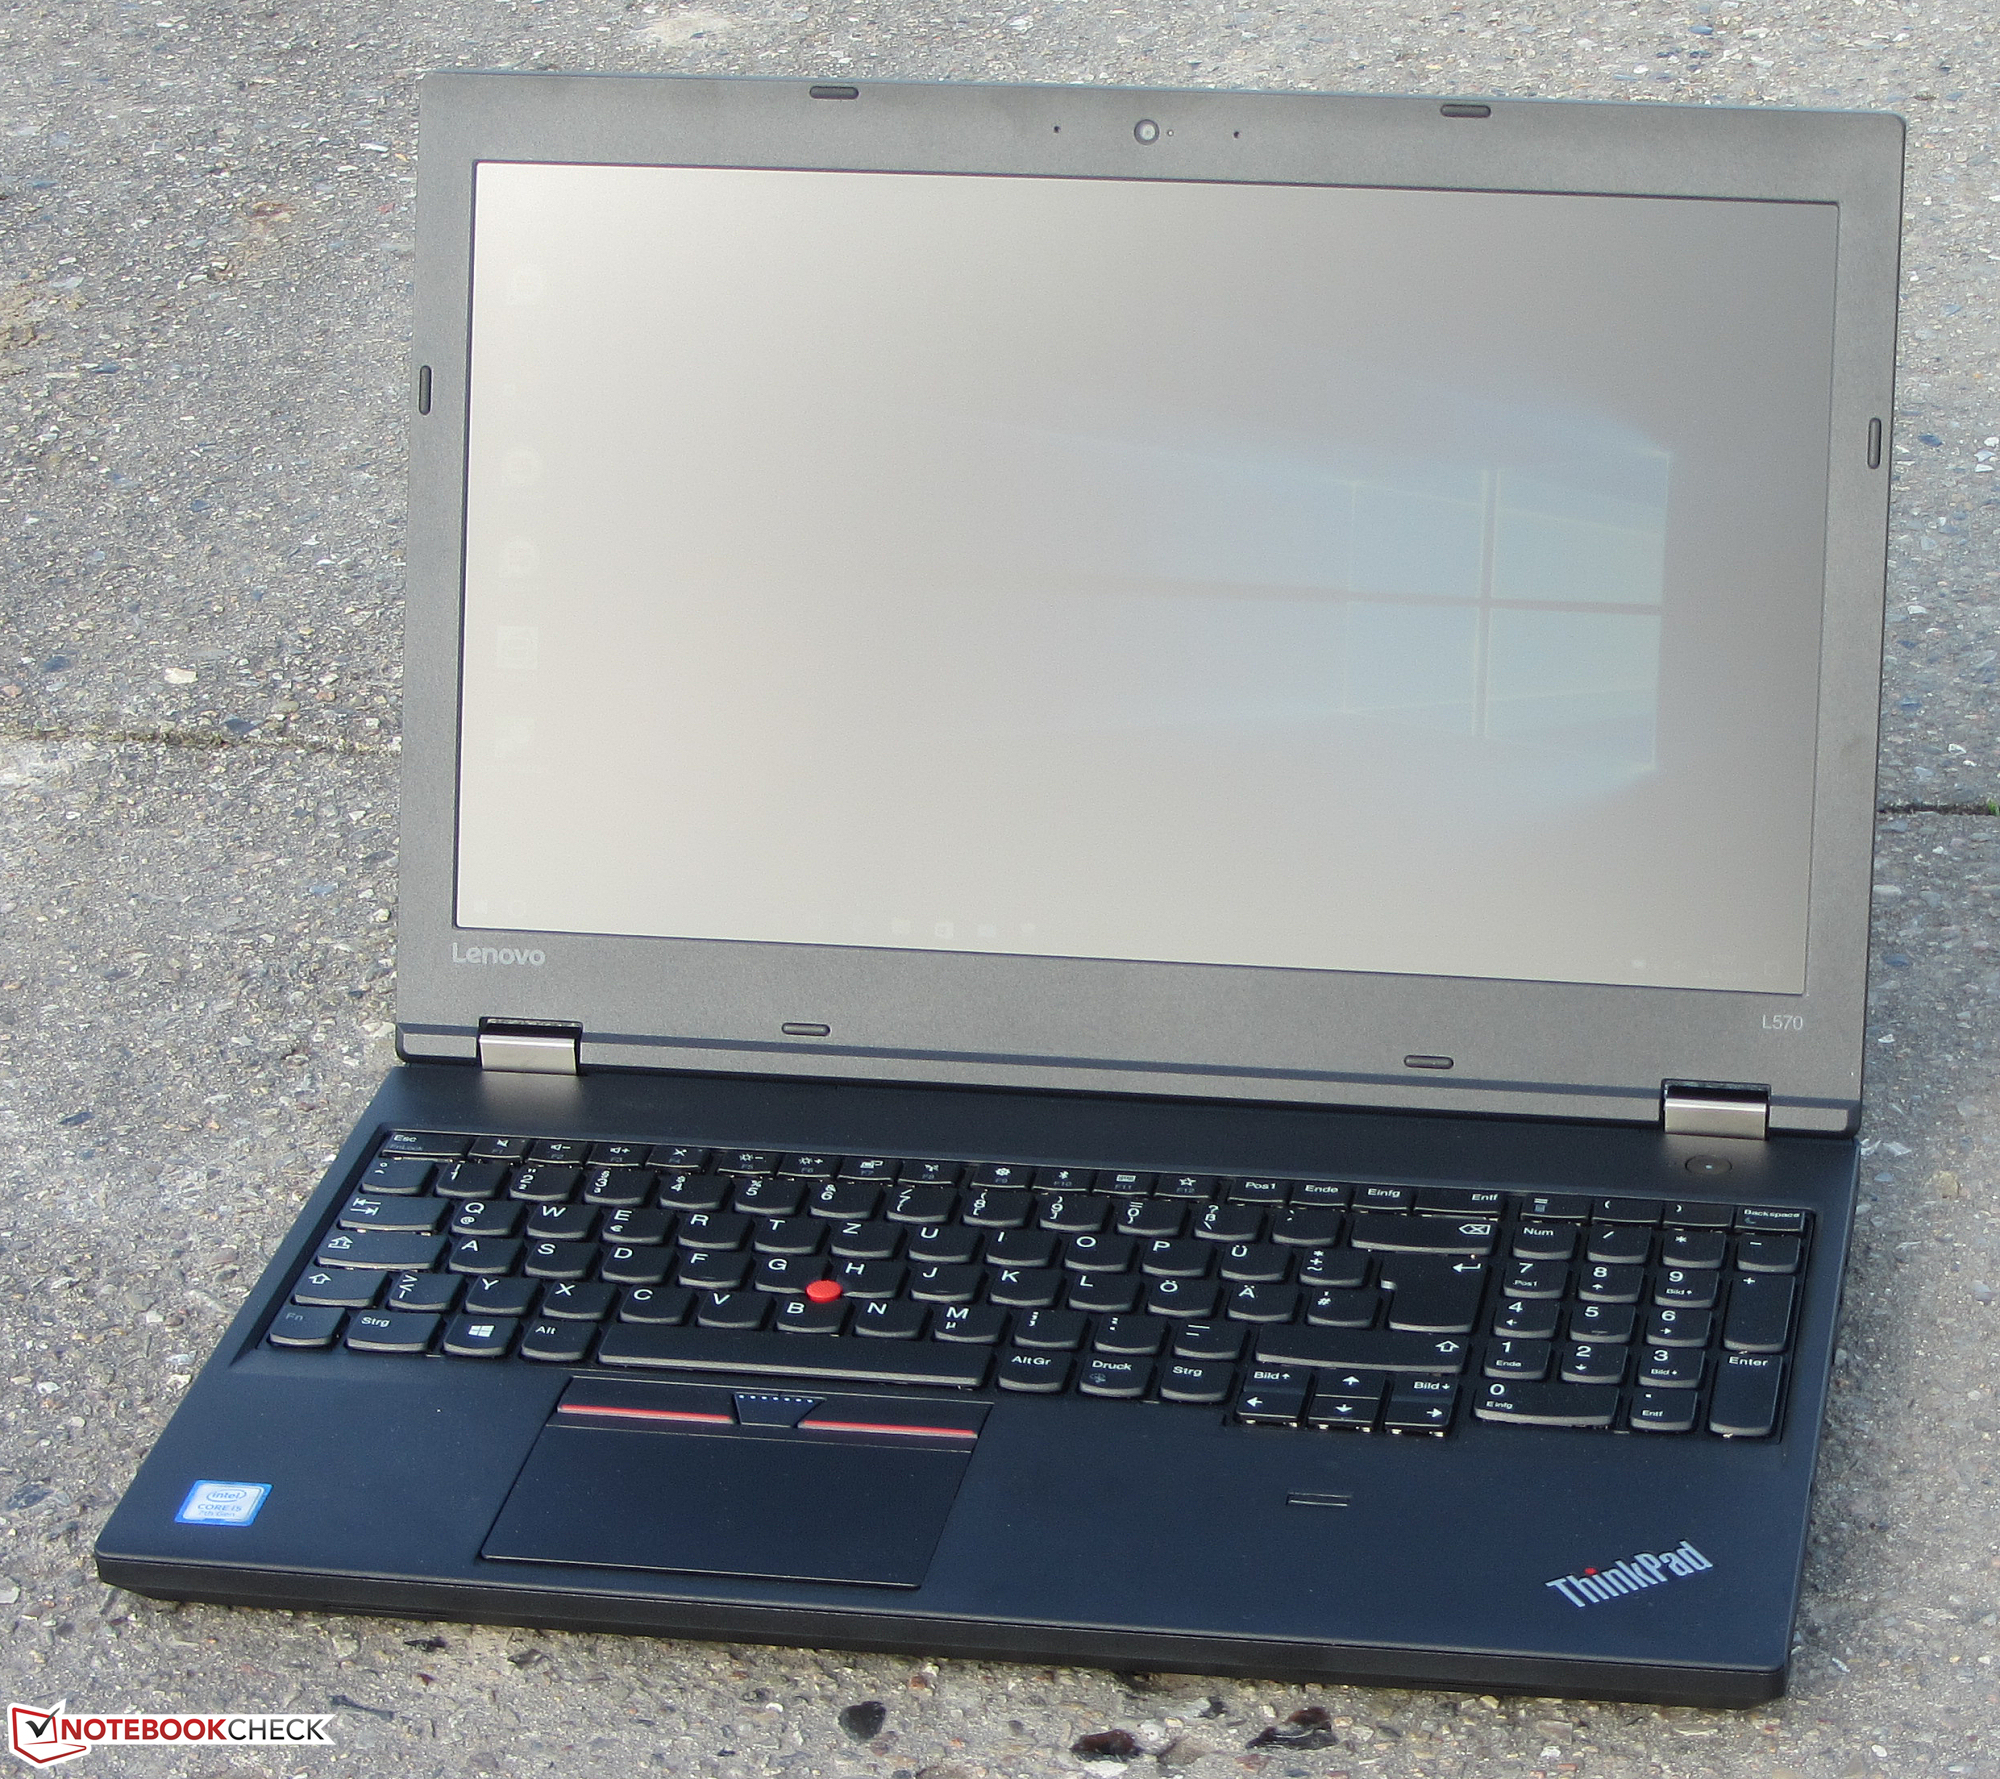
联想 ThinkPad L570 (7200U, Full HD) 笔记本简短评测
| SD Card Reader | |
| average JPG Copy Test (av. of 3 runs) | |
| Dell Latitude 15 E5570 | |
| Lenovo ThinkPad L560-20F10026GE | |
| HP ProBook 450 G4 Y8B60EA | |
| Lenovo Thinkpad L570 20J9S01600 | |
| HP Probook 650 G3 Z2W44ET | |
| Lenovo ThinkPad E570-20H6S00000 | |
| Dell Vostro 15-5568 | |
| maximum AS SSD Seq Read Test (1GB) | |
| HP ProBook 450 G4 Y8B60EA | |
| HP Probook 650 G3 Z2W44ET | |
| Lenovo ThinkPad E570-20H6S00000 | |
| Lenovo ThinkPad L560-20F10026GE | |
| Dell Vostro 15-5568 | |
| Networking | |
| iperf3 transmit AX12 | |
| Lenovo Thinkpad L570 20J9S01600 | |
| HP Probook 650 G3 Z2W44ET (jseb) | |
| Lenovo ThinkPad E570-20H6S00000 | |
| Dell Vostro 15-5568 | |
| iperf3 receive AX12 | |
| HP Probook 650 G3 Z2W44ET (jseb) | |
| Lenovo ThinkPad E570-20H6S00000 | |
| Lenovo Thinkpad L570 20J9S01600 | |
| Dell Vostro 15-5568 | |
| |||||||||||||||||||||||||
Brightness Distribution: 85 %
Center on Battery: 272 cd/m²
Contrast: 613:1 (Black: 0.45 cd/m²)
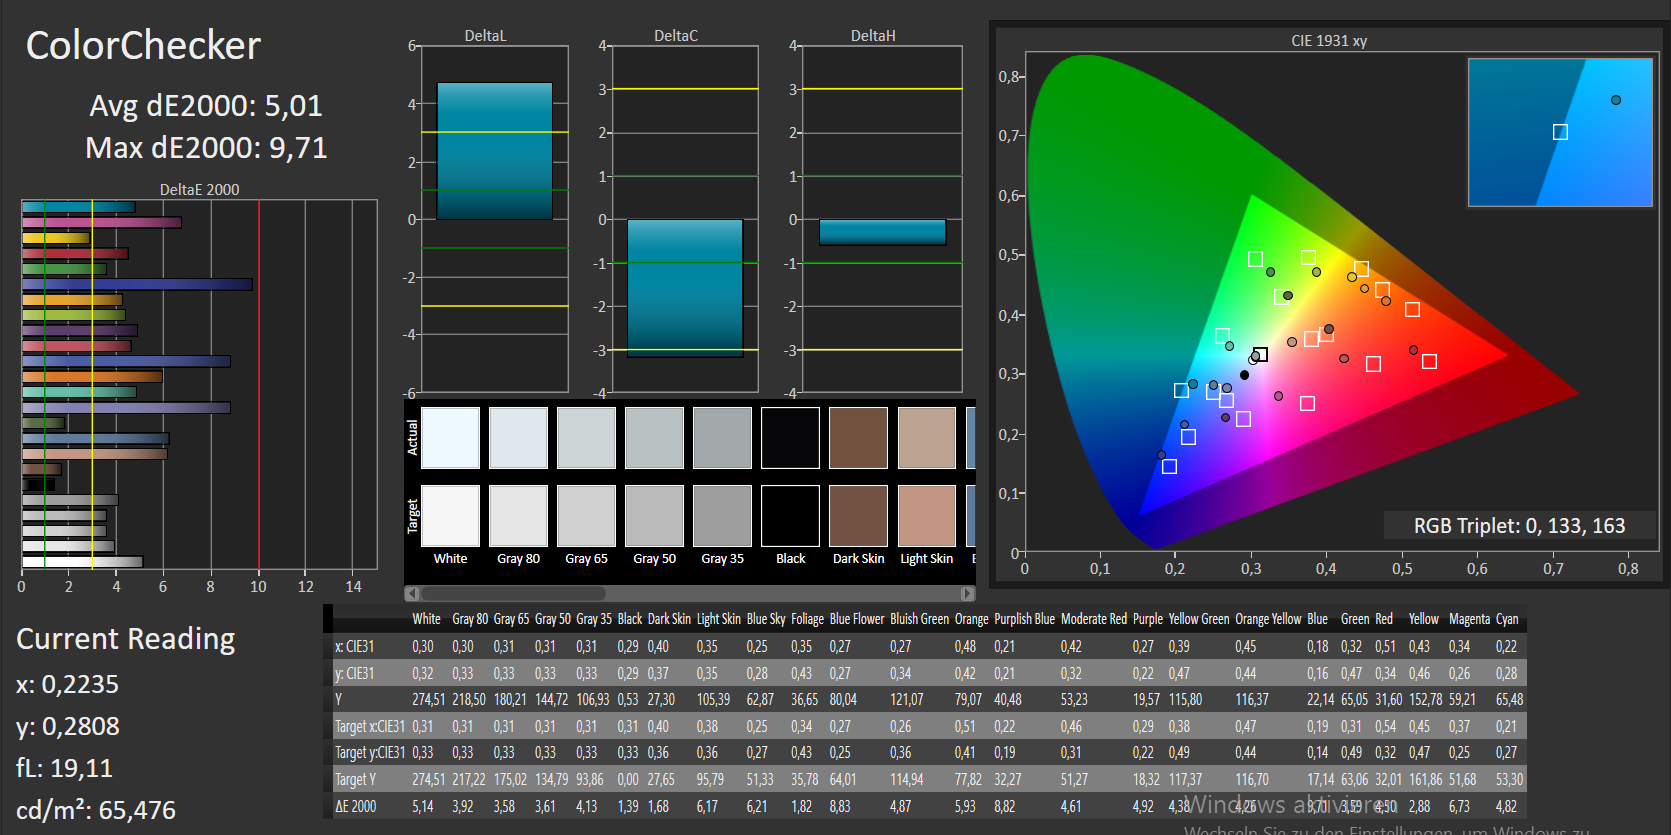
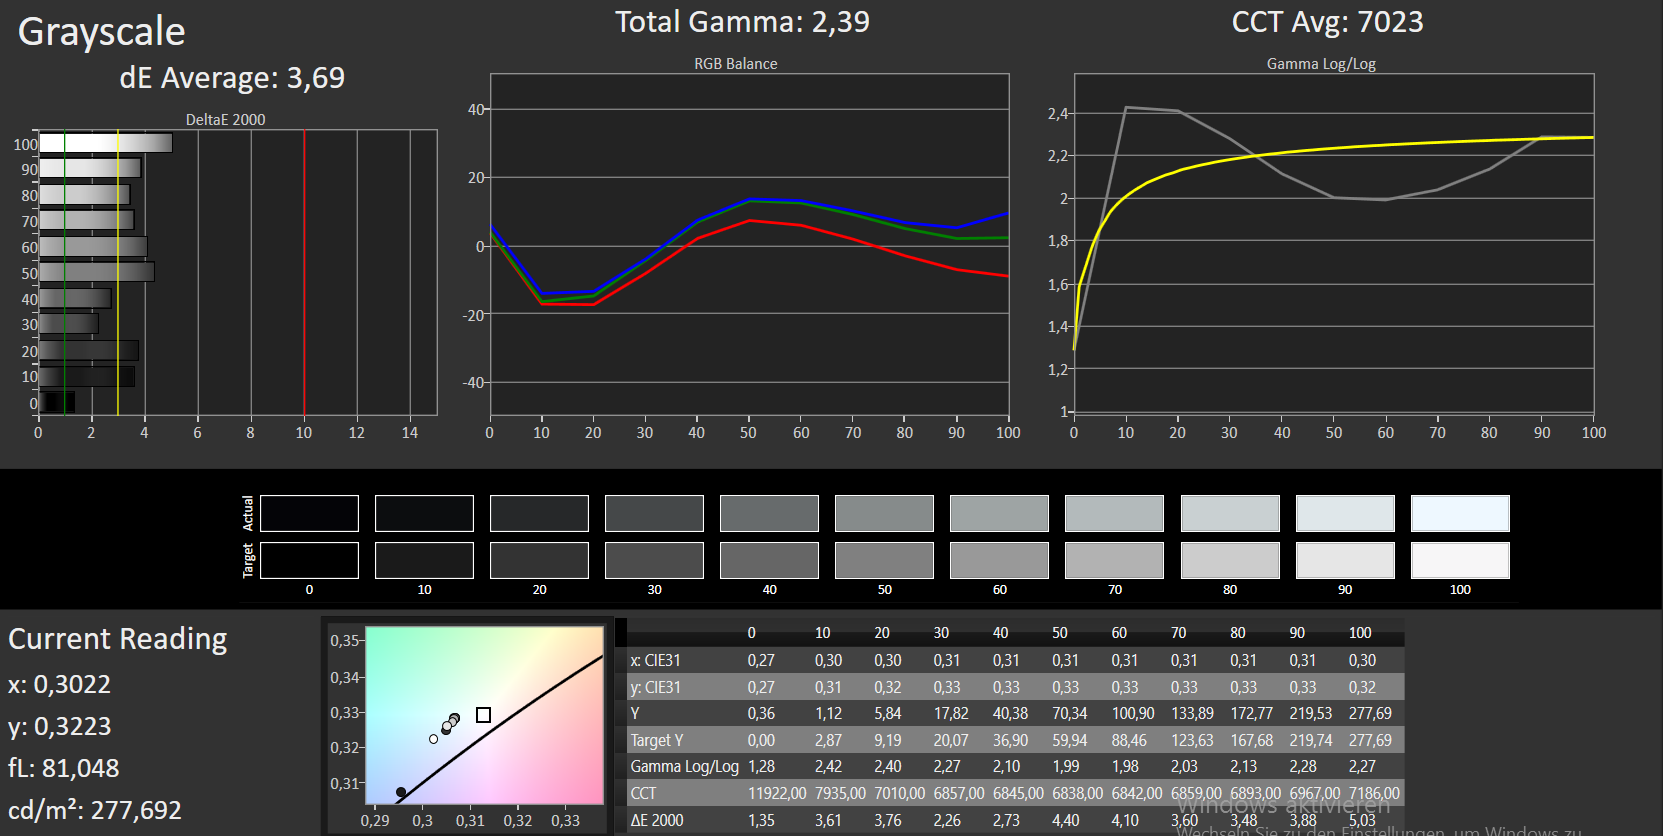
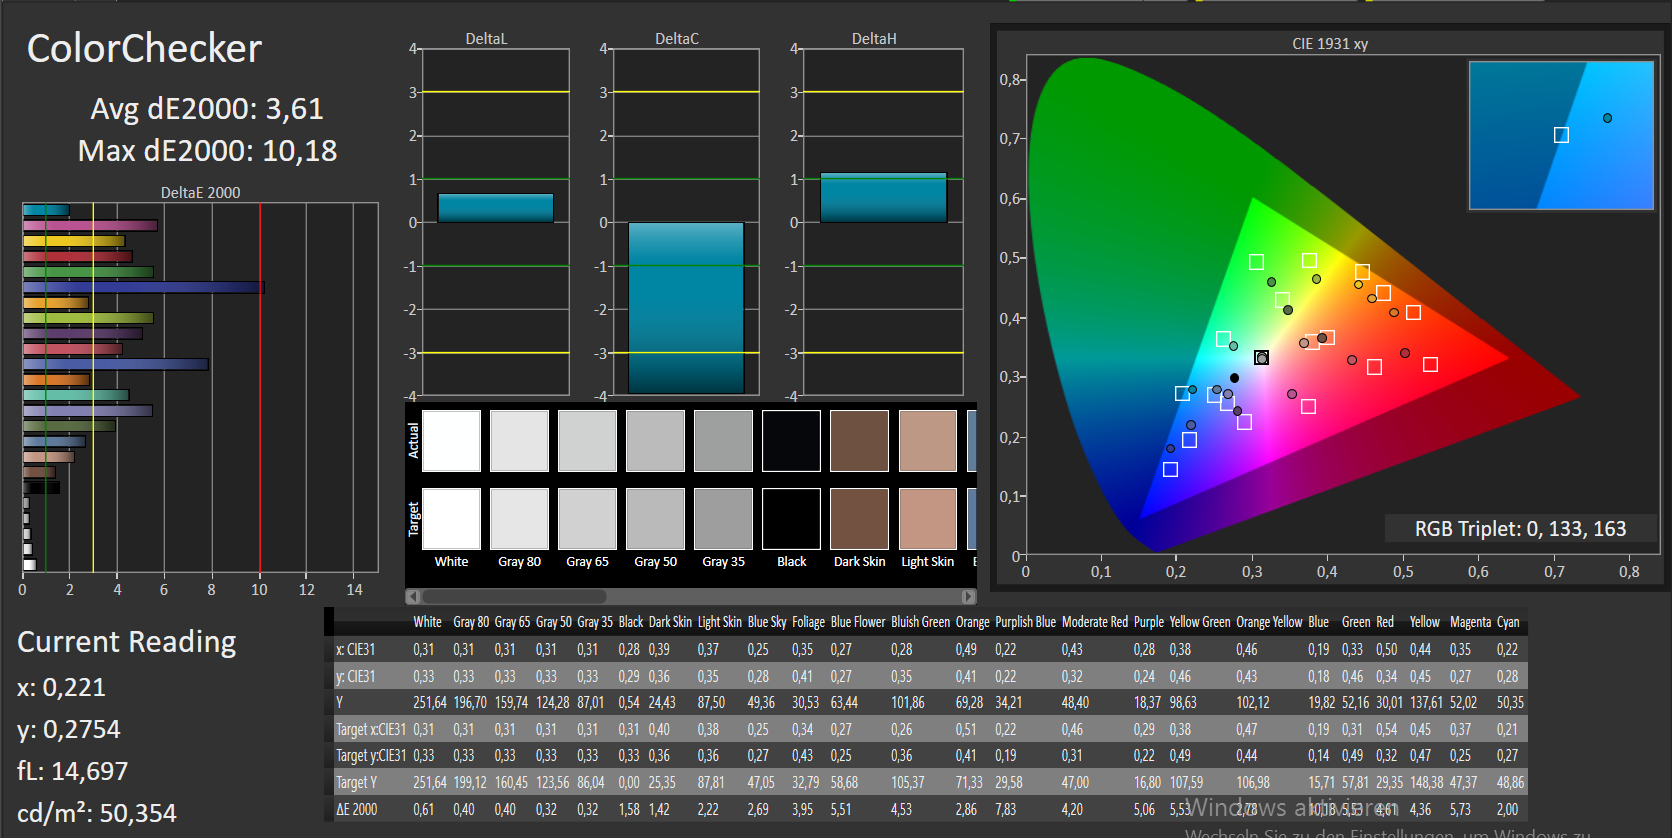
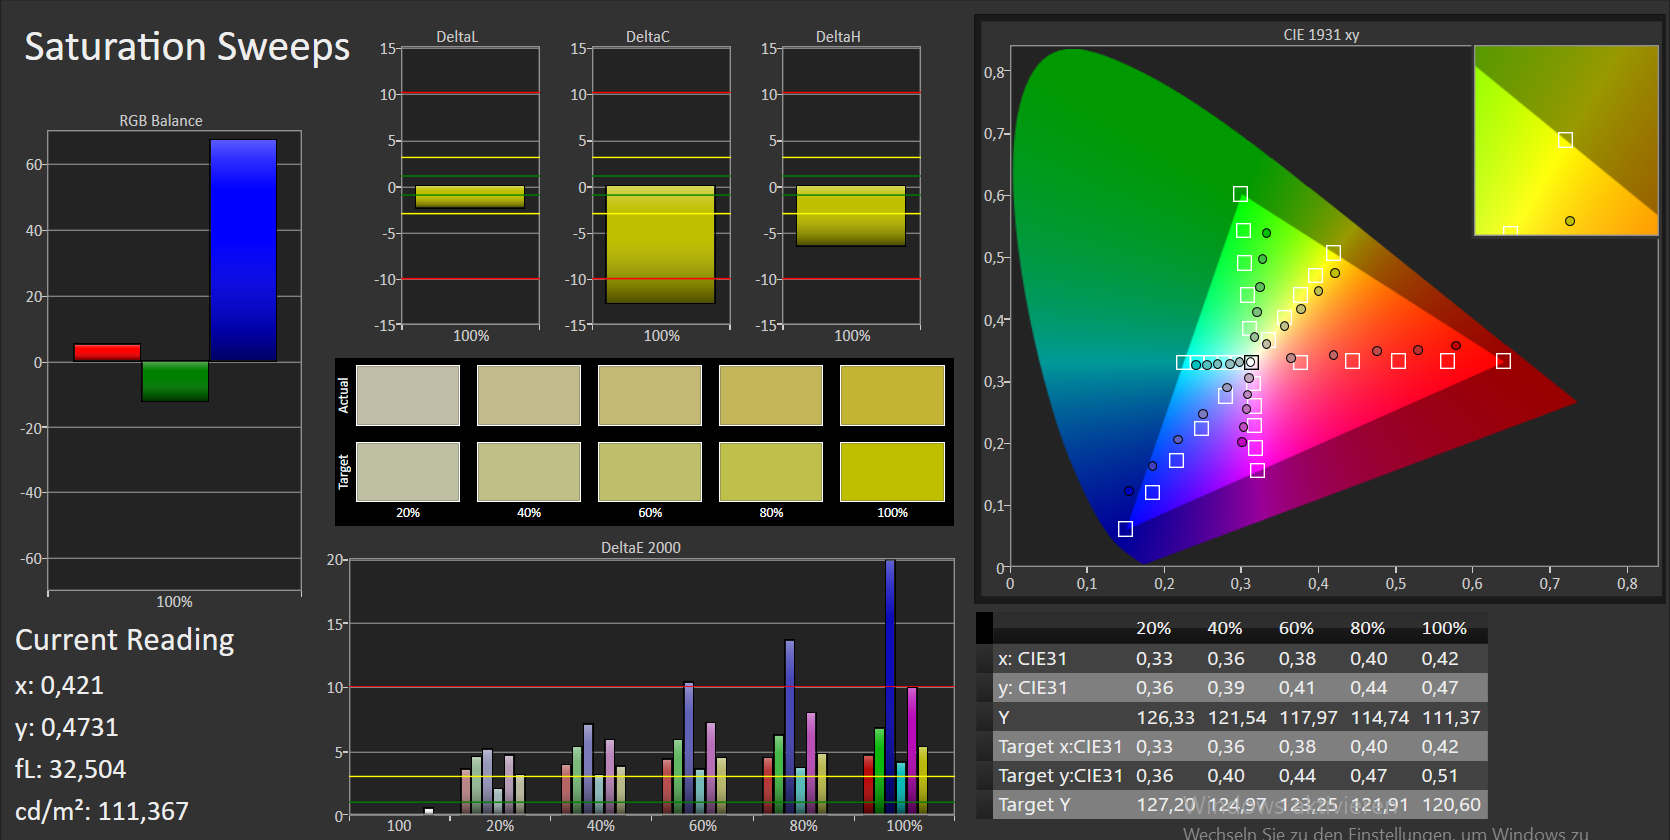
ΔE ColorChecker Calman: 5.01 | ∀{0.5-29.43 Ø4.71}
ΔE Greyscale Calman: 3.69 | ∀{0.09-98 Ø4.96}
56.3% sRGB (Argyll 1.6.3 3D)
36% AdobeRGB 1998 (Argyll 1.6.3 3D)
38.97% AdobeRGB 1998 (Argyll 3D)
56.4% sRGB (Argyll 3D)
37.68% Display P3 (Argyll 3D)
Gamma: 2.39
CCT: 7023 K
| Lenovo Thinkpad L570 20J9S01600 IPS, 1920x1080, 15.6" | Lenovo ThinkPad L560-20F10026GE AH-IPS, 1920x1080, 15.6" | HP Probook 650 G3 Z2W44ET TN LED, 1920x1080, 15.6" | Dell Latitude 15 E5570 TN LED, 1366x768, 15.6" | Lenovo ThinkPad E570-20H6S00000 IPS LED, 1920x1080, 15.6" | HP ProBook 450 G4 Y8B60EA TN LED, 1920x1080, 15.6" | Dell Vostro 15-5568 TN LED, 1920x1080, 15.6" | |
|---|---|---|---|---|---|---|---|
| Display | 3% | 45% | 7% | 3% | 6% | ||
| Display P3 Coverage (%) | 37.68 | 39 4% | 55.2 46% | 40.48 7% | 38.65 3% | 39.89 6% | |
| sRGB Coverage (%) | 56.4 | 58.3 3% | 81.1 44% | 60.9 8% | 58 3% | 59.5 5% | |
| AdobeRGB 1998 Coverage (%) | 38.97 | 40.33 3% | 57 46% | 41.82 7% | 39.94 2% | 41.24 6% | |
| Response Times | -73% | -67% | -77% | -69% | -96% | -79% | |
| Response Time Grey 50% / Grey 80% * (ms) | 43 ? | 39.2 ? 9% | 38 ? 12% | 47 ? -9% | 44.8 ? -4% | 51 ? -19% | 47.6 ? -11% |
| Response Time Black / White * (ms) | 11 ? | 28 ? -155% | 27 ? -145% | 27 ? -145% | 25.6 ? -133% | 30 ? -173% | 27.2 ? -147% |
| PWM Frequency (Hz) | 200 ? | 50 ? | |||||
| Screen | -18% | -35% | -41% | 10% | -46% | -44% | |
| Brightness middle (cd/m²) | 276 | 262 -5% | 351 27% | 228 -17% | 242 -12% | 214 -22% | 229 -17% |
| Brightness (cd/m²) | 252 | 250 -1% | 345 37% | 236 -6% | 243 -4% | 201 -20% | 222 -12% |
| Brightness Distribution (%) | 85 | 92 8% | 95 12% | 90 6% | 75 -12% | 77 -9% | 82 -4% |
| Black Level * (cd/m²) | 0.45 | 0.29 36% | 0.65 -44% | 0.56 -24% | 0.24 47% | 0.43 4% | 0.56 -24% |
| Contrast (:1) | 613 | 903 47% | 540 -12% | 407 -34% | 1008 64% | 498 -19% | 409 -33% |
| Colorchecker dE 2000 * | 5.01 | 8.49 -69% | 11.02 -120% | 10.02 -100% | 4.65 7% | 10.68 -113% | 10.36 -107% |
| Colorchecker dE 2000 max. * | 9.71 | 17.99 -85% | 17.68 -82% | 15.93 -64% | 9.64 1% | 18.07 -86% | 14.95 -54% |
| Greyscale dE 2000 * | 3.69 | 8.11 -120% | 13.14 -256% | 10.66 -189% | 3.39 8% | 11.32 -207% | 10.9 -195% |
| Gamma | 2.39 92% | 2.37 93% | 2.7 81% | 2.48 89% | 2.7 81% | 2.26 97% | 2.21 100% |
| CCT | 7023 93% | 6300 103% | 16626 39% | 11800 55% | 6246 104% | 12204 53% | 10084 64% |
| Color Space (Percent of AdobeRGB 1998) (%) | 36 | 37.07 3% | 52 44% | 39 8% | 36.69 2% | 38 6% | 37.69 5% |
| Color Space (Percent of sRGB) (%) | 56.3 | 57.94 3% | 81 44% | 61 8% | 57.66 2% | 59 5% | 57.92 3% |
| Total Average (Program / Settings) | -29% /
-21% | -19% /
-23% | -37% /
-36% | -19% /
-2% | -45% /
-42% | -62% /
-50% |
* ... smaller is better
Screen Flickering / PWM (Pulse-Width Modulation)
| Screen flickering / PWM not detected | ≤ 90 % brightness setting | |
In comparison: 52 % of all tested devices do not use PWM to dim the display. If PWM was detected, an average of 7754 (minimum: 5 - maximum: 343500) Hz was measured. | ||
Display Response Times
| ↔ Response Time Black to White | ||
|---|---|---|
| 11 ms ... rise ↗ and fall ↘ combined | ↗ 7 ms rise | 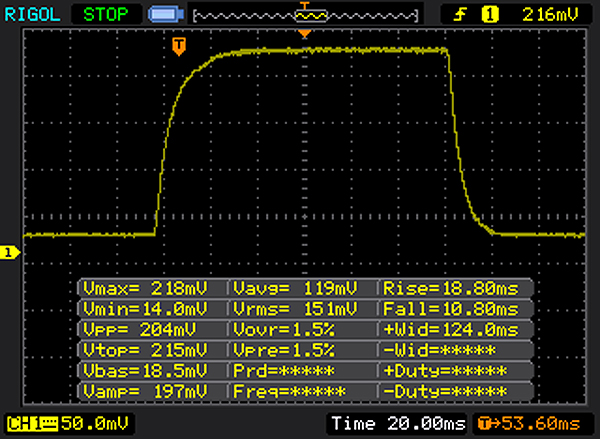 |
| ↘ 4 ms fall | ||
| The screen shows good response rates in our tests, but may be too slow for competitive gamers. In comparison, all tested devices range from 0.1 (minimum) to 240 (maximum) ms. » 30 % of all devices are better. This means that the measured response time is better than the average of all tested devices (19.8 ms). | ||
| ↔ Response Time 50% Grey to 80% Grey | ||
| 43 ms ... rise ↗ and fall ↘ combined | ↗ 24 ms rise | 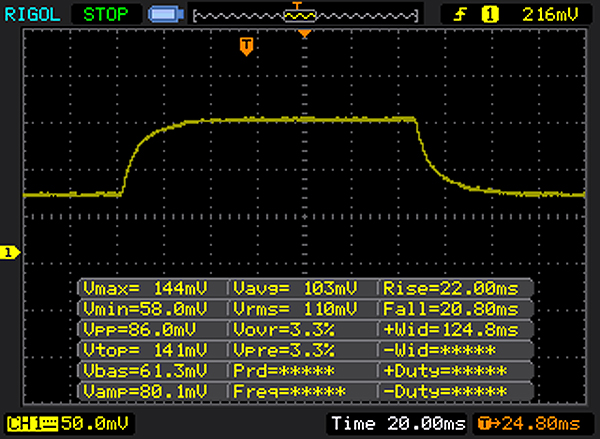 |
| ↘ 19 ms fall | ||
| The screen shows slow response rates in our tests and will be unsatisfactory for gamers. In comparison, all tested devices range from 0.165 (minimum) to 636 (maximum) ms. » 71 % of all devices are better. This means that the measured response time is worse than the average of all tested devices (31 ms). | ||
| Cinebench R10 | |
| Rendering Multiple CPUs 32Bit | |
| Lenovo Thinkpad L570 20J9S01600 | |
| HP Probook 650 G3 Z2W44ET | |
| Dell Latitude 15 E5570 | |
| Lenovo ThinkPad L560-20F10026GE | |
| Rendering Single 32Bit | |
| Lenovo Thinkpad L570 20J9S01600 | |
| HP Probook 650 G3 Z2W44ET | |
| Dell Latitude 15 E5570 | |
| Lenovo ThinkPad L560-20F10026GE | |
| Geekbench 3 | |
| 32 Bit Multi-Core Score | |
| Lenovo Thinkpad L570 20J9S01600 | |
| HP Probook 650 G3 Z2W44ET | |
| Dell Latitude 15 E5570 | |
| 32 Bit Single-Core Score | |
| Lenovo Thinkpad L570 20J9S01600 | |
| Dell Latitude 15 E5570 | |
| HP Probook 650 G3 Z2W44ET | |
| Geekbench 4.0 | |
| 64 Bit Multi-Core Score | |
| Lenovo Thinkpad L570 20J9S01600 | |
| HP Probook 650 G3 Z2W44ET | |
| 64 Bit Single-Core Score | |
| Lenovo Thinkpad L570 20J9S01600 | |
| HP Probook 650 G3 Z2W44ET | |
| Geekbench 4.4 | |
| 64 Bit Multi-Core Score | |
| Lenovo Thinkpad L570 20J9S01600 | |
| 64 Bit Single-Core Score | |
| Lenovo Thinkpad L570 20J9S01600 | |
| PCMark 7 Score | 5464 points | |
| PCMark 8 Home Score Accelerated v2 | 3520 points | |
| PCMark 8 Creative Score Accelerated v2 | 3293 points | |
| PCMark 8 Work Score Accelerated v2 | 4600 points | |
Help | ||

| Lenovo Thinkpad L570 20J9S01600 Samsung PM961 NVMe MZVLW512HMJP | Lenovo ThinkPad L560-20F10026GE WDC Slim WD10SPCX-21KHST0 | HP Probook 650 G3 Z2W44ET Hitachi Travelstar Z7K500 HTS725050A7E630 | Dell Latitude 15 E5570 Samsung SSD PM871 MZ7LN128HCHP | Lenovo ThinkPad E570-20H6S00000 Toshiba THNSF5256GPUK | HP Spectre x360 13-ac033dx Samsung PM961 NVMe MZVLW512HMJP | Lenovo ThinkPad X1 Carbon 2017-20HQS03P00 Samsung PM961 NVMe MZVLW512HMJP | HP Spectre 13-v131ng Samsung PM961 NVMe MZVLW512HMJP | Lenovo ThinkPad T470-20HD002HGE Samsung PM961 NVMe MZVLW512HMJP | HP ProBook 450 G4 Y8B60EA SanDisk SD8SNAT256G1002 | Dell Vostro 15-5568 SanDisk X400 256GB, SATA (SD8SB8U-256G) | |
|---|---|---|---|---|---|---|---|---|---|---|---|
| CrystalDiskMark 3.0 | -96% | -97% | -59% | -28% | 8% | 16% | -6% | -6% | -55% | ||
| Read Seq (MB/s) | 1412 | 113.6 -92% | 109.4 -92% | 474.7 -66% | 1140 -19% | 2065 46% | 1827 29% | 1090 -23% | 1155 -18% | 497.8 -65% | |
| Write Seq (MB/s) | 1110 | 111.7 -90% | 99.9 -91% | 155 -86% | 468.1 -58% | 1550 40% | 1383 25% | 1088 -2% | 1076 -3% | 466.8 -58% | |
| Read 512 (MB/s) | 833 | 39.65 -95% | 16.34 -98% | 393.6 -53% | 759 -9% | 865 4% | 814 -2% | 753 -10% | 811 -3% | 363.4 -56% | |
| Write 512 (MB/s) | 920 | 55.3 -94% | 43.45 -95% | 119.7 -87% | 414 -55% | 1229 34% | 1098 19% | 911 -1% | 862 -6% | 368.5 -60% | |
| Read 4k (MB/s) | 56.8 | 0.488 -99% | 0.337 -99% | 34 -40% | 34.3 -40% | 54.7 -4% | 61 7% | 57.5 1% | 55.5 -2% | 29.02 -49% | |
| Write 4k (MB/s) | 138.9 | 1.022 -99% | 0.866 -99% | 96.6 -30% | 123.4 -11% | 139.4 0% | 172.2 24% | 140.2 1% | 134.6 -3% | 56 -60% | |
| Read 4k QD32 (MB/s) | 539 | 1.367 -100% | 0.826 -100% | 383.3 -29% | 530 -2% | 518 -4% | 601 12% | 497.1 -8% | 496.2 -8% | 296 -45% | |
| Write 4k QD32 (MB/s) | 444.8 | 1.036 -100% | 0.859 -100% | 100.2 -77% | 319.2 -28% | 225.6 -49% | 495.6 11% | 416 -6% | 425.4 -4% | 229.4 -48% |
| 3DMark 06 Standard Score | 7810 points | |
| 3DMark 11 Performance | 1550 points | |
| 3DMark Ice Storm Standard Score | 52860 points | |
| 3DMark Cloud Gate Standard Score | 5745 points | |
| 3DMark Fire Strike Score | 764 points | |
| 3DMark Fire Strike Extreme Score | 343 points | |
Help | ||
| low | med. | high | ultra | |
|---|---|---|---|---|
| Tomb Raider (2013) | 62.7 | 31.4 | 18.4 | 9.7 |
| BioShock Infinite (2013) | 40.3 | 23.9 | 19.8 | 6.9 |
| Battlefield 4 (2013) | 31 | 23 | 15.6 | 6.2 |
Noise level
| Idle |
| 30.3 / 30.3 / 30.3 dB(A) |
| DVD |
| 38.2 / dB(A) |
| Load |
| 33.2 / 33.1 dB(A) |
 | ||
30 dB silent 40 dB(A) audible 50 dB(A) loud |
||
min: | ||
| Lenovo Thinkpad L570 20J9S01600 i5-7200U, HD Graphics 620 | Lenovo ThinkPad L560-20F10026GE 6200U, HD Graphics 520 | HP Probook 650 G3 Z2W44ET i5-7200U, HD Graphics 620 | Dell Latitude 15 E5570 6300U, HD Graphics 520 | Lenovo ThinkPad E570-20H6S00000 i5-7200U, GeForce GTX 950M | HP ProBook 450 G4 Y8B60EA i7-7500U, GeForce 930MX | Dell Vostro 15-5568 i5-7200U, HD Graphics 620 | |
|---|---|---|---|---|---|---|---|
| Noise | 0% | -3% | -7% | -1% | -11% | 0% | |
| off / environment * (dB) | 30.3 | 29.4 3% | 30.7 -1% | 31.2 -3% | 29 4% | 31.6 -4% | 29 4% |
| Idle Minimum * (dB) | 30.3 | 30.1 1% | 31.5 -4% | 31.2 -3% | 29 4% | 32.6 -8% | 29 4% |
| Idle Average * (dB) | 30.3 | 30.1 1% | 31.5 -4% | 33.2 -10% | 29 4% | 32.6 -8% | 29 4% |
| Idle Maximum * (dB) | 30.3 | 30.1 1% | 31.5 -4% | 34.3 -13% | 29 4% | 33 -9% | 29 4% |
| Load Average * (dB) | 33.2 | 33.4 -1% | 34.6 -4% | 36.6 -10% | 34.3 -3% | 38.9 -17% | 33.9 -2% |
| Load Maximum * (dB) | 33.1 | 34.7 -5% | 33.3 -1% | 34.7 -5% | 40.1 -21% | 38.9 -18% | 37 -12% |
* ... smaller is better
(+) The maximum temperature on the upper side is 36.1 °C / 97 F, compared to the average of 34.3 °C / 94 F, ranging from 21.2 to 62.5 °C for the class Office.
(+) The bottom heats up to a maximum of 33.1 °C / 92 F, compared to the average of 36.8 °C / 98 F
(+) In idle usage, the average temperature for the upper side is 22.6 °C / 73 F, compared to the device average of 29.5 °C / 85 F.
(+) The palmrests and touchpad are cooler than skin temperature with a maximum of 28 °C / 82.4 F and are therefore cool to the touch.
(±) The average temperature of the palmrest area of similar devices was 27.5 °C / 81.5 F (-0.5 °C / -0.9 F).
| Lenovo Thinkpad L570 20J9S01600 i5-7200U, HD Graphics 620 | Lenovo ThinkPad L560-20F10026GE 6200U, HD Graphics 520 | HP Probook 650 G3 Z2W44ET i5-7200U, HD Graphics 620 | Dell Latitude 15 E5570 6300U, HD Graphics 520 | Lenovo ThinkPad E570-20H6S00000 i5-7200U, GeForce GTX 950M | HP ProBook 450 G4 Y8B60EA i7-7500U, GeForce 930MX | Dell Vostro 15-5568 i5-7200U, HD Graphics 620 | |
|---|---|---|---|---|---|---|---|
| Heat | -20% | 3% | -33% | -21% | -24% | -18% | |
| Maximum Upper Side * (°C) | 36.1 | 37.2 -3% | 31.9 12% | 37.3 -3% | 46.6 -29% | 44.3 -23% | 38 -5% |
| Maximum Bottom * (°C) | 33.1 | 36 -9% | 32.1 3% | 41.5 -25% | 49.1 -48% | 46.3 -40% | 39 -18% |
| Idle Upper Side * (°C) | 23.7 | 30.7 -30% | 23.5 1% | 34.2 -44% | 24.6 -4% | 27.8 -17% | 25.7 -8% |
| Idle Bottom * (°C) | 24.1 | 32.8 -36% | 25.3 -5% | 38.8 -61% | 25.1 -4% | 27.7 -15% | 33.8 -40% |
* ... smaller is better
Lenovo Thinkpad L570 20J9S01600 audio analysis
(-) | not very loud speakers (70 dB)
Bass 100 - 315 Hz
(±) | reduced bass - on average 13.2% lower than median
(+) | bass is linear (4.8% delta to prev. frequency)
Mids 400 - 2000 Hz
(+) | balanced mids - only 4.1% away from median
(+) | mids are linear (4.1% delta to prev. frequency)
Highs 2 - 16 kHz
(+) | balanced highs - only 1.4% away from median
(+) | highs are linear (2.5% delta to prev. frequency)
Overall 100 - 16.000 Hz
(±) | linearity of overall sound is average (15.2% difference to median)
Compared to same class
» 15% of all tested devices in this class were better, 4% similar, 81% worse
» The best had a delta of 7%, average was 21%, worst was 53%
Compared to all devices tested
» 22% of all tested devices were better, 4% similar, 74% worse
» The best had a delta of 4%, average was 23%, worst was 134%
Apple MacBook 12 (Early 2016) 1.1 GHz audio analysis
(+) | speakers can play relatively loud (83.6 dB)
Bass 100 - 315 Hz
(±) | reduced bass - on average 11.3% lower than median
(±) | linearity of bass is average (14.2% delta to prev. frequency)
Mids 400 - 2000 Hz
(+) | balanced mids - only 2.4% away from median
(+) | mids are linear (5.5% delta to prev. frequency)
Highs 2 - 16 kHz
(+) | balanced highs - only 2% away from median
(+) | highs are linear (4.5% delta to prev. frequency)
Overall 100 - 16.000 Hz
(+) | overall sound is linear (10.2% difference to median)
Compared to same class
» 7% of all tested devices in this class were better, 2% similar, 90% worse
» The best had a delta of 5%, average was 18%, worst was 53%
Compared to all devices tested
» 5% of all tested devices were better, 1% similar, 94% worse
» The best had a delta of 4%, average was 23%, worst was 134%
| Off / Standby | |
| Idle | |
| Load |
|
Key:
min: | |
| Lenovo Thinkpad L570 20J9S01600 i5-7200U, HD Graphics 620 | Lenovo ThinkPad L560-20F10026GE 6200U, HD Graphics 520 | HP Probook 650 G3 Z2W44ET i5-7200U, HD Graphics 620 | Dell Latitude 15 E5570 6300U, HD Graphics 520 | Lenovo ThinkPad E570-20H6S00000 i5-7200U, GeForce GTX 950M | HP ProBook 450 G4 Y8B60EA i7-7500U, GeForce 930MX | Dell Vostro 15-5568 i5-7200U, HD Graphics 620 | |
|---|---|---|---|---|---|---|---|
| Power Consumption | -11% | 2% | -5% | -32% | -23% | -4% | |
| Idle Minimum * (Watt) | 4 | 5 -25% | 4 -0% | 4.5 -13% | 2.8 30% | 3.8 5% | 3.3 17% |
| Idle Average * (Watt) | 7.4 | 7.9 -7% | 6.9 7% | 7.6 -3% | 6.3 15% | 6.6 11% | 6.8 8% |
| Idle Maximum * (Watt) | 7.7 | 8.6 -12% | 7.6 1% | 8.7 -13% | 6.9 10% | 11.3 -47% | 7.7 -0% |
| Load Average * (Watt) | 30.6 | 27.5 10% | 29 5% | 28.5 7% | 51.6 -69% | 38 -24% | 30.9 -1% |
| Load Maximum * (Watt) | 28.2 | 33.7 -20% | 28.7 -2% | 29.2 -4% | 69.7 -147% | 45 -60% | 40.3 -43% |
* ... smaller is better
| Lenovo Thinkpad L570 20J9S01600 i5-7200U, HD Graphics 620, 48 Wh | Lenovo ThinkPad L560-20F10026GE 6200U, HD Graphics 520, 48 Wh | HP Probook 650 G3 Z2W44ET i5-7200U, HD Graphics 620, 48 Wh | Dell Latitude 15 E5570 6300U, HD Graphics 520, 62 Wh | Lenovo ThinkPad E570-20H6S00000 i5-7200U, GeForce GTX 950M, 41 Wh | HP ProBook 450 G4 Y8B60EA i7-7500U, GeForce 930MX, 45 Wh | Dell Vostro 15-5568 i5-7200U, HD Graphics 620, 42 Wh | |
|---|---|---|---|---|---|---|---|
| Battery runtime | -31% | -5% | 15% | -11% | -13% | -14% | |
| Reader / Idle (h) | 19.4 | 11.6 -40% | 12.8 -34% | 20.5 6% | 14.7 -24% | 12.4 -36% | 16.9 -13% |
| H.264 (h) | 8.2 | 4.6 -44% | 6.7 -18% | 9.5 16% | 8.5 4% | ||
| WiFi v1.3 (h) | 8.9 | 6.8 -24% | 7.8 -12% | 10.5 18% | 7.7 -13% | 8.6 -3% | 6 -33% |
| Load (h) | 2.1 | 1.8 -14% | 3 43% | 2.5 19% | 2.2 5% | 2.1 0% | 1.8 -14% |
Pros
Cons
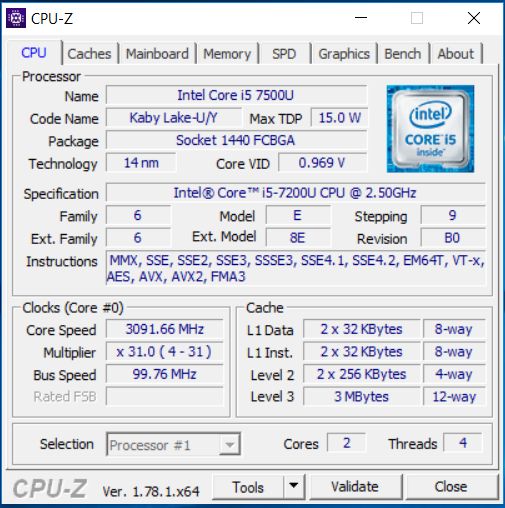
相较于前代产品,ThinkPad L570首先是个Kaby Lake 升级。Kaby Lake 处理器对比Skylake的前代产品仅提供不多的性能提升,但是在其他领域提供了优势:电池续航时间显著增强以至能够坚持在学校使用一整天。
Kaby Lake 提供更长的续航时长。
正因为作为工作设备的定位,这台设备几乎不会发热,切运行安静。冷却风扇不会像许多用户对ThinkPad L560所不满的那样莫名突然高速运作。
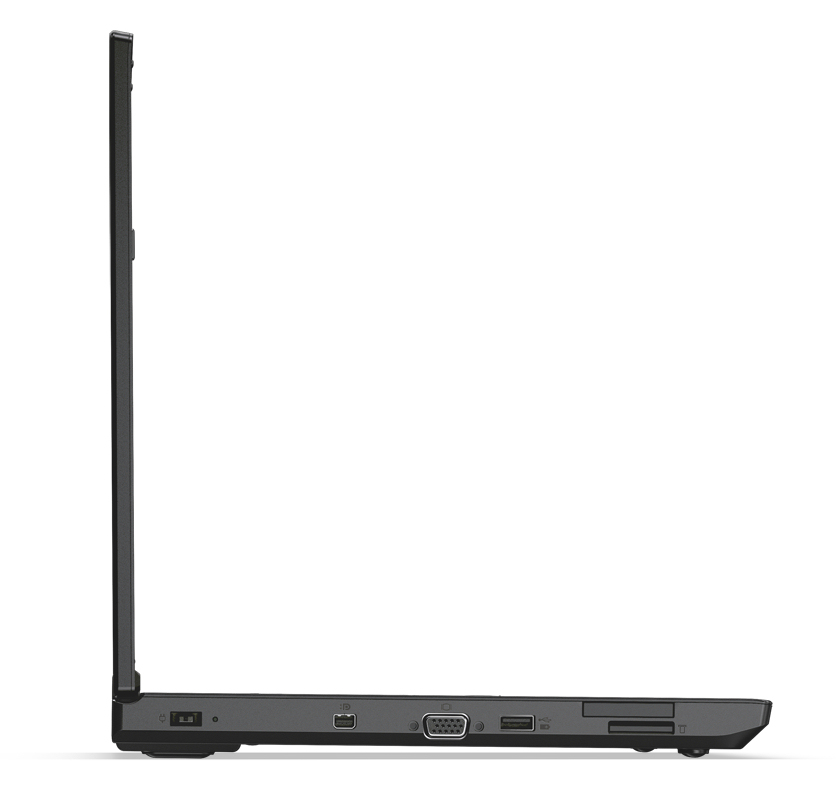
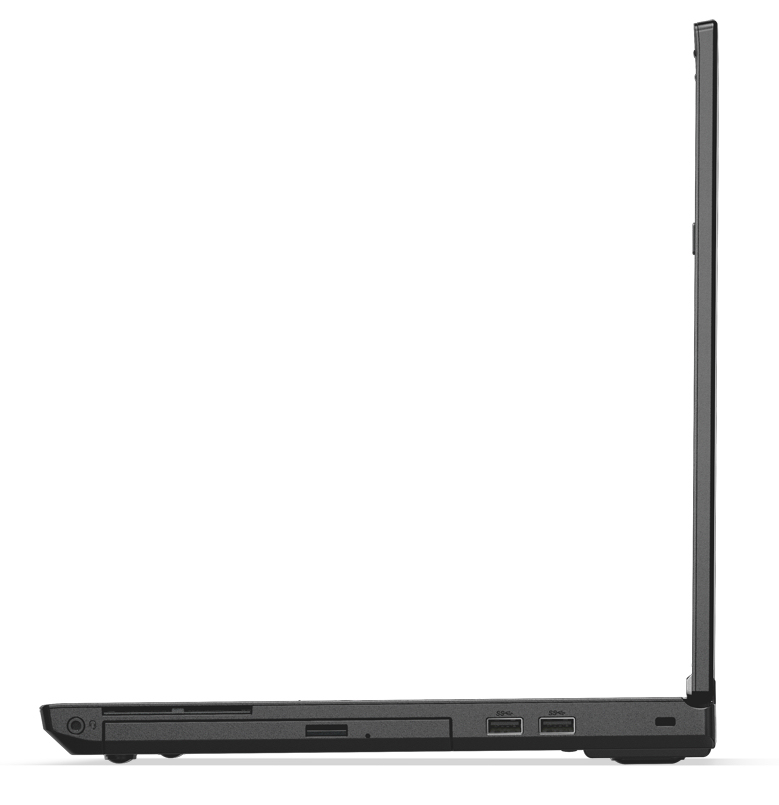
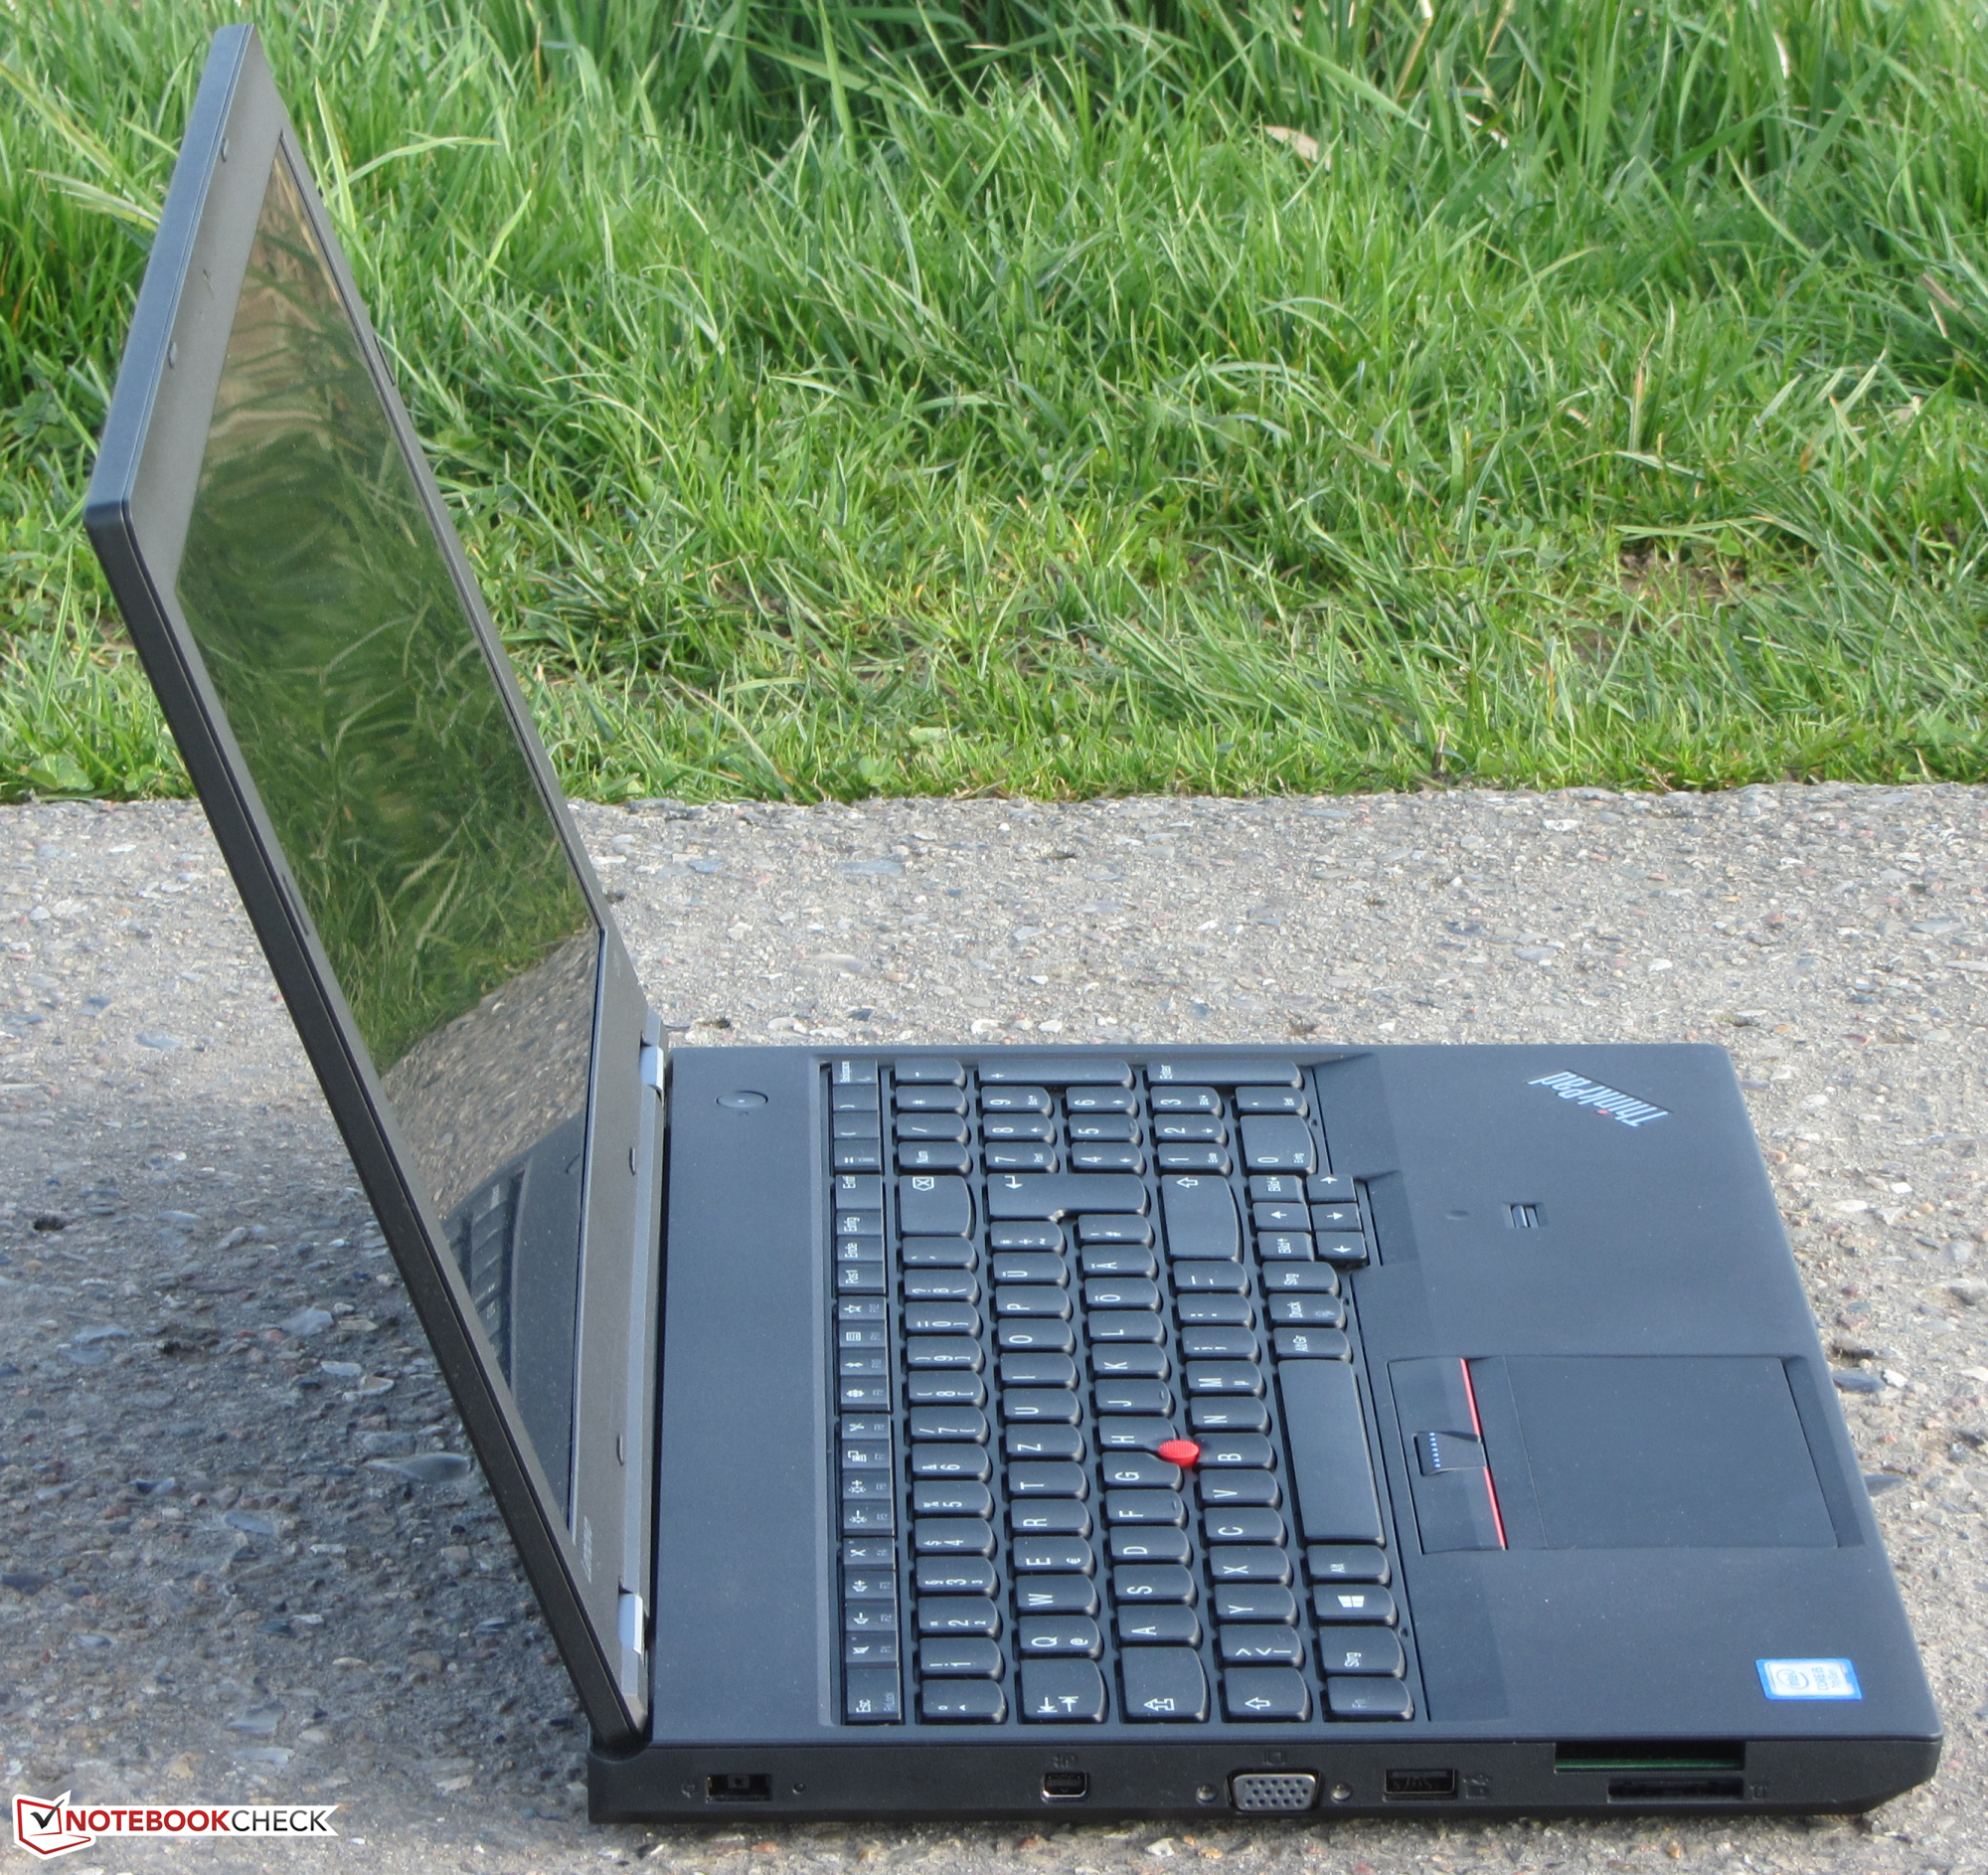
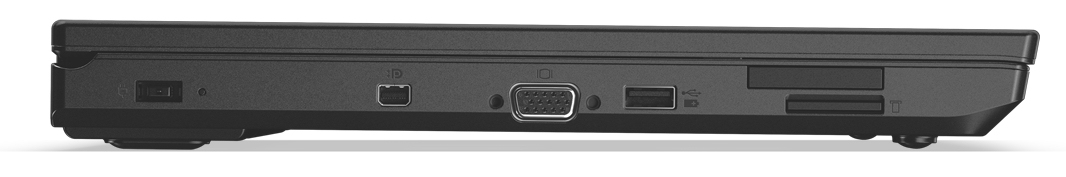
一块NVMe固态硬盘确保系统的高速快捷运作。归功于维修舱门,更换固态硬盘并不会困难。ThinkPad 提供了更多的拓展选项,一个额外的M.2 2242插槽可以用来装备一个LTE 调制模块(天线已安装)或者第二块固态硬盘。
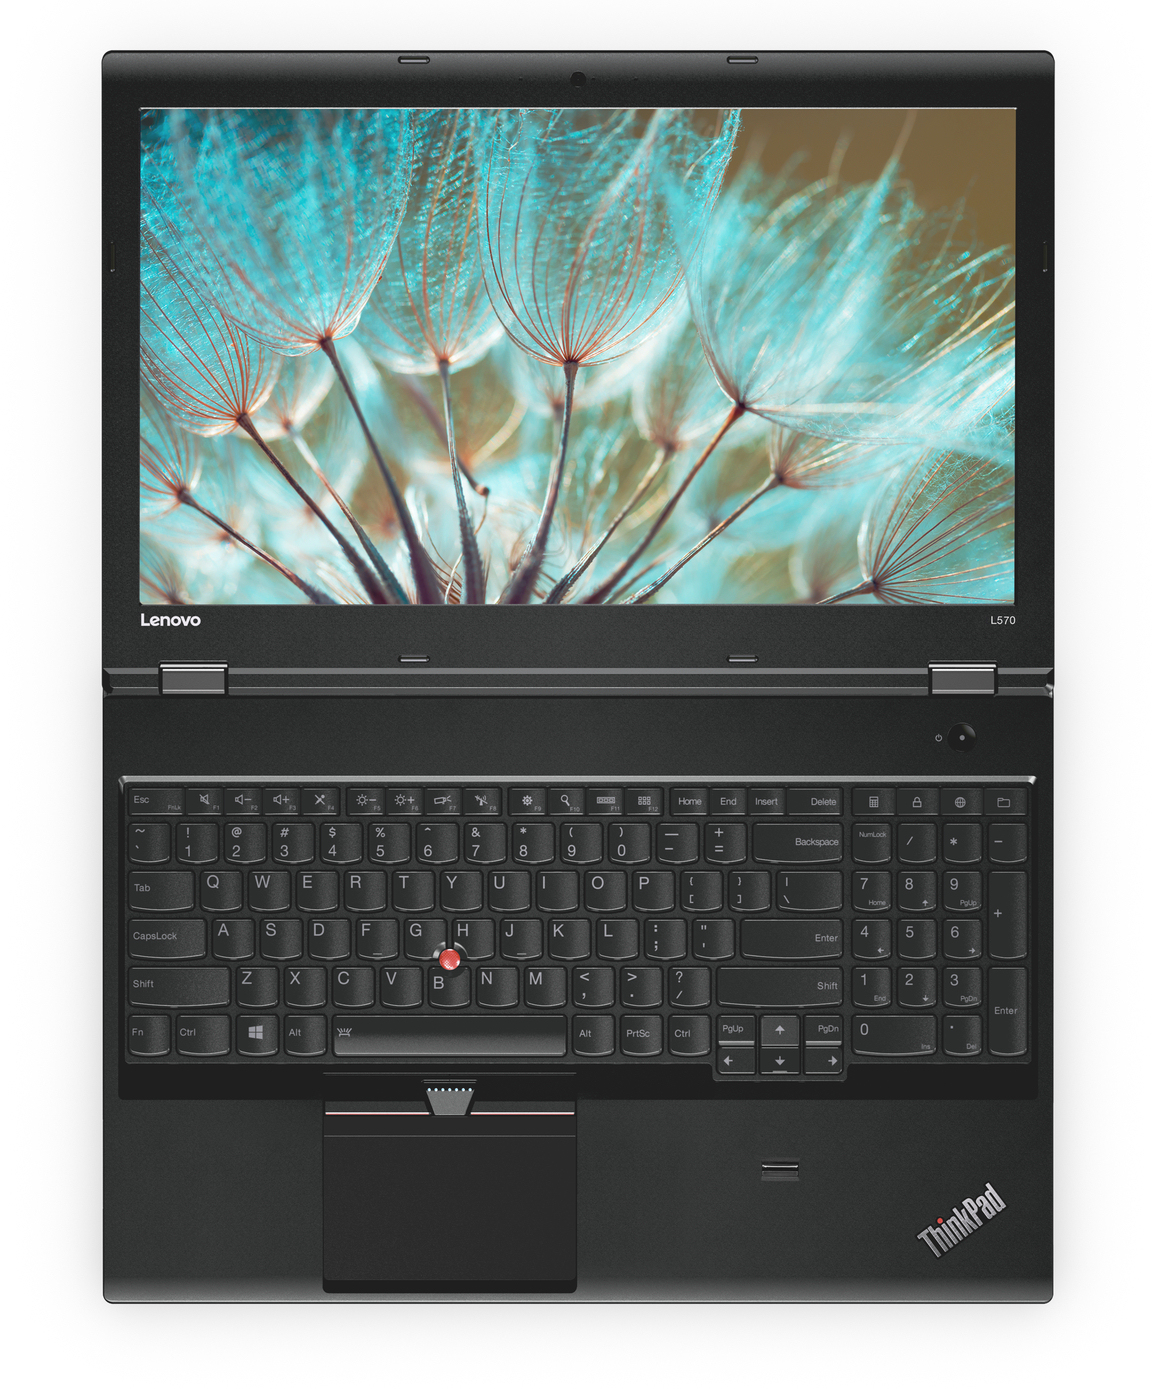
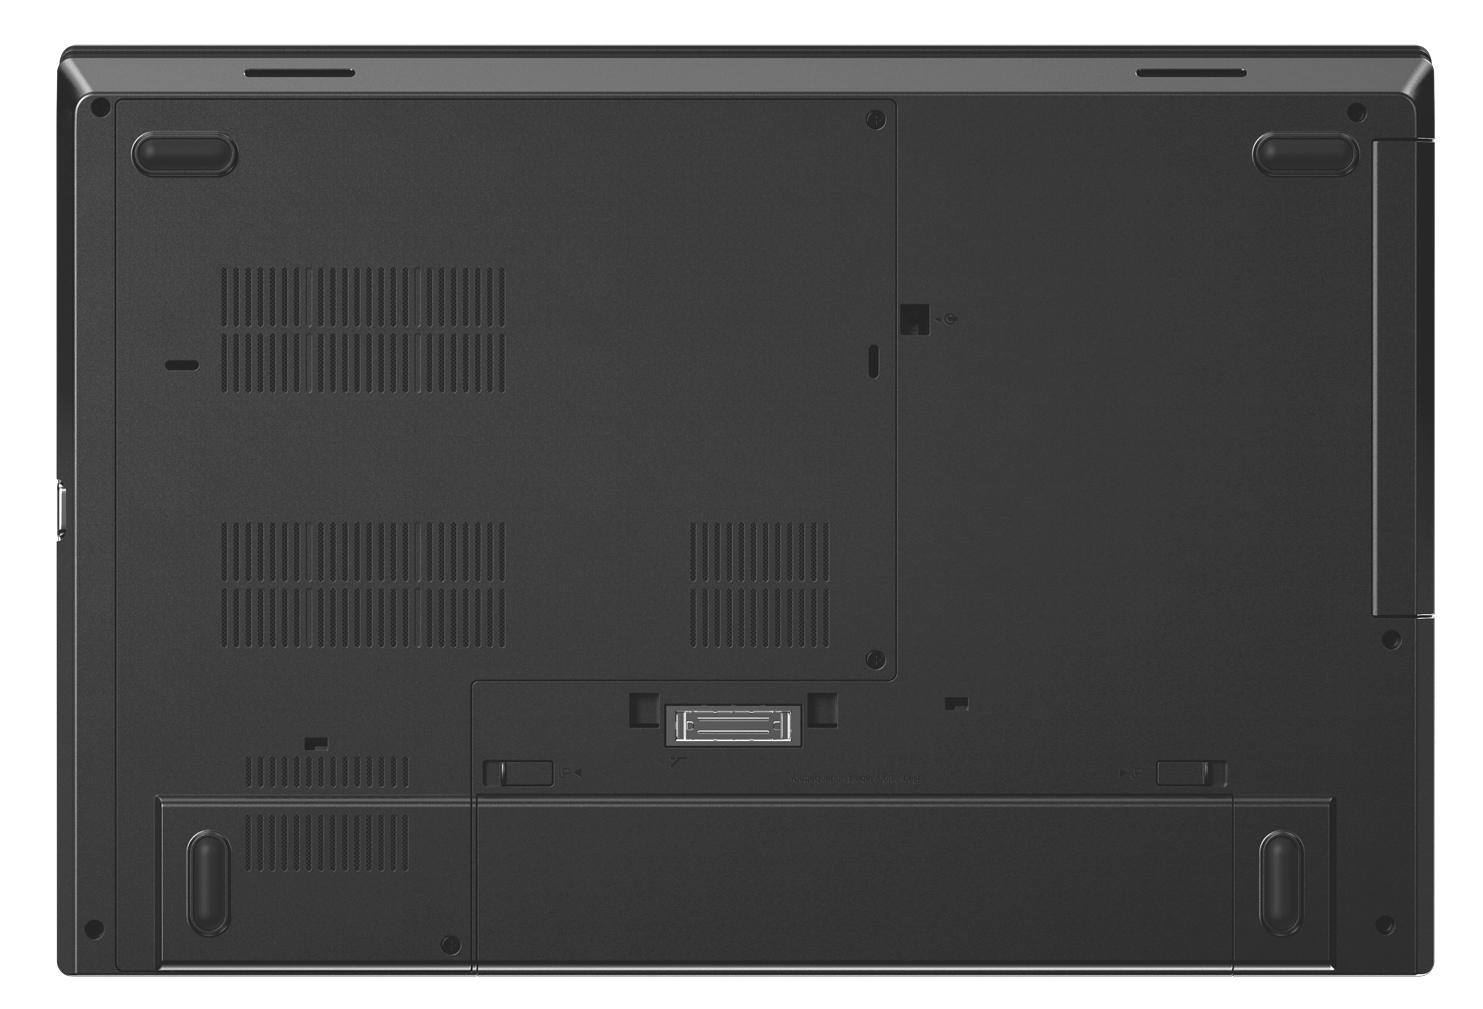
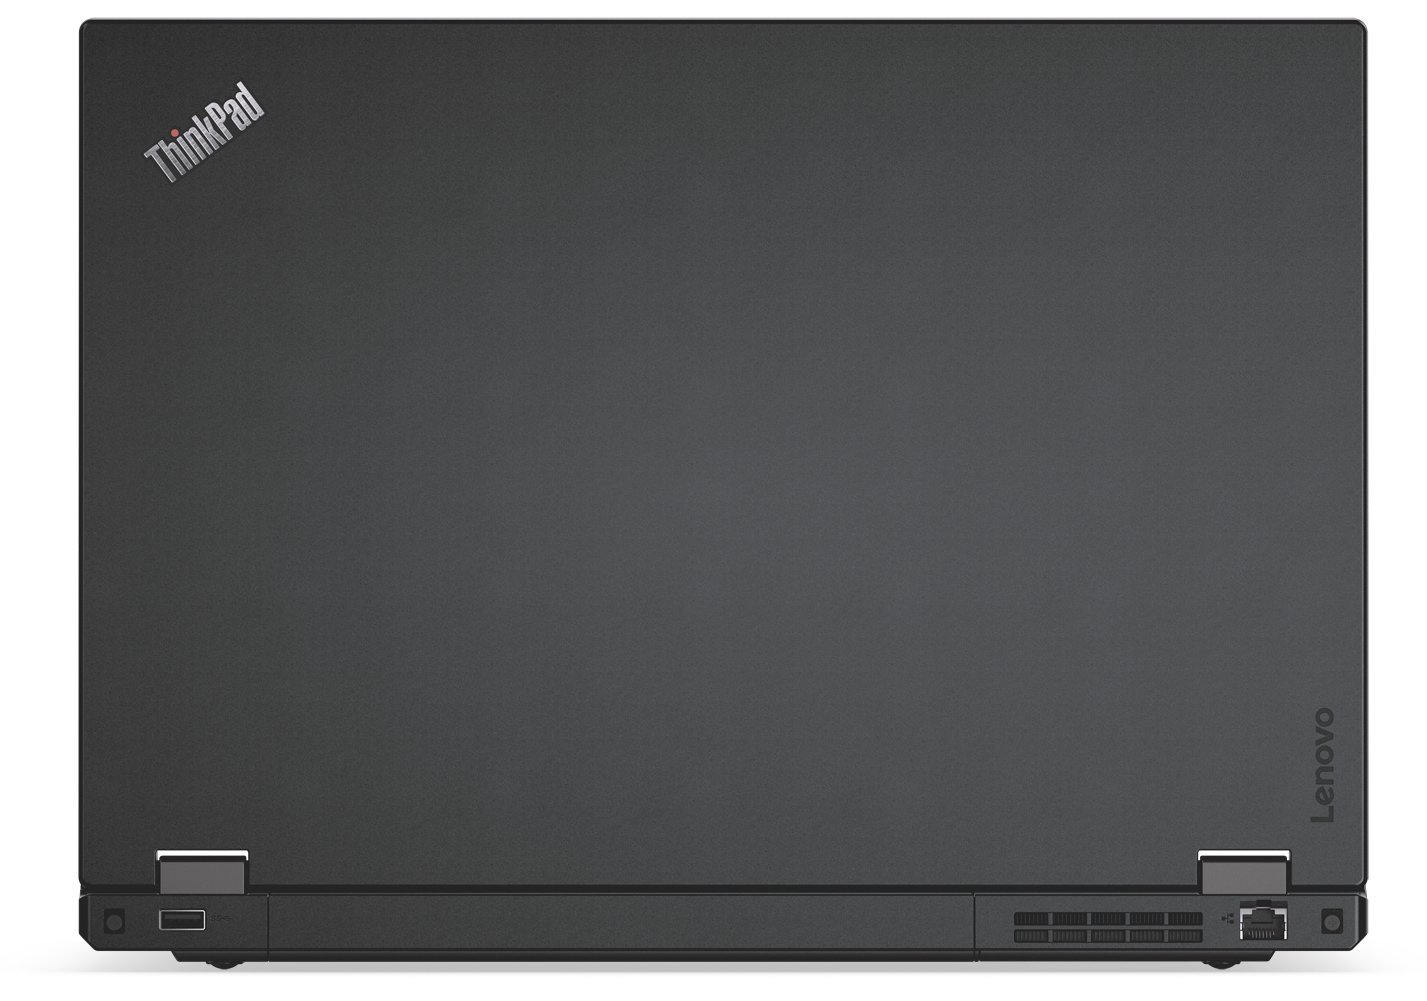
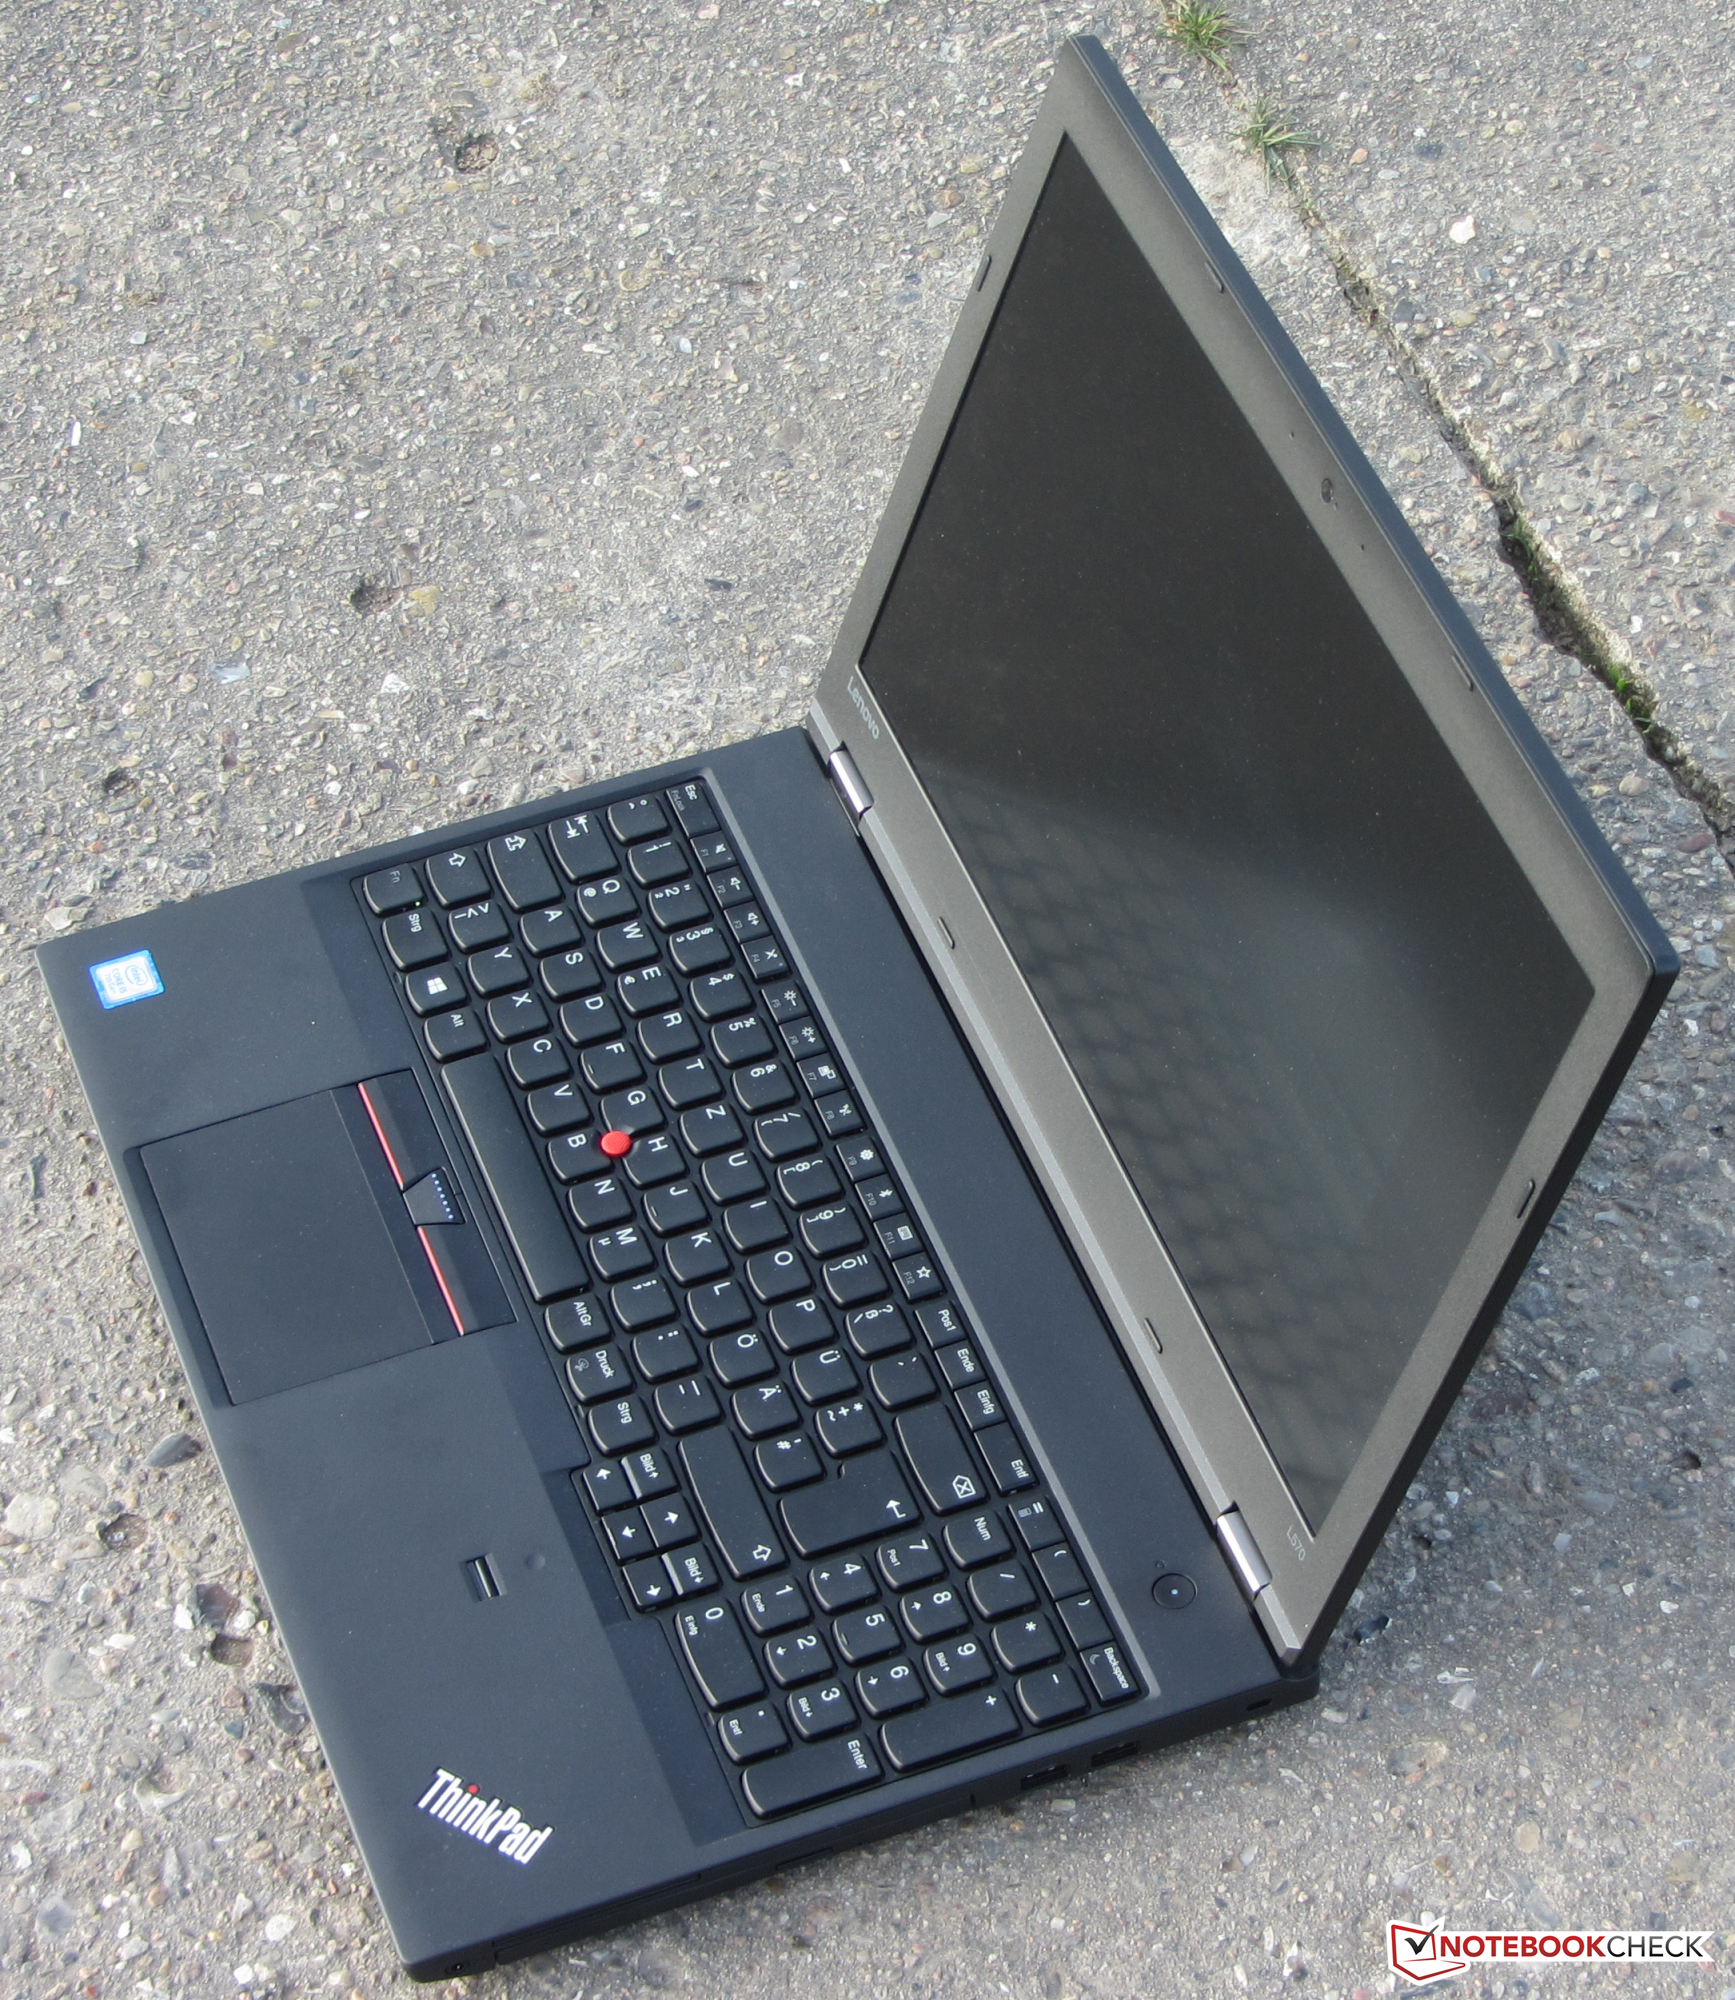
外壳并没有任何的变化,L570使用和L560一样的外壳。联想本应该做的更好。在同类中这个外壳并不是最稳固的。作为工作设备,Thinkpad应该能做到更好。整体上来说,可以认为这台设备是为了出门使用的是设计的。键盘,触摸板,指点杆是联想一贯出色的输入设备。我们想念那从前一代开始就消失了的键盘背光。
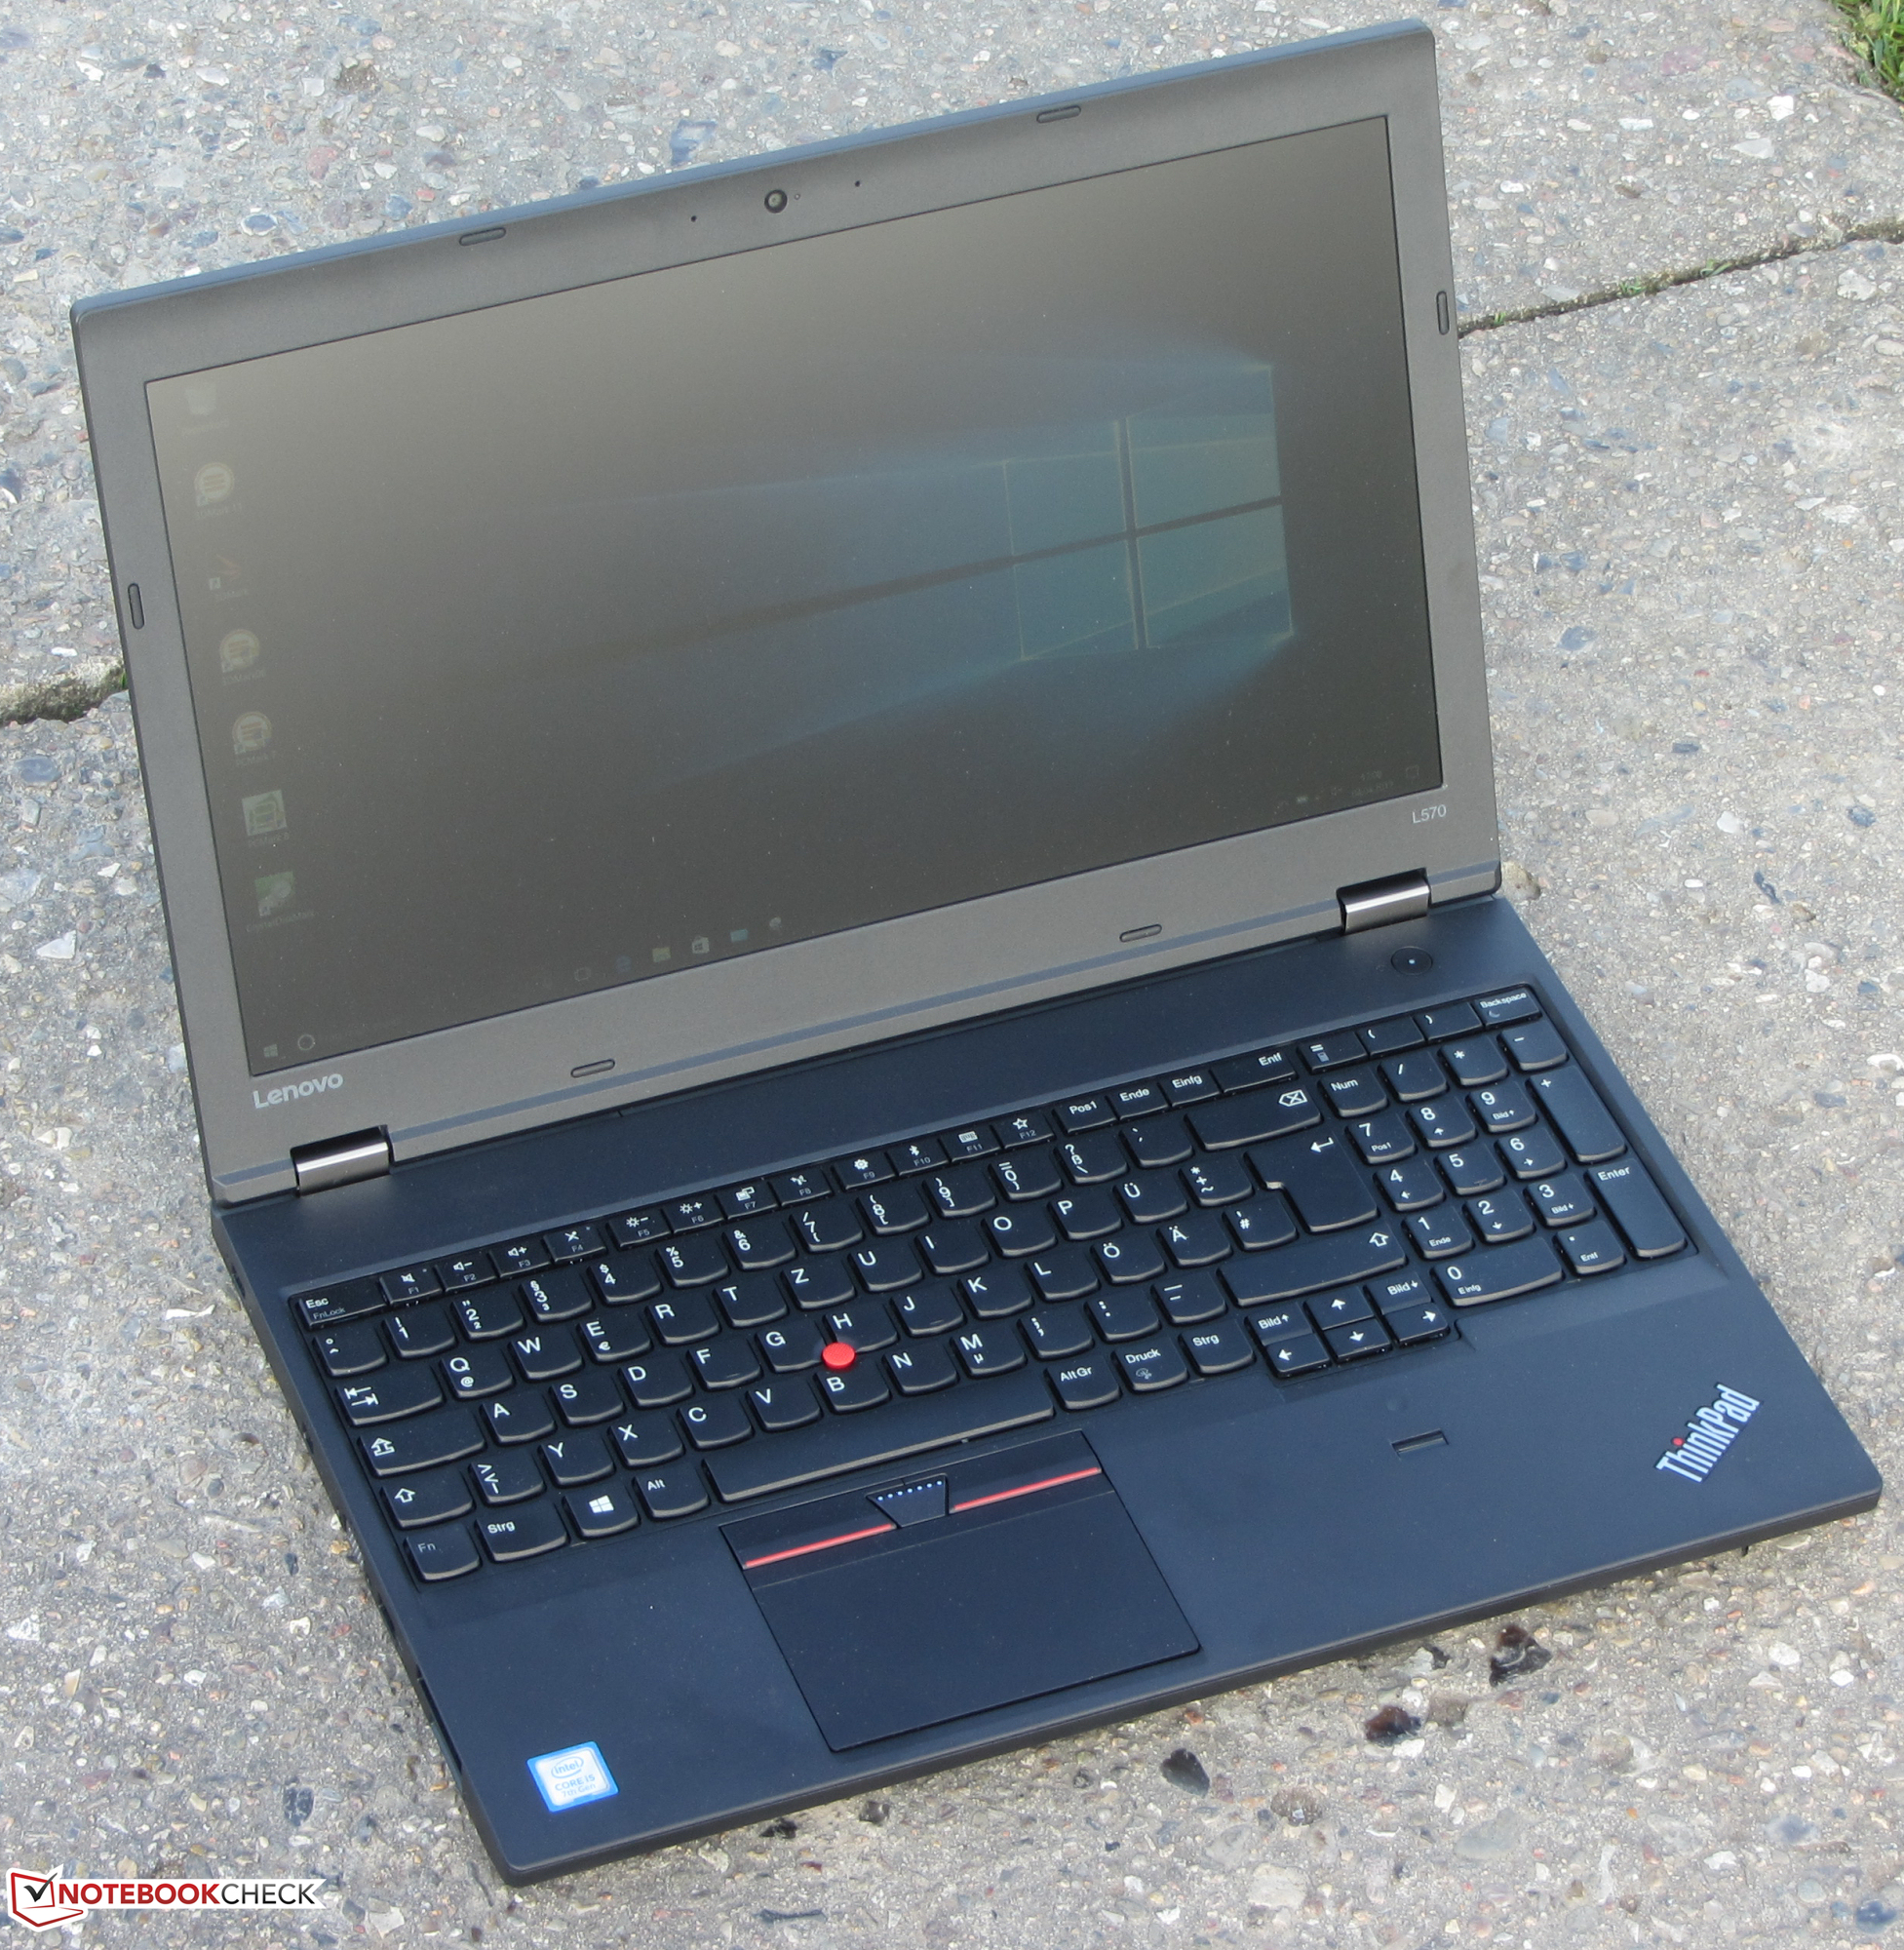
这台ThinkPad 配备一块全高清屏幕,有着广视角以及磨砂表层。亮度以及对比度都在平均水准,但是对于这个价格的笔记本电脑来说太低了些。
注:本文是基于完整评测的缩减版本,阅读完整的英文评测,请点击这里。
Lenovo Thinkpad L570 20J9S01600
- 04/14/2017 v6 (old)
Sascha Mölck