联想 ThinkPad L560 (Core i5, HDD) 笔记本电脑简短评测
| |||||||||||||||||||||||||
Brightness Distribution: 92 %
Center on Battery: 261 cd/m²
Contrast: 903:1 (Black: 0.29 cd/m²)
ΔE ColorChecker Calman: 8.49 | ∀{0.5-29.43 Ø4.71}
ΔE Greyscale Calman: 8.11 | ∀{0.09-98 Ø4.96}
57.94% sRGB (Argyll 1.6.3 3D)
37.07% AdobeRGB 1998 (Argyll 1.6.3 3D)
40.33% AdobeRGB 1998 (Argyll 3D)
58.3% sRGB (Argyll 3D)
39% Display P3 (Argyll 3D)
Gamma: 2.37
CCT: 6300 K
| Lenovo ThinkPad L560-20F10026GE 1920x1080, AH-IPS | Lenovo ThinkPad L540 20AV002YGE 1920x1080, TN LED | Lenovo ThinkPad L460-20FVS01400 1920x1080, IPS | Lenovo ThinkPad E550-20DF00CNGE 1920x1080, TN-Panel | HP ProBook 450 G3 1920x1080, TN LED | Dell Inspiron 15-5558 1920x1080, IPS | |
|---|---|---|---|---|---|---|
| Display | 35% | 8% | 2% | -2% | 6% | |
| Display P3 Coverage (%) | 39 | 53.5 37% | 42.2 8% | 39.84 2% | 38.1 -2% | 41.22 6% |
| sRGB Coverage (%) | 58.3 | 76.7 32% | 62.3 7% | 59.3 2% | 57.3 -2% | 61.8 6% |
| AdobeRGB 1998 Coverage (%) | 40.33 | 54.8 36% | 43.72 8% | 41.2 2% | 39.37 -2% | 42.58 6% |
| Response Times | -10% | -3% | ||||
| Response Time Grey 50% / Grey 80% * (ms) | 39.2 ? | 44.4 ? -13% | 41.2 ? -5% | |||
| Response Time Black / White * (ms) | 28 ? | 29.6 ? -6% | 28 ? -0% | |||
| PWM Frequency (Hz) | ||||||
| Screen | -29% | 6% | -22% | -18% | -1% | |
| Brightness middle (cd/m²) | 262 | 303 16% | 245 -6% | 195 -26% | 211 -19% | 177 -32% |
| Brightness (cd/m²) | 250 | 290 16% | 225 -10% | 188 -25% | 214 -14% | 176 -30% |
| Brightness Distribution (%) | 92 | 85 -8% | 83 -10% | 90 -2% | 91 -1% | 78 -15% |
| Black Level * (cd/m²) | 0.29 | 0.7 -141% | 0.24 17% | 0.46 -59% | 0.43 -48% | 0.15 48% |
| Contrast (:1) | 903 | 433 -52% | 1021 13% | 424 -53% | 491 -46% | 1180 31% |
| Colorchecker dE 2000 * | 8.49 | 11.58 -36% | 6.89 19% | 9.92 -17% | 9.25 -9% | 8.52 -0% |
| Colorchecker dE 2000 max. * | 17.99 | 17.62 2% | ||||
| Greyscale dE 2000 * | 8.11 | 13.65 -68% | 6.45 20% | 10.06 -24% | 9.83 -21% | 9.72 -20% |
| Gamma | 2.37 93% | 2.59 85% | 2.46 89% | 2.37 93% | 2.82 78% | 1.85 119% |
| CCT | 6300 103% | 13248 49% | 6857 95% | 11552 56% | 10890 60% | 5036 129% |
| Color Space (Percent of AdobeRGB 1998) (%) | 37.07 | 51.12 38% | 40.1 8% | 38 3% | 36.4 -2% | 39 5% |
| Color Space (Percent of sRGB) (%) | 57.94 | 61.8 7% | 59.3 2% | 57.3 -1% | 61 5% | |
| Total Average (Program / Settings) | 3% /
-12% | 1% /
4% | -10% /
-16% | -8% /
-12% | 3% /
1% |
* ... smaller is better
Display Response Times
| ↔ Response Time Black to White | ||
|---|---|---|
| 28 ms ... rise ↗ and fall ↘ combined | ↗ 12.4 ms rise | 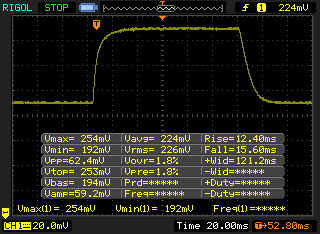 |
| ↘ 15.6 ms fall | ||
| The screen shows relatively slow response rates in our tests and may be too slow for gamers. In comparison, all tested devices range from 0.1 (minimum) to 240 (maximum) ms. » 71 % of all devices are better. This means that the measured response time is worse than the average of all tested devices (19.8 ms). | ||
| ↔ Response Time 50% Grey to 80% Grey | ||
| 39.2 ms ... rise ↗ and fall ↘ combined | ↗ 18.8 ms rise | 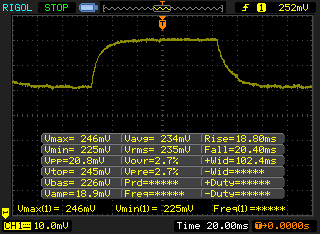 |
| ↘ 20.4 ms fall | ||
| The screen shows slow response rates in our tests and will be unsatisfactory for gamers. In comparison, all tested devices range from 0.165 (minimum) to 636 (maximum) ms. » 60 % of all devices are better. This means that the measured response time is worse than the average of all tested devices (31 ms). | ||
Screen Flickering / PWM (Pulse-Width Modulation)
| Screen flickering / PWM not detected | ||
In comparison: 52 % of all tested devices do not use PWM to dim the display. If PWM was detected, an average of 7754 (minimum: 5 - maximum: 343500) Hz was measured. | ||
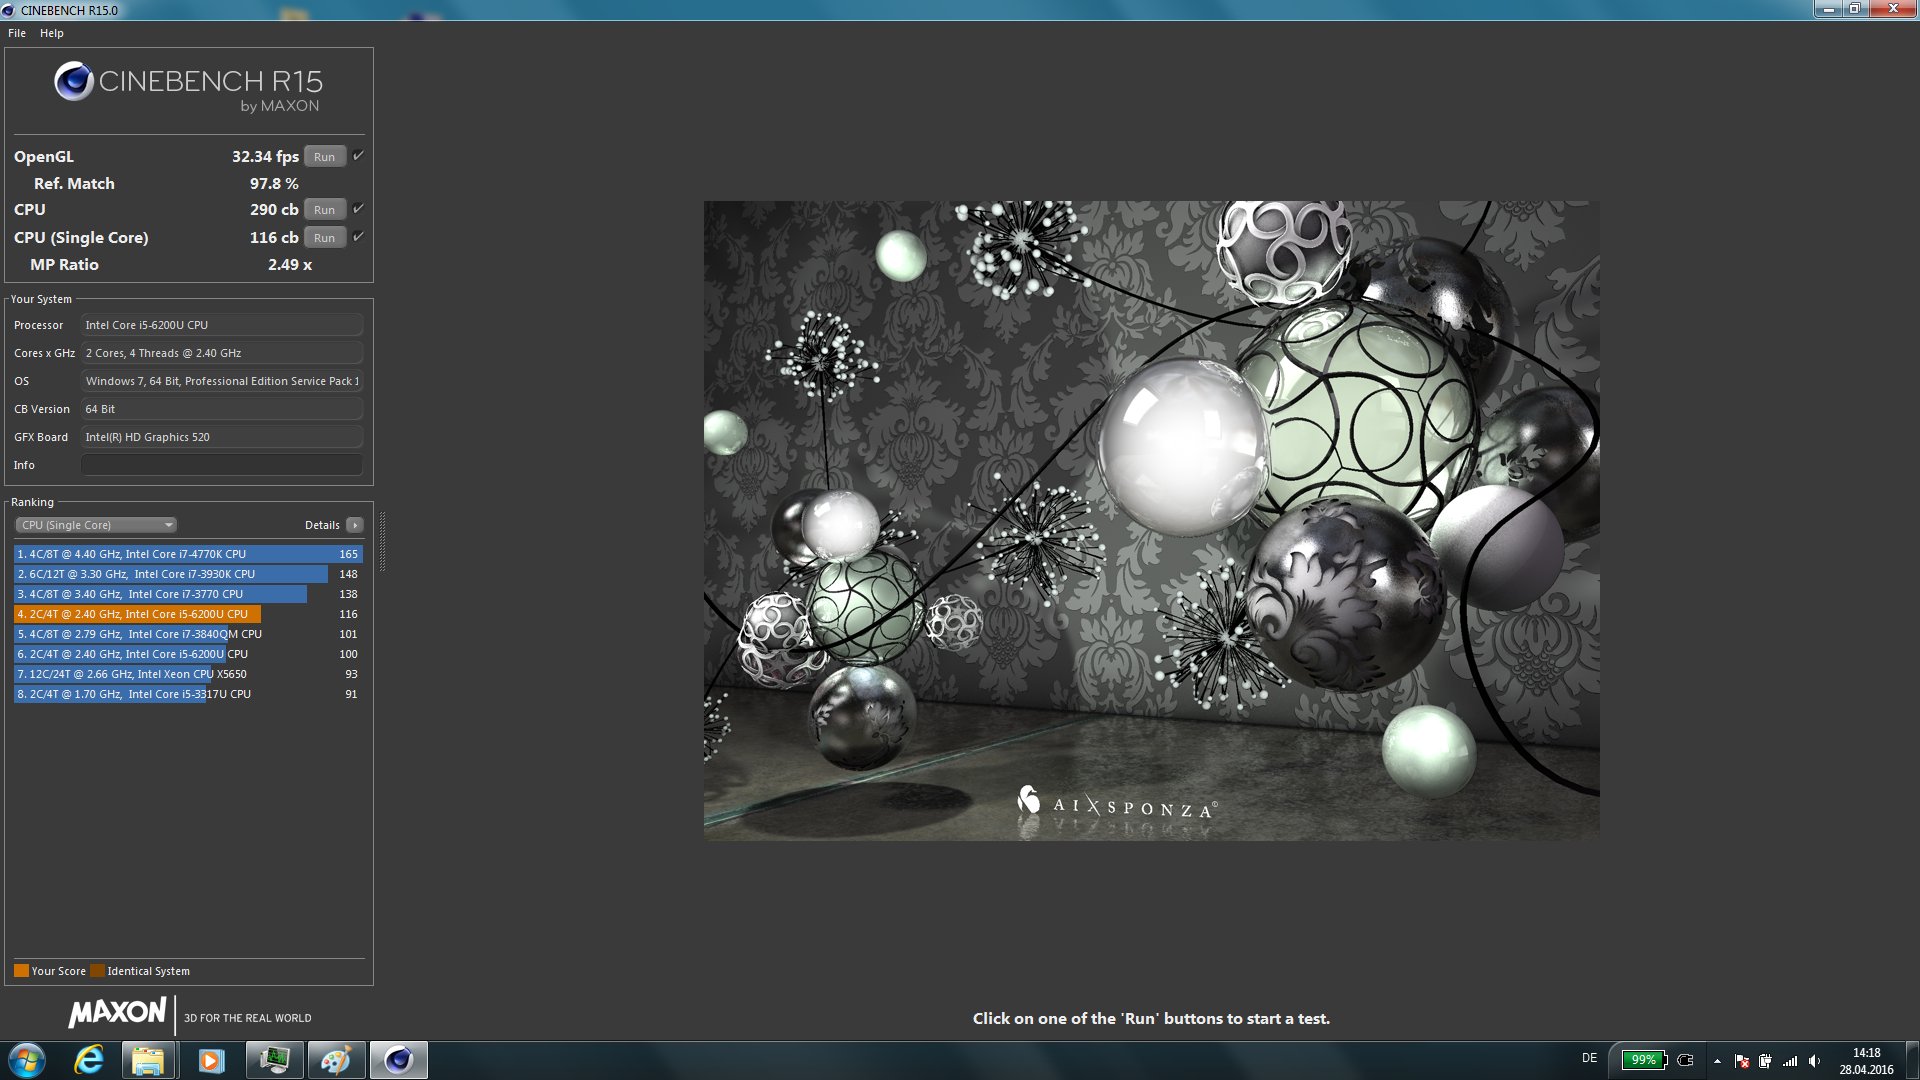
| Cinebench R15 | |
| CPU Single 64Bit (sort by value) | |
| Lenovo ThinkPad L560-20F10026GE | |
| Lenovo ThinkPad L540 20AV002YGE | |
| Lenovo ThinkPad L460-20FVS01400 | |
| Lenovo ThinkPad E550-20DF00CNGE | |
| HP ProBook 450 G3 | |
| Dell Inspiron 15-5558 | |
| CPU Multi 64Bit (sort by value) | |
| Lenovo ThinkPad L560-20F10026GE | |
| Lenovo ThinkPad L540 20AV002YGE | |
| Lenovo ThinkPad L460-20FVS01400 | |
| Lenovo ThinkPad E550-20DF00CNGE | |
| HP ProBook 450 G3 | |
| Dell Inspiron 15-5558 | |
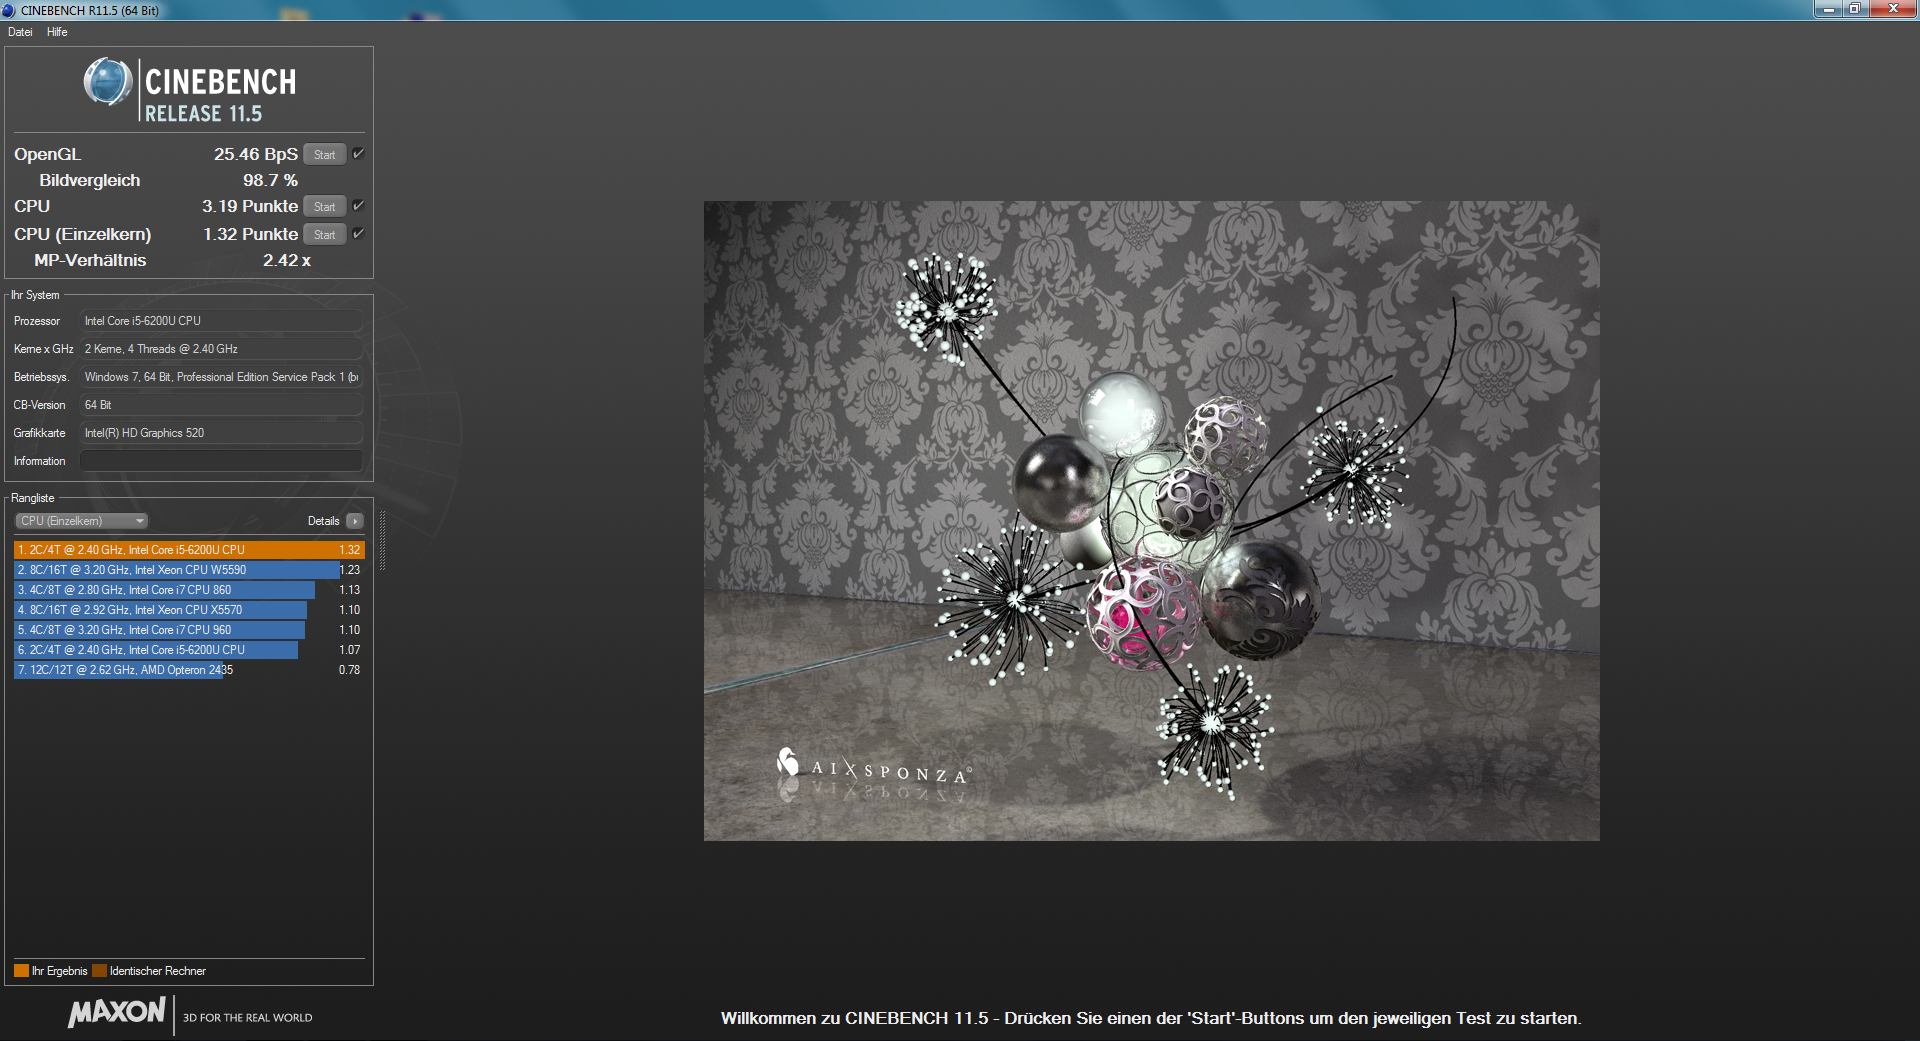
| Cinebench R11.5 | |
| CPU Single 64Bit (sort by value) | |
| Lenovo ThinkPad L560-20F10026GE | |
| Lenovo ThinkPad L540 20AV002YGE | |
| Lenovo ThinkPad L460-20FVS01400 | |
| Lenovo ThinkPad E550-20DF00CNGE | |
| HP ProBook 450 G3 | |
| Dell Inspiron 15-5558 | |
| CPU Multi 64Bit (sort by value) | |
| Lenovo ThinkPad L560-20F10026GE | |
| Lenovo ThinkPad L540 20AV002YGE | |
| Lenovo ThinkPad L460-20FVS01400 | |
| Lenovo ThinkPad E550-20DF00CNGE | |
| HP ProBook 450 G3 | |
| Dell Inspiron 15-5558 | |
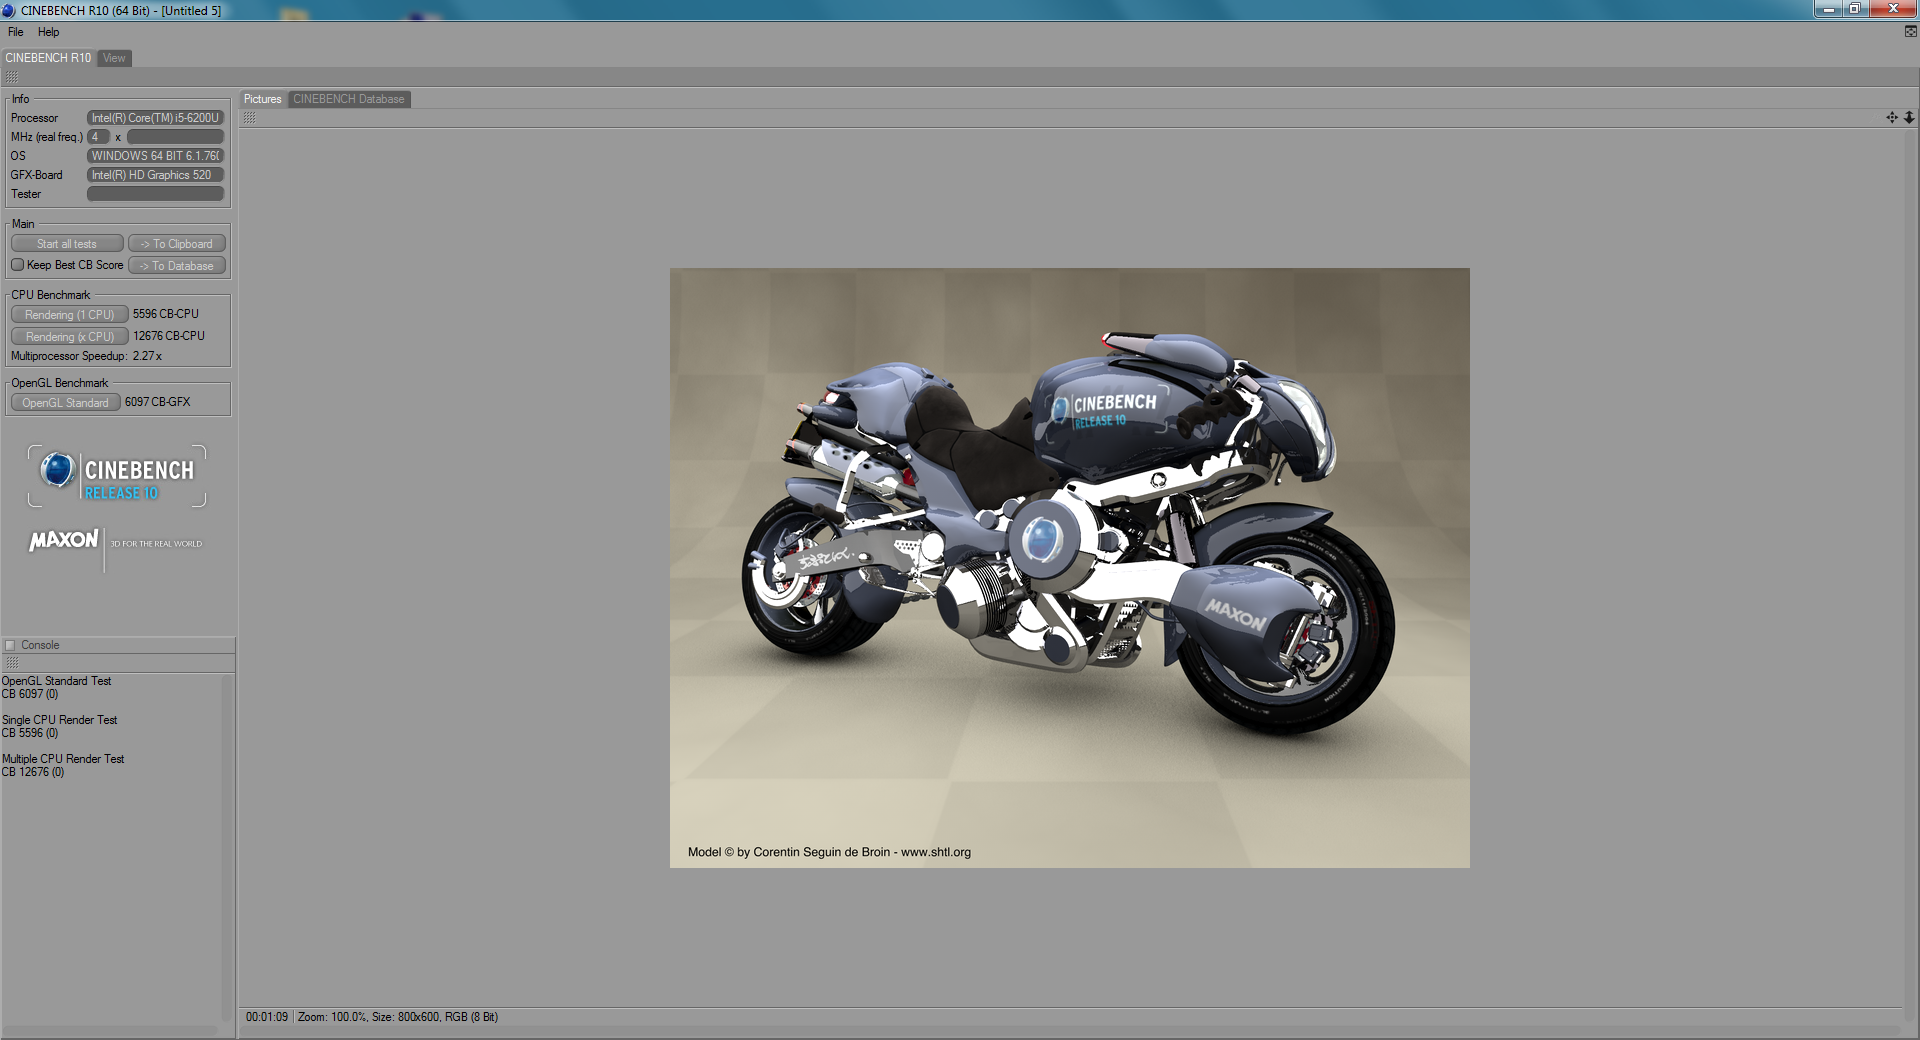
| Cinebench R10 | |
| Rendering Multiple CPUs 64Bit (sort by value) | |
| Lenovo ThinkPad L560-20F10026GE | |
| Lenovo ThinkPad E550-20DF00CNGE | |
| Rendering Single CPUs 64Bit (sort by value) | |
| Lenovo ThinkPad L560-20F10026GE | |
| Lenovo ThinkPad E550-20DF00CNGE | |
| JetStream 1.1 - 1.1 Total (sort by value) | |
| Lenovo ThinkPad L560-20F10026GE | |
| Lenovo ThinkPad L460-20FVS01400 | |
| Lenovo ThinkPad E550-20DF00CNGE | |
| HP ProBook 450 G3 | |
| Octane V2 - Total Score (sort by value) | |
| Lenovo ThinkPad L560-20F10026GE | |
| Lenovo ThinkPad L460-20FVS01400 | |
| Lenovo ThinkPad E550-20DF00CNGE | |
| HP ProBook 450 G3 | |
| Dell Inspiron 15-5558 | |
| Mozilla Kraken 1.1 - Total (sort by value) | |
| Lenovo ThinkPad L560-20F10026GE | |
| Lenovo ThinkPad L460-20FVS01400 | |
| Lenovo ThinkPad E550-20DF00CNGE | |
| HP ProBook 450 G3 | |
| Dell Inspiron 15-5558 | |
* ... smaller is better
| PCMark 8 | |
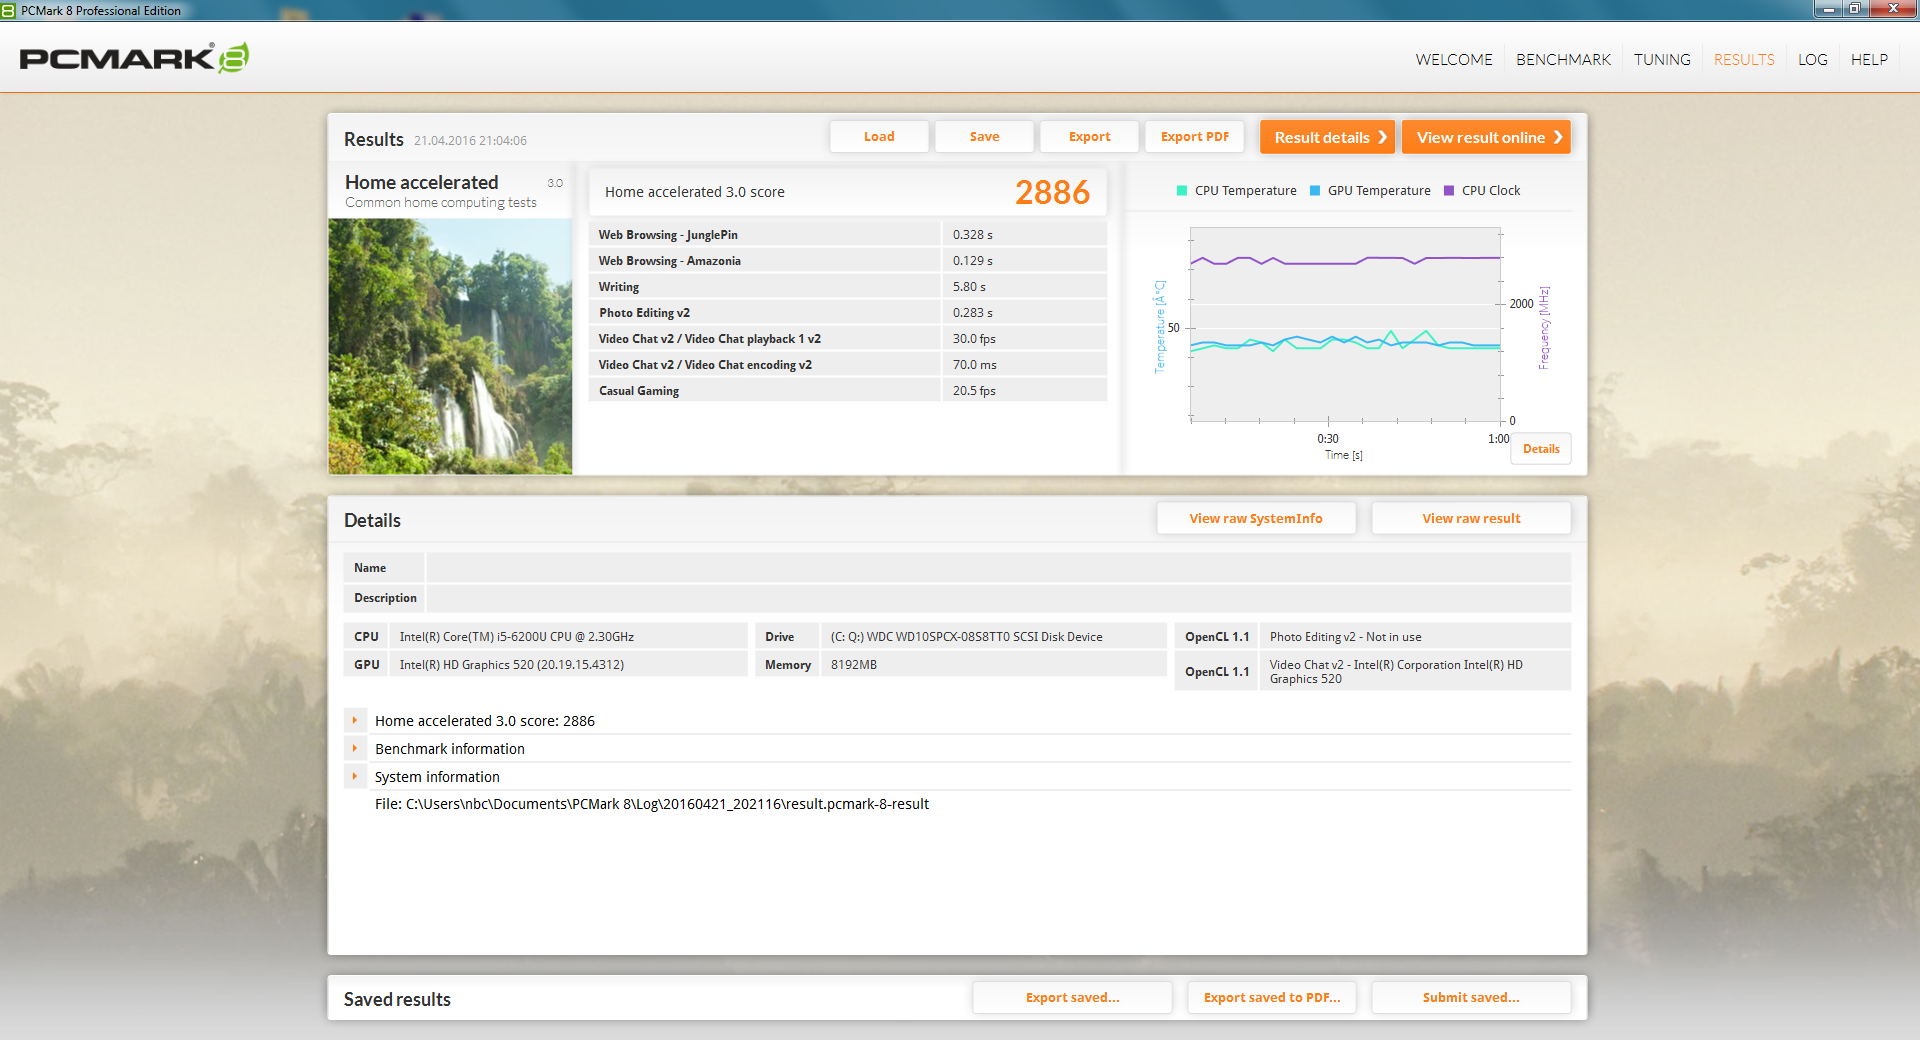
| Home Score Accelerated v2 (sort by value) | |
| Lenovo ThinkPad L560-20F10026GE | |
| Lenovo ThinkPad L540 20AV002YGE | |
| Lenovo ThinkPad L460-20FVS01400 | |
| Lenovo ThinkPad E550-20DF00CNGE | |
| HP ProBook 450 G3 | |
| Dell Inspiron 15-5558 | |
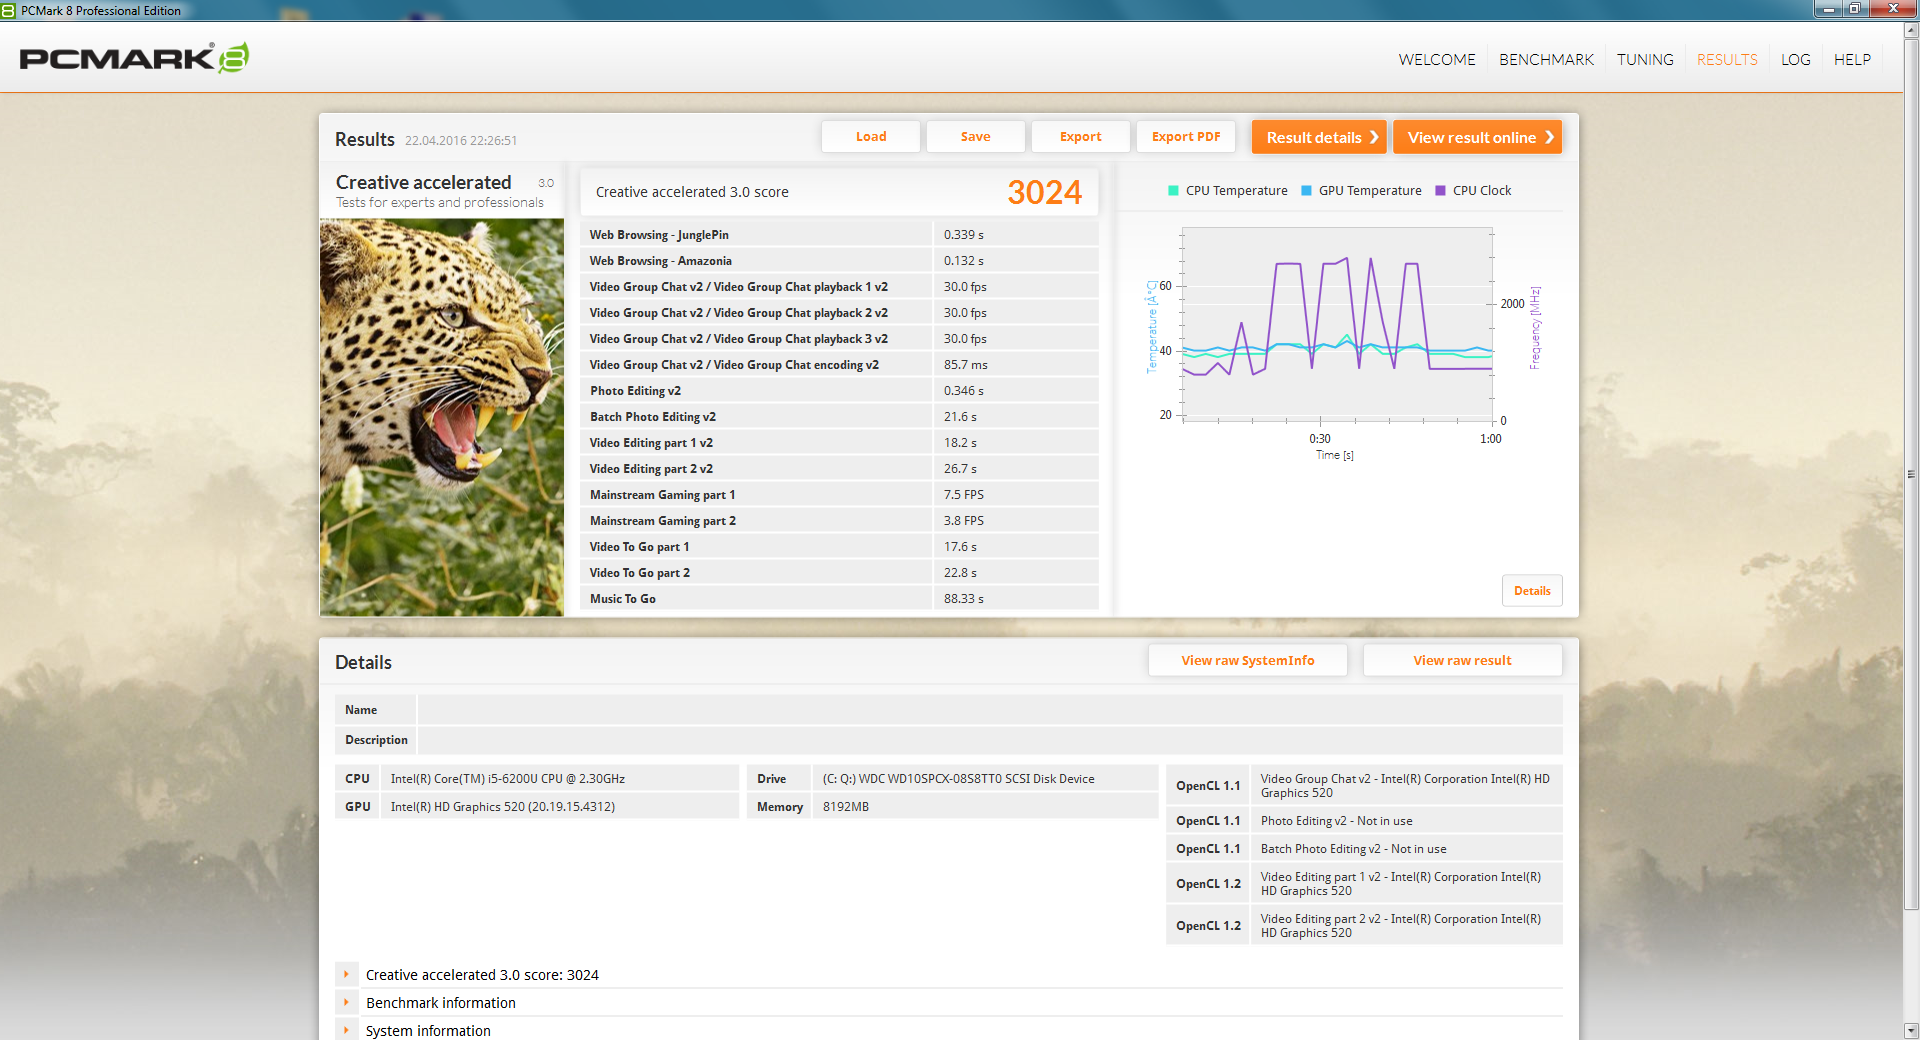
| Creative Score Accelerated v2 (sort by value) | |
| Lenovo ThinkPad L560-20F10026GE | |
| Lenovo ThinkPad L540 20AV002YGE | |
| Lenovo ThinkPad L460-20FVS01400 | |
| HP ProBook 450 G3 | |
| Dell Inspiron 15-5558 | |
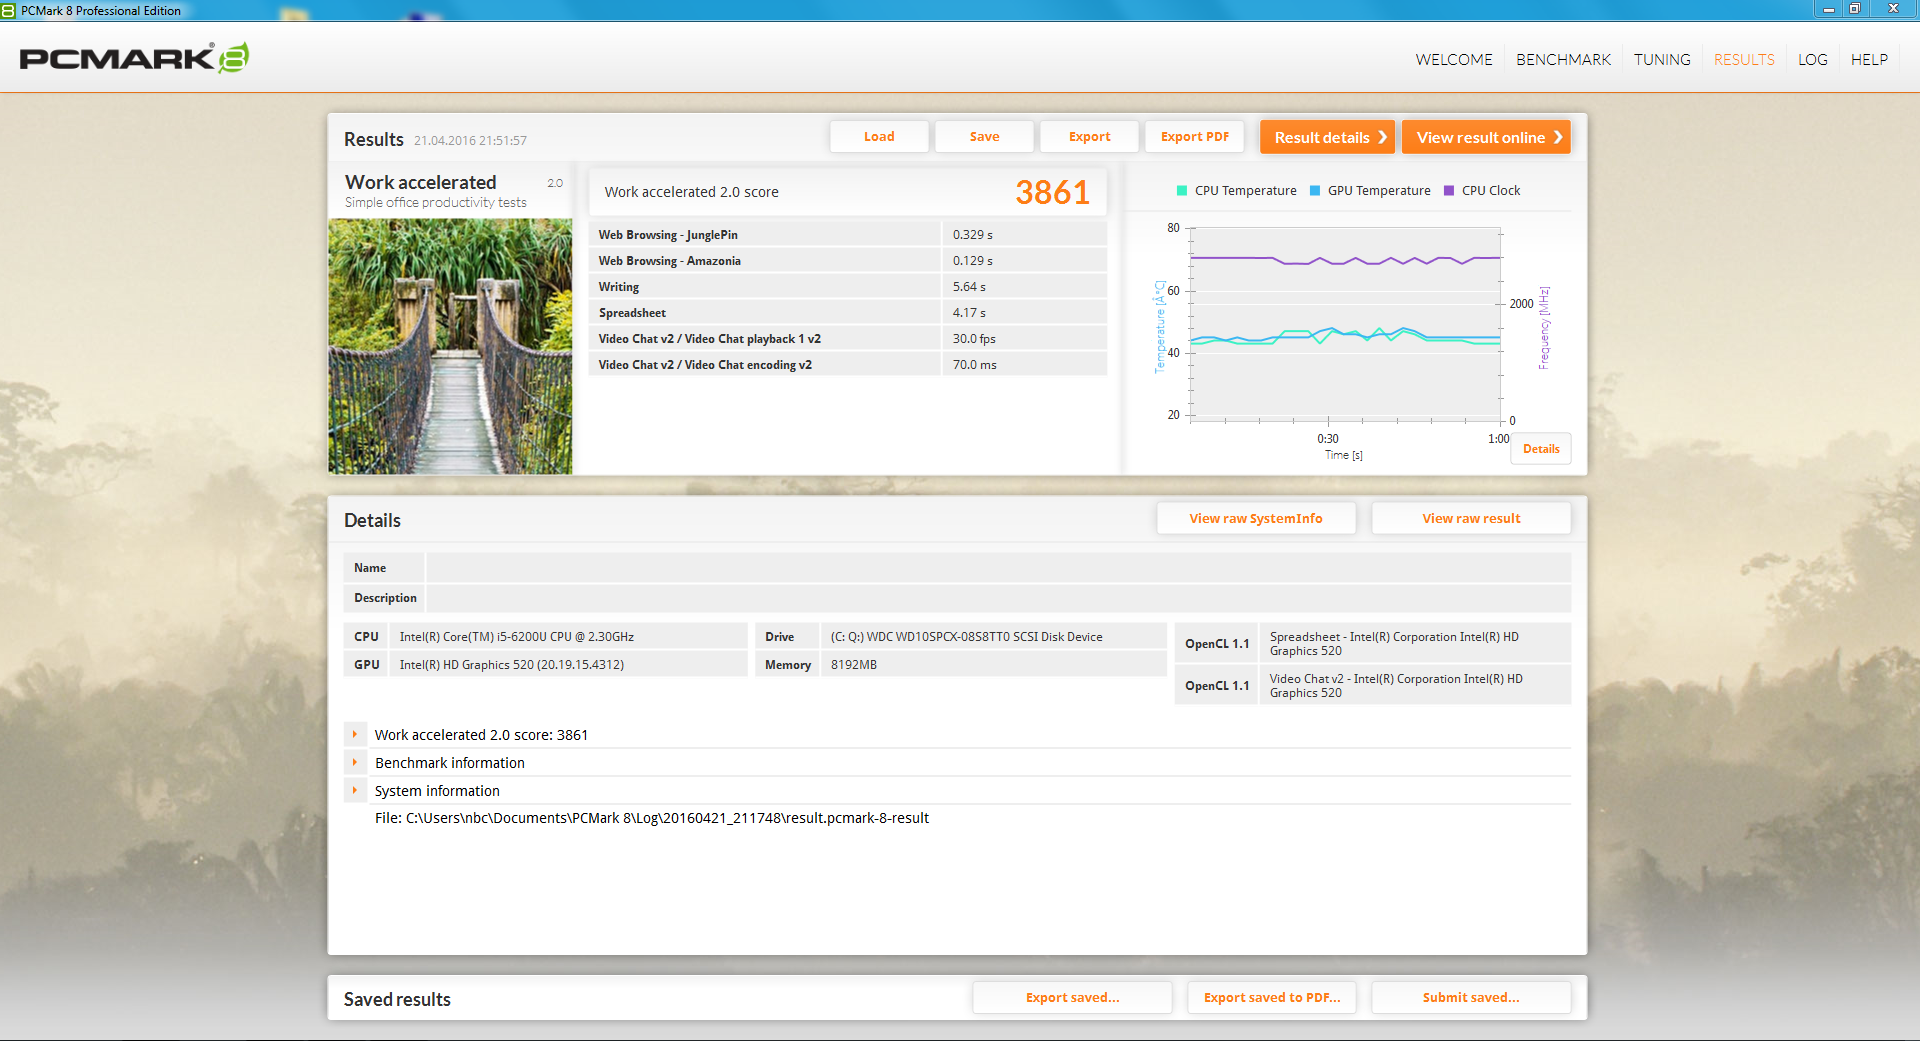
| Work Score Accelerated v2 (sort by value) | |
| Lenovo ThinkPad L560-20F10026GE | |
| Lenovo ThinkPad L540 20AV002YGE | |
| Lenovo ThinkPad L460-20FVS01400 | |
| Lenovo ThinkPad E550-20DF00CNGE | |
| HP ProBook 450 G3 | |
| Dell Inspiron 15-5558 | |
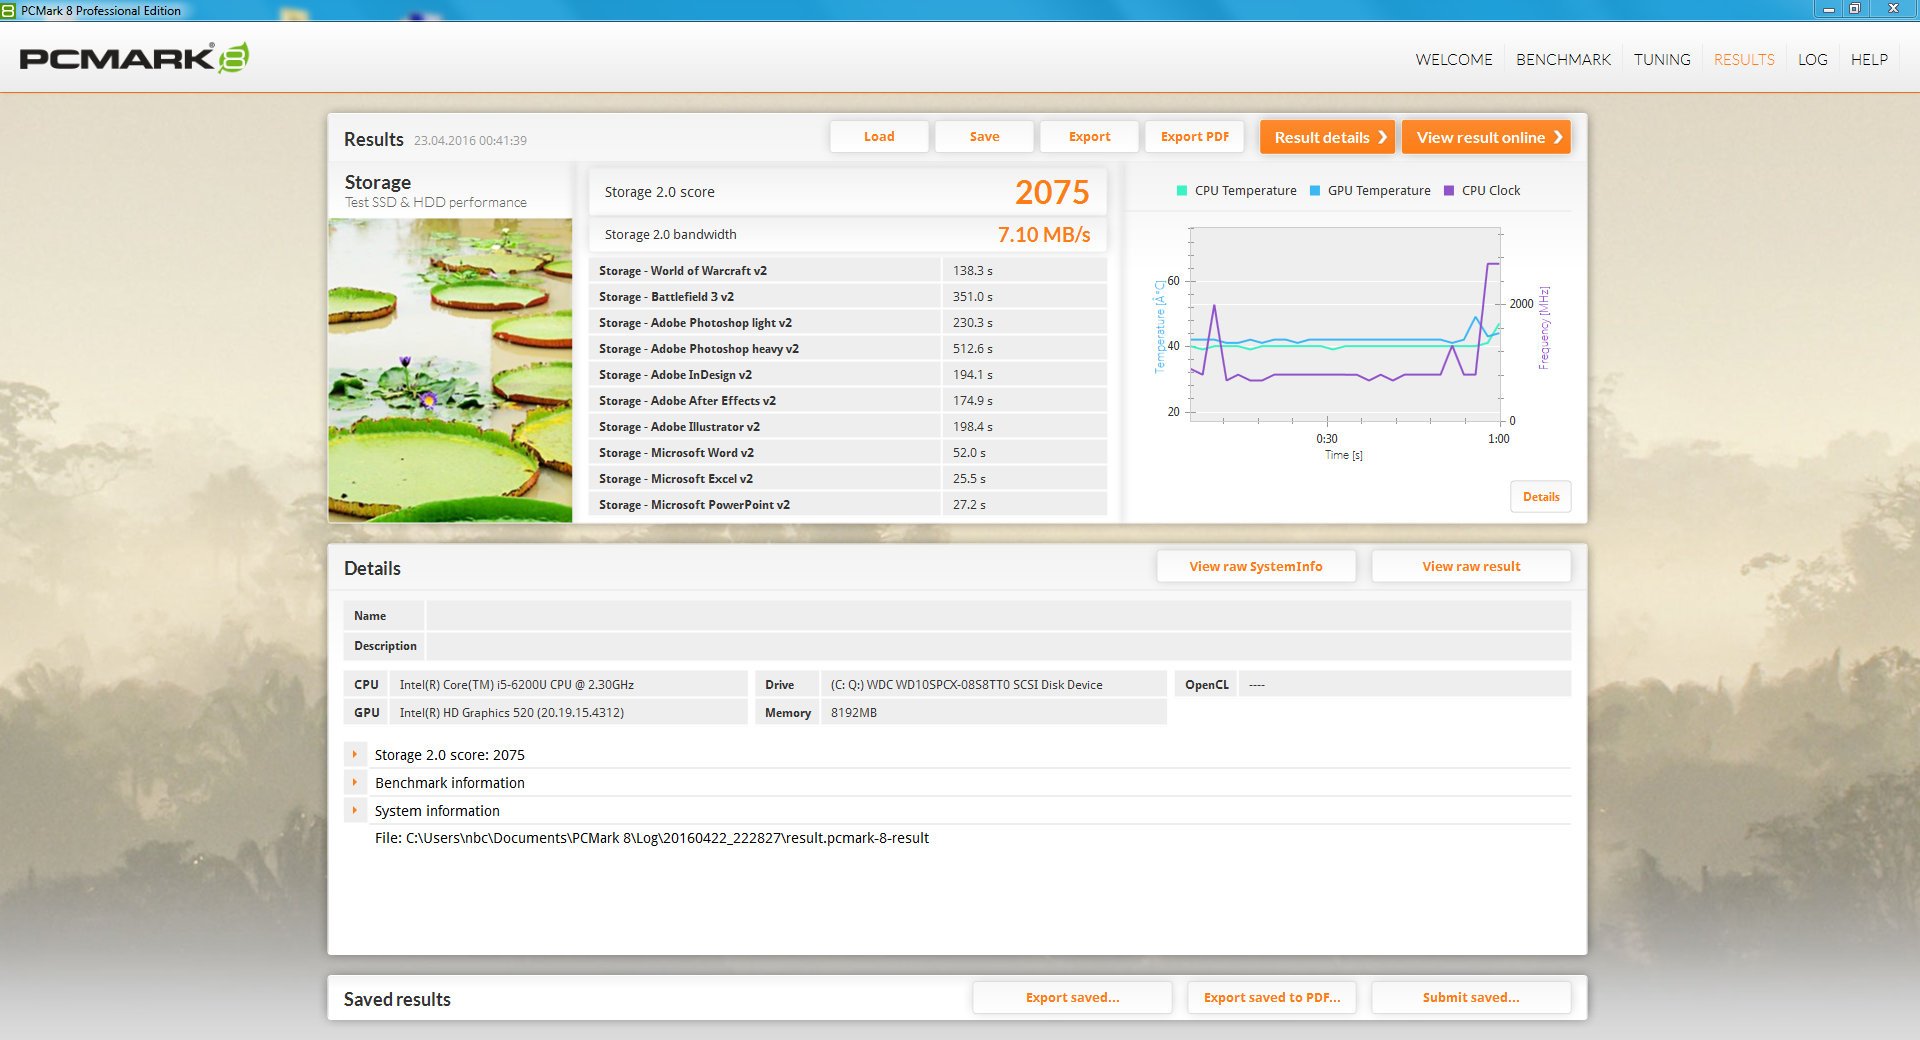
| Storage Score v2 (sort by value) | |
| Lenovo ThinkPad L560-20F10026GE | |
| PCMark 7 | |
| Score (sort by value) | |
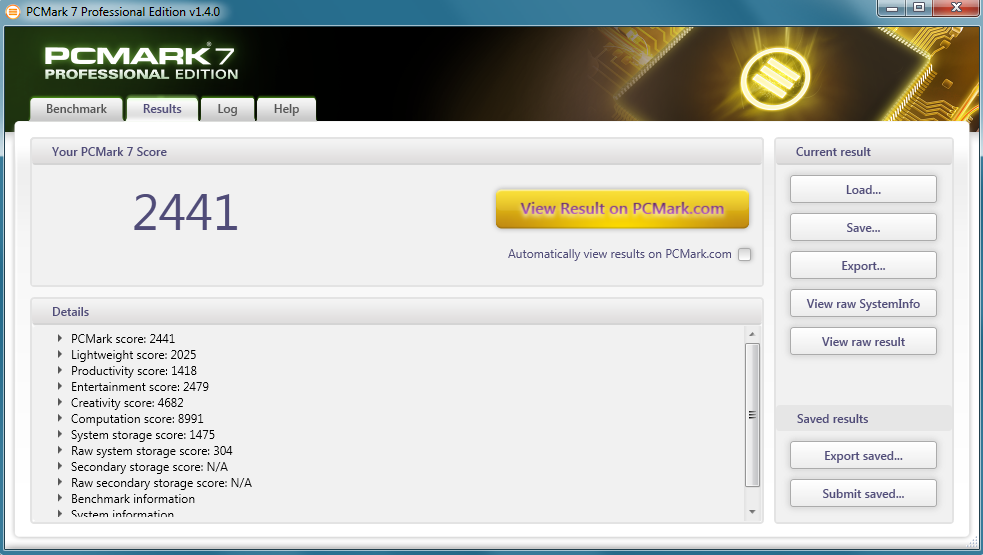
| Lenovo ThinkPad L560-20F10026GE | |
| Lenovo ThinkPad L540 20AV002YGE | |
| Lenovo ThinkPad L460-20FVS01400 | |
| Lenovo ThinkPad E550-20DF00CNGE | |
| HP ProBook 450 G3 | |
| Dell Inspiron 15-5558 | |
| Productivity (sort by value) | |
| Lenovo ThinkPad L560-20F10026GE | |
| Lenovo ThinkPad L540 20AV002YGE | |
| Lenovo ThinkPad L460-20FVS01400 | |
| Lenovo ThinkPad E550-20DF00CNGE | |
| HP ProBook 450 G3 | |
| Dell Inspiron 15-5558 | |
| System Storage (sort by value) | |
| Lenovo ThinkPad L560-20F10026GE | |
| Lenovo ThinkPad L540 20AV002YGE | |
| Lenovo ThinkPad L460-20FVS01400 | |
| Lenovo ThinkPad E550-20DF00CNGE | |
| HP ProBook 450 G3 | |
| Dell Inspiron 15-5558 | |
| PCMark 7 Score | 2441 points | |
| PCMark 8 Home Score Accelerated v2 | 2886 points | |
| PCMark 8 Creative Score Accelerated v2 | 3024 points | |
| PCMark 8 Work Score Accelerated v2 | 3861 points | |
Help | ||

| 3DMark | |
| 1280x720 Ice Storm Standard Score (sort by value) | |
| Lenovo ThinkPad L560-20F10026GE | |
| Lenovo ThinkPad L540 20AV002YGE | |
| Lenovo ThinkPad L460-20FVS01400 | |
| Lenovo ThinkPad E550-20DF00CNGE | |
| HP ProBook 450 G3 | |
| Dell Inspiron 15-5558 | |
| Acer TravelMate P278-MG-76L2 | |
| 1280x720 Cloud Gate Standard Score (sort by value) | |
| Lenovo ThinkPad L560-20F10026GE | |
| Lenovo ThinkPad L540 20AV002YGE | |
| Lenovo ThinkPad L460-20FVS01400 | |
| Lenovo ThinkPad E550-20DF00CNGE | |
| HP ProBook 450 G3 | |
| Dell Inspiron 15-5558 | |
| Acer TravelMate P278-MG-76L2 | |
| 1920x1080 Fire Strike Score (sort by value) | |
| Lenovo ThinkPad L560-20F10026GE | |
| Lenovo ThinkPad L540 20AV002YGE | |
| Lenovo ThinkPad L460-20FVS01400 | |
| Lenovo ThinkPad E550-20DF00CNGE | |
| HP ProBook 450 G3 | |
| Dell Inspiron 15-5558 | |
| Acer TravelMate P278-MG-76L2 | |
| 3DMark 11 | |
| 1280x720 Performance (sort by value) | |
| Lenovo ThinkPad L560-20F10026GE | |
| Lenovo ThinkPad L540 20AV002YGE | |
| Lenovo ThinkPad L460-20FVS01400 | |
| Lenovo ThinkPad E550-20DF00CNGE | |
| HP ProBook 450 G3 | |
| Dell Inspiron 15-5558 | |
| Acer TravelMate P278-MG-76L2 | |
| 1280x720 Performance GPU (sort by value) | |
| Lenovo ThinkPad L560-20F10026GE | |
| Lenovo ThinkPad L540 20AV002YGE | |
| Lenovo ThinkPad L460-20FVS01400 | |
| Lenovo ThinkPad E550-20DF00CNGE | |
| HP ProBook 450 G3 | |
| Dell Inspiron 15-5558 | |
| Acer TravelMate P278-MG-76L2 | |
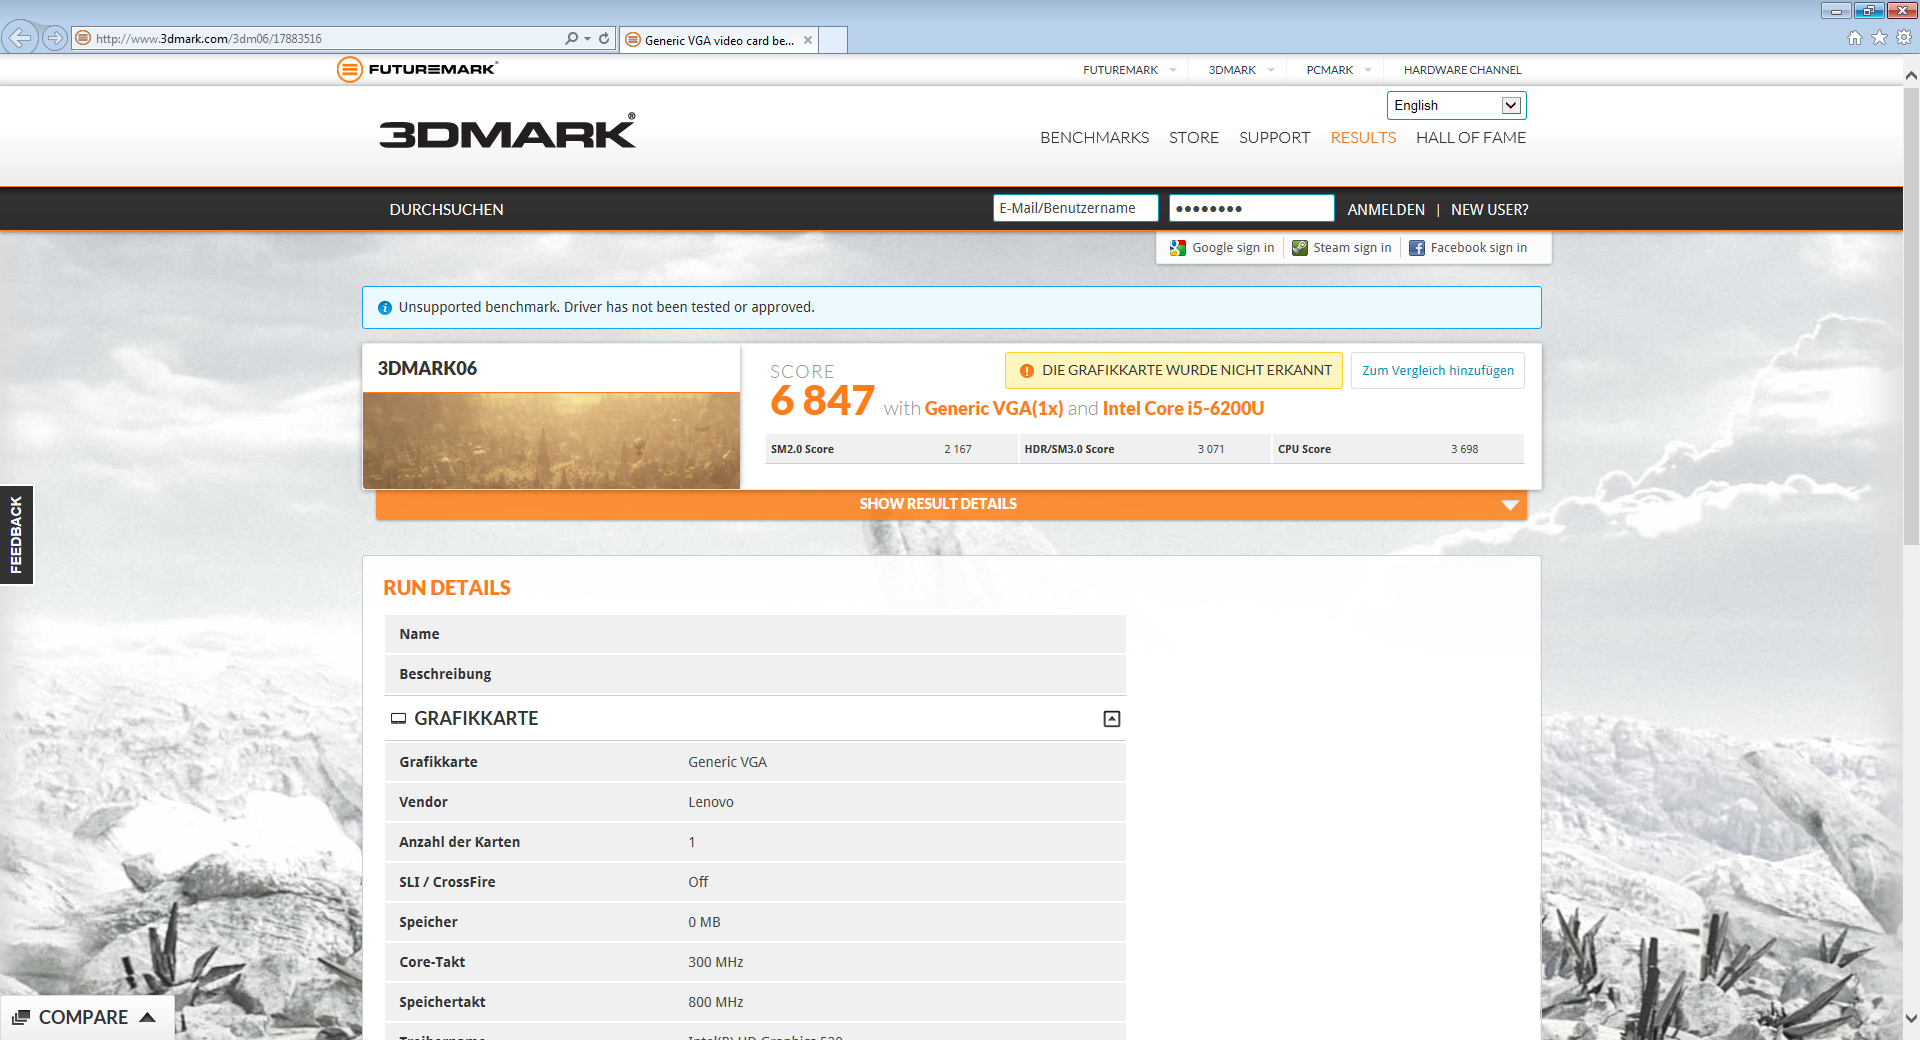
| 3DMark 06 1280x720 Score | 6847 points | |
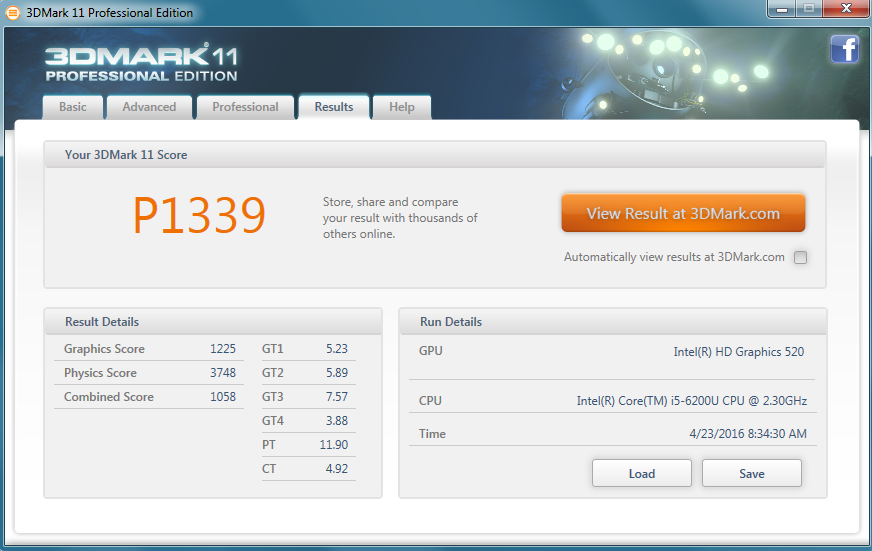
| 3DMark 11 Performance | 1339 points | |
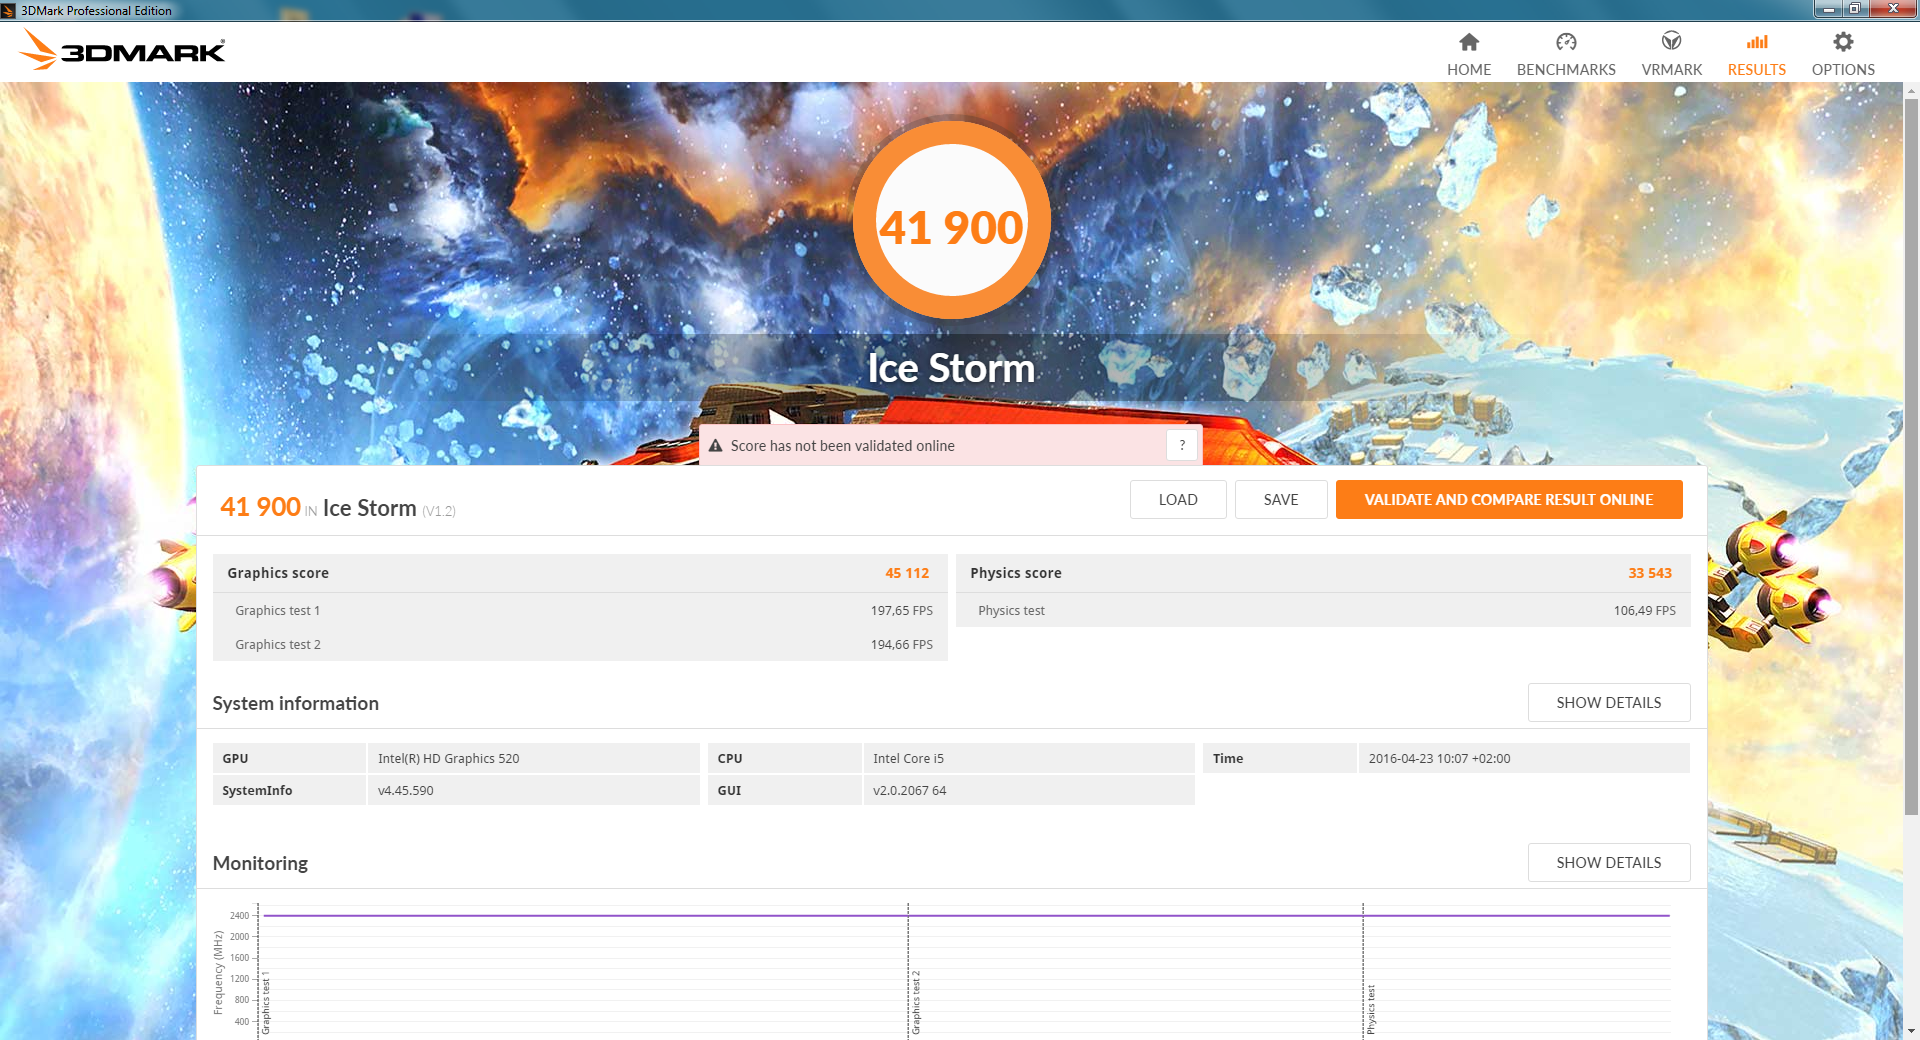
| 3DMark Ice Storm Standard Score | 41900 points | |
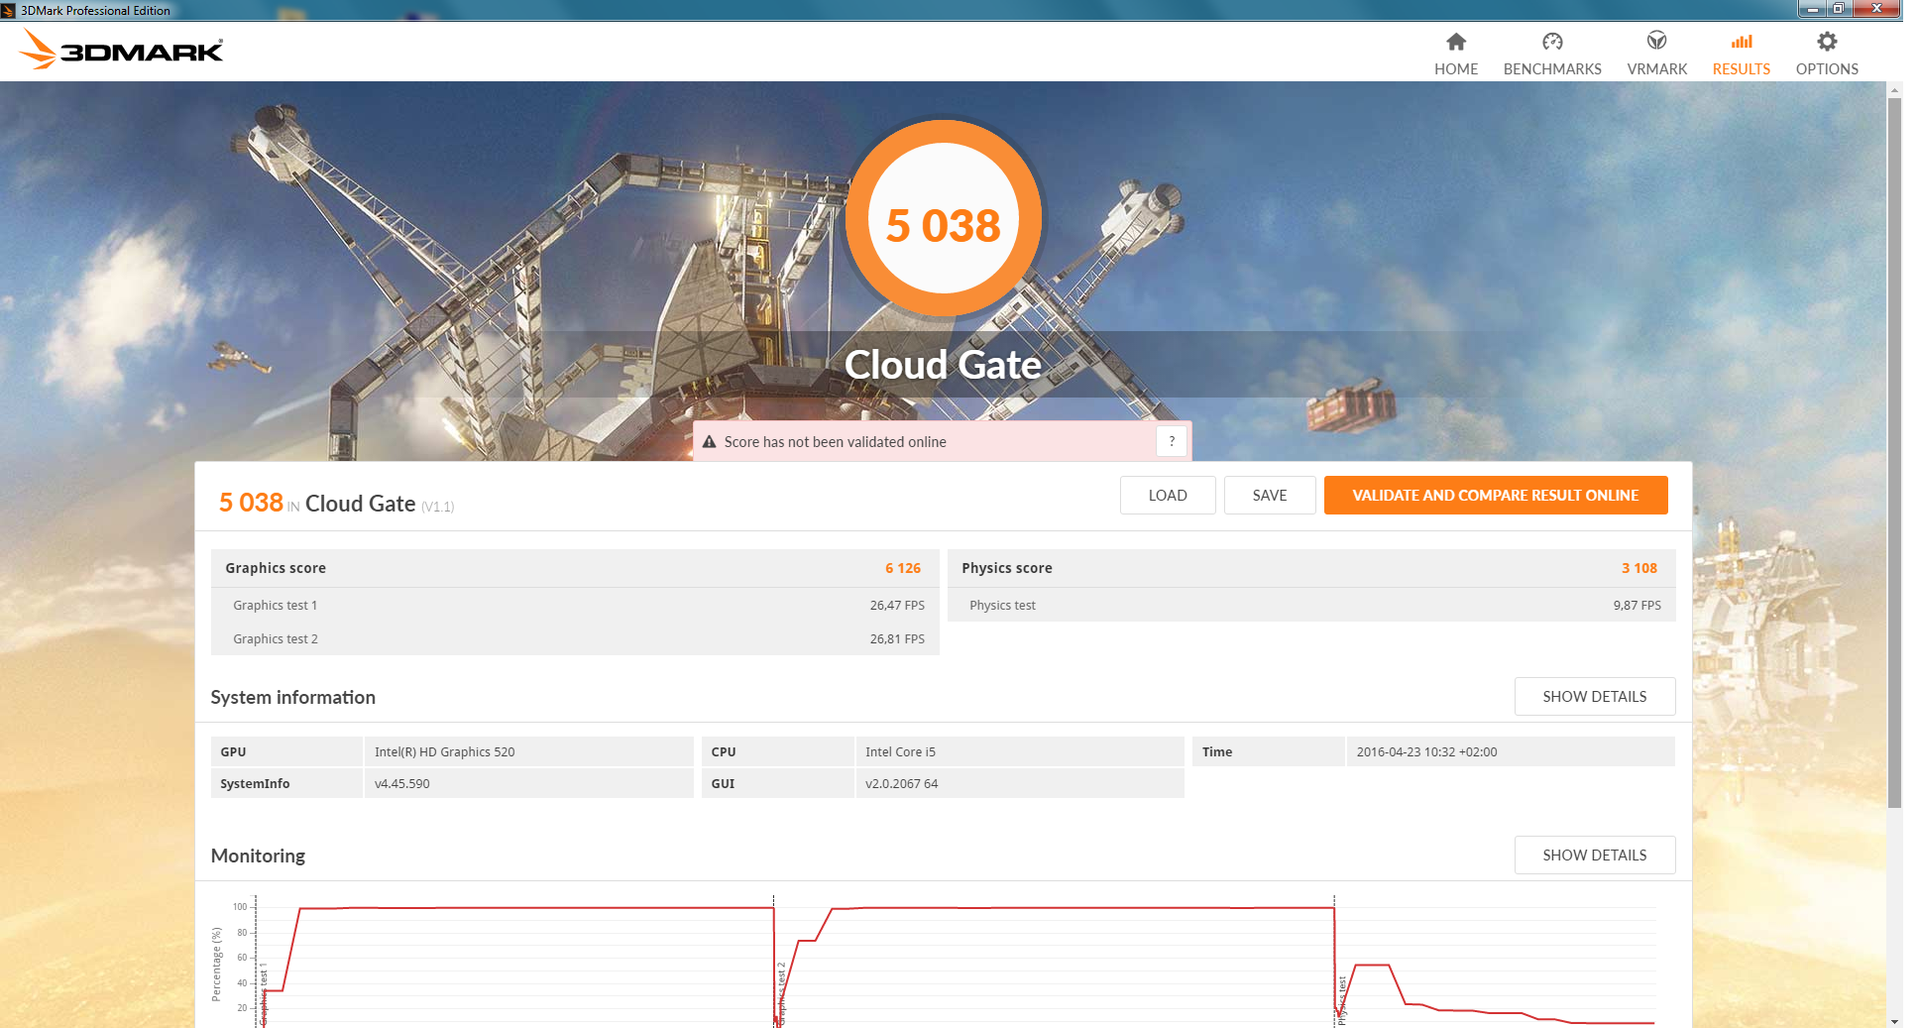
| 3DMark Cloud Gate Standard Score | 5038 points | |
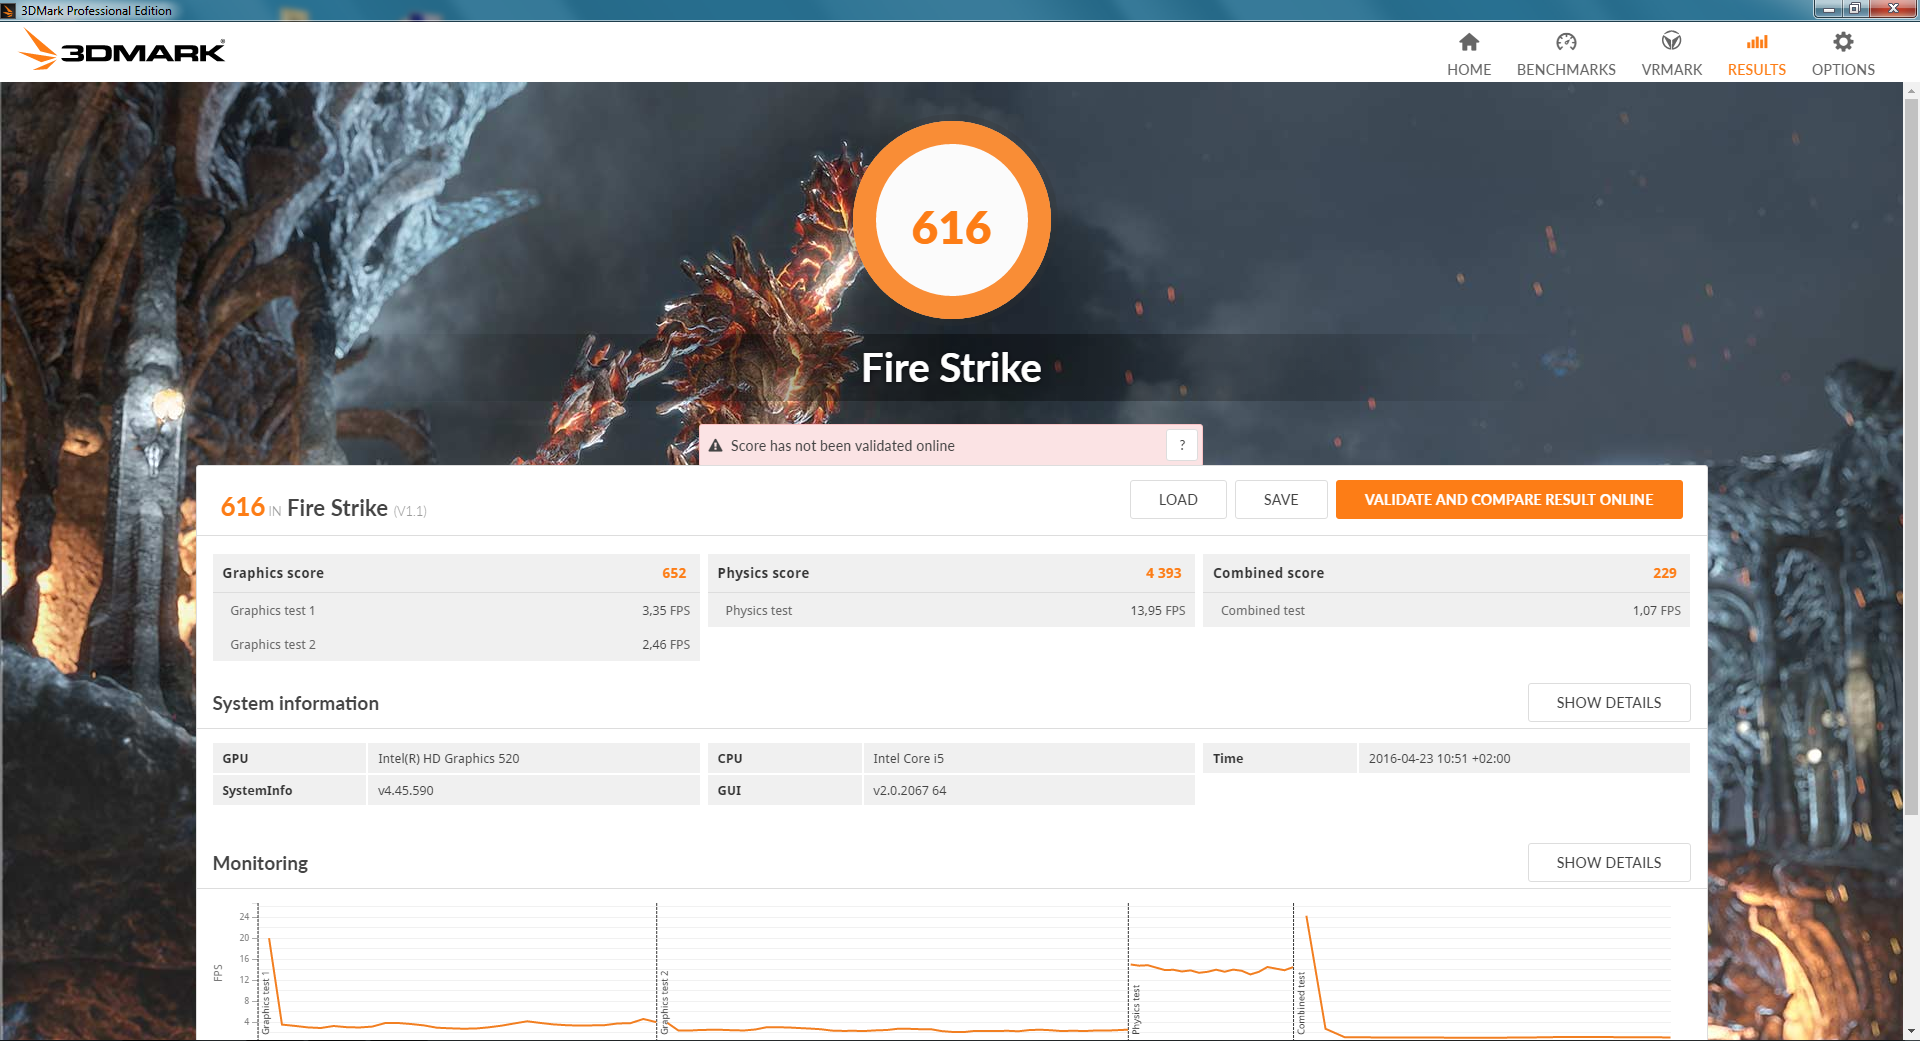
| 3DMark Fire Strike Score | 616 points | |
| 3DMark Fire Strike Extreme Score | 286 points | |
Help | ||
| low | med. | high | ultra | |
|---|---|---|---|---|
| BioShock Infinite (2013) | 35.9 | 20.6 | 16.8 | 5.1 |
| Battlefield 4 (2013) | 32.3 | 24.8 | 14.7 | 4.1 |
| Rise of the Tomb Raider (2016) | 11.2 | 8.7 | 4.2 |
| Lenovo ThinkPad L560-20F10026GE HD Graphics 520, 6200U, WDC Slim WD10SPCX-21KHST0 | Lenovo ThinkPad L540 20AV002YGE HD Graphics 4600, 4200M, Hitachi Travelstar Z7K500 HTS725050A7E630 | Lenovo ThinkPad L460-20FVS01400 Radeon R5 M330, 6500U, Toshiba HG6 THNSFJ256GCSU | Lenovo ThinkPad E550-20DF00CNGE Radeon R7 M265, 5500U, WDC Slim WD10SPCX-22HWST0 | HP ProBook 450 G3 HD Graphics 520, 6200U, Seagate ST500LM021-1KJ15 | Dell Inspiron 15-5558 GeForce 920M, 5200U, Toshiba MQ01ABD100 | |
|---|---|---|---|---|---|---|
| Noise | -6% | 1% | -1% | 1% | -20% | |
| off / environment * (dB) | 29.4 | 29.2 1% | ||||
| Idle Minimum * (dB) | 30.1 | 31.9 -6% | 29.2 3% | 29.8 1% | 29.7 1% | 33.5 -11% |
| Idle Average * (dB) | 30.1 | 32.4 -8% | 29.2 3% | 29.8 1% | 29.7 1% | 33.5 -11% |
| Idle Maximum * (dB) | 30.1 | 32.4 -8% | 29.2 3% | 31.1 -3% | 29.7 1% | 33.5 -11% |
| Load Average * (dB) | 33.4 | 34.8 -4% | 32.5 3% | 33.1 1% | 33.1 1% | 45.9 -37% |
| Load Maximum * (dB) | 34.7 | 36.1 -4% | 37.2 -7% | 35.6 -3% | 34.2 1% | 45.3 -31% |
* ... smaller is better
Noise level
| Idle |
| 30.1 / 30.1 / 30.1 dB(A) |
| Load |
| 33.4 / 34.7 dB(A) |
 | ||
30 dB silent 40 dB(A) audible 50 dB(A) loud |
||
min: | ||
(+) The maximum temperature on the upper side is 37.2 °C / 99 F, compared to the average of 34.3 °C / 94 F, ranging from 21.2 to 62.5 °C for the class Office.
(+) The bottom heats up to a maximum of 36 °C / 97 F, compared to the average of 36.8 °C / 98 F
(+) In idle usage, the average temperature for the upper side is 28.6 °C / 83 F, compared to the device average of 29.5 °C / 85 F.
(+) The palmrests and touchpad are cooler than skin temperature with a maximum of 29.2 °C / 84.6 F and are therefore cool to the touch.
(±) The average temperature of the palmrest area of similar devices was 27.5 °C / 81.5 F (-1.7 °C / -3.1 F).
| Lenovo ThinkPad L560-20F10026GE HD Graphics 520, 6200U, WDC Slim WD10SPCX-21KHST0 | Lenovo ThinkPad L540 20AV002YGE HD Graphics 4600, 4200M, Hitachi Travelstar Z7K500 HTS725050A7E630 | Lenovo ThinkPad L460-20FVS01400 Radeon R5 M330, 6500U, Toshiba HG6 THNSFJ256GCSU | Lenovo ThinkPad E550-20DF00CNGE Radeon R7 M265, 5500U, WDC Slim WD10SPCX-22HWST0 | HP ProBook 450 G3 HD Graphics 520, 6200U, Seagate ST500LM021-1KJ15 | Dell Inspiron 15-5558 GeForce 920M, 5200U, Toshiba MQ01ABD100 | Acer TravelMate P278-MG-76L2 GeForce 940M, 6500U, Lite-On CV1-8B256 | |
|---|---|---|---|---|---|---|---|
| Power Consumption | -60% | -2% | -11% | -5% | 3% | -62% | |
| Idle Minimum * (Watt) | 5 | 9.5 -90% | 3.1 38% | 4.1 18% | 4.9 2% | 4.3 14% | 5.8 -16% |
| Idle Average * (Watt) | 7.9 | 13.1 -66% | 6.3 20% | 6.7 15% | 8.2 -4% | 6.5 18% | 11.6 -47% |
| Idle Maximum * (Watt) | 8.6 | 13.4 -56% | 7.9 8% | 7.7 10% | 9 -5% | 7.4 14% | 13.6 -58% |
| Load Average * (Watt) | 27.5 | 38.6 -40% | 29.5 -7% | 37.6 -37% | 30.1 -9% | 33.3 -21% | 51 -85% |
| Load Maximum * (Watt) | 33.7 | 49.5 -47% | 57.3 -70% | 54.7 -62% | 36.1 -7% | 36.3 -8% | 69 -105% |
* ... smaller is better
| Off / Standby | |
| Idle | |
| Load |
|
Key:
min: | |

| Lenovo ThinkPad L560-20F10026GE 48 Wh | Lenovo ThinkPad L540 20AV002YGE 56 Wh | Lenovo ThinkPad L460-20FVS01400 48 Wh | Lenovo ThinkPad E550-20DF00CNGE 48 Wh | HP ProBook 450 G3 44 Wh | Dell Inspiron 15-5558 40 Wh | Acer TravelMate P278-MG-76L2 37 Wh | |
|---|---|---|---|---|---|---|---|
| Battery runtime | -28% | 29% | -10% | -9% | -3% | -11% | |
| Reader / Idle (h) | 11.6 | 6.5 -44% | 19.2 66% | 11.1 -4% | 9.6 -17% | 11.1 -4% | 10 -14% |
| H.264 (h) | 4.6 | 7.2 57% | 5.2 13% | 5.6 22% | 5.3 15% | 4.8 4% | |
| WiFi v1.3 (h) | 6.8 | 7.1 4% | 4.9 -28% | 5.2 -24% | 5.6 -18% | 5 -26% | |
| Load (h) | 1.8 | 1.6 -11% | 1.6 -11% | 1.4 -22% | 1.5 -17% | 1.7 -6% | 1.7 -6% |
| WiFi (h) | 5 |
Pros
Cons
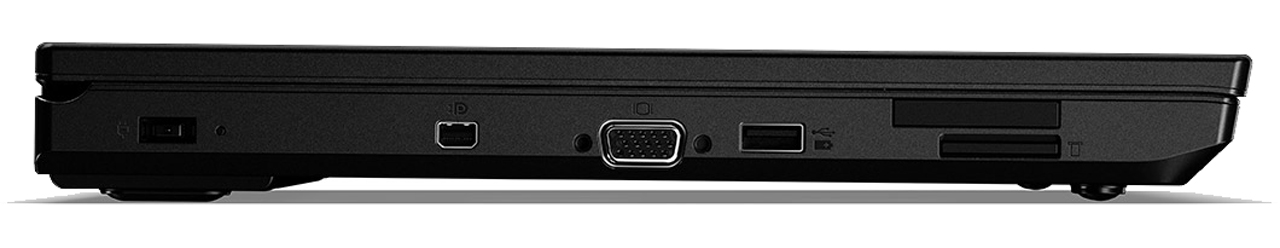
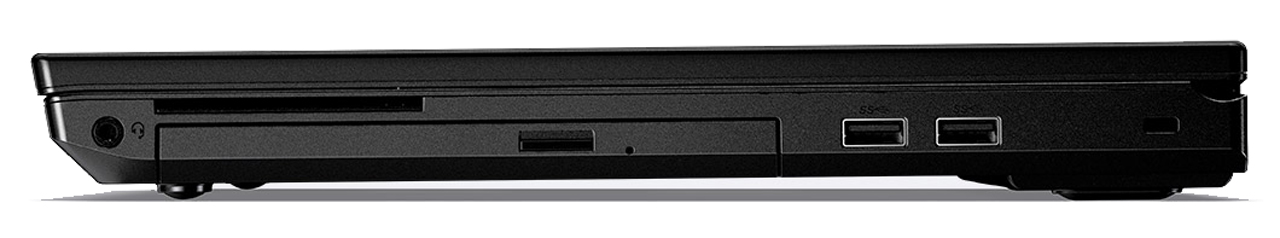
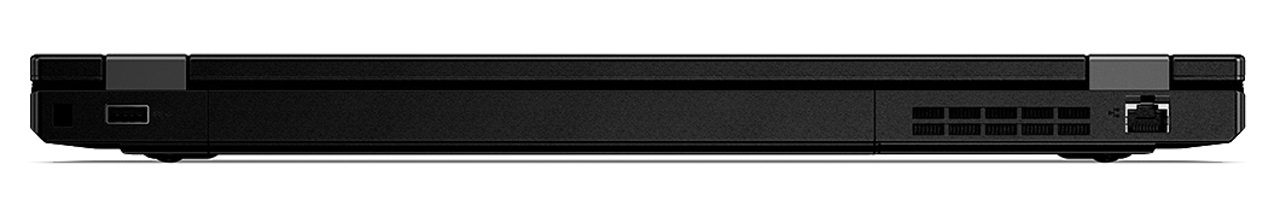
联想ThinkPad L560是ThinkPad L540实至名归的继任者。换了更节能的超低电压版处理器后,联想的这台设备几乎无可挑剔。更低的功耗带来了更好的电池续航表现。它不足1000欧元(约7328人民币)的定价也可以吸引更多的消费者。ThinkPad机型的可扩展性非常优秀,同时安全功能也没有减弱。优秀的接口布局设计让人无可挑剔。另外,它的连接性也可以通过拓展坞增强。
在从Haswell到Skylake的升级中,联想作出了正确的决定,不过ThinkPad L560缺少一些对细节的关注,让它没能成为出色的商务笔记本电脑。
不过,在屏幕上它表现较弱,有一些值得改进的地方。仅管它提供了宽广的可视角度范围,但在色域覆盖上只能算是一般。另外,它的屏幕亮度十分一般,让它很难适合在较强光线下使用。搭配固态硬盘应该可以提高系统性能。我们也希望它的键盘能够提供对背光的支持,让它的键盘在昏暗环境下容易看清。
仅管有一些小缺点,联想ThinkPad L560依然是一台优秀的商务笔记本电脑。节能的Skylake处理器在性能上足够满足日常使用的需要。对扩展坞或Trackpoint指点杆感到不可或缺的用户除了ThinkPad机型以外几乎没有别的选择。
注:本文是基于完整评测的缩减版本,阅读完整的英文评测,请点击这里。
Lenovo ThinkPad L560-20F10026GE
- 05/03/2016 v5.1 (old)
Sebastian Bade