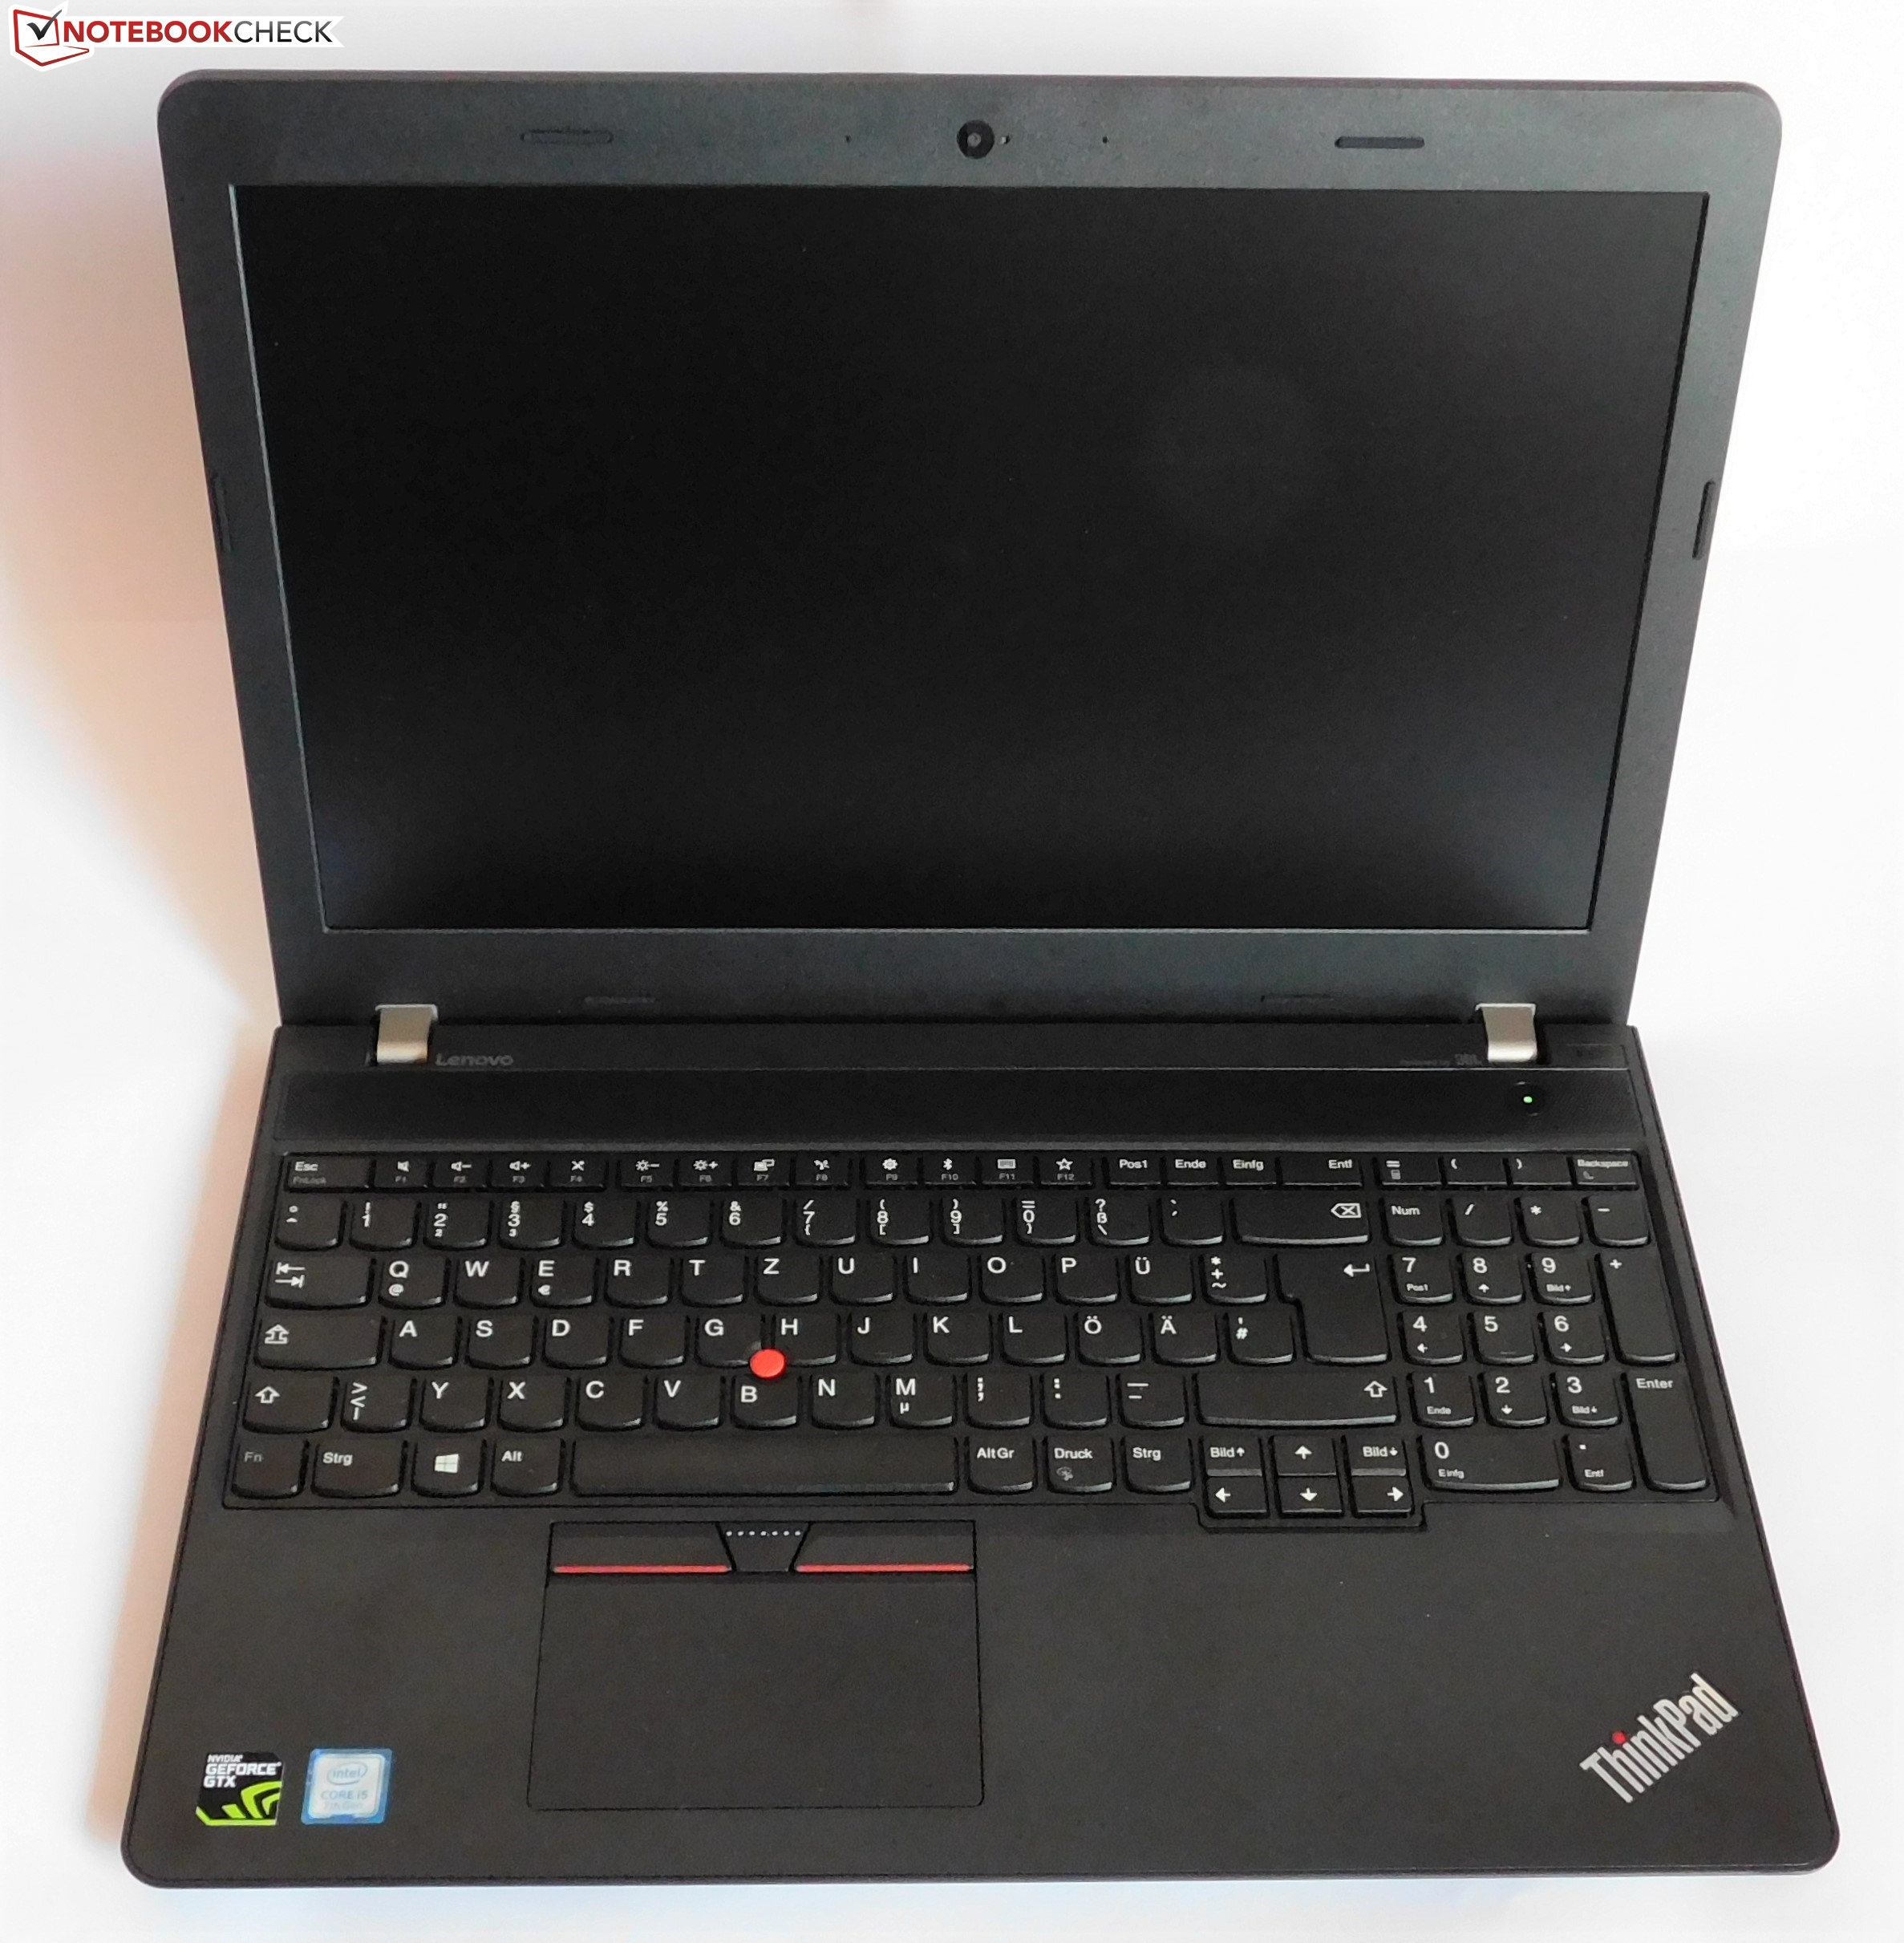
联想 ThinkPad E570 (酷睿 i5, GTX 950M) 笔记本电脑简短评测
| SD Card Reader | |
| average JPG Copy Test (av. of 3 runs) | |
| Dell XPS 13 9360 FHD i5 | |
| HP ProBook 450 G4 Y8B60EA | |
| Lenovo ThinkPad E570-20H6S00000 | |
| Dell Latitude 15-3570 | |
| maximum AS SSD Seq Read Test (1GB) | |
| Dell XPS 13 9360 FHD i5 | |
| HP ProBook 450 G4 Y8B60EA | |
| Lenovo ThinkPad E570-20H6S00000 | |
| Dell Latitude 15-3570 | |
| Networking | |
| iperf3 receive AX12 | |
| Lenovo ThinkPad E570-20H6S00000 | |
| Acer Spin 5 SP513-51 | |
| HP 15-ba077ng | |
| iperf3 transmit AX12 | |
| Lenovo ThinkPad E570-20H6S00000 | |
| Acer Spin 5 SP513-51 | |
| HP 15-ba077ng | |
| |||||||||||||||||||||||||
Brightness Distribution: 75 %
Center on Battery: 245 cd/m²
Contrast: 1008:1 (Black: 0.24 cd/m²)
ΔE ColorChecker Calman: 4.65 | ∀{0.5-29.43 Ø4.72}
ΔE Greyscale Calman: 3.39 | ∀{0.09-98 Ø4.97}
57.66% sRGB (Argyll 1.6.3 3D)
36.69% AdobeRGB 1998 (Argyll 1.6.3 3D)
39.94% AdobeRGB 1998 (Argyll 3D)
58% sRGB (Argyll 3D)
38.65% Display P3 (Argyll 3D)
Gamma: 2.7
CCT: 6246 K
| Lenovo ThinkPad E570-20H6S00000 AUO B156HAN04.4, , 1920x1080, 15.6" | Lenovo ThinkPad E560 20EV000XPB LG Display LEN40BA / LP156WF6-SPK1, , 1920x1080, 15.6" | HP ProBook 450 G4 Y8B60EA Chi Mei CMN15C4, , 1920x1080, 15.6" | Dell Latitude 15-3570 LG Philips LGD04AF / 156WHU, , 1366x768, 15.6" | Acer Aspire E5-575G-549D Chi Mei CMN15C4, , 1920x1080, 15.6" | Lenovo IdeaPad 510-15IKB 80SV0087GE BOE HF NV156FHM-N42, , 1920x1080, 15.6" | |
|---|---|---|---|---|---|---|
| Display | -7% | 3% | 5% | -0% | 10% | |
| Display P3 Coverage (%) | 38.65 | 36.05 -7% | 39.89 3% | 40.61 5% | 38.57 0% | 42.66 10% |
| sRGB Coverage (%) | 58 | 53.2 -8% | 59.5 3% | 61.1 5% | 57.4 -1% | 64.1 11% |
| AdobeRGB 1998 Coverage (%) | 39.94 | 37.4 -6% | 41.24 3% | 41.96 5% | 39.89 0% | 44.08 10% |
| Response Times | -16% | -14% | 10% | -31% | ||
| Response Time Grey 50% / Grey 80% * (ms) | 44.8 ? | 51 ? -14% | 37 ? 17% | 39 ? 13% | 51 ? -14% | |
| Response Time Black / White * (ms) | 25.6 ? | 30 ? -17% | 37 ? -45% | 24 ? 6% | 38 ? -48% | |
| PWM Frequency (Hz) | 50 ? | 50 ? | ||||
| Screen | -3% | -60% | -80% | -50% | 9% | |
| Brightness middle (cd/m²) | 242 | 332.2 37% | 214 -12% | 202 -17% | 176 -27% | 291 20% |
| Brightness (cd/m²) | 243 | 301 24% | 201 -17% | 211 -13% | 169 -30% | 265 9% |
| Brightness Distribution (%) | 75 | 80 7% | 77 3% | 88 17% | 91 21% | 86 15% |
| Black Level * (cd/m²) | 0.24 | 0.4 -67% | 0.43 -79% | 0.62 -158% | 0.47 -96% | 0.23 4% |
| Contrast (:1) | 1008 | 830 -18% | 498 -51% | 326 -68% | 374 -63% | 1265 25% |
| Colorchecker dE 2000 * | 4.65 | 10.68 -130% | 12.35 -166% | 8.83 -90% | 4.78 -3% | |
| Colorchecker dE 2000 max. * | 9.64 | 18.07 -87% | 19.9 -106% | 14.01 -45% | 9.51 1% | |
| Greyscale dE 2000 * | 3.39 | 11.32 -234% | 13.46 -297% | 8.97 -165% | 3.49 -3% | |
| Gamma | 2.7 81% | 2.26 97% | 2.44 90% | 2.43 91% | 2.58 85% | |
| CCT | 6246 104% | 12204 53% | 15217 43% | 10234 64% | 6013 108% | |
| Color Space (Percent of AdobeRGB 1998) (%) | 36.69 | 38 4% | 39 6% | 36.8 0% | 40 9% | |
| Color Space (Percent of sRGB) (%) | 57.66 | 59 2% | 61 6% | 57.3 -1% | 64 11% | |
| Total Average (Program / Settings) | -5% /
-5% | -24% /
-42% | -30% /
-54% | -13% /
-32% | -4% /
4% |
* ... smaller is better
Display Response Times
| ↔ Response Time Black to White | ||
|---|---|---|
| 25.6 ms ... rise ↗ and fall ↘ combined | ↗ 6.8 ms rise | 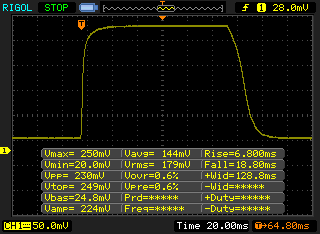 |
| ↘ 18.8 ms fall | ||
| The screen shows relatively slow response rates in our tests and may be too slow for gamers. In comparison, all tested devices range from 0.1 (minimum) to 240 (maximum) ms. » 61 % of all devices are better. This means that the measured response time is worse than the average of all tested devices (19.8 ms). | ||
| ↔ Response Time 50% Grey to 80% Grey | ||
| 44.8 ms ... rise ↗ and fall ↘ combined | ↗ 16.4 ms rise | 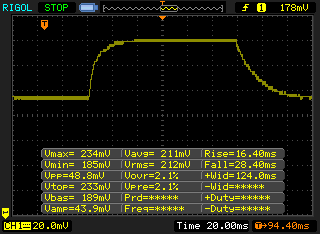 |
| ↘ 28.4 ms fall | ||
| The screen shows slow response rates in our tests and will be unsatisfactory for gamers. In comparison, all tested devices range from 0.165 (minimum) to 636 (maximum) ms. » 76 % of all devices are better. This means that the measured response time is worse than the average of all tested devices (31 ms). | ||
Screen Flickering / PWM (Pulse-Width Modulation)
| Screen flickering / PWM not detected | ||
In comparison: 52 % of all tested devices do not use PWM to dim the display. If PWM was detected, an average of 7769 (minimum: 5 - maximum: 343500) Hz was measured. | ||
| Cinebench R15 | |
| CPU Single 64Bit | |
| Lenovo IdeaPad 510-15IKB 80SV0087GE | |
| HP ProBook 450 G4 Y8B60EA | |
| Lenovo ThinkPad E560 20EV000XPB | |
| Acer Aspire E5-575G-549D | |
| Lenovo ThinkPad E570-20H6S00000 | |
| Dell Latitude 15-3570 | |
| CPU Multi 64Bit | |
| HP ProBook 450 G4 Y8B60EA | |
| Lenovo IdeaPad 510-15IKB 80SV0087GE | |
| Acer Aspire E5-575G-549D | |
| Lenovo ThinkPad E570-20H6S00000 | |
| Lenovo ThinkPad E560 20EV000XPB | |
| Dell Latitude 15-3570 | |
| PCMark 8 | |
| Home Score Accelerated v2 | |
| Lenovo IdeaPad 510-15IKB 80SV0087GE | |
| Lenovo ThinkPad E570-20H6S00000 | |
| Dell Latitude 15-3570 | |
| HP ProBook 450 G4 Y8B60EA | |
| Acer Aspire E5-575G-549D | |
| Work Score Accelerated v2 | |
| HP ProBook 450 G4 Y8B60EA | |
| Lenovo ThinkPad E570-20H6S00000 | |
| Dell Latitude 15-3570 | |
| Acer Aspire E5-575G-549D | |
| PCMark 8 Home Score Accelerated v2 | 3550 points | |
| PCMark 8 Work Score Accelerated v2 | 4666 points | |
Help | ||
| Lenovo ThinkPad E570-20H6S00000 Toshiba THNSF5256GPUK | Lenovo ThinkPad E560 20EV000XPB Samsung CM871 MZ7LF192HCGS | HP ProBook 450 G4 Y8B60EA SanDisk SD8SNAT256G1002 | Dell Latitude 15-3570 Samsung CM871 MZNLF128HCHP | Lenovo IdeaPad 510-15IKB 80SV0087GE Liteonit CV3-DE256 | |
|---|---|---|---|---|---|
| AS SSD | -70% | -46% | -75% | -33% | |
| Seq Read (MB/s) | 1227 | 489.5 -60% | 493.8 -60% | 489.1 -60% | 479.8 -61% |
| Seq Write (MB/s) | 636 | 169.9 -73% | 315.9 -50% | 130 -80% | 377.8 -41% |
| 4K Read (MB/s) | 37.12 | 17.46 -53% | 17.96 -52% | 17.25 -54% | 32.4 -13% |
| 4K Write (MB/s) | 73.1 | 34.76 -52% | 73.4 0% | 21.57 -70% | 59.7 -18% |
| 4K-64 Read (MB/s) | 654 | 84.6 -87% | 137.1 -79% | 81.8 -87% | 345.5 -47% |
| 4K-64 Write (MB/s) | 232.5 | 33.68 -86% | 195.5 -16% | 19.37 -92% | 203.7 -12% |
| Score Total (Points) | 1578 | 305 -81% | 607 -62% | 267 -83% | 951 -40% |

| 3DMark 11 - 1280x720 Performance GPU | |
| Acer Aspire E5-575G-549D | |
| Lenovo ThinkPad E570-20H6S00000 | |
| Lenovo ThinkPad E560 20EV000XPB | |
| Lenovo IdeaPad 510-15IKB 80SV0087GE | |
| HP ProBook 450 G4 Y8B60EA | |
| Dell Latitude 15-3570 | |
| 3DMark | |
| 1280x720 Cloud Gate Standard Graphics | |
| Acer Aspire E5-575G-549D | |
| Lenovo ThinkPad E570-20H6S00000 | |
| Lenovo ThinkPad E560 20EV000XPB | |
| HP ProBook 450 G4 Y8B60EA | |
| Dell Latitude 15-3570 | |
| 1920x1080 Fire Strike Graphics | |
| Acer Aspire E5-575G-549D | |
| Lenovo ThinkPad E570-20H6S00000 | |
| Lenovo ThinkPad E560 20EV000XPB | |
| HP ProBook 450 G4 Y8B60EA | |
| 3DMark 11 Performance | 4255 points | |
| 3DMark Cloud Gate Standard Score | 10297 points | |
| 3DMark Fire Strike Score | 3244 points | |
Help | ||
| low | med. | high | ultra | |
|---|---|---|---|---|
| BioShock Infinite (2013) | 138.1 | 95.4 | 86.8 | 35.66 |
| Company of Heroes 2 (2013) | 47.25 | 40.03 | 27.41 | 16.89 |
| Rise of the Tomb Raider (2016) | 71.4 | 40.32 | 21.2 |
Noise level
| Idle |
| 29 / 29 / 29 dB(A) |
| Load |
| 34.3 / 40.1 dB(A) |
 | ||
30 dB silent 40 dB(A) audible 50 dB(A) loud |
||
min: | ||
(-) The maximum temperature on the upper side is 46.6 °C / 116 F, compared to the average of 36.8 °C / 98 F, ranging from 21 to 71 °C for the class Multimedia.
(-) The bottom heats up to a maximum of 49.1 °C / 120 F, compared to the average of 39.1 °C / 102 F
(+) In idle usage, the average temperature for the upper side is 23.1 °C / 74 F, compared to the device average of 31.3 °C / 88 F.
(+) The palmrests and touchpad are reaching skin temperature as a maximum (35.3 °C / 95.5 F) and are therefore not hot.
(-) The average temperature of the palmrest area of similar devices was 28.7 °C / 83.7 F (-6.6 °C / -11.8 F).
Lenovo ThinkPad E570-20H6S00000 audio analysis
(±) | speaker loudness is average but good (80.7 dB)
Bass 100 - 315 Hz
(-) | nearly no bass - on average 16.8% lower than median
(-) | bass is not linear (16.4% delta to prev. frequency)
Mids 400 - 2000 Hz
(±) | higher mids - on average 5.1% higher than median
(±) | linearity of mids is average (9.5% delta to prev. frequency)
Highs 2 - 16 kHz
(+) | balanced highs - only 2.7% away from median
(+) | highs are linear (6.5% delta to prev. frequency)
Overall 100 - 16.000 Hz
(±) | linearity of overall sound is average (19.6% difference to median)
Compared to same class
» 64% of all tested devices in this class were better, 7% similar, 29% worse
» The best had a delta of 5%, average was 17%, worst was 45%
Compared to all devices tested
» 49% of all tested devices were better, 7% similar, 44% worse
» The best had a delta of 4%, average was 24%, worst was 134%
Apple MacBook 12 (Early 2016) 1.1 GHz audio analysis
(+) | speakers can play relatively loud (83.6 dB)
Bass 100 - 315 Hz
(±) | reduced bass - on average 11.3% lower than median
(±) | linearity of bass is average (14.2% delta to prev. frequency)
Mids 400 - 2000 Hz
(+) | balanced mids - only 2.4% away from median
(+) | mids are linear (5.5% delta to prev. frequency)
Highs 2 - 16 kHz
(+) | balanced highs - only 2% away from median
(+) | highs are linear (4.5% delta to prev. frequency)
Overall 100 - 16.000 Hz
(+) | overall sound is linear (10.2% difference to median)
Compared to same class
» 7% of all tested devices in this class were better, 2% similar, 91% worse
» The best had a delta of 5%, average was 18%, worst was 53%
Compared to all devices tested
» 5% of all tested devices were better, 1% similar, 94% worse
» The best had a delta of 4%, average was 24%, worst was 134%
| Off / Standby | |
| Idle | |
| Load |
|
Key:
min: | |
| Lenovo ThinkPad E570-20H6S00000 i5-7200U, GeForce GTX 950M, Toshiba THNSF5256GPUK, IPS LED, 1920x1080, 15.6" | Lenovo ThinkPad E560 20EV000XPB 6500U, Radeon R7 M370, Samsung CM871 MZ7LF192HCGS, IPS, 1920x1080, 15.6" | HP ProBook 450 G4 Y8B60EA i7-7500U, GeForce 930MX, SanDisk SD8SNAT256G1002, TN LED, 1920x1080, 15.6" | Dell Latitude 15-3570 6200U, HD Graphics 520, Samsung CM871 MZNLF128HCHP, TN LED, 1366x768, 15.6" | Acer Aspire E5-575G-549D i5-7200U, GeForce GTX 950M, Toshiba MQ01ABD100, TN, 1920x1080, 15.6" | Lenovo IdeaPad 510-15IKB 80SV0087GE i7-7500U, GeForce 940MX, Liteonit CV3-DE256, IPS, 1920x1080, 15.6" | |
|---|---|---|---|---|---|---|
| Power Consumption | -29% | -9% | 3% | -41% | -8% | |
| Idle Minimum * (Watt) | 2.8 | 3.6 -29% | 3.8 -36% | 4.9 -75% | 6 -114% | 3.9 -39% |
| Idle Average * (Watt) | 6.3 | 8.7 -38% | 6.6 -5% | 7.2 -14% | 8.1 -29% | 7.4 -17% |
| Idle Maximum * (Watt) | 6.9 | 11.5 -67% | 11.3 -64% | 7.5 -9% | 9.8 -42% | 9.5 -38% |
| Load Average * (Watt) | 51.6 | 61.9 -20% | 38 26% | 25.4 51% | 52.5 -2% | 41 21% |
| Load Maximum * (Watt) | 69.7 | 64.8 7% | 45 35% | 28 60% | 81.6 -17% | 48 31% |
* ... smaller is better
| Lenovo ThinkPad E570-20H6S00000 i5-7200U, GeForce GTX 950M, 41 Wh | Lenovo ThinkPad E560 20EV000XPB 6500U, Radeon R7 M370, 48 Wh | HP ProBook 450 G4 Y8B60EA i7-7500U, GeForce 930MX, 45 Wh | Dell Latitude 15-3570 6200U, HD Graphics 520, 65 Wh | Acer Aspire E5-575G-549D i5-7200U, GeForce GTX 950M, 62 Wh | Lenovo IdeaPad 510-15IKB 80SV0087GE i7-7500U, GeForce 940MX, 30 Wh | |
|---|---|---|---|---|---|---|
| Battery runtime | -10% | -3% | 17% | -19% | -40% | |
| Reader / Idle (h) | 14.7 | 13.2 -10% | 12.4 -16% | 17.1 16% | 12.8 -13% | |
| WiFi v1.3 (h) | 7.7 | 8.6 12% | 9 17% | 7.5 -3% | 4.6 -40% | |
| Load (h) | 2.2 | 2.1 -5% | 2.6 18% | 1.3 -41% | ||
| WiFi (h) | 5.5 | |||||
| H.264 (h) | 7.7 |
Pros
Cons

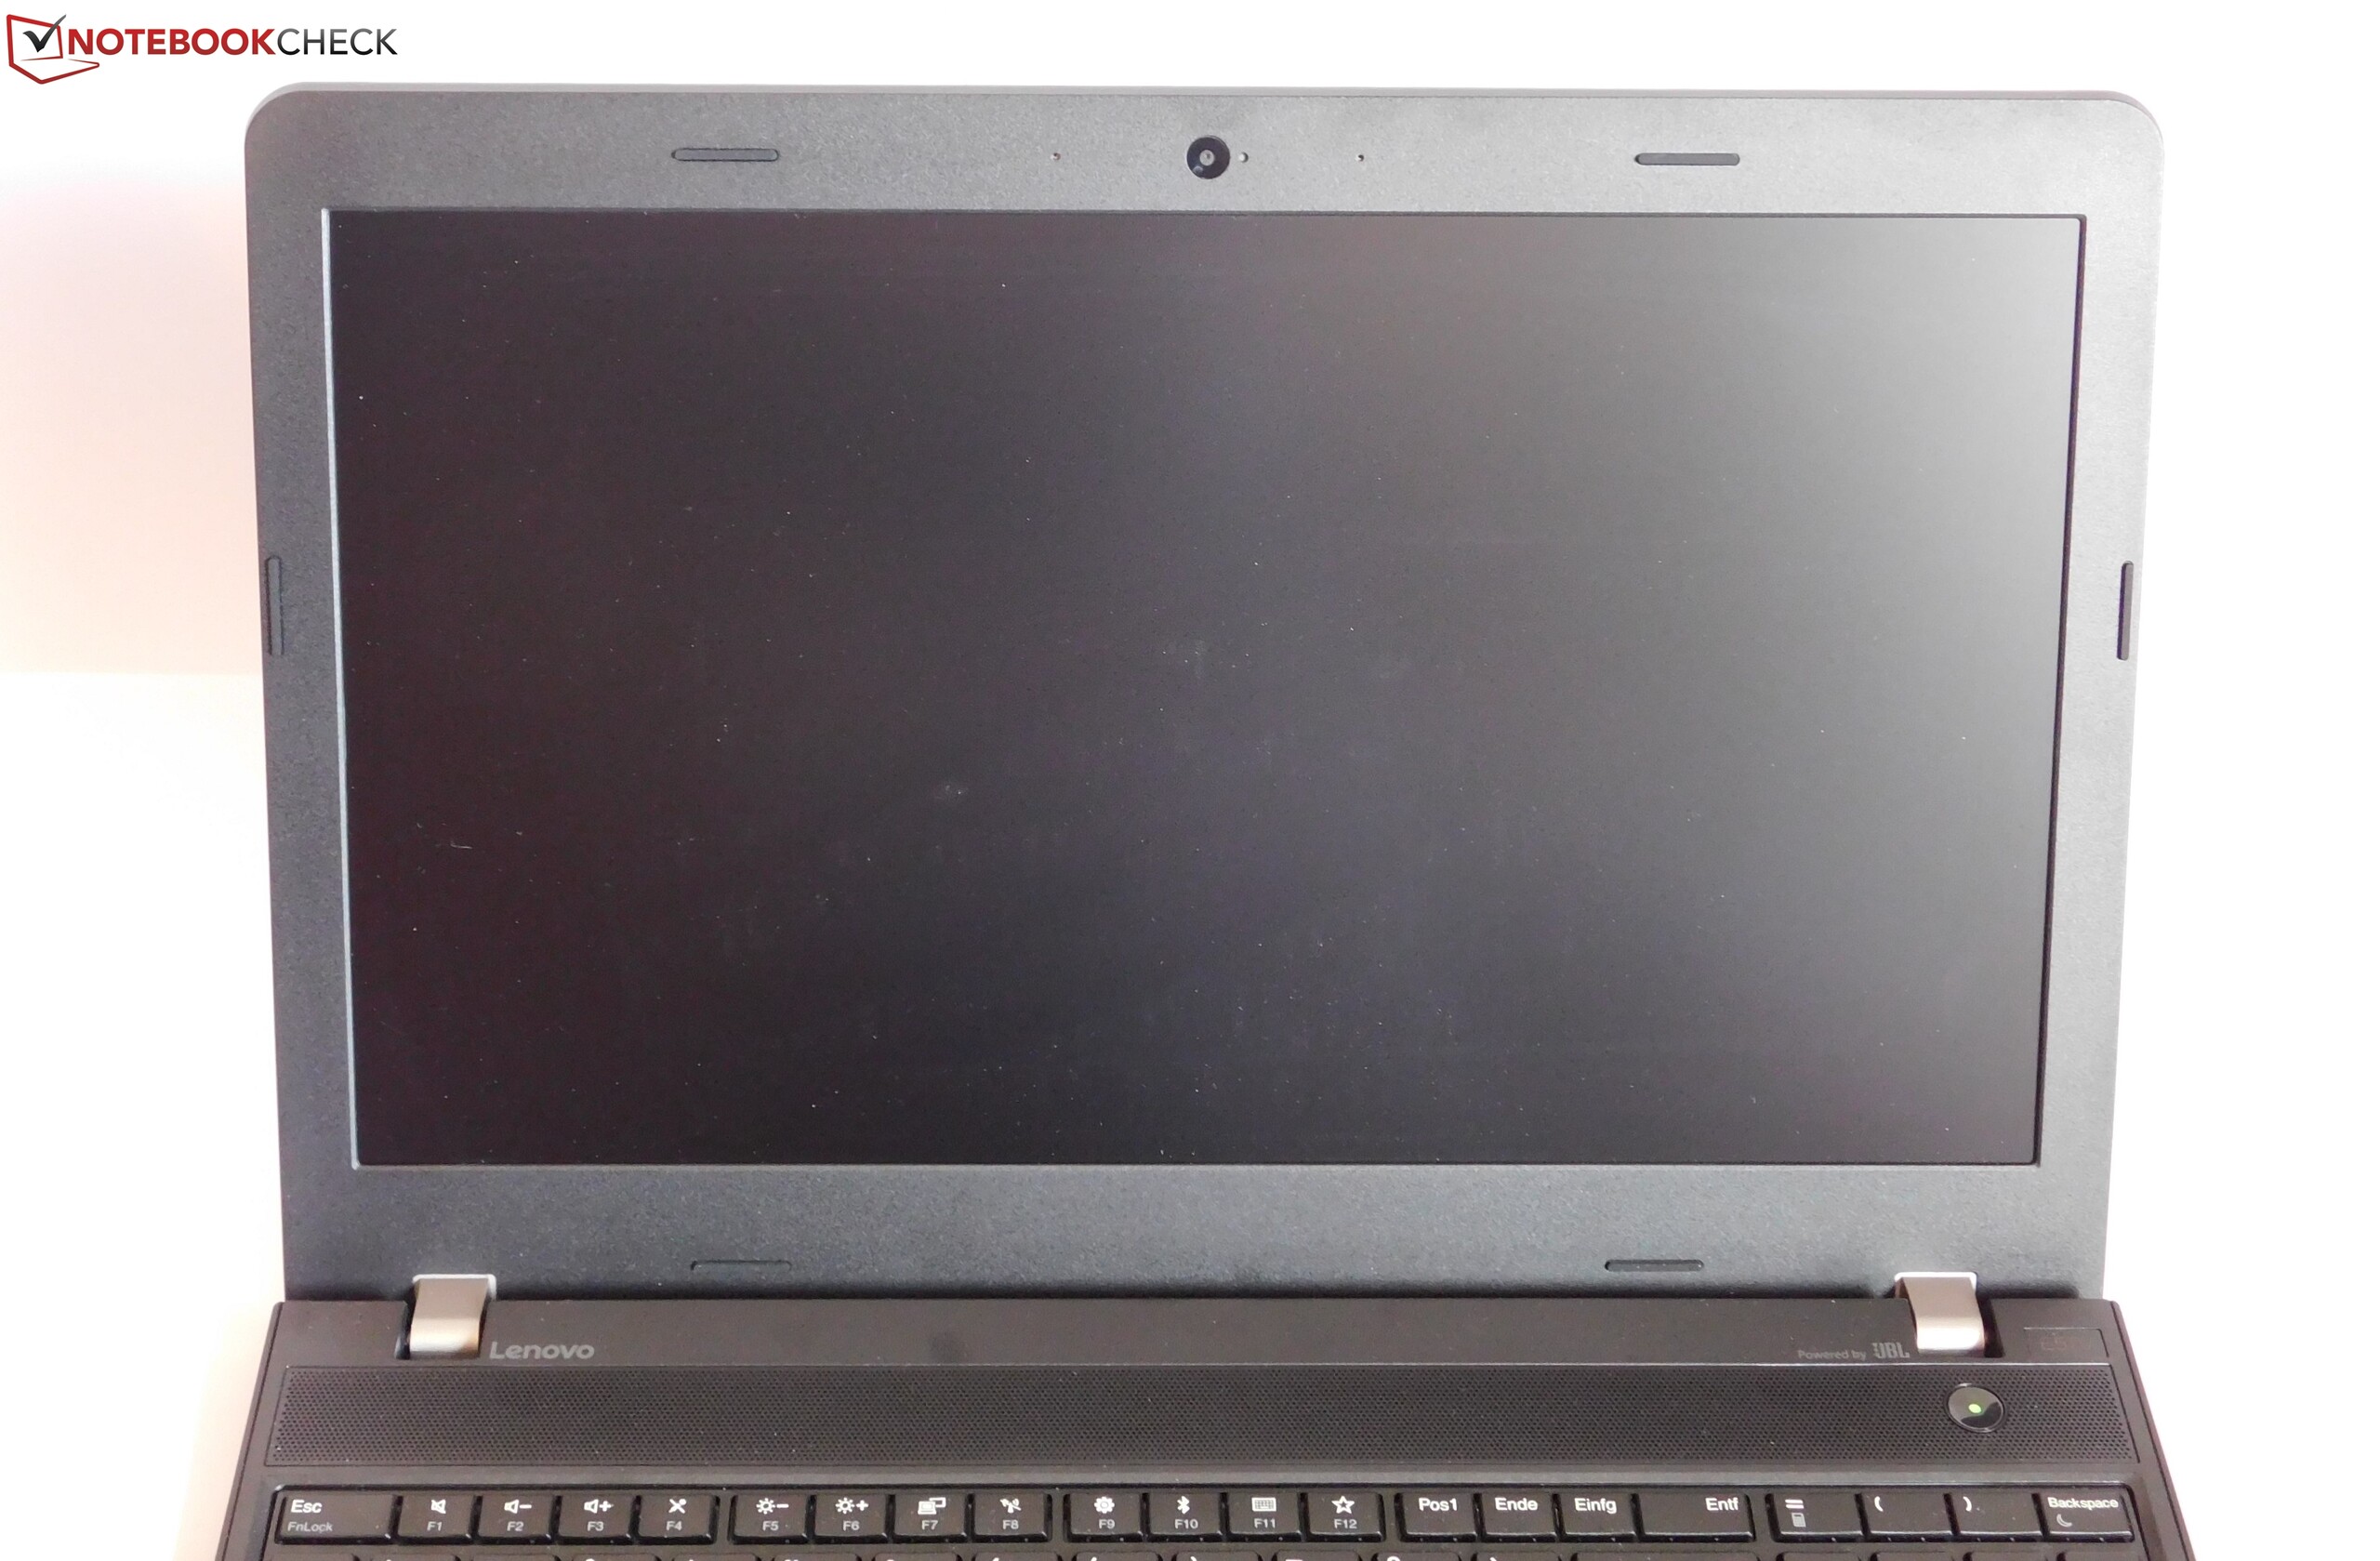
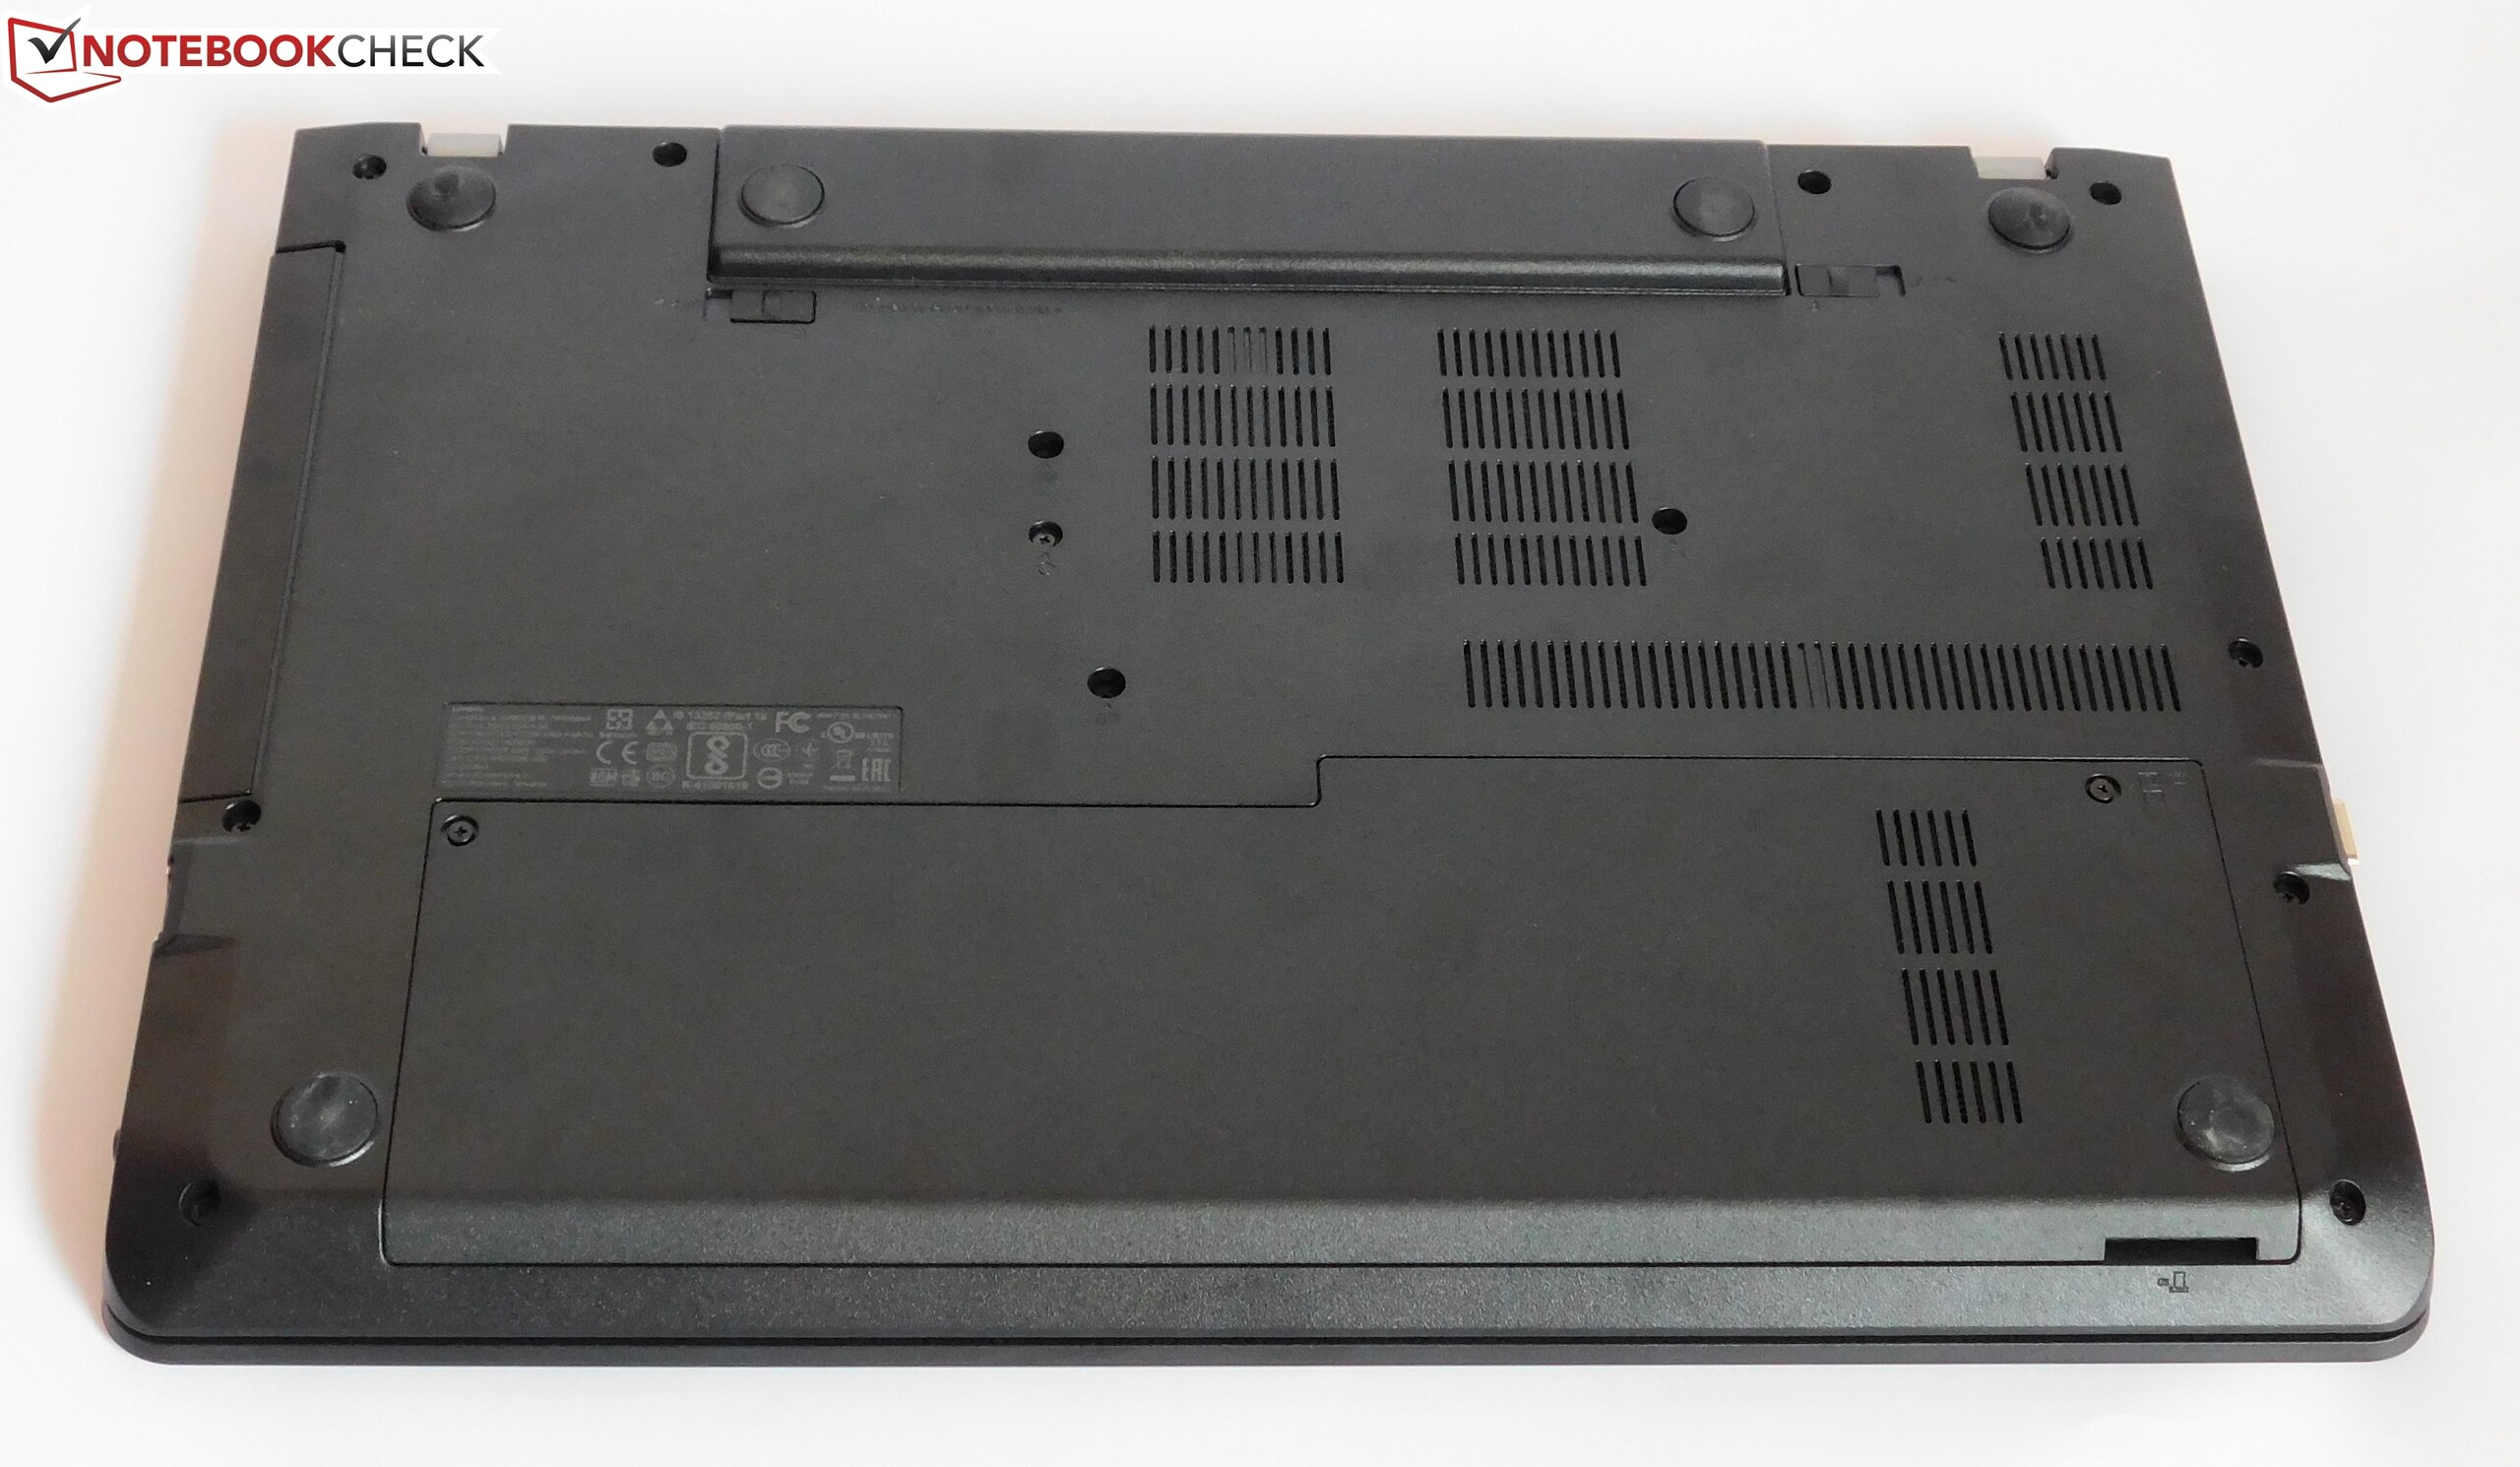
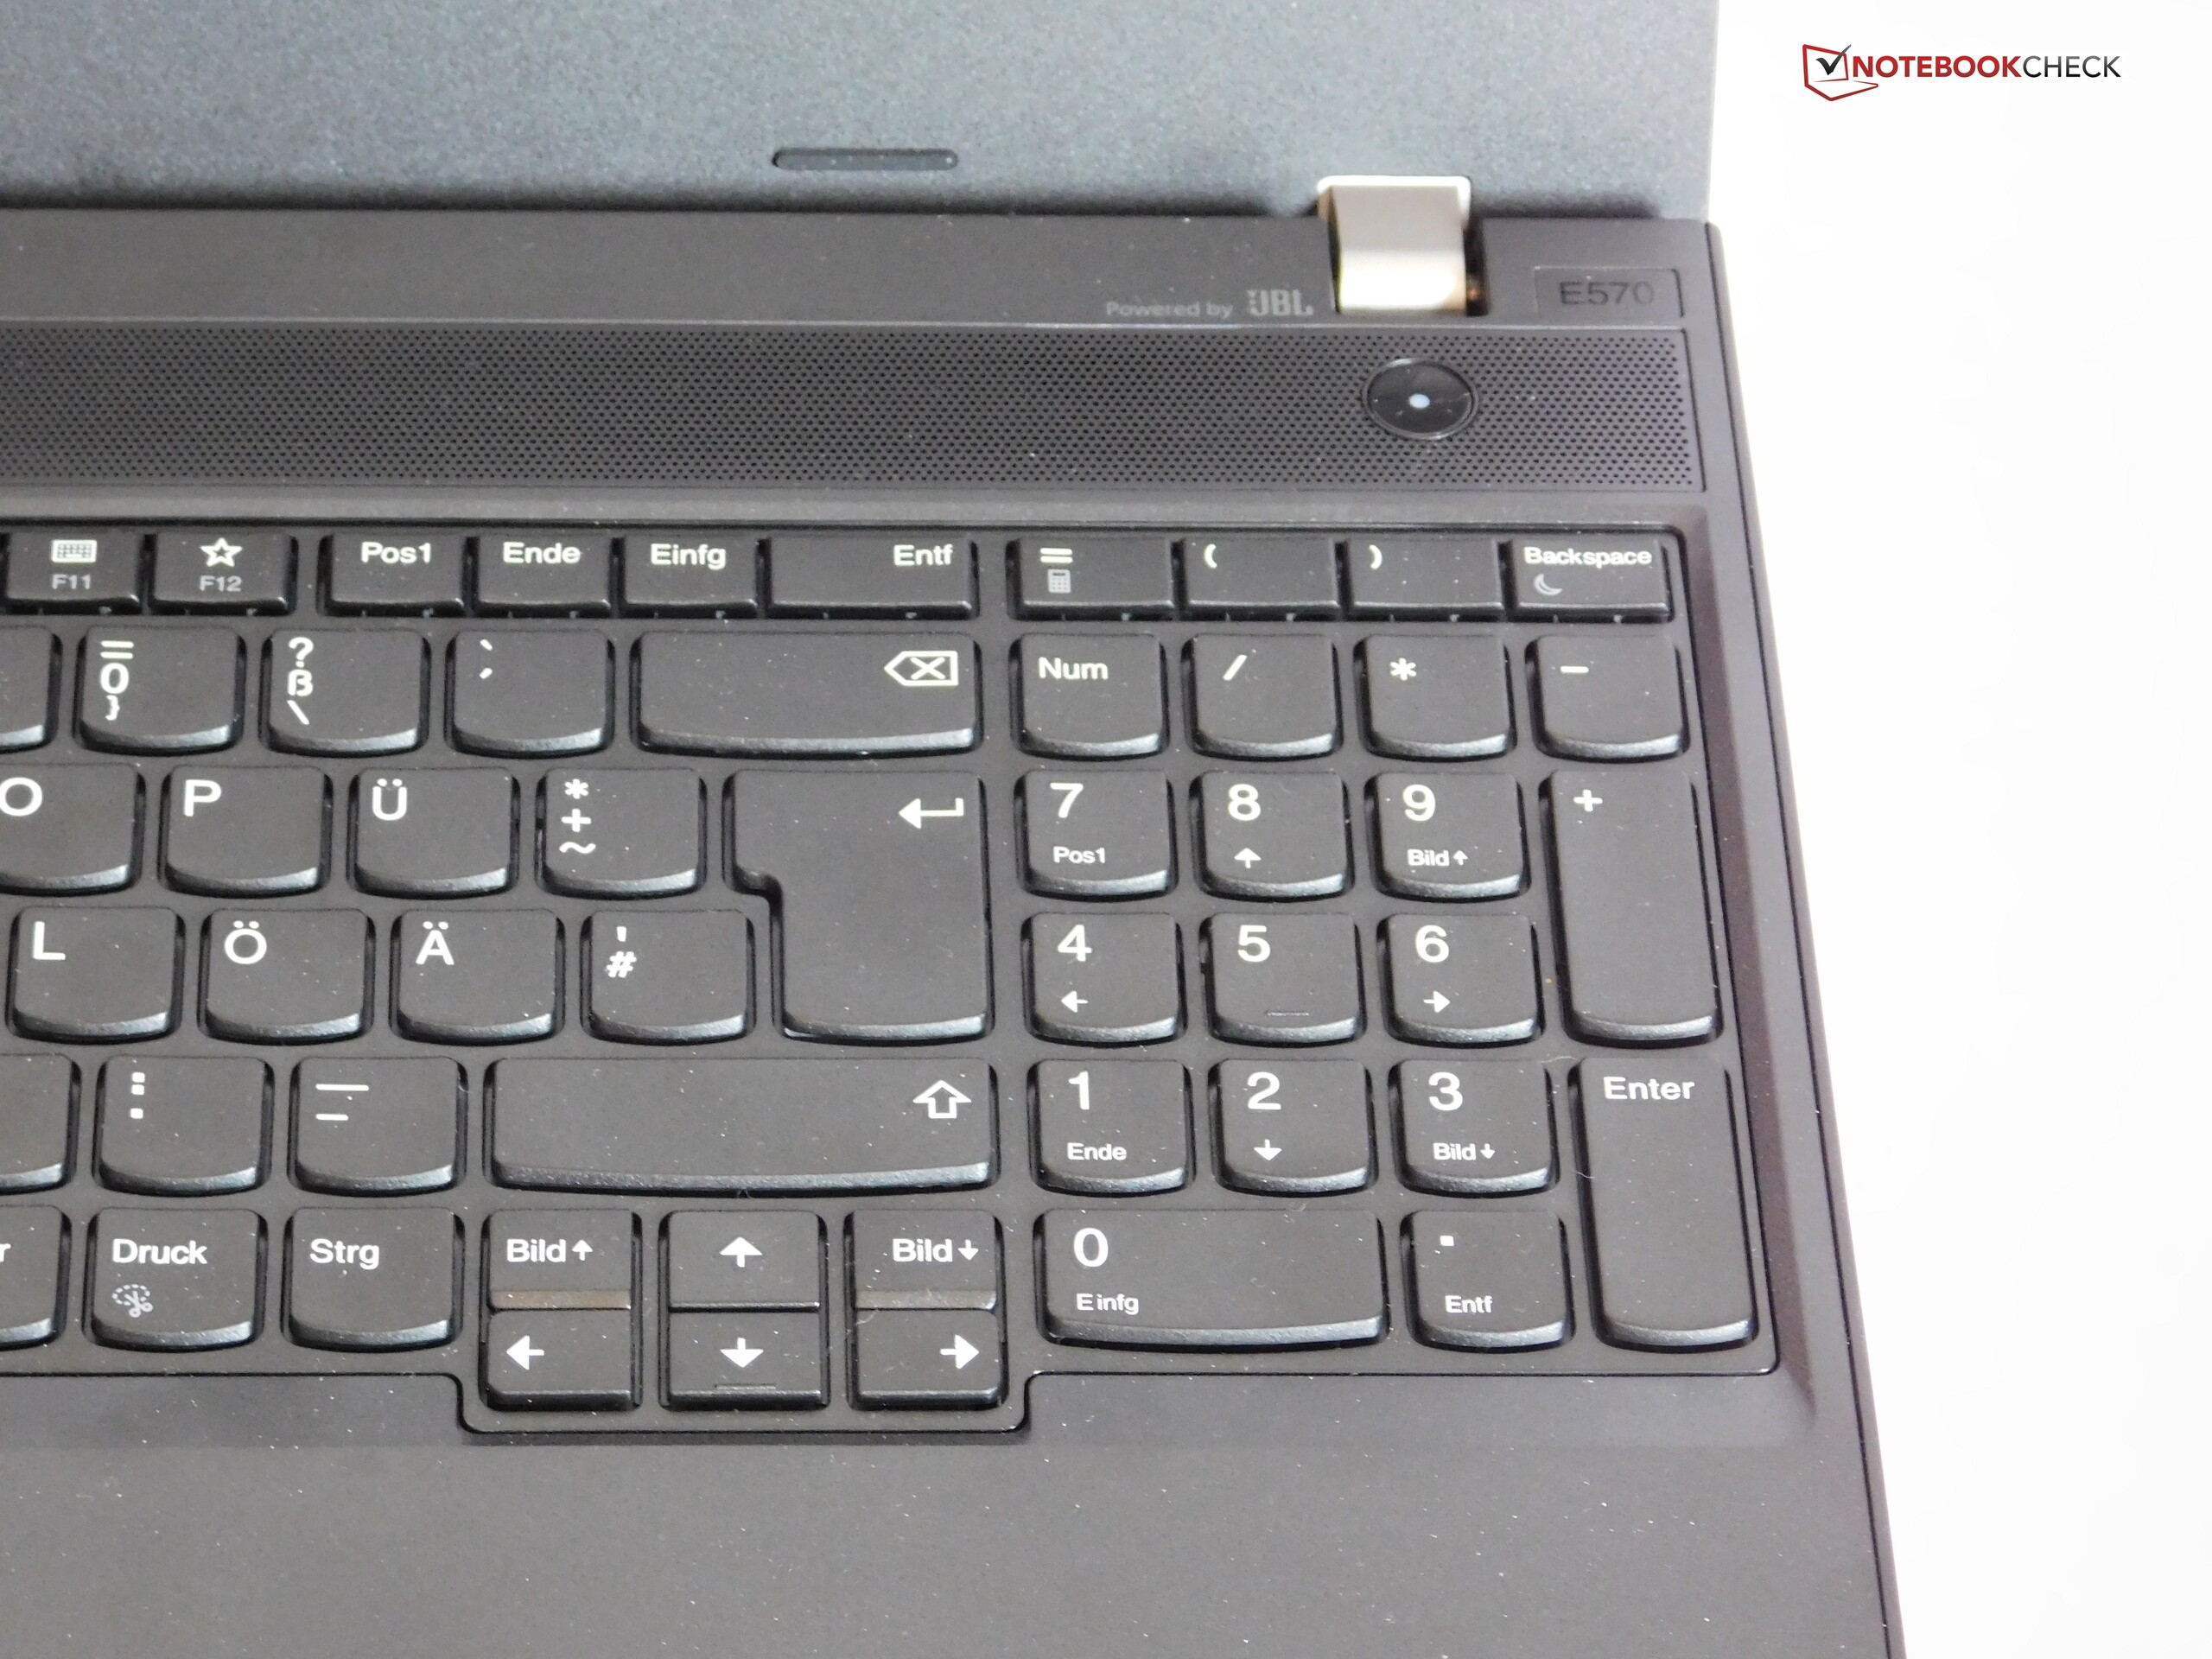
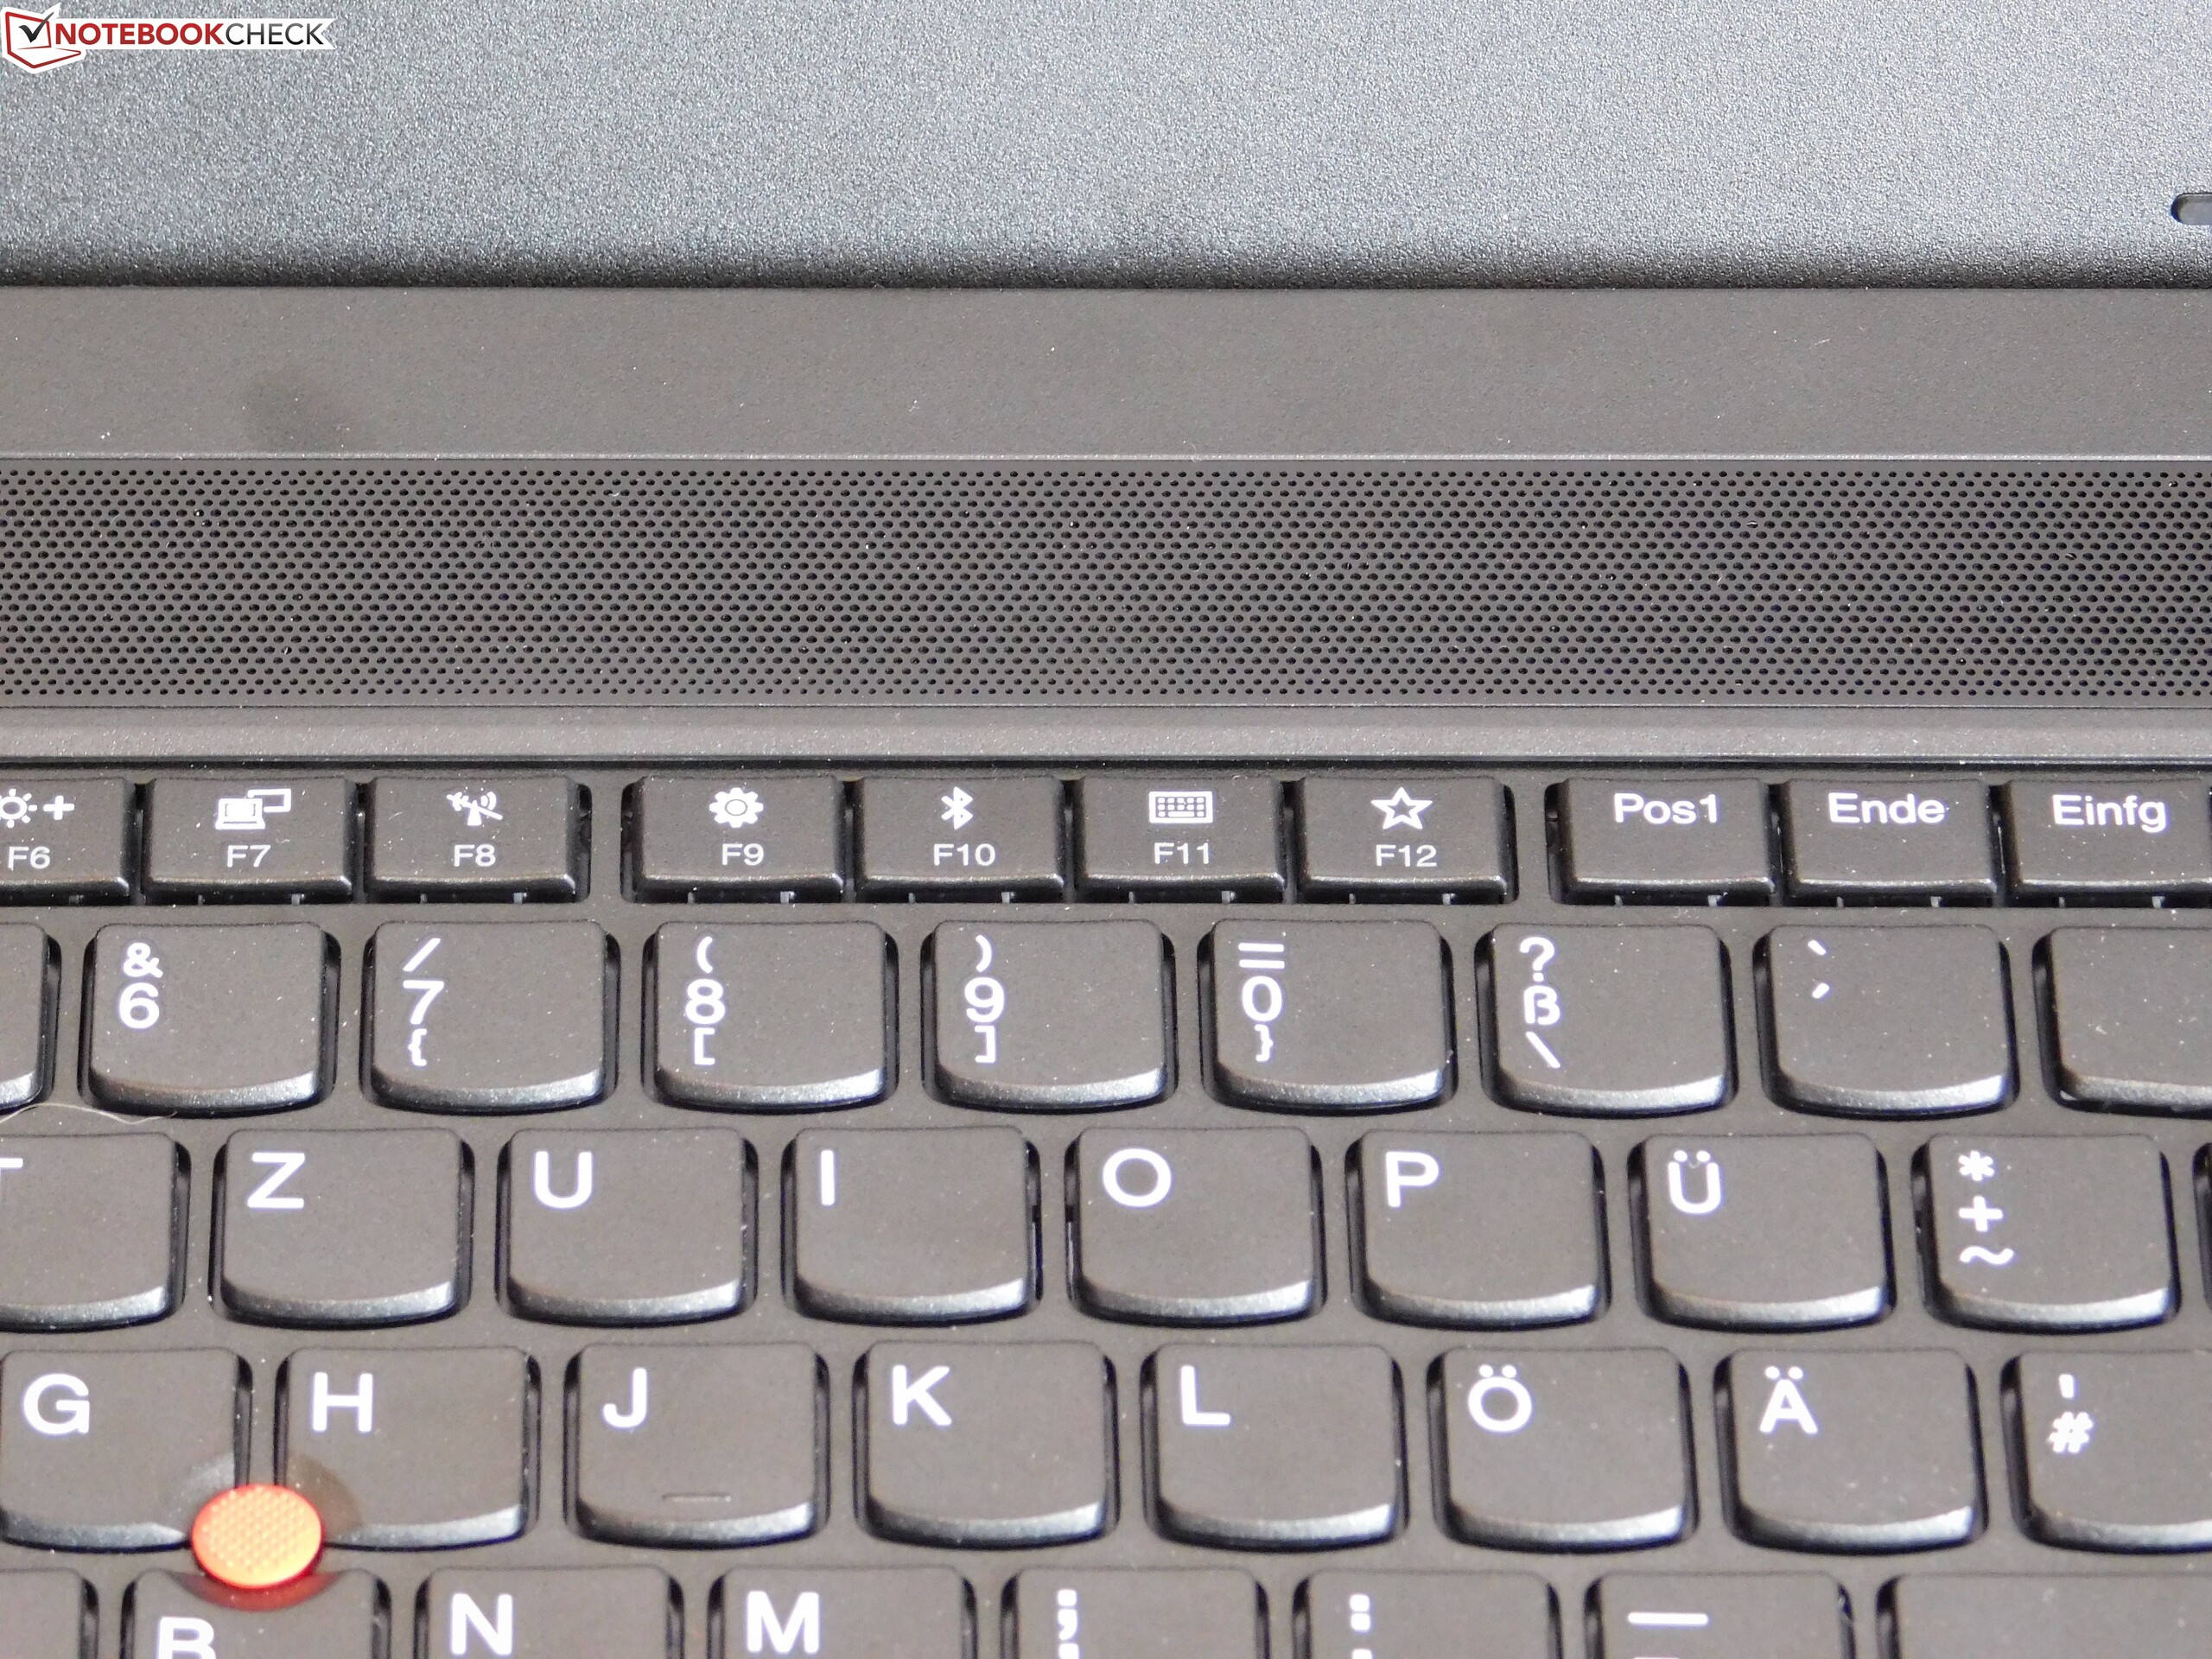
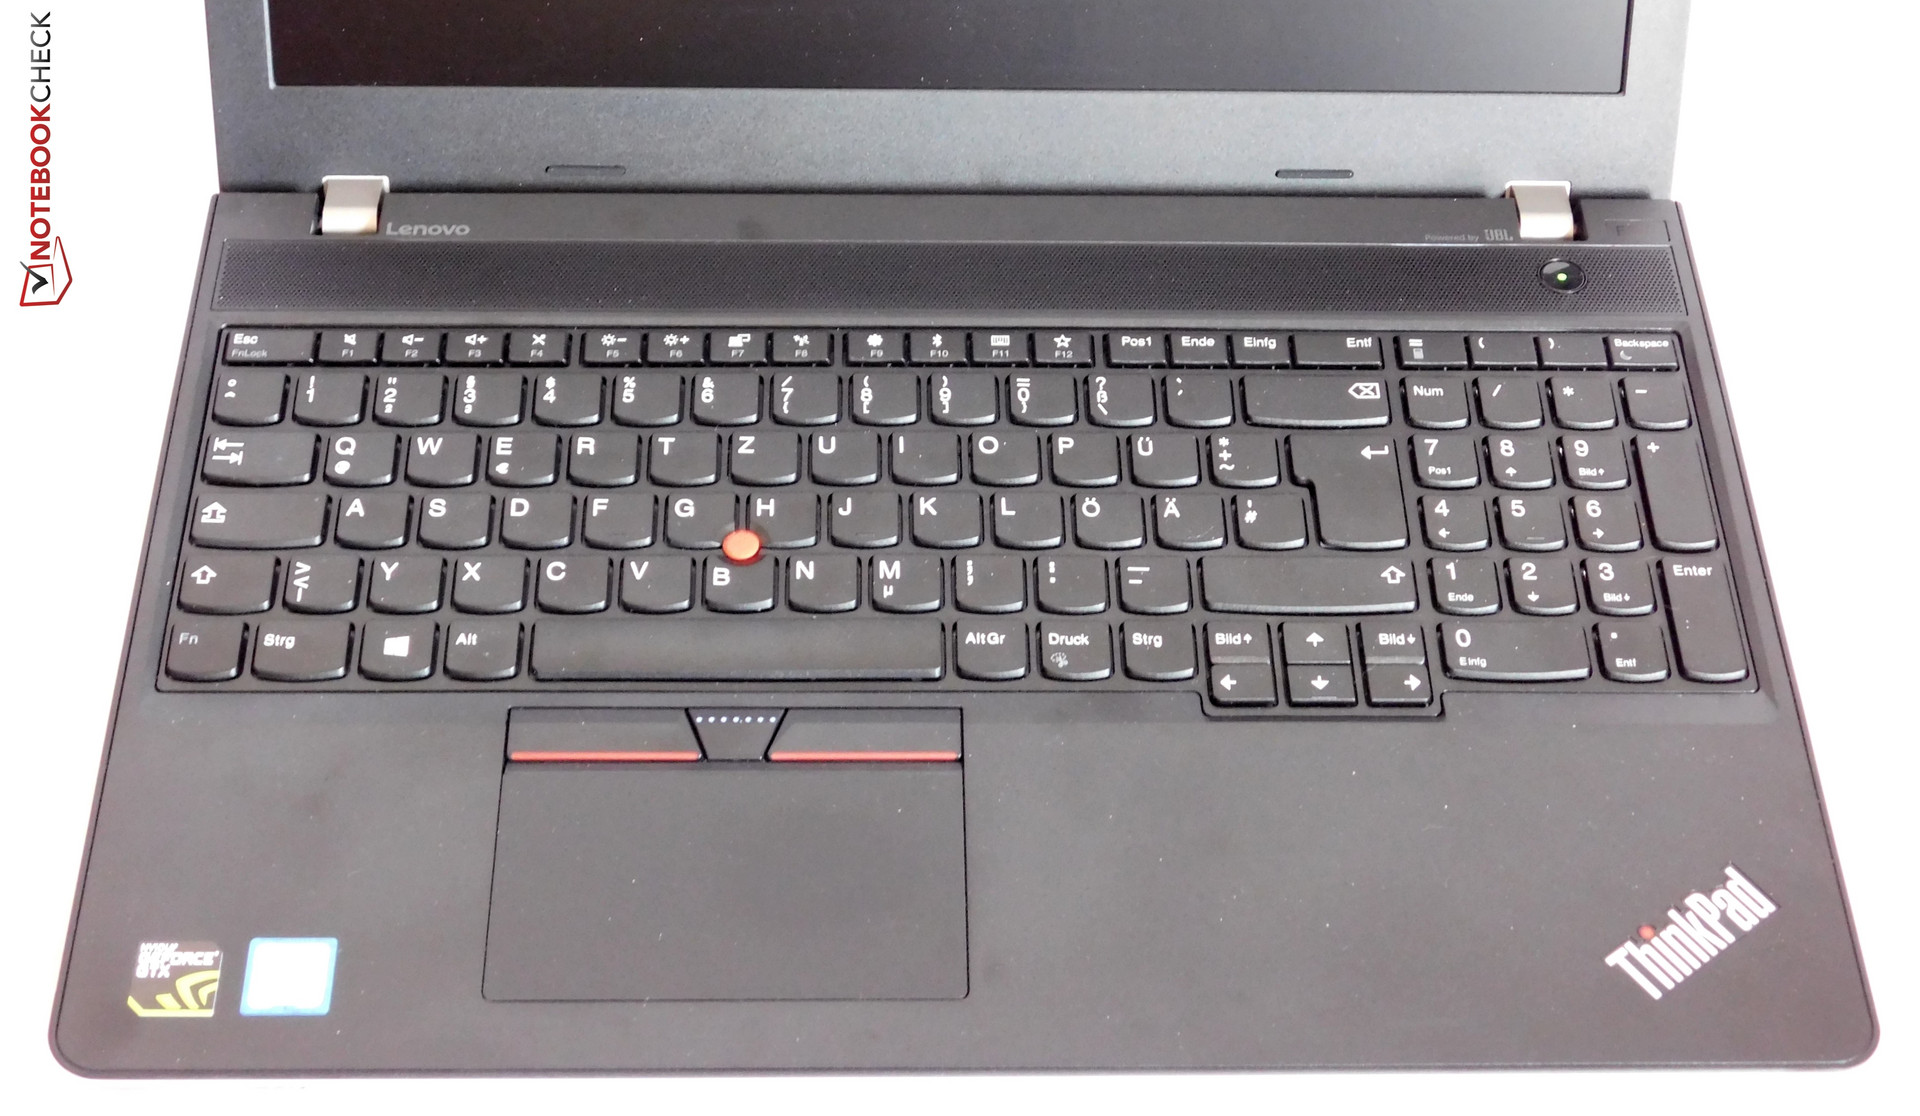
E570作为第一台上市的15.6寸Kaby Lake ThinkPad设备,具备不少优秀特性:它的优秀输入设备更是其中的亮点。联想在屏幕的选择上没有重大失误;它的色域覆盖对于低售价设备来说并不算无法接受,而其他方面都表现不错。E570也十分易于维护,搭配了优秀的扬声器,和相对较强的显卡,为它带来了十分不错的多媒体性能。另外,我们发现这台设备在低负载下可以保持清凉和完全安静。
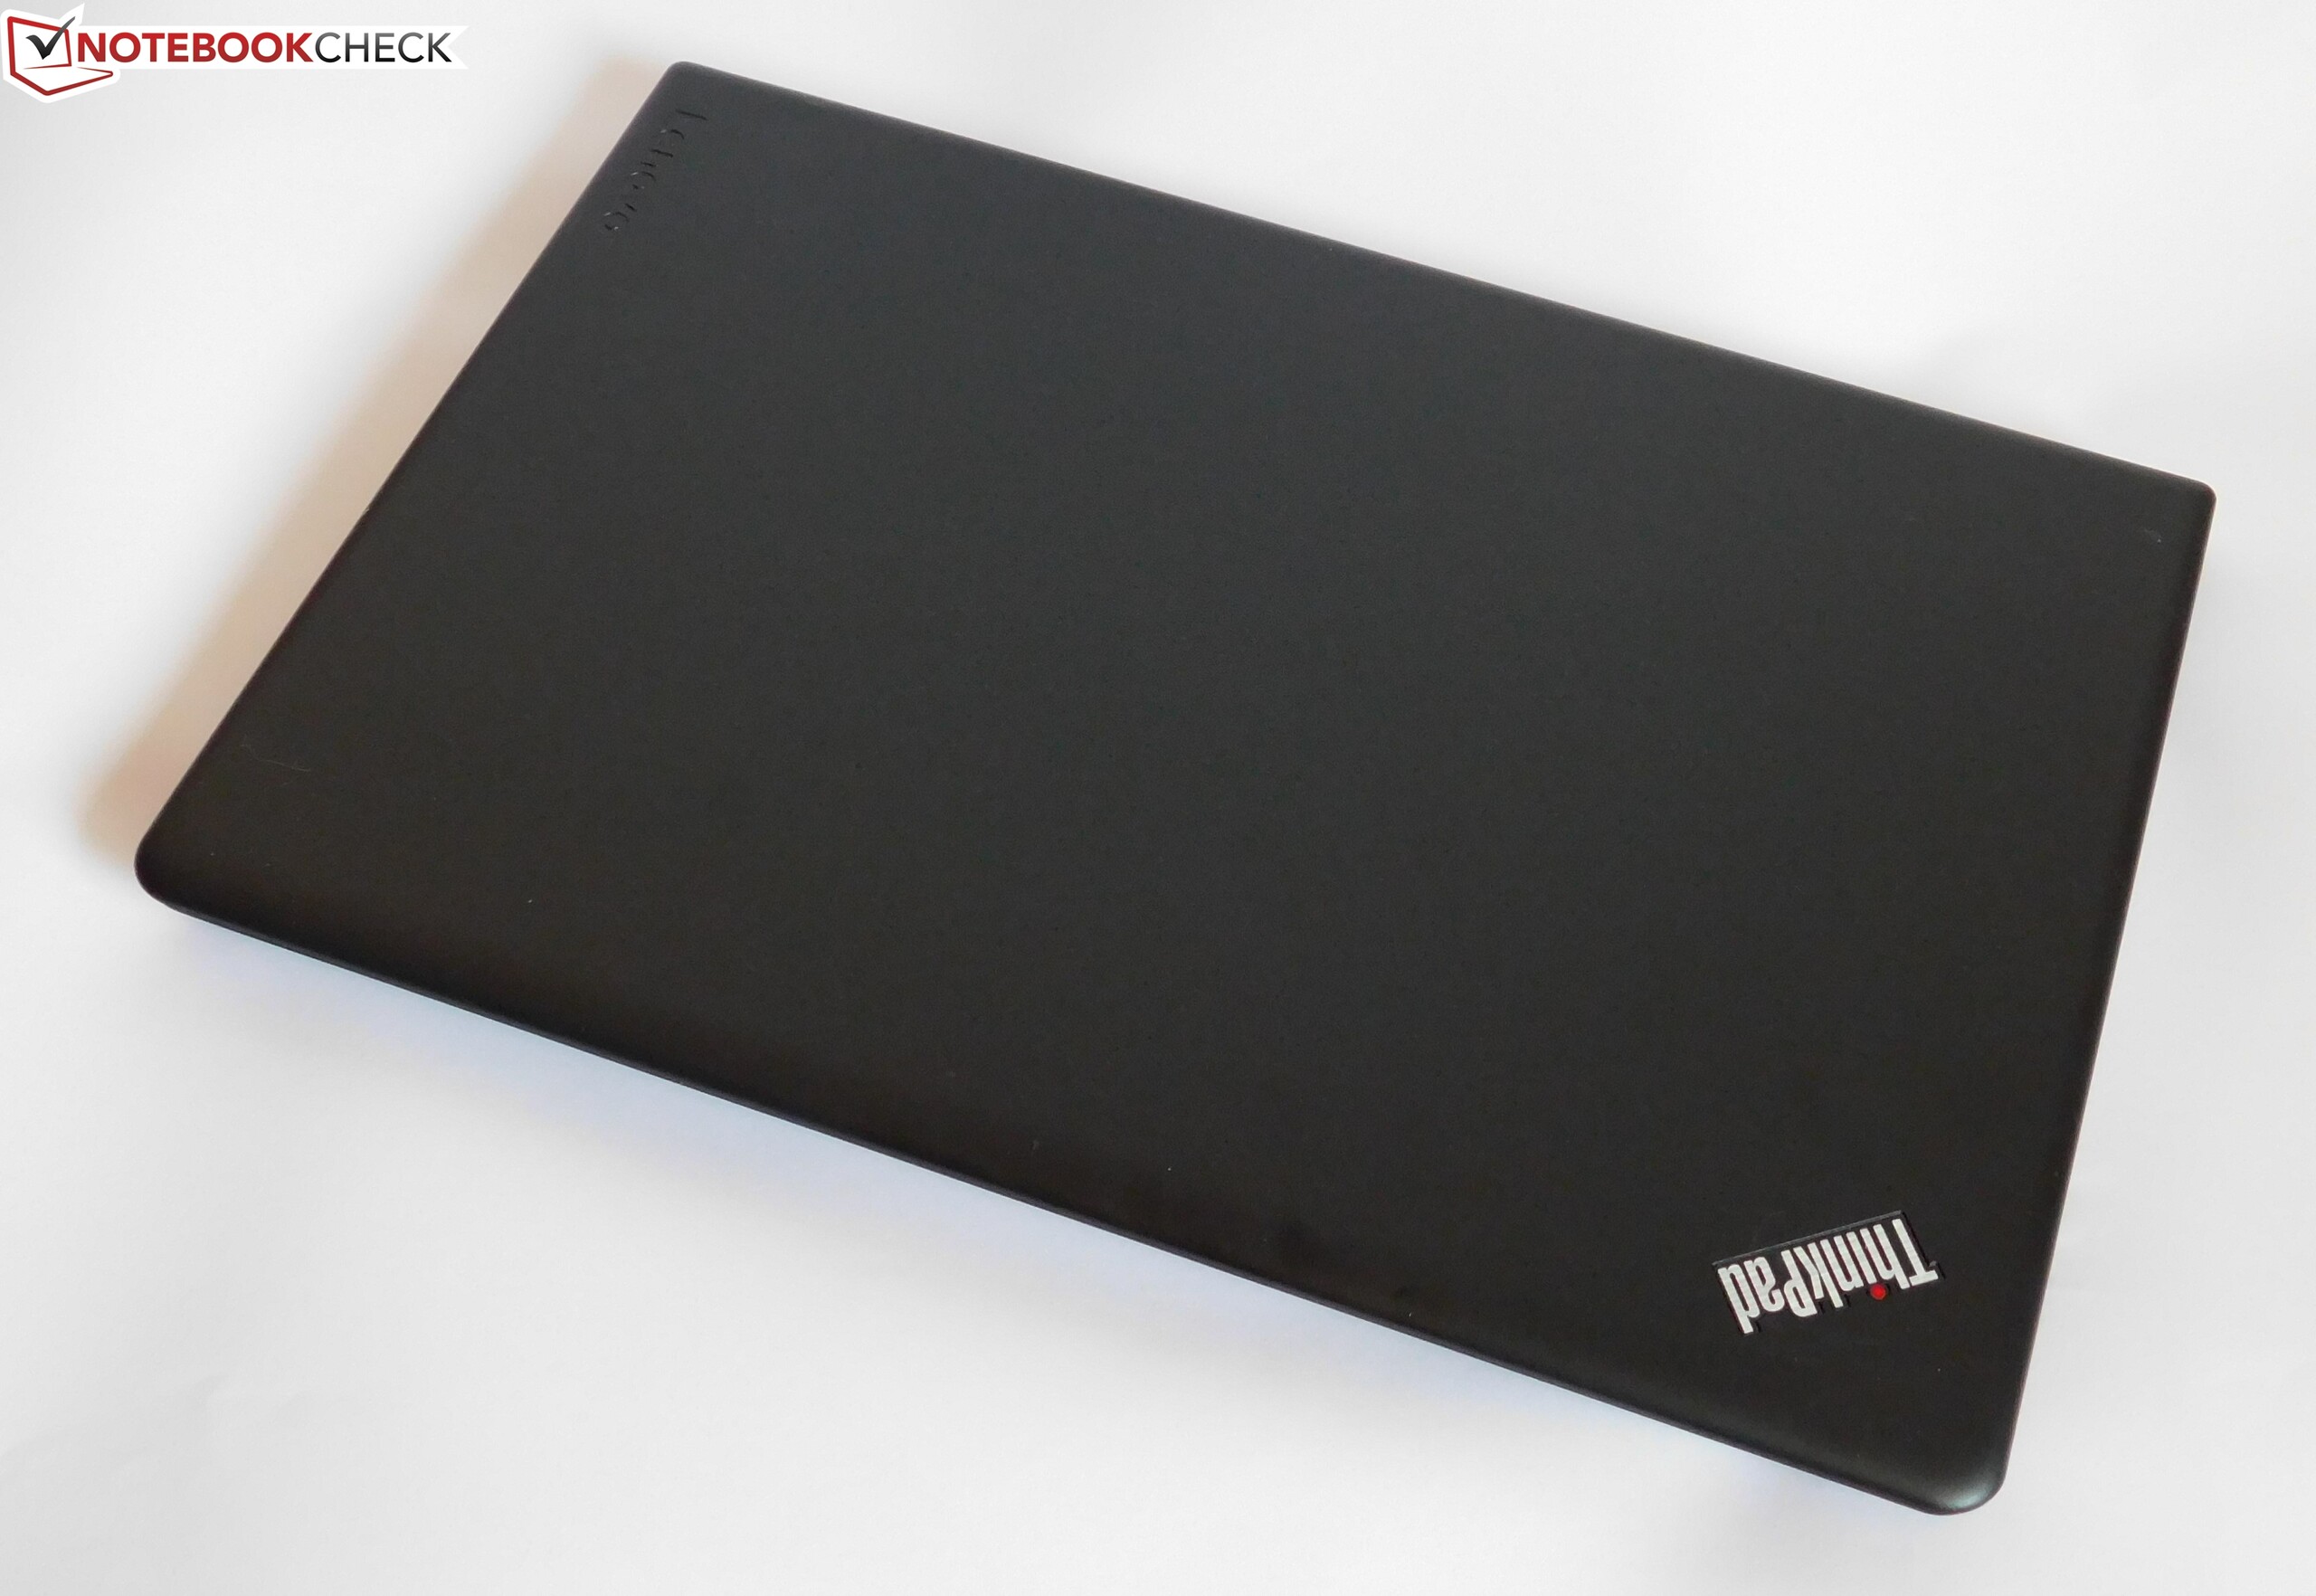
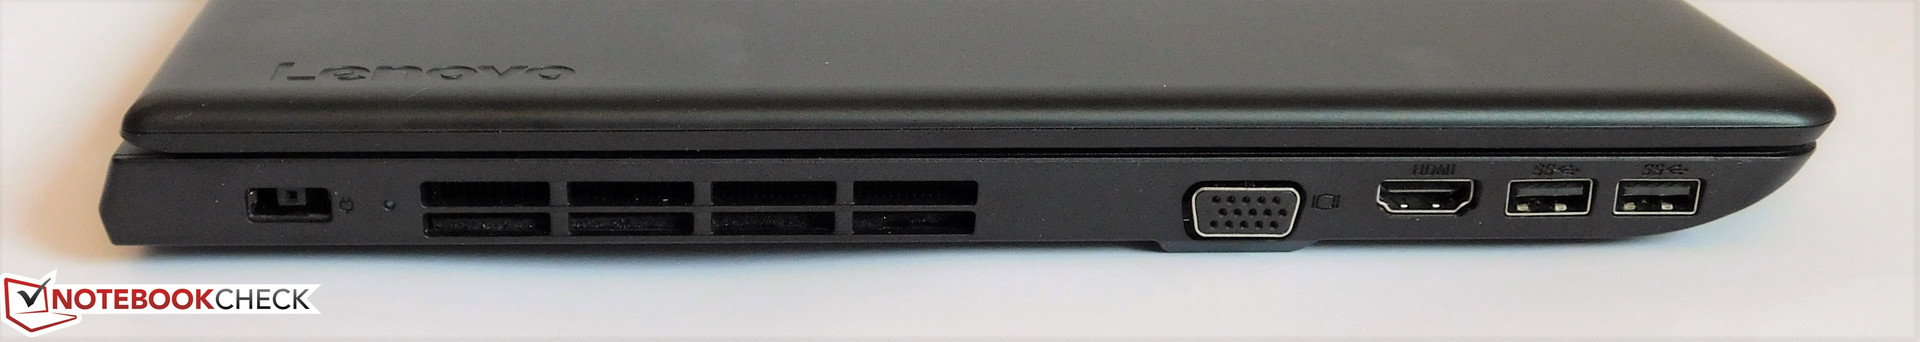
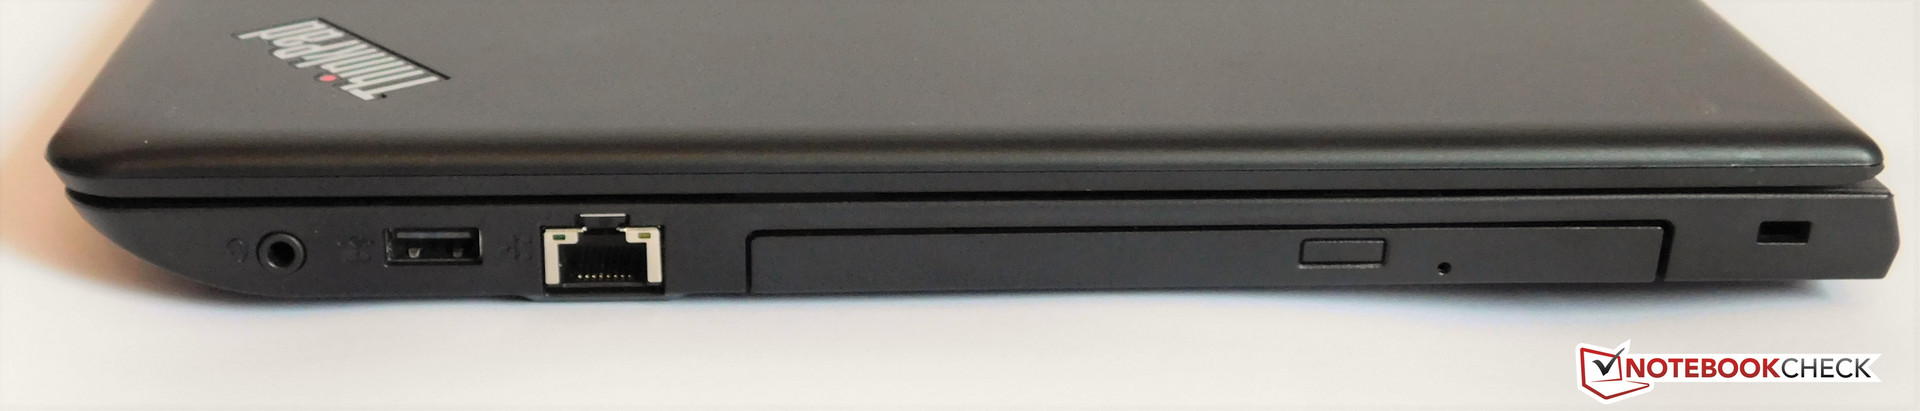
遗憾的是,联想的设计也有一些不足之处,它的接口布局不是特别合理,尽管搭配了DVD光驱,如果安排得当的话它的接口布局还可以得到不小的改善。在负载下它的处理器和显卡也有降频现象,这意味着散热系统能力不足。最后我们还需要提到它的机身,它的屏幕上盖不论在工艺还是坚固度上都难以令人满意。
十分遗憾联想在工艺品质上留下了这样的缺陷。E570实际上对于学生来说是一台十分有吸引力的设备——不过,尺寸稍小的E470可能更胜一筹。
不论如何,我们认为E570由于整体性价比优秀十分值得推荐。它对于需要一台搭配输入设备的机型的学生或者个人用户来说十分适合。不过对于除学生以外的消费者来说它的性价比并不算出色:固定配置机型售价750欧元(约5489人民币),但没有搭配固态硬盘仅提供了1TB的机械硬盘,同时没有搭载独立显卡。当从联想直接购买时,它至少搭配了较弱的940MX。惠普 ProBook 450 G4的售价相比稍低,不过采用了较差的TN屏幕。
注:本文是基于完整评测的缩减版本,阅读完整的英文评测,请点击这里。
Lenovo ThinkPad E570-20H6S00000
- 02/03/2017 v6 (old)
Benjamin Herzig