戴尔 Vostro 15 5568 (酷睿 i5, 全高清) 笔记本电脑简短评测
| SD Card Reader | |
| average JPG Copy Test (av. of 3 runs) | |
| HP ProBook 450 G4 Y8B60EA | |
| Acer TravelMate P259-MG-71UU | |
| Lenovo ThinkPad E570-20H6S00000 | |
| Dell Vostro 15-5568 | |
| maximum AS SSD Seq Read Test (1GB) | |
| HP ProBook 450 G4 Y8B60EA | |
| Lenovo ThinkPad E570-20H6S00000 | |
| Dell Vostro 15-5568 | |
| Networking | |
| iperf3 transmit AX12 | |
| Acer TravelMate P259-MG-71UU | |
| Lenovo ThinkPad E570-20H6S00000 | |
| Dell Vostro 15-5568 | |
| iperf3 receive AX12 | |
| Acer TravelMate P259-MG-71UU | |
| Lenovo ThinkPad E570-20H6S00000 | |
| Dell Vostro 15-5568 | |
| |||||||||||||||||||||||||
Brightness Distribution: 82 %
Center on Battery: 231 cd/m²
Contrast: 409:1 (Black: 0.56 cd/m²)
ΔE ColorChecker Calman: 10.36 | ∀{0.5-29.43 Ø4.71}
ΔE Greyscale Calman: 10.9 | ∀{0.09-98 Ø4.96}
57.92% sRGB (Argyll 1.6.3 3D)
37.69% AdobeRGB 1998 (Argyll 1.6.3 3D)
Gamma: 2.21
CCT: 10084 K
| Dell Vostro 15-5568 Chi Mei CMN154C-8KV42 , , 1920x1080, 15.6" | Lenovo ThinkPad E570-20H6S00000 AUO B156HAN04.4, , 1920x1080, 15.6" | HP ProBook 450 G4 Y8B60EA Chi Mei CMN15C4, , 1920x1080, 15.6" | Acer TravelMate P259-MG-71UU BOE NT156FHM-N41, , 1920x1080, 15.6" | |
|---|---|---|---|---|
| Display | ||||
| Display P3 Coverage (%) | 38.65 | 39.89 | 38.58 | |
| sRGB Coverage (%) | 58 | 59.5 | 58 | |
| AdobeRGB 1998 Coverage (%) | 39.94 | 41.24 | 39.85 | |
| Response Times | 6% | -9% | 15% | |
| Response Time Grey 50% / Grey 80% * (ms) | 47.6 ? | 44.8 ? 6% | 51 ? -7% | 43 ? 10% |
| Response Time Black / White * (ms) | 27.2 ? | 25.6 ? 6% | 30 ? -10% | 22 ? 19% |
| PWM Frequency (Hz) | 50 ? | |||
| Screen | 37% | -0% | -3% | |
| Brightness middle (cd/m²) | 229 | 242 6% | 214 -7% | 180 -21% |
| Brightness (cd/m²) | 222 | 243 9% | 201 -9% | 178 -20% |
| Brightness Distribution (%) | 82 | 75 -9% | 77 -6% | 93 13% |
| Black Level * (cd/m²) | 0.56 | 0.24 57% | 0.43 23% | 0.45 20% |
| Contrast (:1) | 409 | 1008 146% | 498 22% | 400 -2% |
| Colorchecker dE 2000 * | 10.36 | 4.65 55% | 10.68 -3% | 9.91 4% |
| Colorchecker dE 2000 max. * | 14.95 | 9.64 36% | 18.07 -21% | 18.19 -22% |
| Greyscale dE 2000 * | 10.9 | 3.39 69% | 11.32 -4% | 11.25 -3% |
| Gamma | 2.21 100% | 2.7 81% | 2.26 97% | 2.35 94% |
| CCT | 10084 64% | 6246 104% | 12204 53% | 12115 54% |
| Color Space (Percent of AdobeRGB 1998) (%) | 37.69 | 36.69 -3% | 38 1% | 37 -2% |
| Color Space (Percent of sRGB) (%) | 57.92 | 57.66 0% | 59 2% | 58 0% |
| Total Average (Program / Settings) | 22% /
32% | -5% /
-2% | 6% /
-0% |
* ... smaller is better
Display Response Times
| ↔ Response Time Black to White | ||
|---|---|---|
| 27.2 ms ... rise ↗ and fall ↘ combined | ↗ 10 ms rise | 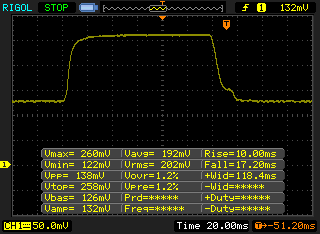 |
| ↘ 17.2 ms fall | ||
| The screen shows relatively slow response rates in our tests and may be too slow for gamers. In comparison, all tested devices range from 0.1 (minimum) to 240 (maximum) ms. » 69 % of all devices are better. This means that the measured response time is worse than the average of all tested devices (19.8 ms). | ||
| ↔ Response Time 50% Grey to 80% Grey | ||
| 47.6 ms ... rise ↗ and fall ↘ combined | ↗ 24.4 ms rise | 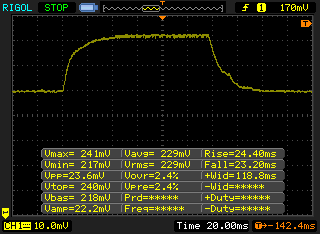 |
| ↘ 23.2 ms fall | ||
| The screen shows slow response rates in our tests and will be unsatisfactory for gamers. In comparison, all tested devices range from 0.165 (minimum) to 636 (maximum) ms. » 82 % of all devices are better. This means that the measured response time is worse than the average of all tested devices (30.9 ms). | ||
Screen Flickering / PWM (Pulse-Width Modulation)
| Screen flickering / PWM not detected | ||
In comparison: 52 % of all tested devices do not use PWM to dim the display. If PWM was detected, an average of 7748 (minimum: 5 - maximum: 343500) Hz was measured. | ||
| PCMark 8 | |
| Home Score Accelerated v2 | |
| Acer TravelMate P259-MG-71UU | |
| Lenovo ThinkPad E570-20H6S00000 | |
| Dell Vostro 15-5568 | |
| HP ProBook 450 G4 Y8B60EA | |
| Work Score Accelerated v2 | |
| HP ProBook 450 G4 Y8B60EA | |
| Acer TravelMate P259-MG-71UU | |
| Lenovo ThinkPad E570-20H6S00000 | |
| Dell Vostro 15-5568 | |
| PCMark 7 Score | 5113 points | |
| PCMark 8 Home Score Accelerated v2 | 3331 points | |
| PCMark 8 Creative Score Accelerated v2 | 4276 points | |
| PCMark 8 Work Score Accelerated v2 | 4573 points | |
Help | ||
| Dell Vostro 15-5568 SanDisk X400 256GB, SATA (SD8SB8U-256G) | Lenovo ThinkPad E570-20H6S00000 Toshiba THNSF5256GPUK | HP ProBook 450 G4 Y8B60EA SanDisk SD8SNAT256G1002 | Acer TravelMate P259-MG-71UU Liteonit CV3-8D256 | |
|---|---|---|---|---|
| AS SSD | 66% | -5% | -3% | |
| Seq Read (MB/s) | 502 | 1227 144% | 493.8 -2% | 402.9 -20% |
| Seq Write (MB/s) | 465.2 | 636 37% | 315.9 -32% | 333.5 -28% |
| 4K Read (MB/s) | 26.84 | 37.12 38% | 17.96 -33% | 29.56 10% |
| 4K Write (MB/s) | 50.3 | 73.1 45% | 73.4 46% | 62.9 25% |

| 3DMark 11 - 1280x720 Performance GPU | |
| Lenovo ThinkPad E570-20H6S00000 | |
| Acer TravelMate P259-MG-71UU | |
| HP ProBook 450 G4 Y8B60EA | |
| Acer Swift 5 SF514-51-59AV | |
| HP ProBook 430 G4-Y8B47EA | |
| Dell Vostro 15-5568 | |
| 3DMark | |
| 1280x720 Cloud Gate Standard Graphics | |
| Lenovo ThinkPad E570-20H6S00000 | |
| Acer TravelMate P259-MG-71UU | |
| HP ProBook 450 G4 Y8B60EA | |
| Acer Swift 5 SF514-51-59AV | |
| HP ProBook 430 G4-Y8B47EA | |
| Dell Vostro 15-5568 | |
| 1920x1080 Fire Strike Graphics | |
| Lenovo ThinkPad E570-20H6S00000 | |
| Acer TravelMate P259-MG-71UU | |
| HP ProBook 450 G4 Y8B60EA | |
| HP ProBook 430 G4-Y8B47EA | |
| Dell Vostro 15-5568 | |
| 3DMark 11 Performance | 1490 points | |
| 3DMark Cloud Gate Standard Score | 5503 points | |
| 3DMark Fire Strike Score | 716 points | |
Help | ||
| low | med. | high | ultra | |
|---|---|---|---|---|
| Tomb Raider (2013) | 61.5 | 32.2 | 17.9 | 8.9 |
| BioShock Infinite (2013) | 39.9 | 23 | 18.8 | 6 |
| The Witcher 3 (2015) | 12.3 |
Noise level
| Idle |
| 29 / 29 / 29 dB(A) |
| Load |
| 33.9 / 37 dB(A) |
 | ||
30 dB silent 40 dB(A) audible 50 dB(A) loud |
||
min: | ||
(+) The maximum temperature on the upper side is 38 °C / 100 F, compared to the average of 34.3 °C / 94 F, ranging from 21.2 to 62.5 °C for the class Office.
(+) The bottom heats up to a maximum of 39 °C / 102 F, compared to the average of 36.8 °C / 98 F
(+) In idle usage, the average temperature for the upper side is 23.6 °C / 74 F, compared to the device average of 29.5 °C / 85 F.
(+) The palmrests and touchpad are cooler than skin temperature with a maximum of 25.6 °C / 78.1 F and are therefore cool to the touch.
(±) The average temperature of the palmrest area of similar devices was 27.6 °C / 81.7 F (+2 °C / 3.6 F).
| Dell Vostro 15-5568 HD Graphics 620, i5-7200U, SanDisk X400 256GB, SATA (SD8SB8U-256G) | Lenovo ThinkPad E570-20H6S00000 GeForce GTX 950M, i5-7200U, Toshiba THNSF5256GPUK | HP ProBook 450 G4 Y8B60EA GeForce 930MX, i7-7500U, SanDisk SD8SNAT256G1002 | Acer TravelMate P259-MG-71UU GeForce 940MX, 6500U, Liteonit CV3-8D256 | |
|---|---|---|---|---|
| Heat | -5% | -7% | 1% | |
| Maximum Upper Side * (°C) | 38 | 46.6 -23% | 44.3 -17% | 35.1 8% |
| Maximum Bottom * (°C) | 39 | 49.1 -26% | 46.3 -19% | 46.7 -20% |
| Idle Upper Side * (°C) | 25.7 | 24.6 4% | 27.8 -8% | 27 -5% |
| Idle Bottom * (°C) | 33.8 | 25.1 26% | 27.7 18% | 27.4 19% |
* ... smaller is better
Dell Vostro 15-5568 audio analysis
(+) | speakers can play relatively loud (82.8 dB)
Bass 100 - 315 Hz
(-) | nearly no bass - on average 16.9% lower than median
(-) | bass is not linear (16.4% delta to prev. frequency)
Mids 400 - 2000 Hz
(±) | higher mids - on average 9% higher than median
(±) | linearity of mids is average (9.4% delta to prev. frequency)
Highs 2 - 16 kHz
(+) | balanced highs - only 4.8% away from median
(+) | highs are linear (6.6% delta to prev. frequency)
Overall 100 - 16.000 Hz
(±) | linearity of overall sound is average (23.6% difference to median)
Compared to same class
» 67% of all tested devices in this class were better, 8% similar, 25% worse
» The best had a delta of 7%, average was 21%, worst was 53%
Compared to all devices tested
» 71% of all tested devices were better, 6% similar, 23% worse
» The best had a delta of 4%, average was 23%, worst was 134%
Lenovo ThinkPad E570-20H6S00000 audio analysis
(±) | speaker loudness is average but good (80.7 dB)
Bass 100 - 315 Hz
(-) | nearly no bass - on average 16.8% lower than median
(-) | bass is not linear (16.4% delta to prev. frequency)
Mids 400 - 2000 Hz
(±) | higher mids - on average 5.1% higher than median
(±) | linearity of mids is average (9.5% delta to prev. frequency)
Highs 2 - 16 kHz
(+) | balanced highs - only 2.7% away from median
(+) | highs are linear (6.5% delta to prev. frequency)
Overall 100 - 16.000 Hz
(±) | linearity of overall sound is average (19.6% difference to median)
Compared to same class
» 64% of all tested devices in this class were better, 7% similar, 29% worse
» The best had a delta of 5%, average was 17%, worst was 45%
Compared to all devices tested
» 49% of all tested devices were better, 7% similar, 44% worse
» The best had a delta of 4%, average was 23%, worst was 134%
| Off / Standby | |
| Idle | |
| Load |
|
Key:
min: | |
| Dell Vostro 15-5568 i5-7200U, HD Graphics 620, SanDisk X400 256GB, SATA (SD8SB8U-256G), TN LED, 1920x1080, 15.6" | Lenovo ThinkPad E570-20H6S00000 i5-7200U, GeForce GTX 950M, Toshiba THNSF5256GPUK, IPS LED, 1920x1080, 15.6" | HP ProBook 450 G4 Y8B60EA i7-7500U, GeForce 930MX, SanDisk SD8SNAT256G1002, TN LED, 1920x1080, 15.6" | Acer TravelMate P259-MG-71UU 6500U, GeForce 940MX, Liteonit CV3-8D256, TN LED, 1920x1080, 15.6" | |
|---|---|---|---|---|
| Power Consumption | -22% | -19% | -45% | |
| Idle Minimum * (Watt) | 3.3 | 2.8 15% | 3.8 -15% | 7 -112% |
| Idle Average * (Watt) | 6.8 | 6.3 7% | 6.6 3% | 8 -18% |
| Idle Maximum * (Watt) | 7.7 | 6.9 10% | 11.3 -47% | 10.6 -38% |
| Load Average * (Watt) | 30.9 | 51.6 -67% | 38 -23% | 39.7 -28% |
| Load Maximum * (Watt) | 40.3 | 69.7 -73% | 45 -12% | 51.9 -29% |
* ... smaller is better
| Dell Vostro 15-5568 i5-7200U, HD Graphics 620, 42 Wh | Lenovo ThinkPad E570-20H6S00000 i5-7200U, GeForce GTX 950M, 41 Wh | HP ProBook 450 G4 Y8B60EA i7-7500U, GeForce 930MX, 45 Wh | Acer TravelMate P259-MG-71UU 6500U, GeForce 940MX, 41 Wh | |
|---|---|---|---|---|
| Battery runtime | 12% | 11% | -41% | |
| Reader / Idle (h) | 16.9 | 14.7 -13% | 12.4 -27% | 10.3 -39% |
| H.264 (h) | 8.5 | 4.1 -52% | ||
| WiFi v1.3 (h) | 6 | 7.7 28% | 8.6 43% | 4.7 -22% |
| Load (h) | 1.8 | 2.2 22% | 2.1 17% | 0.9 -50% |
Pros
Cons
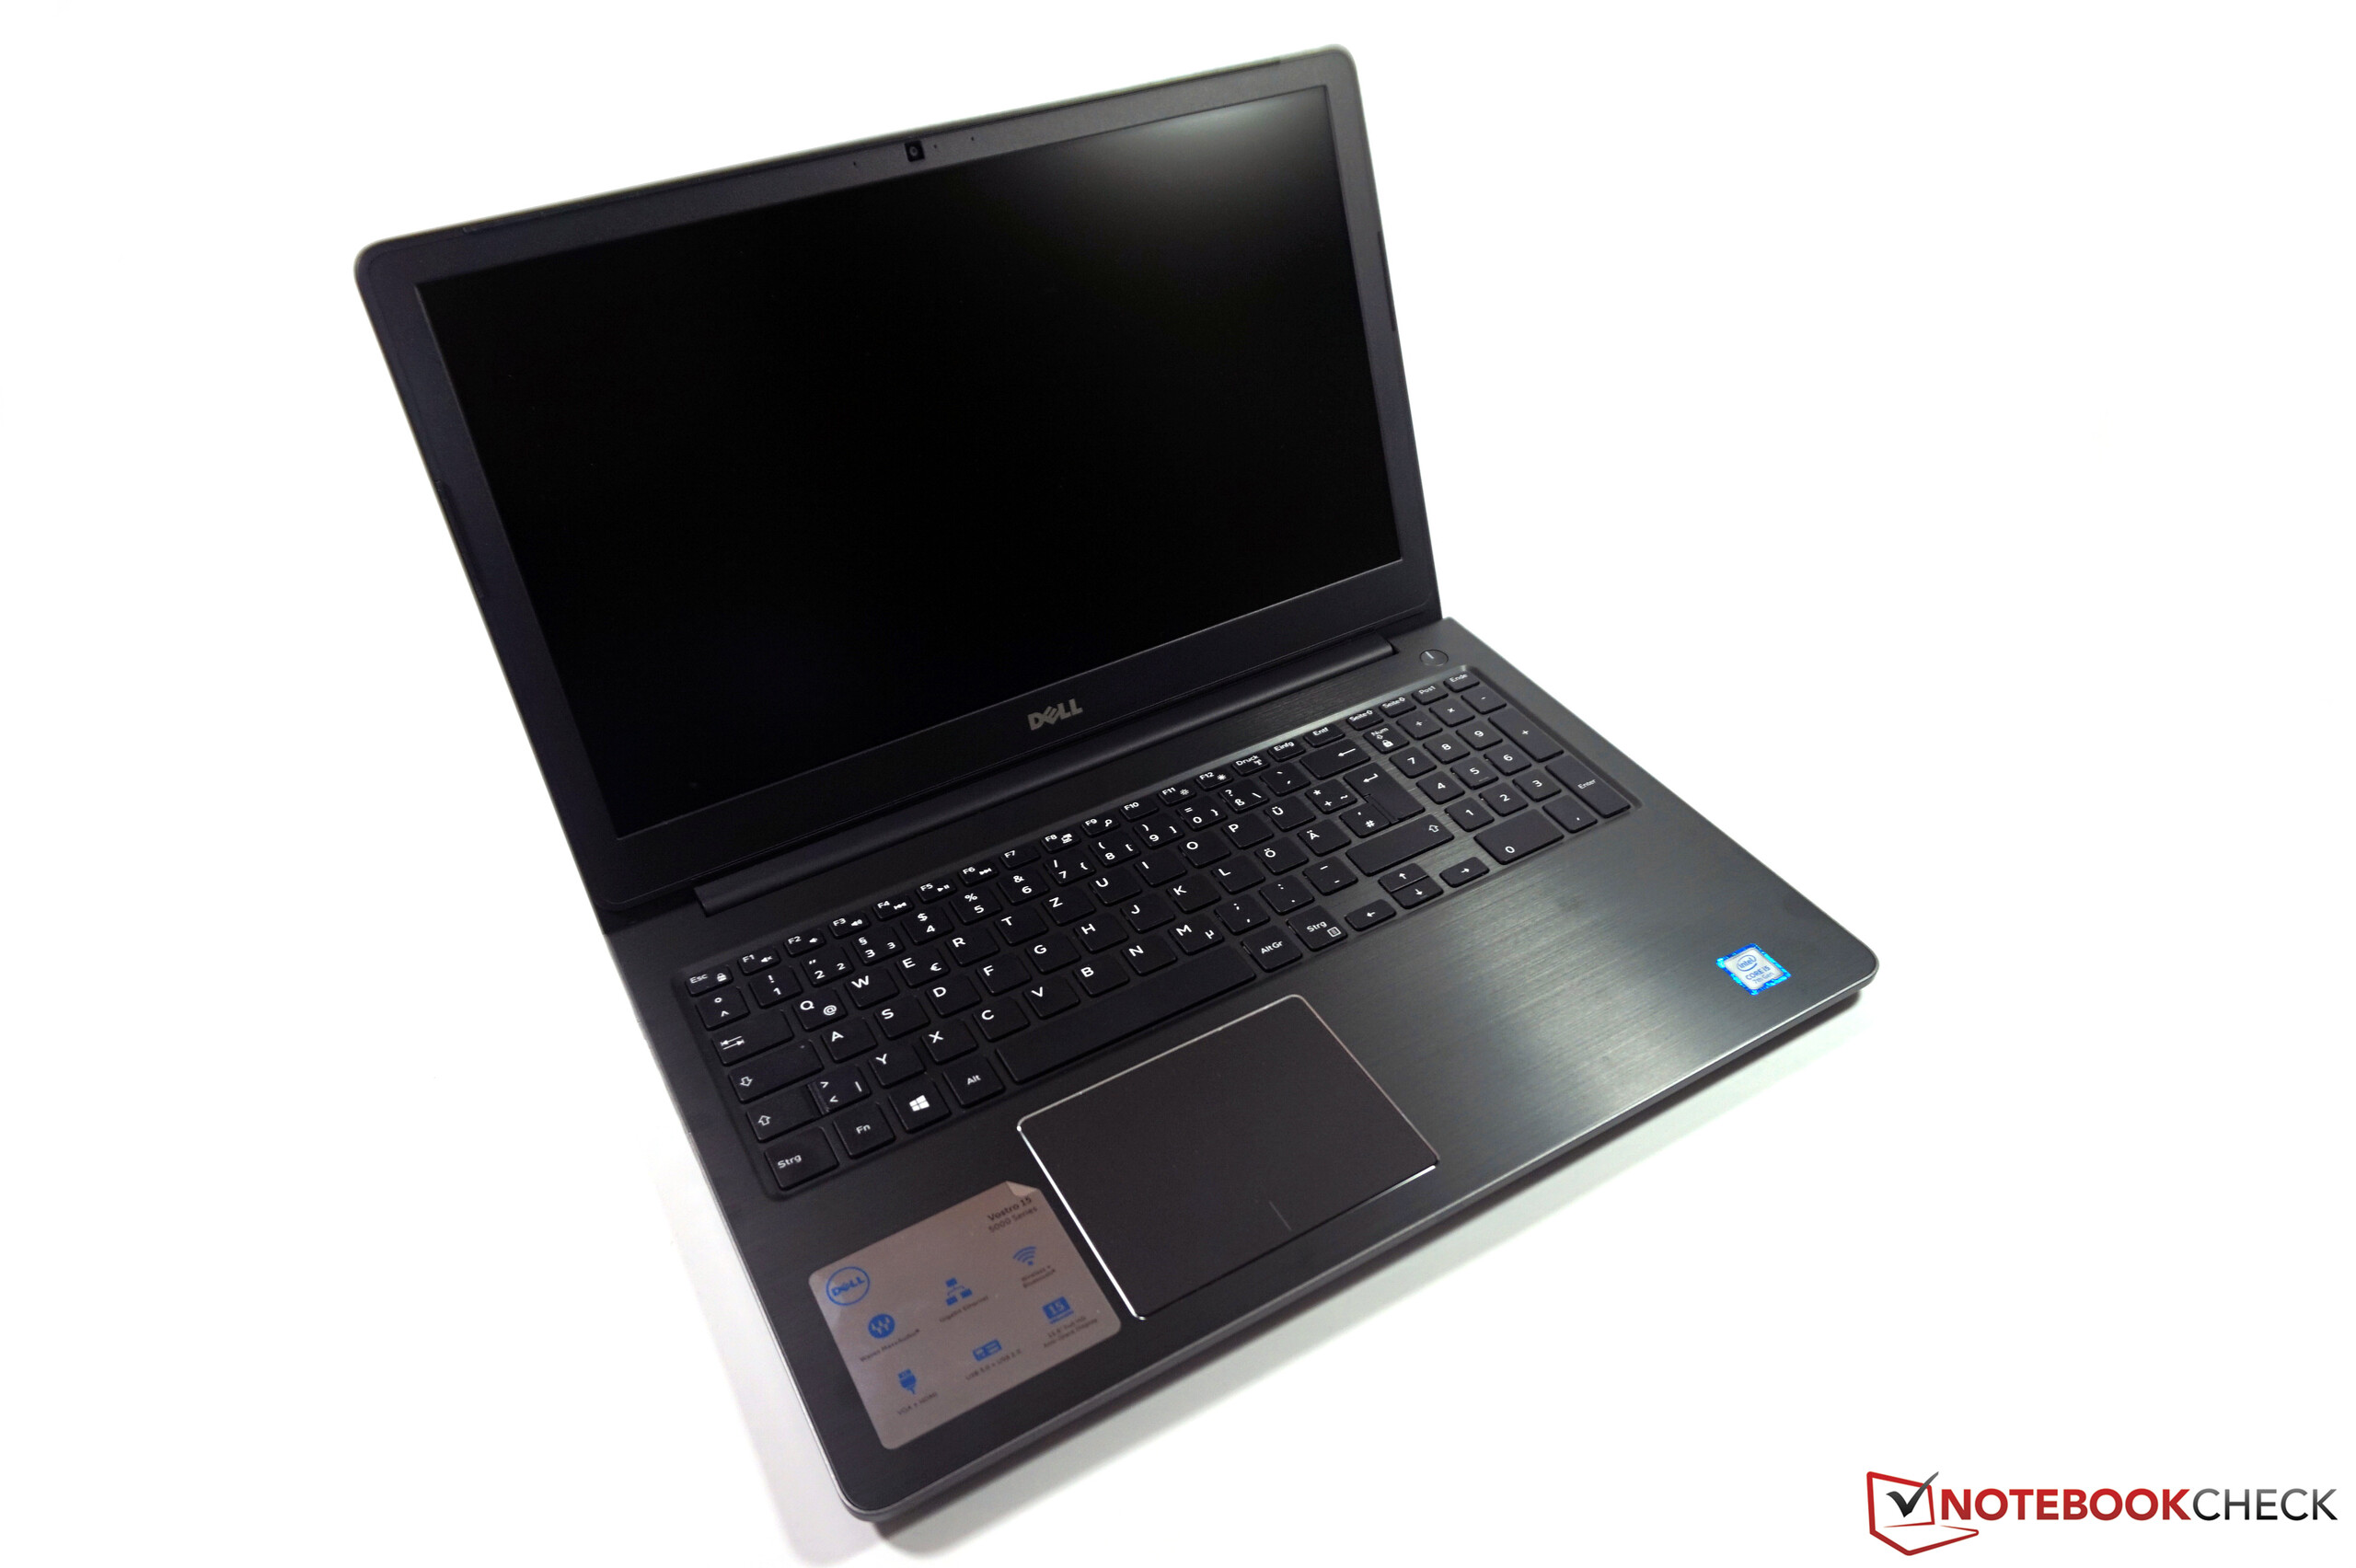
戴尔Vostro 15是一台不错的办公笔记本电脑。相比售价更昂贵的商务笔记本电脑来说它有不少不足之处,而这也不算是个新闻。但是,它并没有让人望而却步的严重问题。当然,全高清TN屏幕在色彩还原上表现较差,整体色彩偏蓝,但这对于办公用途(收发邮件,电子表格,简报,视频会议等)来说并不算是太大的问题。我们测试过的机型中也还有可视角度范围表现更差的。
它还有一些其他的缺点,比如平庸的输入设备,较慢的无线连接速度,安全功能的缺乏和较差的扬声器。不过其中有一些可以通过可选升级得到改进(键盘背光,指纹感应器,其他无线模组)。
戴尔Vostro 15是一台实惠型的办公笔记本电脑,它提供了不错的性能和品质优秀的机身。一块可选的IPS屏幕可能会让它更有竞争力。
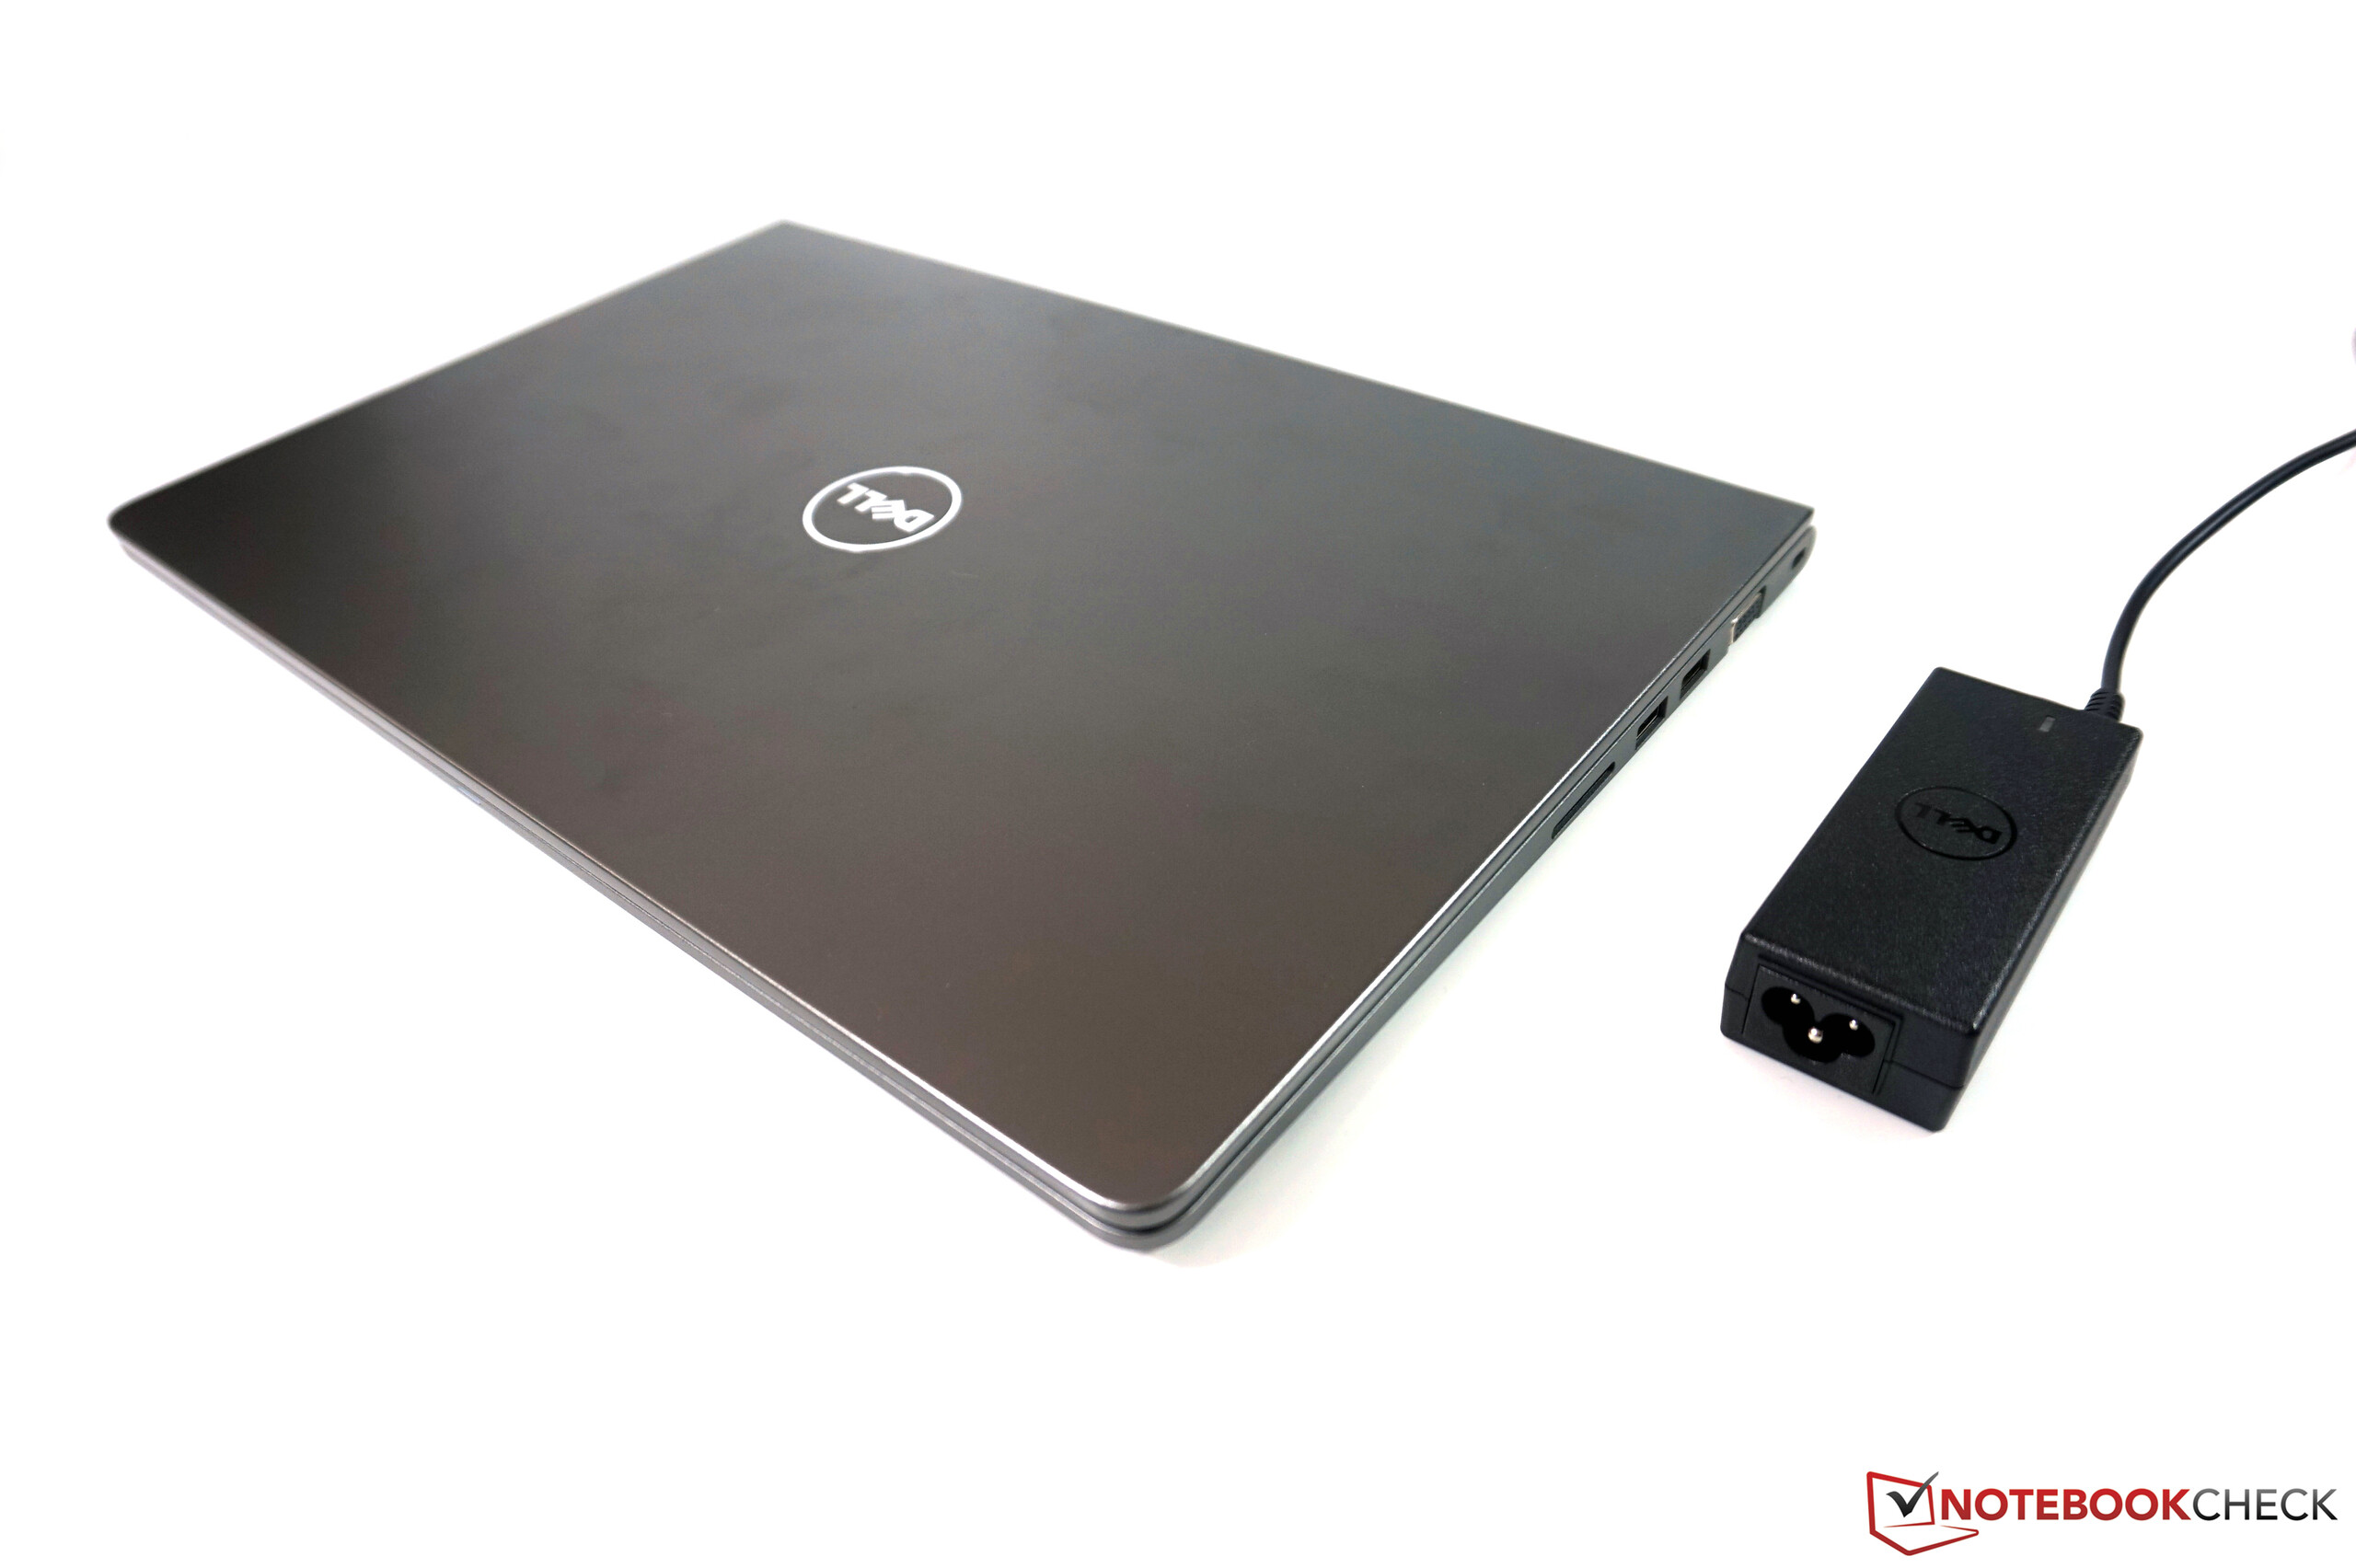
我们十分喜欢它的优秀性能,安静的运行和美观机身,这些都优于大部分入门级设备。Vostro 15在坚固度上也不逊于很多更贵的设备。我们十分希望它能够搭配更高品质的键盘和一块IPS屏幕。
惠普 ProBook 450 G4和宏碁 TravelMate P259都搭配了更差的屏幕。我们目前正在测试最新的联想 ThinkPad E570,初步来看搭配全高清IPS屏幕的这款设备可能是它们的强劲对手。
注:本文是基于完整评测的缩减版本,阅读完整的英文评测,请点击这里。
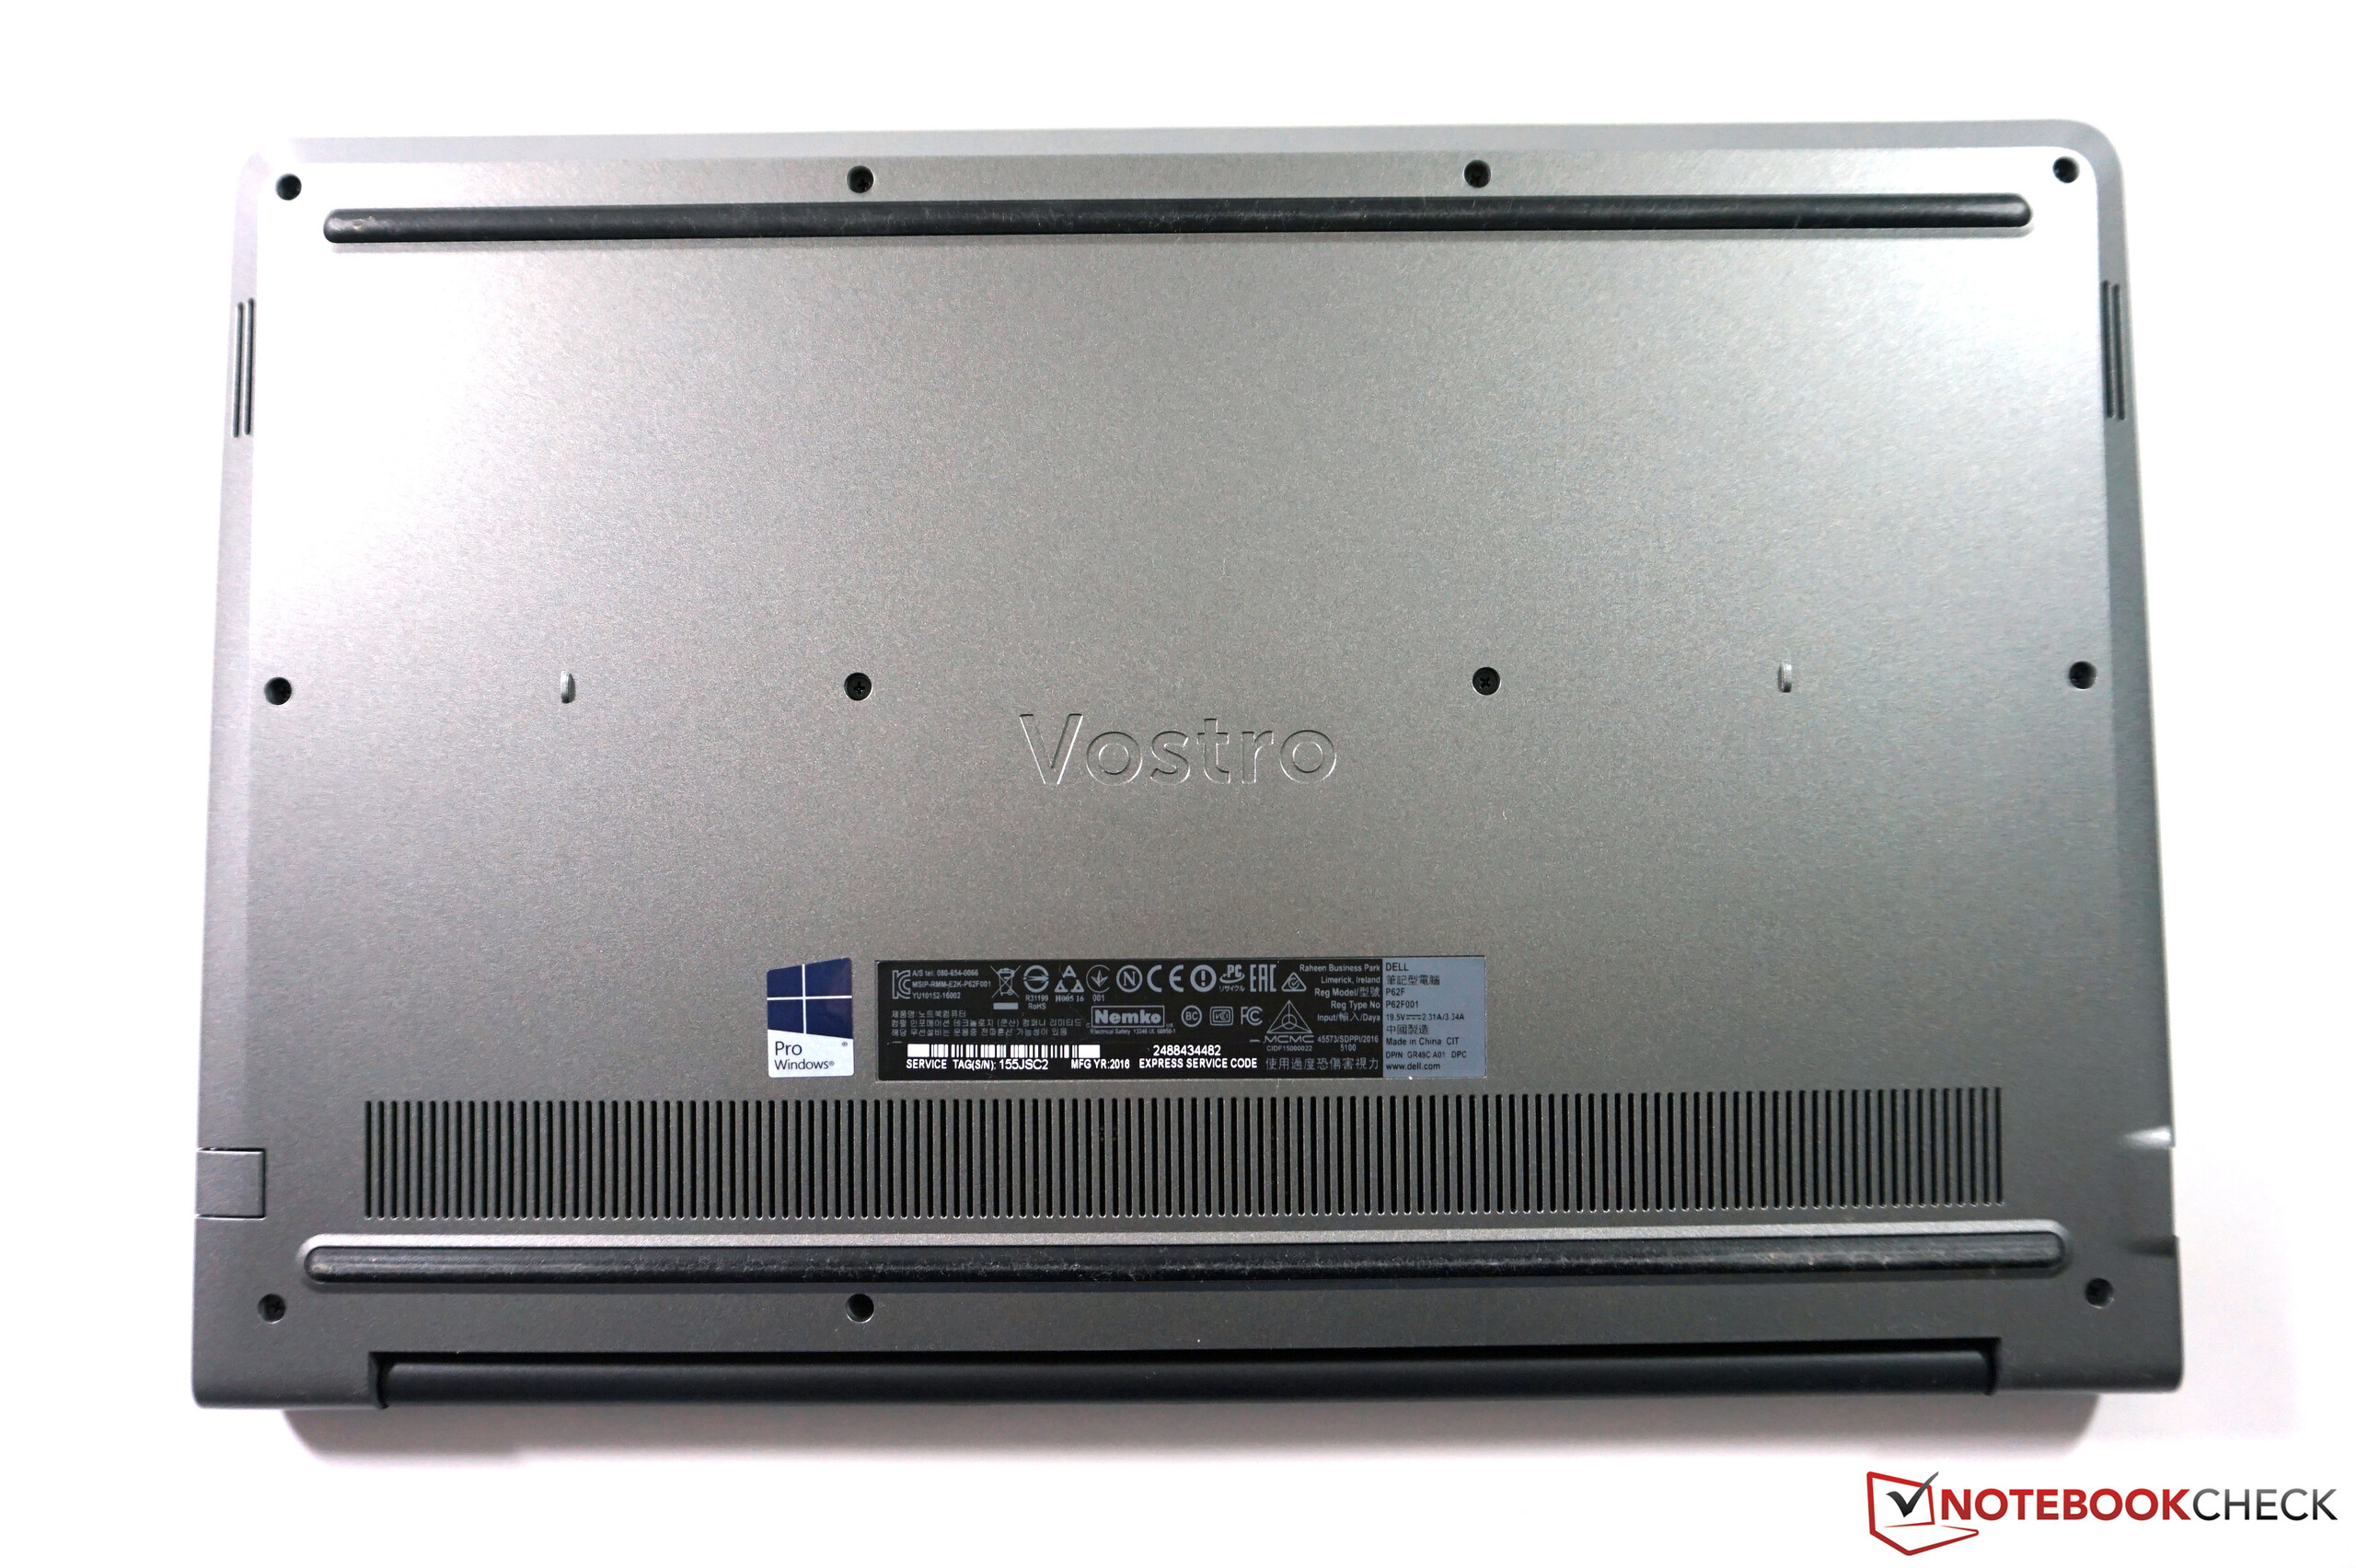
Dell Vostro 15-5568
- 01/31/2017 v6 (old)
Andreas Osthoff
Price comparison
