MSI GS66 Stealth 10SFS笔记本电脑评测:看起来低调,声音不低调
Rating | Date | Model | Weight | Height | Size | Resolution | Price |
|---|---|---|---|---|---|---|---|
| 82.8 % v7 (old) | 06 / 2020 | MSI GS66 Stealth 10SFS i9-10980HK, GeForce RTX 2070 Super Max-Q | 2.2 kg | 20 mm | 15.60" | 1920x1080 | |
| 84 % v7 (old) | 08 / 2019 | Acer Predator Triton 500 PT515-51-71PZ i7-9750H, GeForce RTX 2070 Max-Q | 2.1 kg | 18 mm | 15.60" | 1920x1080 | |
| 84 % v7 (old) | 07 / 2019 | Gigabyte Aero 15 Classic-XA i7-9750H, GeForce RTX 2070 Max-Q | 2.1 kg | 19 mm | 15.60" | 1920x1080 | |
| 82.3 % v7 (old) | 10 / 2019 | HP Omen X 2S 15-dg0075cl i7-9750H, GeForce RTX 2070 Max-Q | 2.4 kg | 19.8 mm | 15.60" | 1920x1080 | |
| 82.8 % v7 (old) | 12 / 2019 | Schenker XMG Neo 15 XNE15M19 i7-9750H, GeForce RTX 2070 Max-Q | 2.1 kg | 22 mm | 15.60" | 1920x1080 |


| |||||||||||||||||||||||||
Brightness Distribution: 92 %
Center on Battery: 316 cd/m²
Contrast: 1505:1 (Black: 0.21 cd/m²)
ΔE ColorChecker Calman: 3.03 | ∀{0.5-29.43 Ø4.71}
calibrated: 1.1
ΔE Greyscale Calman: 3.9 | ∀{0.09-98 Ø4.96}
100% sRGB (Argyll 1.6.3 3D)
65% AdobeRGB 1998 (Argyll 1.6.3 3D)
70.8% AdobeRGB 1998 (Argyll 3D)
99.6% sRGB (Argyll 3D)
69.5% Display P3 (Argyll 3D)
Gamma: 2.42
CCT: 7439 K
| MSI GS66 Stealth 10SFS AUO B156HAN12.0 (AUO328E), IPS, 1920x1080, 15.6" | Acer Predator Triton 500 PT515-51-71PZ NV156FHM-N4K (BOE082A), IPS, 1920x1080, 15.6" | Gigabyte Aero 15 Classic-XA Sharp LQ156M1JW03 (SHP14C5), IGZO, 1920x1080, 15.6" | HP Omen X 2S 15-dg0075cl AU Optronics AUO82ED, IPS, 1920x1080, 15.6" | Schenker XMG Neo 15 XNE15M19 NV156FHM-N4G (BOE084D), IPS, 1920x1080, 15.6" | |
|---|---|---|---|---|---|
| Display | -7% | -5% | -6% | -8% | |
| Display P3 Coverage (%) | 69.5 | 64.6 -7% | 65.3 -6% | 66.2 -5% | 64 -8% |
| sRGB Coverage (%) | 99.6 | 92.6 -7% | 95.5 -4% | 92.3 -7% | 90.3 -9% |
| AdobeRGB 1998 Coverage (%) | 70.8 | 66 -7% | 66.5 -6% | 67.2 -5% | 65.4 -8% |
| Response Times | 23% | -13% | -11% | 3% | |
| Response Time Grey 50% / Grey 80% * (ms) | 14 ? | 5.2 ? 63% | 15.2 ? -9% | 15.2 ? -9% | 9.6 ? 31% |
| Response Time Black / White * (ms) | 9.6 ? | 11.2 ? -17% | 11.2 ? -17% | 10.8 ? -13% | 12 ? -25% |
| PWM Frequency (Hz) | 23580 ? | ||||
| Screen | -7% | -8% | -34% | -12% | |
| Brightness middle (cd/m²) | 316 | 288 -9% | 266 -16% | 324.8 3% | 313 -1% |
| Brightness (cd/m²) | 311 | 265 -15% | 248 -20% | 316 2% | 295 -5% |
| Brightness Distribution (%) | 92 | 84 -9% | 89 -3% | 84 -9% | 89 -3% |
| Black Level * (cd/m²) | 0.21 | 0.22 -5% | 0.31 -48% | 0.26 -24% | 0.3 -43% |
| Contrast (:1) | 1505 | 1309 -13% | 858 -43% | 1249 -17% | 1043 -31% |
| Colorchecker dE 2000 * | 3.03 | 3.22 -6% | 2.78 8% | 4.96 -64% | 3.33 -10% |
| Colorchecker dE 2000 max. * | 7.32 | 6.26 14% | 5.96 19% | 8.95 -22% | 6.25 15% |
| Colorchecker dE 2000 calibrated * | 1.1 | 1.5 -36% | 0.91 17% | 3.23 -194% | 1.77 -61% |
| Greyscale dE 2000 * | 3.9 | 3.43 12% | 3.58 8% | 5 -28% | 3.1 21% |
| Gamma | 2.42 91% | 2.41 91% | 2.46 89% | 2.21 100% | 2.51 88% |
| CCT | 7439 87% | 7290 89% | 7186 90% | 7742 84% | 6930 94% |
| Color Space (Percent of AdobeRGB 1998) (%) | 65 | 60 -8% | 62 -5% | 59.8 -8% | 59 -9% |
| Color Space (Percent of sRGB) (%) | 100 | 93 -7% | 96 -4% | 91.8 -8% | 90 -10% |
| Total Average (Program / Settings) | 3% /
-4% | -9% /
-8% | -17% /
-26% | -6% /
-10% |
* ... smaller is better
Display Response Times
| ↔ Response Time Black to White | ||
|---|---|---|
| 9.6 ms ... rise ↗ and fall ↘ combined | ↗ 5.2 ms rise | 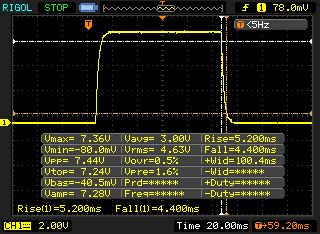 |
| ↘ 4.4 ms fall | ||
| The screen shows fast response rates in our tests and should be suited for gaming. In comparison, all tested devices range from 0.1 (minimum) to 240 (maximum) ms. » 26 % of all devices are better. This means that the measured response time is better than the average of all tested devices (19.8 ms). | ||
| ↔ Response Time 50% Grey to 80% Grey | ||
| 14 ms ... rise ↗ and fall ↘ combined | ↗ 6.8 ms rise | 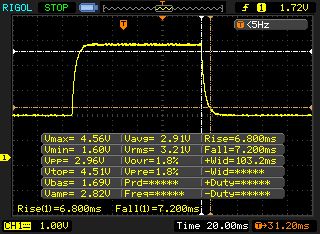 |
| ↘ 7.2 ms fall | ||
| The screen shows good response rates in our tests, but may be too slow for competitive gamers. In comparison, all tested devices range from 0.165 (minimum) to 636 (maximum) ms. » 28 % of all devices are better. This means that the measured response time is better than the average of all tested devices (31 ms). | ||
Screen Flickering / PWM (Pulse-Width Modulation)
| Screen flickering / PWM not detected |  | ||
In comparison: 52 % of all tested devices do not use PWM to dim the display. If PWM was detected, an average of 7757 (minimum: 5 - maximum: 343500) Hz was measured. | |||
| Blender - v2.79 BMW27 CPU | |
| MSI GS66 Stealth 10SFS | |
| Average of class Gaming (79 - 330, n=104, last 2 years) | |
| 7-Zip 18.03 | |
| 7z b 4 -mmt1 | |
| Average of class Gaming (4199 - 7436, n=105, last 2 years) | |
| MSI GS66 Stealth 10SFS | |
| 7z b 4 | |
| Average of class Gaming (33491 - 148086, n=105, last 2 years) | |
| MSI GS66 Stealth 10SFS | |
| Geekbench 5.5 | |
| Single-Core | |
| Average of class Gaming (986 - 2474, n=105, last 2 years) | |
| MSI GS66 Stealth 10SFS | |
| Multi-Core | |
| Average of class Gaming (6460 - 28263, n=105, last 2 years) | |
| MSI GS66 Stealth 10SFS | |
| HWBOT x265 Benchmark v2.2 - 4k Preset | |
| Average of class Gaming (11.5 - 44.4, n=105, last 2 years) | |
| MSI GS66 Stealth 10SFS | |
| LibreOffice - 20 Documents To PDF | |
| MSI GS66 Stealth 10SFS | |
| Average of class Gaming (33.2 - 88.8, n=105, last 2 years) | |
| R Benchmark 2.5 - Overall mean | |
| MSI GS66 Stealth 10SFS | |
| Average of class Gaming (0.3439 - 0.759, n=106, last 2 years) | |
* ... smaller is better
| DPC Latencies / LatencyMon - interrupt to process latency (max), Web, Youtube, Prime95 | |
| MSI GS66 Stealth 10SFS | |
* ... smaller is better
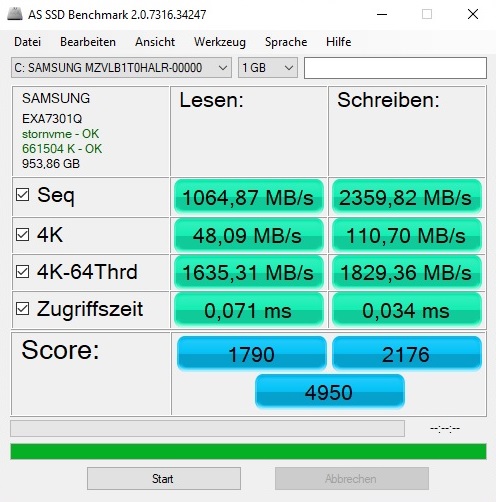
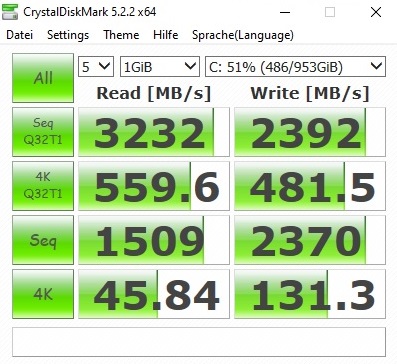
| MSI GS66 Stealth 10SFS Samsung SSD PM981 MZVLB1T0HALR | Acer Predator Triton 500 PT515-51-71PZ WDC PC SN720 SDAPNTW-512G | Gigabyte Aero 15 Classic-XA Intel SSD 760p SSDPEKKW512G8 | HP Omen X 2S 15-dg0075cl WDC PC SN720 SDAPNTW-1T00 | Schenker XMG Neo 15 XNE15M19 Seagate FireCuda 510 SSD ZP1000GM30001 | |
|---|---|---|---|---|---|
| CrystalDiskMark 5.2 / 6 | -4% | -4% | 2% | -12% | |
| Write 4K (MB/s) | 131.3 | 108.8 -17% | 115.5 -12% | 137.4 5% | 108.7 -17% |
| Read 4K (MB/s) | 45.84 | 40.31 -12% | 58 27% | 41.37 -10% | 41.4 -10% |
| Write Seq (MB/s) | 2370 | 2488 5% | 1555 -34% | 2500 5% | 1083 -54% |
| Read Seq (MB/s) | 1509 | 1916 27% | 2590 72% | 1576 4% | 917 -39% |
| Write 4K Q32T1 (MB/s) | 481.5 | 382.4 -21% | 369.3 -23% | 446.7 -7% | 468.5 -3% |
| Read 4K Q32T1 (MB/s) | 560 | 421.8 -25% | 441.7 -21% | 522 -7% | 530 -5% |
| Write Seq Q32T1 (MB/s) | 2392 | 2542 6% | 1547 -35% | 2796 17% | 3057 28% |
| Read Seq Q32T1 (MB/s) | 3232 | 3320 3% | 2969 -8% | 3415 6% | 3422 6% |

| 3DMark 11 Performance | 21934 points | |
| 3DMark Cloud Gate Standard Score | 45202 points | |
| 3DMark Fire Strike Score | 17312 points | |
| 3DMark Time Spy Score | 7272 points | |
Help | ||
| The Witcher 3 - 1920x1080 Ultra Graphics & Postprocessing (HBAO+) | |
| Average of class Gaming (104.7 - 240, n=7, last 2 years) | |
| MSI GS66 Stealth 10SFS | |
| HP Omen X 2S 15-dg0075cl | |
| Acer Predator Triton 500 PT515-51-71PZ | |
| Gigabyte Aero 15 Classic-XA | |
| Schenker XMG Neo 15 XNE15M19 | |
| low | med. | high | ultra | |
|---|---|---|---|---|
| GTA V (2015) | 182 | 174 | 153 | 83.4 |
| The Witcher 3 (2015) | 131 | 70.5 | ||
| Dota 2 Reborn (2015) | 153 | 138 | 128 | 120 |
| X-Plane 11.11 (2018) | 113 | 97.4 | 82.3 | |
| Shadow of the Tomb Raider (2018) | 102 | 91 | ||
| Battlefield V (2018) | 121 | 113 | ||
| Apex Legends (2019) | 140 | 139 | ||
| Borderlands 3 (2019) | 76.3 | 58.9 | ||
| FIFA 20 (2019) | 196 | 190 | ||
| Need for Speed Heat (2019) | 88.2 | 80.7 | ||
| Star Wars Jedi Fallen Order (2019) | 95 | 88.8 | ||
| Escape from Tarkov (2020) | 121 | 119 | ||
| Hunt Showdown (2020) | 91.6 | |||
| Doom Eternal (2020) | 141 | 137 | ||
| Gears Tactics (2020) | 116 | 90.6 |
Noise level
| Idle |
| 32 / 34 / 39 dB(A) |
| Load |
| 53 / 53 dB(A) |
 | ||
30 dB silent 40 dB(A) audible 50 dB(A) loud |
||
min: | ||
| MSI GS66 Stealth 10SFS i9-10980HK, GeForce RTX 2070 Super Max-Q | Acer Predator Triton 500 PT515-51-71PZ i7-9750H, GeForce RTX 2070 Max-Q | Gigabyte Aero 15 Classic-XA i7-9750H, GeForce RTX 2070 Max-Q | HP Omen X 2S 15-dg0075cl i7-9750H, GeForce RTX 2070 Max-Q | Schenker XMG Neo 15 XNE15M19 i7-9750H, GeForce RTX 2070 Max-Q | |
|---|---|---|---|---|---|
| Noise | 4% | 0% | 8% | 1% | |
| off / environment * (dB) | 30 | 30 -0% | 30 -0% | 29 3% | 31 -3% |
| Idle Minimum * (dB) | 32 | 30 6% | 31 3% | 30.5 5% | 31 3% |
| Idle Average * (dB) | 34 | 33 3% | 34 -0% | 31.5 7% | 34 -0% |
| Idle Maximum * (dB) | 39 | 39 -0% | 39 -0% | 31.5 19% | 37 5% |
| Load Average * (dB) | 53 | 45 15% | 46 13% | 40.6 23% | 47 11% |
| Witcher 3 ultra * (dB) | 48 | 49 -2% | 53 -10% | 49.5 -3% | 50 -4% |
| Load Maximum * (dB) | 53 | 51 4% | 55 -4% | 53.4 -1% | 54 -2% |
* ... smaller is better
(-) The maximum temperature on the upper side is 53 °C / 127 F, compared to the average of 40.4 °C / 105 F, ranging from 21.2 to 68.8 °C for the class Gaming.
(-) The bottom heats up to a maximum of 55 °C / 131 F, compared to the average of 43.2 °C / 110 F
(+) In idle usage, the average temperature for the upper side is 26.8 °C / 80 F, compared to the device average of 33.9 °C / 93 F.
(-) Playing The Witcher 3, the average temperature for the upper side is 44 °C / 111 F, compared to the device average of 33.9 °C / 93 F.
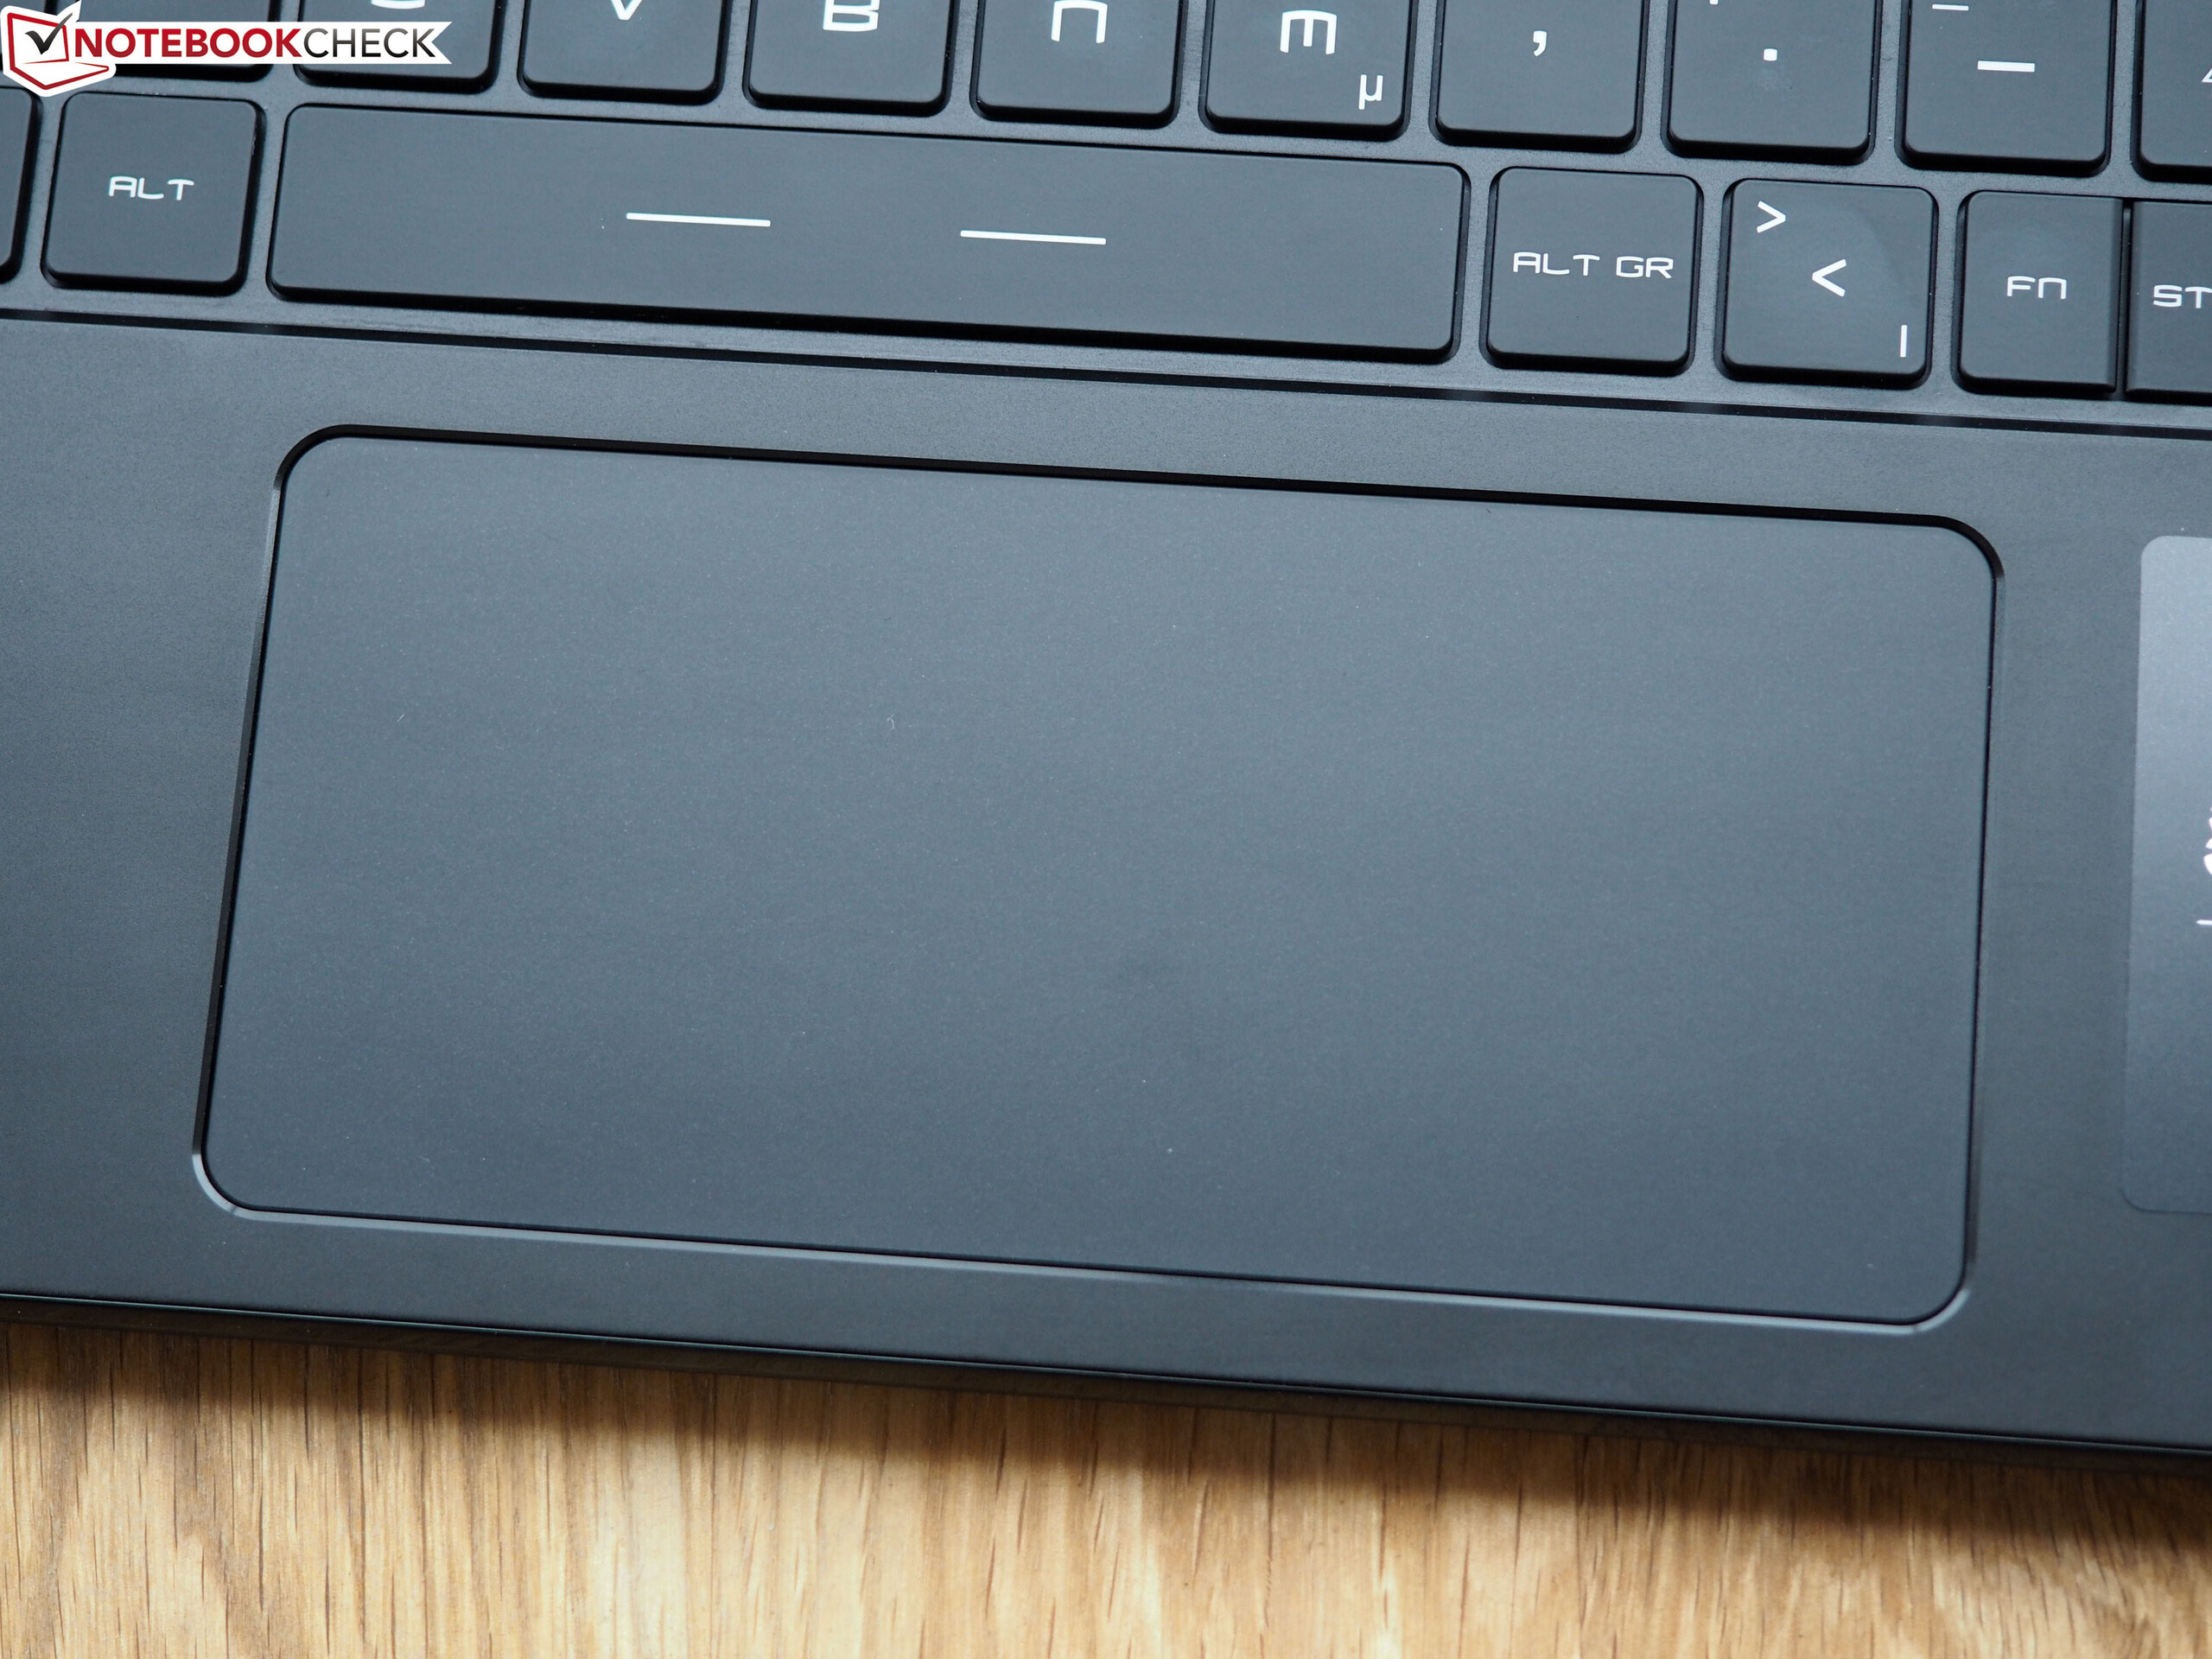
(±) The palmrests and touchpad can get very hot to the touch with a maximum of 37 °C / 98.6 F.
(-) The average temperature of the palmrest area of similar devices was 28.8 °C / 83.8 F (-8.2 °C / -14.8 F).
| MSI GS66 Stealth 10SFS i9-10980HK, GeForce RTX 2070 Super Max-Q | Acer Predator Triton 500 PT515-51-71PZ i7-9750H, GeForce RTX 2070 Max-Q | Gigabyte Aero 15 Classic-XA i7-9750H, GeForce RTX 2070 Max-Q | HP Omen X 2S 15-dg0075cl i7-9750H, GeForce RTX 2070 Max-Q | Schenker XMG Neo 15 XNE15M19 i7-9750H, GeForce RTX 2070 Max-Q | |
|---|---|---|---|---|---|
| Heat | 0% | -10% | -24% | -13% | |
| Maximum Upper Side * (°C) | 53 | 49 8% | 58 -9% | 48.8 8% | 60 -13% |
| Maximum Bottom * (°C) | 55 | 59 -7% | 64 -16% | 55 -0% | 66 -20% |
| Idle Upper Side * (°C) | 28 | 28 -0% | 30 -7% | 41 -46% | 30 -7% |
| Idle Bottom * (°C) | 29 | 29 -0% | 31 -7% | 45.6 -57% | 32 -10% |
* ... smaller is better
MSI GS66 Stealth 10SFS audio analysis
(+) | speakers can play relatively loud (91 dB)
Bass 100 - 315 Hz
(-) | nearly no bass - on average 25.3% lower than median
(+) | bass is linear (6.8% delta to prev. frequency)
Mids 400 - 2000 Hz
(±) | higher mids - on average 9.2% higher than median
(±) | linearity of mids is average (8.3% delta to prev. frequency)
Highs 2 - 16 kHz
(+) | balanced highs - only 2.9% away from median
(+) | highs are linear (5.8% delta to prev. frequency)
Overall 100 - 16.000 Hz
(±) | linearity of overall sound is average (23.5% difference to median)
Compared to same class
» 85% of all tested devices in this class were better, 5% similar, 10% worse
» The best had a delta of 6%, average was 18%, worst was 132%
Compared to all devices tested
» 70% of all tested devices were better, 6% similar, 24% worse
» The best had a delta of 4%, average was 23%, worst was 134%
Acer Predator Triton 500 PT515-51-71PZ audio analysis
(±) | speaker loudness is average but good (80 dB)
Bass 100 - 315 Hz
(±) | reduced bass - on average 12.2% lower than median
(±) | linearity of bass is average (12.6% delta to prev. frequency)
Mids 400 - 2000 Hz
(+) | balanced mids - only 4.5% away from median
(+) | mids are linear (4.7% delta to prev. frequency)
Highs 2 - 16 kHz
(+) | balanced highs - only 2.2% away from median
(+) | highs are linear (3.2% delta to prev. frequency)
Overall 100 - 16.000 Hz
(+) | overall sound is linear (14.8% difference to median)
Compared to same class
» 30% of all tested devices in this class were better, 7% similar, 63% worse
» The best had a delta of 6%, average was 18%, worst was 132%
Compared to all devices tested
» 20% of all tested devices were better, 4% similar, 76% worse
» The best had a delta of 4%, average was 23%, worst was 134%
| Off / Standby | |
| Idle | |
| Load |
|
Key:
min: | |
| MSI GS66 Stealth 10SFS i9-10980HK, GeForce RTX 2070 Super Max-Q | Acer Predator Triton 500 PT515-51-71PZ i7-9750H, GeForce RTX 2070 Max-Q | Gigabyte Aero 15 Classic-XA i7-9750H, GeForce RTX 2070 Max-Q | HP Omen X 2S 15-dg0075cl i7-9750H, GeForce RTX 2070 Max-Q | Schenker XMG Neo 15 XNE15M19 i7-9750H, GeForce RTX 2070 Max-Q | |
|---|---|---|---|---|---|
| Power Consumption | 24% | -17% | -109% | 15% | |
| Idle Minimum * (Watt) | 13 | 7 46% | 21 -62% | 46 -254% | 11 15% |
| Idle Average * (Watt) | 16 | 12 25% | 23 -44% | 59 -269% | 15 6% |
| Idle Maximum * (Watt) | 27 | 22 19% | 32 -19% | 65.5 -143% | 21 22% |
| Load Average * (Watt) | 109 | 86 21% | 97 11% | 99.8 8% | 94 14% |
| Witcher 3 ultra * (Watt) | 155 | 144 7% | 148 5% | 154.1 1% | 143 8% |
| Load Maximum * (Watt) | 236 | 177 25% | 213 10% | 222.7 6% | 173 27% |
* ... smaller is better
| MSI GS66 Stealth 10SFS i9-10980HK, GeForce RTX 2070 Super Max-Q, 99.99 Wh | Acer Predator Triton 500 PT515-51-71PZ i7-9750H, GeForce RTX 2070 Max-Q, Wh | Gigabyte Aero 15 Classic-XA i7-9750H, GeForce RTX 2070 Max-Q, 94.24 Wh | HP Omen X 2S 15-dg0075cl i7-9750H, GeForce RTX 2070 Max-Q, 72 Wh | Schenker XMG Neo 15 XNE15M19 i7-9750H, GeForce RTX 2070 Max-Q, 62 Wh | Average of class Gaming | |
|---|---|---|---|---|---|---|
| Battery runtime | 19% | 33% | -48% | -15% | 1% | |
| Reader / Idle (h) | 8.4 | 11.1 32% | 9.1 8% | 3.7 -56% | 7.3 -13% | 8.27 ? -2% |
| WiFi v1.3 (h) | 6.1 | 8 31% | 7 15% | 2.2 -64% | 5.7 -7% | 7.11 ? 17% |
| Load (h) | 1.7 | 1.6 -6% | 3 76% | 1.3 -24% | 1.3 -24% | 1.502 ? -12% |
| H.264 (h) | 6.8 | 8.32 ? |
Pros
Cons
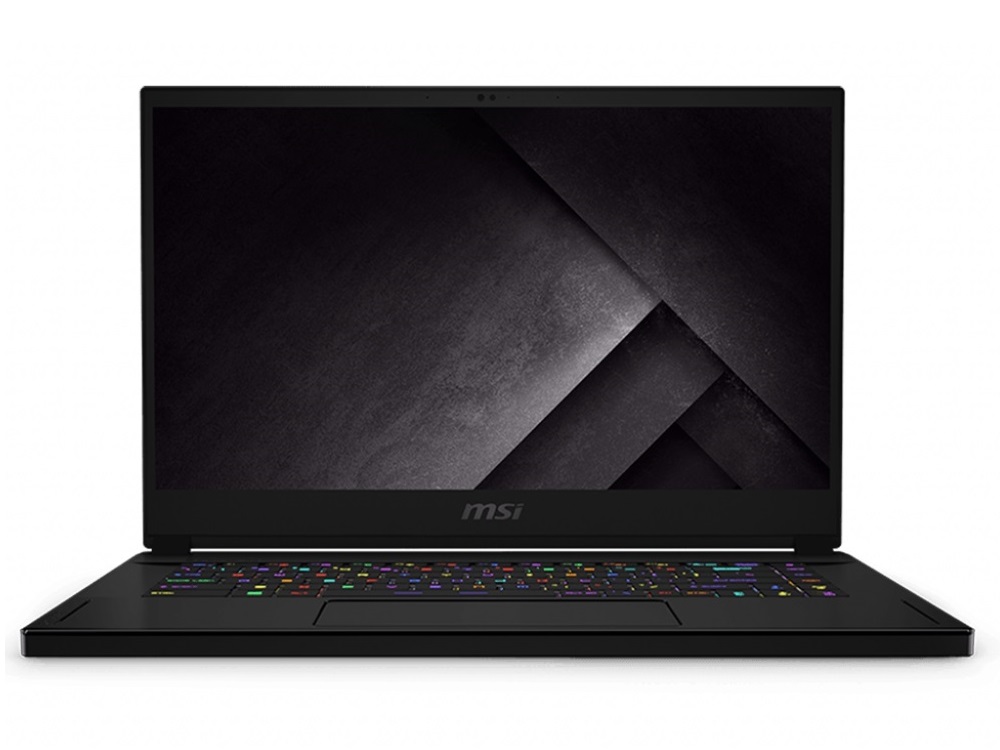
与GS65相比,GS66有着明显的进步。
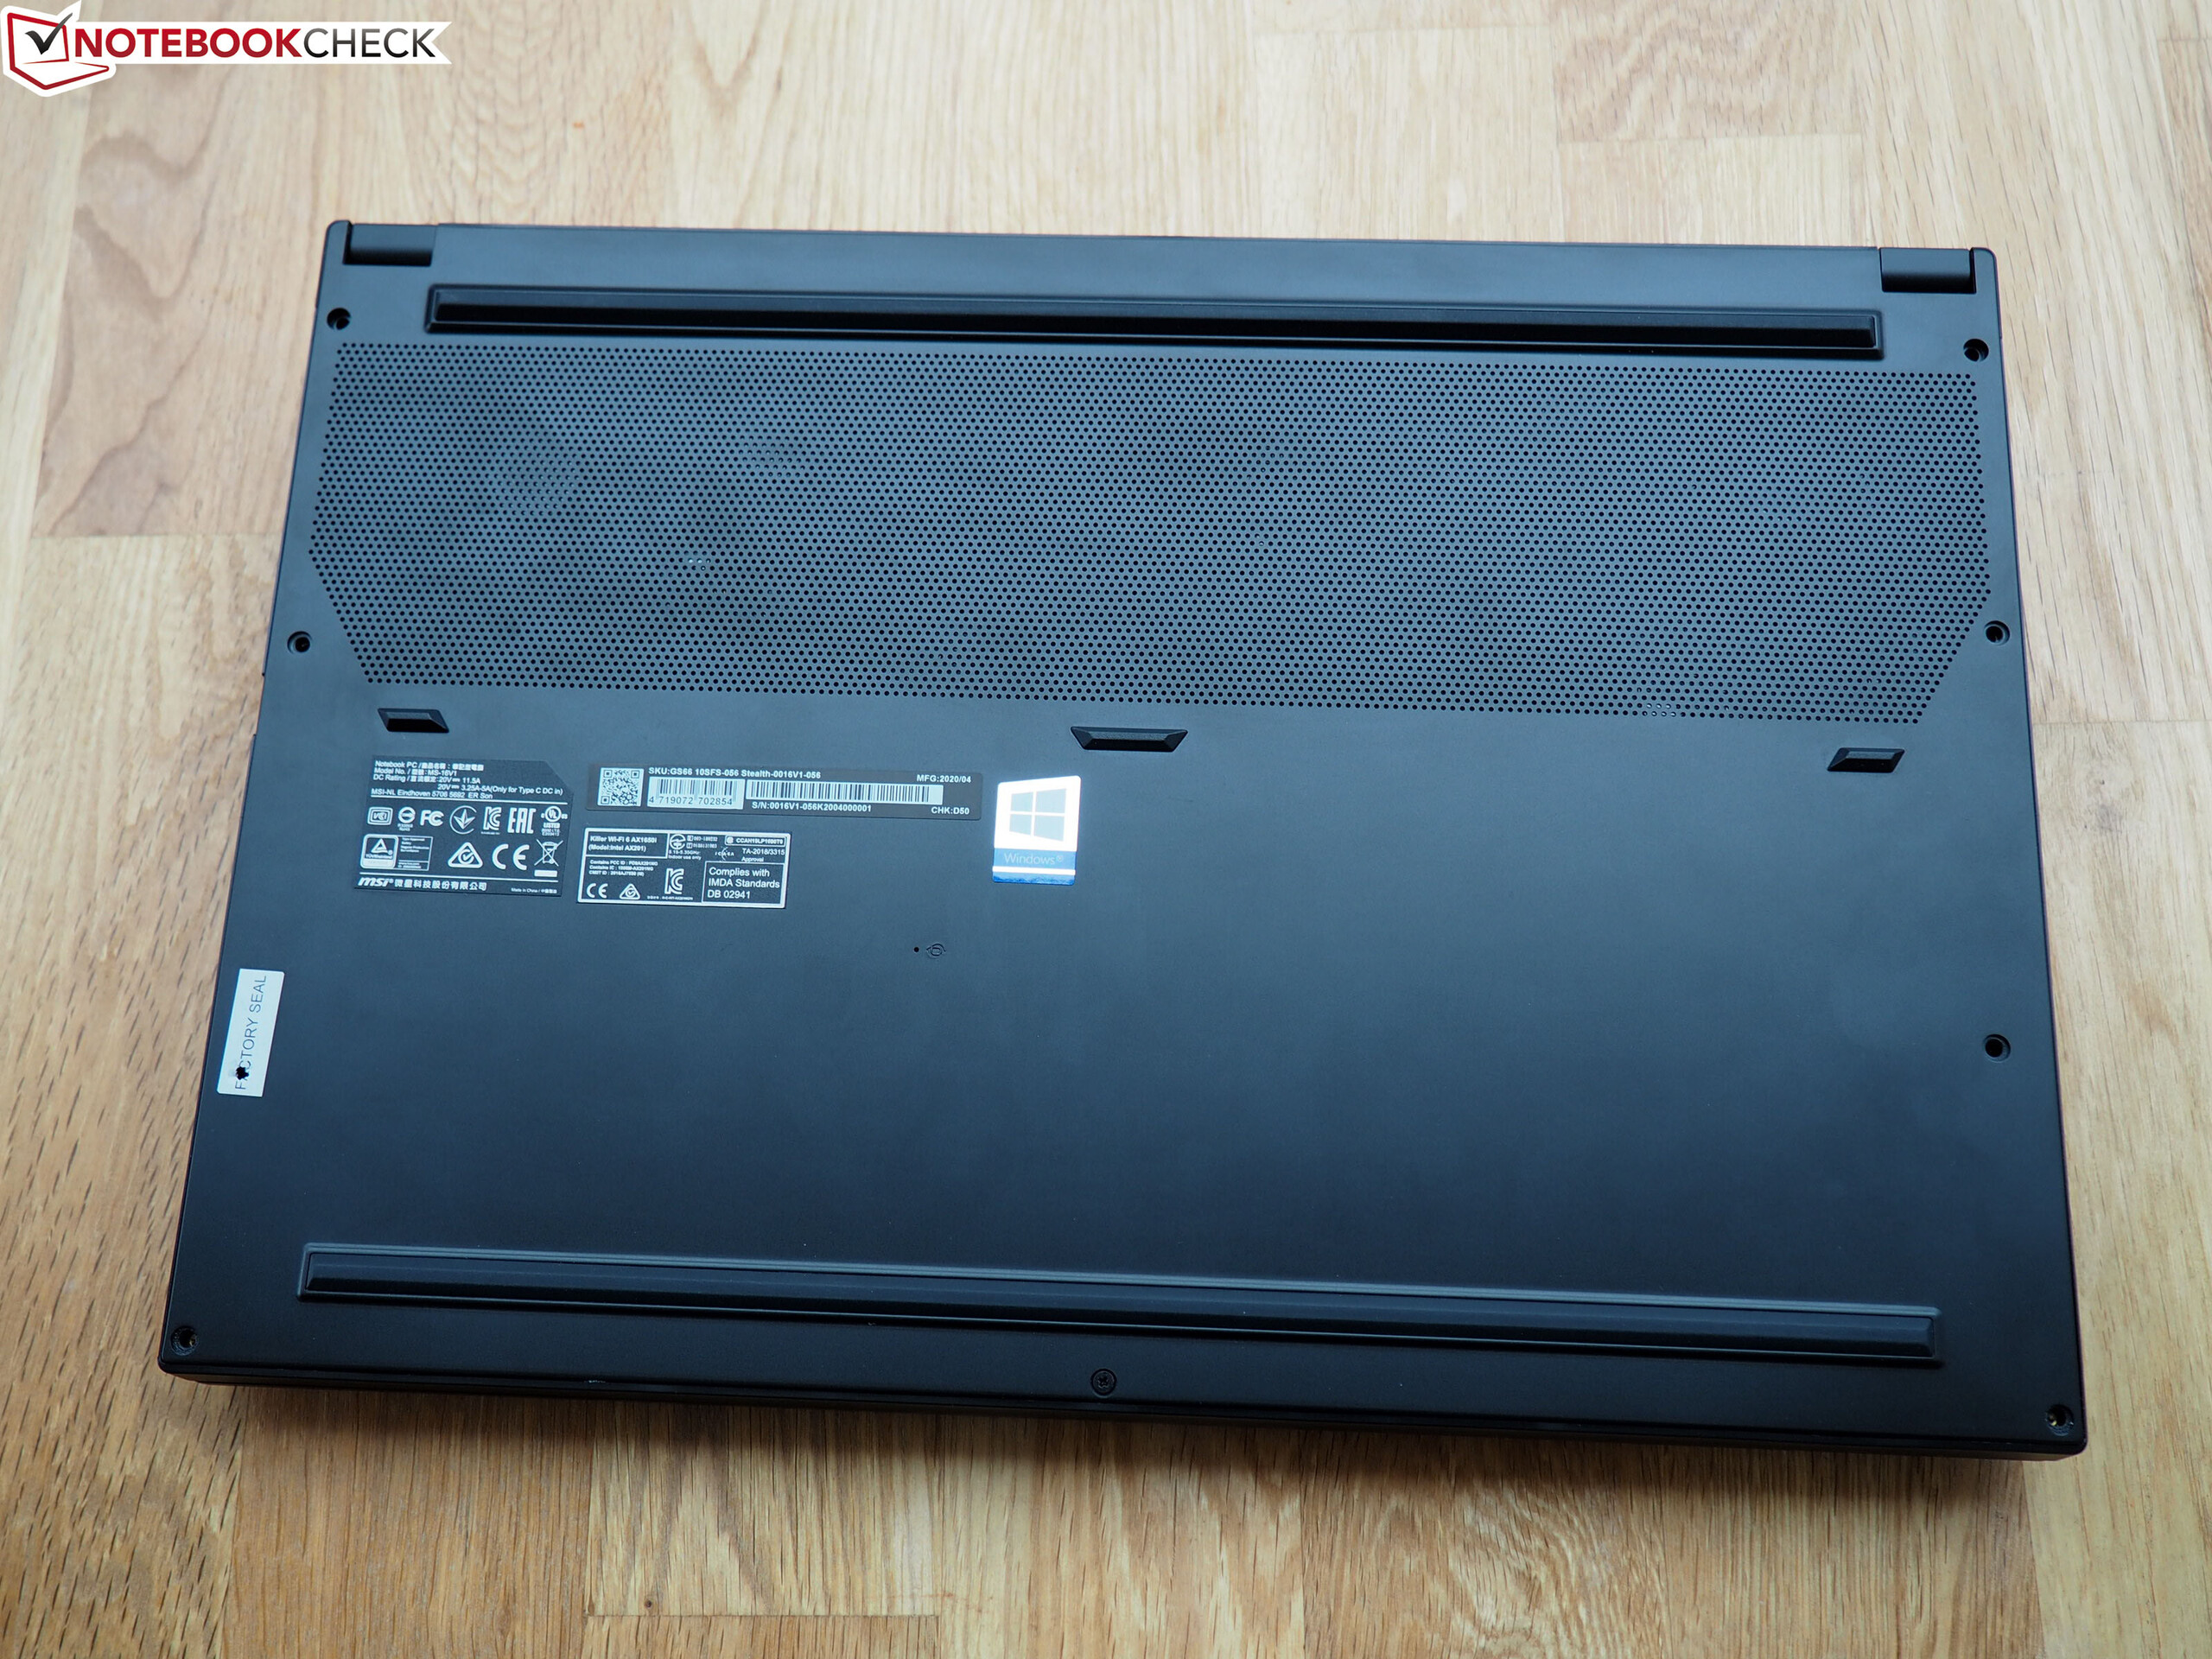
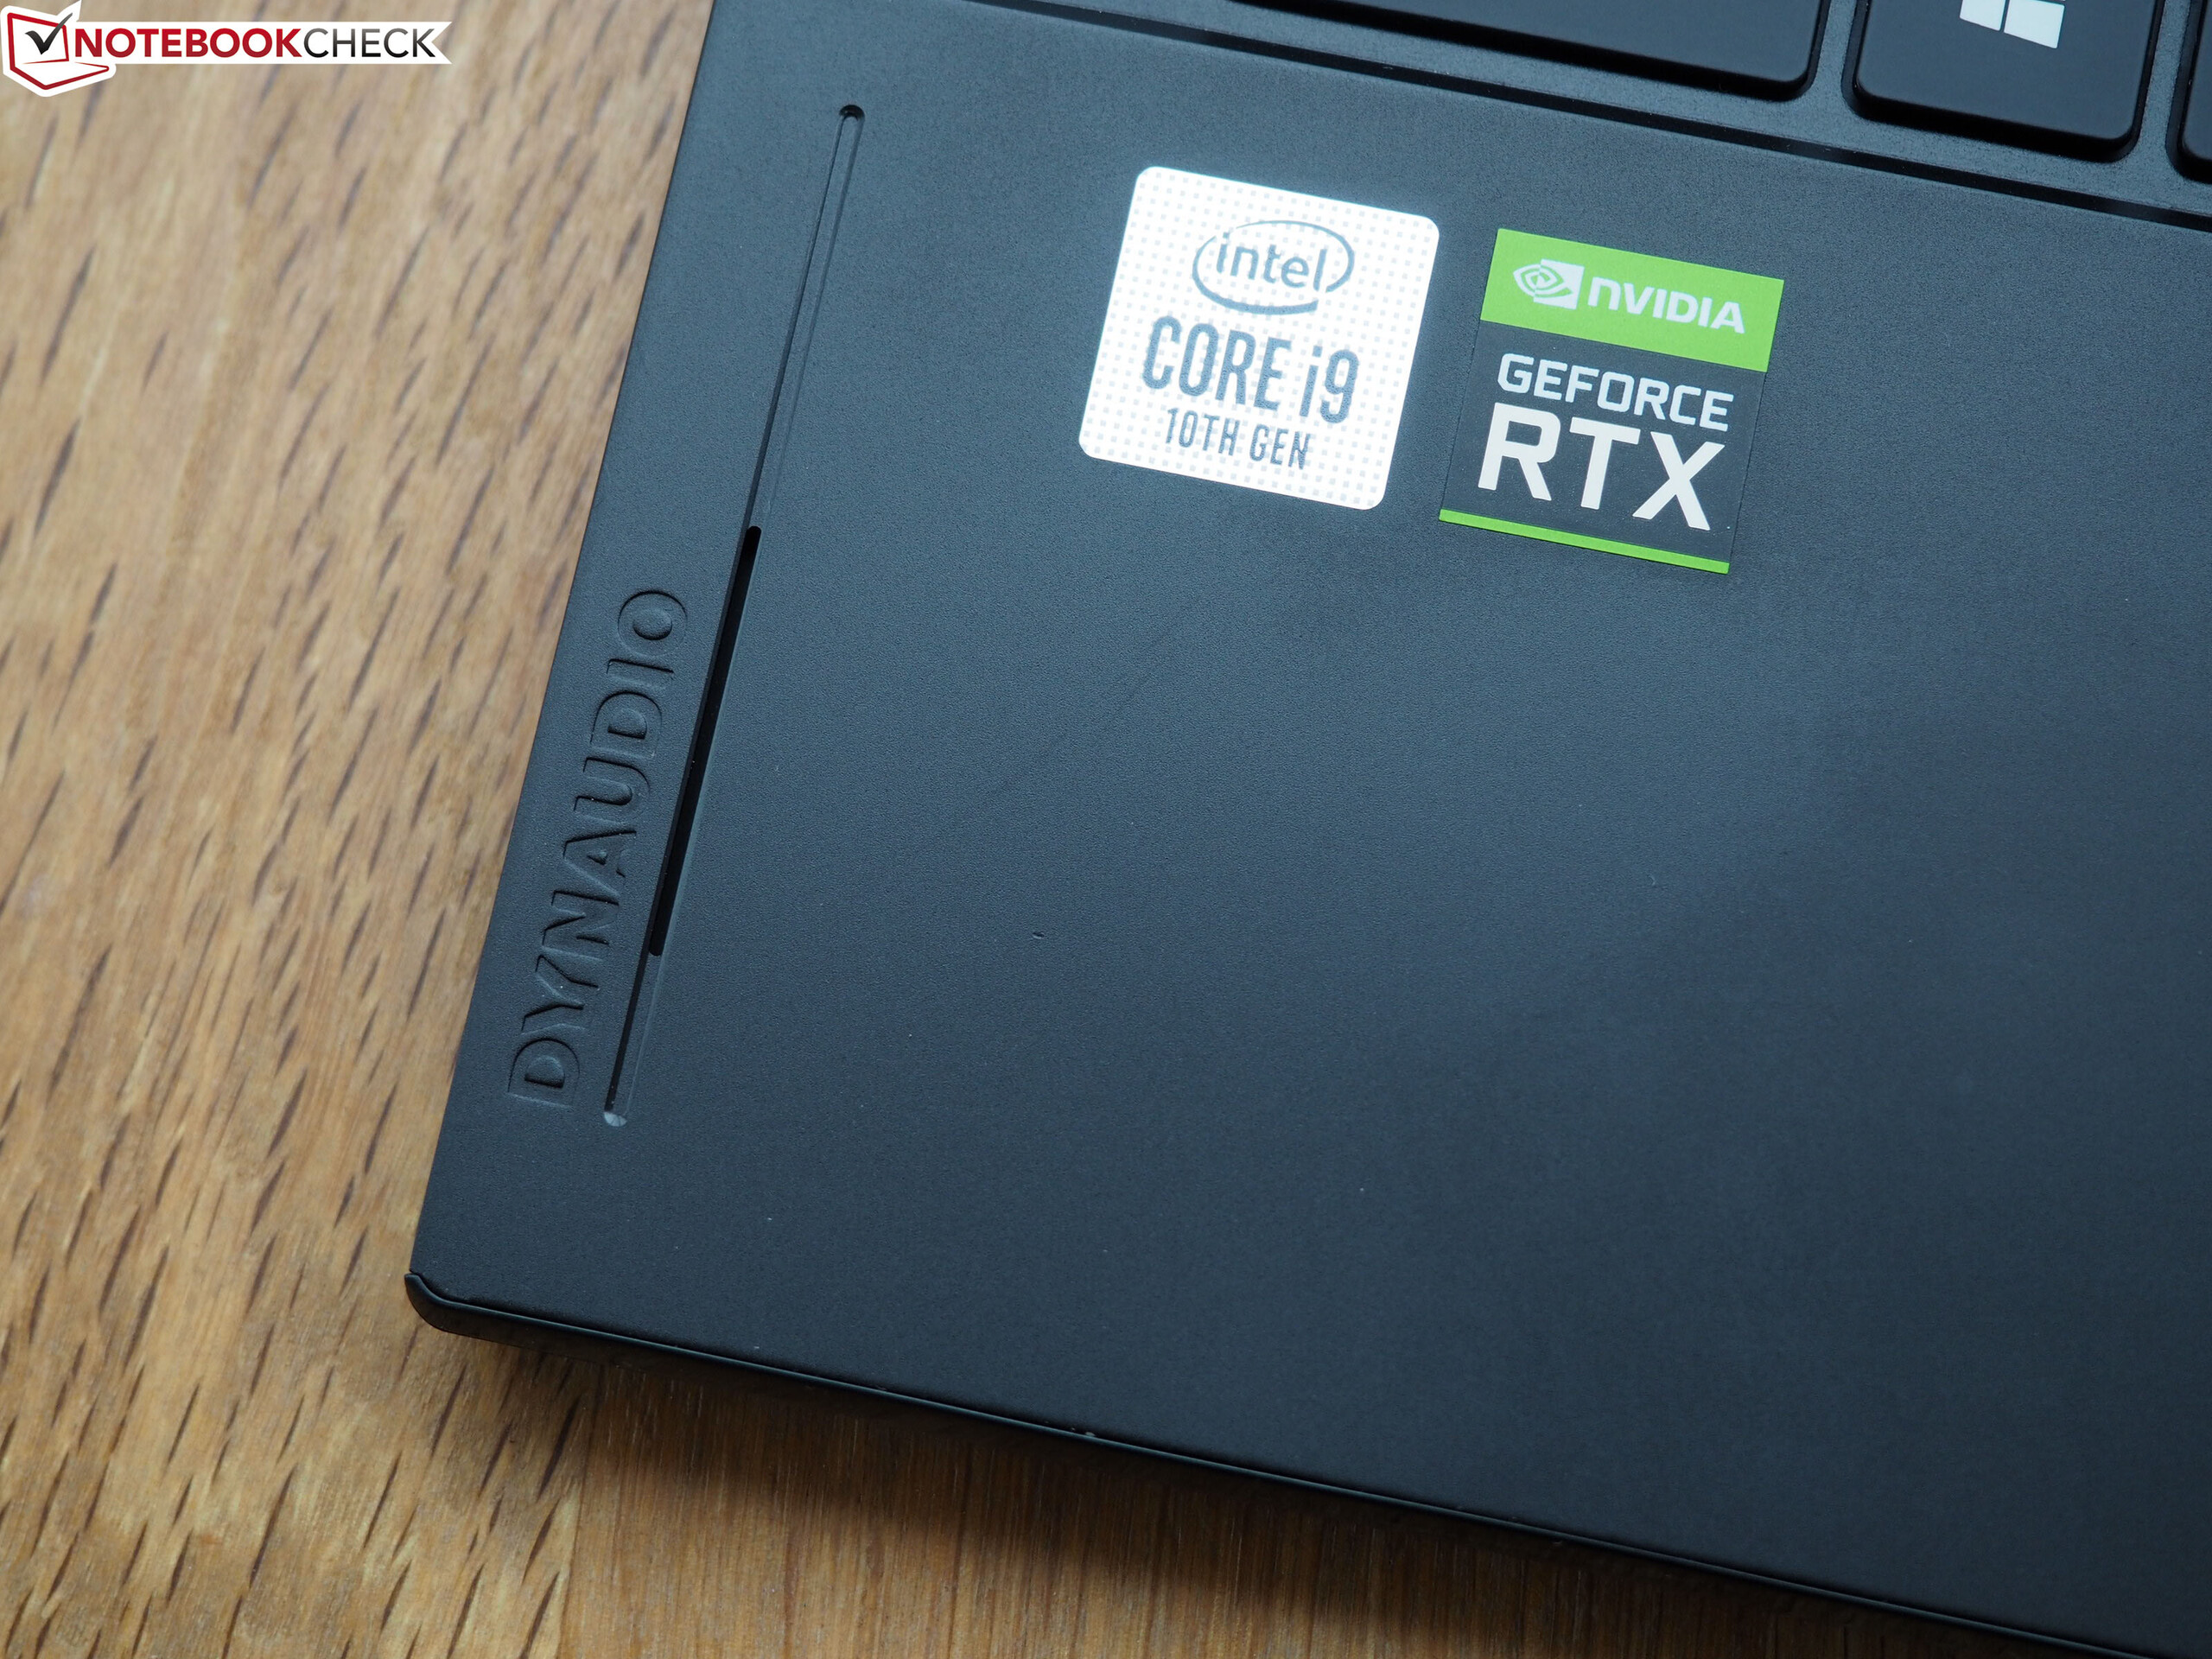
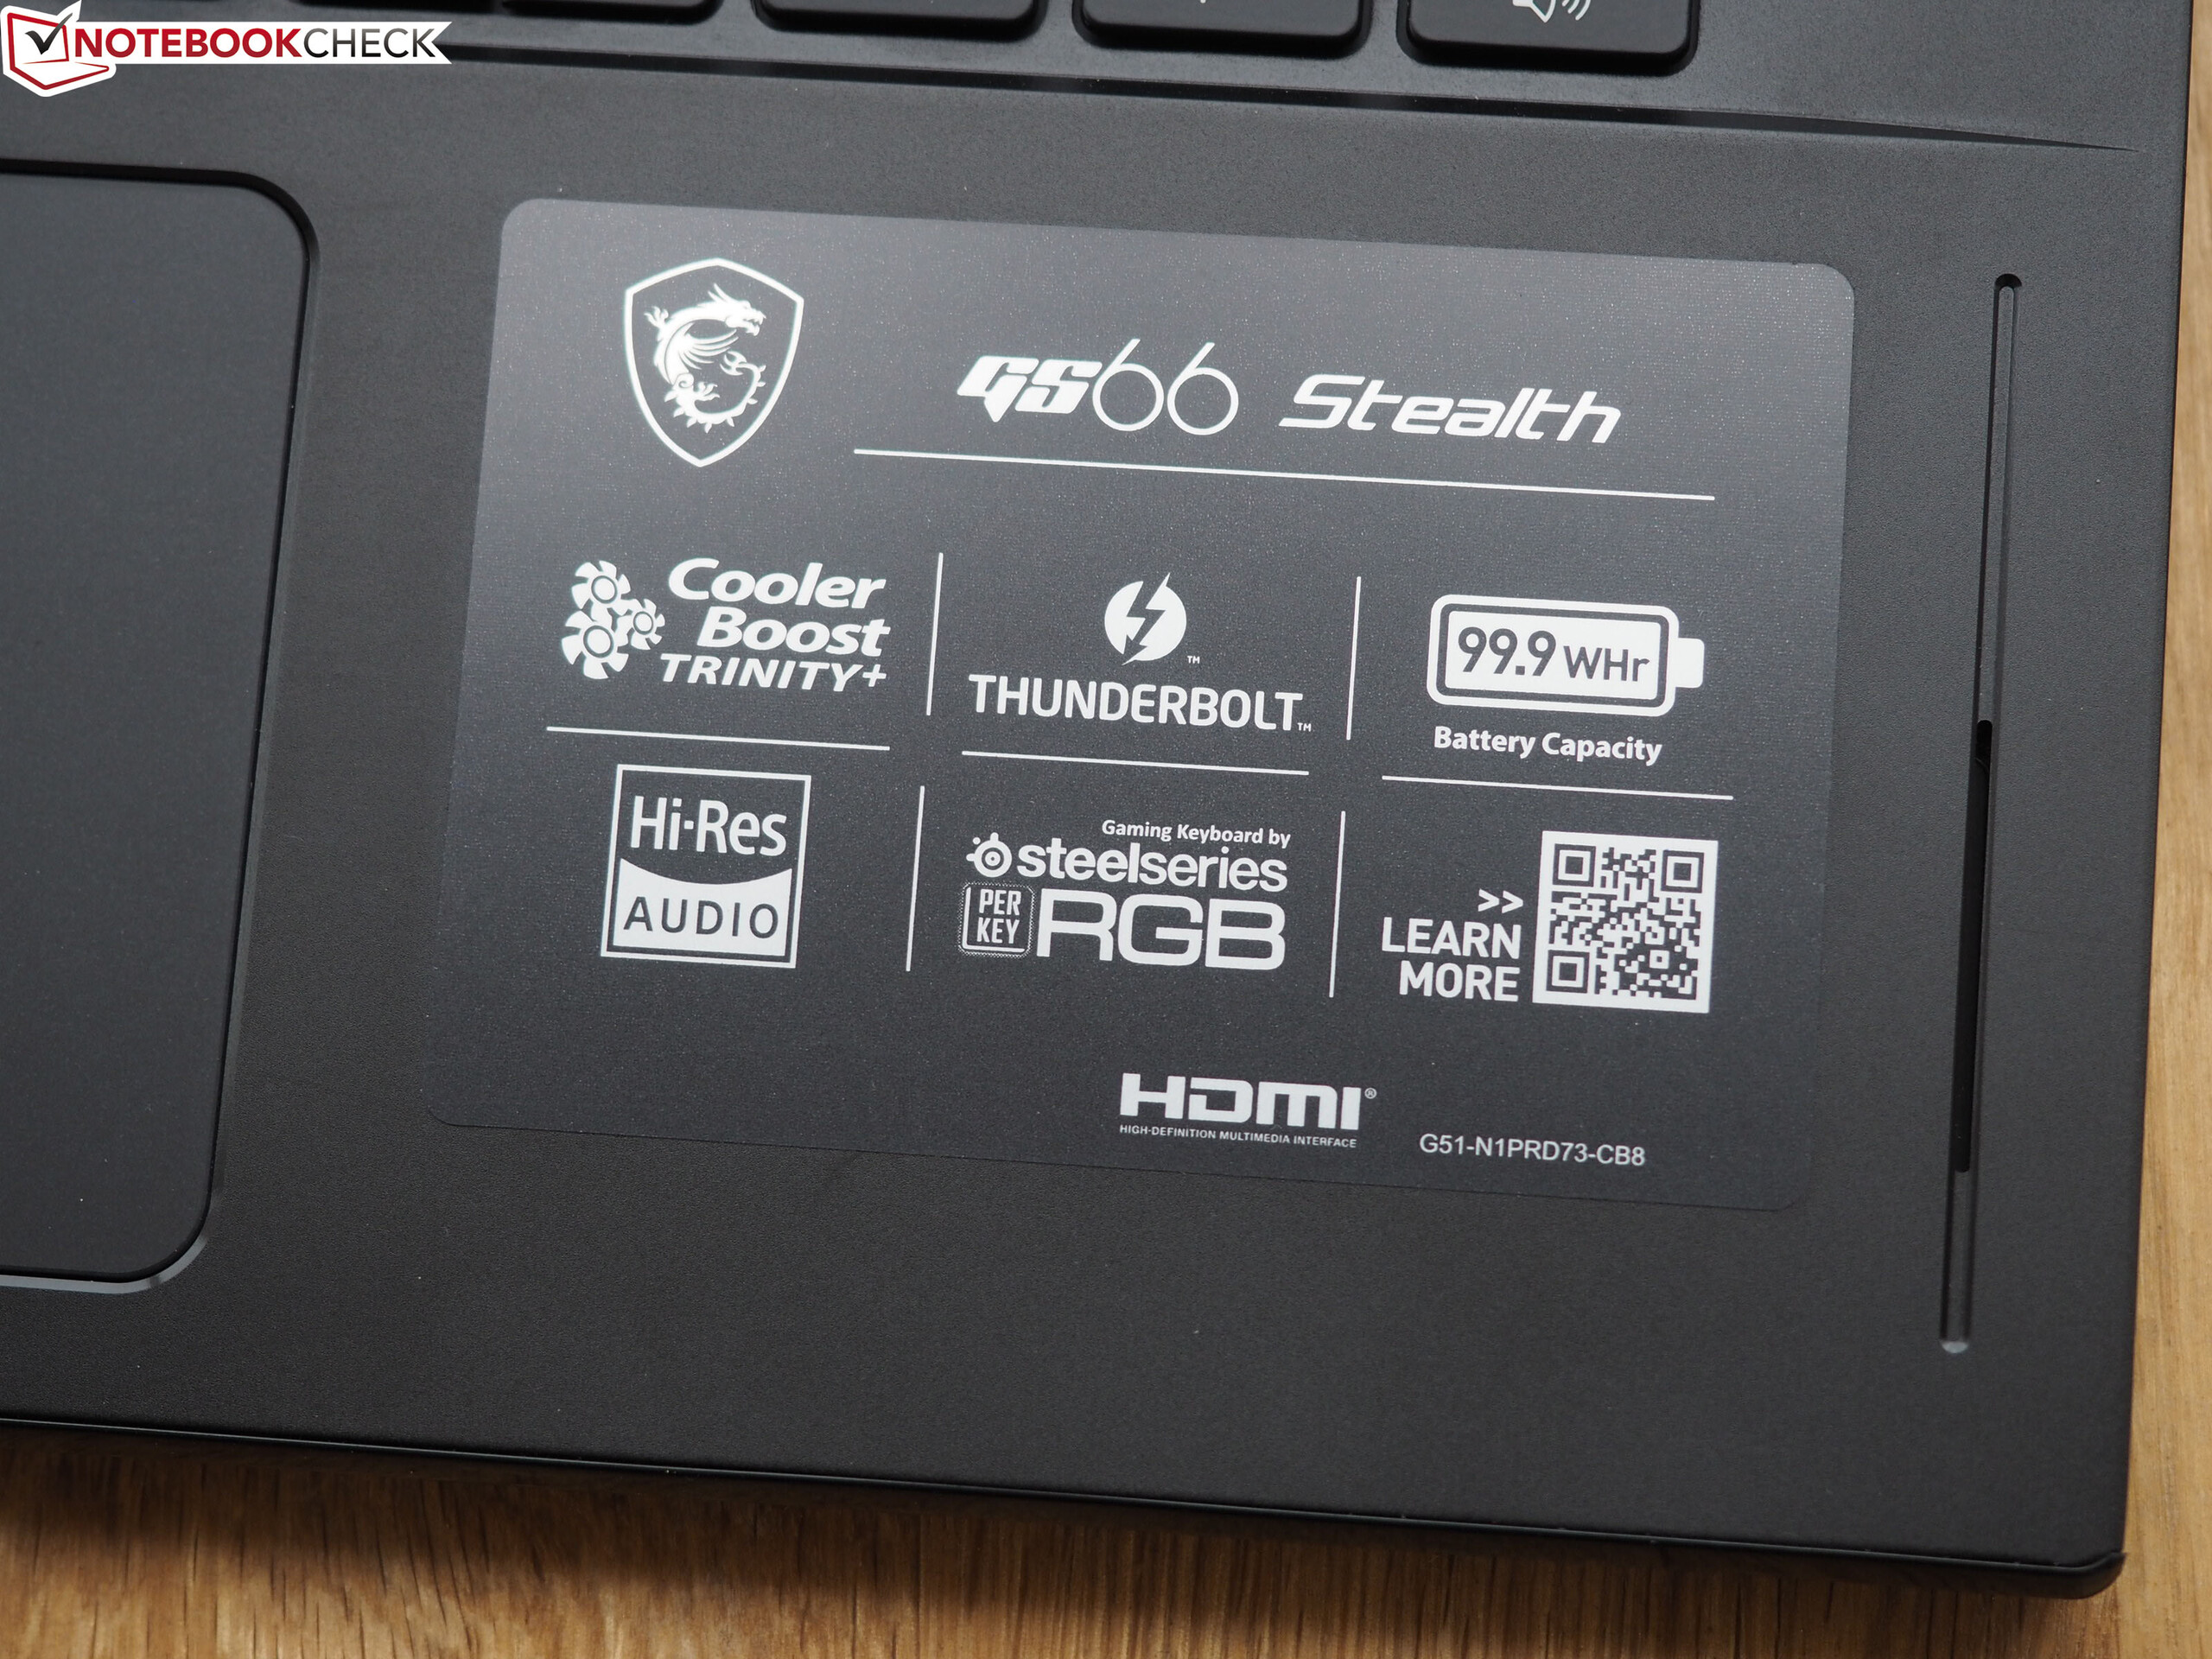
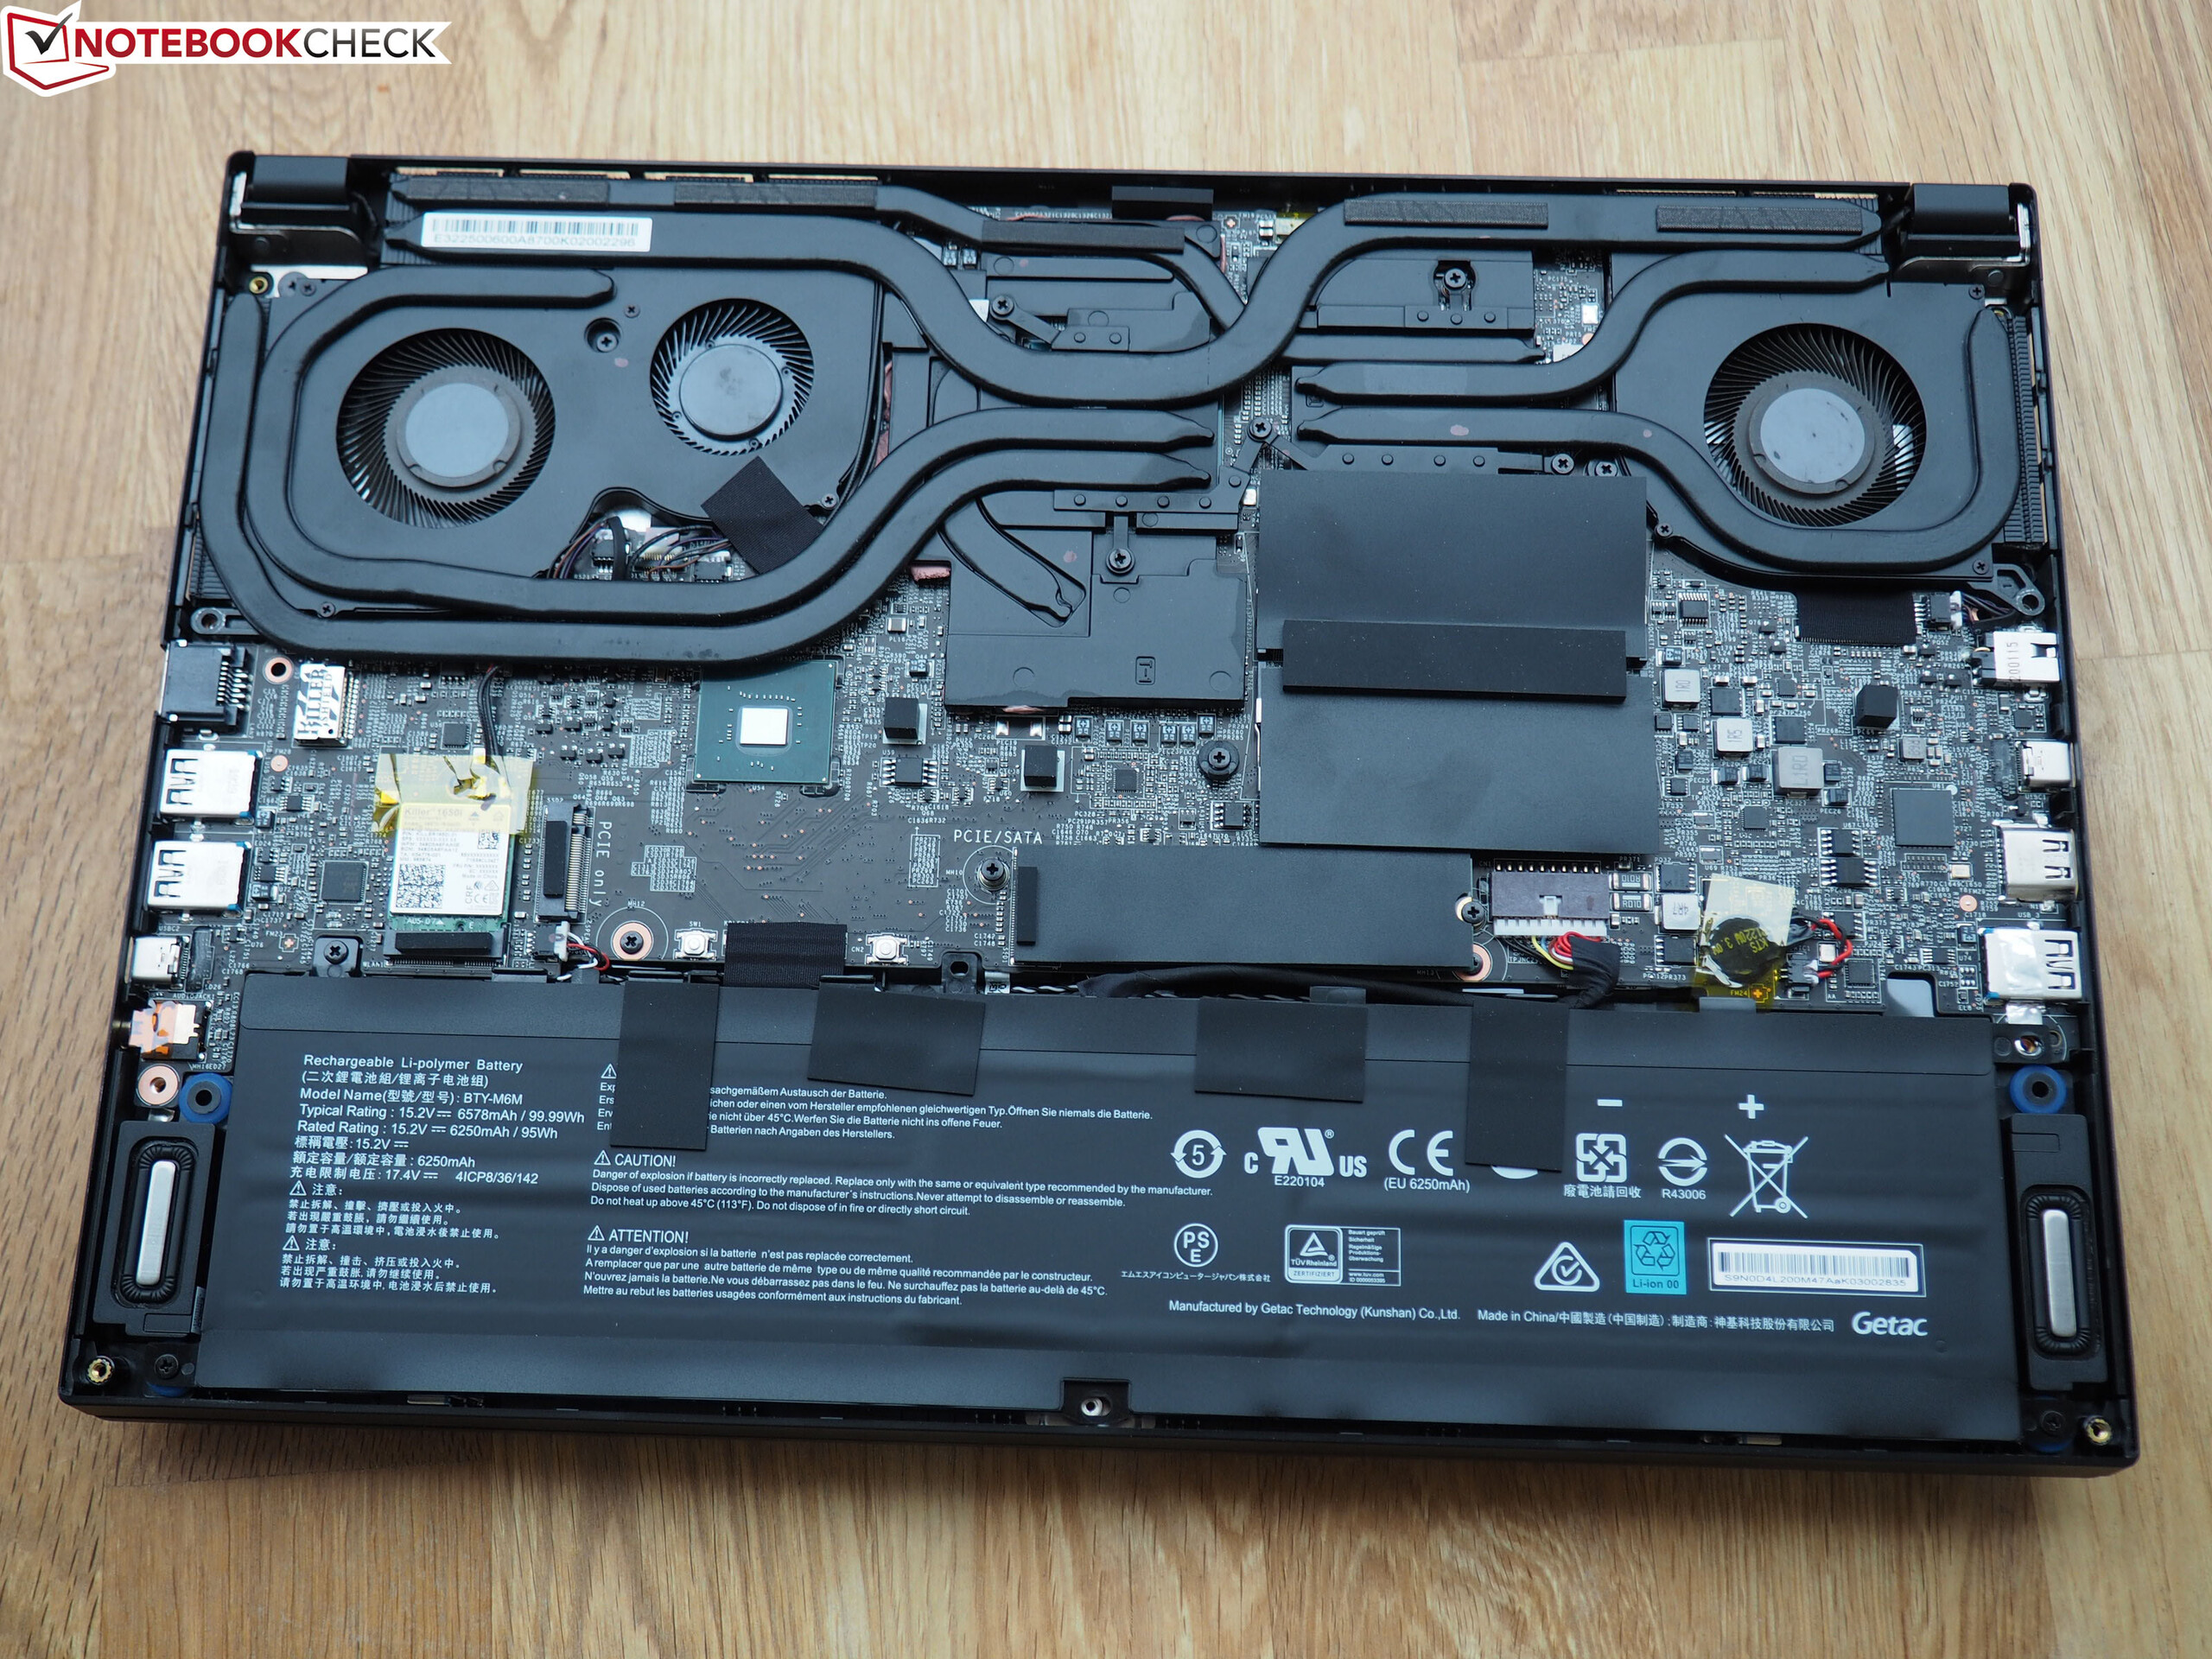
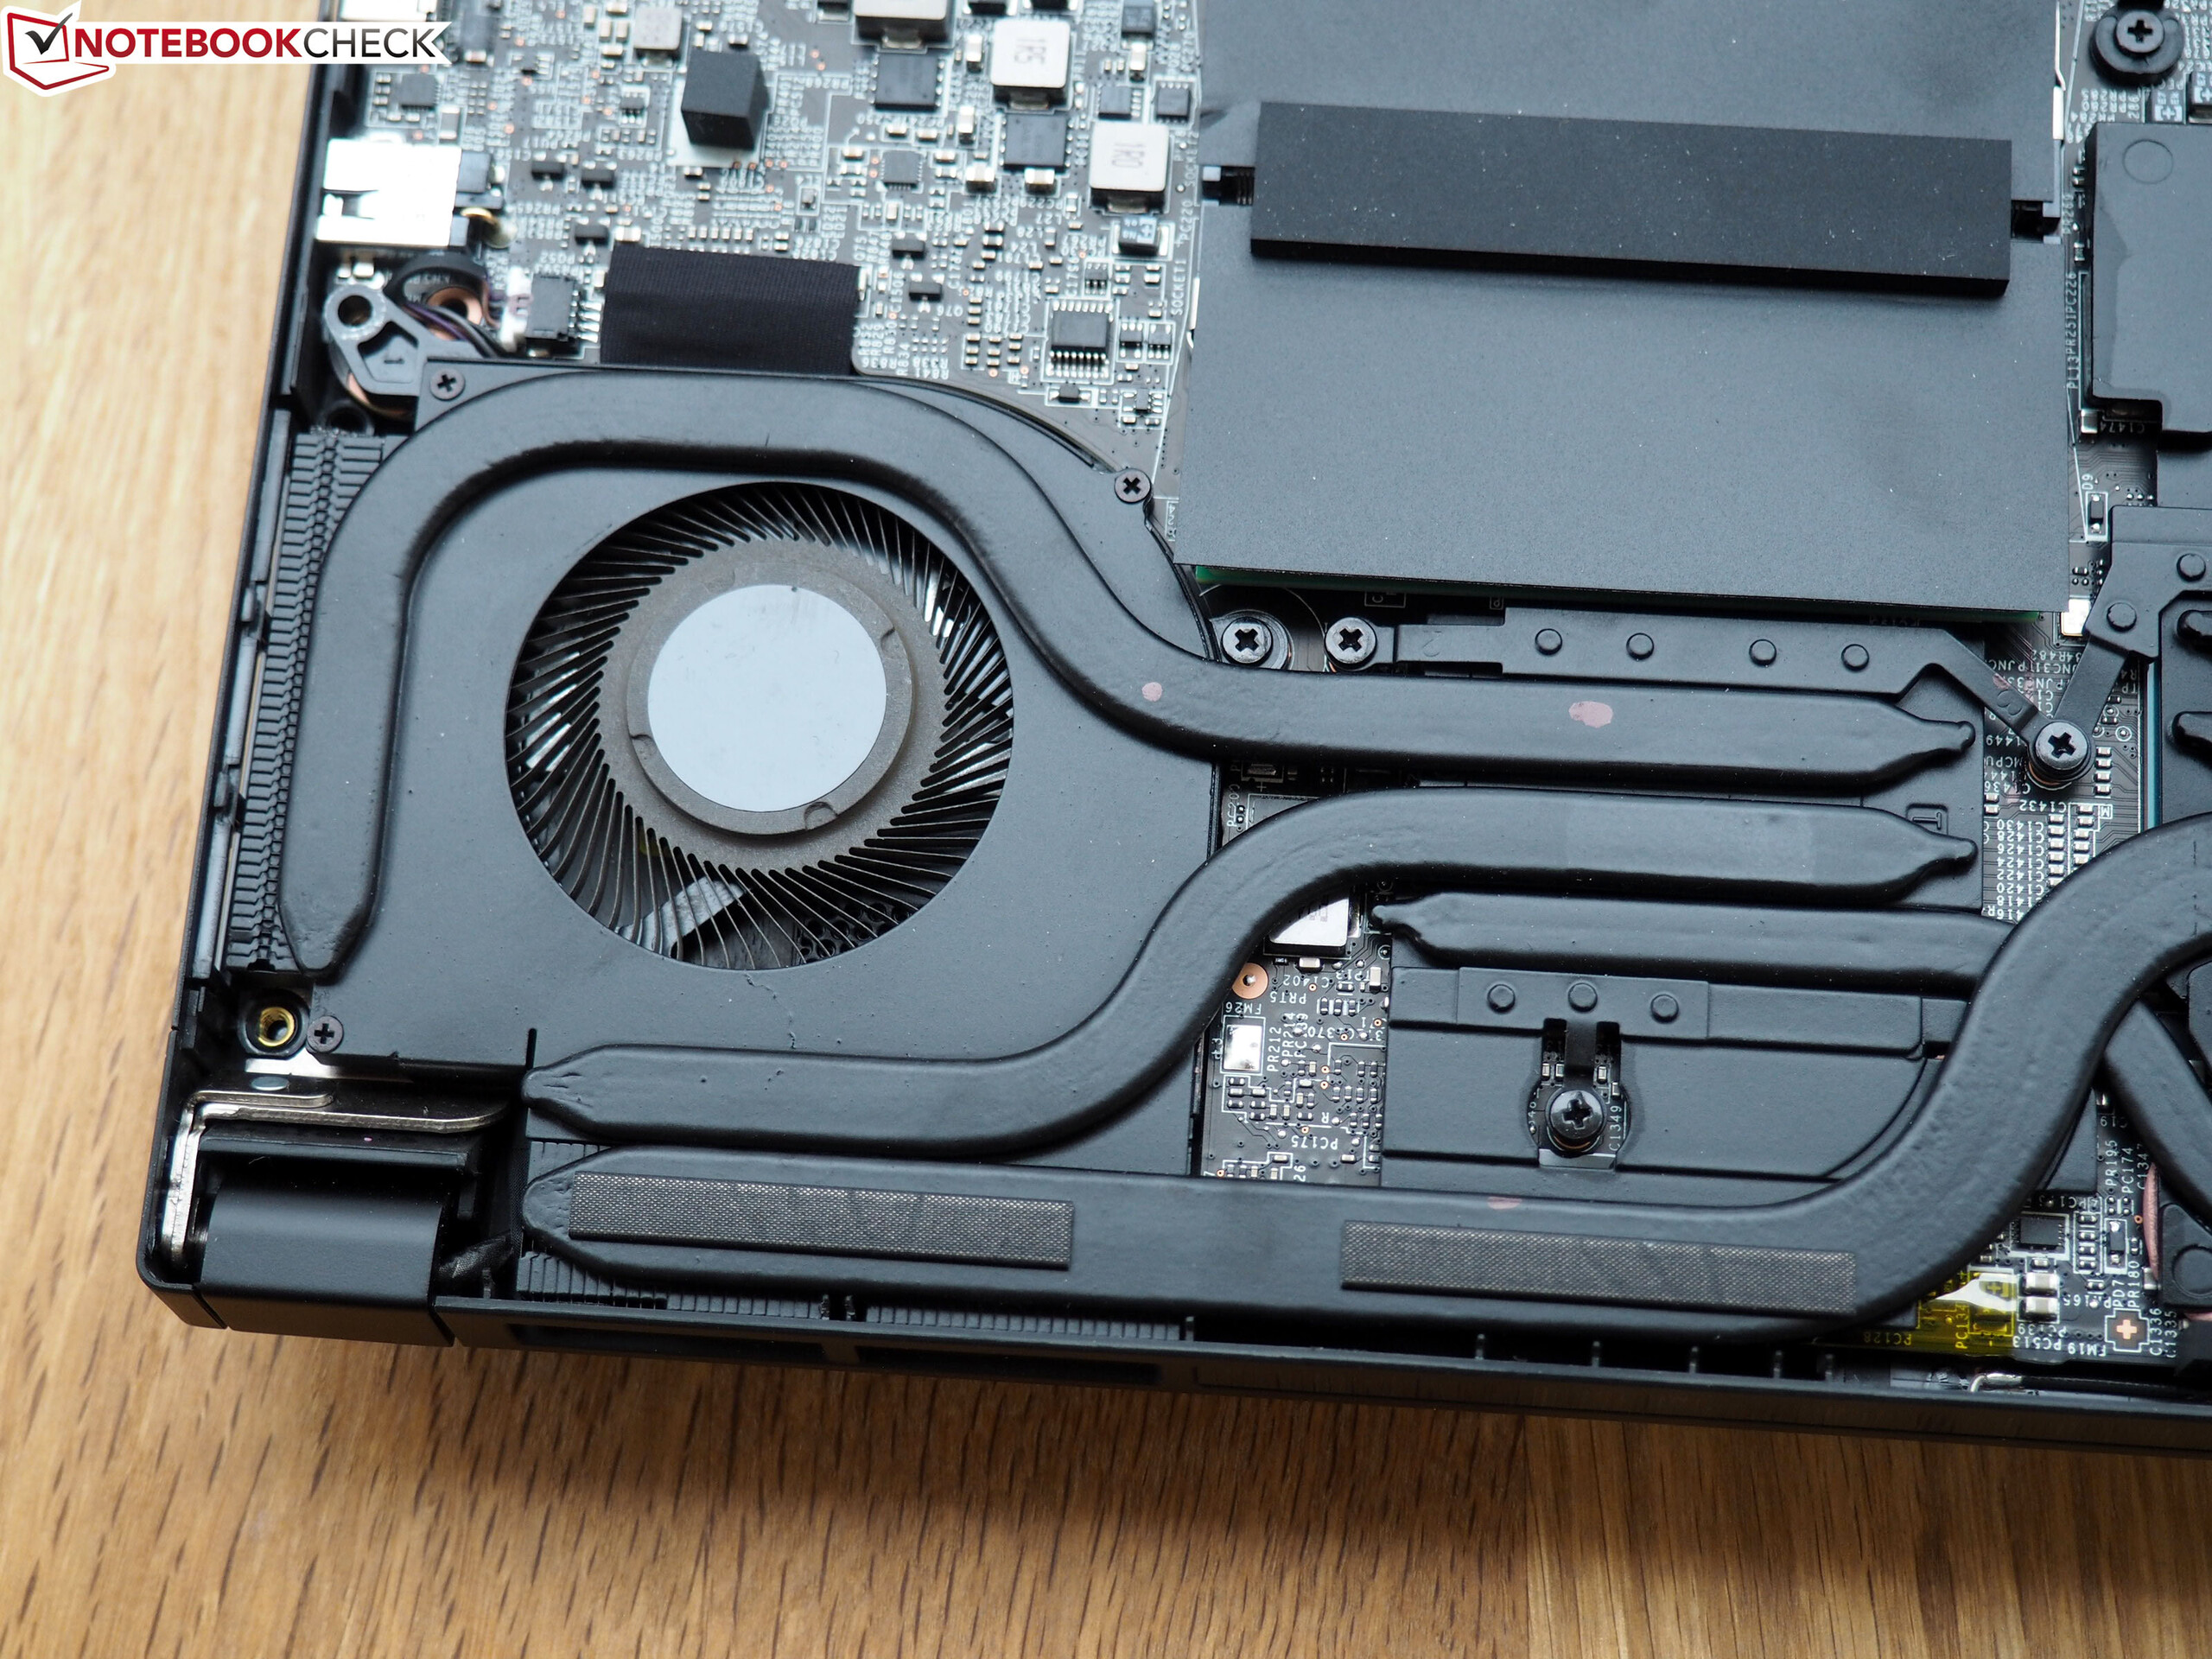
MSI处理了最重要的不满,并为紧凑机身提供了更多的稳定性和维护选项。它也应该因最新的连接设备(Thunderbolt 3),快速且对比度高的300-Hz面板以及巨大的电池而受到称赞,即使电池潜能还未完全被发掘。
我们发现处理器的选择有些难以理解。虽然从市场营销角度和收益方面来说,酷睿i9-10980HK当然是非常有吸引力的,但是如果客户要面对的弊端(高温和噪音增加)要比优势(更高的性能潜能)更多 并且笔记本通常是为移动而设计的,我们一开始就不会建议此选项。
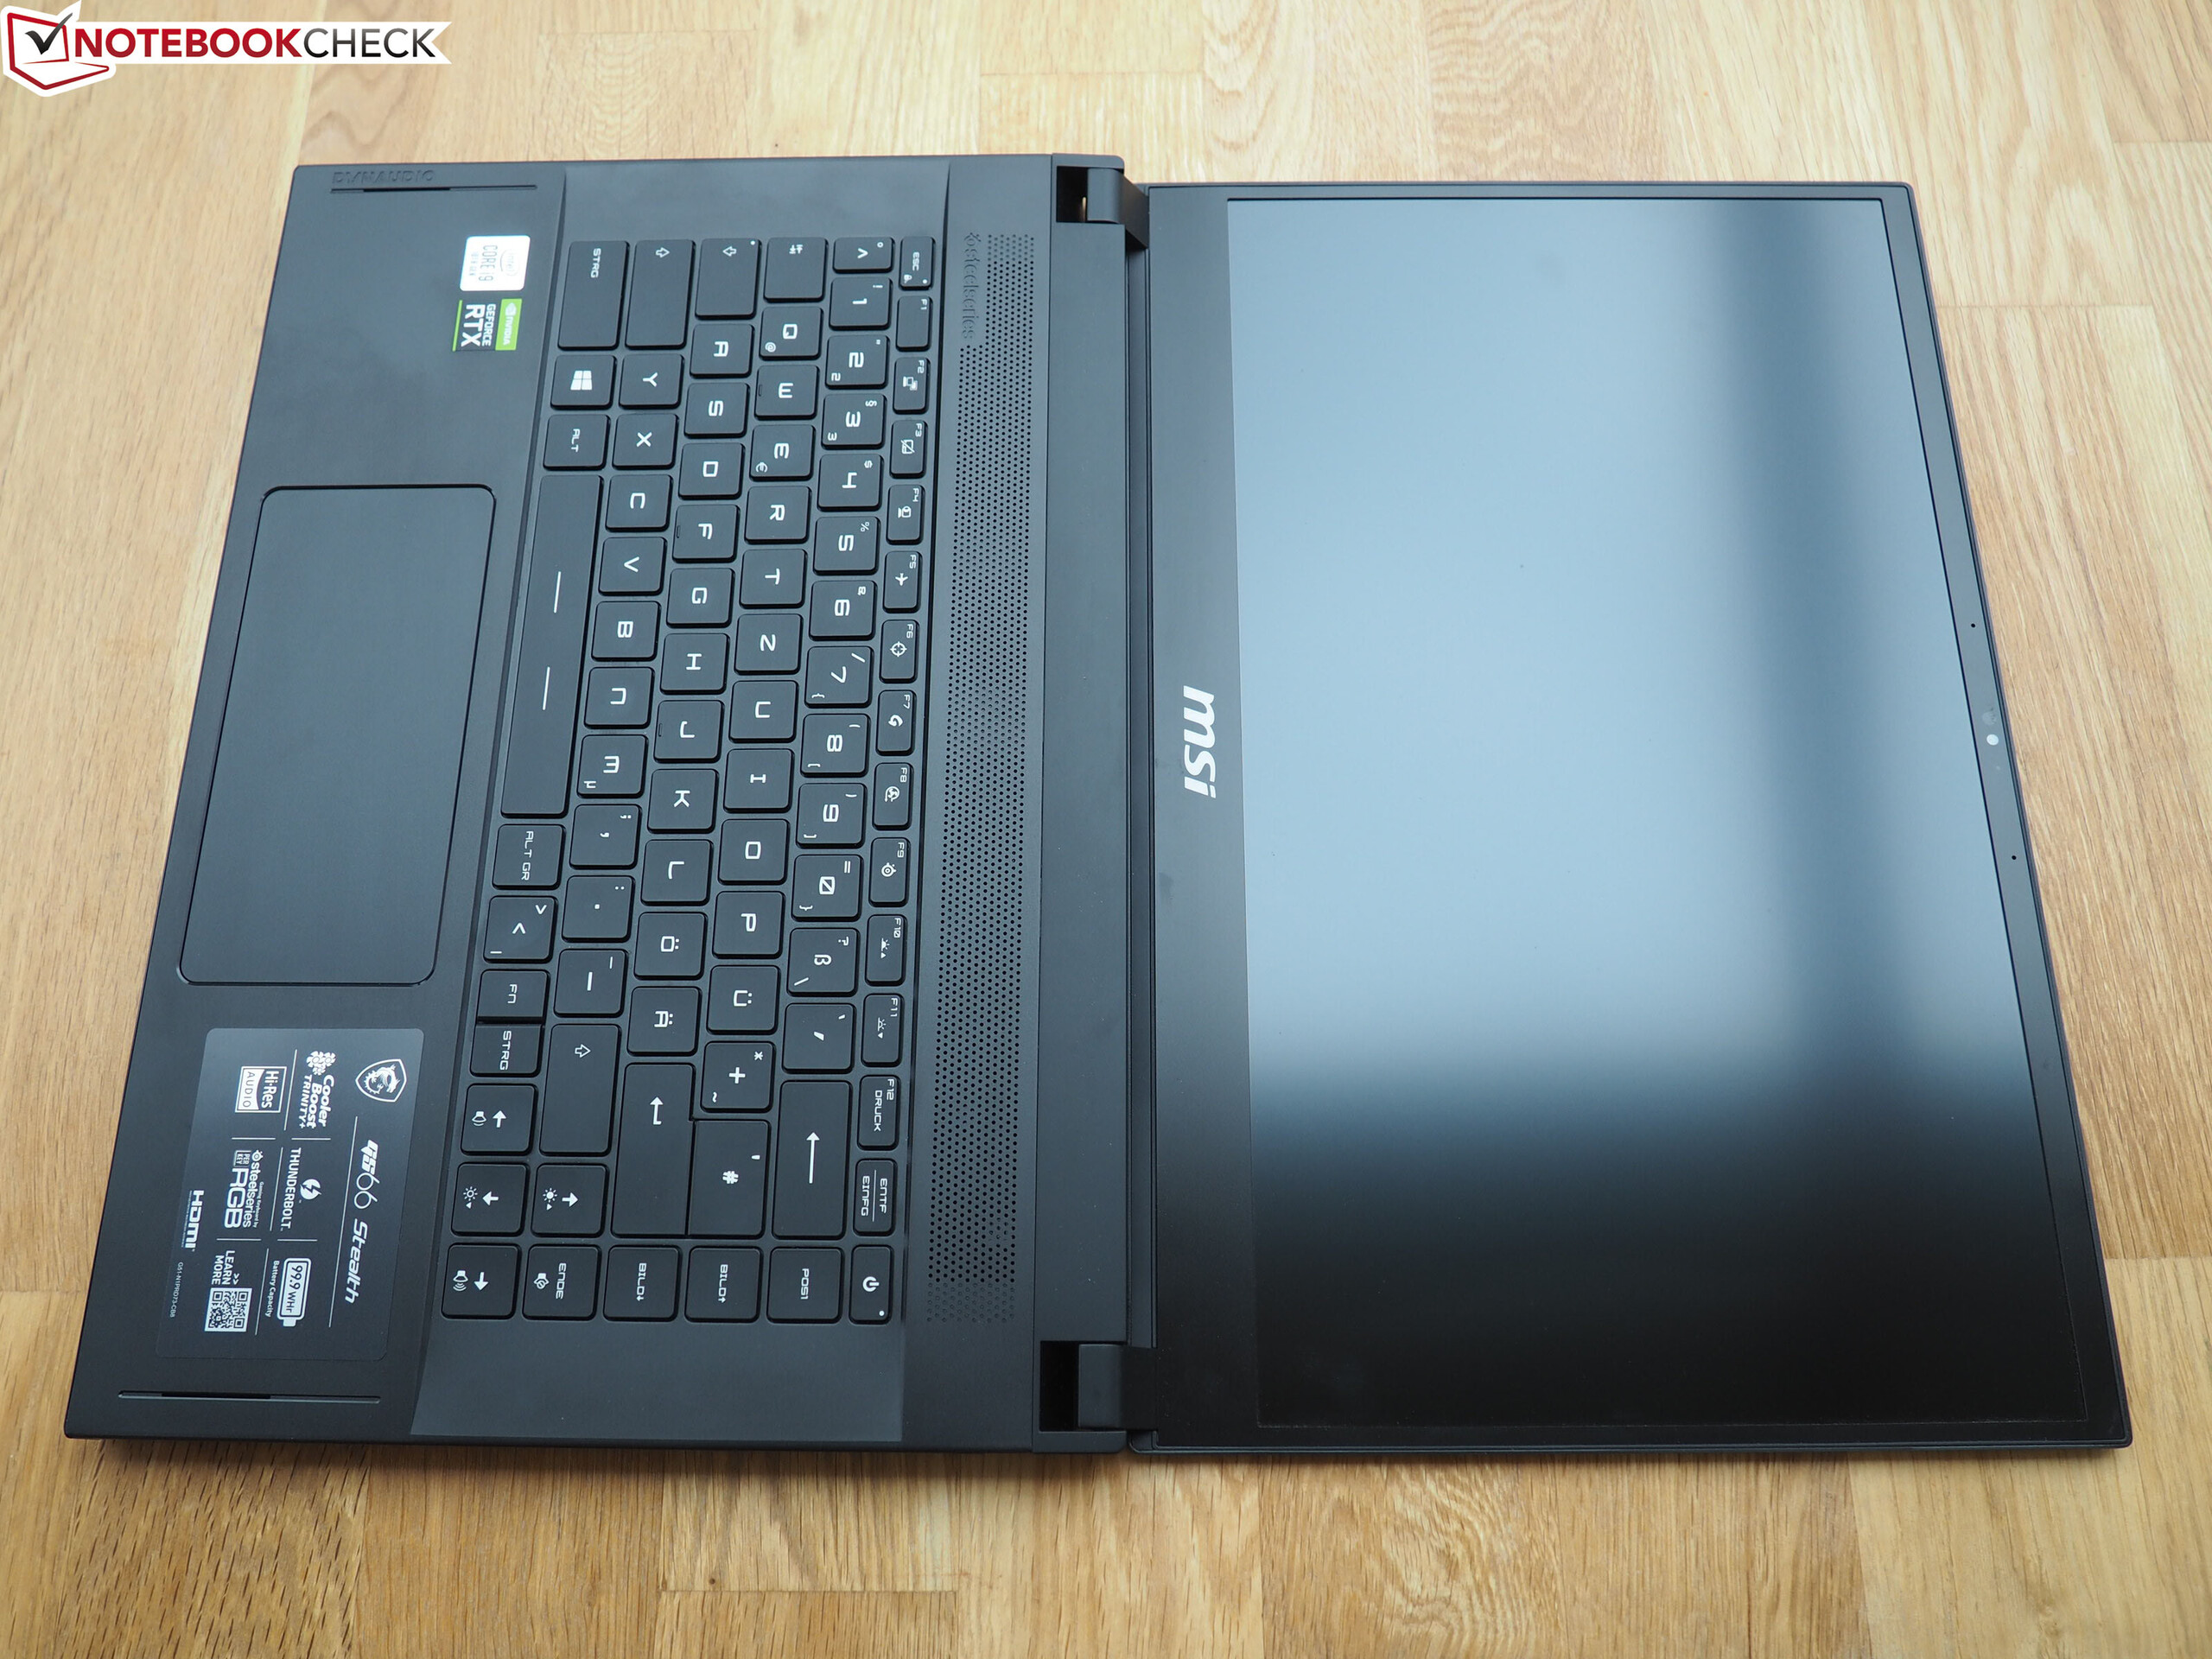
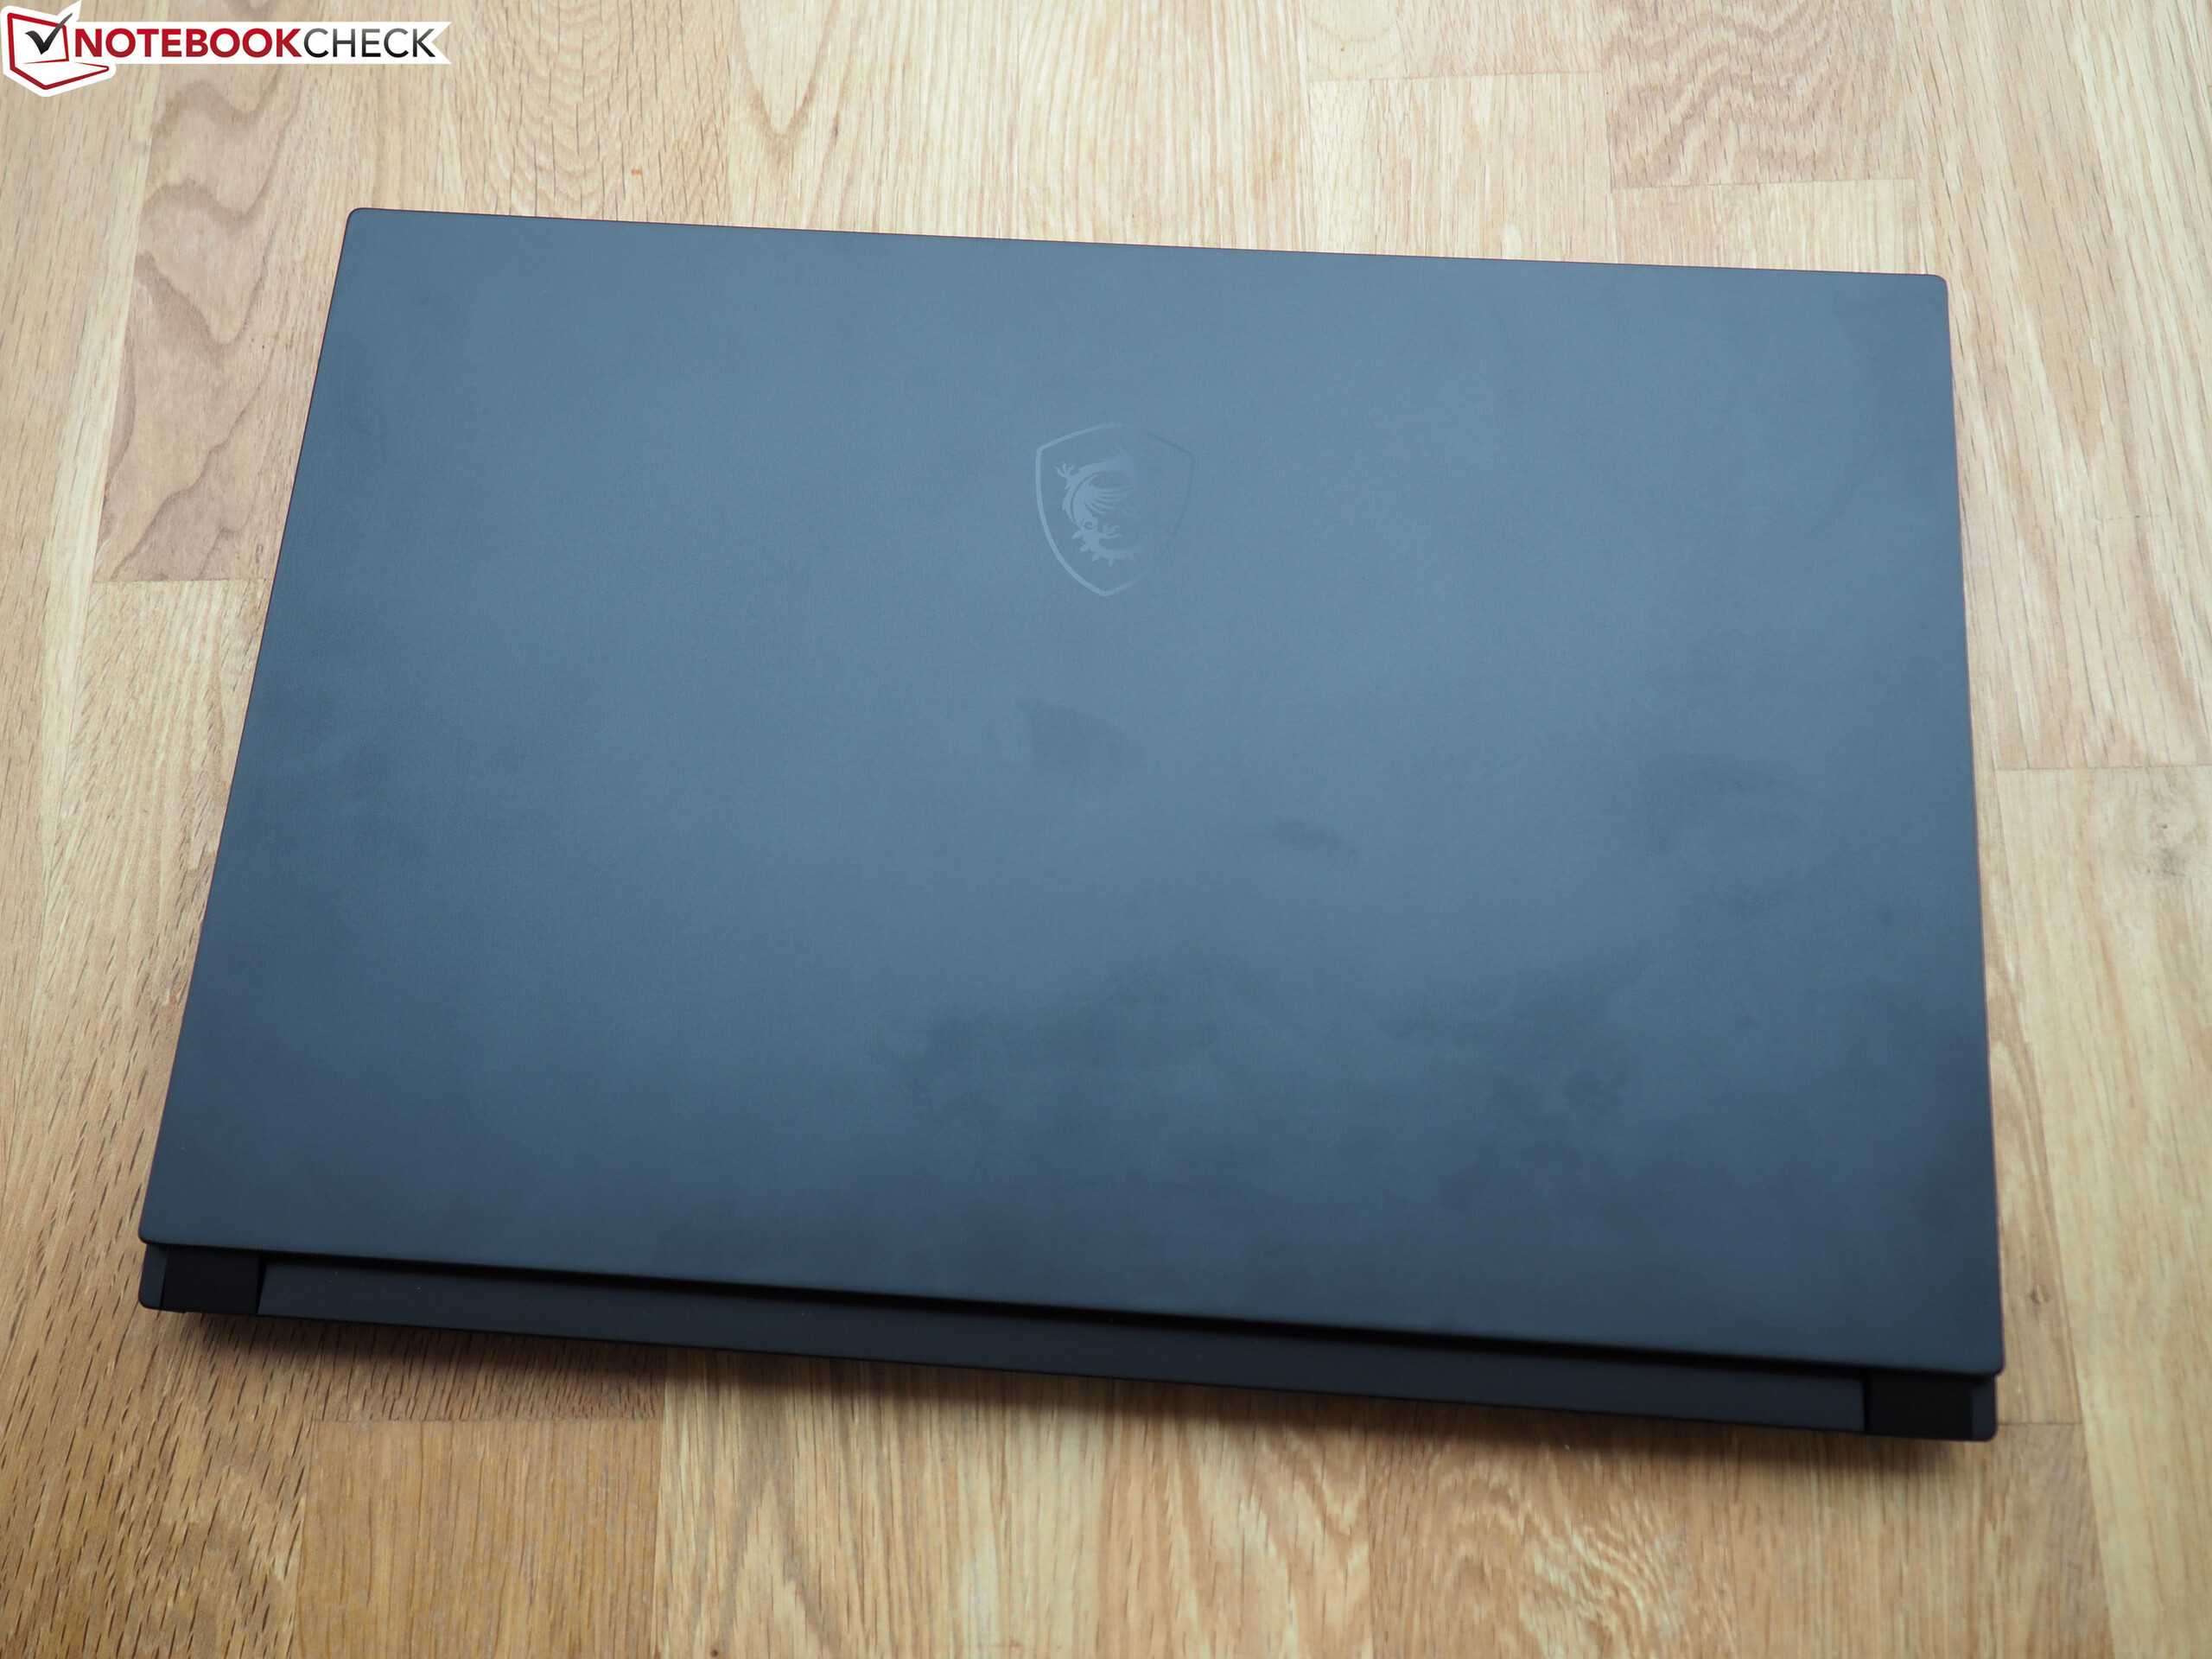
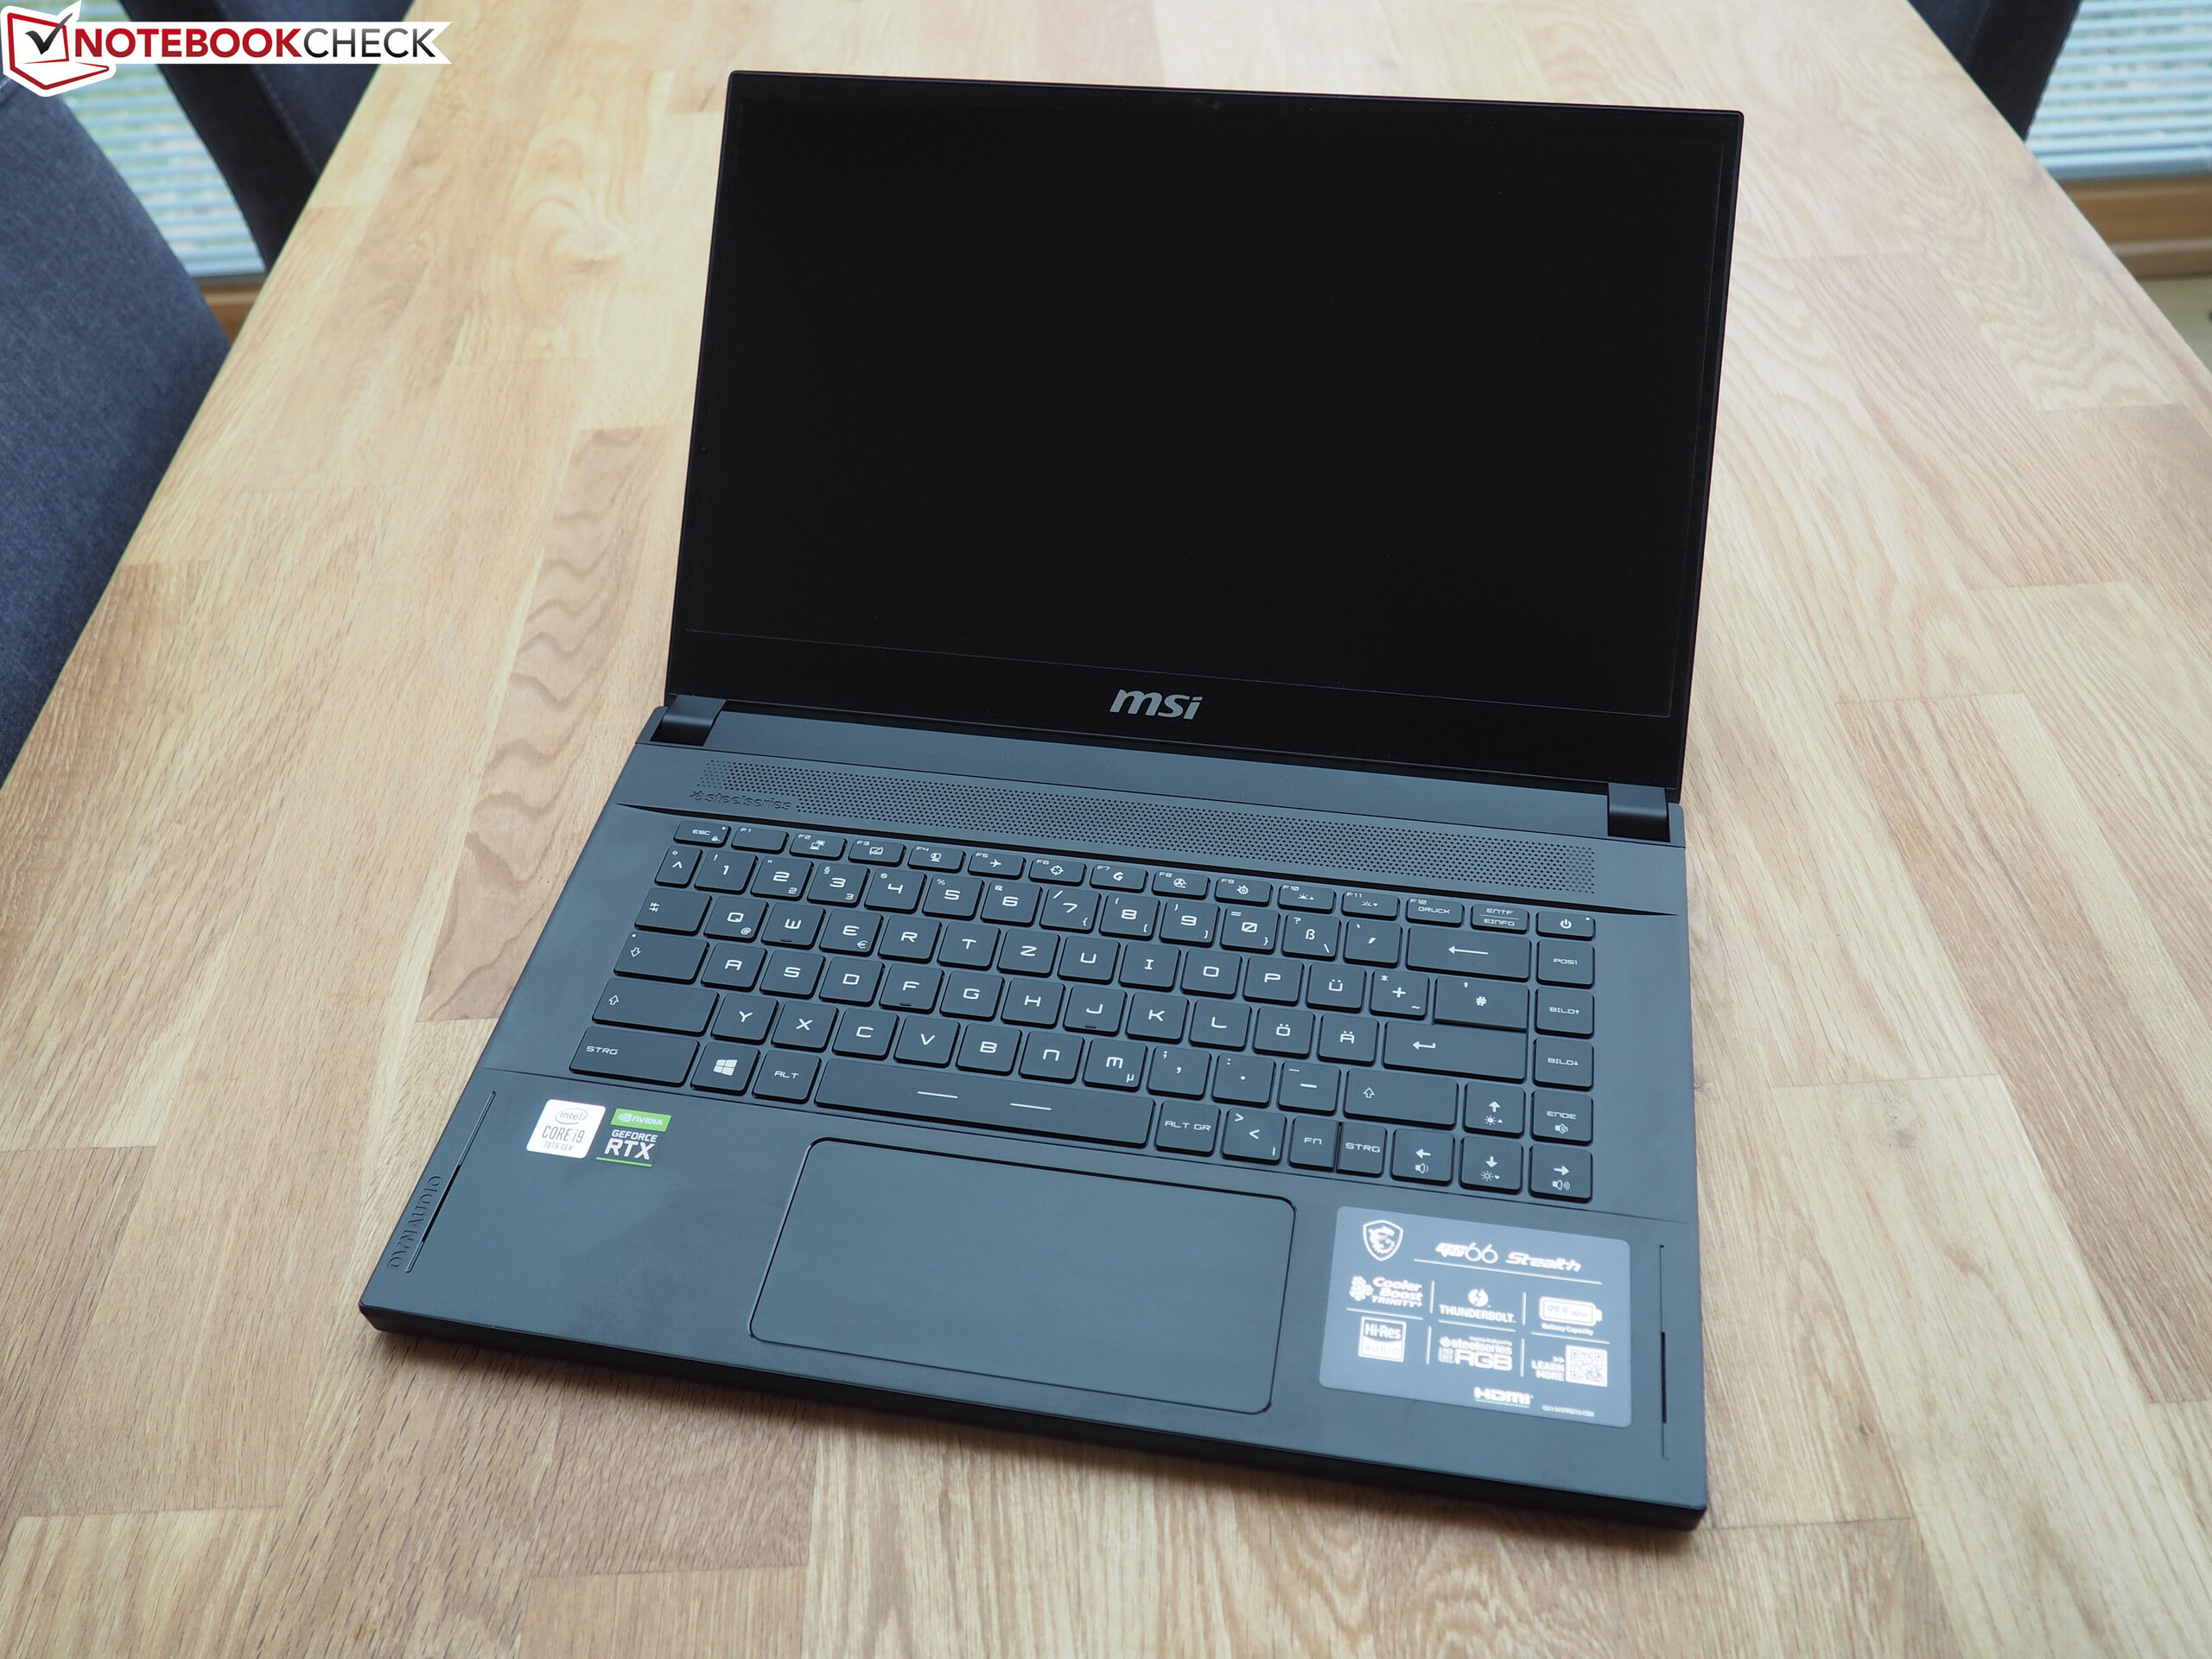
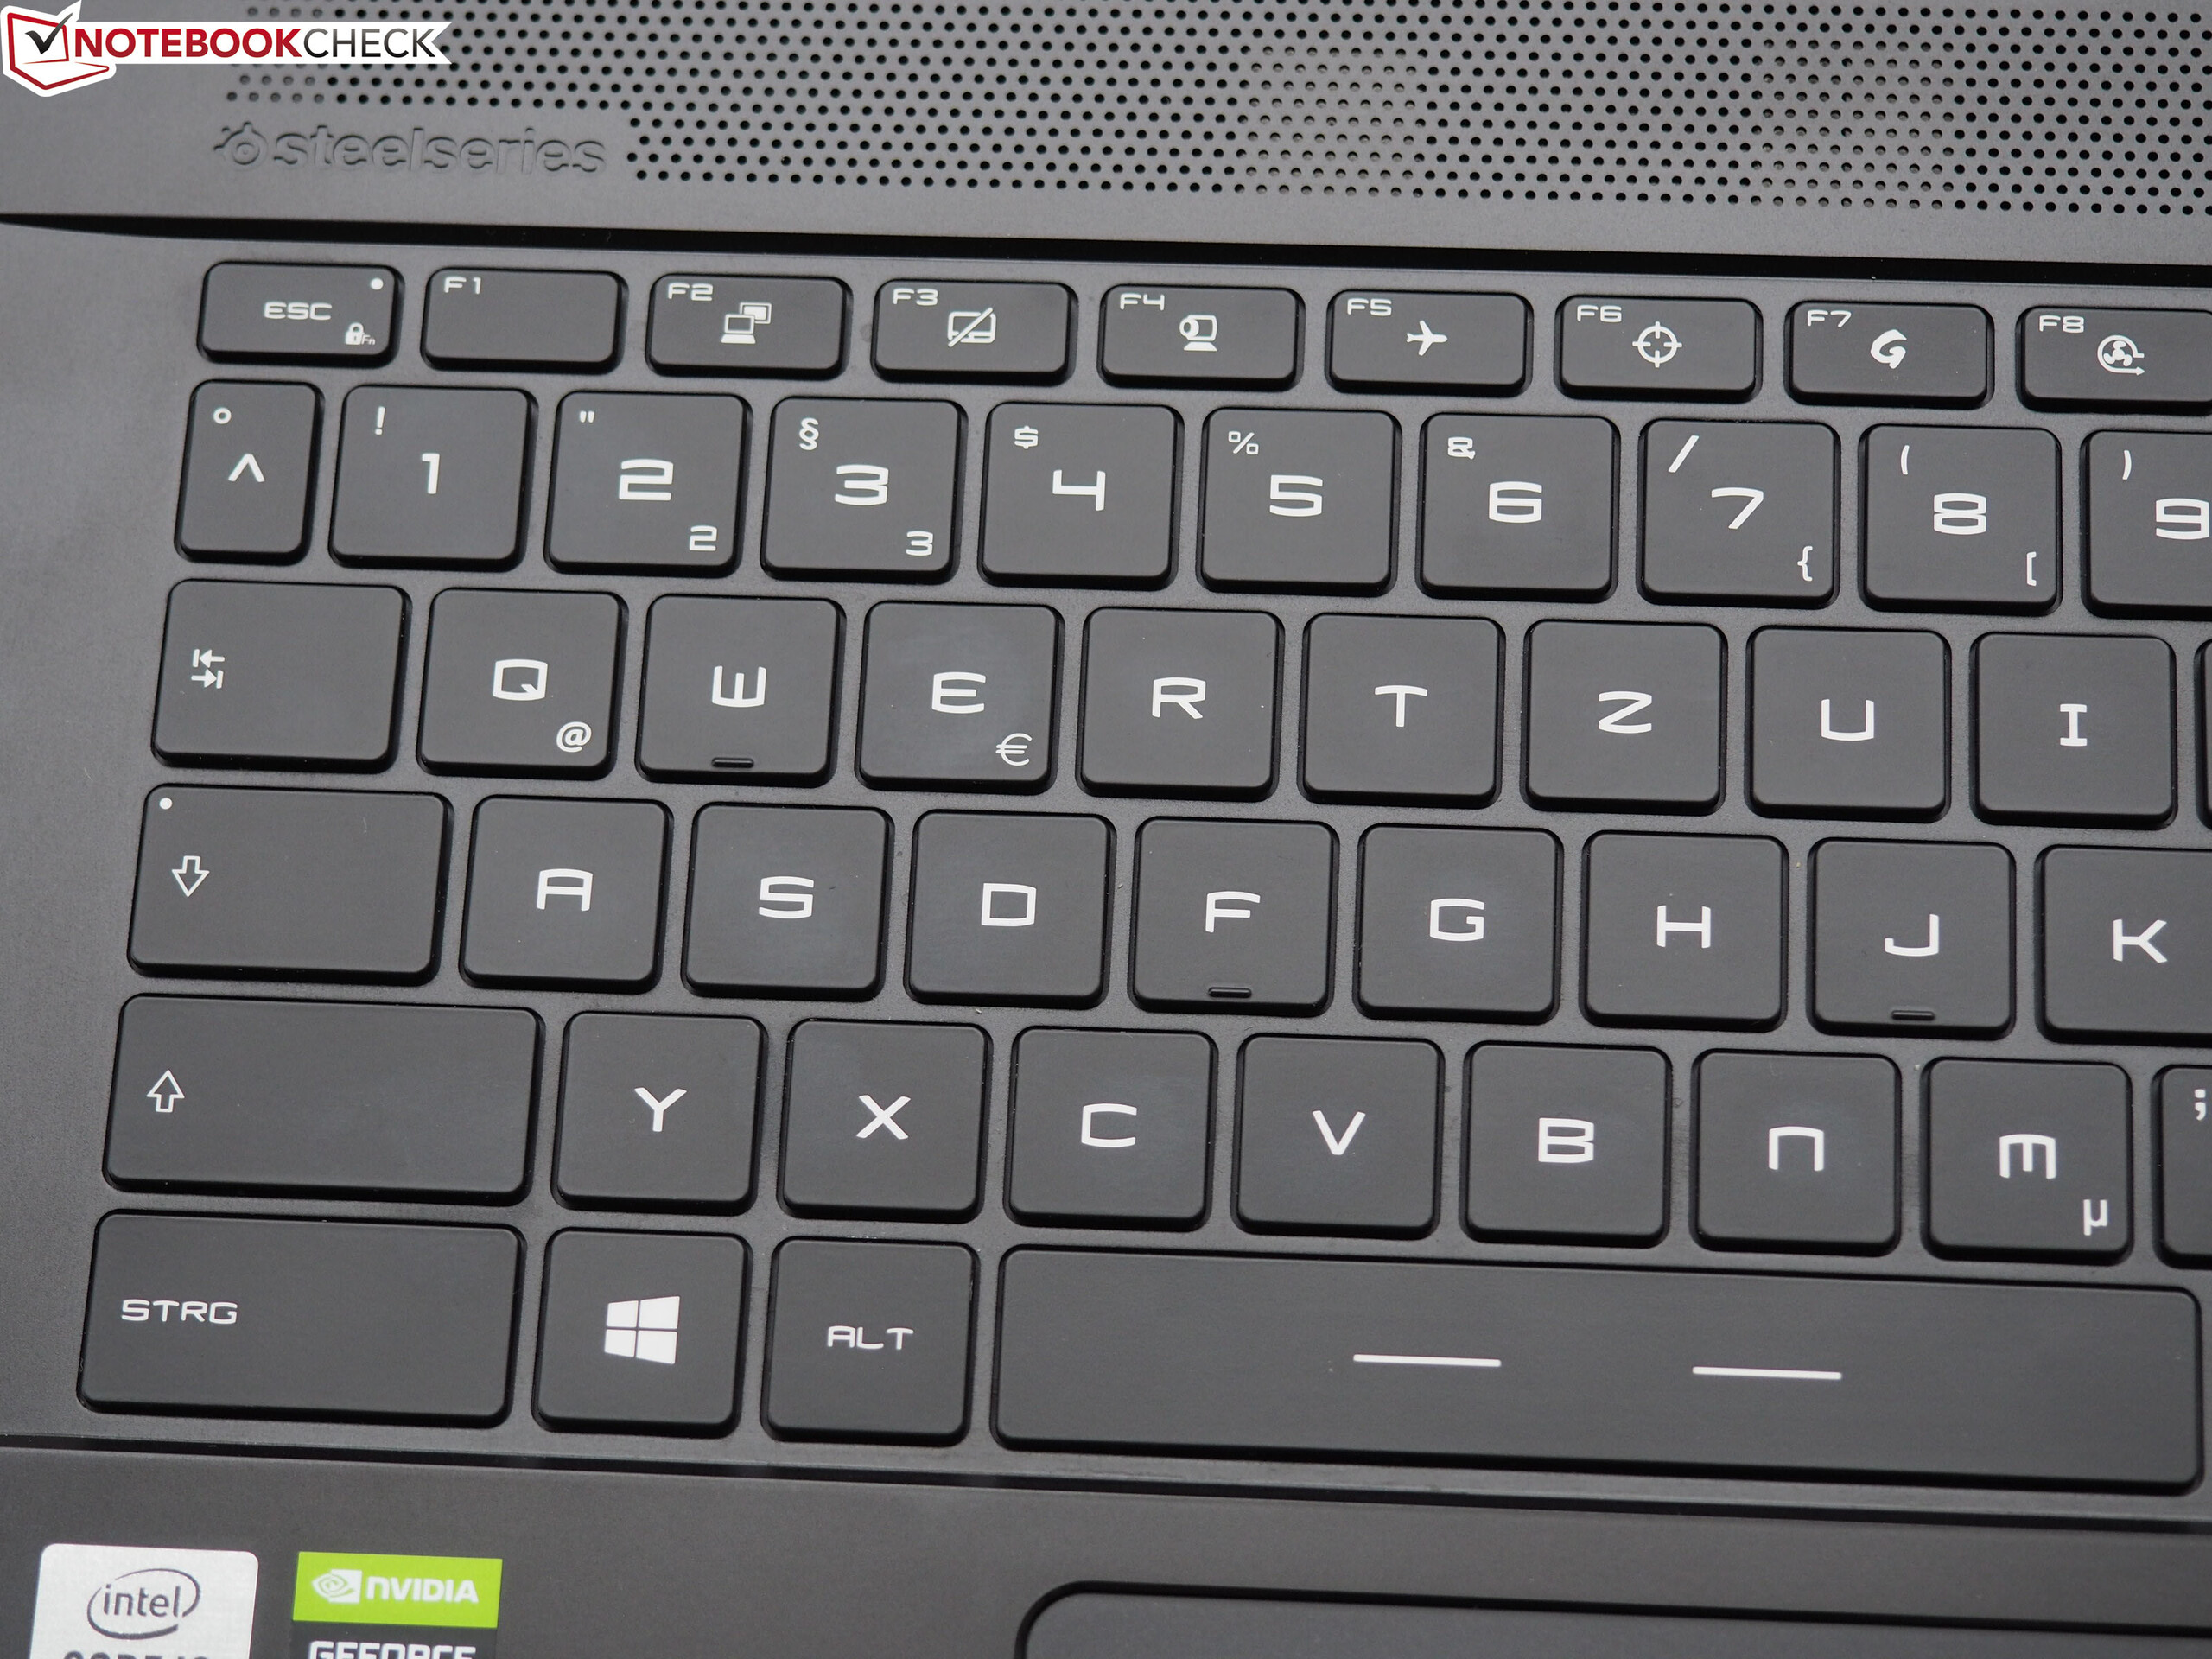
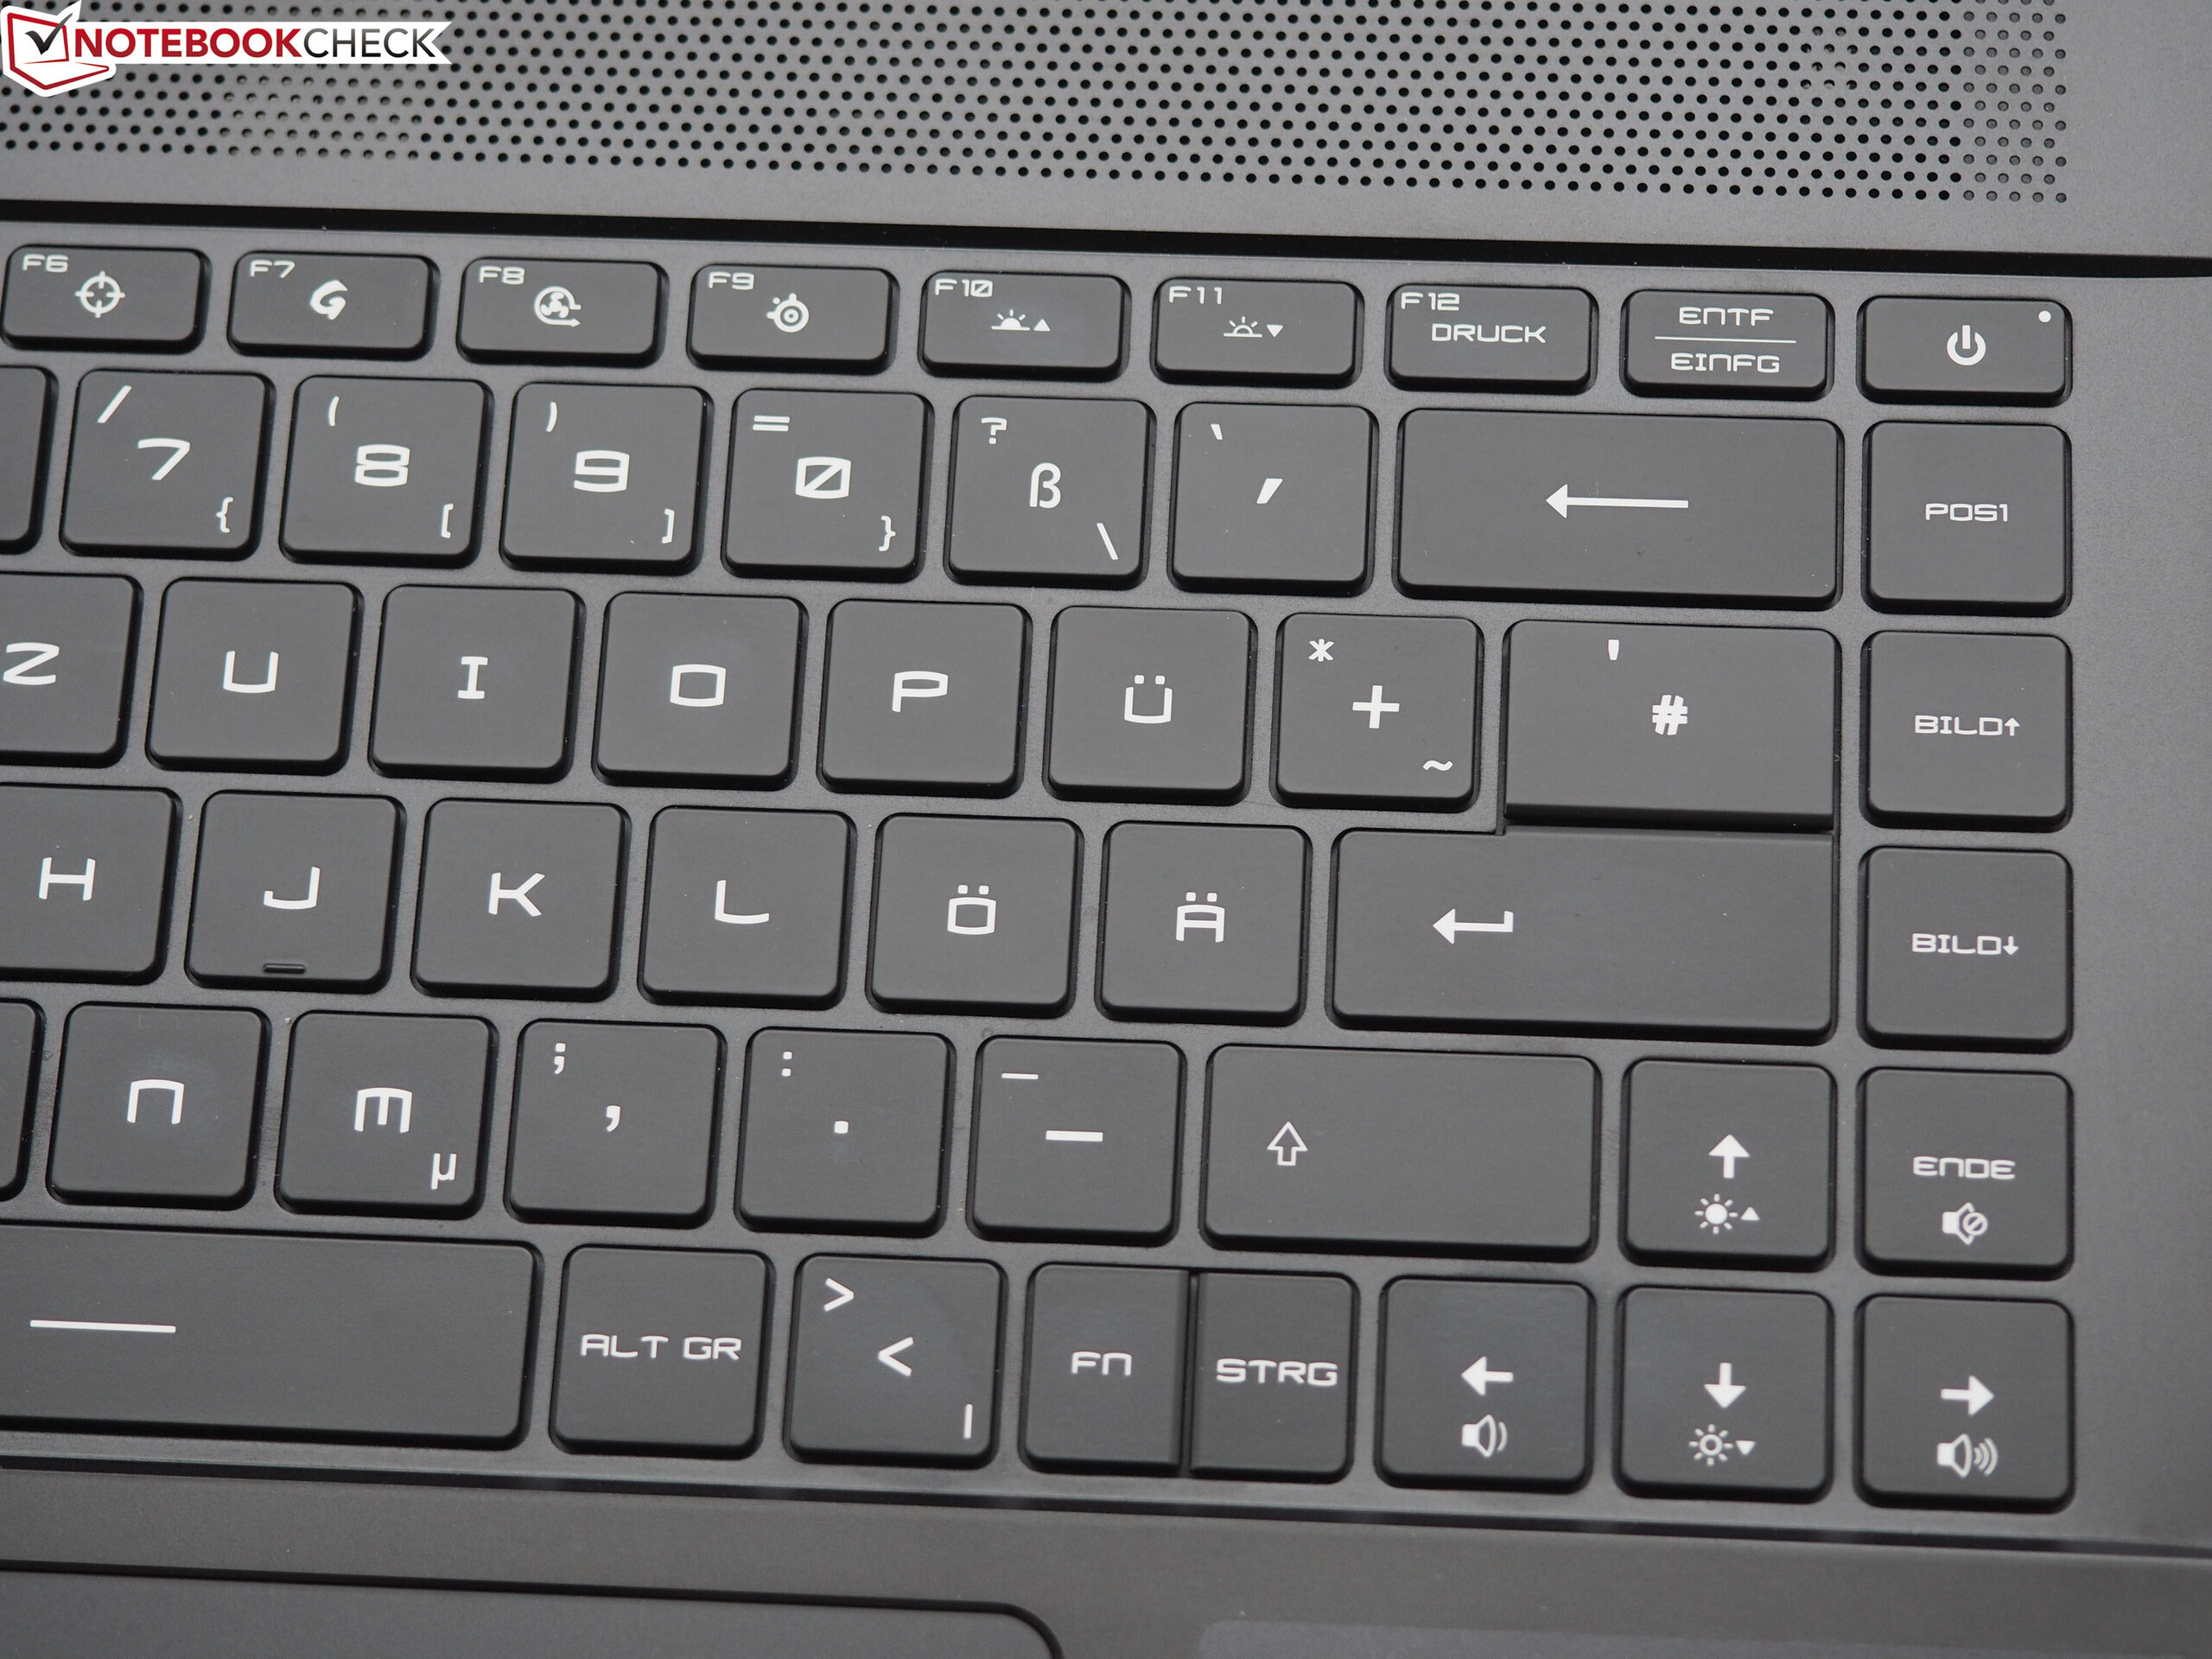
MSI GS66 Stealth 10SFS
- 05/17/2020 v7 (old)
Florian Glaser
Price comparison