联想 Legion Y520 15IKBN (7700HQ, 全高清, GTX 1050 Ti) 笔记本电脑简短评测


| SD Card Reader | |
| average JPG Copy Test (av. of 3 runs) | |
| Dell XPS 15 9560 (i7-7700HQ, UHD) | |
| Lenovo Legion Y520-15IKBN-80WK001KUS | |
| Asus ROG Strix GL553VD-DS71 | |
| MSI GS63VR 7RF-228US | |
| Samsung Odyssey NP800G5M-X01US | |
| maximum AS SSD Seq Read Test (1GB) | |
| Dell XPS 15 9560 (i7-7700HQ, UHD) | |
| Asus ROG Strix GL553VD-DS71 | |
| Lenovo Legion Y520-15IKBN-80WK001KUS | |
| MSI GS63VR 7RF-228US | |
| Samsung Odyssey NP800G5M-X01US | |
| |||||||||||||||||||||||||
Brightness Distribution: 88 %
Center on Battery: 239 cd/m²
Contrast: 683:1 (Black: 0.35 cd/m²)
ΔE ColorChecker Calman: 7.3 | ∀{0.5-29.43 Ø4.71}
ΔE Greyscale Calman: 4.9 | ∀{0.09-98 Ø4.96}
55% sRGB (Argyll 1.6.3 3D)
35% AdobeRGB 1998 (Argyll 1.6.3 3D)
Gamma: 2.19
CCT: 7332 K
| Lenovo Legion Y520-15IKBN-80WK001KUS LP156WF6-SPK3, IPS, 15.6", 1920x1080 | Lenovo Legion Y720 80VR002XGE LG Philips LGD0533 LP156WF6-SPK3, IPS, 15.6", 1920x1080 | Samsung Odyssey NP800G5M-X01US IPS, 15.6", 1920x1080 | MSI GS63VR 7RF-228US IPS, 15.6", 3840x2160 | Asus ROG Strix GL553VD-DS71 BOE HF NV156FHM-N43, IPS, 15.6", 1920x1080 | Alienware 15 R3 HPJGK_B156HTN (AUO51ED), TN, 15.6", 1920x1080 | |
|---|---|---|---|---|---|---|
| Display | ||||||
| Display P3 Coverage (%) | 38.43 | 47.11 | 48.21 | 67.6 | 66 | |
| sRGB Coverage (%) | 57.5 | 70.4 | 72.6 | 90.8 | 90.5 | |
| AdobeRGB 1998 Coverage (%) | 39.75 | 48.71 | 49.81 | 66.4 | 66.2 | |
| Response Times | 30% | 21% | 43% | -1% | 62% | |
| Response Time Grey 50% / Grey 80% * (ms) | 58.8 ? | 43 ? 27% | 38.8 ? 34% | 28 ? 52% | 57.6 ? 2% | 25 ? 57% |
| Response Time Black / White * (ms) | 36 ? | 24 ? 33% | 33.6 ? 7% | 23.6 ? 34% | 37.2 ? -3% | 12 ? 67% |
| PWM Frequency (Hz) | 21550 ? | 21000 ? | 19230 ? | 1351 ? | ||
| Screen | 15% | 4% | 0% | 43% | 16% | |
| Brightness middle (cd/m²) | 239 | 288 21% | 255.9 7% | 274.2 15% | 289.3 21% | 386 62% |
| Brightness (cd/m²) | 244 | 275 13% | 249 2% | 263 8% | 280 15% | 382 57% |
| Brightness Distribution (%) | 88 | 86 -2% | 90 2% | 92 5% | 93 6% | 93 6% |
| Black Level * (cd/m²) | 0.35 | 0.36 -3% | 0.48 -37% | 0.44 -26% | 0.29 17% | 0.39 -11% |
| Contrast (:1) | 683 | 800 17% | 533 -22% | 623 -9% | 998 46% | 990 45% |
| Colorchecker dE 2000 * | 7.3 | 5.29 28% | 5.9 19% | 8 -10% | 3.1 58% | 10.2 -40% |
| Colorchecker dE 2000 max. * | 24.7 | 9.97 60% | 18.9 23% | 14.6 41% | 7.1 71% | 15.81 36% |
| Greyscale dE 2000 * | 4.9 | 4.5 8% | 5.6 -14% | 9.1 -86% | 2.1 57% | 11.28 -130% |
| Gamma | 2.19 100% | 2.39 92% | 2.21 100% | 2.24 98% | 2.22 99% | 2.23 99% |
| CCT | 7332 89% | 6839 95% | 7250 90% | 5020 129% | 6226 104% | 11383 57% |
| Color Space (Percent of AdobeRGB 1998) (%) | 35 | 37 6% | 44.8 28% | 45.7 31% | 59 69% | 59 69% |
| Color Space (Percent of sRGB) (%) | 55 | 57 4% | 70.1 27% | 72.1 31% | 91 65% | 90 64% |
| Total Average (Program / Settings) | 23% /
18% | 13% /
6% | 22% /
7% | 21% /
35% | 39% /
24% |
* ... smaller is better
Display Response Times
| ↔ Response Time Black to White | ||
|---|---|---|
| 36 ms ... rise ↗ and fall ↘ combined | ↗ 23.6 ms rise | 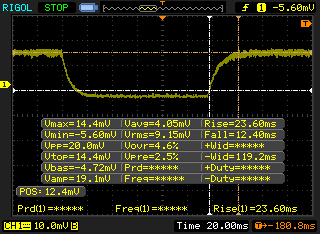 |
| ↘ 12.4 ms fall | ||
| The screen shows slow response rates in our tests and will be unsatisfactory for gamers. In comparison, all tested devices range from 0.1 (minimum) to 240 (maximum) ms. » 94 % of all devices are better. This means that the measured response time is worse than the average of all tested devices (19.8 ms). | ||
| ↔ Response Time 50% Grey to 80% Grey | ||
| 58.8 ms ... rise ↗ and fall ↘ combined | ↗ 33.6 ms rise | 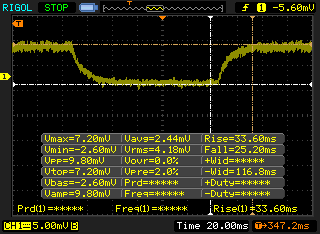 |
| ↘ 25.2 ms fall | ||
| The screen shows slow response rates in our tests and will be unsatisfactory for gamers. In comparison, all tested devices range from 0.165 (minimum) to 636 (maximum) ms. » 95 % of all devices are better. This means that the measured response time is worse than the average of all tested devices (31 ms). | ||
Screen Flickering / PWM (Pulse-Width Modulation)
| Screen flickering / PWM detected | 21550 Hz | ≤ 99 % brightness setting | 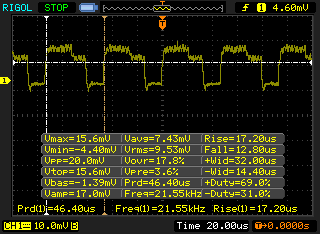 |
The display backlight flickers at 21550 Hz (worst case, e.g., utilizing PWM) Flickering detected at a brightness setting of 99 % and below. There should be no flickering or PWM above this brightness setting. The frequency of 21550 Hz is quite high, so most users sensitive to PWM should not notice any flickering. In comparison: 52 % of all tested devices do not use PWM to dim the display. If PWM was detected, an average of 7757 (minimum: 5 - maximum: 343500) Hz was measured. | |||
| wPrime 2.10 - 1024m | |
| Asus ROG Strix GL553VD-DS71 | |
| MSI GS63VR 7RF-228US | |
| Samsung Odyssey NP800G5M-X01US | |
* ... smaller is better
| Lenovo Legion Y520-15IKBN-80WK001KUS Samsung PM961 MZVLW256HEHP | Lenovo Legion Y720 80VR002XGE Samsung PM961 MZVLW256HEHP | Samsung Odyssey NP800G5M-X01US Samsung PM961 NVMe MZVLW128HEGR | MSI GS63VR 7RF-228US Samsung SM961 MZVKW512HMJP m.2 PCI-e | Alienware 15 R3 | |
|---|---|---|---|---|---|
| CrystalDiskMark 3.0 | 1% | -31% | 20% | -22% | |
| Read Seq (MB/s) | 2170 | 2196 1% | 1518 -30% | 2141 -1% | 1123 -48% |
| Write Seq (MB/s) | 1202 | 1144 -5% | 798 -34% | 1621 35% | 429.2 -64% |
| Read 512 (MB/s) | 786 | 747 -5% | 460.5 -41% | 499.7 -36% | 833 6% |
| Write 512 (MB/s) | 822 | 810 -1% | 195.8 -76% | 1531 86% | 428.1 -48% |
| Read 4k (MB/s) | 58.9 | 60.1 2% | 47.16 -20% | 54.2 -8% | 37.8 -36% |
| Write 4k (MB/s) | 146.4 | 153.5 5% | 143.1 -2% | 158.2 8% | 122.9 -16% |
| Read 4k QD32 (MB/s) | 457.7 | 485.4 6% | 521 14% | 632 38% | 542 18% |
| Write 4k QD32 (MB/s) | 392.9 | 396.3 1% | 176.4 -55% | 527 34% | 429.8 9% |

| 3DMark Ice Storm Standard Score | 80136 points | |
| 3DMark Cloud Gate Standard Score | 19356 points | |
| 3DMark Fire Strike Score | 6554 points | |
| 3DMark Fire Strike Extreme Score | 3492 points | |
Help | ||
| Batman: Arkham Knight | |
| 3840x2160 High / On (Interactive Smoke & Paper Debris Off) AA:SM AF:8x (sort by value) | |
| MSI GS63VR 7RF-228US | |
| 1920x1080 High / On AA:SM AF:16x (sort by value) | |
| Lenovo Legion Y520-15IKBN-80WK001KUS | |
| Samsung Odyssey NP800G5M-X01US | |
| MSI GS63VR 7RF-228US | |
| 1920x1080 High / On (Interactive Smoke & Paper Debris Off) AA:SM AF:8x (sort by value) | |
| Lenovo Legion Y520-15IKBN-80WK001KUS | |
| Samsung Odyssey NP800G5M-X01US | |
| 1366x768 Normal / Off AF:4x (sort by value) | |
| Lenovo Legion Y520-15IKBN-80WK001KUS | |
| Samsung Odyssey NP800G5M-X01US | |
| 1280x720 Low / Off AF:Trilinear (sort by value) | |
| Lenovo Legion Y520-15IKBN-80WK001KUS | |
| Samsung Odyssey NP800G5M-X01US | |
| Rise of the Tomb Raider | |
| 3840x2160 High Preset AA:FX AF:4x (sort by value) | |
| MSI GS63VR 7RF-228US | |
| 1920x1080 Very High Preset AA:FX AF:16x (sort by value) | |
| Lenovo Legion Y520-15IKBN-80WK001KUS | |
| Samsung Odyssey NP800G5M-X01US | |
| MSI GS63VR 7RF-228US | |
| Asus ROG Strix GL553VD-DS71 | |
| Dell Inspiron 15 7000 7567 | |
| 1920x1080 High Preset AA:FX AF:4x (sort by value) | |
| Lenovo Legion Y520-15IKBN-80WK001KUS | |
| Samsung Odyssey NP800G5M-X01US | |
| Asus ROG Strix GL553VD-DS71 | |
| Dell Inspiron 15 7000 7567 | |
| 1366x768 Medium Preset AF:2x (sort by value) | |
| Lenovo Legion Y520-15IKBN-80WK001KUS | |
| Samsung Odyssey NP800G5M-X01US | |
| Dell Inspiron 15 7000 7567 | |
| 1024x768 Lowest Preset (sort by value) | |
| Lenovo Legion Y520-15IKBN-80WK001KUS | |
| Dell Inspiron 15 7000 7567 | |
| low | med. | high | ultra | |
|---|---|---|---|---|
| BioShock Infinite (2013) | 227 | 189 | 174 | 74 |
| The Witcher 3 (2015) | 38 | |||
| Batman: Arkham Knight (2015) | 113 | 101 | 64 | 41 |
| Rise of the Tomb Raider (2016) | 122 | 76 | 45 | 38 |
Noise level
| Idle |
| 30.5 / 30.5 / 30.6 dB(A) |
| Load |
| 40 / 42.6 dB(A) |
 | ||
30 dB silent 40 dB(A) audible 50 dB(A) loud |
||
min: | ||
| Lenovo Legion Y520-15IKBN-80WK001KUS GeForce GTX 1050 Ti Mobile, i7-7700HQ, Samsung PM961 MZVLW256HEHP | Lenovo Legion Y720 80VR002XGE GeForce GTX 1060 Mobile, i7-7700HQ, Samsung PM961 MZVLW256HEHP | Samsung Odyssey NP800G5M-X01US GeForce GTX 1050 Mobile, i7-7700HQ, Samsung PM961 NVMe MZVLW128HEGR | Asus ROG Strix GL553VD-DS71 GeForce GTX 1050 Mobile, i7-7700HQ, HGST Travelstar 7K1000 HTS721010A9E630 | Alienware 15 R3 GeForce GTX 1070 Mobile, i7-7700HQ | |
|---|---|---|---|---|---|
| Noise | -2% | -4% | -12% | -15% | |
| off / environment * (dB) | 27.7 | 30.3 -9% | 28.1 -1% | 30.6 -10% | 30 -8% |
| Idle Minimum * (dB) | 30.5 | 31 -2% | 28.1 8% | 33.4 -10% | 31 -2% |
| Idle Average * (dB) | 30.5 | 30.9 -1% | 29.1 5% | 33.4 -10% | 32 -5% |
| Idle Maximum * (dB) | 30.6 | 31.5 -3% | 29.1 5% | 33.4 -9% | 42 -37% |
| Load Average * (dB) | 40 | 38.7 3% | 49.2 -23% | 46.5 -16% | 49 -23% |
| Witcher 3 ultra * (dB) | 40 | 42 -5% | |||
| Load Maximum * (dB) | 42.6 | 41.9 2% | 49.2 -15% | 49.6 -16% | 50 -17% |
* ... smaller is better
(-) The maximum temperature on the upper side is 46.8 °C / 116 F, compared to the average of 40.4 °C / 105 F, ranging from 21.2 to 68.8 °C for the class Gaming.
(-) The bottom heats up to a maximum of 55.8 °C / 132 F, compared to the average of 43.2 °C / 110 F
(+) In idle usage, the average temperature for the upper side is 25.1 °C / 77 F, compared to the device average of 33.9 °C / 93 F.
(+) Playing The Witcher 3, the average temperature for the upper side is 28 °C / 82 F, compared to the device average of 33.9 °C / 93 F.
(+) The palmrests and touchpad are cooler than skin temperature with a maximum of 27.2 °C / 81 F and are therefore cool to the touch.
(±) The average temperature of the palmrest area of similar devices was 28.8 °C / 83.8 F (+1.6 °C / 2.8 F).
Lenovo Legion Y520-15IKBN-80WK001KUS audio analysis
(-) | not very loud speakers (71.9 dB)
Bass 100 - 315 Hz
(±) | reduced bass - on average 13.9% lower than median
(-) | bass is not linear (15.9% delta to prev. frequency)
Mids 400 - 2000 Hz
(+) | balanced mids - only 2.2% away from median
(+) | mids are linear (3.8% delta to prev. frequency)
Highs 2 - 16 kHz
(+) | balanced highs - only 3.7% away from median
(±) | linearity of highs is average (10.7% delta to prev. frequency)
Overall 100 - 16.000 Hz
(±) | linearity of overall sound is average (22.4% difference to median)
Compared to same class
» 80% of all tested devices in this class were better, 6% similar, 14% worse
» The best had a delta of 6%, average was 18%, worst was 132%
Compared to all devices tested
» 66% of all tested devices were better, 6% similar, 29% worse
» The best had a delta of 4%, average was 23%, worst was 134%
Alienware 15 R3 audio analysis
(+) | speakers can play relatively loud (82 dB)
Bass 100 - 315 Hz
(-) | nearly no bass - on average 19.1% lower than median
(±) | linearity of bass is average (10.4% delta to prev. frequency)
Mids 400 - 2000 Hz
(±) | higher mids - on average 6.7% higher than median
(±) | linearity of mids is average (7.5% delta to prev. frequency)
Highs 2 - 16 kHz
(+) | balanced highs - only 3.6% away from median
(+) | highs are linear (5.2% delta to prev. frequency)
Overall 100 - 16.000 Hz
(±) | linearity of overall sound is average (21.6% difference to median)
Compared to same class
» 77% of all tested devices in this class were better, 5% similar, 18% worse
» The best had a delta of 6%, average was 18%, worst was 132%
Compared to all devices tested
» 61% of all tested devices were better, 7% similar, 32% worse
» The best had a delta of 4%, average was 23%, worst was 134%
| Off / Standby | |
| Idle | |
| Load |
|
Key:
min: | |
| Lenovo Legion Y520-15IKBN-80WK001KUS i7-7700HQ, GeForce GTX 1050 Ti Mobile, Samsung PM961 MZVLW256HEHP, IPS, 1920x1080, 15.6" | Lenovo Legion Y720 80VR002XGE i7-7700HQ, GeForce GTX 1060 Mobile, Samsung PM961 MZVLW256HEHP, IPS, 1920x1080, 15.6" | Samsung Odyssey NP800G5M-X01US i7-7700HQ, GeForce GTX 1050 Mobile, Samsung PM961 NVMe MZVLW128HEGR, IPS, 1920x1080, 15.6" | Asus ROG Strix GL553VD-DS71 i7-7700HQ, GeForce GTX 1050 Mobile, HGST Travelstar 7K1000 HTS721010A9E630, IPS, 1920x1080, 15.6" | Alienware 15 R3 i7-7700HQ, GeForce GTX 1070 Mobile, , TN, 1920x1080, 15.6" | |
|---|---|---|---|---|---|
| Power Consumption | -8% | 3% | -10% | -108% | |
| Idle Minimum * (Watt) | 8.5 | 8 6% | 6.7 21% | 7.7 9% | 19 -124% |
| Idle Average * (Watt) | 9.1 | 10.9 -20% | 8.9 2% | 11.7 -29% | 23 -153% |
| Idle Maximum * (Watt) | 9.7 | 11.8 -22% | 10.8 -11% | 12 -24% | 29 -199% |
| Load Average * (Watt) | 79.9 | 70 12% | 81.8 -2% | 80.5 -1% | 85 -6% |
| Witcher 3 ultra * (Watt) | 97.7 | 102 -4% | 92.2 6% | ||
| Load Maximum * (Watt) | 121.5 | 148 -22% | 122.7 -1% | 128.4 -6% | 192 -58% |
* ... smaller is better
| Lenovo Legion Y520-15IKBN-80WK001KUS i7-7700HQ, GeForce GTX 1050 Ti Mobile, 45 Wh | Lenovo Legion Y720 80VR002XGE i7-7700HQ, GeForce GTX 1060 Mobile, 60 Wh | Samsung Odyssey NP800G5M-X01US i7-7700HQ, GeForce GTX 1050 Mobile, 43 Wh | MSI GS63VR 7RF-228US i7-7700HQ, GeForce GTX 1060 Mobile, 65 Wh | Asus ROG Strix GL553VD-DS71 i7-7700HQ, GeForce GTX 1050 Mobile, 48 Wh | Alienware 15 R3 i7-7700HQ, GeForce GTX 1070 Mobile, 99 Wh | |
|---|---|---|---|---|---|---|
| Battery runtime | 49% | 31% | 12% | 0% | 33% | |
| Reader / Idle (h) | 8.5 | 11.8 39% | 10.2 20% | 6.4 -25% | 7.3 -14% | 6.4 -25% |
| WiFi v1.3 (h) | 4 | 6.3 58% | 4.4 10% | 3.9 -2% | 4.6 15% | 4.4 10% |
| Load (h) | 0.8 | 1.2 50% | 1.3 63% | 1.3 63% | 0.8 0% | 1.7 113% |
Pros
Cons
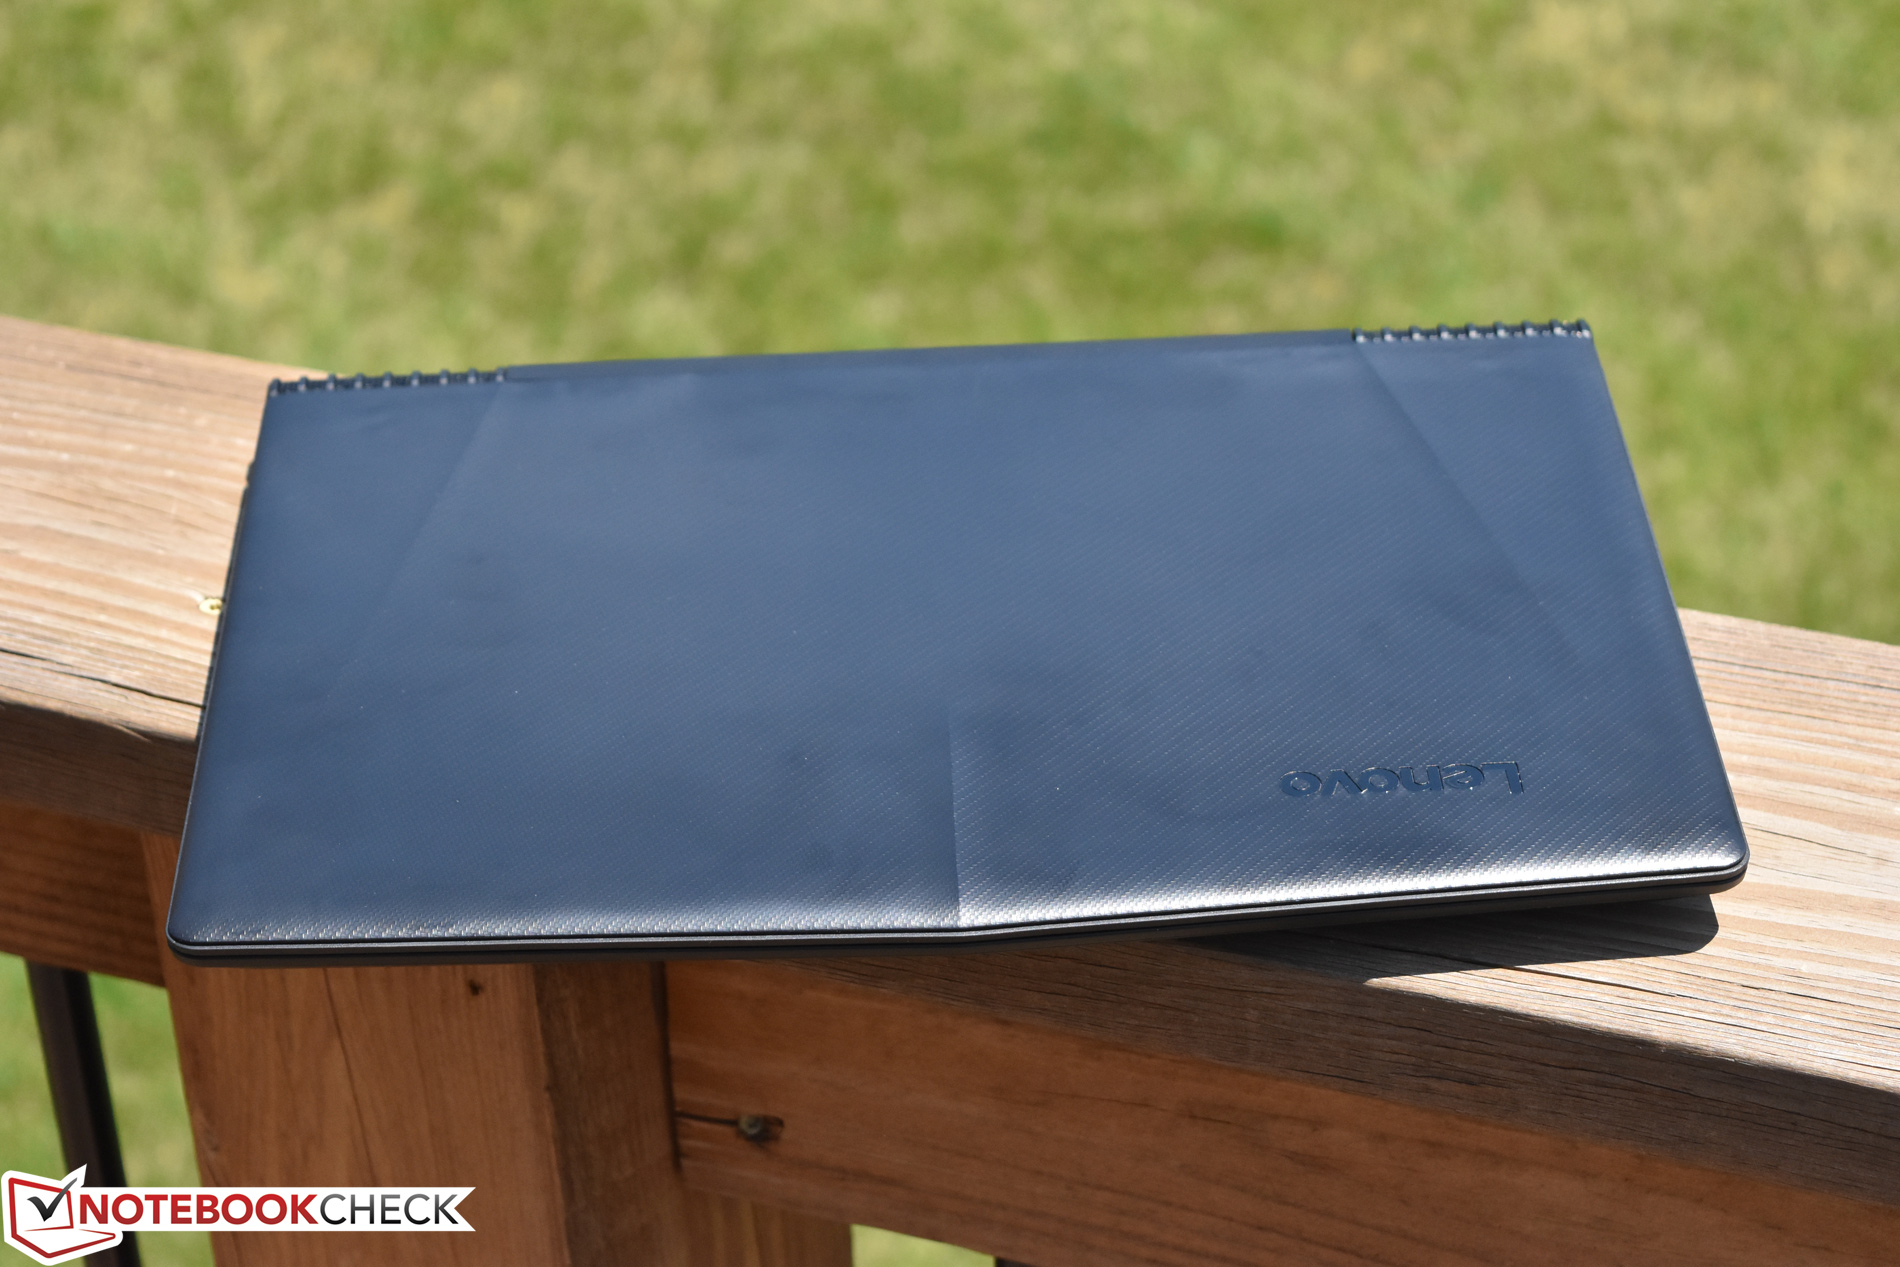
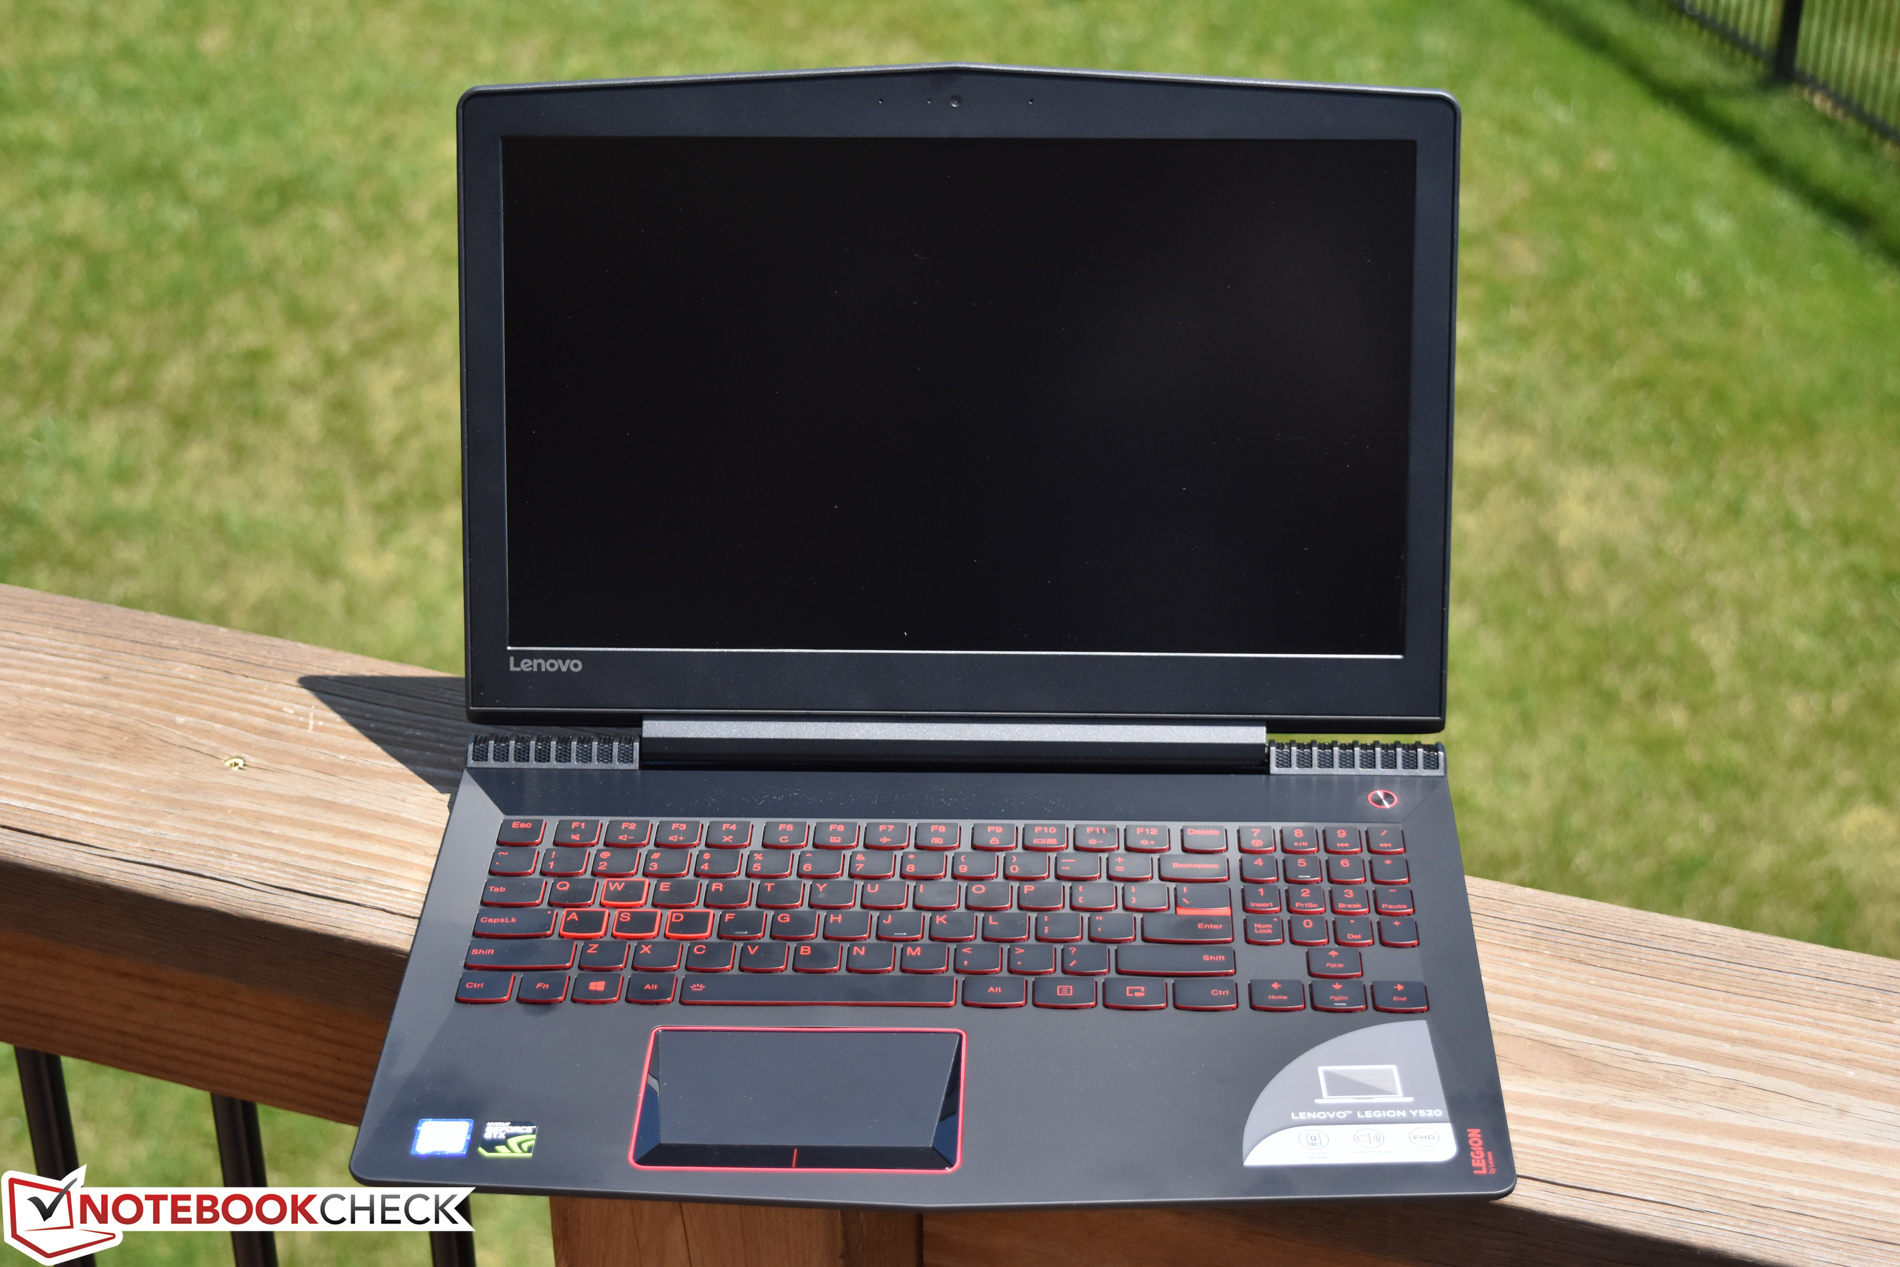
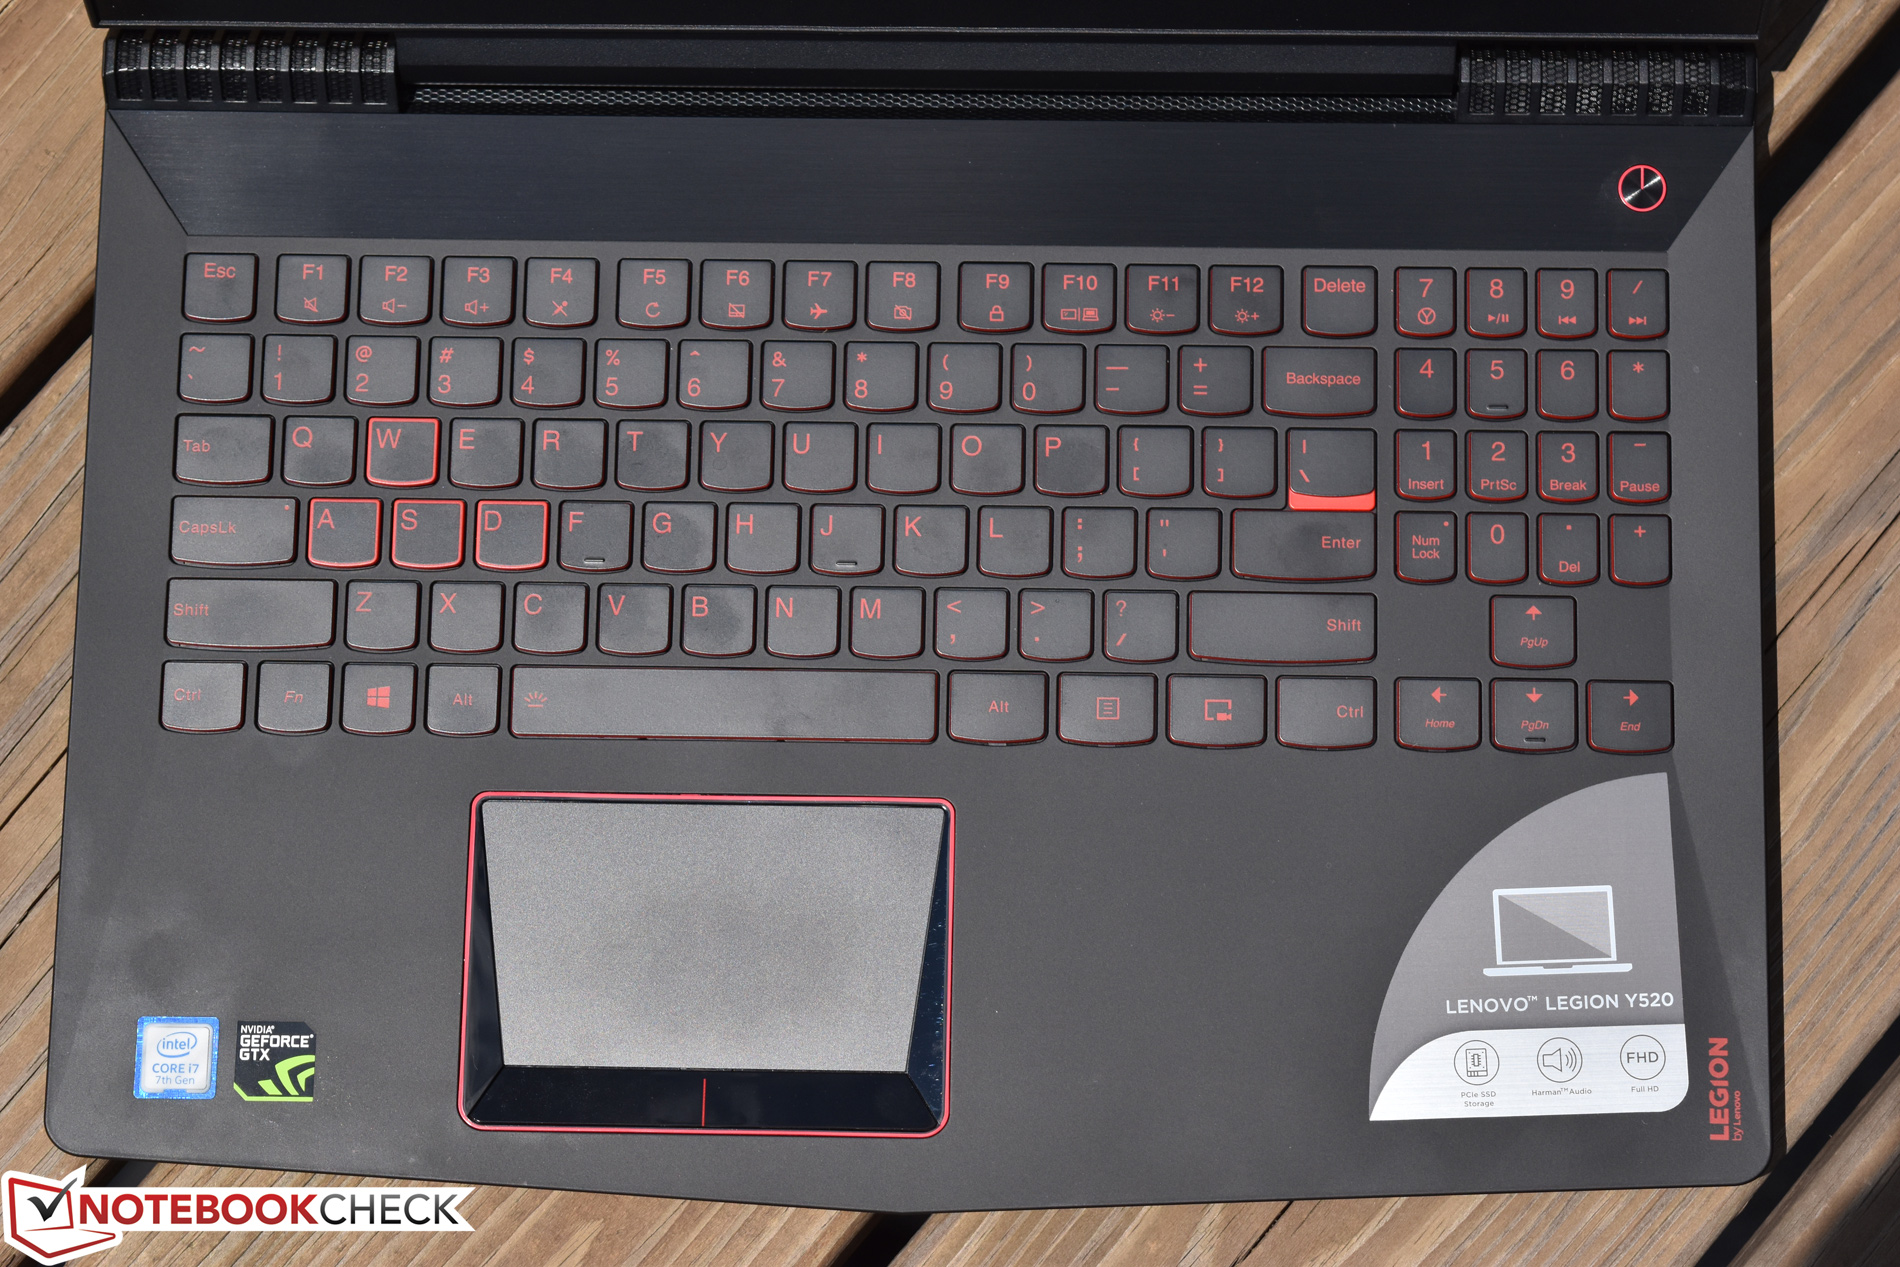
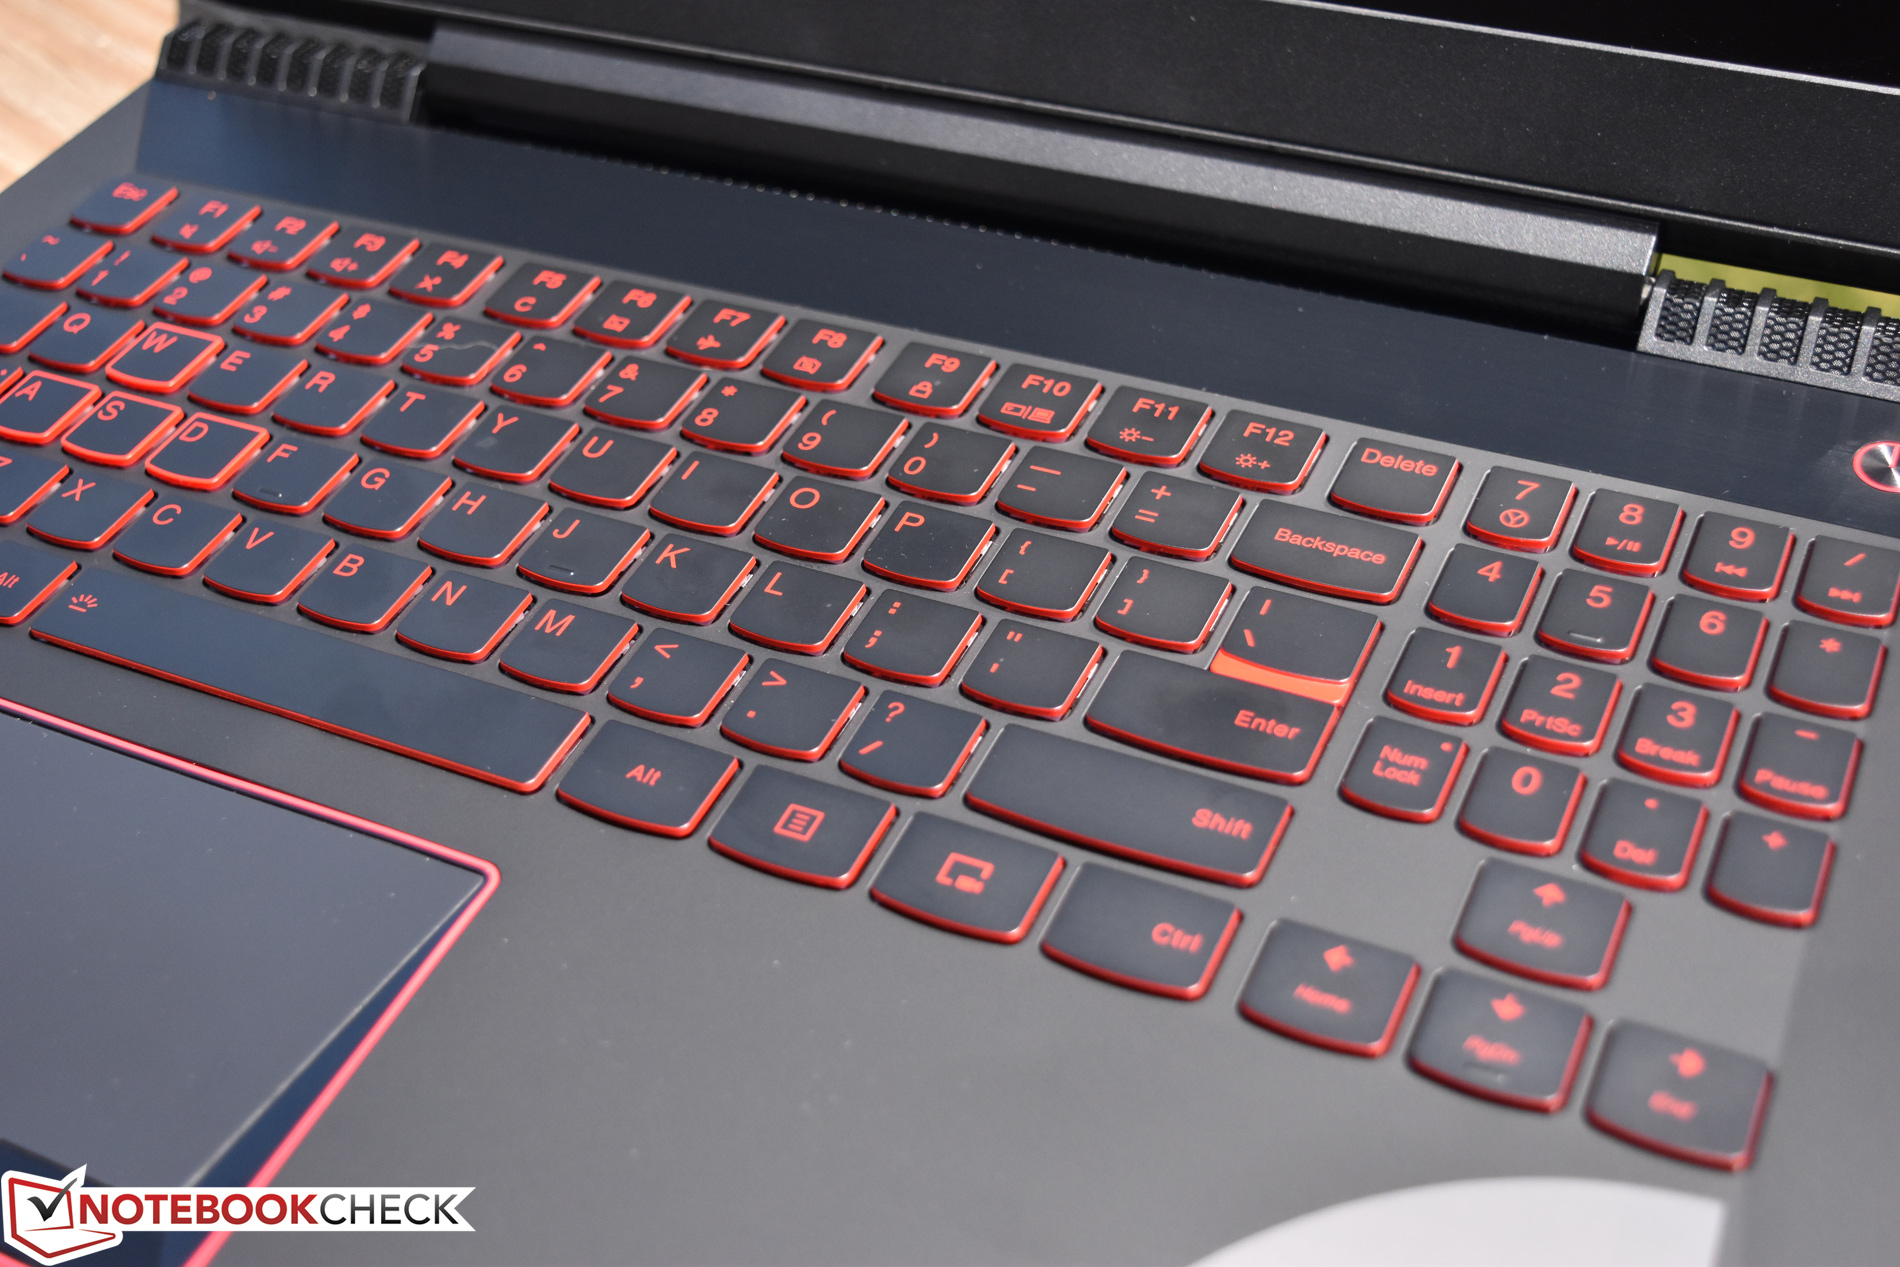
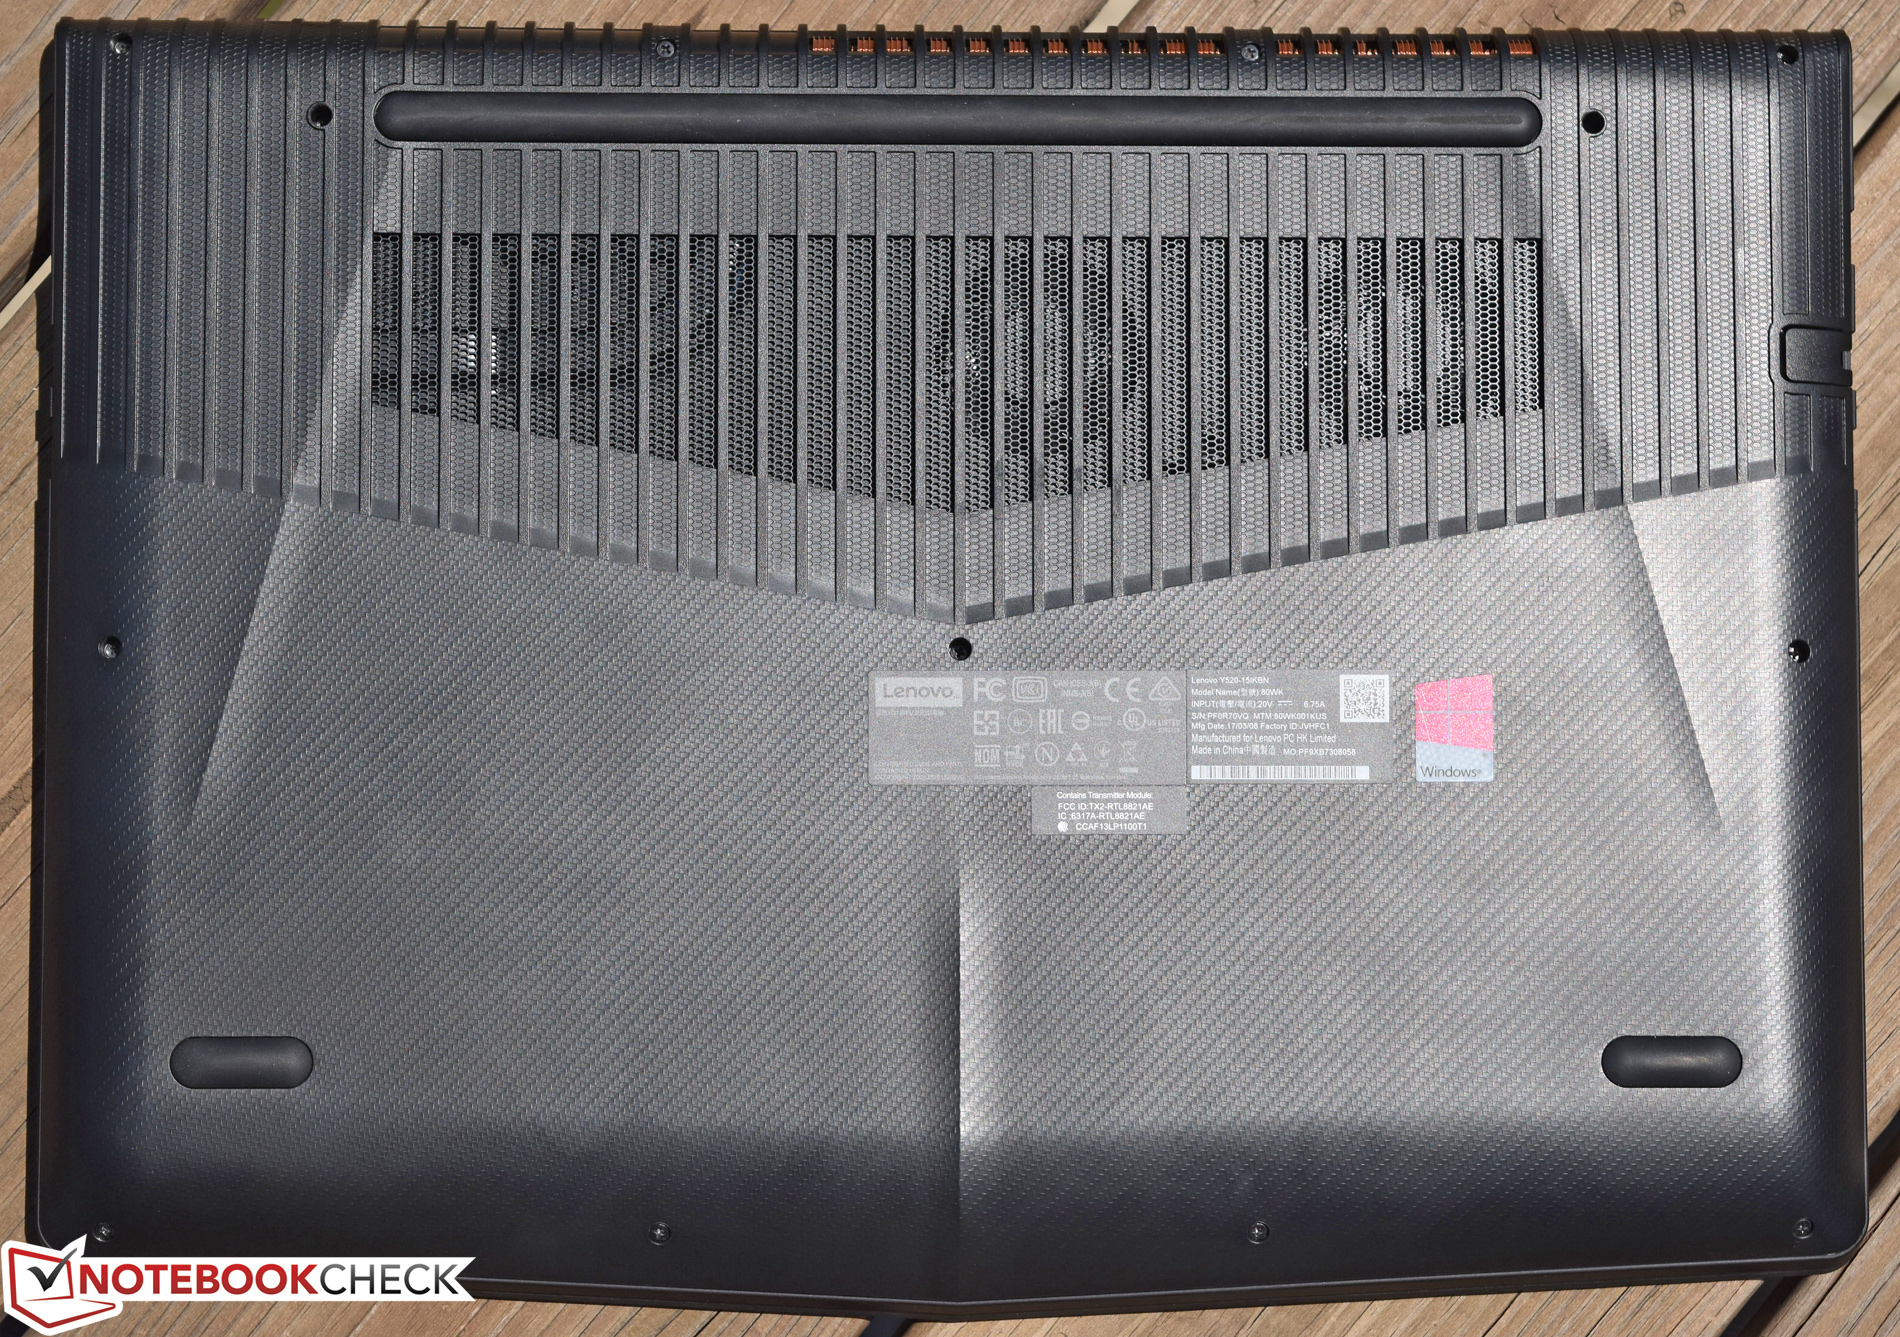
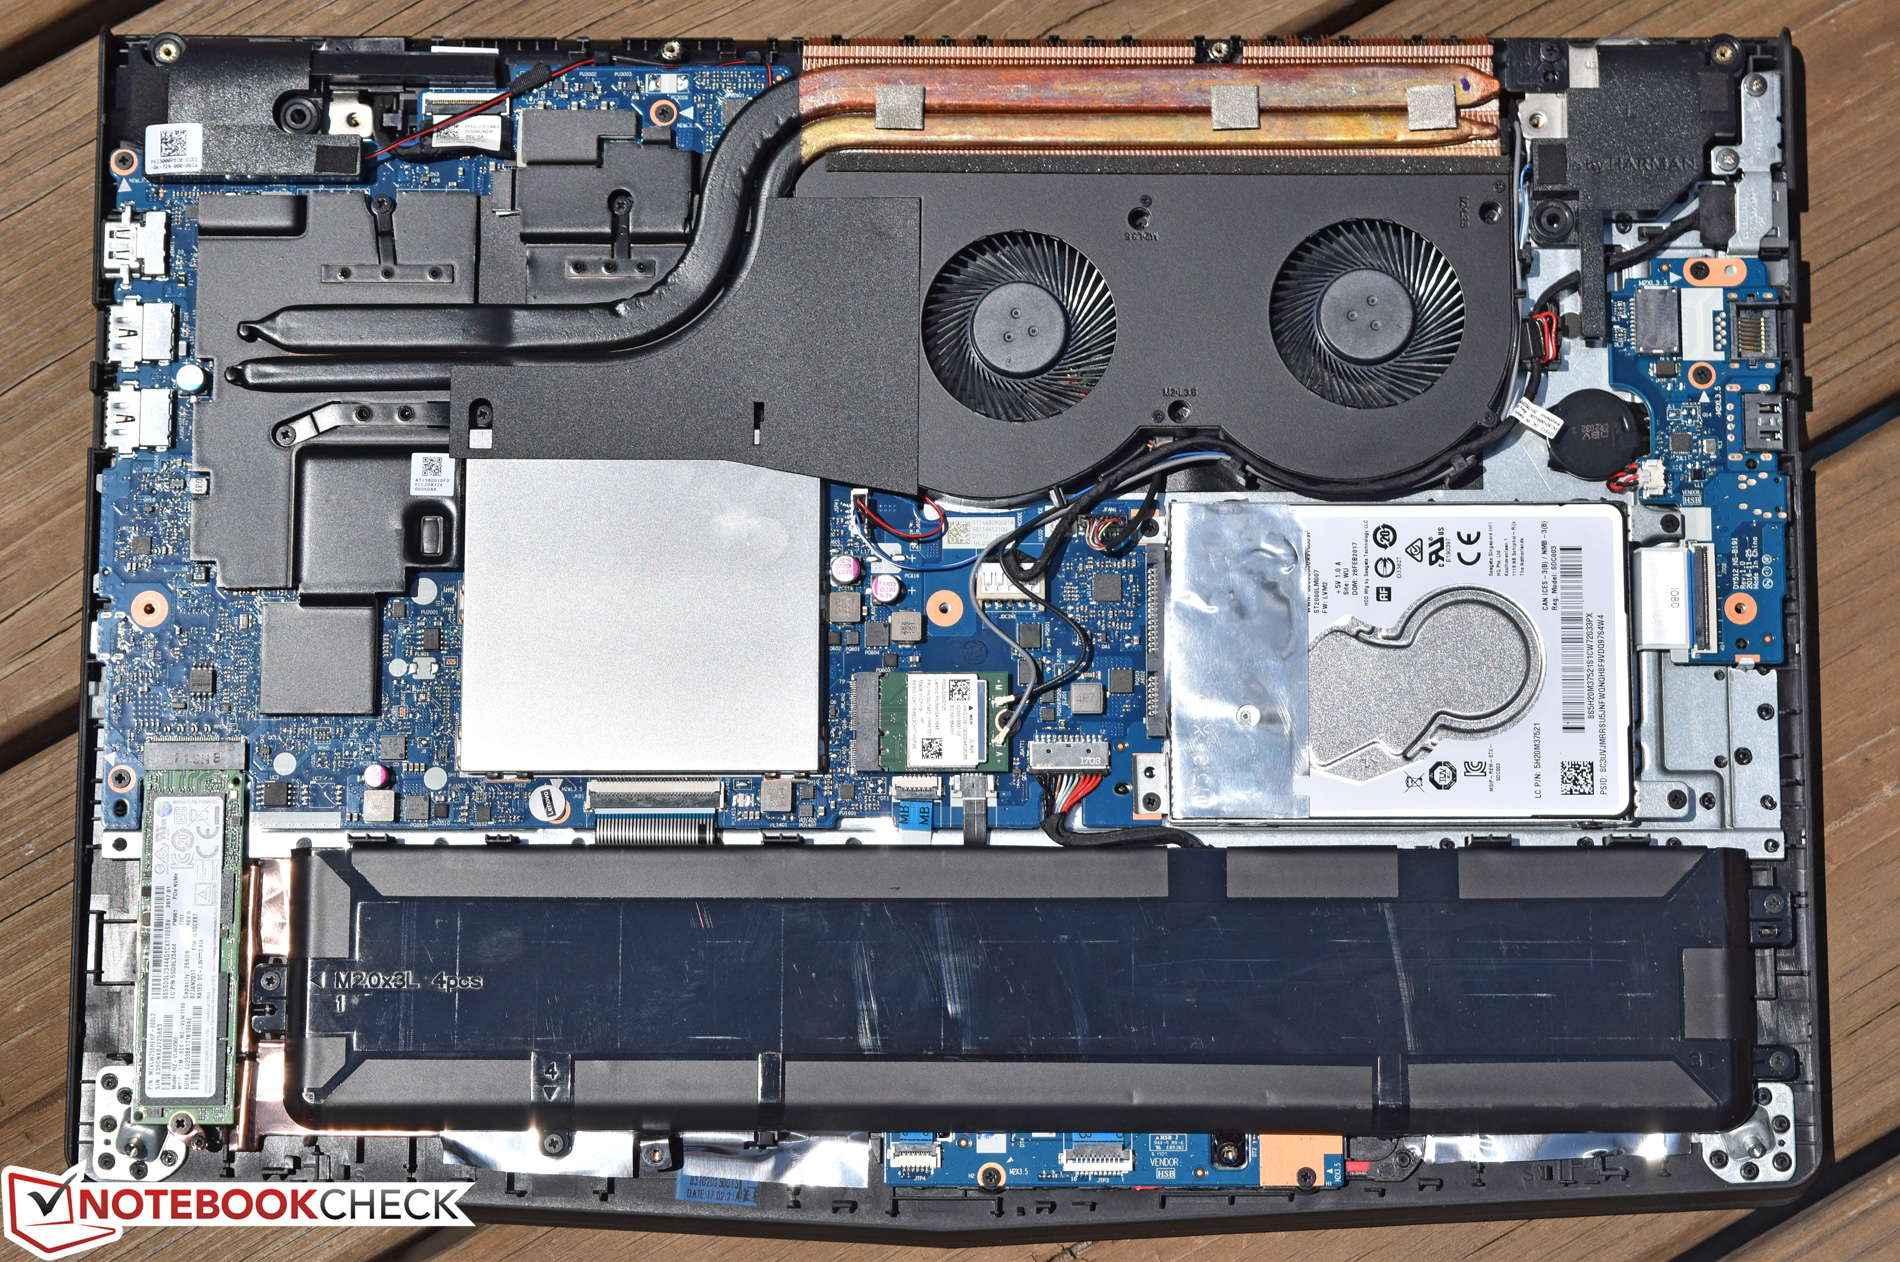
联想Legion Y520对预算有限的游戏玩家来说是个不错的选择。它提供了优秀的处理器和显卡性能,相对便捷的维护和升级操作,以及优秀的输入设备。尽管机身品质和设计都是以功能性为主,但如果用户主要在家中使用的话,这也不是太大的问题。同时它的价位(测试机型定价1060美元)也不算很高。
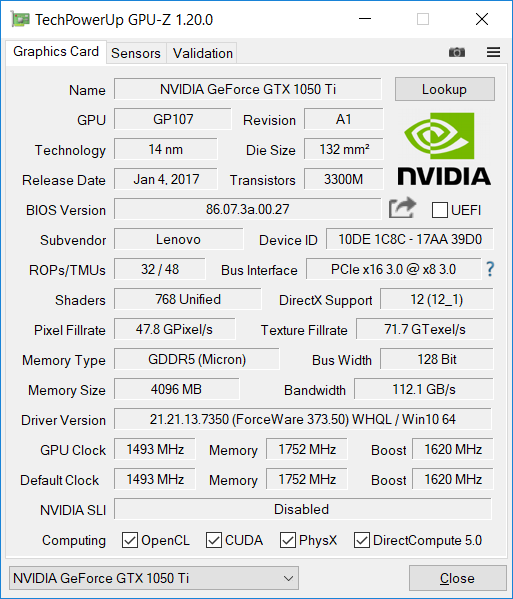
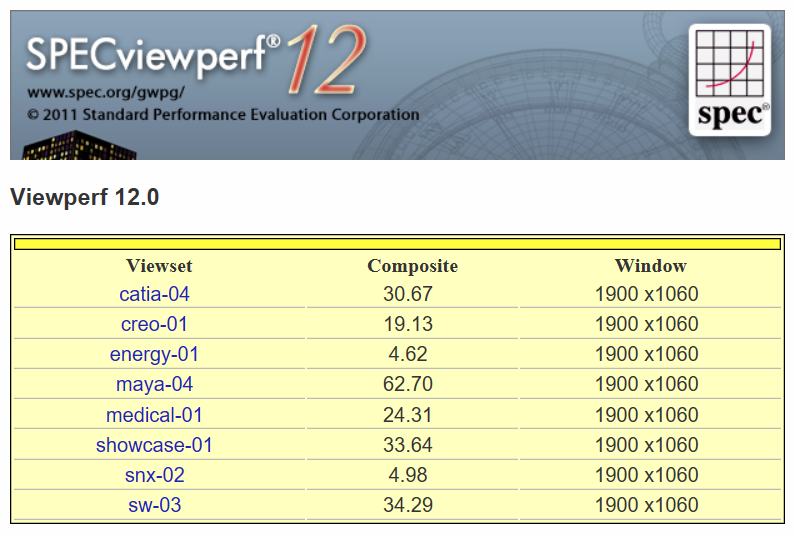
英伟达 GTX 1050 Ti相比高端设备中的GTX 1070/1080芯片差别很大,不过也应该可以满足大部分最新游戏在1080p分辨率和高设定下的流畅运行。在持续游戏负载下(或繁重处理器运算中)它的稳定性也十分优秀,散热系统没有展现出任何弱点。我们所测试的Y520配置机型也提供了出色的存储设备,搭配高速256GB NVMe固态硬盘的同时,它还有2TB机械硬盘的辅助。
联想Legion Y520对于预算有限的游戏玩家来说是个不错的选择。它在高速的同时也可靠而稳定,相比其他高端机型价格十分实惠。
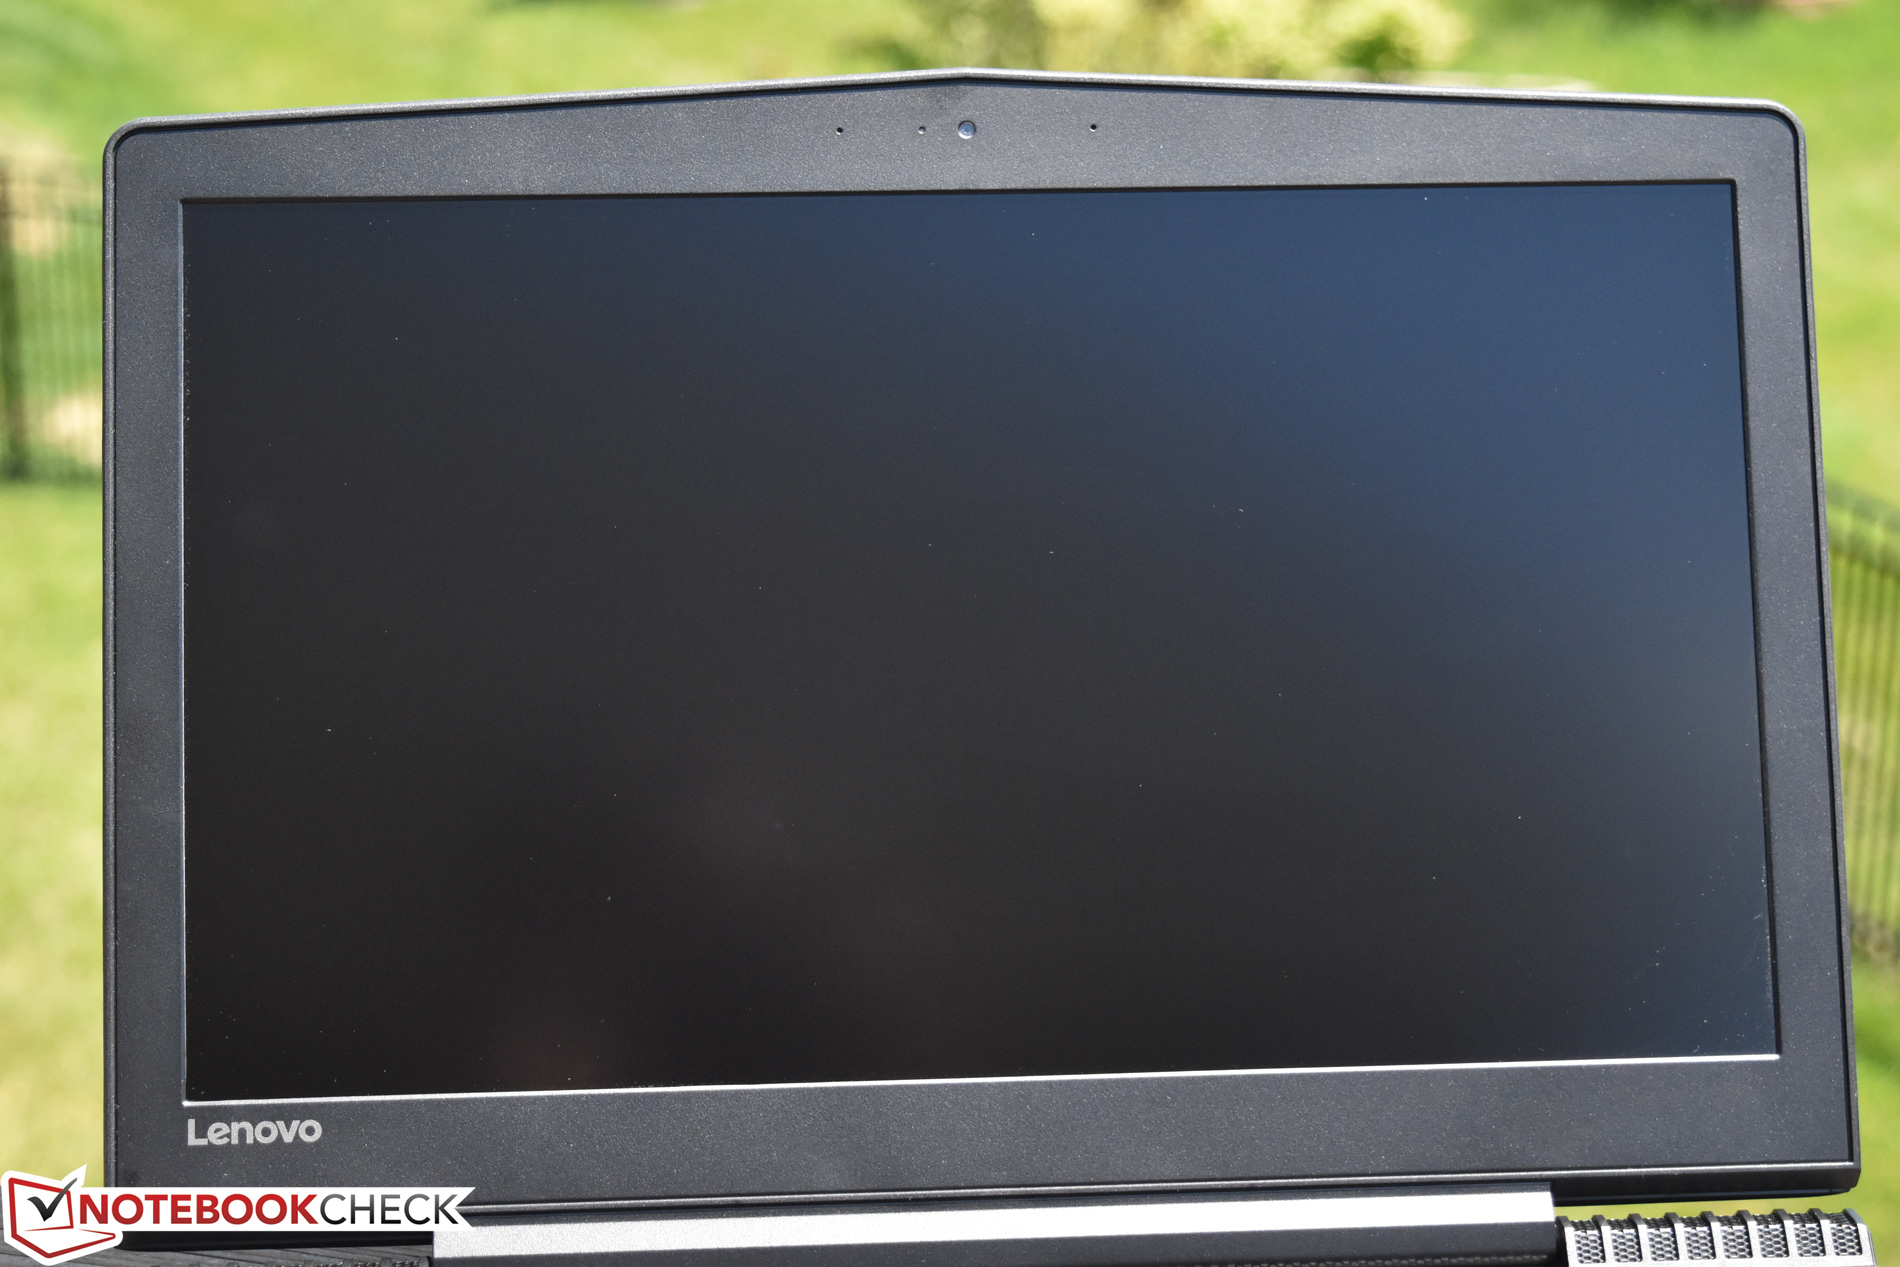
它的最大弱点在于无法升级显卡——由于定位更高的Y720的存在,这也多少在我们的预料之中。出了仅属于中端的显卡性能外,Y520为了接近实惠型游戏本定位也在其他一些方面也节省了成本。首先最明显的就是机身的设计和材质;Y720坚固的金属表面和RGB分区背光键盘没有被Y520继承,它采用了红黑两色的全塑料机身。其他的一些设备,如华硕 ROG Strix GL553VD则相比其他方面更加强调机身和设计,具备一些更接近商务风格的Y520所不具备的直观魅力。另外一个明显不足之处是屏幕,尽管在显示效果上中规中矩,但亮度和色域覆盖都难以令人满意。在这个方面,Y720也提供了可选升级,而Y520则只有一种屏幕配置。
如果可以投入更高几百美元的预算的话,Y720会是个更有吸引力的选择。而一些相似机型,如戴尔 Inspiron 15 7567的定位也十分相近,值得同时参考。不过从自身出发,Y520是一台十分成功的设备。它性能强劲、可靠而稳定,以较低的售价提供了优秀的游戏性能。
注:本文是基于完整评测的缩减版本,阅读完整的英文评测,请点击这里。
Lenovo Legion Y520-15IKBN-80WK001KUS
- 05/26/2017 v6 (old)
Steve Schardein
Price comparison
