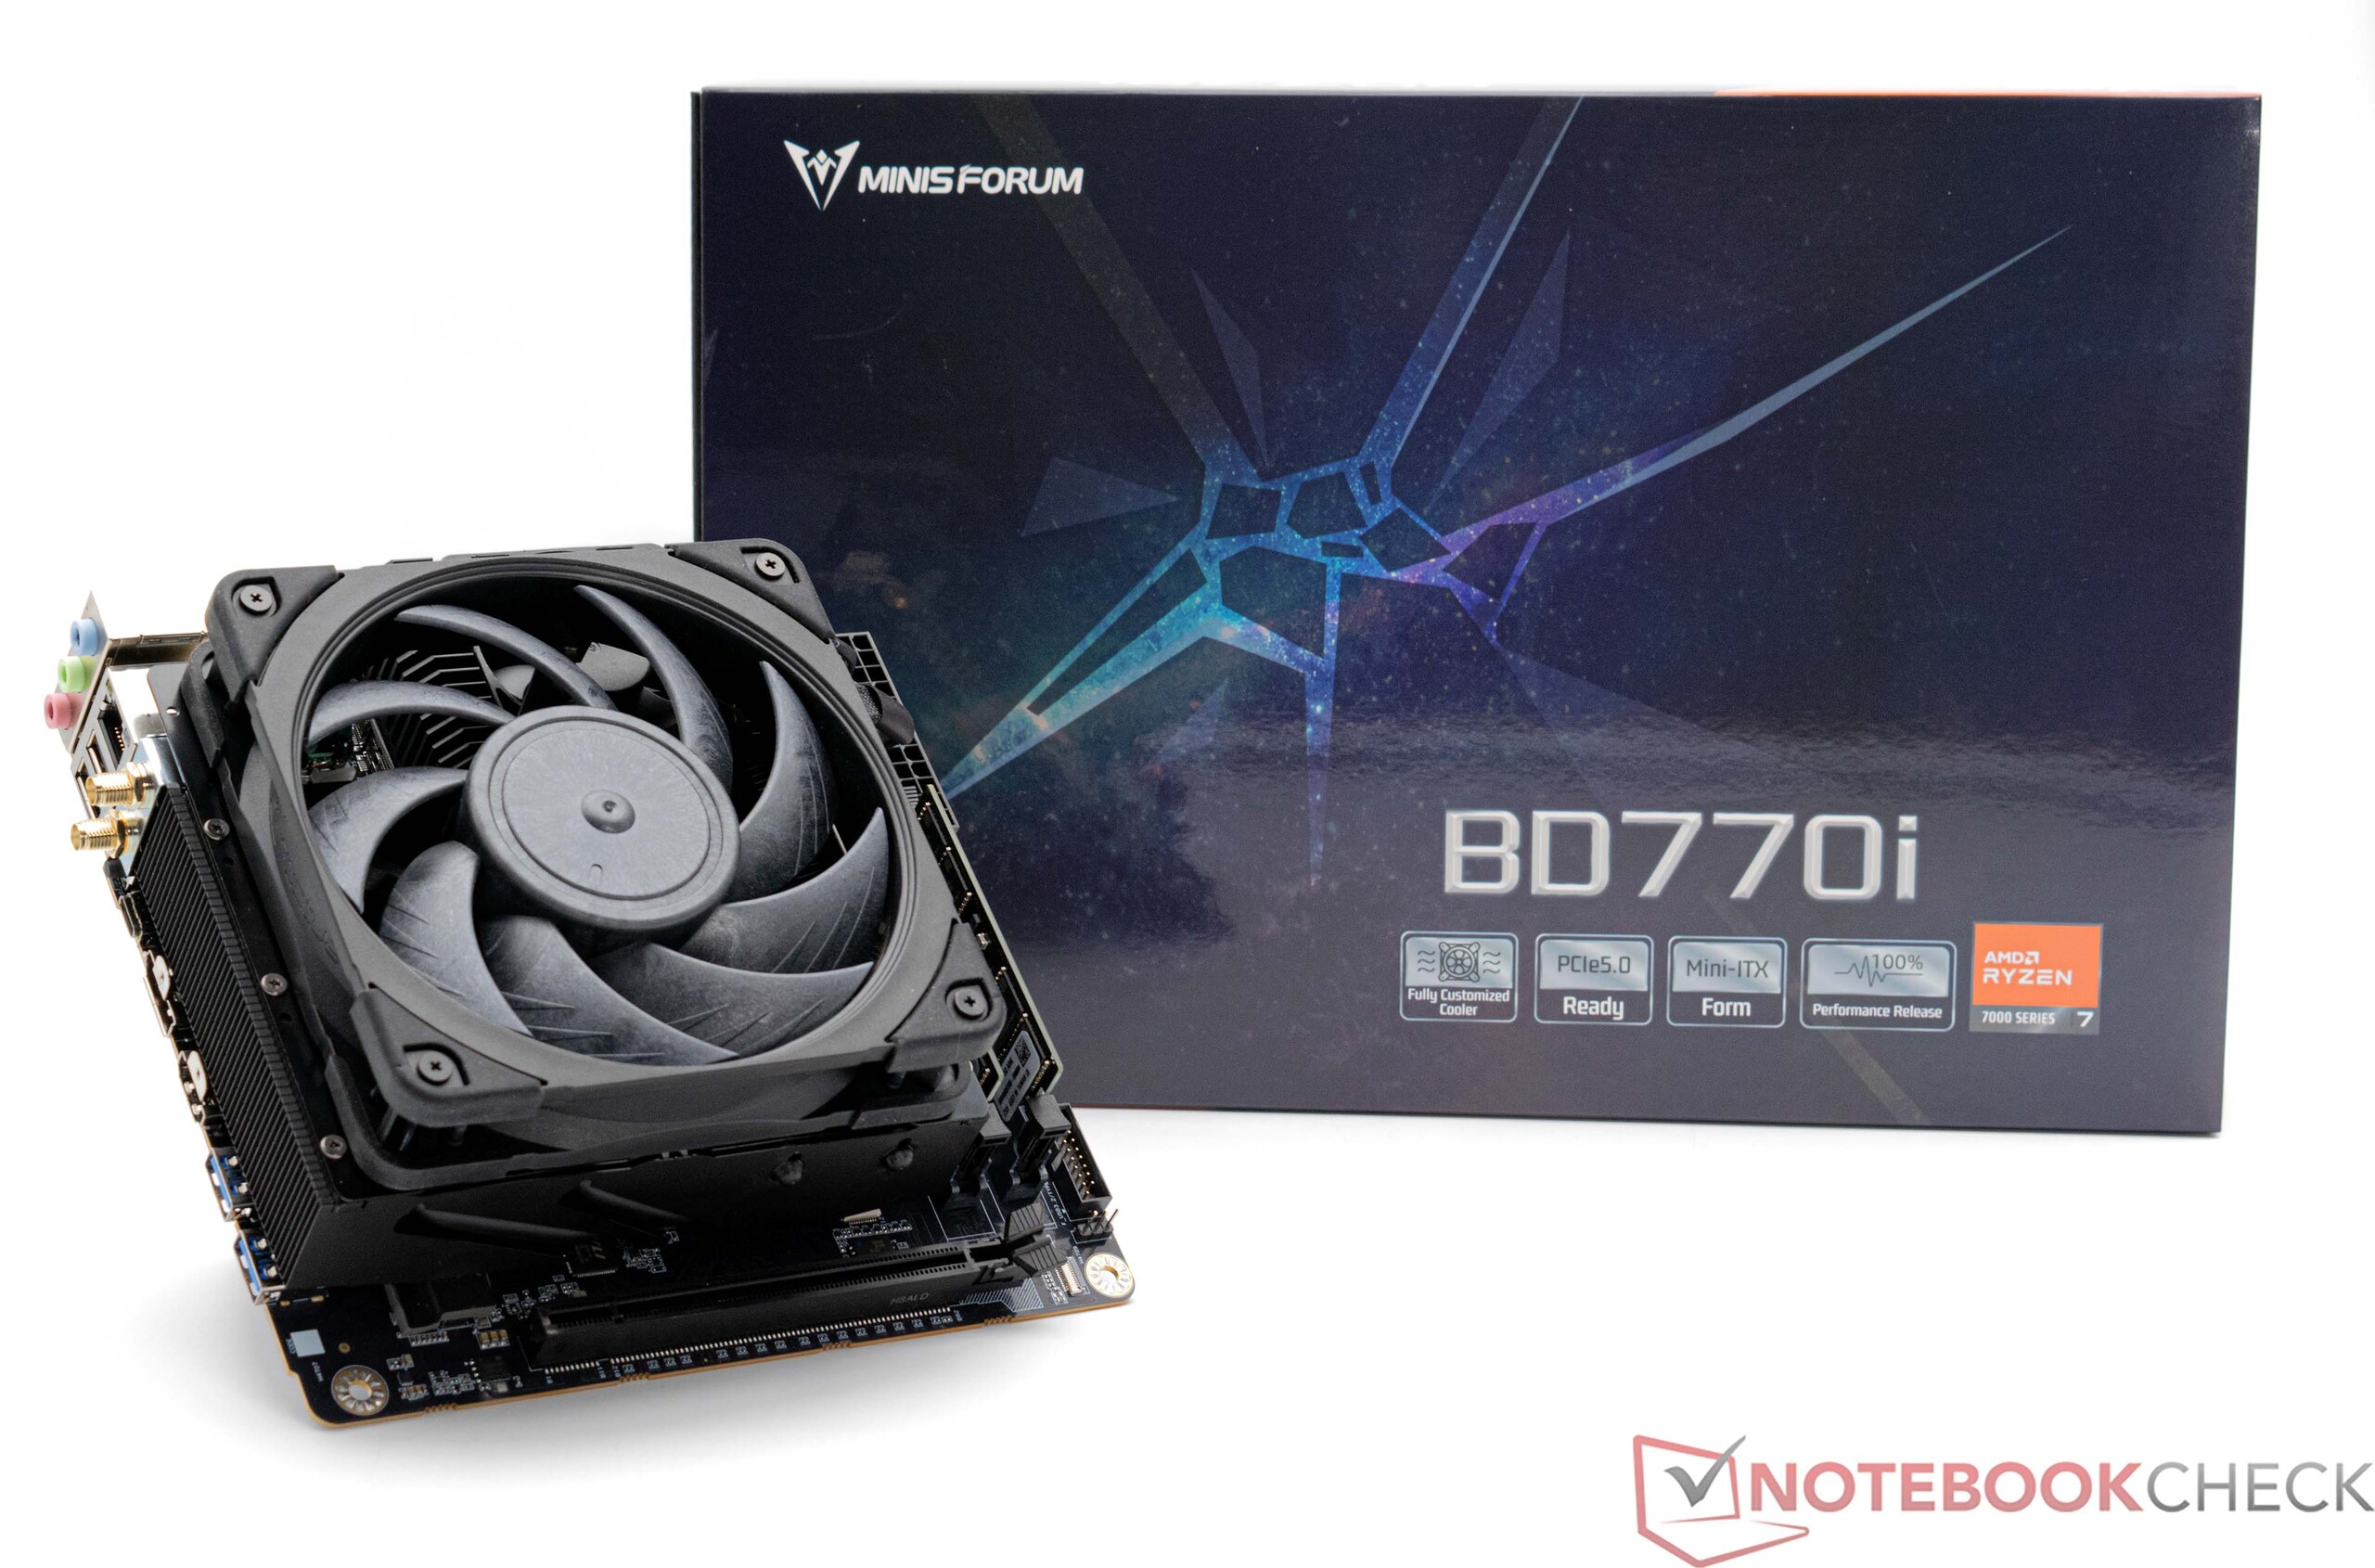
Minisforum BD770i 评测:采用 AMD Ryzen 7 7745HX 作为小型游戏 PC 基础的 mini-ITX 主板
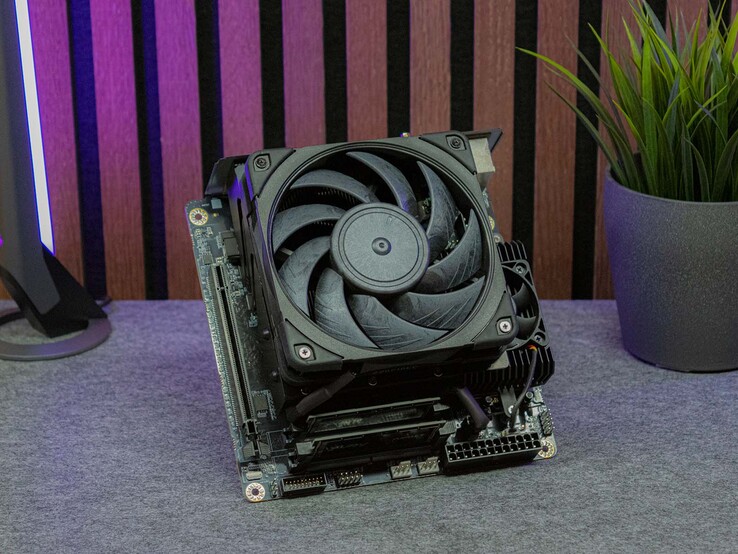
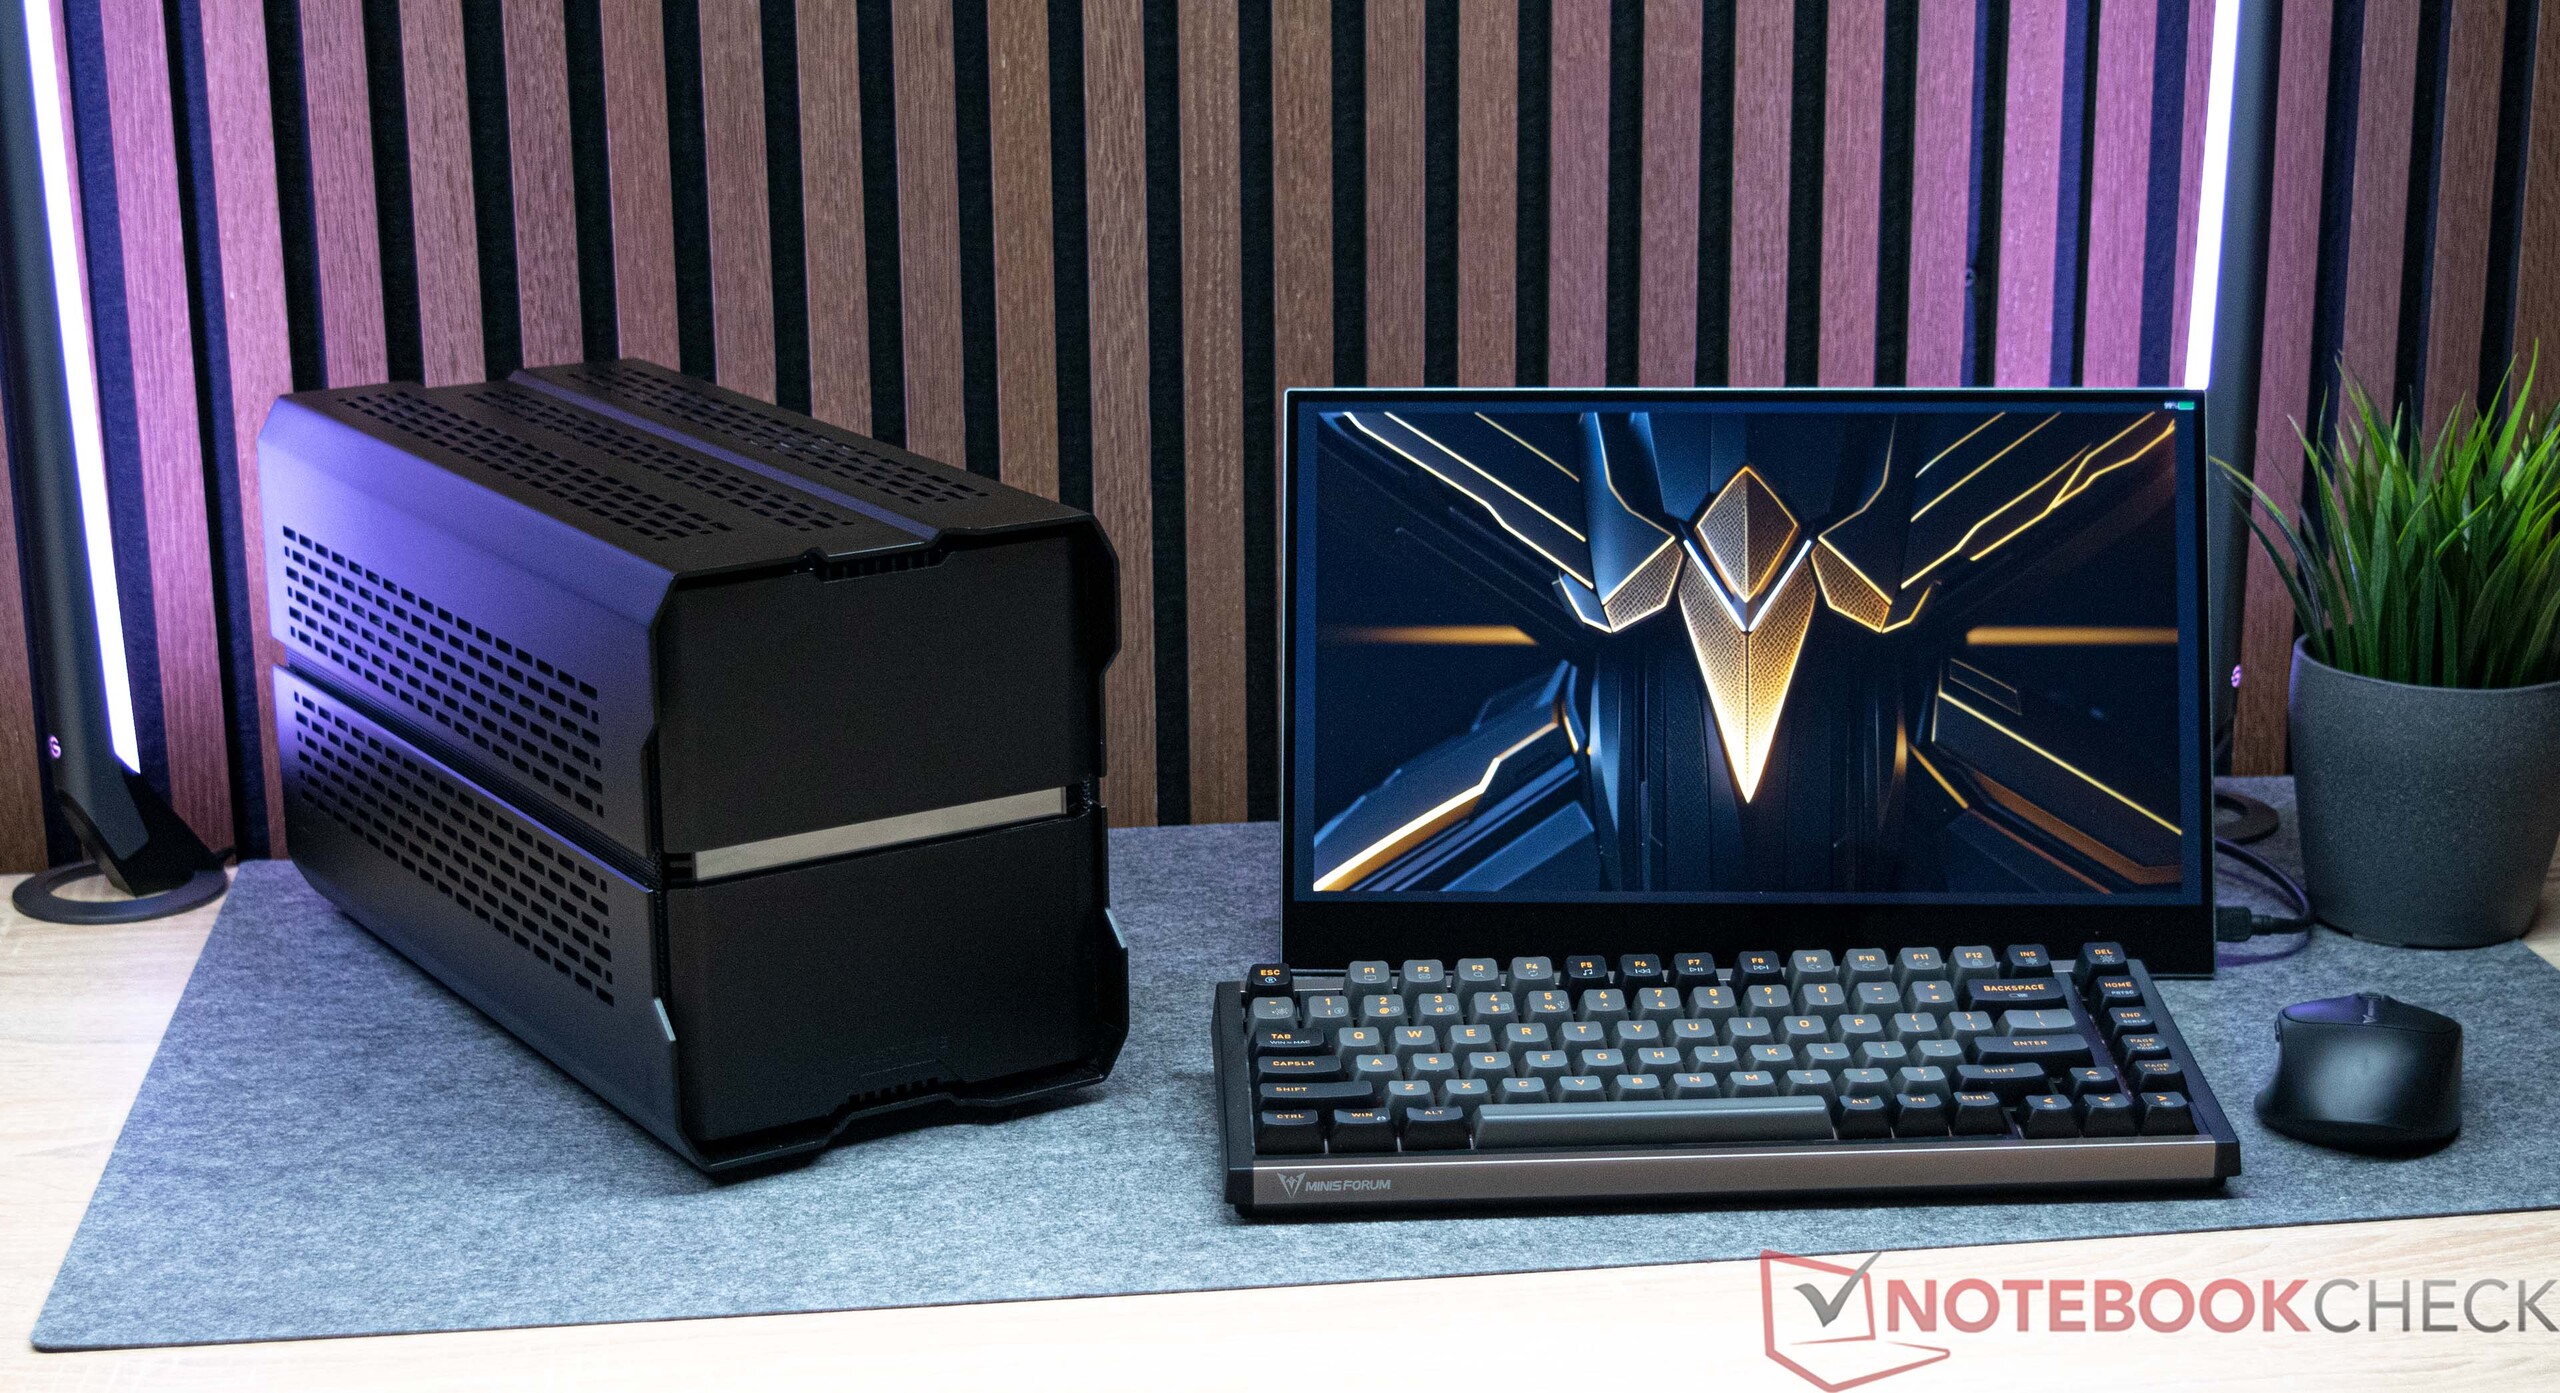
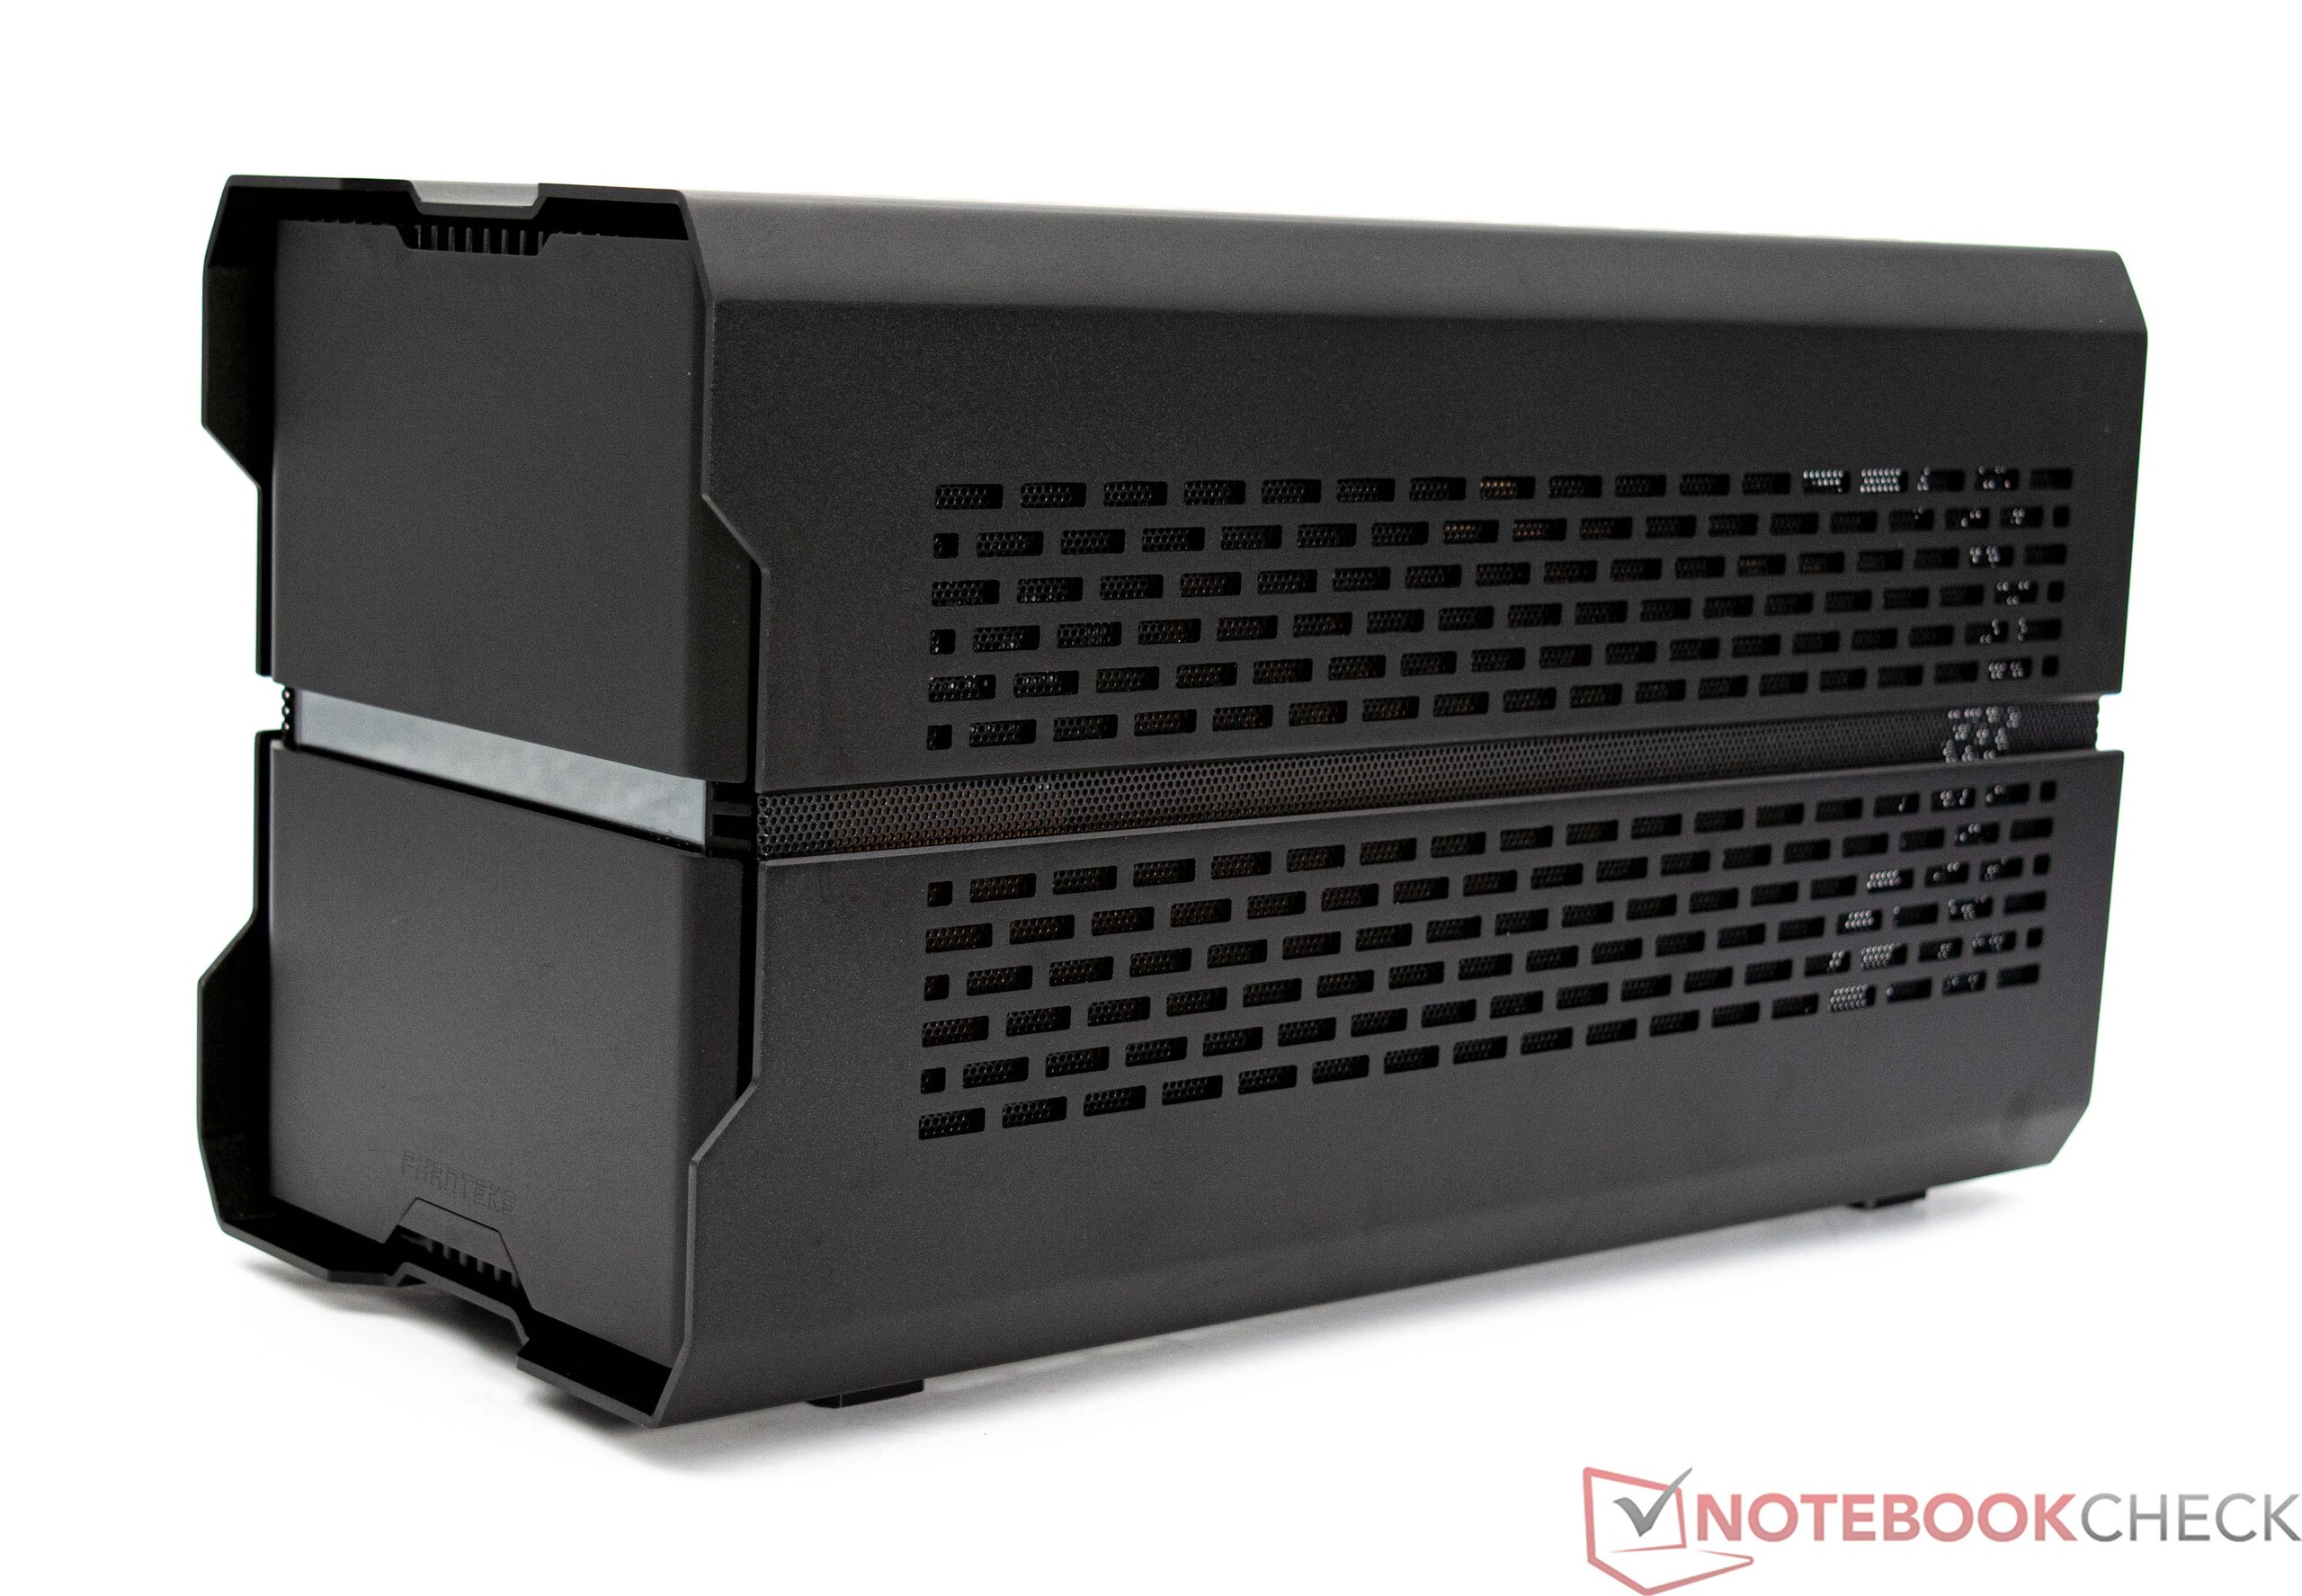
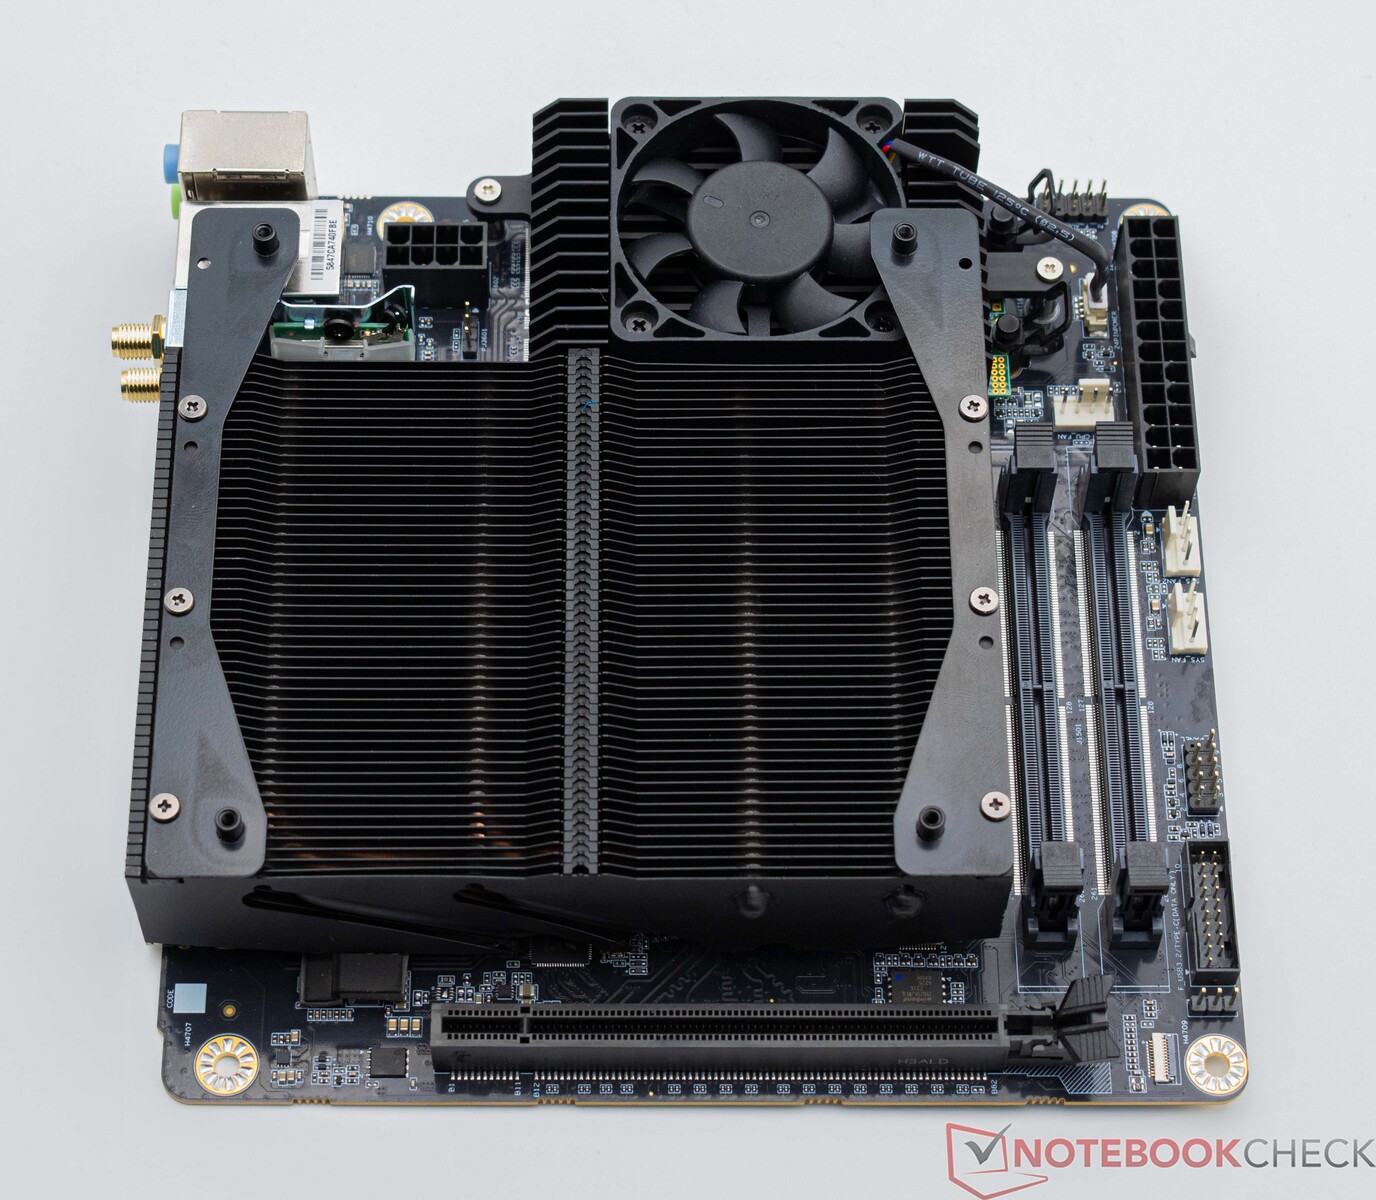
Minisforum 以生产 Mini-PC 而闻名,此次推出的 Minisforum BD770i 主板采用了焊接式 CPU,开创了新的领域。该主板采用 ITX 标准作为外形尺寸,与大多数 PC 机箱兼容。由于其结构紧凑,它很可能被应用于非常小的 Mini-ITX 机箱中。
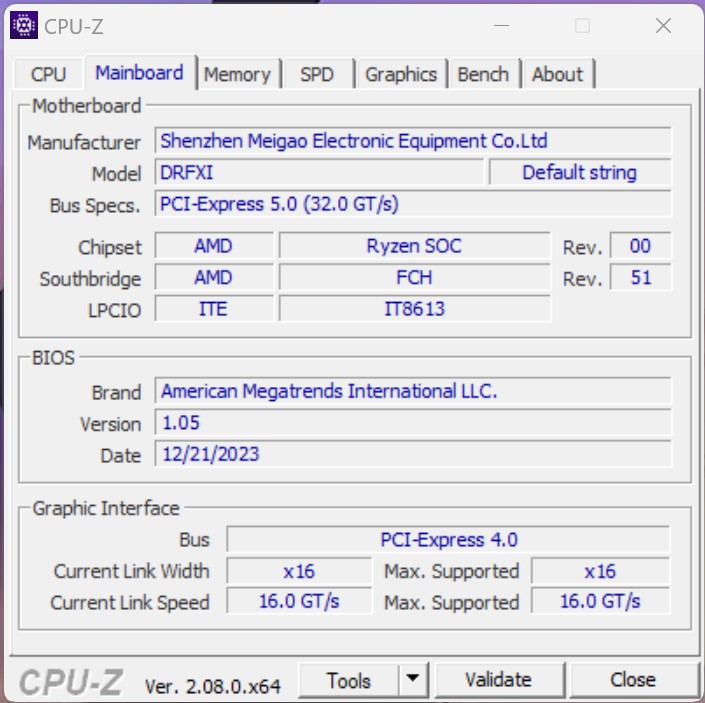
BD770i 配备了
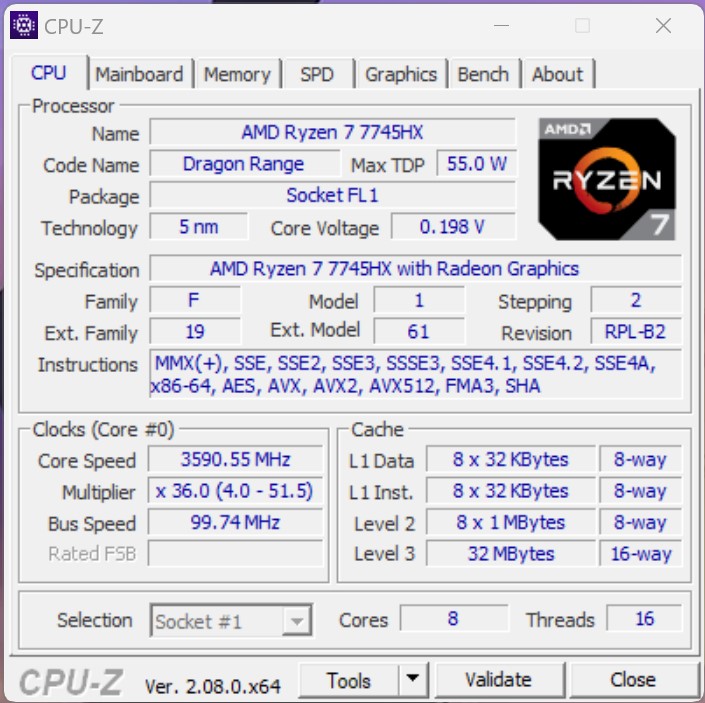
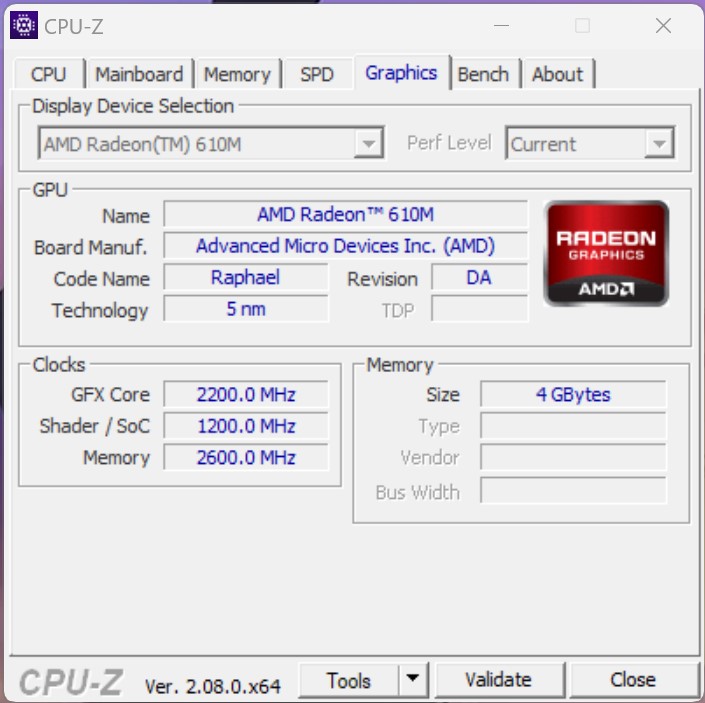
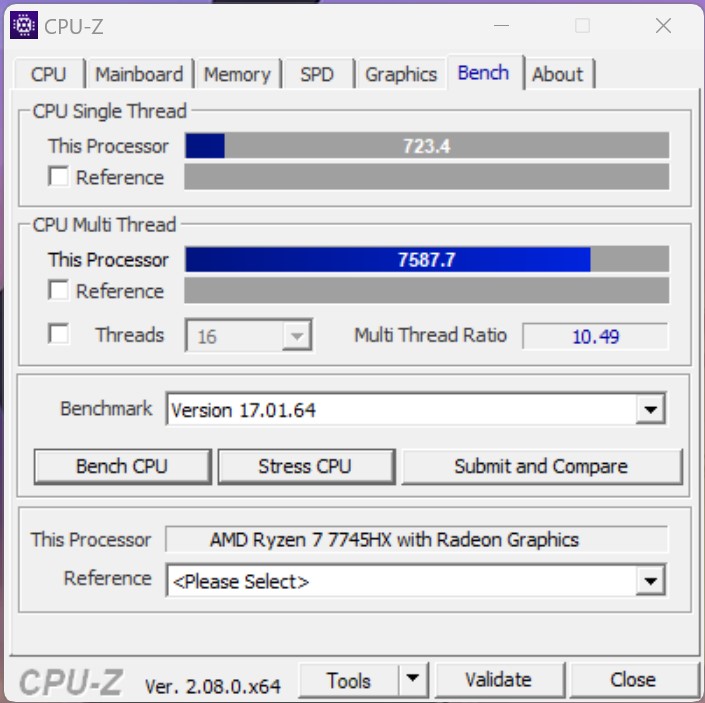
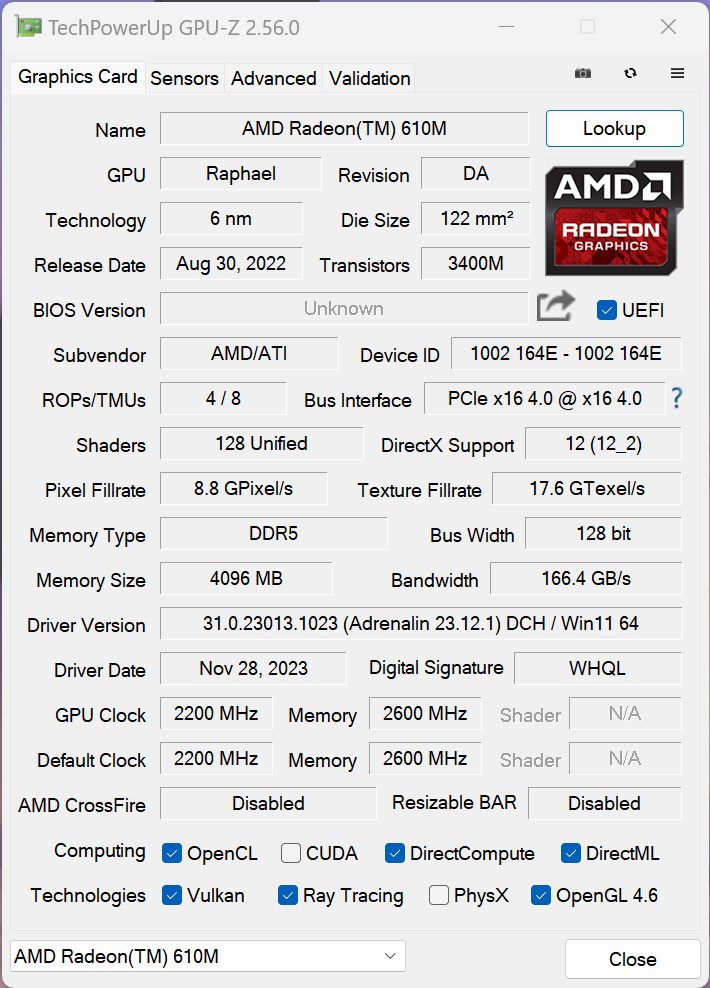
AMD Ryzen 7 7745HX处理器,拥有八个 Zen4 内核。这款 SoC 可为处理复杂任务提供充足的性能。我们一起深入研究了它的游戏性能。 英伟达GeForce RTX 4090由于采用了全 PCIe x16 插槽,显卡可以在峰值性能下运行。Minisforum 目前提供五款不同的主板,每款都配备了笔记本领域的处理器。在下面的概述中,我们汇编了有关这些设备的信息,重点介绍了它们的主要规格。Minisforum 主板对比
| 名称 | BD790i | BD770i | AR900i | AR650i | AD650i |
| CPU | AMD Ryzen 9 7945HX | AMD Ryzen 7 7745HX | Intel Core i9-13900HX 处理器 | Intel Core i7-13650HX | Intel Core i7-13650HX 处理器 |
| 内核/线程 | 16 / 32 | 8 /16 | 24 / 32 | 14 / 20 | 14 / 20 |
| GPU | AMD Radeon 610M | AMD Radeon 610M | IntelUHD Graphics | IntelUHD Graphics | IntelUHD Graphics |
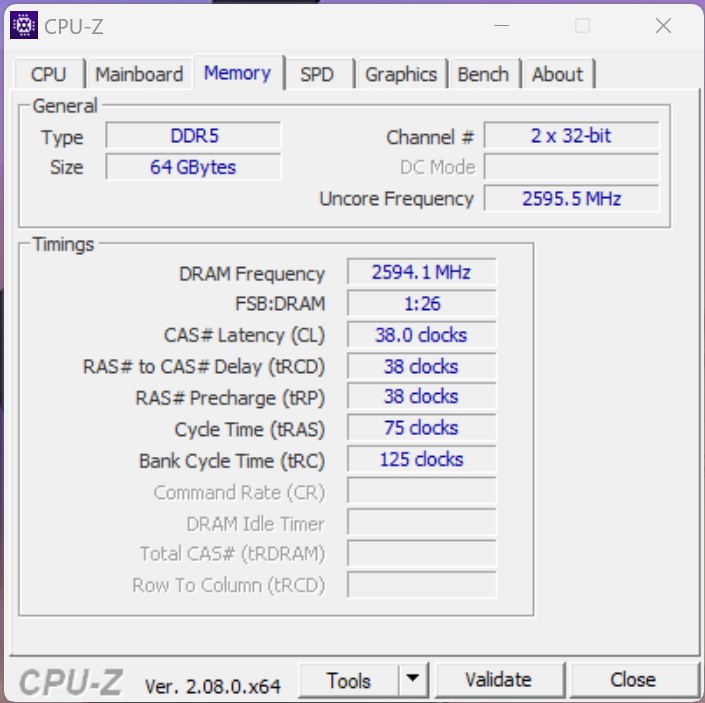
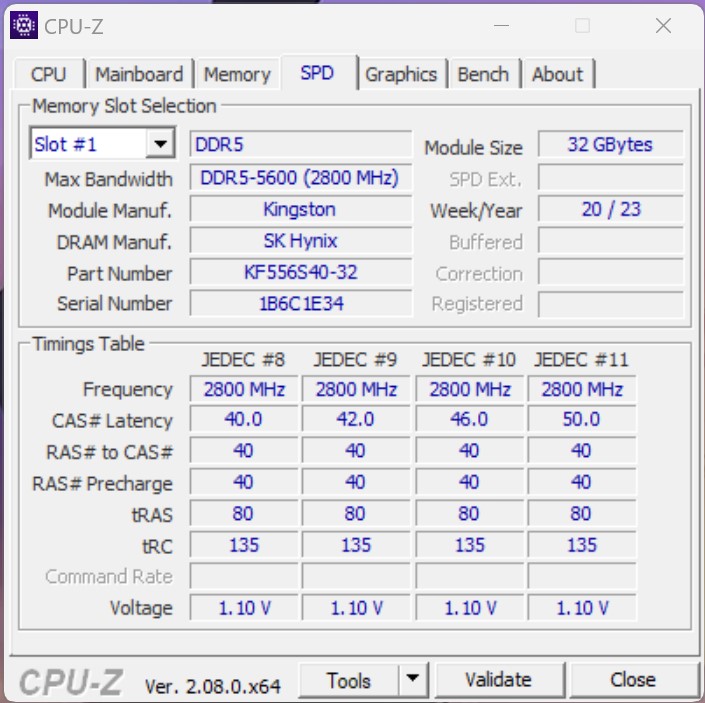
| 内存类型 | DDR5-5200 SODIMM | DDR5-5200 SODIMM | DDR5-5600 SODIMM | DDR5-5600 SODIMM | DDR5-5600 SODIMM |
| 最大内存容量 | 96GB | 64GB | 64 GB | 64 GB | 64 GB |
Minisforum BD770i 和测试系统详解


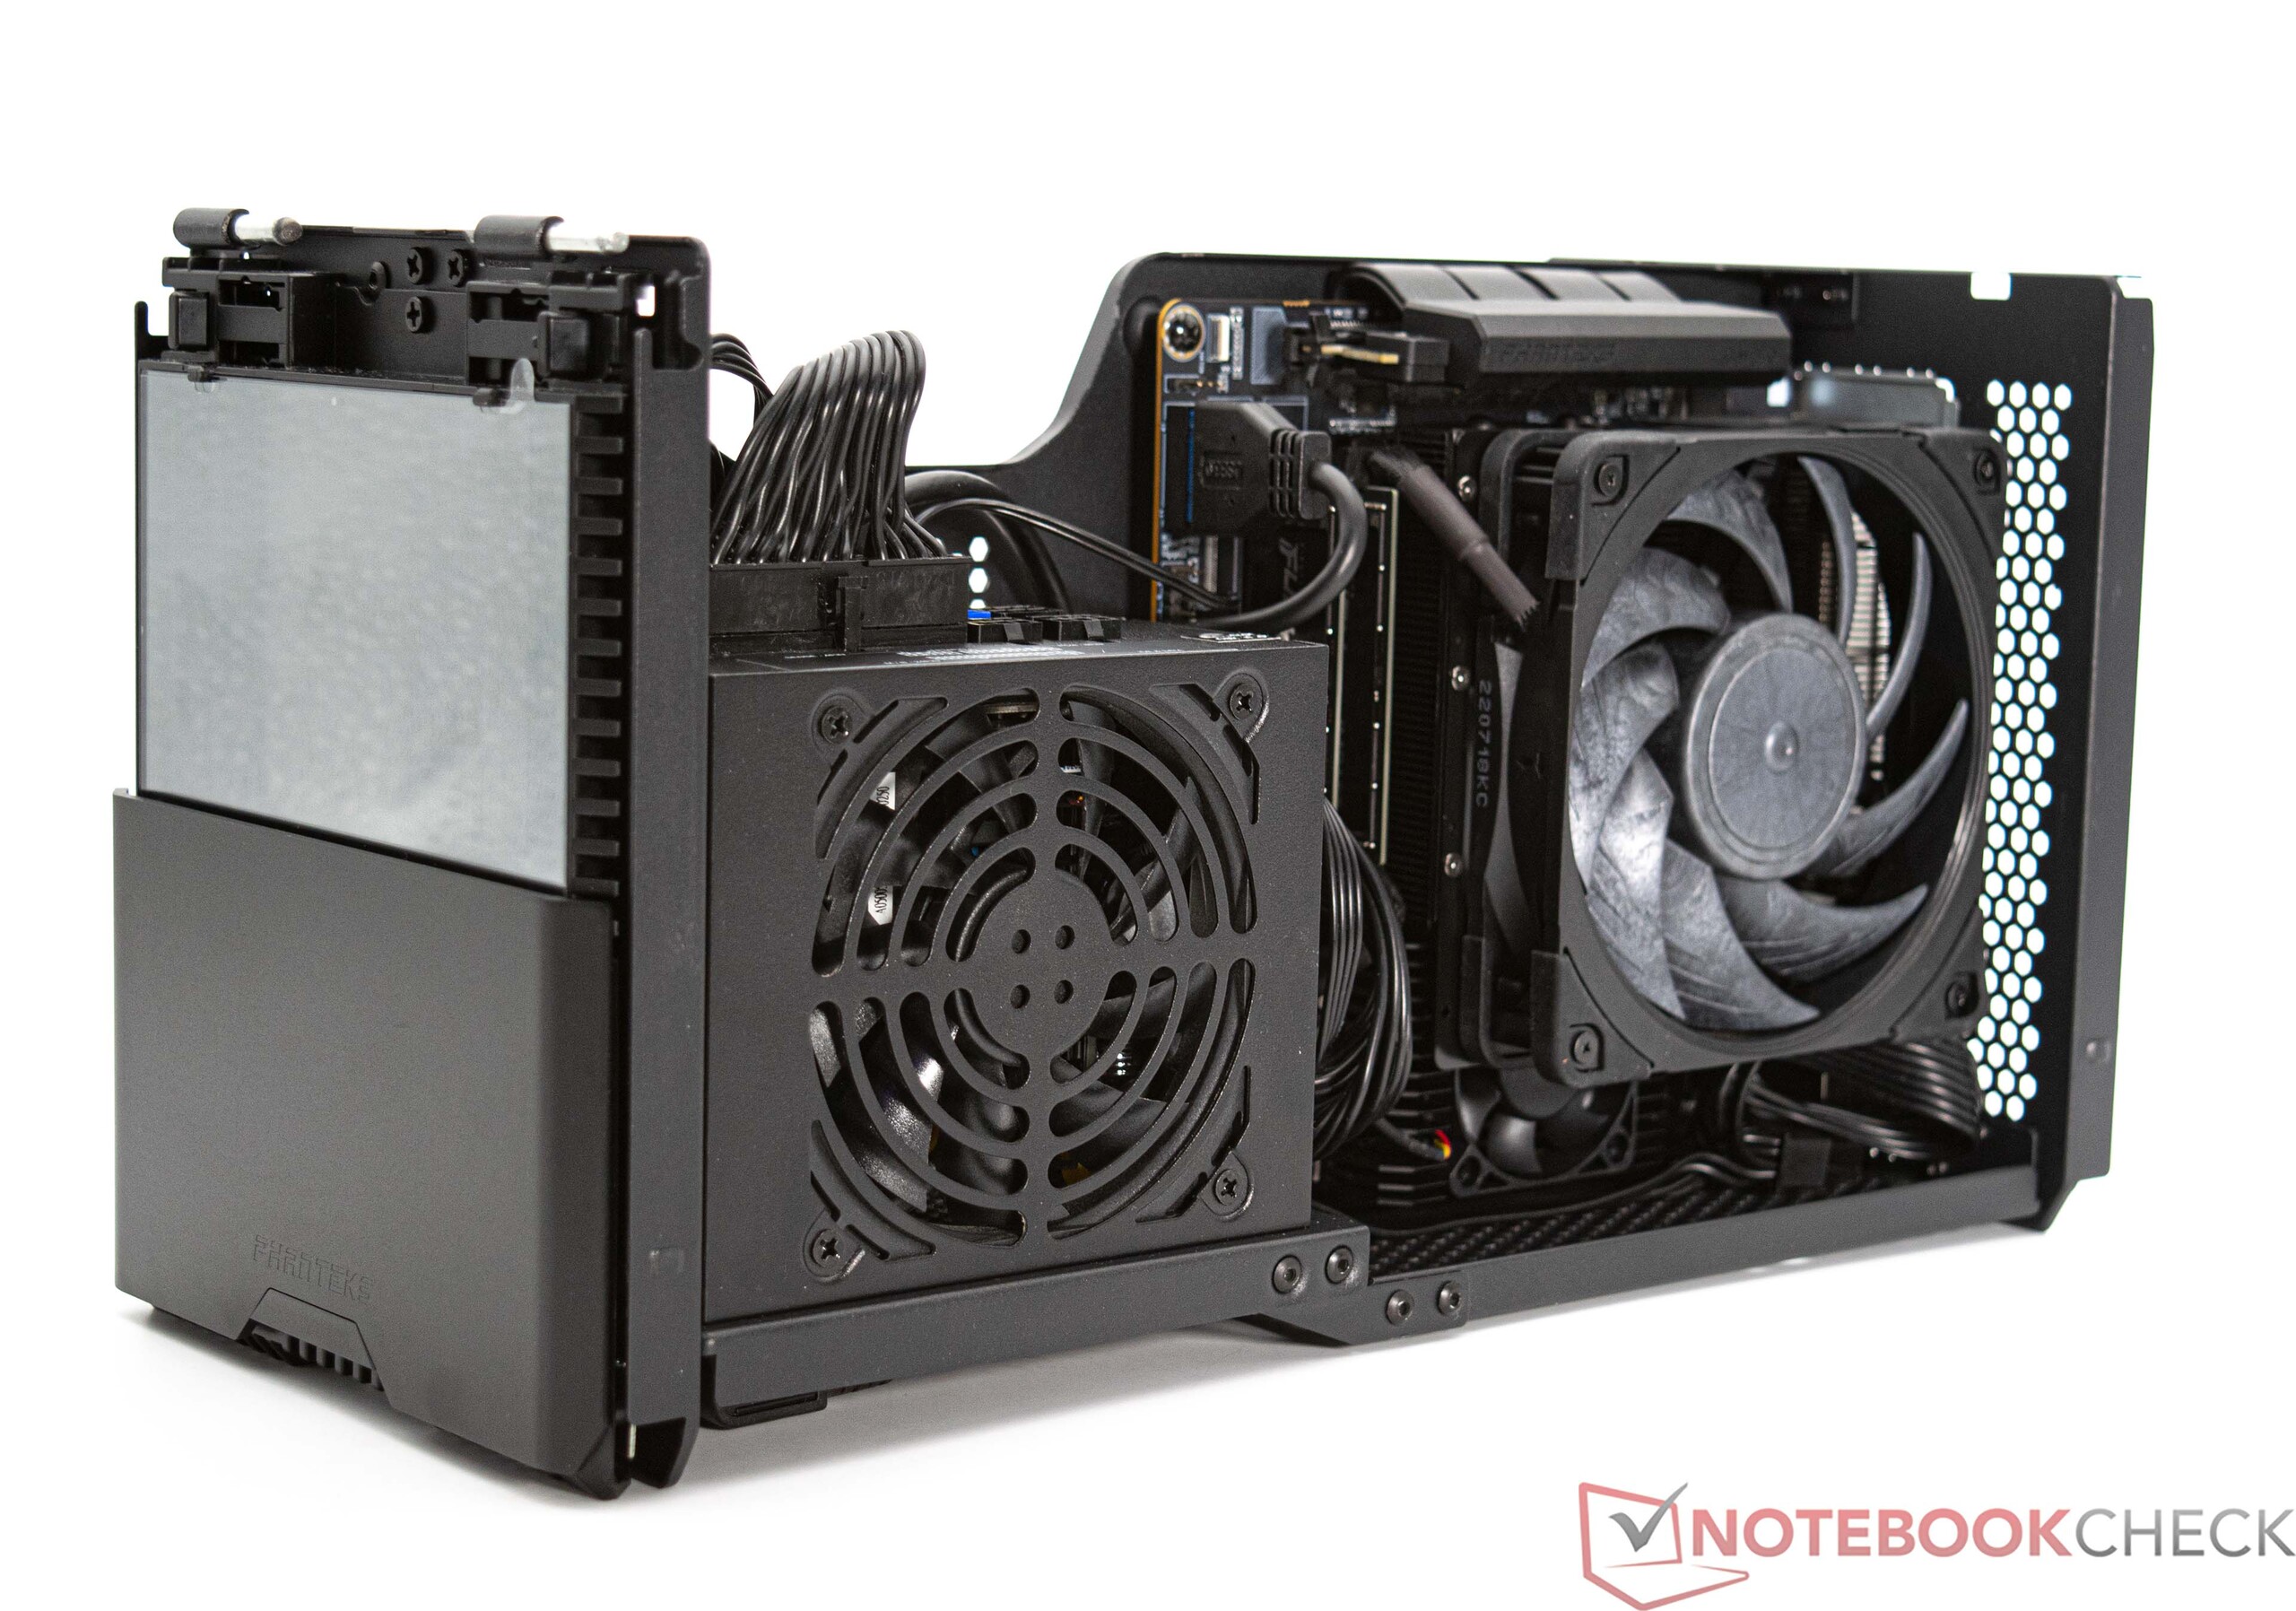
案例和测试设置
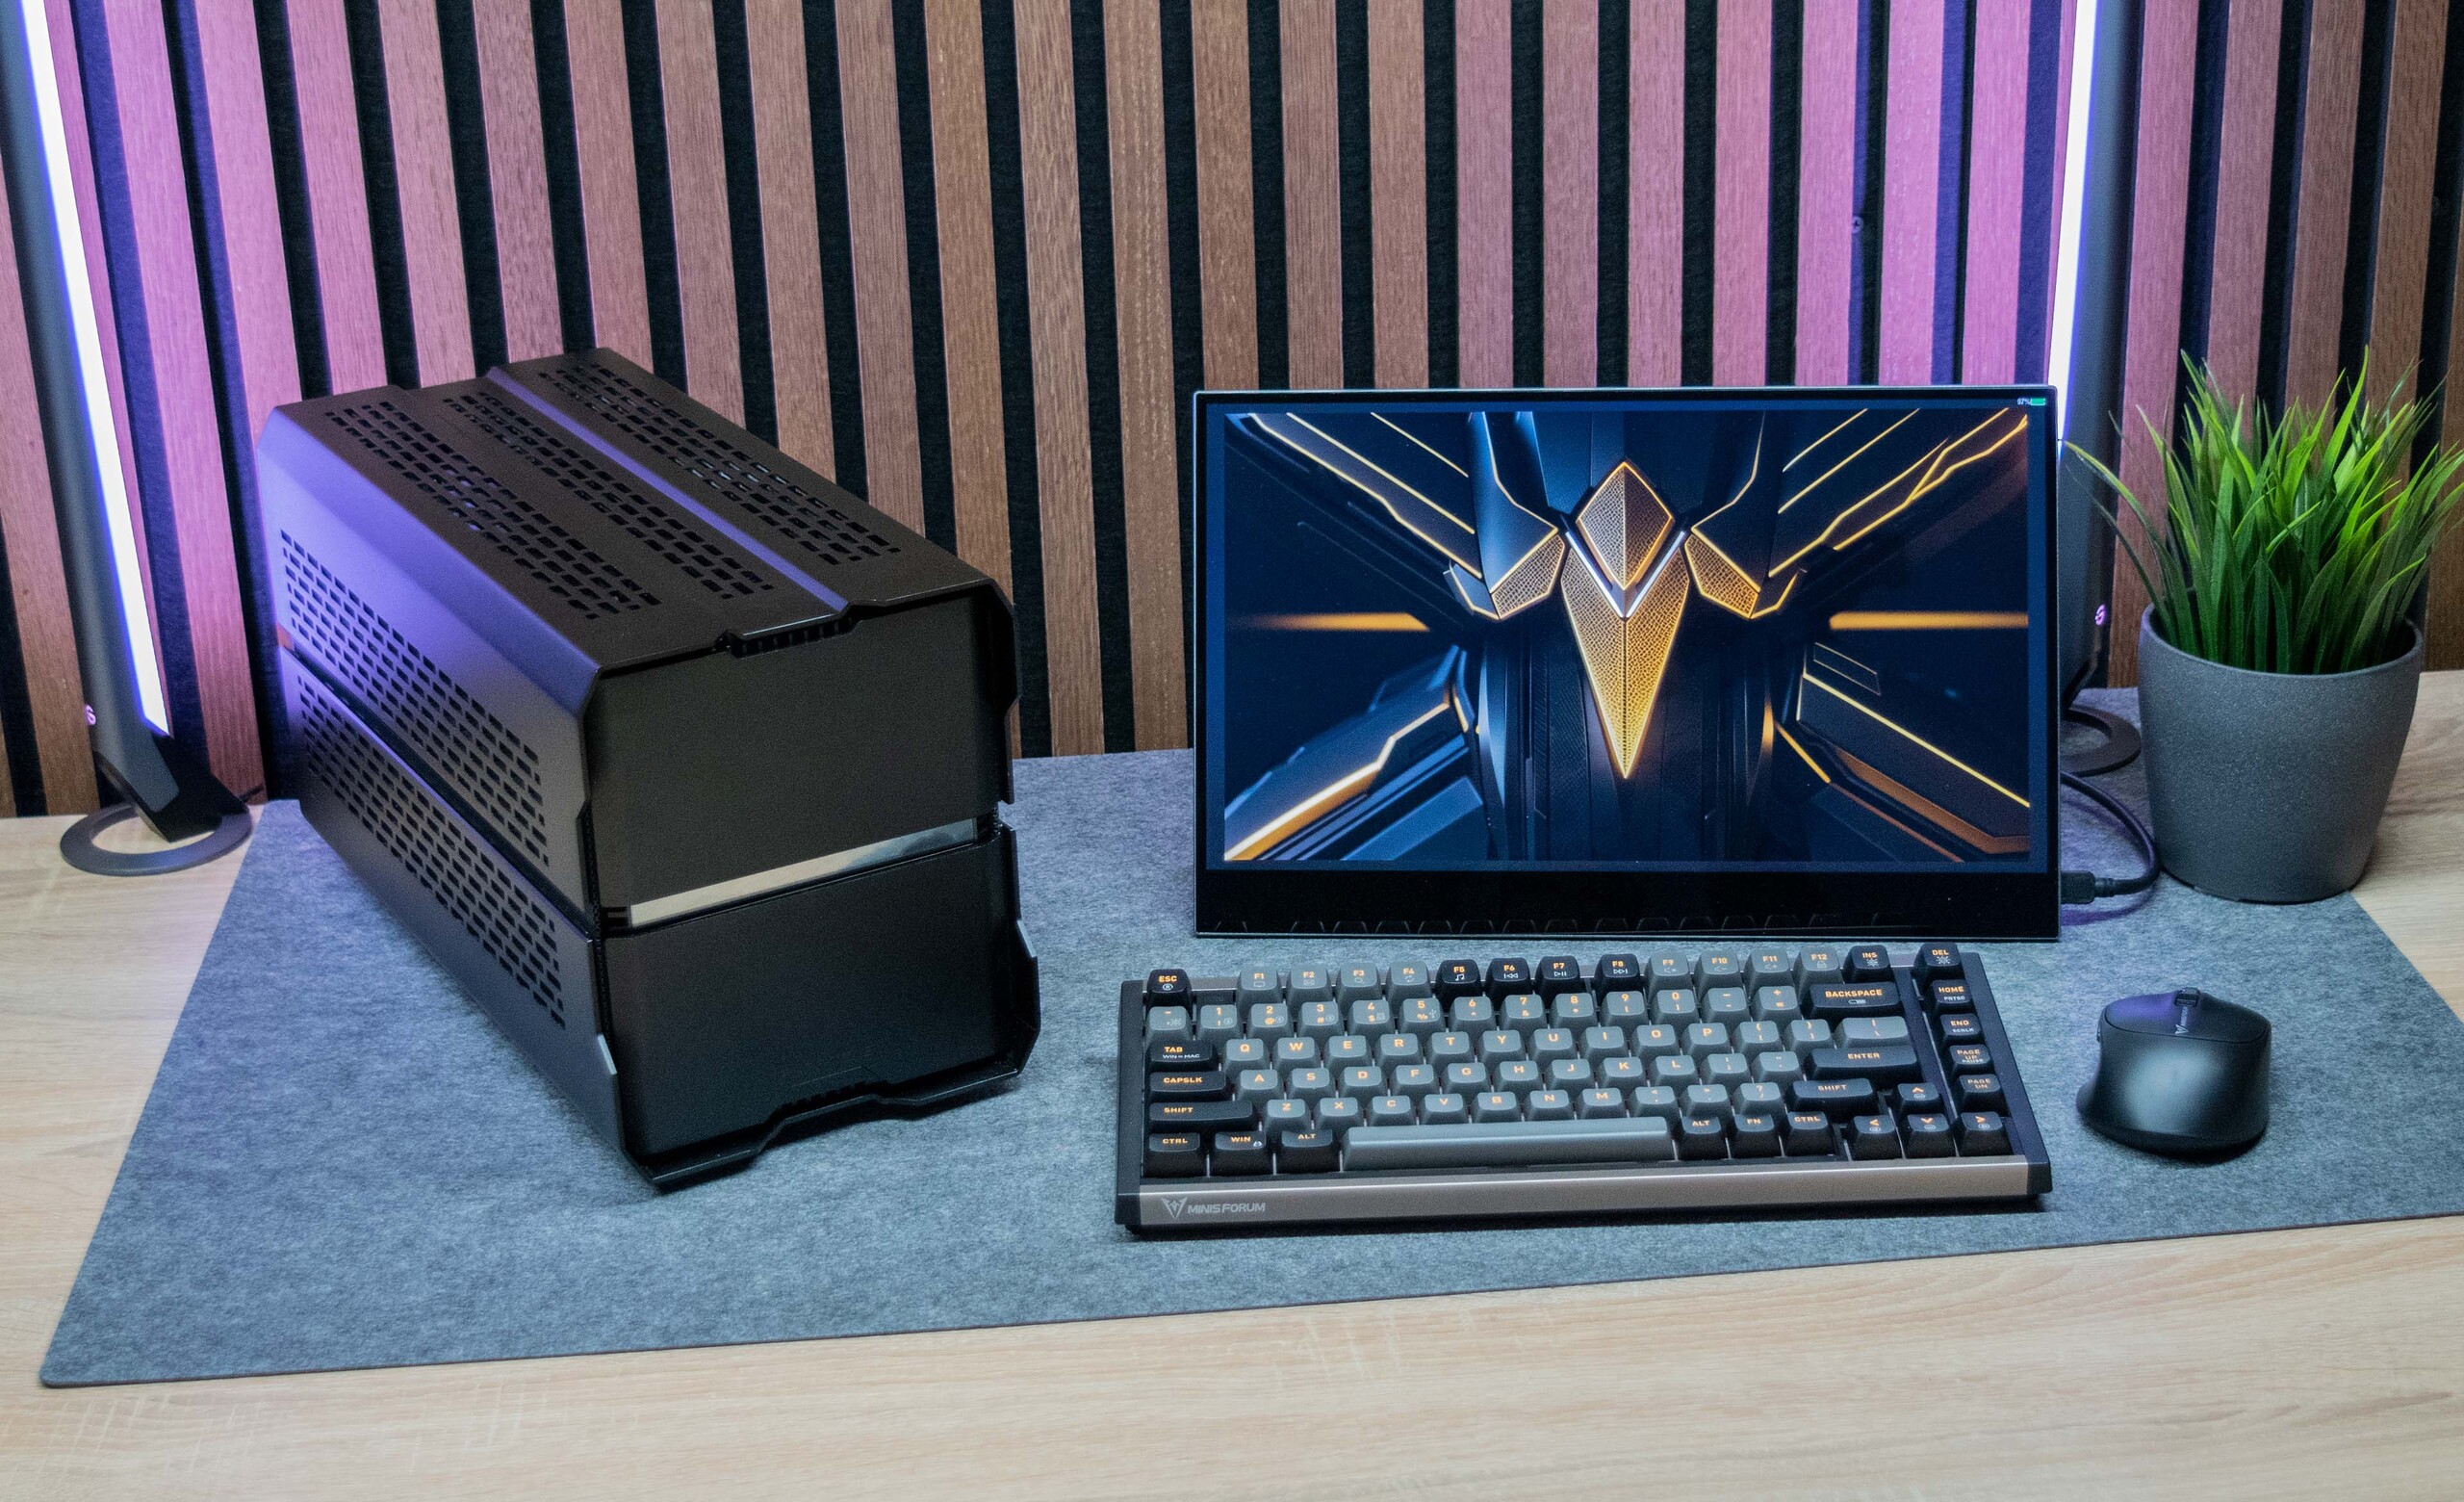
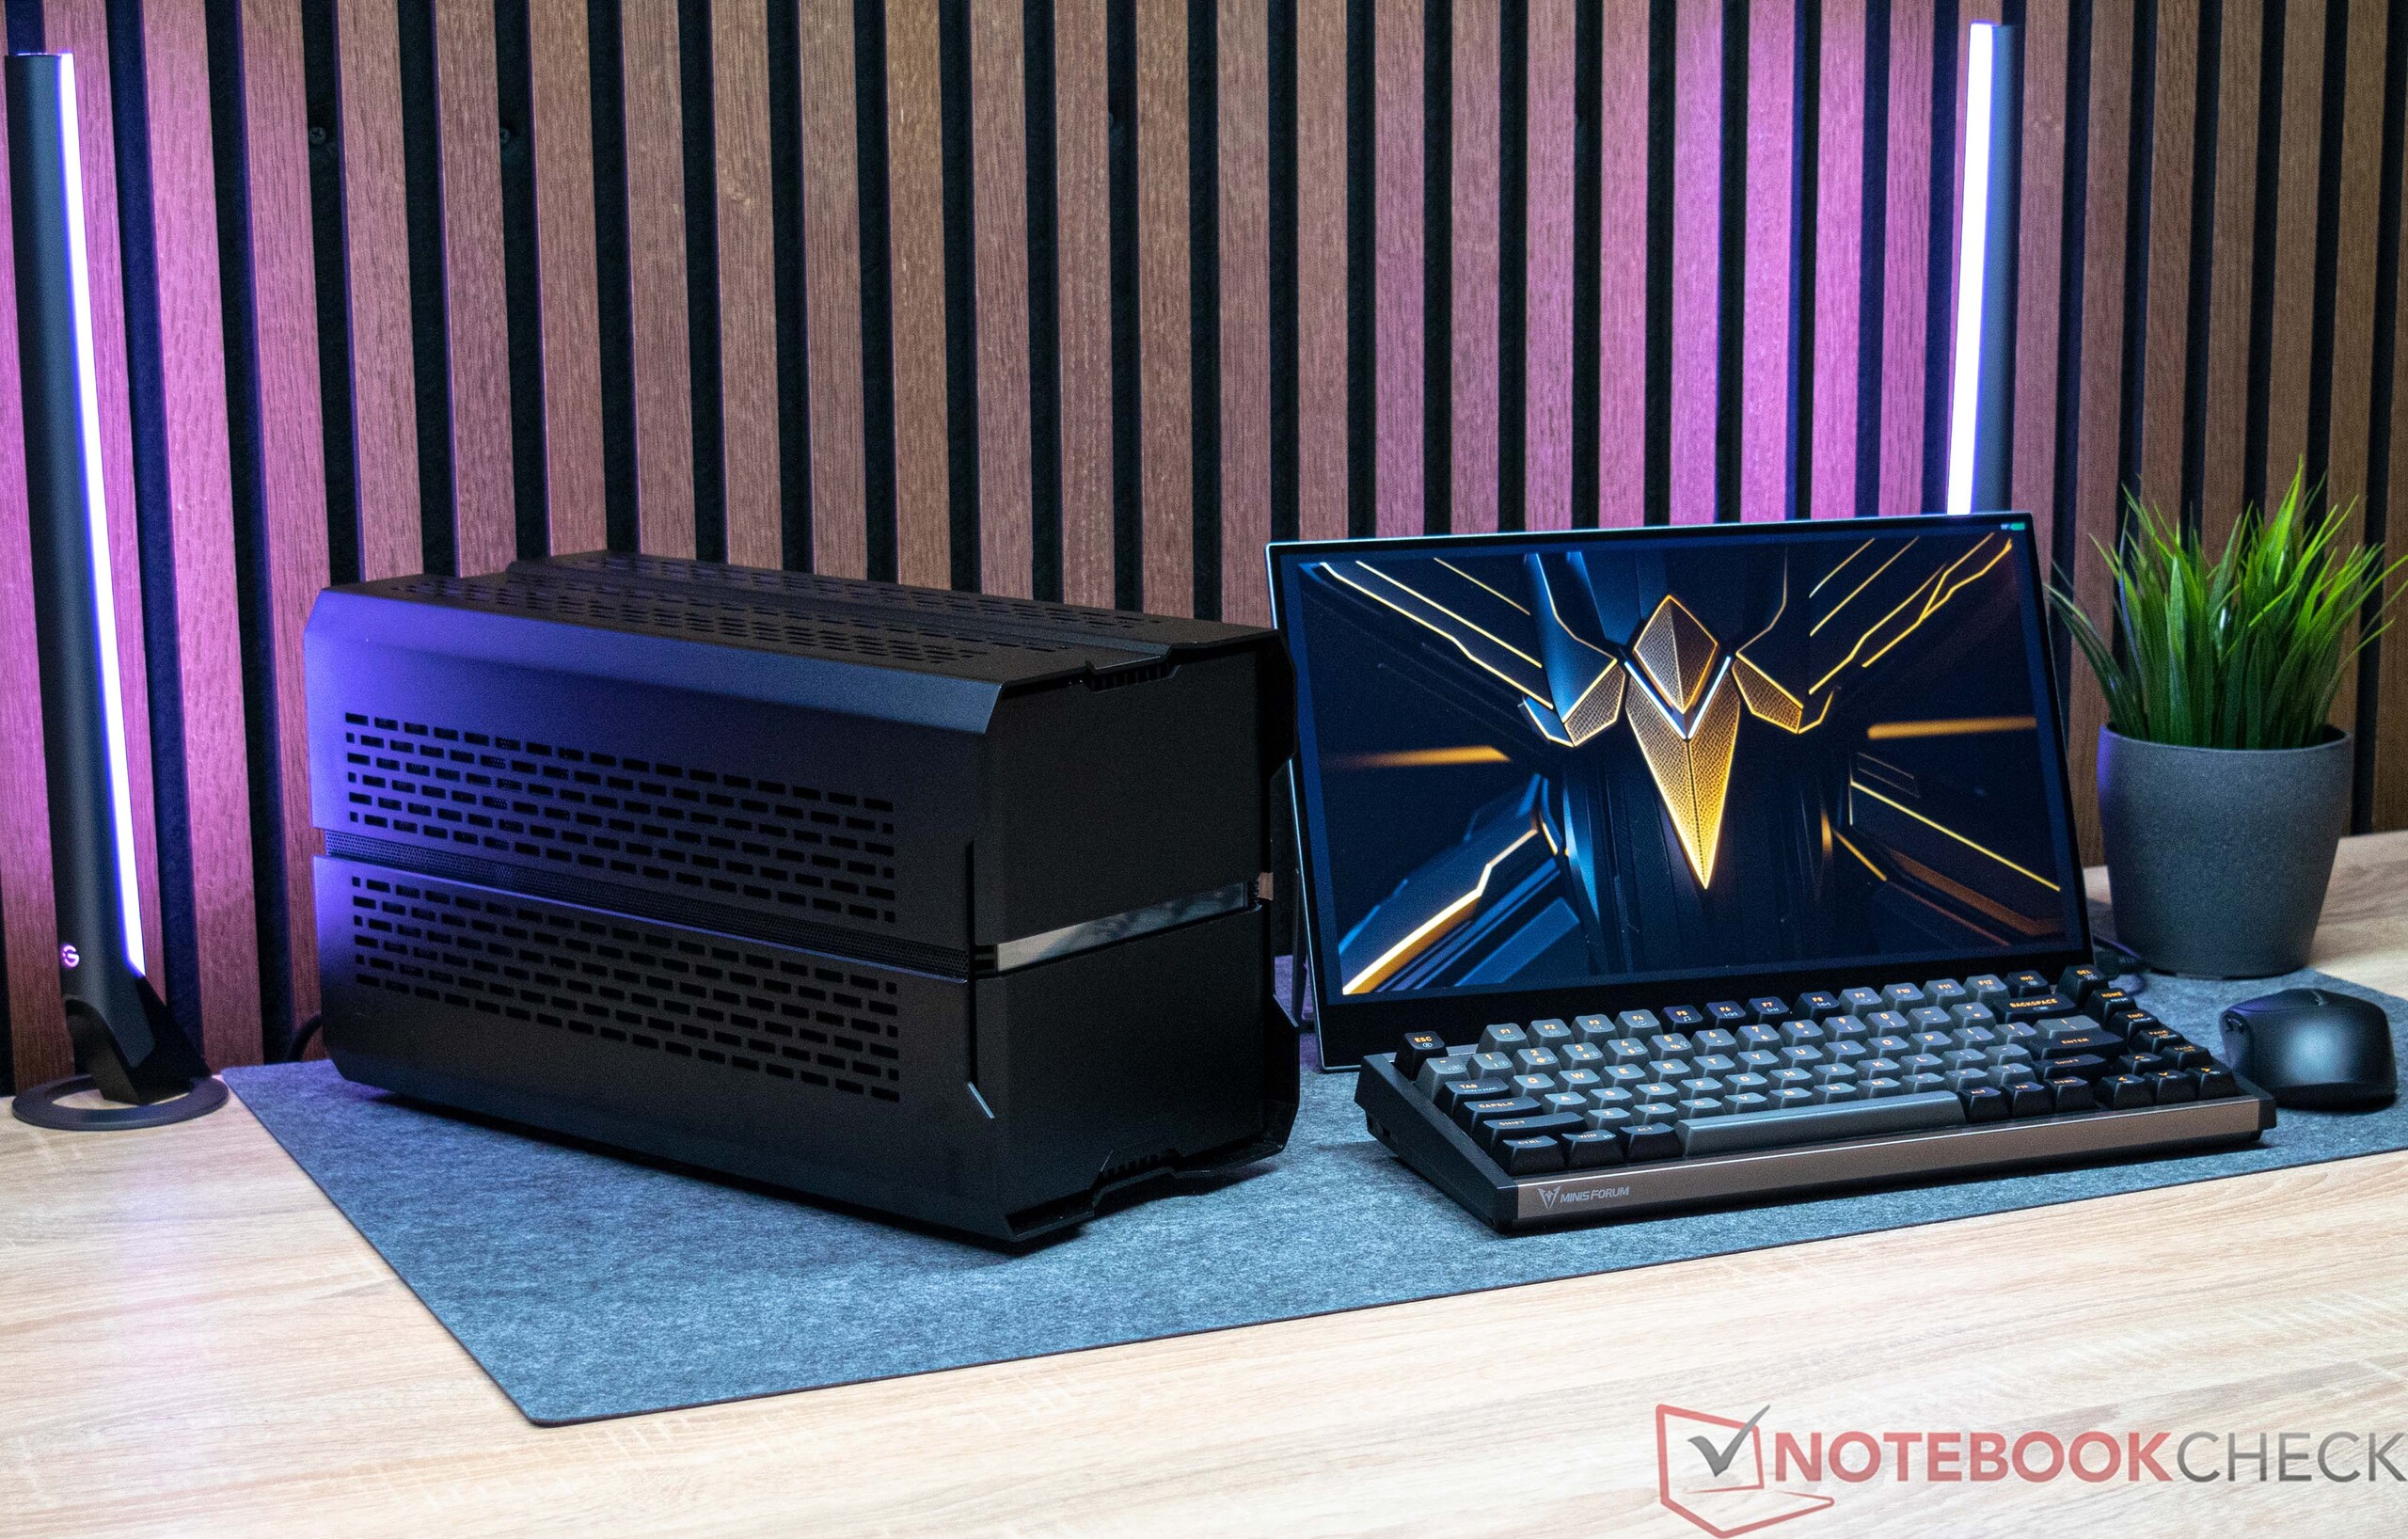
为了确保测试的真实性,我们选择在没有专用显卡的情况下进行所有测试。我们使用了 Phanteks Enthoo Evolv Shift XT 机箱,该机箱因其紧凑的设计而被选中,为我们提供了坚实的基础。
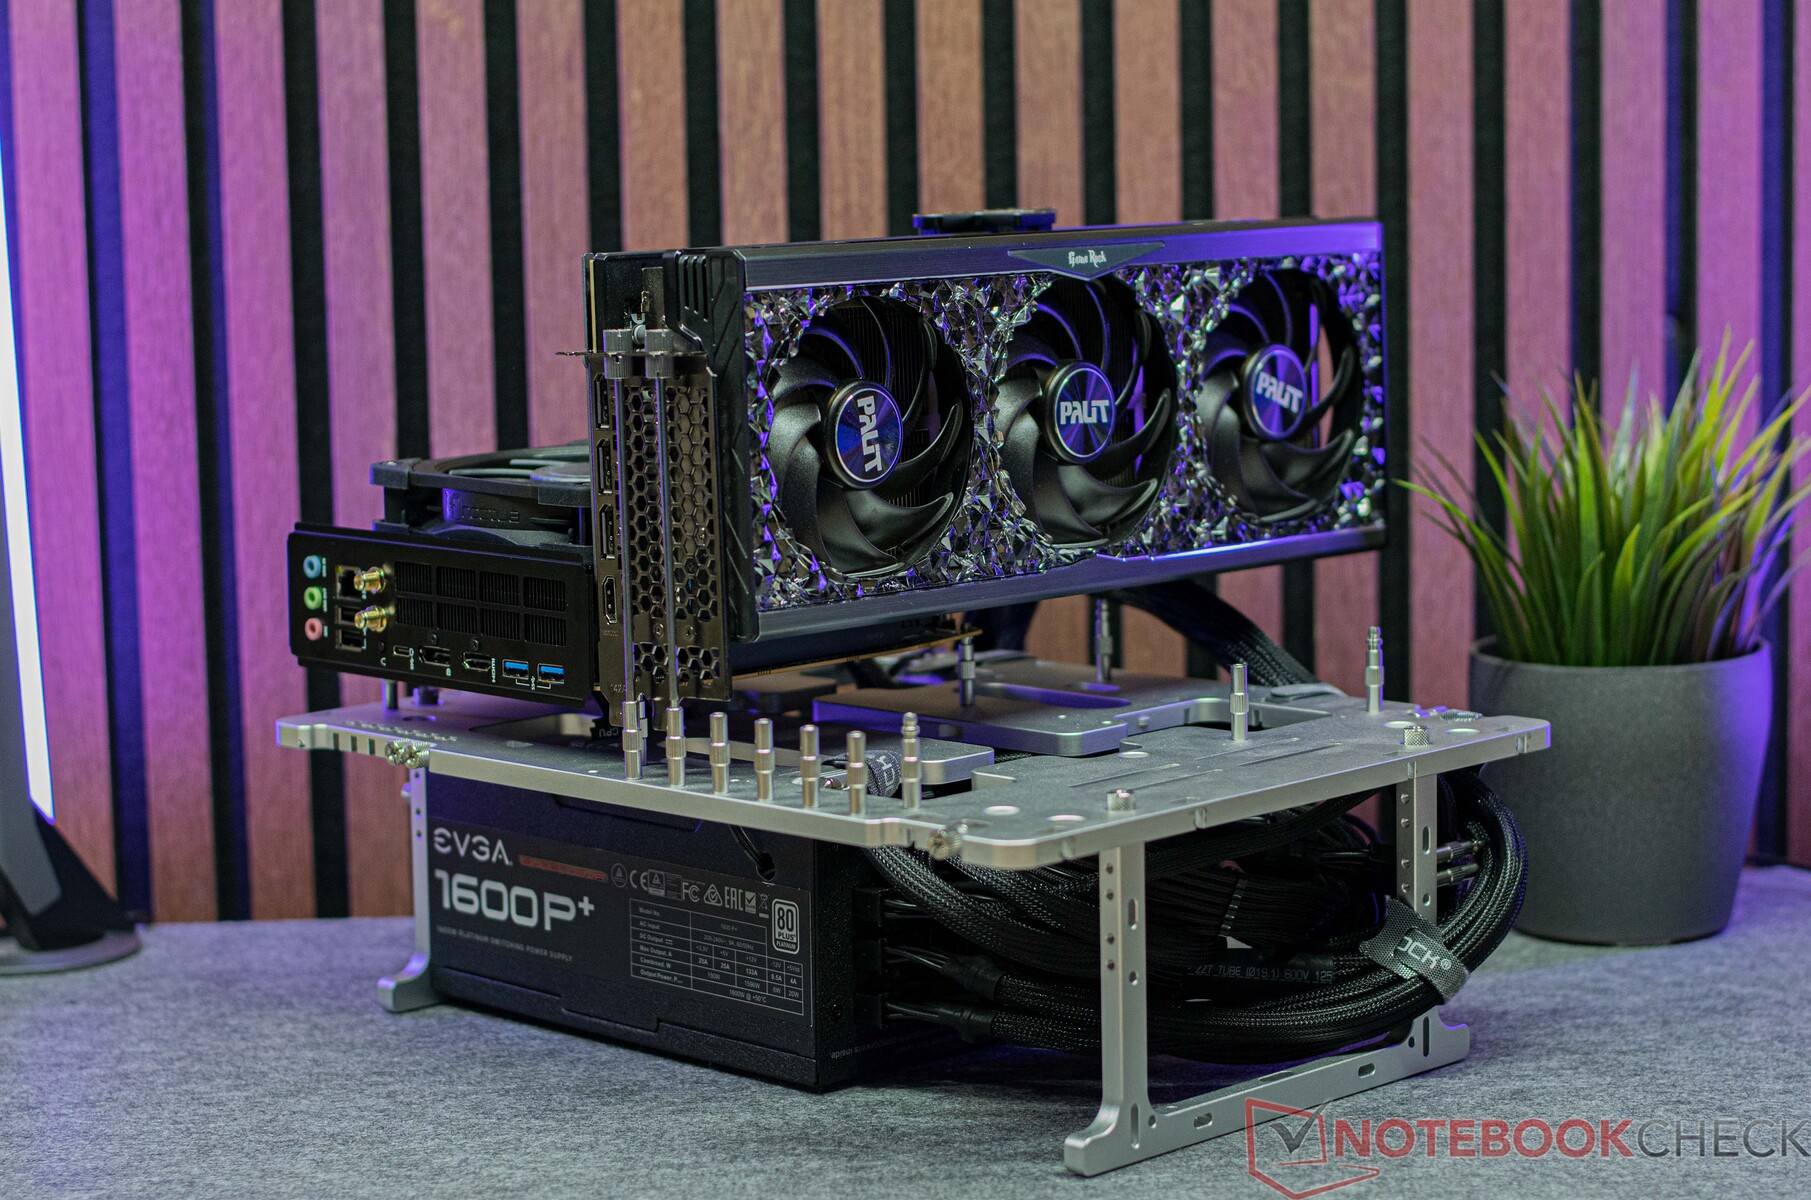
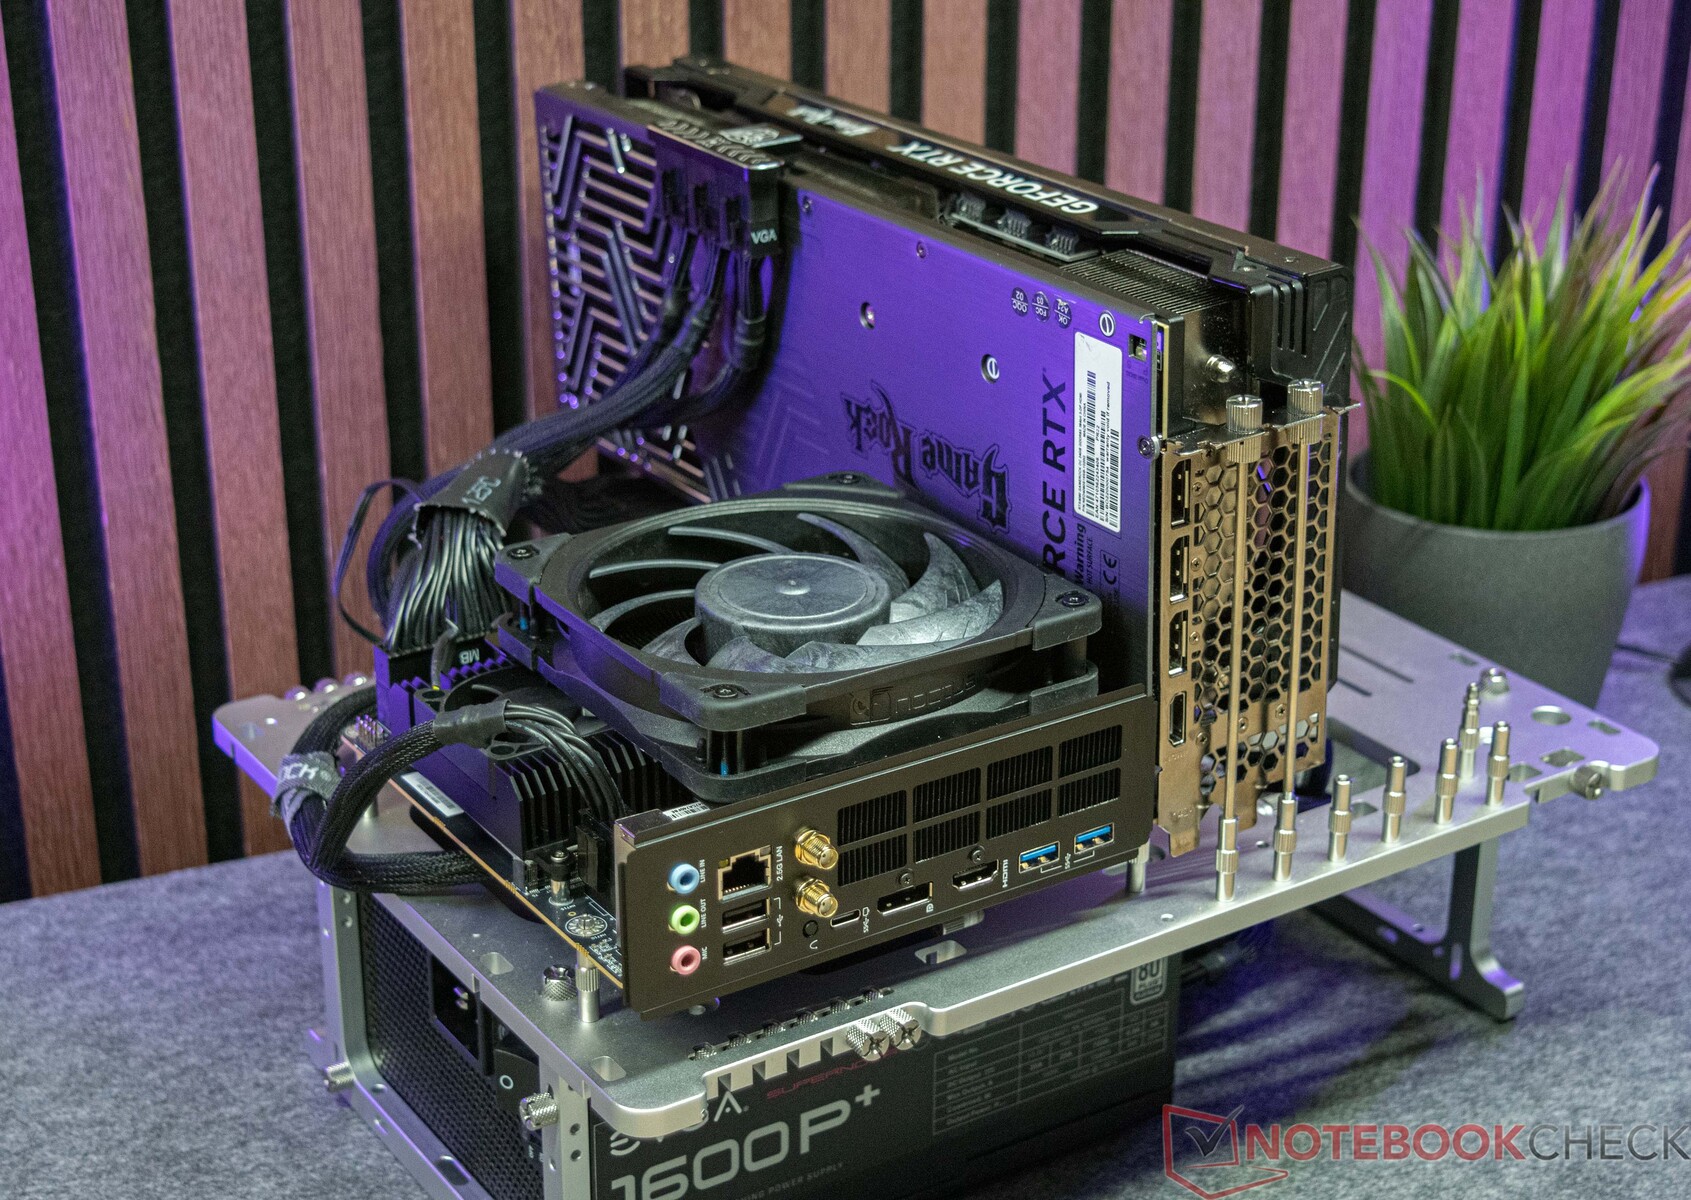
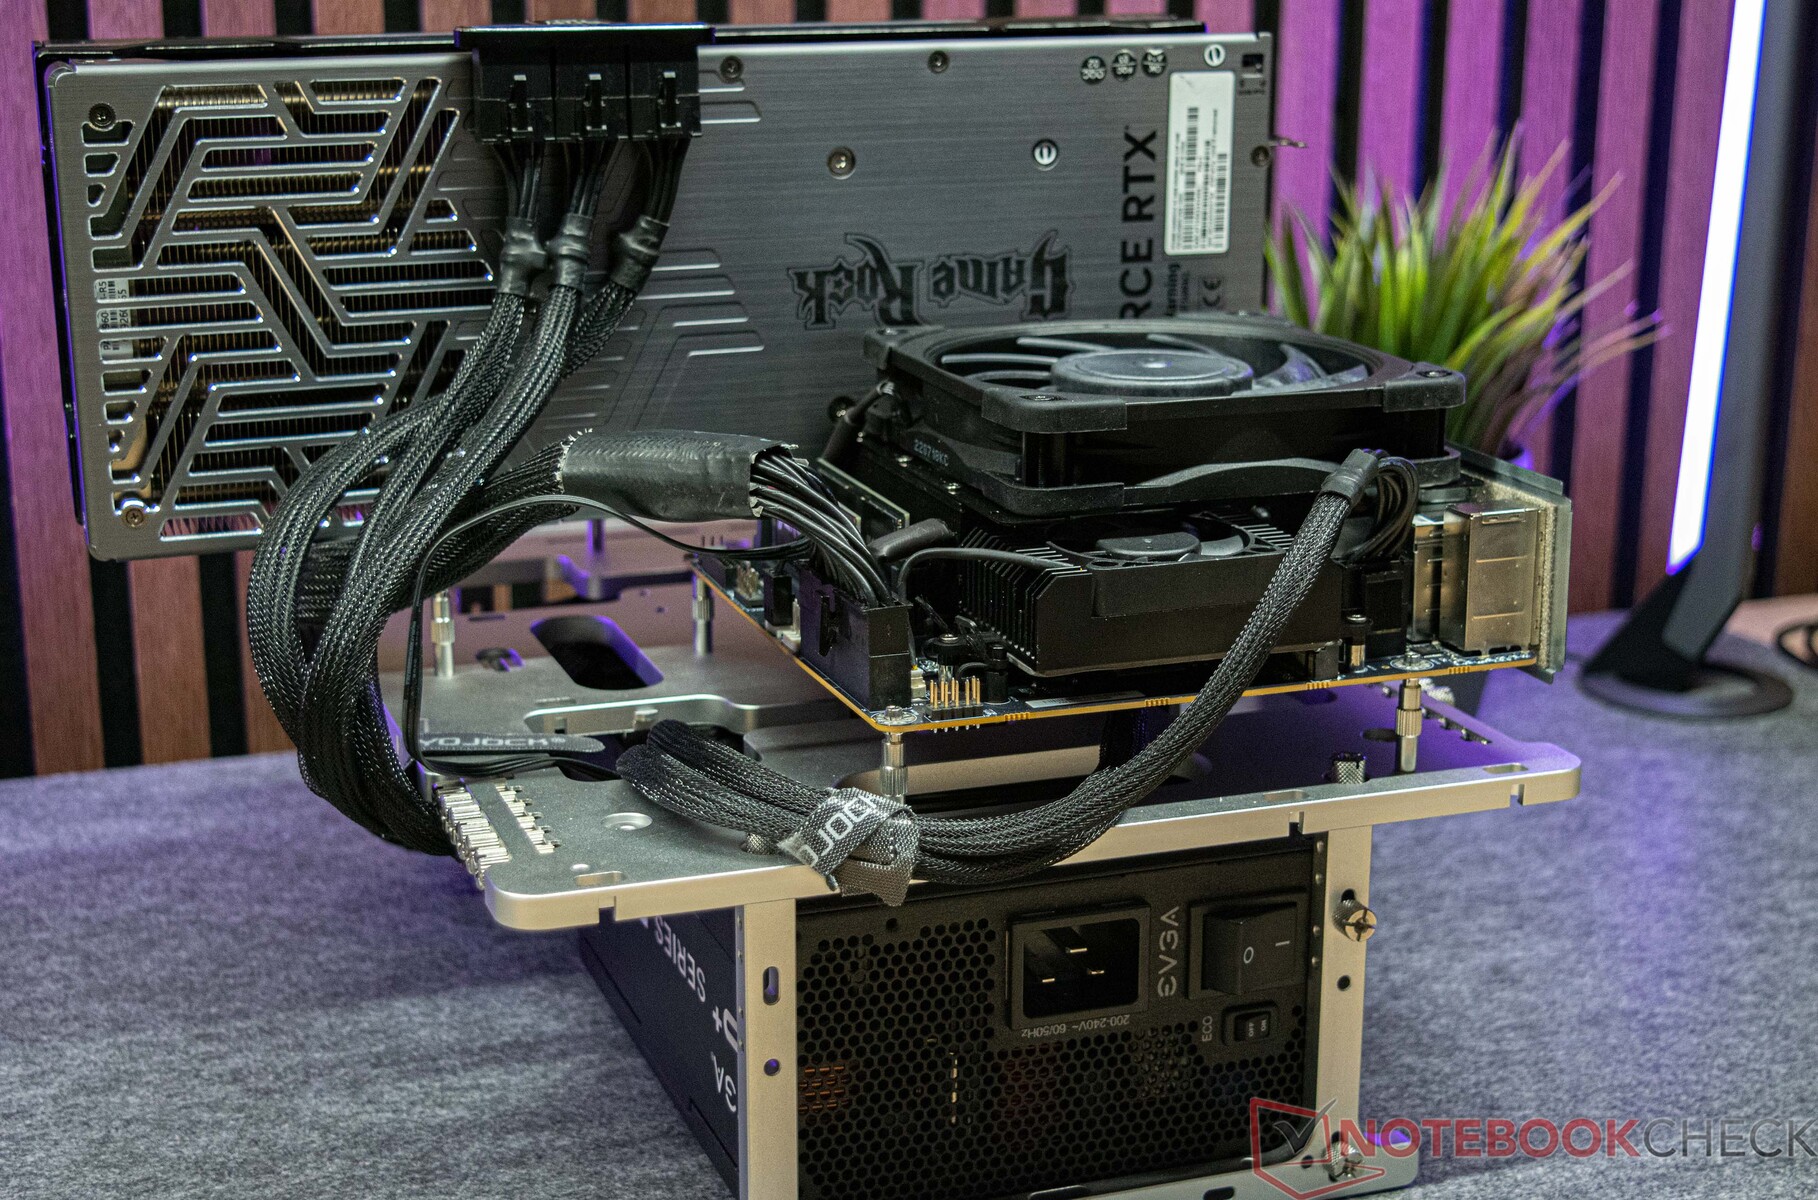
此外,在涉及专用显卡的性能比较中,我们将 Minisforum BD770i 与 PalitGeForce RTX 4090 GameRock OC在开放式设置中进行评估。显卡的尺寸使其无法安装在 Phanteks Enthoo Evolv Shift XT 中。该机箱可容纳长度不超过 32.4 厘米的显卡。
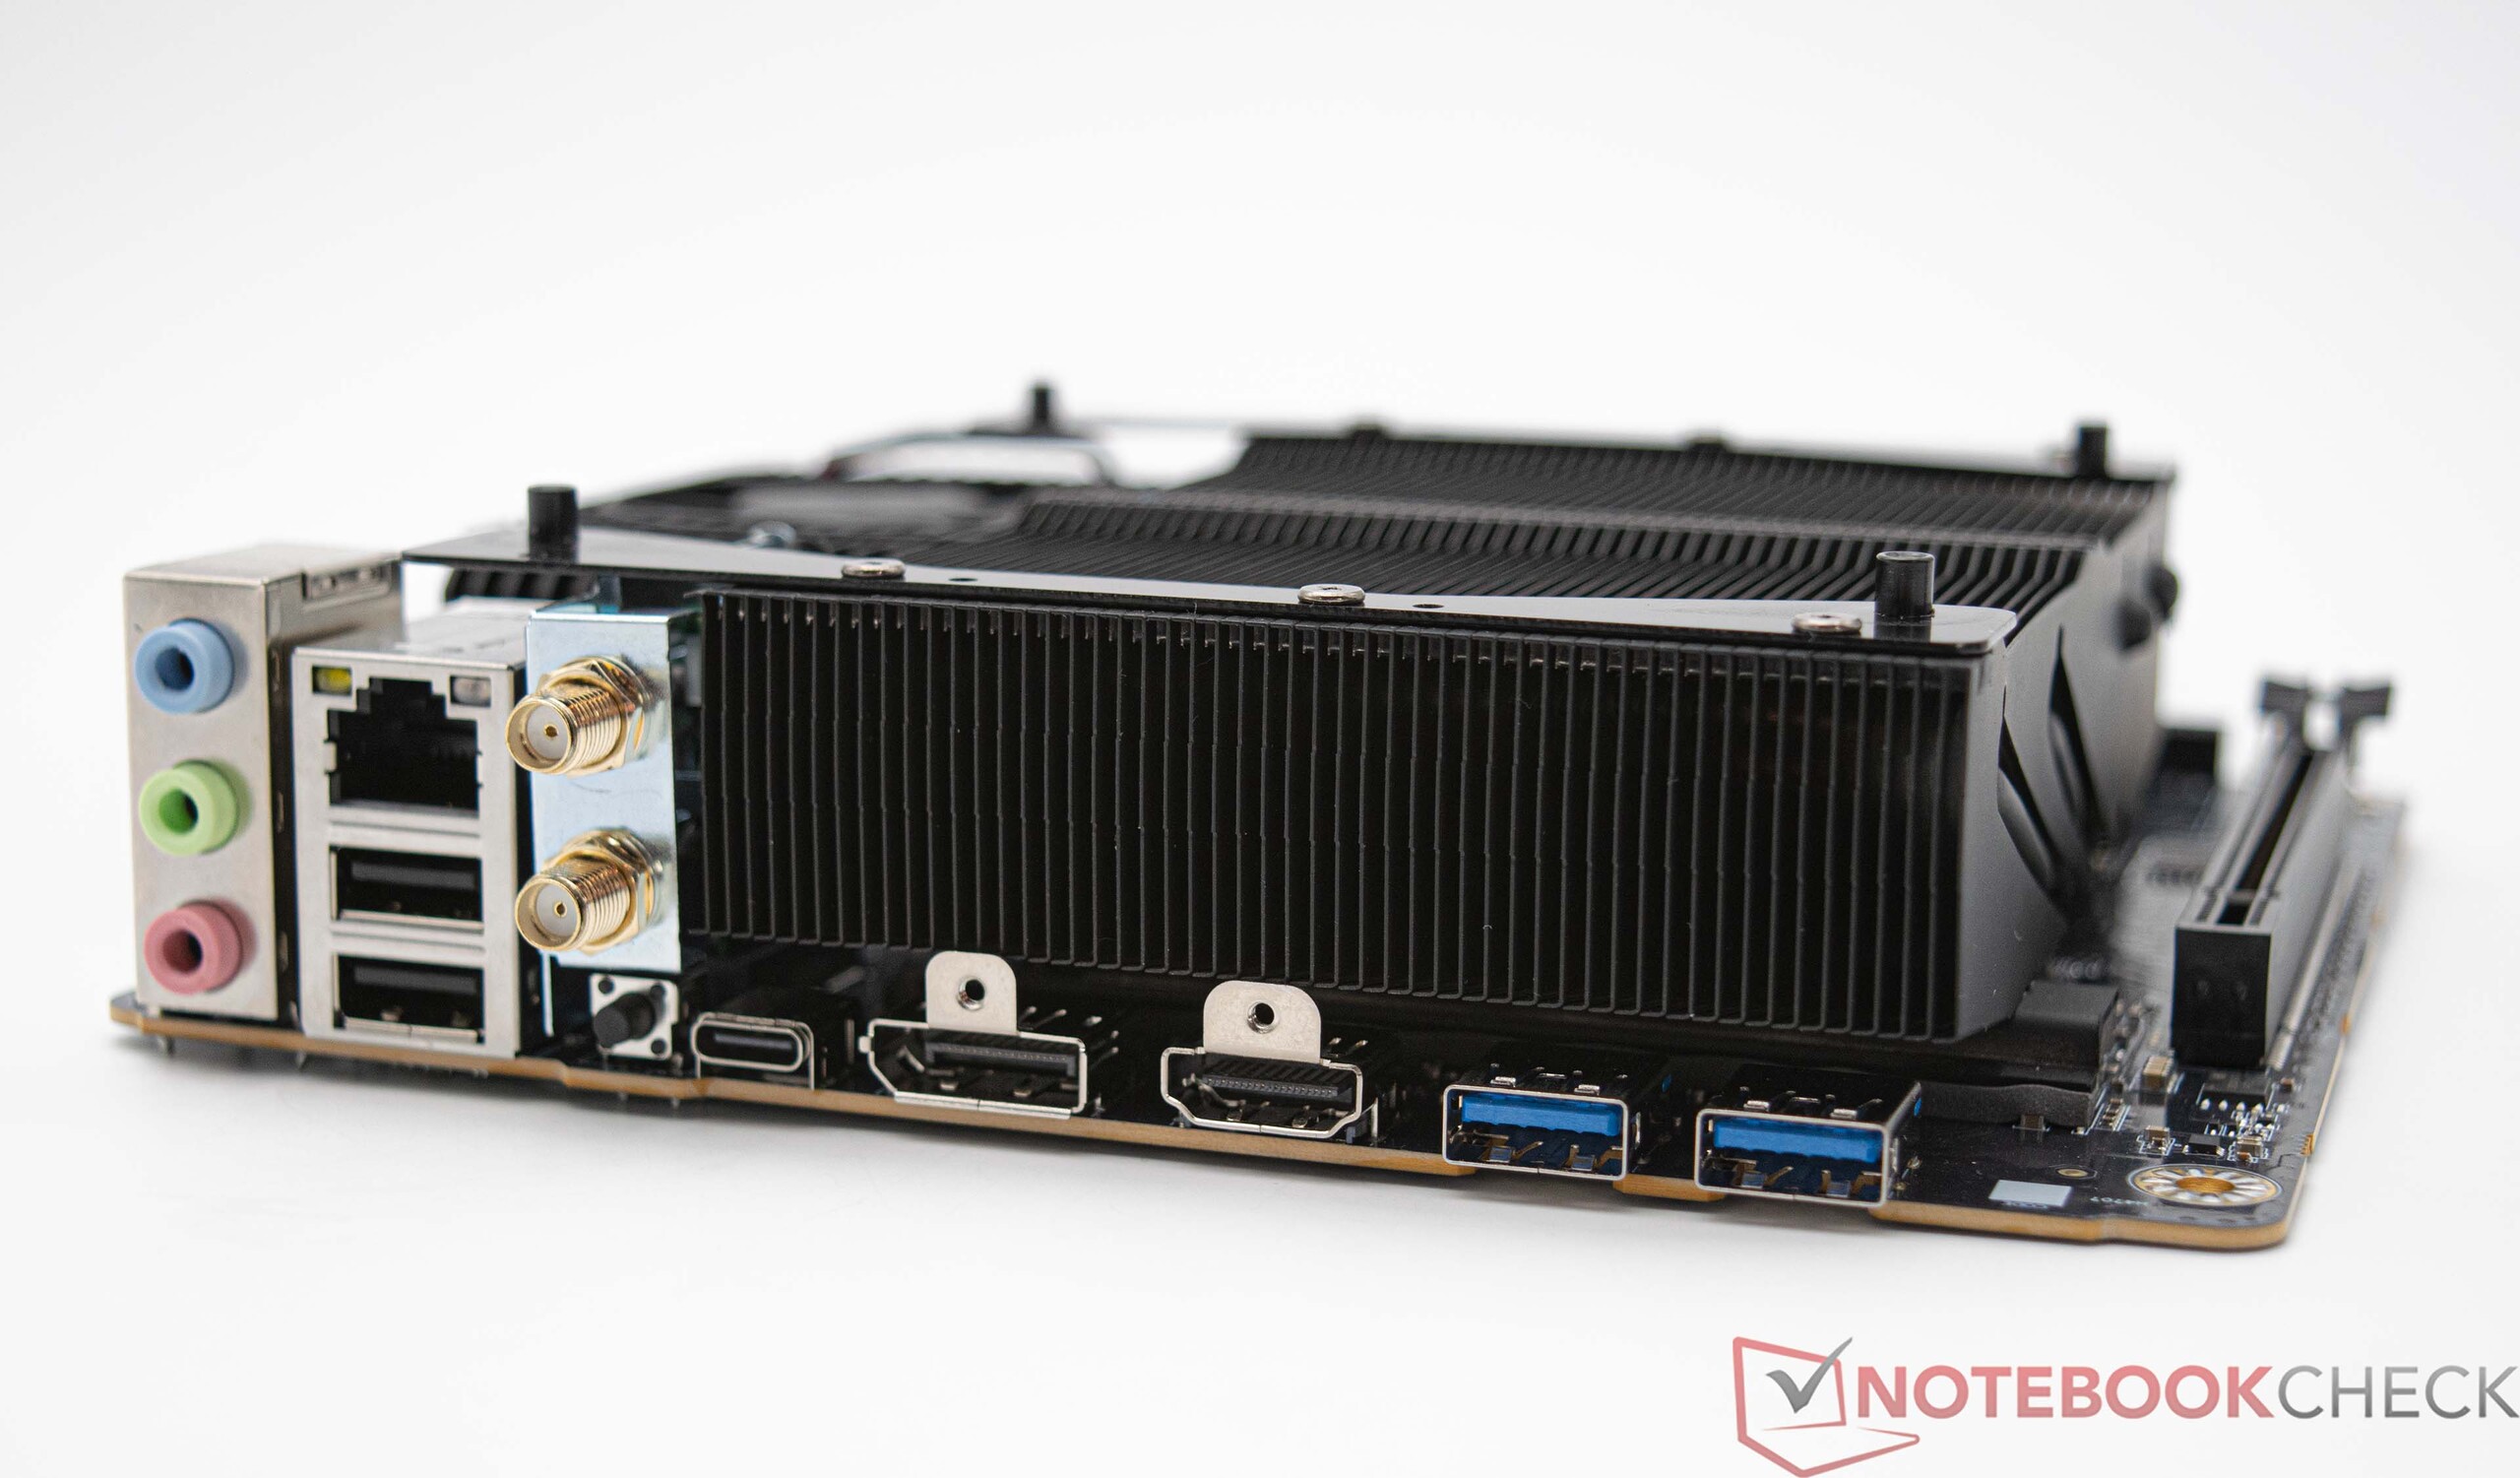
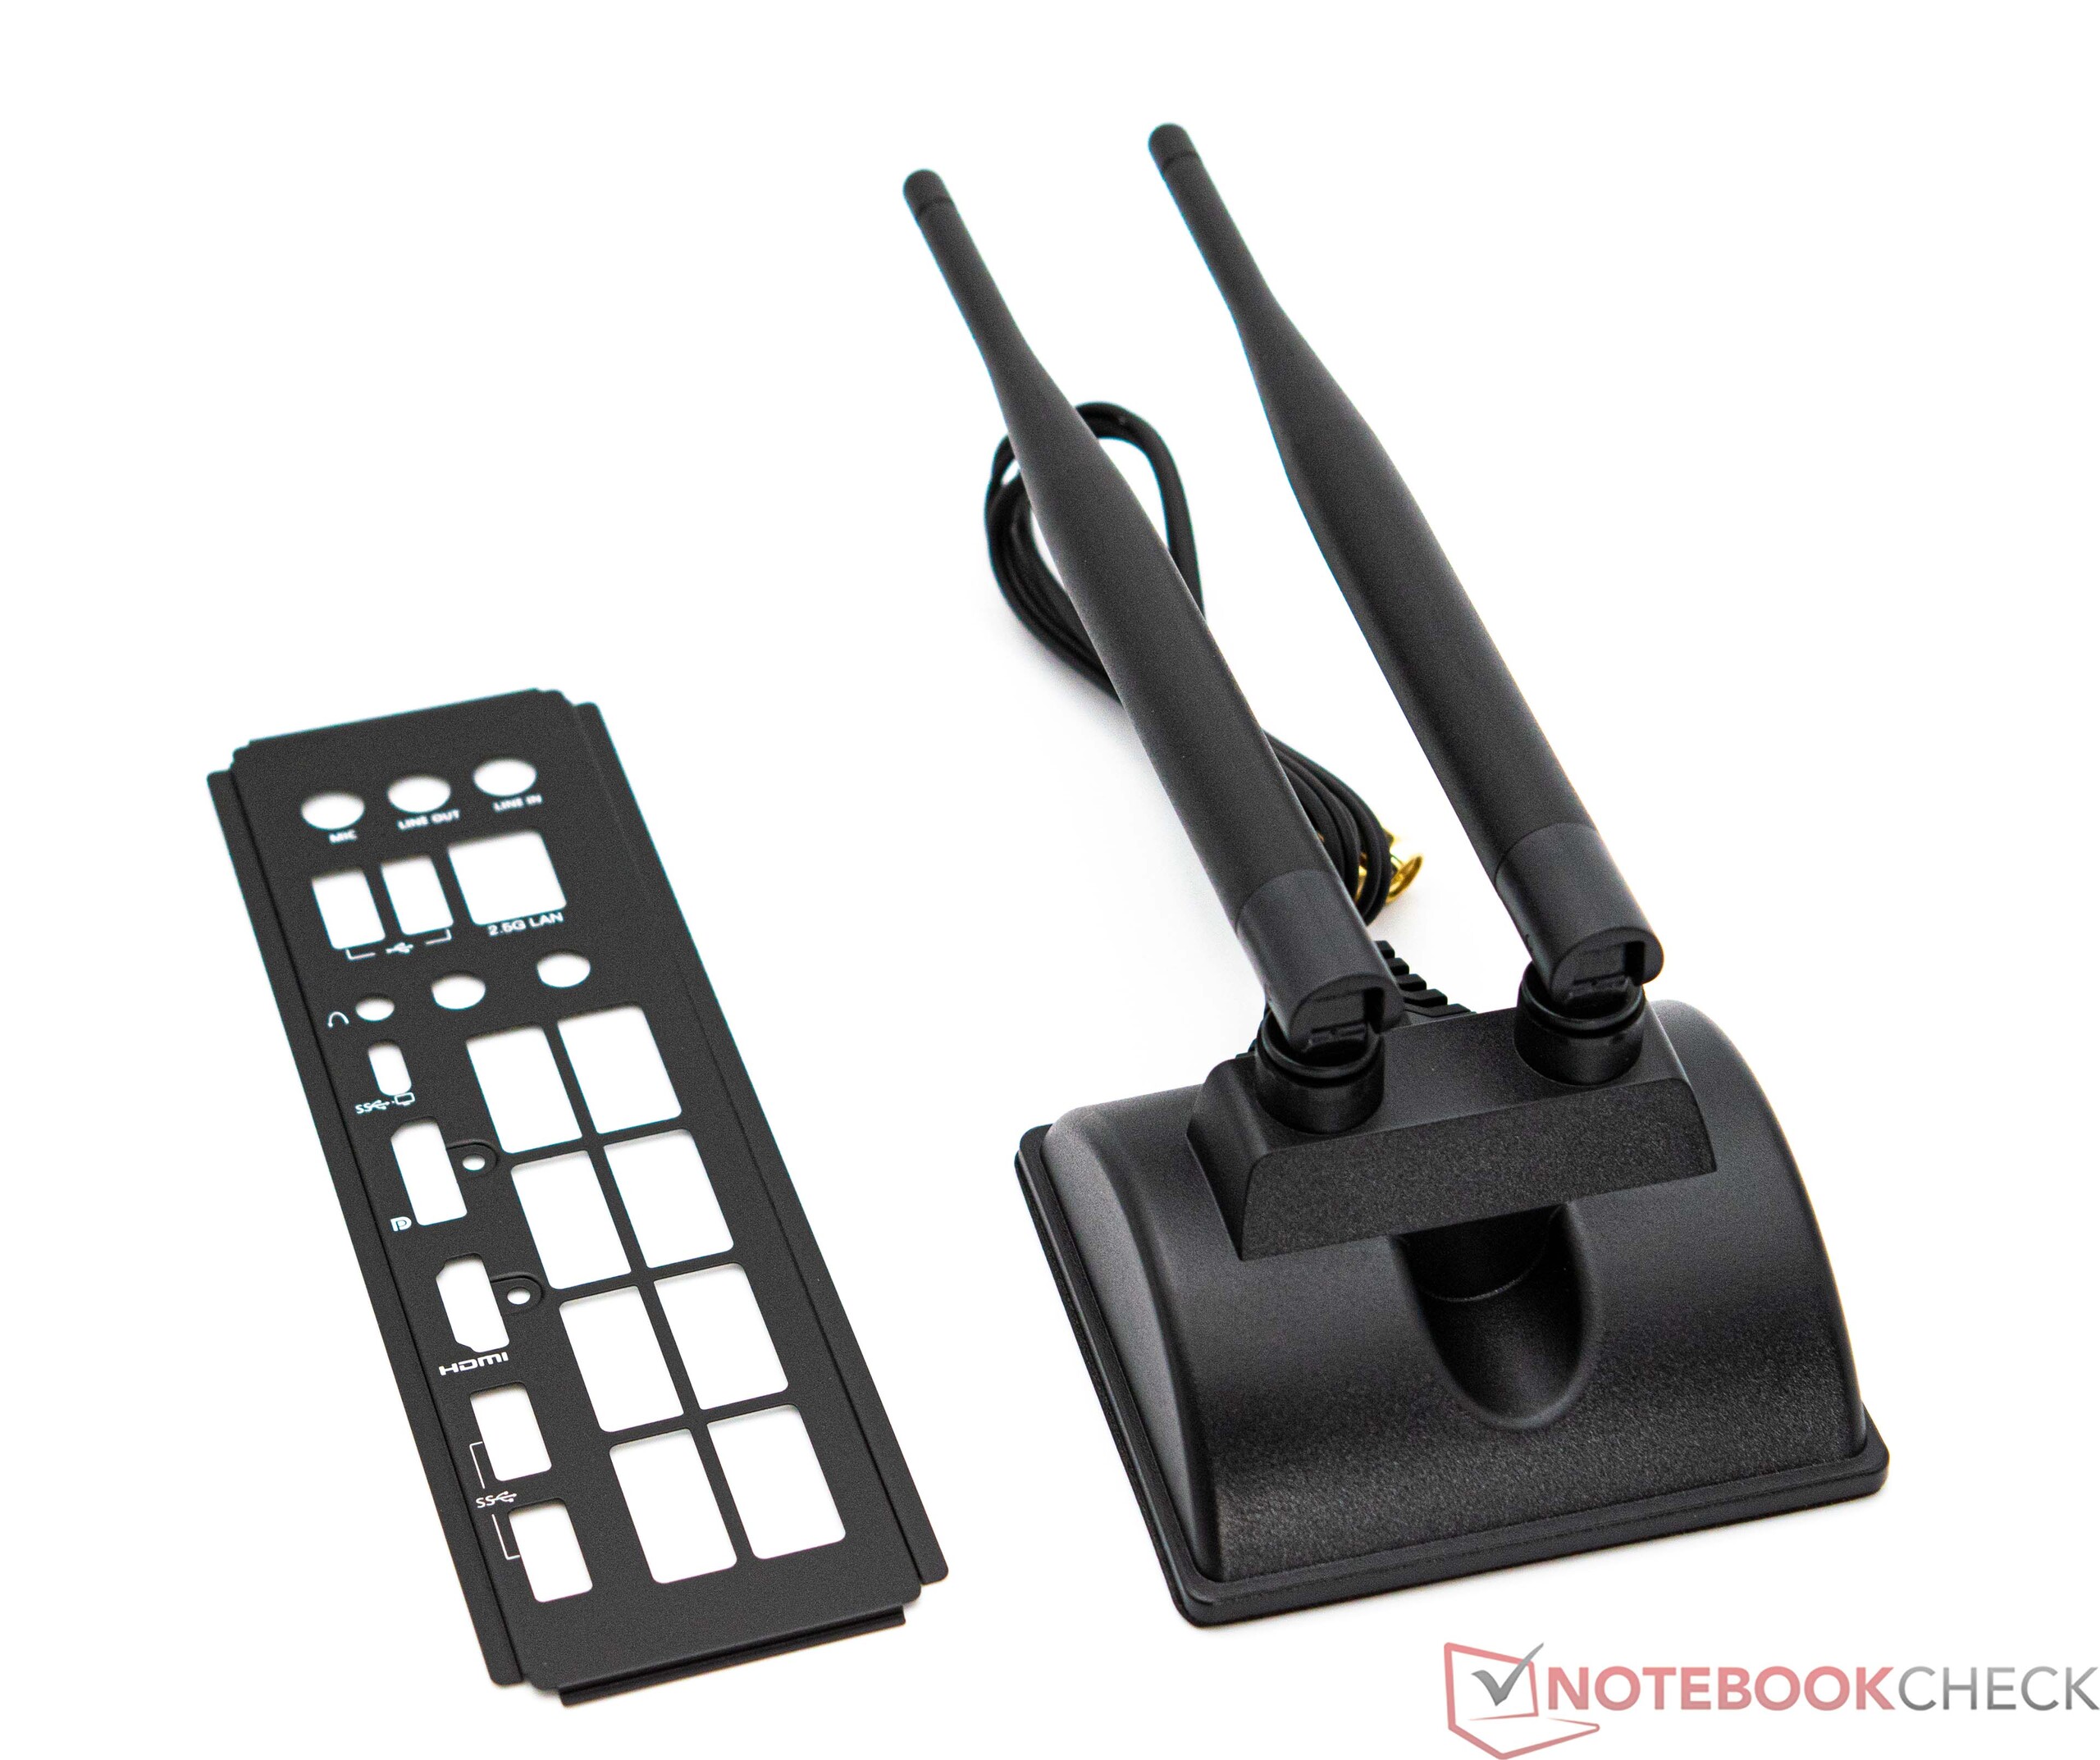
交付范围
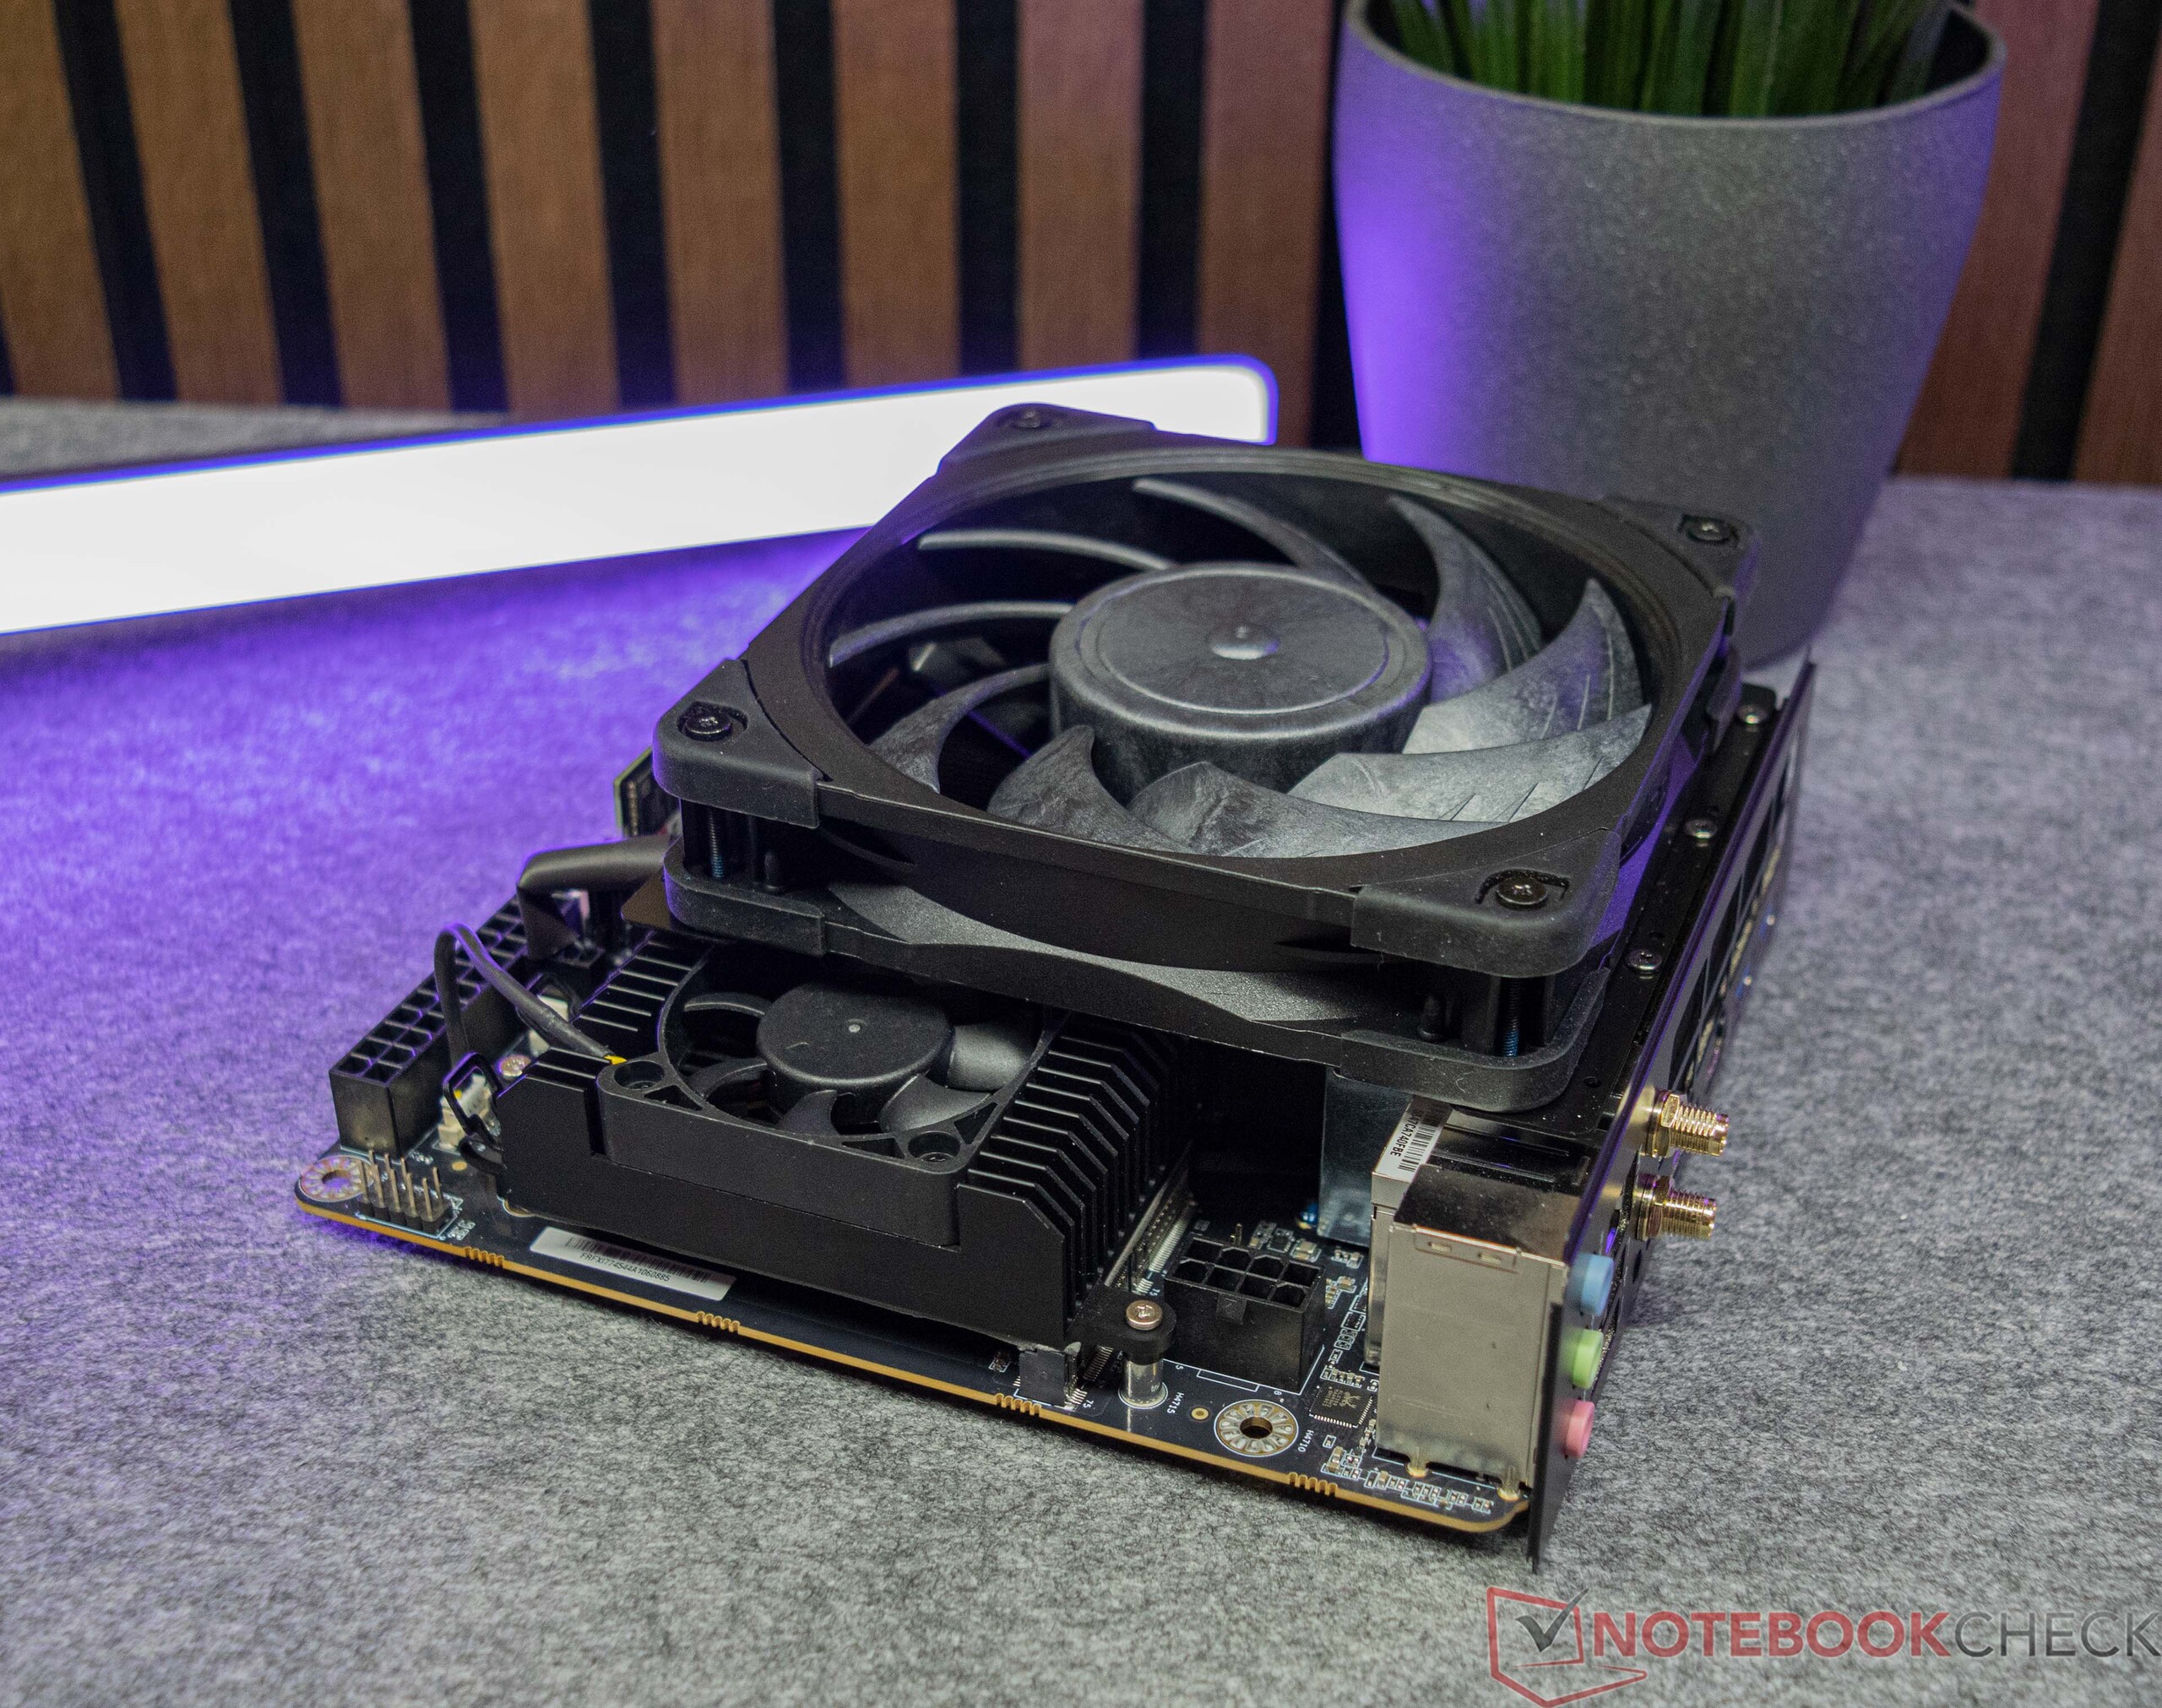
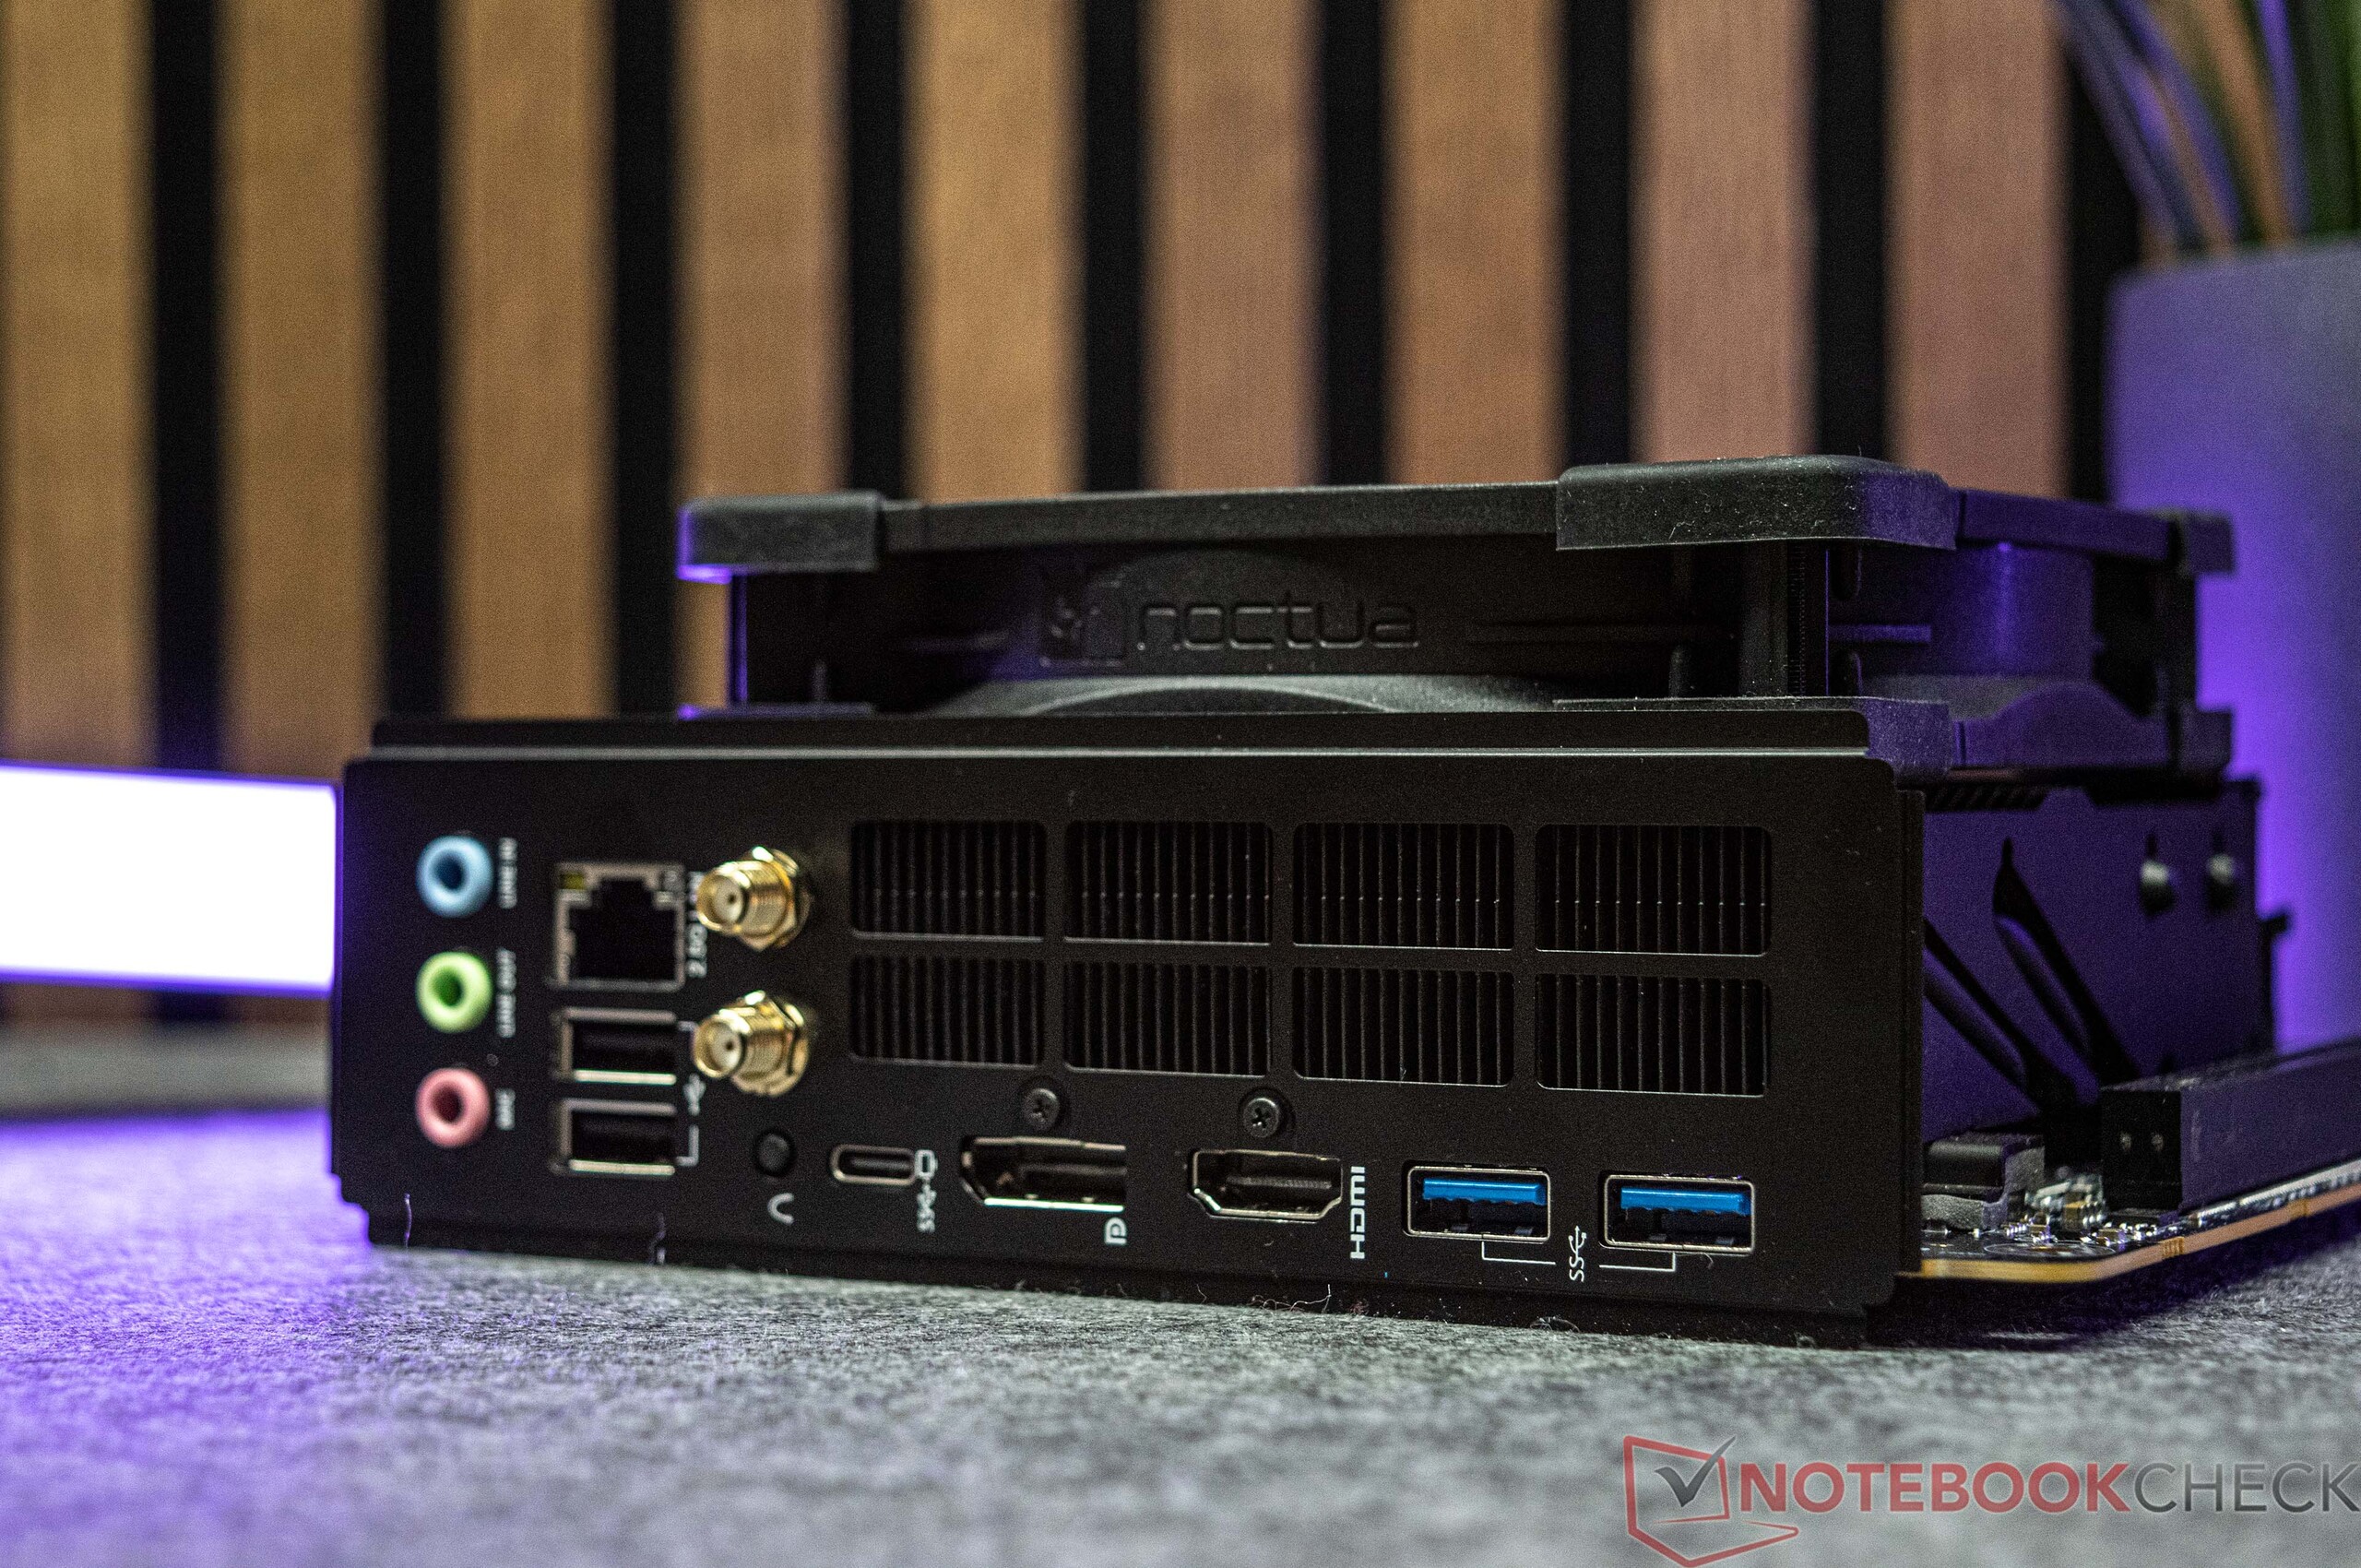
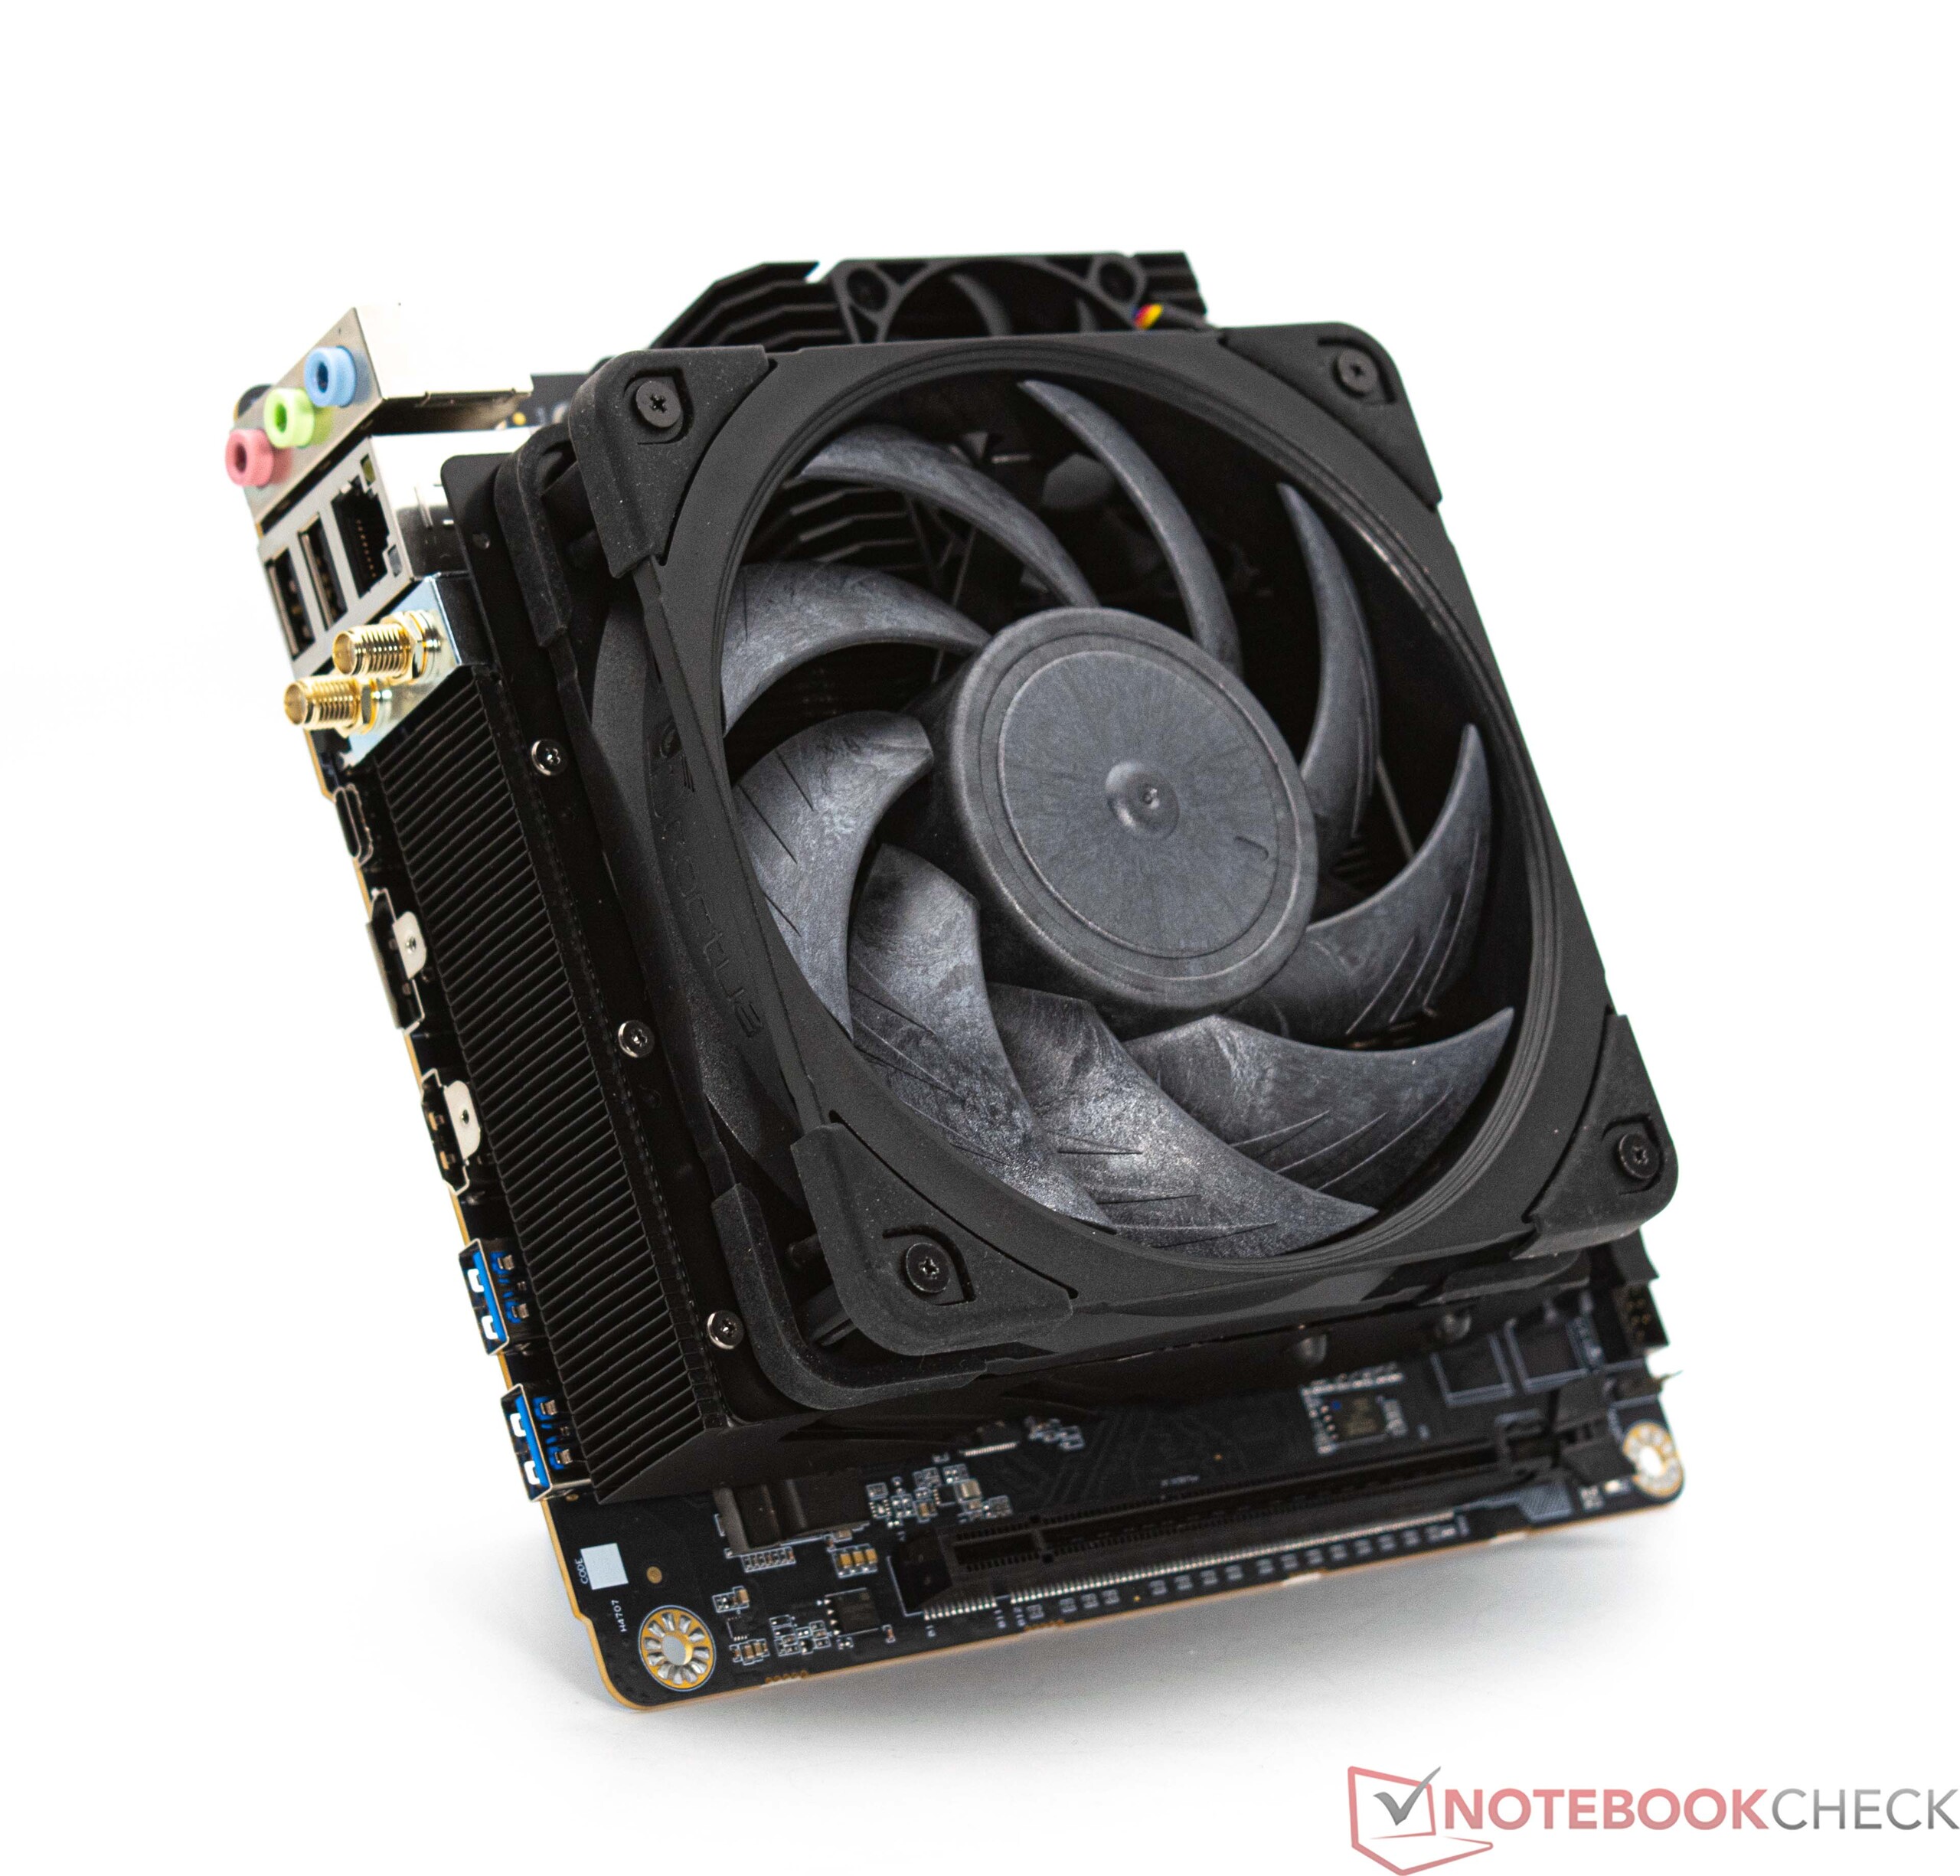
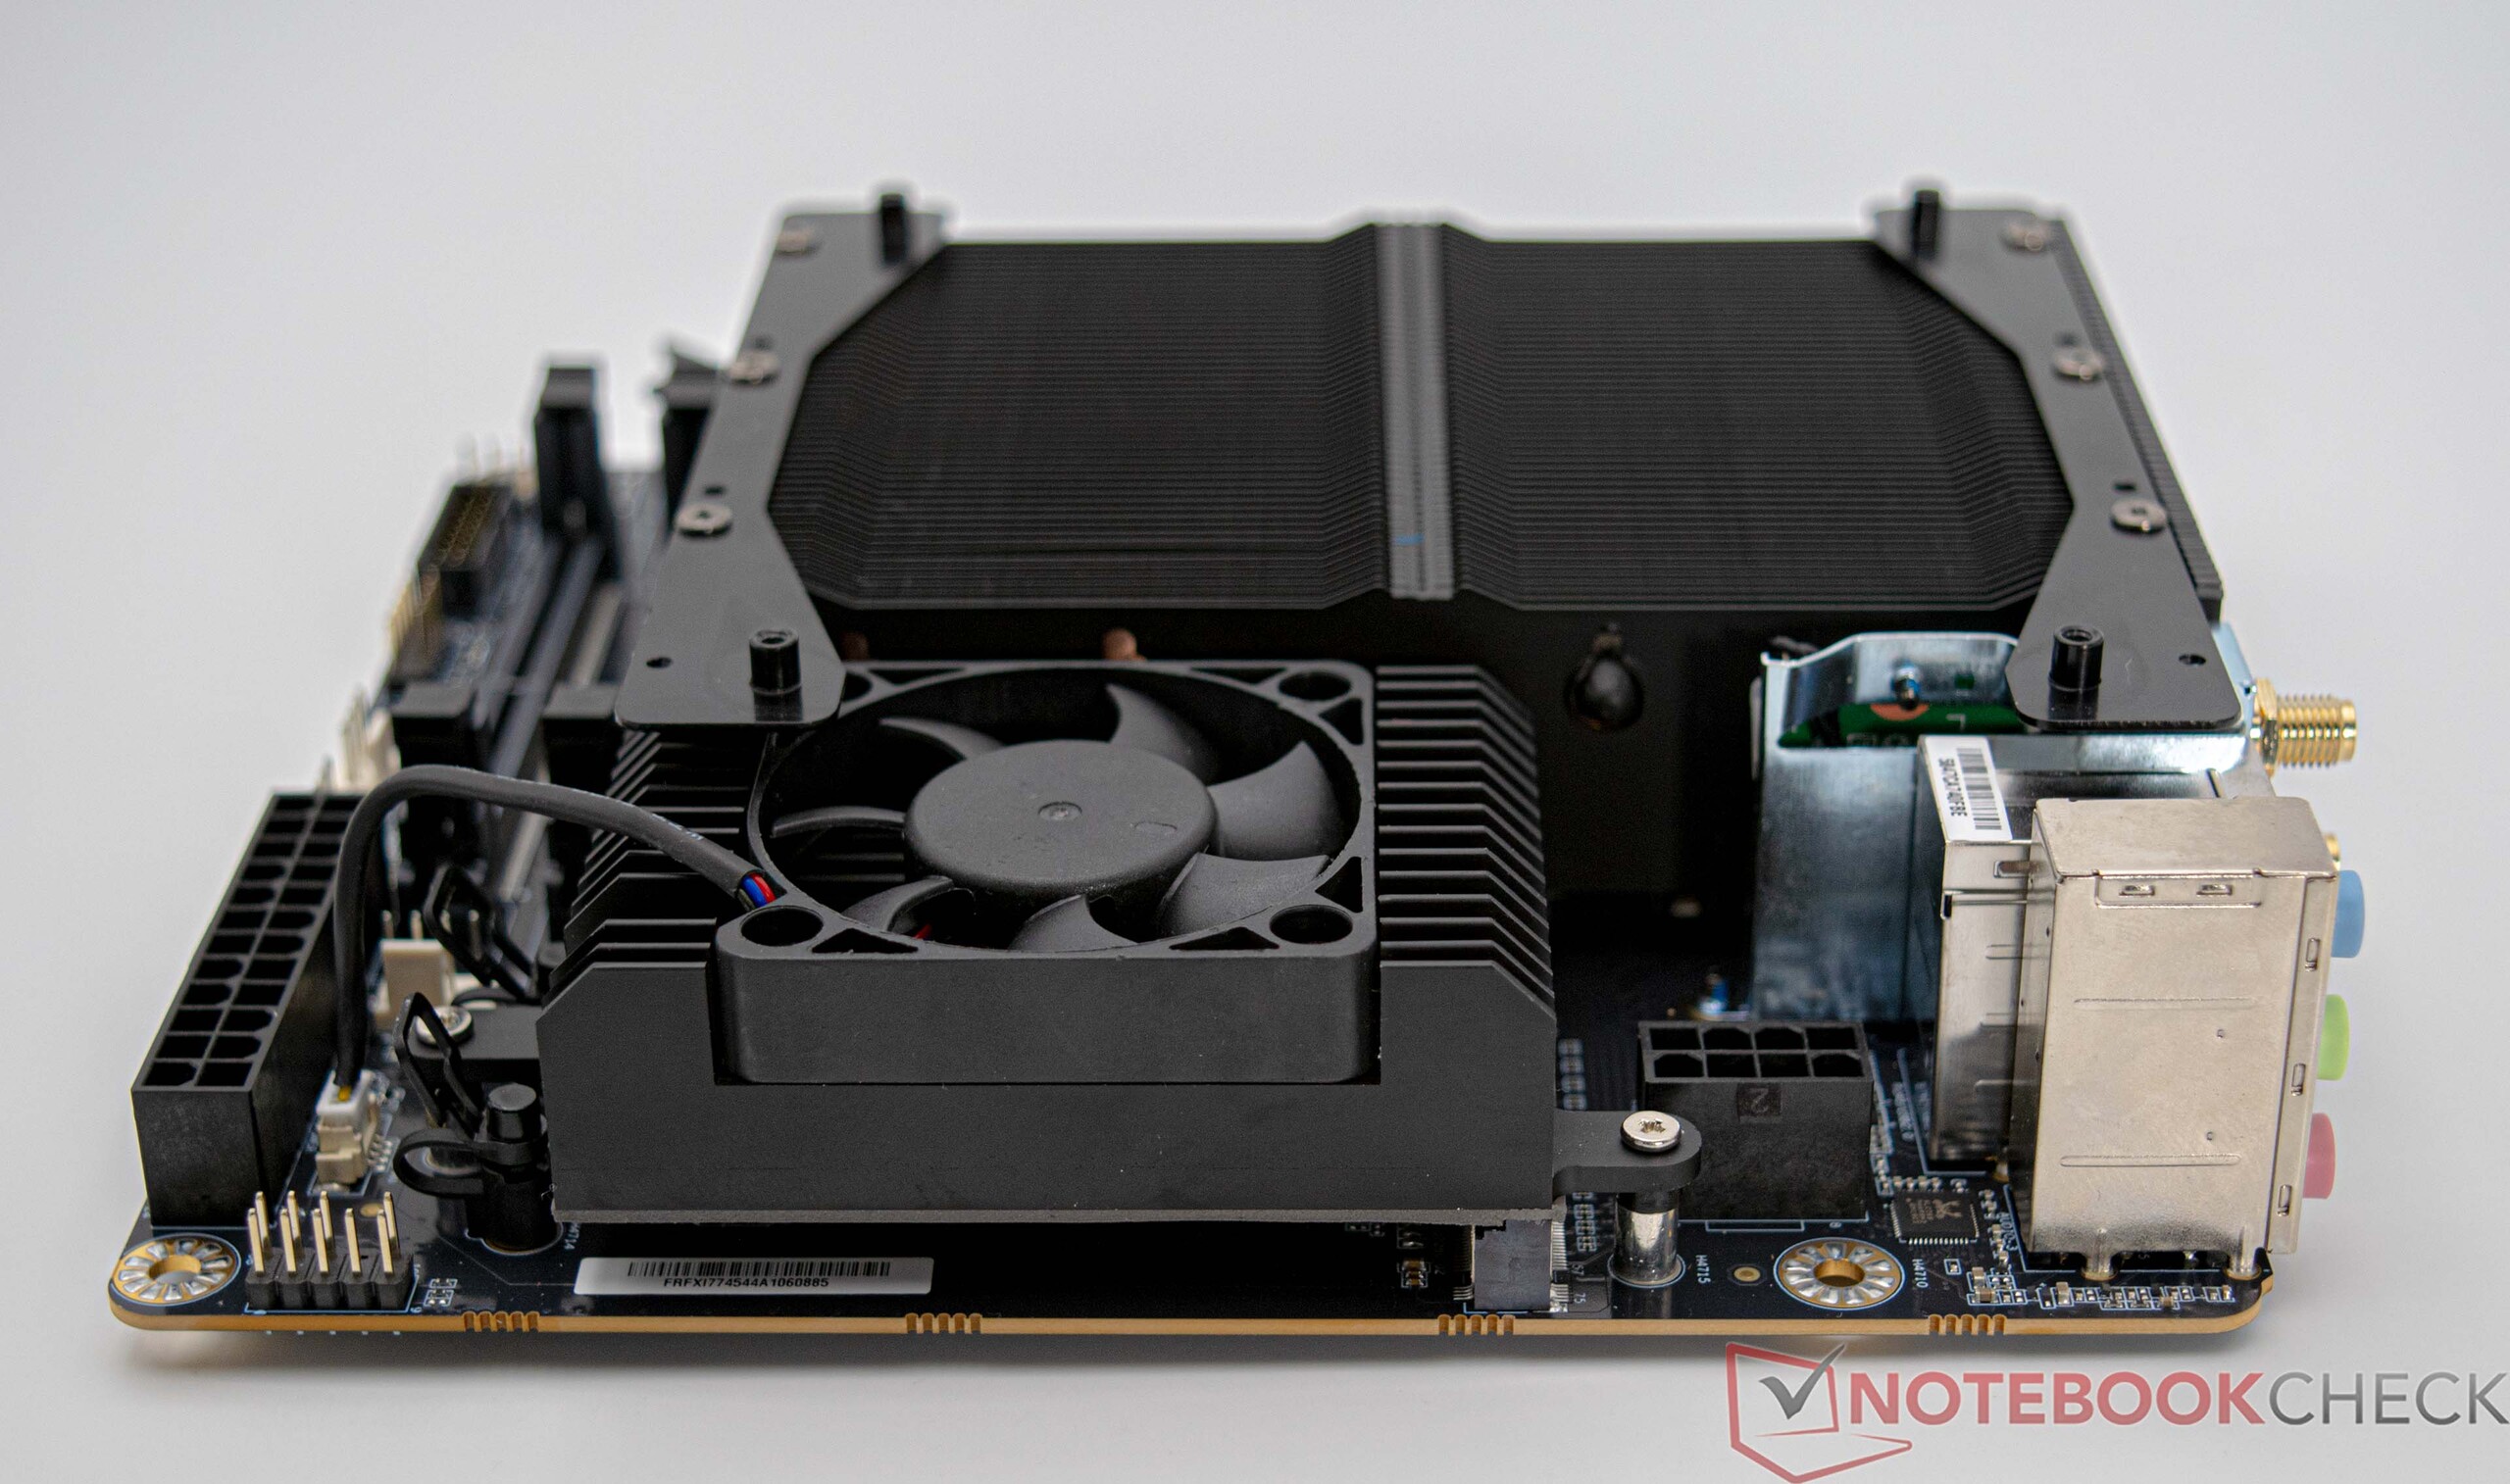
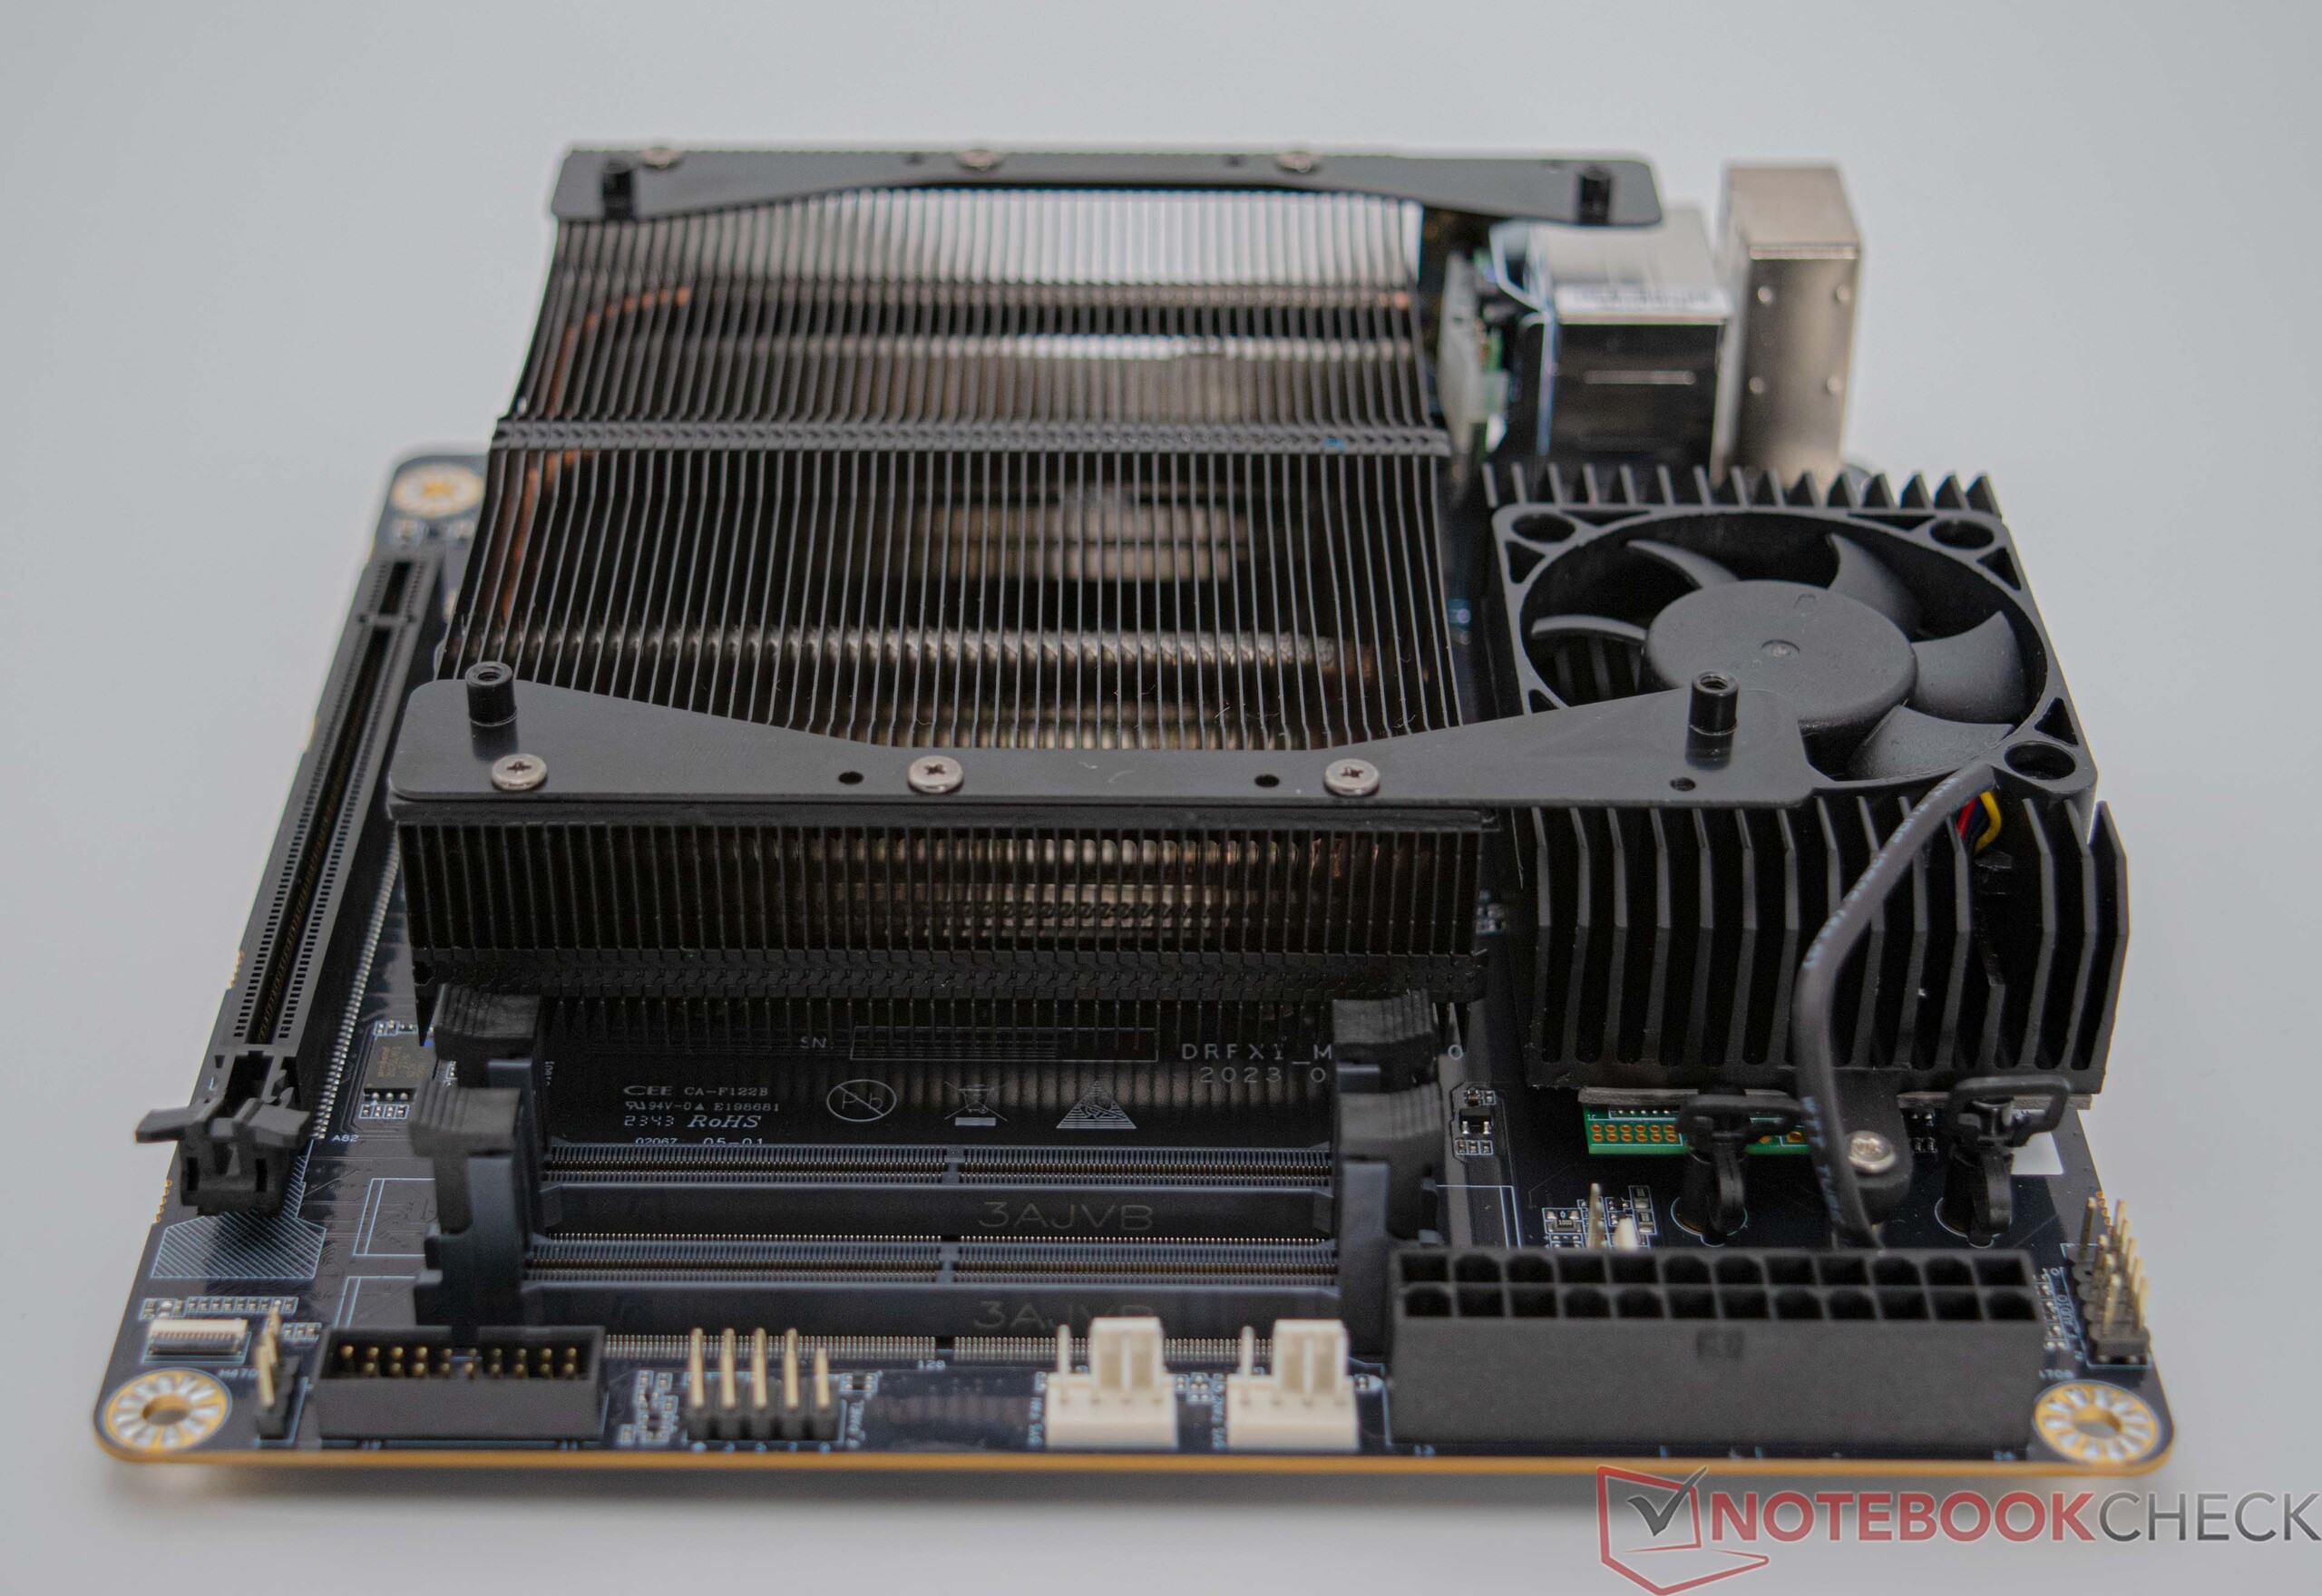
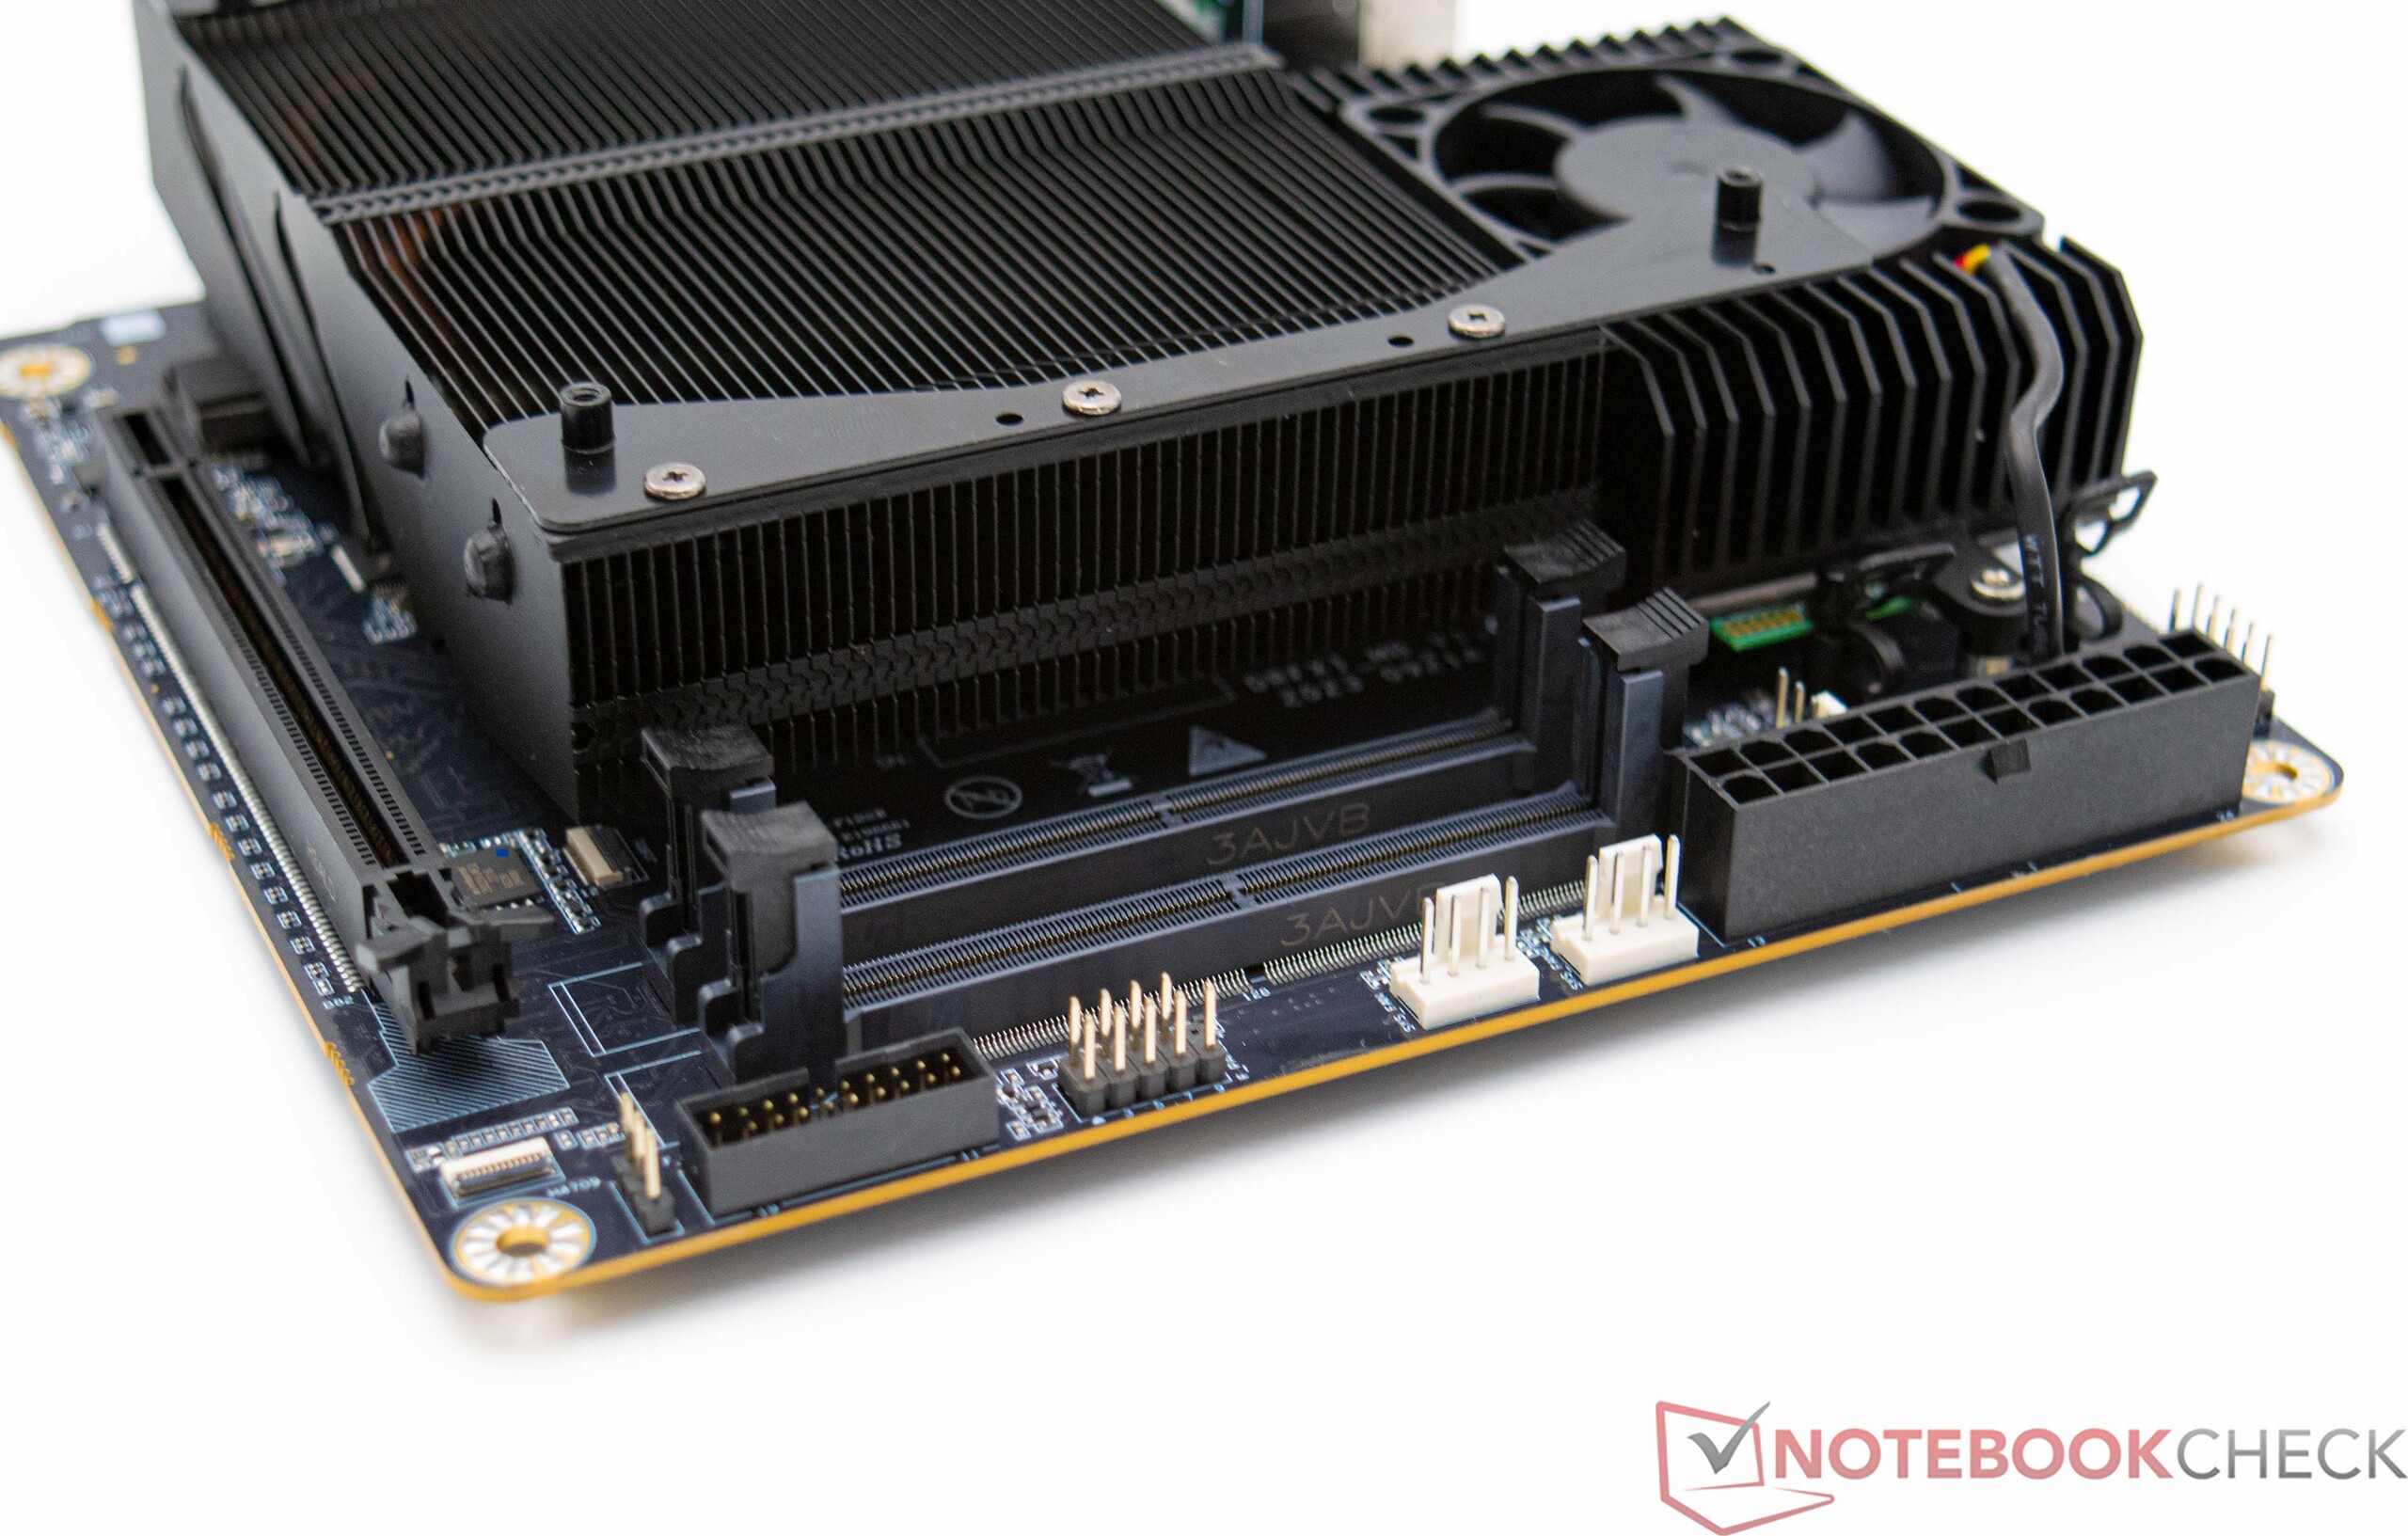
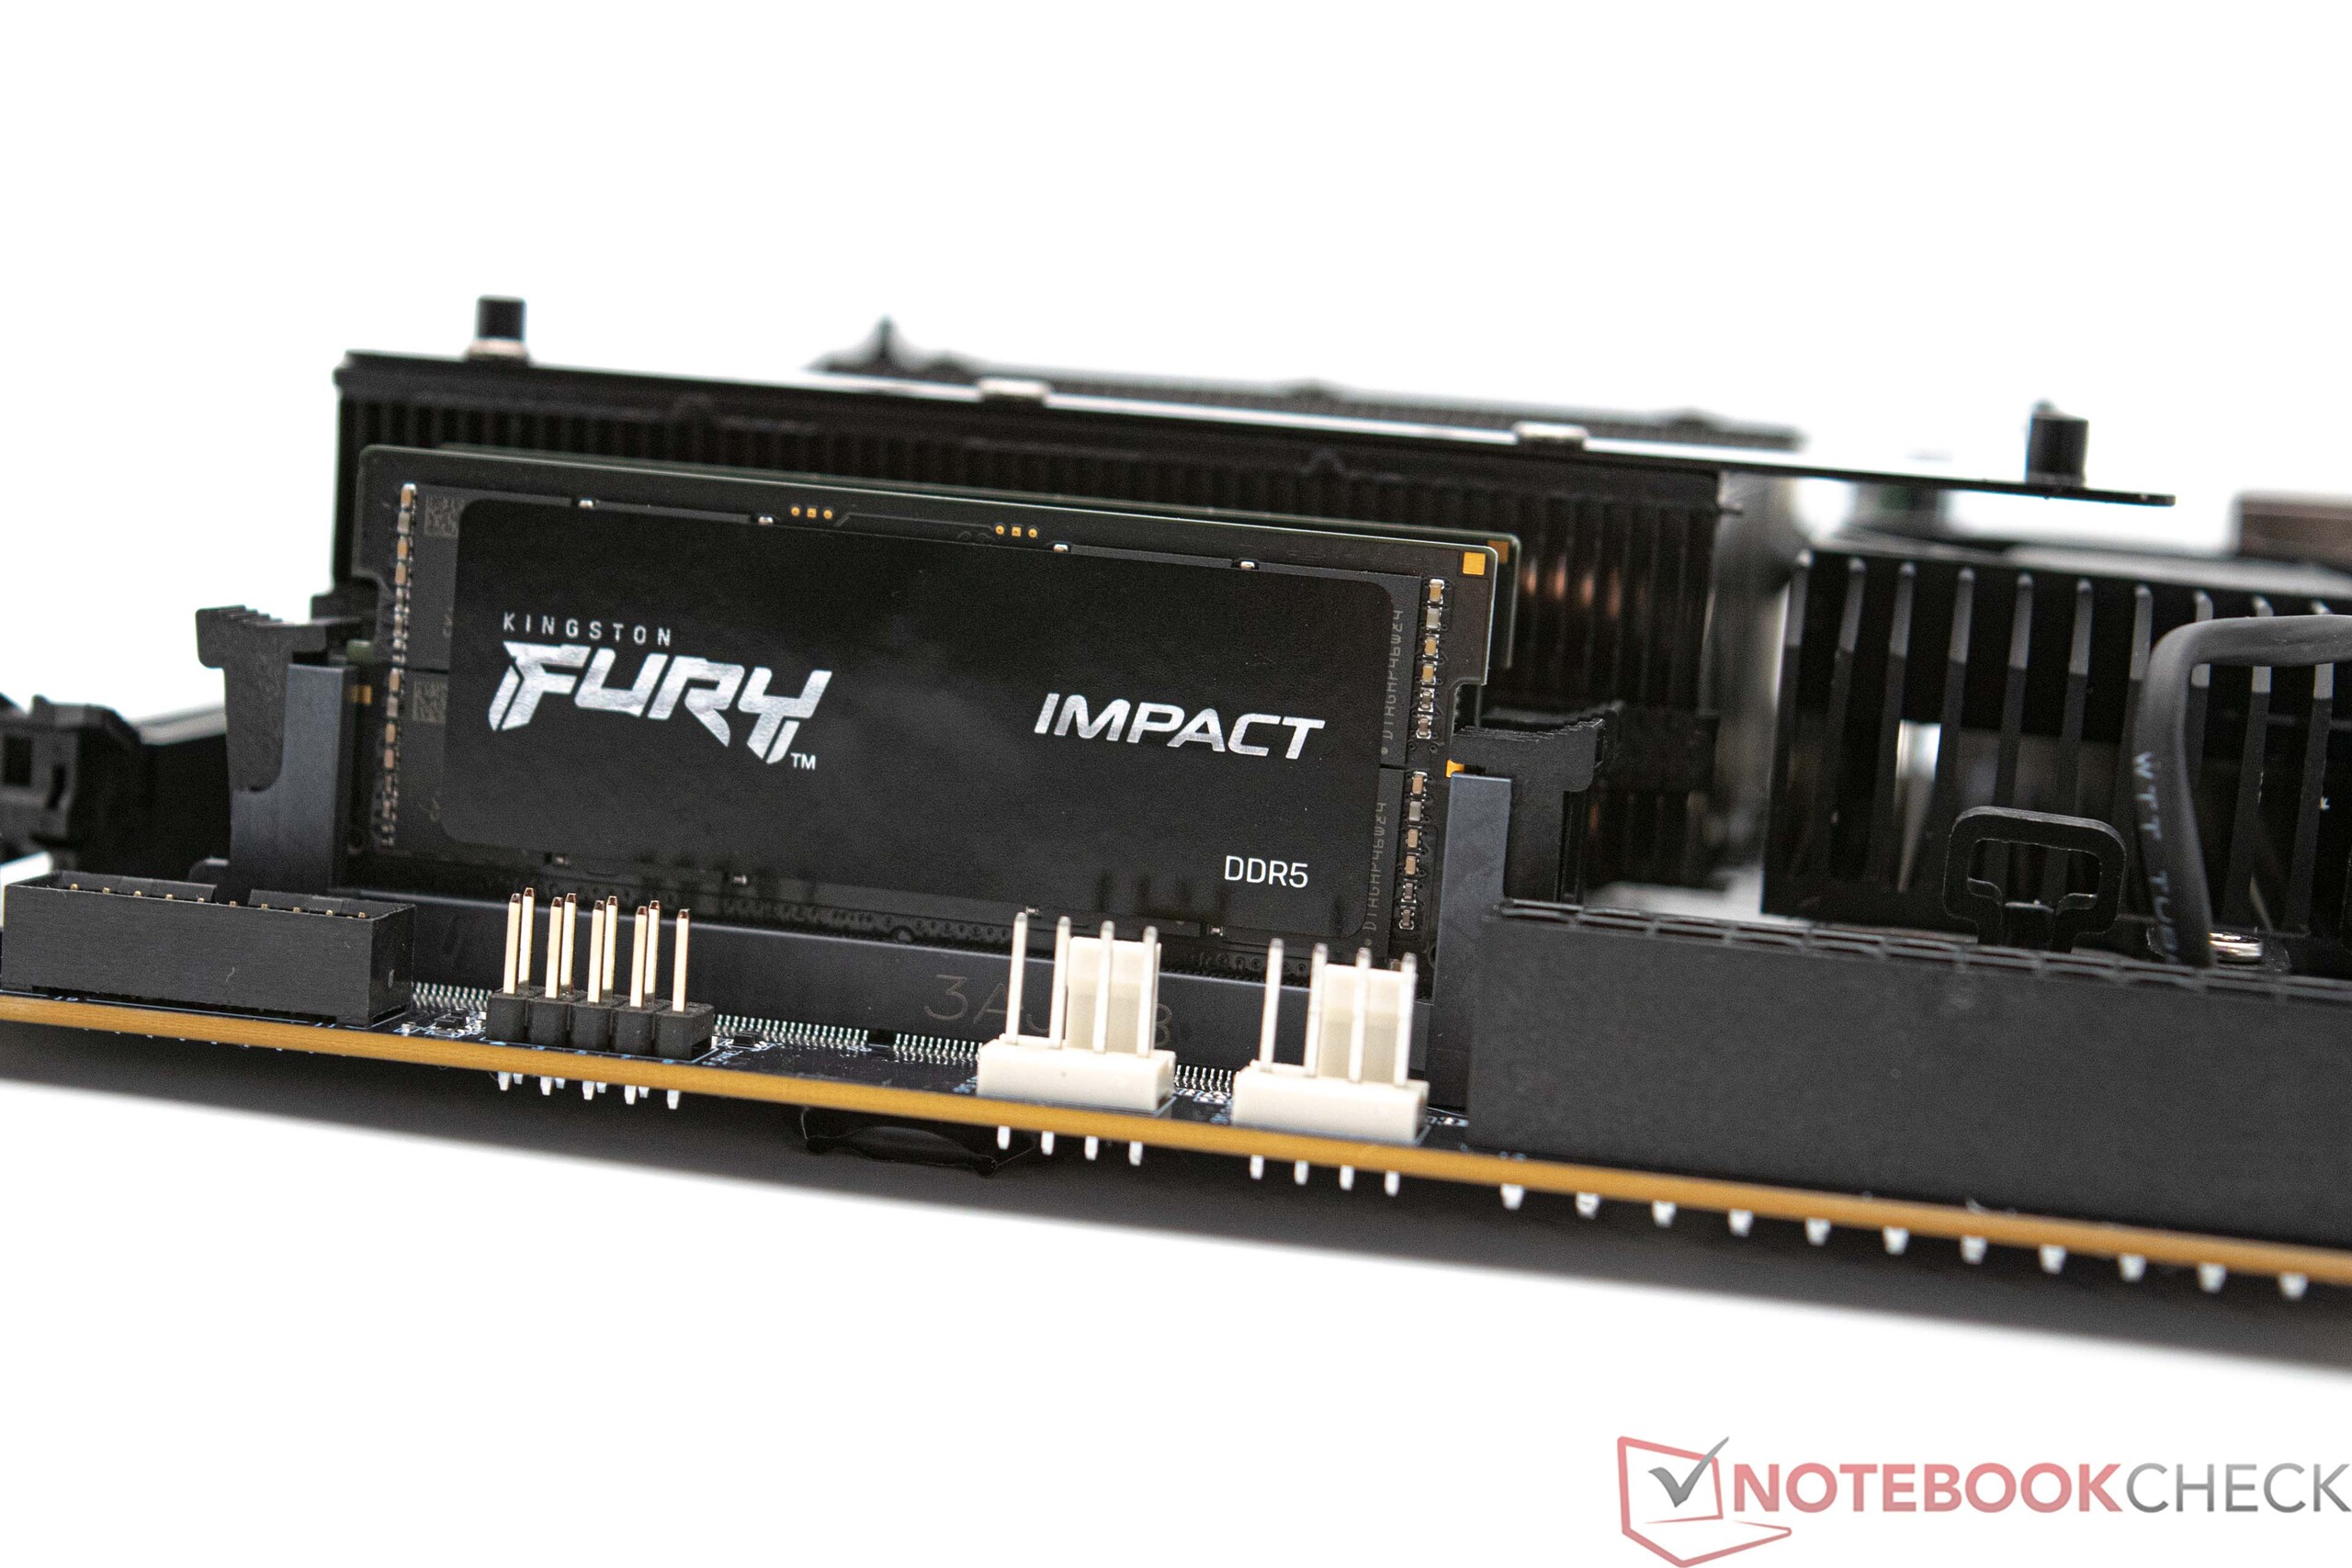
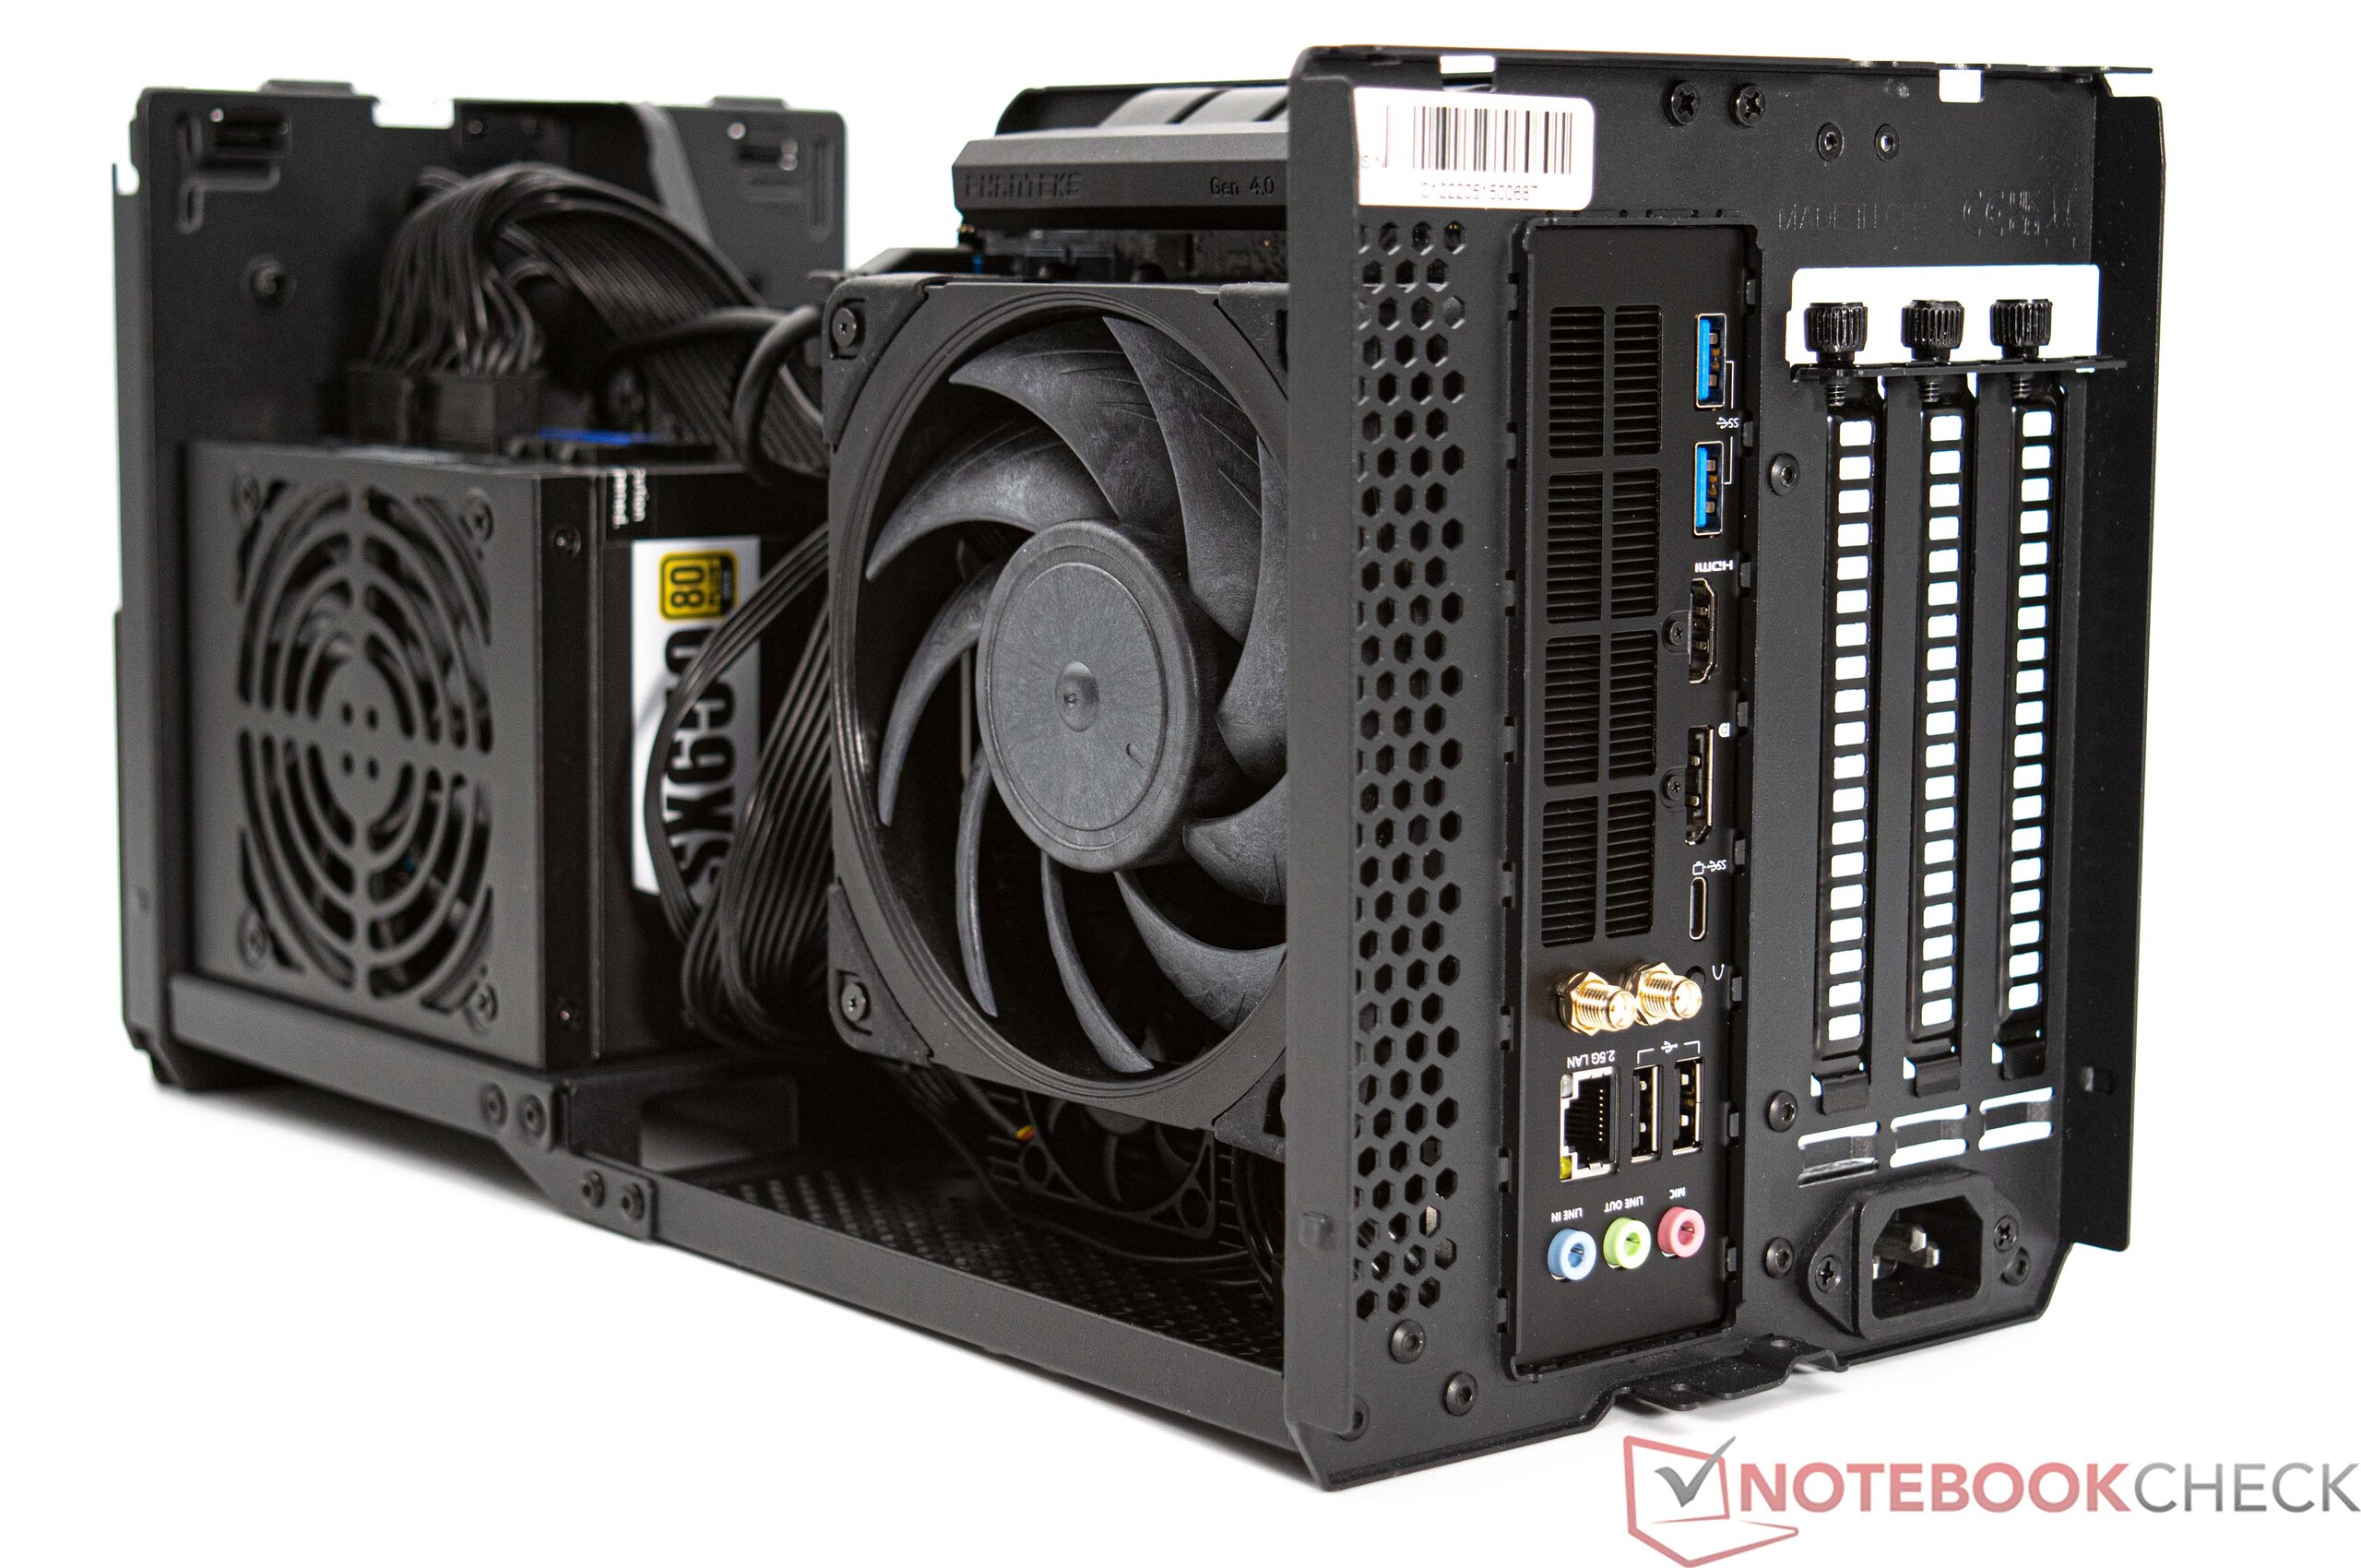
交货包括 Minisforum BD770i 主板,已安装 SoC 散热器。此外,还包括一个相对较大的 WLAN 天线(带磁性支架)和匹配的 IO 屏蔽。操作 Minisforum BD770i 还需要其他配件。生产商既没有提供 120 毫米风扇,也没有预装内存或固态硬盘。此外,还需要一个合适的 PC 电源;它应该是小型 SFX 格式的,以适合 Phanteks Enthoo Evolv Shift XT 机箱。因此,Minisforum BD770i 是微型 DIY PC 的坚实基础。

处理器基准
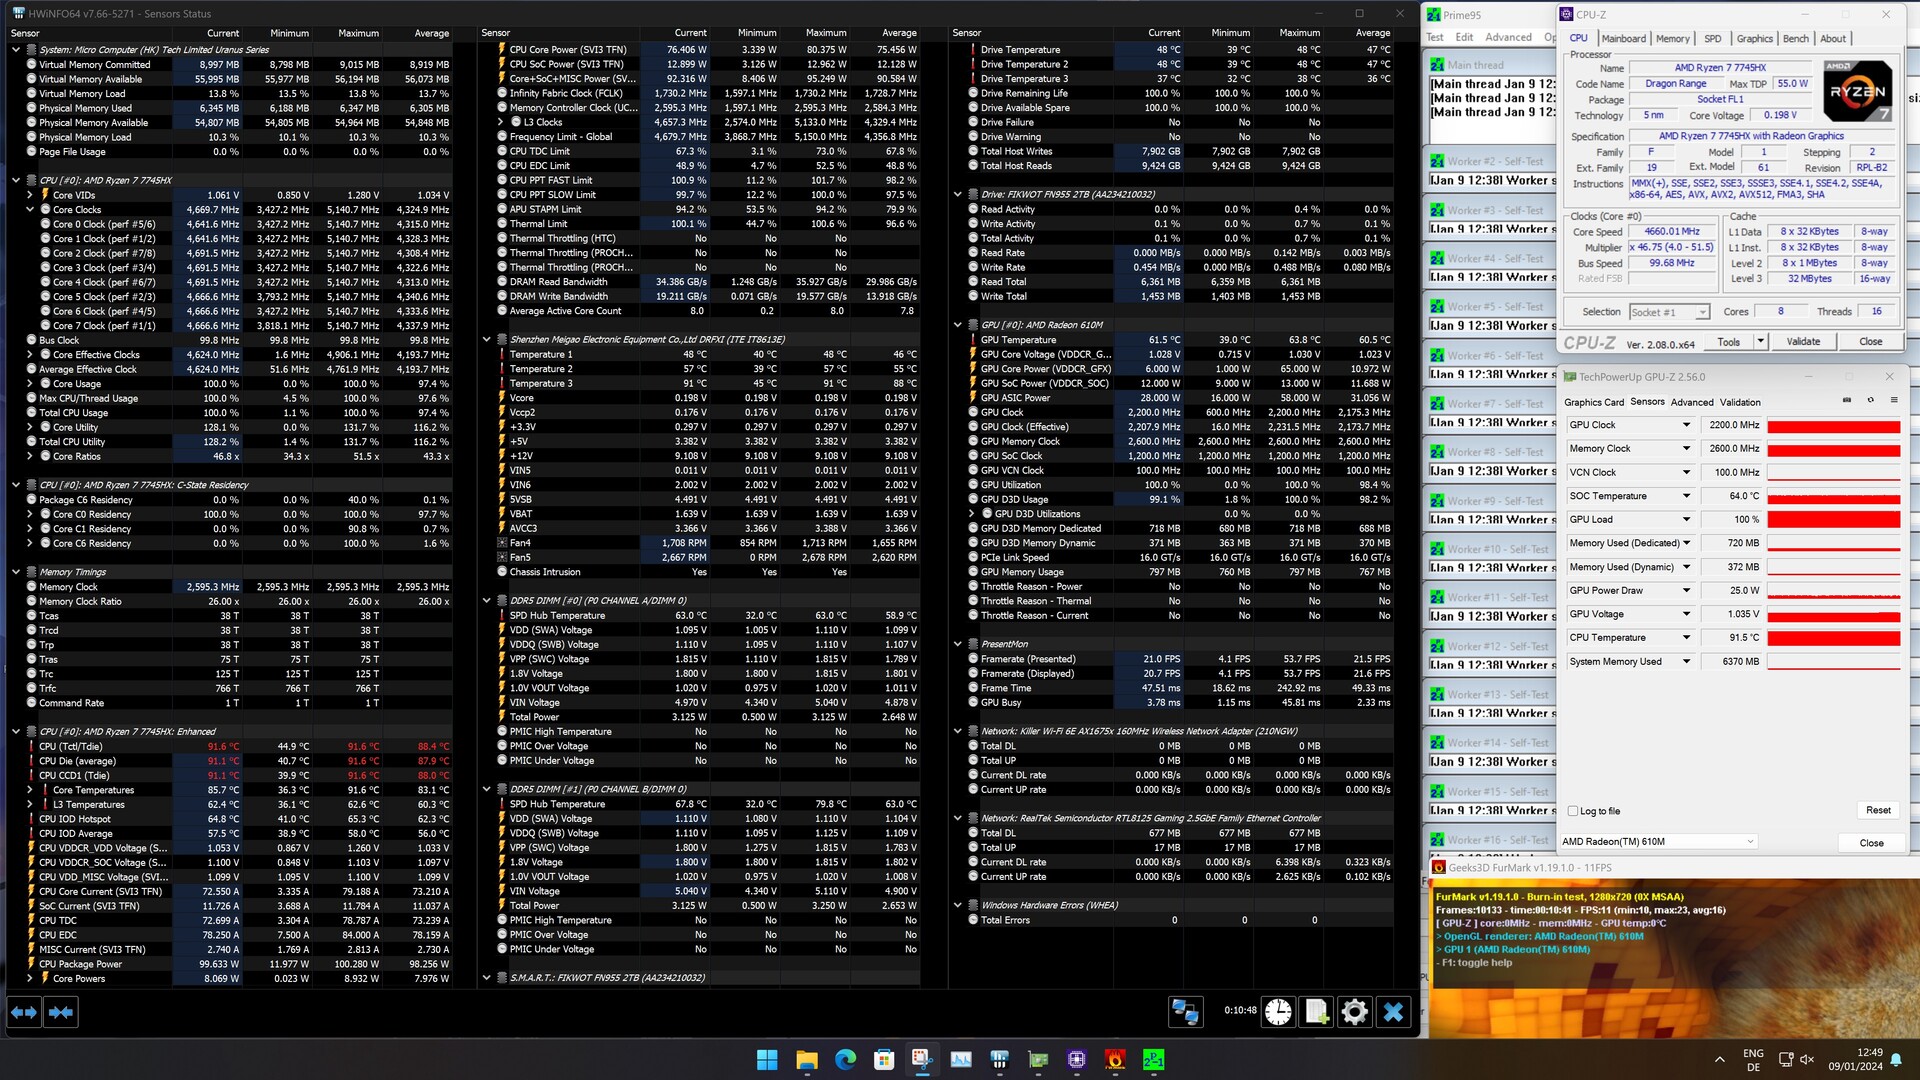
配备 AMD Ryzen 7 7745HXMinisforum BD770i 主板采用了现代 SoC,尽管不是最新的 AMD 处理器。不过,安装的 SoC 凭借其 8 个 Zen4 内核(可处理 16 个线程)脱颖而出。出色的散热性能确保了稳定的高性能,散热限制也不像笔记本电脑或迷你 PC 那样严重。在我们的性能评估中,AMD Ryzen 7 7745HX 紧随 AMD Ryzen 7 7800X 之后。 AMD Ryzen 7 7800X3D.与英特尔相比,它超过了 酷睿 i5-12600K尽管英特尔酷睿 i5-13600K 的性能略胜一筹。我们很欣赏将移动处理器集成到传统台式电脑中的策略,因为这些 CPU 通常更容易散热,同时还能提供令人称道的性能。即使是目前的 英特尔酷睿 i5-14600K在性能评级中也仅领先 10%。这凸显了采用高效散热技术的移动 SoC 在性能方面的积极发展。在单项测试中,由于核心数量较少,AMD Ryzen 7 7745HX 的性能可能无法与知名旗舰机型相媲美。
值得注意的是 AMD Ryzen 7 7840HS和 AMD Ryzen 9 7940HS这两款产品都在 Minisforum 迷你 PC (Minisforum EliteMini UM780 XTX 和 Minisforum Venus 系列 UM790 Pro).不容忽视的是,这两款 HS 型号的功耗略低。不过,显而易见的是,移动 SoC 可以通过有效散热大大提高性能。这需要适当的 UEFI 设置,在散热条件允许的情况下,允许处理器获得更多的持续功率。Minisforum 的 BD770i 没有人为限制功率值,而且功率限制可以手动调整。在默认状态下,我们记录的 AMD Ryzen 7 7745HX 的稳定功耗为 75 瓦。
有关其他比较和基准,请参阅我们的CPU 比较表 。
| Performance rating - Percent | |
| Intel Core i9-14900K | |
| Intel Core i9-13900K | |
| AMD Ryzen 9 7950X | |
| AMD Ryzen 9 7950X3D | |
| AMD Ryzen 9 7900X | |
| Intel Core i5-14600K | |
| Intel Core i9-12900K | |
| AMD Ryzen 9 5950X | |
| Intel Core i5-13600K | |
| AMD Ryzen 7 7800X3D | |
| AMD Ryzen 7 7745HX | |
| AMD Ryzen 5 7600X | |
| Intel Core i5-12600K | |
| AMD Ryzen 7 7840HS | |
| AMD Ryzen 9 7940HS | |
| Intel Core i5-13400 | |
| Intel Core i5-12400F | |
| Cinebench R15 | |
| CPU Single 64Bit | |
| Intel Core i9-14900K | |
| AMD Ryzen 9 7950X | |
| Intel Core i9-13900K | |
| AMD Ryzen 9 7950X3D | |
| AMD Ryzen 9 7900X | |
| AMD Ryzen 5 7600X | |
| Intel Core i5-14600K | |
| AMD Ryzen 7 7745HX | |
| AMD Ryzen 7 7800X3D | |
| Intel Core i5-13600K | |
| Intel Core i9-12900K | |
| AMD Ryzen 9 7940HS | |
| AMD Ryzen 7 7840HS | |
| Intel Core i5-12600K | |
| AMD Ryzen 9 5950X | |
| Intel Core i5-13400 | |
| Intel Core i5-12400F | |
| CPU Multi 64Bit | |
| Intel Core i9-14900K | |
| AMD Ryzen 9 7950X | |
| Intel Core i9-13900K | |
| AMD Ryzen 9 7950X3D | |
| AMD Ryzen 9 7900X | |
| AMD Ryzen 9 5950X | |
| Intel Core i9-12900K | |
| Intel Core i5-13600K | |
| Intel Core i5-14600K | |
| AMD Ryzen 7 7745HX | |
| AMD Ryzen 7 7800X3D | |
| AMD Ryzen 9 7940HS | |
| AMD Ryzen 7 7840HS | |
| Intel Core i5-12600K | |
| AMD Ryzen 5 7600X | |
| Intel Core i5-13400 | |
| Intel Core i5-12400F | |
| Cinebench R20 | |
| CPU (Single Core) | |
| Intel Core i9-14900K | |
| Intel Core i9-13900K | |
| AMD Ryzen 9 7950X | |
| AMD Ryzen 9 7950X3D | |
| Intel Core i5-14600K | |
| AMD Ryzen 9 7900X | |
| Intel Core i5-13600K | |
| Intel Core i9-12900K | |
| AMD Ryzen 5 7600X | |
| Intel Core i5-12600K | |
| AMD Ryzen 7 7745HX | |
| AMD Ryzen 9 7940HS | |
| AMD Ryzen 7 7800X3D | |
| AMD Ryzen 7 7840HS | |
| Intel Core i5-13400 | |
| Intel Core i5-12400F | |
| AMD Ryzen 9 5950X | |
| CPU (Multi Core) | |
| Intel Core i9-14900K | |
| Intel Core i9-13900K | |
| AMD Ryzen 9 7950X | |
| AMD Ryzen 9 7950X3D | |
| AMD Ryzen 9 7900X | |
| AMD Ryzen 9 5950X | |
| Intel Core i9-12900K | |
| Intel Core i5-14600K | |
| Intel Core i5-13600K | |
| AMD Ryzen 7 7745HX | |
| AMD Ryzen 7 7800X3D | |
| Intel Core i5-12600K | |
| AMD Ryzen 9 7940HS | |
| AMD Ryzen 7 7840HS | |
| Intel Core i5-13400 | |
| AMD Ryzen 5 7600X | |
| Intel Core i5-12400F | |
| Cinebench R23 | |
| Single Core | |
| Intel Core i9-14900K | |
| Intel Core i9-13900K | |
| Intel Core i5-14600K | |
| AMD Ryzen 9 7950X3D | |
| AMD Ryzen 9 7950X | |
| AMD Ryzen 9 7900X | |
| Intel Core i5-13600K | |
| Intel Core i9-12900K | |
| AMD Ryzen 5 7600X | |
| Intel Core i5-12600K | |
| AMD Ryzen 7 7745HX | |
| AMD Ryzen 7 7800X3D | |
| AMD Ryzen 9 7940HS | |
| Intel Core i5-13400 | |
| AMD Ryzen 7 7840HS | |
| Intel Core i5-12400F | |
| AMD Ryzen 9 5950X | |
| Multi Core | |
| Intel Core i9-14900K | |
| Intel Core i9-13900K | |
| AMD Ryzen 9 7950X | |
| AMD Ryzen 9 7950X3D | |
| AMD Ryzen 9 7900X | |
| AMD Ryzen 9 5950X | |
| Intel Core i9-12900K | |
| Intel Core i5-14600K | |
| Intel Core i5-13600K | |
| AMD Ryzen 7 7745HX | |
| AMD Ryzen 7 7800X3D | |
| Intel Core i5-12600K | |
| AMD Ryzen 9 7940HS | |
| AMD Ryzen 7 7840HS | |
| Intel Core i5-13400 | |
| AMD Ryzen 5 7600X | |
| Intel Core i5-12400F | |
| Cinebench R11.5 | |
| CPU Single 64Bit | |
| Intel Core i9-14900K | |
| Intel Core i9-13900K | |
| AMD Ryzen 9 7950X | |
| AMD Ryzen 9 7950X3D | |
| AMD Ryzen 9 7900X | |
| AMD Ryzen 5 7600X | |
| Intel Core i5-14600K | |
| AMD Ryzen 7 7745HX | |
| Intel Core i9-12900K | |
| Intel Core i5-13600K | |
| AMD Ryzen 9 7940HS | |
| AMD Ryzen 7 7800X3D | |
| AMD Ryzen 7 7840HS | |
| Intel Core i5-12600K | |
| AMD Ryzen 9 5950X | |
| Intel Core i5-13400 | |
| Intel Core i5-12400F | |
| CPU Multi 64Bit | |
| Intel Core i9-14900K | |
| Intel Core i9-13900K | |
| AMD Ryzen 9 7950X | |
| AMD Ryzen 9 7950X3D | |
| AMD Ryzen 9 7900X | |
| AMD Ryzen 9 5950X | |
| Intel Core i9-12900K | |
| Intel Core i5-13600K | |
| Intel Core i5-14600K | |
| AMD Ryzen 7 7745HX | |
| AMD Ryzen 7 7800X3D | |
| AMD Ryzen 9 7940HS | |
| AMD Ryzen 7 7840HS | |
| Intel Core i5-12600K | |
| AMD Ryzen 5 7600X | |
| Intel Core i5-13400 | |
| Intel Core i5-12400F | |
| Cinebench R10 | |
| Rendering Single CPUs 64Bit | |
| Intel Core i9-14900K | |
| Intel Core i9-13900K | |
| Intel Core i5-14600K | |
| AMD Ryzen 9 7900X | |
| AMD Ryzen 9 7950X | |
| Intel Core i5-13600K | |
| Intel Core i9-12900K | |
| AMD Ryzen 5 7600X | |
| Intel Core i5-12600K | |
| AMD Ryzen 7 7745HX | |
| AMD Ryzen 9 7940HS | |
| AMD Ryzen 7 7800X3D | |
| AMD Ryzen 7 7840HS | |
| Intel Core i5-13400 | |
| Intel Core i5-12400F | |
| AMD Ryzen 9 5950X | |
| AMD Ryzen 9 7950X3D | |
| Rendering Multiple CPUs 64Bit | |
| Intel Core i9-14900K | |
| Intel Core i9-13900K | |
| AMD Ryzen 9 7950X | |
| AMD Ryzen 9 7900X | |
| Intel Core i5-14600K | |
| Intel Core i9-12900K | |
| Intel Core i5-13600K | |
| AMD Ryzen 9 5950X | |
| AMD Ryzen 7 7745HX | |
| AMD Ryzen 7 7800X3D | |
| AMD Ryzen 5 7600X | |
| Intel Core i5-12600K | |
| AMD Ryzen 9 7940HS | |
| AMD Ryzen 7 7840HS | |
| Intel Core i5-13400 | |
| AMD Ryzen 9 7950X3D | |
| Intel Core i5-12400F | |
| Blender - v2.79 BMW27 CPU | |
| Intel Core i5-12400F | |
| Intel Core i5-13400 | |
| AMD Ryzen 5 7600X | |
| AMD Ryzen 7 7840HS | |
| Intel Core i5-12600K | |
| AMD Ryzen 9 7940HS | |
| AMD Ryzen 7 7800X3D | |
| AMD Ryzen 7 7745HX | |
| Intel Core i5-13600K | |
| Intel Core i5-14600K | |
| Intel Core i9-12900K | |
| AMD Ryzen 9 5950X | |
| AMD Ryzen 9 7900X | |
| AMD Ryzen 9 7950X3D | |
| AMD Ryzen 9 7950X | |
| Intel Core i9-13900K | |
| Intel Core i9-14900K | |
| wPrime 2.10 | |
| 32m | |
| Intel Core i9-12900K | |
| Intel Core i5-12600K | |
| Intel Core i5-12400F | |
| Intel Core i5-13400 | |
| AMD Ryzen 5 7600X | |
| AMD Ryzen 9 7940HS | |
| AMD Ryzen 7 7840HS | |
| AMD Ryzen 9 5950X | |
| Intel Core i5-13600K | |
| AMD Ryzen 7 7800X3D | |
| Intel Core i5-14600K | |
| AMD Ryzen 7 7745HX | |
| Intel Core i9-14900K | |
| AMD Ryzen 9 7950X3D | |
| Intel Core i9-13900K | |
| AMD Ryzen 9 7900X | |
| AMD Ryzen 9 7950X | |
| 1024m | |
| Intel Core i5-13400 | |
| Intel Core i5-12600K | |
| Intel Core i9-12900K | |
| Intel Core i5-13600K | |
| Intel Core i5-14600K | |
| Intel Core i5-12400F | |
| Intel Core i9-13900K | |
| AMD Ryzen 5 7600X | |
| Intel Core i9-14900K | |
| AMD Ryzen 7 7840HS | |
| AMD Ryzen 9 7940HS | |
| AMD Ryzen 9 5950X | |
| AMD Ryzen 7 7800X3D | |
| AMD Ryzen 7 7745HX | |
| AMD Ryzen 9 7900X | |
| AMD Ryzen 9 7950X3D | |
| AMD Ryzen 9 7950X | |
| X264 HD Benchmark 4.0 | |
| Pass 1 | |
| Intel Core i9-14900K | |
| Intel Core i9-13900K | |
| Intel Core i5-14600K | |
| AMD Ryzen 9 7950X3D | |
| Intel Core i5-13600K | |
| AMD Ryzen 9 7950X | |
| AMD Ryzen 9 7900X | |
| Intel Core i9-12900K | |
| AMD Ryzen 5 7600X | |
| AMD Ryzen 7 7745HX | |
| AMD Ryzen 7 7800X3D | |
| AMD Ryzen 9 5950X | |
| Intel Core i5-12600K | |
| Intel Core i5-13400 | |
| AMD Ryzen 9 7940HS | |
| AMD Ryzen 7 7840HS | |
| Intel Core i5-12400F | |
| Pass 2 | |
| Intel Core i9-14900K | |
| Intel Core i9-13900K | |
| AMD Ryzen 9 7950X | |
| AMD Ryzen 9 7950X3D | |
| AMD Ryzen 9 7900X | |
| AMD Ryzen 9 5950X | |
| Intel Core i5-14600K | |
| Intel Core i9-12900K | |
| Intel Core i5-13600K | |
| AMD Ryzen 7 7745HX | |
| AMD Ryzen 7 7800X3D | |
| AMD Ryzen 9 7940HS | |
| AMD Ryzen 7 7840HS | |
| Intel Core i5-12600K | |
| AMD Ryzen 5 7600X | |
| Intel Core i5-13400 | |
| Intel Core i5-12400F | |
| WinRAR - Result | |
| AMD Ryzen 9 7900X | |
| AMD Ryzen 7 7800X3D | |
| AMD Ryzen 9 7950X | |
| AMD Ryzen 5 7600X | |
| Intel Core i9-14900K | |
| AMD Ryzen 9 7950X3D | |
| Intel Core i9-13900K | |
| AMD Ryzen 7 7745HX | |
| AMD Ryzen 9 5950X | |
| Intel Core i5-14600K | |
| Intel Core i5-13600K | |
| Intel Core i9-12900K | |
| Intel Core i5-13400 | |
| Intel Core i5-12400F | |
| AMD Ryzen 7 7840HS | |
| AMD Ryzen 9 7940HS | |
| Intel Core i5-12600K | |
| Geekbench 5.5 | |
| Multi-Core | |
| Intel Core i9-14900K | |
| AMD Ryzen 9 7950X | |
| AMD Ryzen 9 7950X3D | |
| Intel Core i9-13900K | |
| AMD Ryzen 9 7900X | |
| Intel Core i9-12900K | |
| Intel Core i5-14600K | |
| AMD Ryzen 9 5950X | |
| Intel Core i5-13600K | |
| AMD Ryzen 7 7800X3D | |
| AMD Ryzen 7 7745HX | |
| Intel Core i5-12600K | |
| AMD Ryzen 7 7840HS | |
| Intel Core i5-13400 | |
| AMD Ryzen 5 7600X | |
| AMD Ryzen 9 7940HS | |
| Intel Core i5-12400F | |
| Single-Core | |
| AMD Ryzen 9 7950X | |
| AMD Ryzen 9 7950X3D | |
| Intel Core i9-13900K | |
| AMD Ryzen 9 7900X | |
| Intel Core i9-14900K | |
| AMD Ryzen 5 7600X | |
| AMD Ryzen 7 7745HX | |
| Intel Core i9-12900K | |
| AMD Ryzen 7 7800X3D | |
| Intel Core i5-14600K | |
| AMD Ryzen 9 7940HS | |
| Intel Core i5-13600K | |
| AMD Ryzen 7 7840HS | |
| Intel Core i5-12600K | |
| Intel Core i5-13400 | |
| Intel Core i5-12400F | |
| AMD Ryzen 9 5950X | |
| Geekbench 5.0 | |
| 5.0 Multi-Core | |
| Intel Core i9-14900K | |
| AMD Ryzen 9 7950X | |
| Intel Core i9-13900K | |
| AMD Ryzen 9 7950X3D | |
| AMD Ryzen 9 7900X | |
| Intel Core i9-12900K | |
| Intel Core i5-14600K | |
| Intel Core i5-13600K | |
| AMD Ryzen 9 5950X | |
| AMD Ryzen 7 7800X3D | |
| AMD Ryzen 7 7745HX | |
| Intel Core i5-12600K | |
| AMD Ryzen 7 7840HS | |
| AMD Ryzen 5 7600X | |
| Intel Core i5-13400 | |
| AMD Ryzen 9 7940HS | |
| Intel Core i5-12400F | |
| 5.0 Single-Core | |
| Intel Core i9-14900K | |
| AMD Ryzen 9 7950X | |
| Intel Core i9-13900K | |
| AMD Ryzen 9 7900X | |
| AMD Ryzen 9 7950X3D | |
| AMD Ryzen 5 7600X | |
| Intel Core i5-14600K | |
| AMD Ryzen 7 7745HX | |
| Intel Core i9-12900K | |
| AMD Ryzen 7 7800X3D | |
| Intel Core i5-13600K | |
| AMD Ryzen 7 7840HS | |
| AMD Ryzen 9 7940HS | |
| Intel Core i5-12600K | |
| Intel Core i5-13400 | |
| AMD Ryzen 9 5950X | |
| Intel Core i5-12400F | |
| Geekbench 4.4 | |
| 64 Bit Single-Core Score | |
| Intel Core i9-14900K | |
| Intel Core i9-13900K | |
| AMD Ryzen 9 7950X | |
| AMD Ryzen 9 7950X3D | |
| AMD Ryzen 9 7900X | |
| AMD Ryzen 7 7800X3D | |
| AMD Ryzen 5 7600X | |
| Intel Core i5-14600K | |
| Intel Core i9-12900K | |
| Intel Core i5-13600K | |
| AMD Ryzen 7 7745HX | |
| Intel Core i5-12600K | |
| AMD Ryzen 7 7840HS | |
| AMD Ryzen 9 7940HS | |
| Intel Core i5-13400 | |
| Intel Core i5-12400F | |
| AMD Ryzen 9 5950X | |
| 64 Bit Multi-Core Score | |
| AMD Ryzen 9 7950X | |
| Intel Core i9-14900K | |
| AMD Ryzen 9 7950X3D | |
| Intel Core i9-13900K | |
| AMD Ryzen 9 7900X | |
| Intel Core i5-14600K | |
| Intel Core i9-12900K | |
| AMD Ryzen 9 5950X | |
| Intel Core i5-13600K | |
| AMD Ryzen 7 7800X3D | |
| AMD Ryzen 7 7745HX | |
| AMD Ryzen 7 7840HS | |
| AMD Ryzen 5 7600X | |
| Intel Core i5-12600K | |
| AMD Ryzen 9 7940HS | |
| Intel Core i5-13400 | |
| Intel Core i5-12400F | |
| 3DMark 11 - 1280x720 Performance Physics | |
| AMD Ryzen 9 7950X3D | |
| AMD Ryzen 7 7800X3D | |
| Intel Core i9-13900K | |
| Intel Core i9-14900K | |
| Intel Core i5-14600K | |
| Intel Core i5-13600K | |
| AMD Ryzen 9 7900X | |
| AMD Ryzen 9 7950X | |
| Intel Core i9-12900K | |
| AMD Ryzen 7 7745HX | |
| AMD Ryzen 5 7600X | |
| AMD Ryzen 9 5950X | |
| Intel Core i5-12600K | |
| Intel Core i5-13400 | |
| AMD Ryzen 7 7840HS | |
| AMD Ryzen 9 7940HS | |
| Intel Core i5-12400F | |
| 7-Zip 18.03 | |
| 7z b 4 | |
| AMD Ryzen 9 7950X | |
| AMD Ryzen 9 7950X3D | |
| Intel Core i9-14900K | |
| Intel Core i9-13900K | |
| AMD Ryzen 9 5950X | |
| AMD Ryzen 9 7900X | |
| Intel Core i9-12900K | |
| Intel Core i5-14600K | |
| Intel Core i5-13600K | |
| AMD Ryzen 7 7800X3D | |
| AMD Ryzen 7 7745HX | |
| AMD Ryzen 7 7840HS | |
| AMD Ryzen 9 7940HS | |
| AMD Ryzen 5 7600X | |
| Intel Core i5-12600K | |
| Intel Core i5-13400 | |
| Intel Core i5-12400F | |
| 7z b 4 -mmt1 | |
| AMD Ryzen 9 7950X | |
| AMD Ryzen 9 7950X3D | |
| AMD Ryzen 9 7900X | |
| AMD Ryzen 7 7800X3D | |
| AMD Ryzen 5 7600X | |
| Intel Core i9-14900K | |
| AMD Ryzen 7 7745HX | |
| Intel Core i9-13900K | |
| AMD Ryzen 9 5950X | |
| Intel Core i5-14600K | |
| AMD Ryzen 9 7940HS | |
| Intel Core i9-12900K | |
| AMD Ryzen 7 7840HS | |
| Intel Core i5-13600K | |
| Intel Core i5-12600K | |
| Intel Core i5-13400 | |
| Intel Core i5-12400F | |
| HWBOT x265 Benchmark v2.2 - 4k Preset | |
| AMD Ryzen 9 7950X | |
| Intel Core i9-14900K | |
| Intel Core i9-13900K | |
| AMD Ryzen 9 7950X3D | |
| AMD Ryzen 9 7900X | |
| AMD Ryzen 9 5950X | |
| Intel Core i5-12600K | |
| Intel Core i9-12900K | |
| Intel Core i5-14600K | |
| Intel Core i5-13600K | |
| AMD Ryzen 7 7800X3D | |
| AMD Ryzen 7 7745HX | |
| AMD Ryzen 5 7600X | |
| AMD Ryzen 7 7840HS | |
| AMD Ryzen 9 7940HS | |
| Intel Core i5-13400 | |
| Intel Core i5-12400F | |
| R Benchmark 2.5 - Overall mean | |
| Intel Core i5-12400F | |
| Intel Core i5-13400 | |
| AMD Ryzen 9 5950X | |
| Intel Core i5-12600K | |
| AMD Ryzen 7 7840HS | |
| Intel Core i9-12900K | |
| AMD Ryzen 9 7940HS | |
| AMD Ryzen 7 7800X3D | |
| AMD Ryzen 7 7745HX | |
| Intel Core i5-13600K | |
| Intel Core i5-14600K | |
| AMD Ryzen 5 7600X | |
| AMD Ryzen 9 7900X | |
| AMD Ryzen 9 7950X3D | |
| AMD Ryzen 9 7950X | |
| Intel Core i9-13900K | |
| Intel Core i9-14900K | |
| LibreOffice - 20 Documents To PDF | |
| Intel Core i5-12600K | |
| AMD Ryzen 7 7840HS | |
| Intel Core i5-12400F | |
| AMD Ryzen 9 7940HS | |
| AMD Ryzen 9 5950X | |
| AMD Ryzen 7 7745HX | |
| AMD Ryzen 7 7800X3D | |
| Intel Core i9-12900K | |
| Intel Core i5-13400 | |
| AMD Ryzen 9 7950X3D | |
| AMD Ryzen 5 7600X | |
| Intel Core i9-13900K | |
| AMD Ryzen 9 7950X | |
| Intel Core i5-13600K | |
| AMD Ryzen 9 7900X | |
| Intel Core i9-14900K | |
| Intel Core i5-14600K | |
| WebXPRT 3 - Overall | |
| AMD Ryzen 9 7950X3D | |
| Intel Core i9-14900K | |
| AMD Ryzen 9 7900X | |
| AMD Ryzen 9 7950X | |
| AMD Ryzen 5 7600X | |
| Intel Core i9-13900K | |
| Intel Core i5-14600K | |
| AMD Ryzen 7 7800X3D | |
| AMD Ryzen 7 7745HX | |
| Intel Core i5-13600K | |
| AMD Ryzen 7 7840HS | |
| Intel Core i9-12900K | |
| Intel Core i5-13400 | |
| AMD Ryzen 9 7940HS | |
| Intel Core i5-12600K | |
| AMD Ryzen 9 5950X | |
| Intel Core i5-12400F | |
| Mozilla Kraken 1.1 - Total | |
| Intel Core i5-12400F | |
| AMD Ryzen 9 5950X | |
| Intel Core i5-13400 | |
| AMD Ryzen 7 7840HS | |
| Intel Core i5-12600K | |
| AMD Ryzen 7 7800X3D | |
| AMD Ryzen 9 7940HS | |
| Intel Core i9-12900K | |
| AMD Ryzen 7 7745HX | |
| Intel Core i5-13600K | |
| Intel Core i5-14600K | |
| AMD Ryzen 5 7600X | |
| AMD Ryzen 9 7950X3D | |
| AMD Ryzen 9 7950X | |
| Intel Core i9-13900K | |
| AMD Ryzen 9 7900X | |
| Intel Core i9-14900K | |
| 3DMark | |
| 1920x1080 Fire Strike Physics | |
| Intel Core i9-14900K | |
| Intel Core i9-13900K | |
| AMD Ryzen 9 7950X3D | |
| AMD Ryzen 9 7900X | |
| AMD Ryzen 9 7950X | |
| Intel Core i5-14600K | |
| AMD Ryzen 9 5950X | |
| Intel Core i9-12900K | |
| Intel Core i5-13600K | |
| AMD Ryzen 7 7800X3D | |
| AMD Ryzen 5 7600X | |
| Intel Core i5-12600K | |
| AMD Ryzen 7 7840HS | |
| AMD Ryzen 9 7940HS | |
| Intel Core i5-13400 | |
| Intel Core i5-12400F | |
| AMD Ryzen 7 7745HX | |
| 2560x1440 Time Spy CPU | |
| Intel Core i9-14900K | |
| Intel Core i9-13900K | |
| Intel Core i5-14600K | |
| Intel Core i9-12900K | |
| AMD Ryzen 9 7950X3D | |
| Intel Core i5-13600K | |
| AMD Ryzen 9 7900X | |
| AMD Ryzen 9 7950X | |
| AMD Ryzen 7 7800X3D | |
| Intel Core i5-12600K | |
| AMD Ryzen 9 5950X | |
| Intel Core i5-13400 | |
| AMD Ryzen 7 7840HS | |
| AMD Ryzen 7 7745HX | |
| AMD Ryzen 9 7940HS | |
| AMD Ryzen 5 7600X | |
| Intel Core i5-12400F | |
* ... smaller is better
Cinebench 结果 AMD Ryzen 7 7745HX
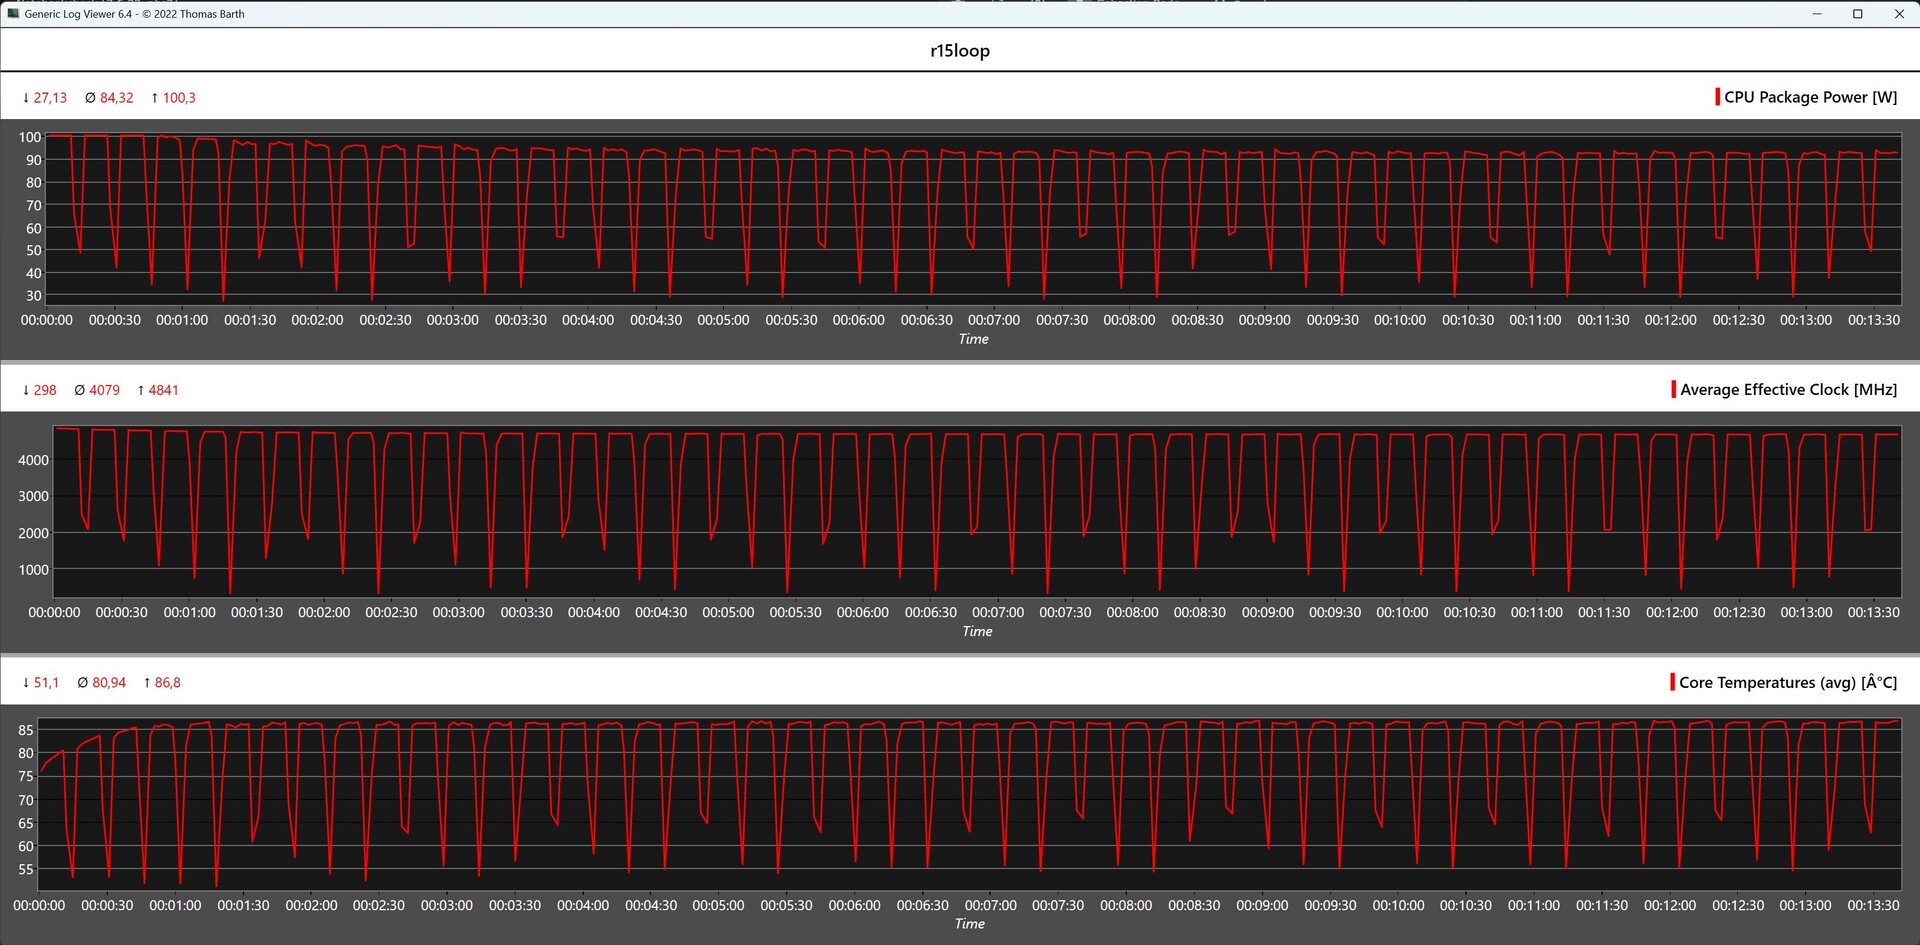
通过 Cinebench R15 多连续测试,我们可以初步了解所安装散热解决方案的性能。总体而言,AMD Ryzen 7 7745HX 的性能相对稳定。我们的测试样机平均得分为 2,867 分,在这种情况下取得了出色的成绩。值得注意的是,该测试结果超过了 AMD Ryzen 7 7840HS。
系统性能
在系统性能方面,我们简要介绍了 Minisforum BD770i 测试系统的主观体验:该系统的性能始终保持在较高水平,原生 8 核能够有效处理要求苛刻的应用程序。与快速的 NVMe 固态硬盘和 DDR5 内存搭配使用,可确保快速的运行速度。这一观察结果适用于本文提及的所有对比系统。没有任何组合表现出明显的缺陷,差异主要是可测量的。Minisforum BD770i 系统位居中下游,与 Minisforum 的两台迷你 PC 处于同一位置。虽然这些设备的性能可能无法与高端台式机系统相提并论,但必须指出的是,这种比较有些不公平。不过,将这些设备纳入概览为评估 Minisforum BD770i 与 AMD Ryzen 7 7745HX 的性能提供了更好的背景。
| Performance rating - Percent | |
| AMD Ryzen 9 7950X3D, AMD Ryzen 9 7950X3D -1! | |
| NVIDIA GeForce RTX 3090 Founders Edition, AMD Ryzen 9 7950X | |
| AMD Ryzen 9 7900X, AMD Ryzen 9 7900X | |
| Palit GeForce RTX 4090 GameRock OC, Intel Core i9-14900K | |
| AMD Ryzen 5 7600X, AMD Ryzen 5 7600X | |
| Intel Core i9-13900K, Intel Core i9-13900K | |
| Intel Core i5-13600K, Intel Core i5-13600K | |
| Intel Core i5-14600K, Intel Core i5-14600K | |
| AMD Ryzen 7 7800X3D, AMD Ryzen 7 7800X3D | |
| AMD Ryzen 9 5950X, AMD Ryzen 9 5950X | |
| Intel Core i9-12900K, Intel Core i9-12900K | |
| Intel Core i5-13400, Intel Core i5-13400 | |
| Intel Core i5-12600K, Intel Core i5-12600K | |
| Minisforum BD770i, AMD Ryzen 7 7745HX | |
| Minisforum EliteMini UM780 XTX, AMD Ryzen 7 7840HS | |
| Minisforum Venus Series UM790 Pro, AMD Ryzen 9 7940HS | |
| Intel Core i5-12400F, Intel Core i5-12400F | |
| CrossMark / Overall | |
| Palit GeForce RTX 4090 GameRock OC, Palit GeForce RTX 4090 GameRock OC, Intel Core i9-14900K | |
| Intel Core i9-13900K, Intel Core i9-13900K, Intel Core i9-13900K | |
| NVIDIA GeForce RTX 3090 Founders Edition, NVIDIA GeForce RTX 3090 Founders Edition, AMD Ryzen 9 7950X | |
| AMD Ryzen 9 7900X, AMD Ryzen 9 7900X, AMD Ryzen 9 7900X | |
| Intel Core i5-14600K, Intel Core i5-14600K, Intel Core i5-14600K | |
| Intel Core i5-13600K, Intel Core i5-13600K, Intel Core i5-13600K | |
| AMD Ryzen 5 7600X, AMD Ryzen 5 7600X, AMD Ryzen 5 7600X | |
| AMD Ryzen 7 7800X3D, AMD Ryzen 7 7800X3D, AMD Ryzen 7 7800X3D | |
| AMD Ryzen 9 7950X3D, AMD Ryzen 9 7950X3D, AMD Ryzen 9 7950X3D | |
| Minisforum BD770i, AMD Ryzen 7 7745HX | |
| Intel Core i5-13400, Intel Core i5-13400, Intel Core i5-13400 | |
| Intel Core i5-12400F, Intel Core i5-12400F, Intel Core i5-12400F | |
| Minisforum EliteMini UM780 XTX, AMD Ryzen 7 7840HS | |
| Minisforum Venus Series UM790 Pro, AMD Ryzen 9 7940HS | |
| AMD Ryzen 9 5950X, AMD Ryzen 9 5950X, AMD Ryzen 9 5950X | |
| CrossMark / Productivity | |
| Palit GeForce RTX 4090 GameRock OC, Palit GeForce RTX 4090 GameRock OC, Intel Core i9-14900K | |
| Intel Core i9-13900K, Intel Core i9-13900K, Intel Core i9-13900K | |
| NVIDIA GeForce RTX 3090 Founders Edition, NVIDIA GeForce RTX 3090 Founders Edition, AMD Ryzen 9 7950X | |
| AMD Ryzen 9 7900X, AMD Ryzen 9 7900X, AMD Ryzen 9 7900X | |
| Intel Core i5-14600K, Intel Core i5-14600K, Intel Core i5-14600K | |
| Intel Core i5-13600K, Intel Core i5-13600K, Intel Core i5-13600K | |
| AMD Ryzen 5 7600X, AMD Ryzen 5 7600X, AMD Ryzen 5 7600X | |
| AMD Ryzen 7 7800X3D, AMD Ryzen 7 7800X3D, AMD Ryzen 7 7800X3D | |
| Minisforum BD770i, AMD Ryzen 7 7745HX | |
| AMD Ryzen 9 7950X3D, AMD Ryzen 9 7950X3D, AMD Ryzen 9 7950X3D | |
| Intel Core i5-13400, Intel Core i5-13400, Intel Core i5-13400 | |
| Minisforum Venus Series UM790 Pro, AMD Ryzen 9 7940HS | |
| Intel Core i5-12400F, Intel Core i5-12400F, Intel Core i5-12400F | |
| Minisforum EliteMini UM780 XTX, AMD Ryzen 7 7840HS | |
| AMD Ryzen 9 5950X, AMD Ryzen 9 5950X, AMD Ryzen 9 5950X | |
| CrossMark / Creativity | |
| Palit GeForce RTX 4090 GameRock OC, Palit GeForce RTX 4090 GameRock OC, Intel Core i9-14900K | |
| NVIDIA GeForce RTX 3090 Founders Edition, NVIDIA GeForce RTX 3090 Founders Edition, AMD Ryzen 9 7950X | |
| Intel Core i9-13900K, Intel Core i9-13900K, Intel Core i9-13900K | |
| AMD Ryzen 9 7900X, AMD Ryzen 9 7900X, AMD Ryzen 9 7900X | |
| Intel Core i5-14600K, Intel Core i5-14600K, Intel Core i5-14600K | |
| AMD Ryzen 9 7950X3D, AMD Ryzen 9 7950X3D, AMD Ryzen 9 7950X3D | |
| AMD Ryzen 7 7800X3D, AMD Ryzen 7 7800X3D, AMD Ryzen 7 7800X3D | |
| AMD Ryzen 5 7600X, AMD Ryzen 5 7600X, AMD Ryzen 5 7600X | |
| Intel Core i5-13600K, Intel Core i5-13600K, Intel Core i5-13600K | |
| Minisforum BD770i, AMD Ryzen 7 7745HX | |
| Minisforum EliteMini UM780 XTX, AMD Ryzen 7 7840HS | |
| Intel Core i5-13400, Intel Core i5-13400, Intel Core i5-13400 | |
| Minisforum Venus Series UM790 Pro, AMD Ryzen 9 7940HS | |
| Intel Core i5-12400F, Intel Core i5-12400F, Intel Core i5-12400F | |
| AMD Ryzen 9 5950X, AMD Ryzen 9 5950X, AMD Ryzen 9 5950X | |
| CrossMark / Responsiveness | |
| Intel Core i9-13900K, Intel Core i9-13900K, Intel Core i9-13900K | |
| Palit GeForce RTX 4090 GameRock OC, Palit GeForce RTX 4090 GameRock OC, Intel Core i9-14900K | |
| Intel Core i5-13600K, Intel Core i5-13600K, Intel Core i5-13600K | |
| NVIDIA GeForce RTX 3090 Founders Edition, NVIDIA GeForce RTX 3090 Founders Edition, AMD Ryzen 9 7950X | |
| AMD Ryzen 9 7900X, AMD Ryzen 9 7900X, AMD Ryzen 9 7900X | |
| AMD Ryzen 5 7600X, AMD Ryzen 5 7600X, AMD Ryzen 5 7600X | |
| Intel Core i5-14600K, Intel Core i5-14600K, Intel Core i5-14600K | |
| AMD Ryzen 7 7800X3D, AMD Ryzen 7 7800X3D, AMD Ryzen 7 7800X3D | |
| Minisforum BD770i, AMD Ryzen 7 7745HX | |
| Intel Core i5-13400, Intel Core i5-13400, Intel Core i5-13400 | |
| Intel Core i5-12400F, Intel Core i5-12400F, Intel Core i5-12400F | |
| AMD Ryzen 9 7950X3D, AMD Ryzen 9 7950X3D, AMD Ryzen 9 7950X3D | |
| Minisforum Venus Series UM790 Pro, AMD Ryzen 9 7940HS | |
| Minisforum EliteMini UM780 XTX, AMD Ryzen 7 7840HS | |
| AMD Ryzen 9 5950X, AMD Ryzen 9 5950X, AMD Ryzen 9 5950X | |
| AIDA64 / Memory Copy | |
| Palit GeForce RTX 4090 GameRock OC | |
| Palit GeForce RTX 4090 GameRock OC | |
| Intel Core i5-14600K | |
| Intel Core i9-13900K | |
| AMD Ryzen 9 7950X3D | |
| Intel Core i9-12900K | |
| NVIDIA GeForce RTX 3090 Founders Edition | |
| Intel Core i5-13400 | |
| Intel Core i5-13600K | |
| Intel Core i5-12400F | |
| Intel Core i5-12600K | |
| Average of class Desktop (54743 - 98416, n=21, last 2 years) | |
| AMD Ryzen 9 7900X | |
| Minisforum EliteMini UM780 XTX | |
| AMD Ryzen 7 7800X3D | |
| Minisforum Venus Series UM790 Pro | |
| AMD Ryzen 5 7600X | |
| AMD Ryzen 9 5950X | |
| Minisforum BD770i | |
| Average AMD Ryzen 7 7745HX (50007 - 53867, n=2) | |
| AIDA64 / Memory Read | |
| Palit GeForce RTX 4090 GameRock OC | |
| Palit GeForce RTX 4090 GameRock OC | |
| Intel Core i5-14600K | |
| Intel Core i9-13900K | |
| Intel Core i9-12900K | |
| AMD Ryzen 9 7950X3D | |
| NVIDIA GeForce RTX 3090 Founders Edition | |
| Intel Core i5-13400 | |
| Intel Core i5-12600K | |
| Intel Core i5-13600K | |
| Average of class Desktop (58375 - 110448, n=21, last 2 years) | |
| AMD Ryzen 9 7900X | |
| Intel Core i5-12400F | |
| AMD Ryzen 9 5950X | |
| AMD Ryzen 7 7800X3D | |
| Minisforum EliteMini UM780 XTX | |
| Minisforum Venus Series UM790 Pro | |
| AMD Ryzen 5 7600X | |
| Minisforum BD770i | |
| Average AMD Ryzen 7 7745HX (50703 - 54278, n=2) | |
| AIDA64 / Memory Write | |
| AMD Ryzen 7 7800X3D | |
| Minisforum EliteMini UM780 XTX | |
| AMD Ryzen 9 7950X3D | |
| Intel Core i5-14600K | |
| Palit GeForce RTX 4090 GameRock OC | |
| Palit GeForce RTX 4090 GameRock OC | |
| AMD Ryzen 5 7600X | |
| NVIDIA GeForce RTX 3090 Founders Edition | |
| Minisforum Venus Series UM790 Pro | |
| Average of class Desktop (60635 - 93889, n=21, last 2 years) | |
| AMD Ryzen 9 7900X | |
| Intel Core i9-13900K | |
| Intel Core i5-13400 | |
| Intel Core i5-12600K | |
| Intel Core i5-12400F | |
| Intel Core i9-12900K | |
| Intel Core i5-13600K | |
| Minisforum BD770i | |
| Average AMD Ryzen 7 7745HX (54587 - 70803, n=2) | |
| AMD Ryzen 9 5950X | |
| AIDA64 / Memory Latency | |
| Minisforum EliteMini UM780 XTX | |
| Average of class Desktop (68.5 - 168, n=21, last 2 years) | |
| Minisforum Venus Series UM790 Pro | |
| Average AMD Ryzen 7 7745HX (80.7 - 86.5, n=2) | |
| Intel Core i5-13600K | |
| Minisforum BD770i | |
| Intel Core i5-12400F | |
| Intel Core i5-13400 | |
| Intel Core i9-13900K | |
| Palit GeForce RTX 4090 GameRock OC | |
| Palit GeForce RTX 4090 GameRock OC | |
| Intel Core i5-14600K | |
| AMD Ryzen 7 7800X3D | |
| AMD Ryzen 9 5950X | |
| AMD Ryzen 9 7950X3D | |
| AMD Ryzen 5 7600X | |
| AMD Ryzen 9 7900X | |
| NVIDIA GeForce RTX 3090 Founders Edition | |
* ... smaller is better
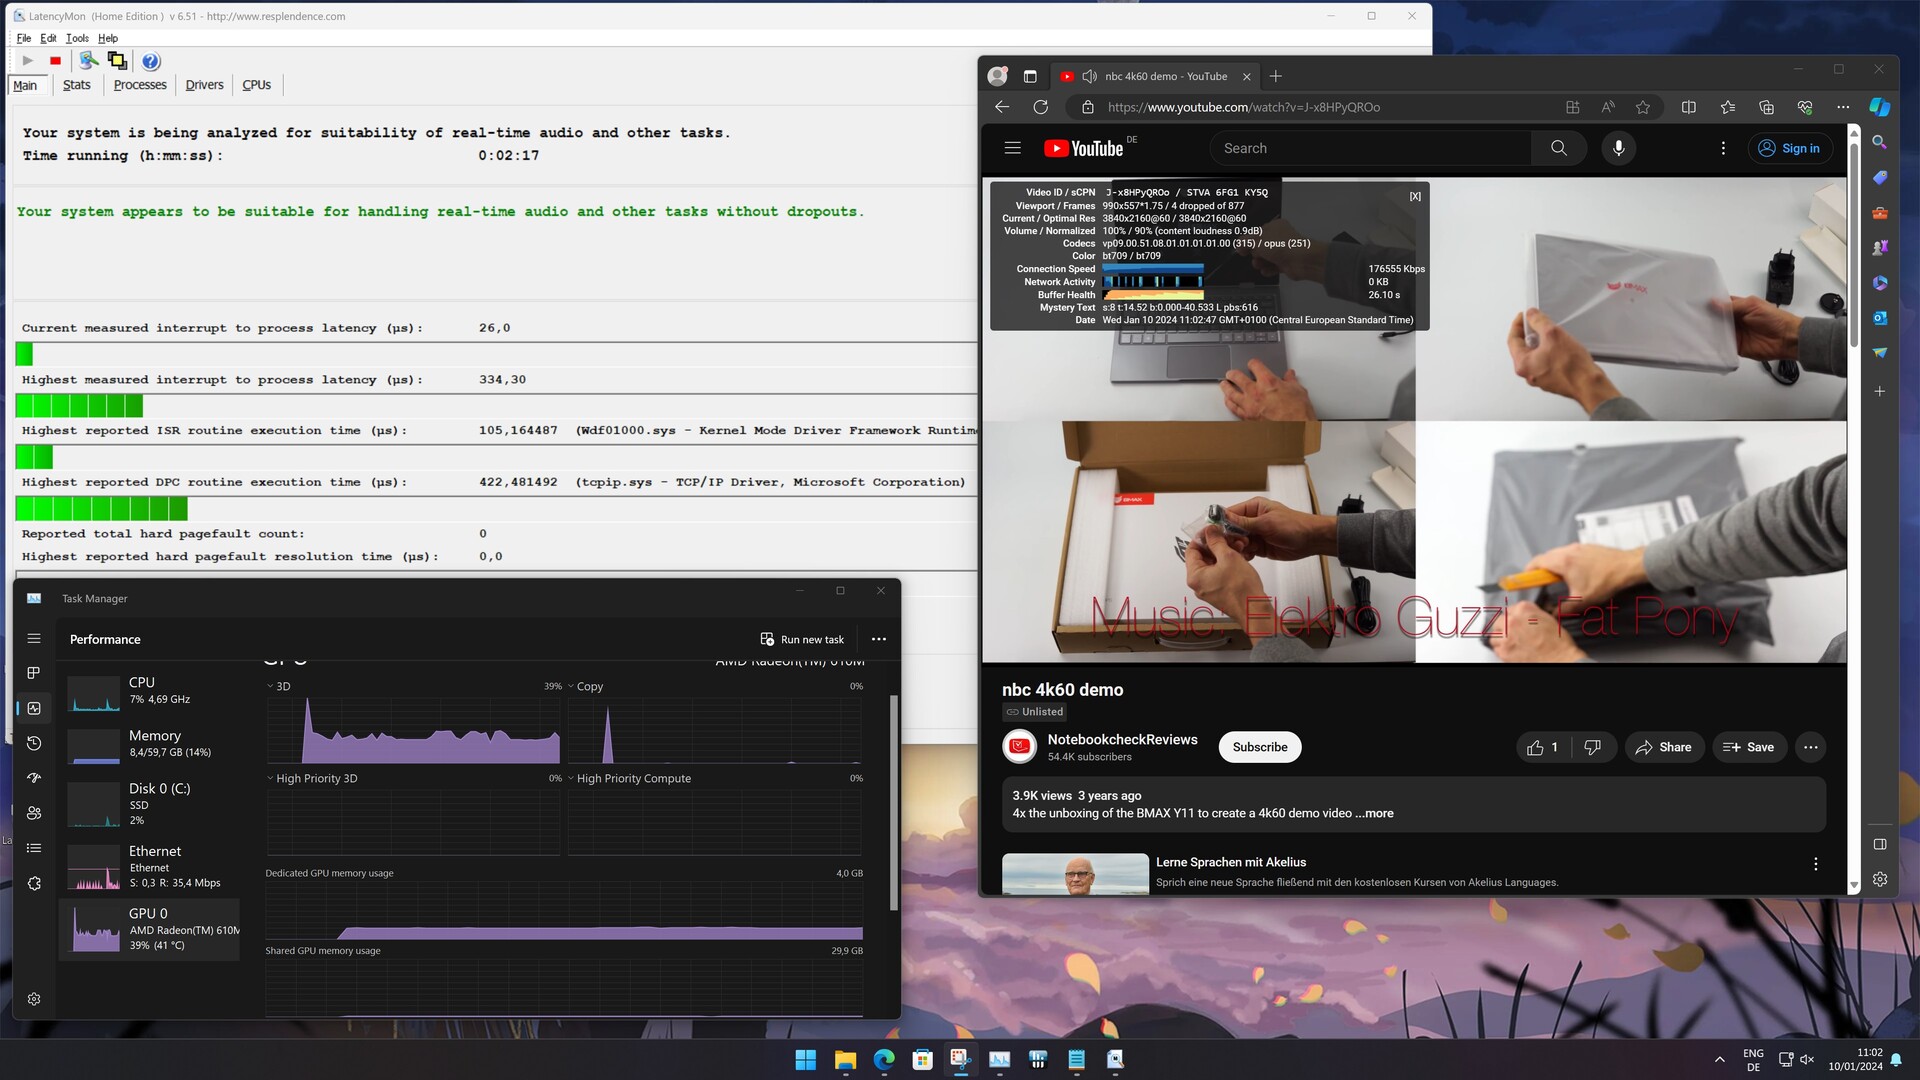
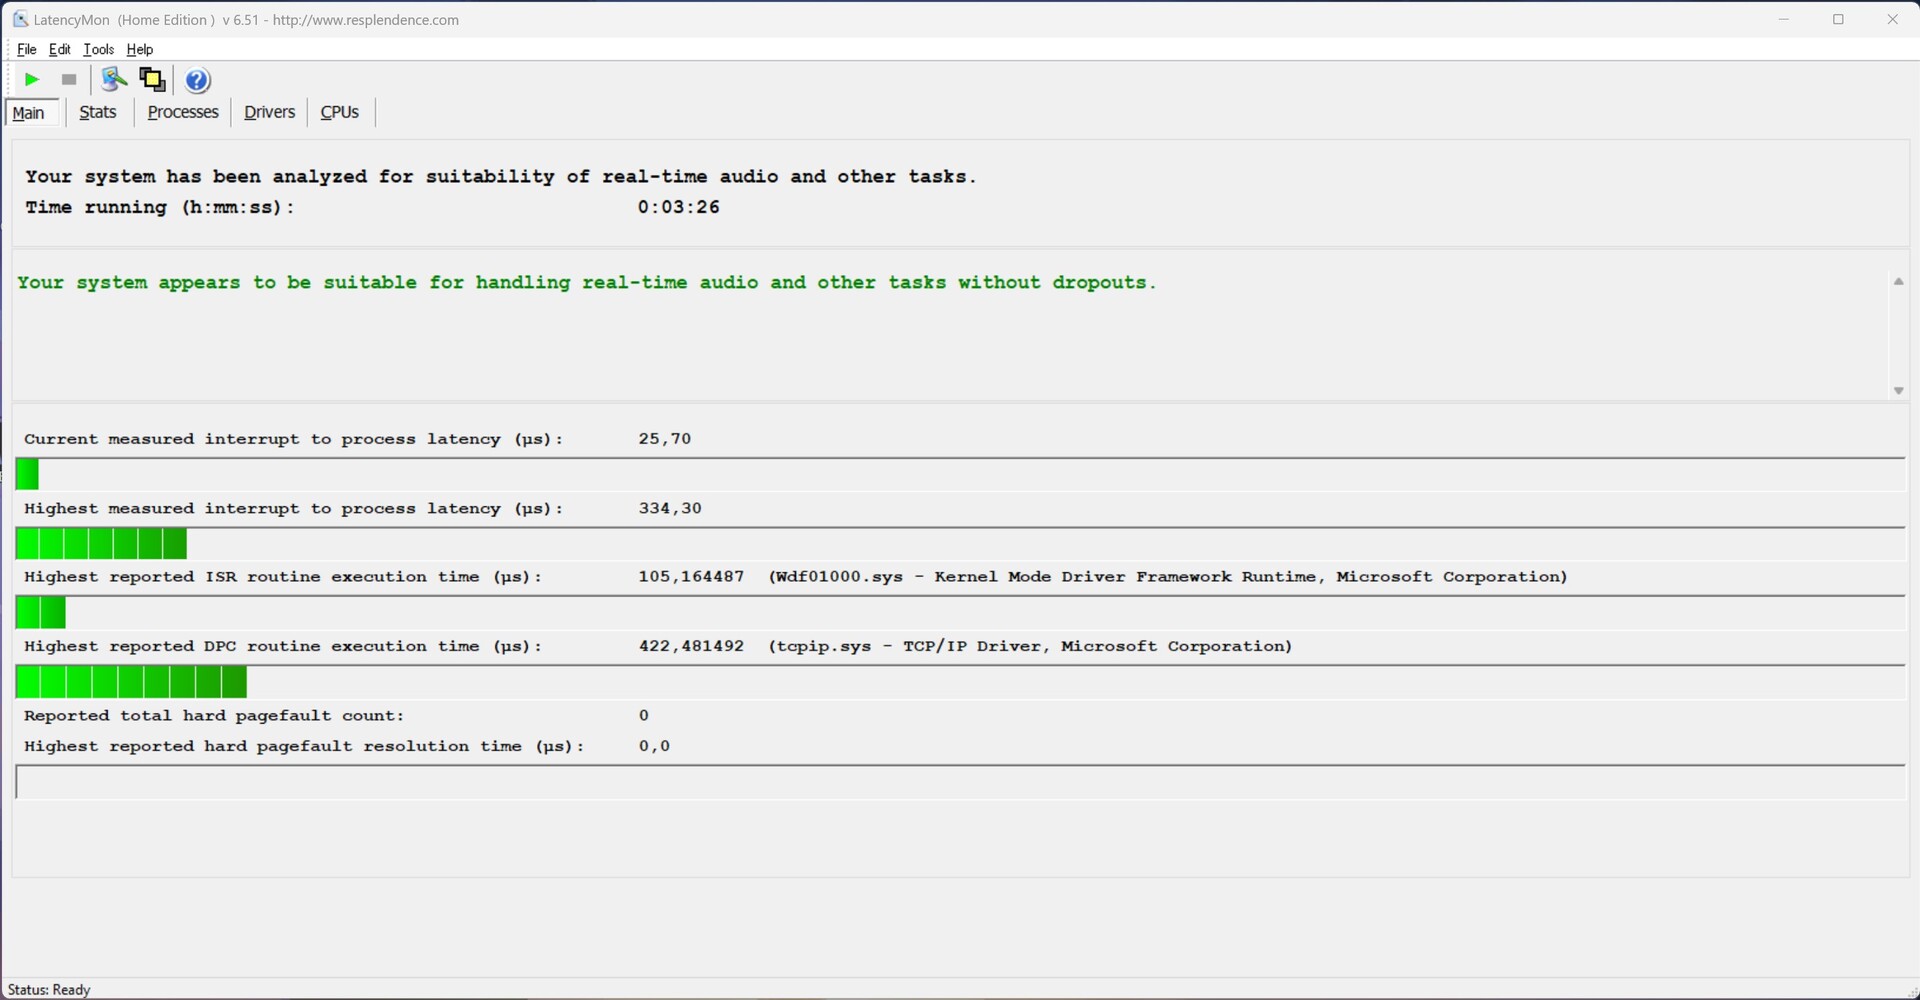
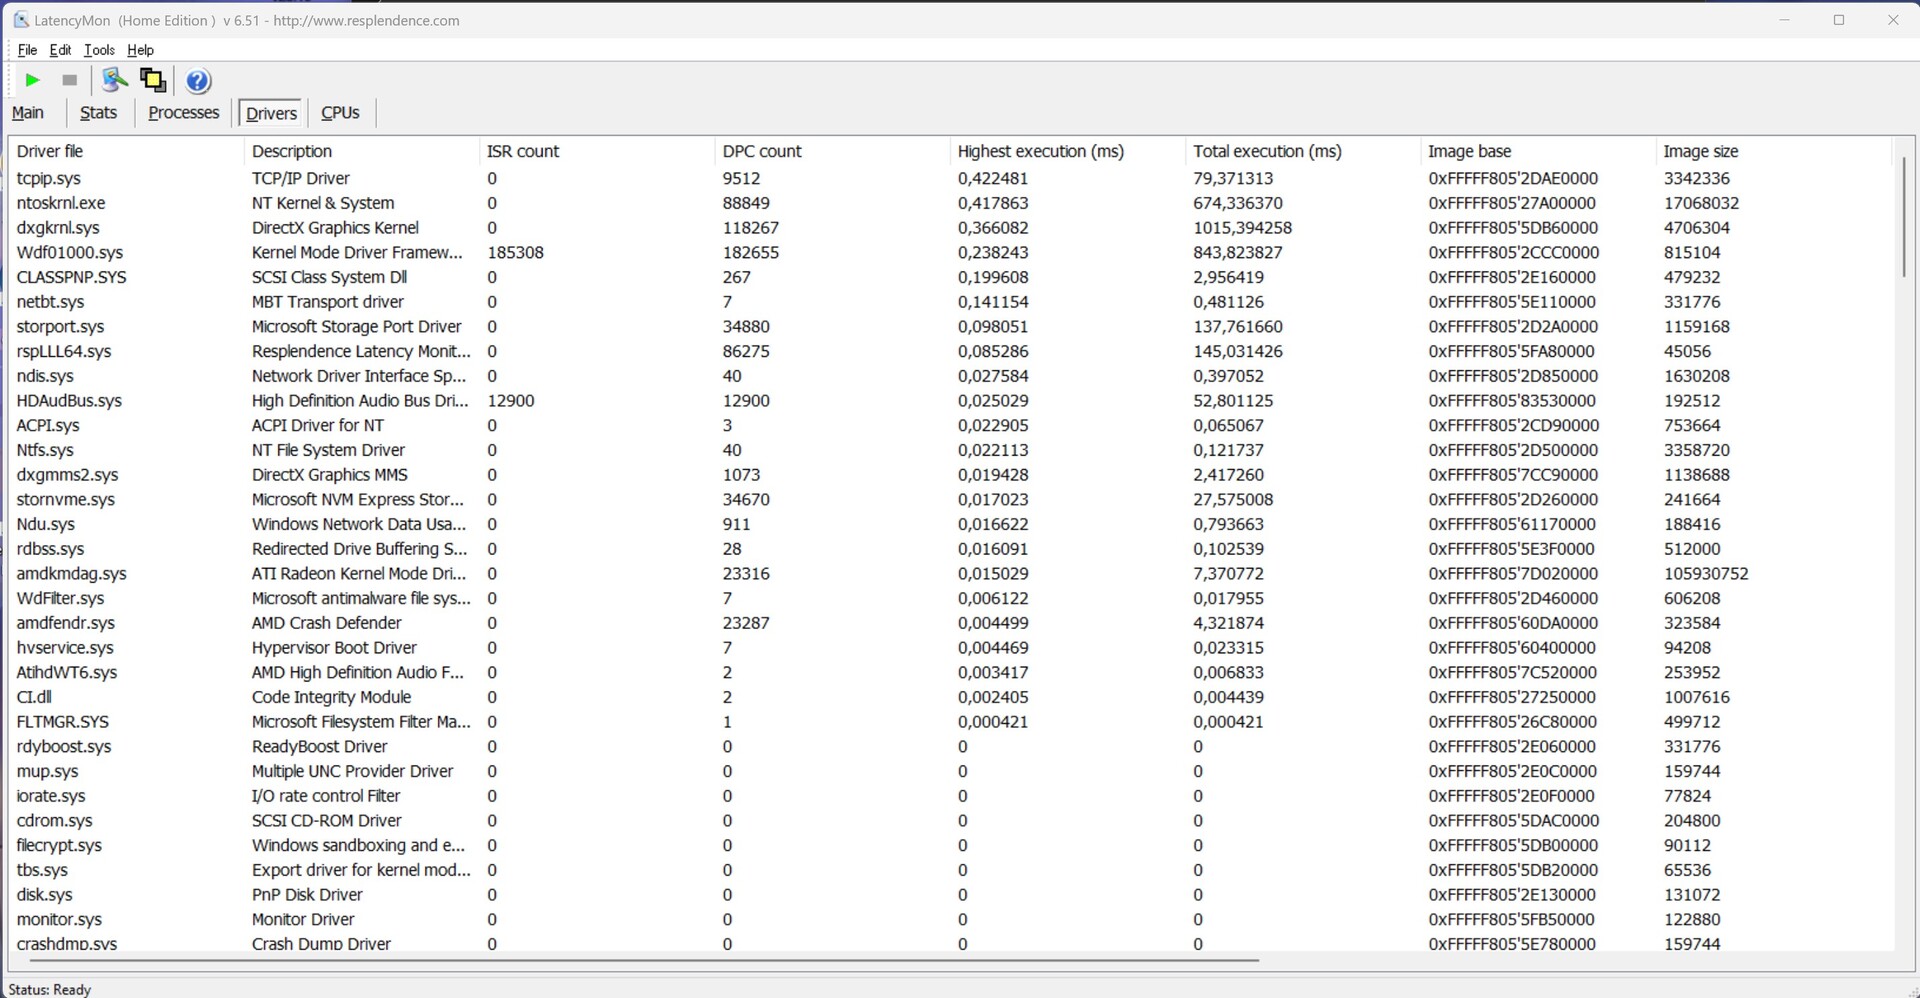
DPC 延迟
在围绕 Minisforum BD770i 构建的测试系统中,我们观察到的延迟非常低。无论是进行简单的互联网浏览还是播放 4K 测试视频,即使是 Prime95 压力测试也不会导致高延迟。因此,Minisforum BD770i 主板非常适合为客厅创建紧凑、安静的流媒体系统。
| DPC Latencies / LatencyMon - interrupt to process latency (max), Web, Youtube, Prime95 | |
| Minisforum EliteMini UM780 XTX | |
| Minisforum Venus Series UM790 Pro | |
| Minisforum BD770i | |
* ... smaller is better
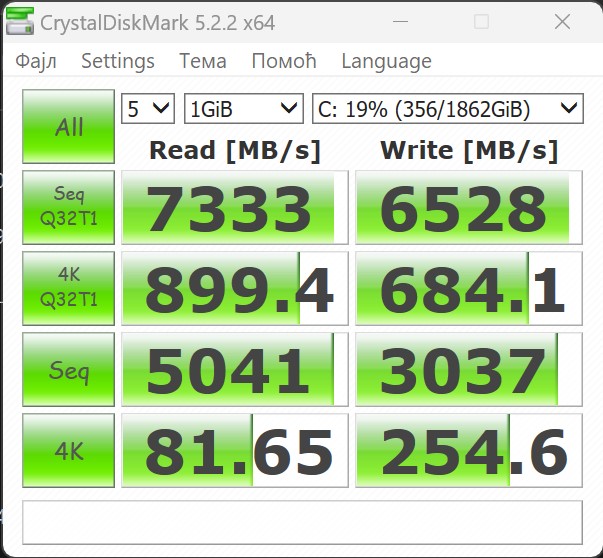
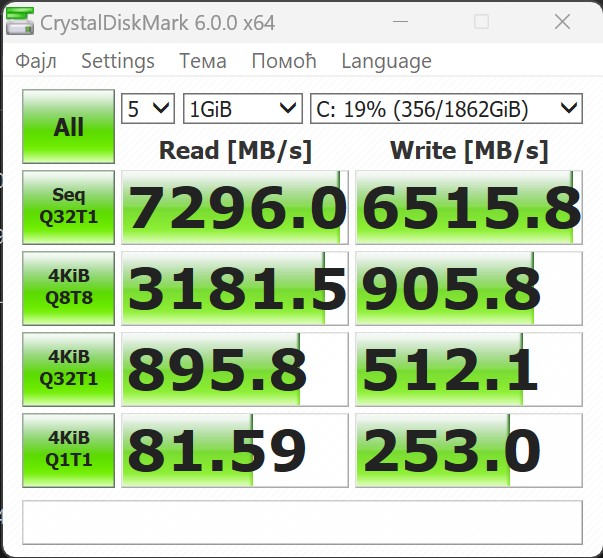
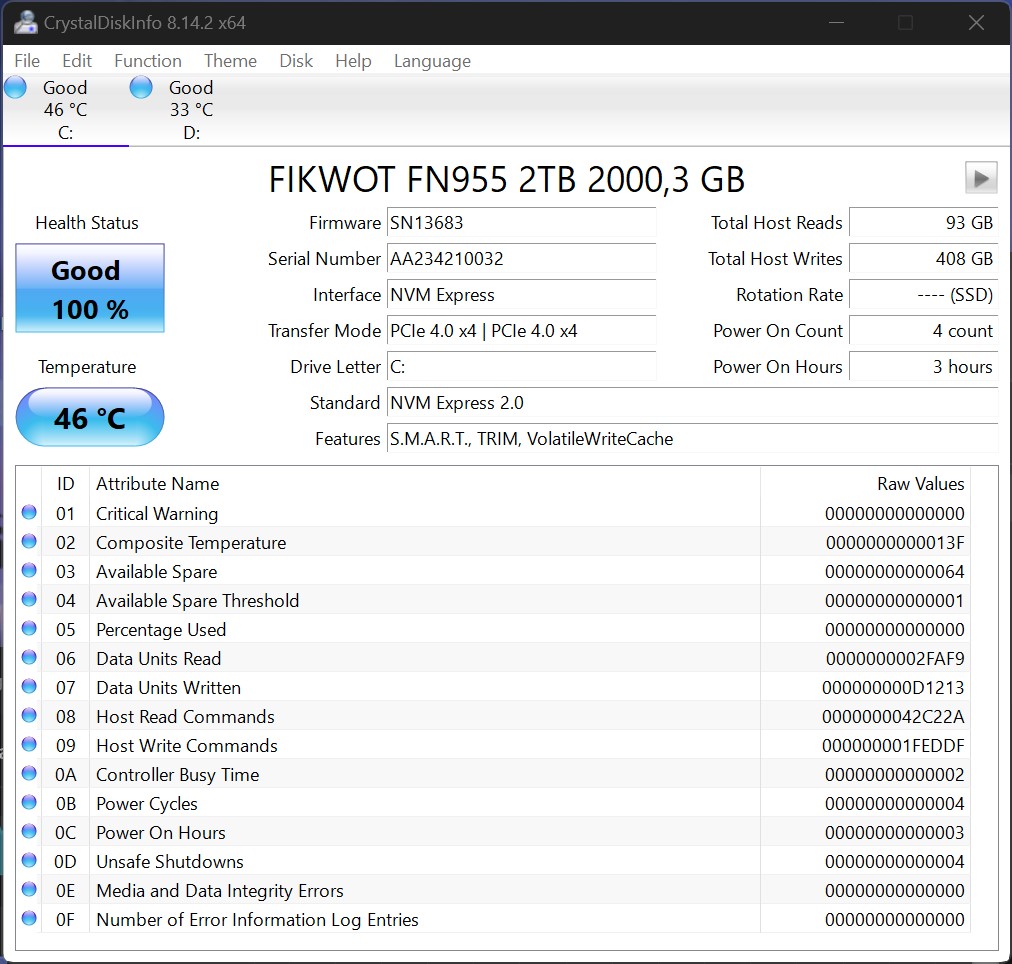
存储设备
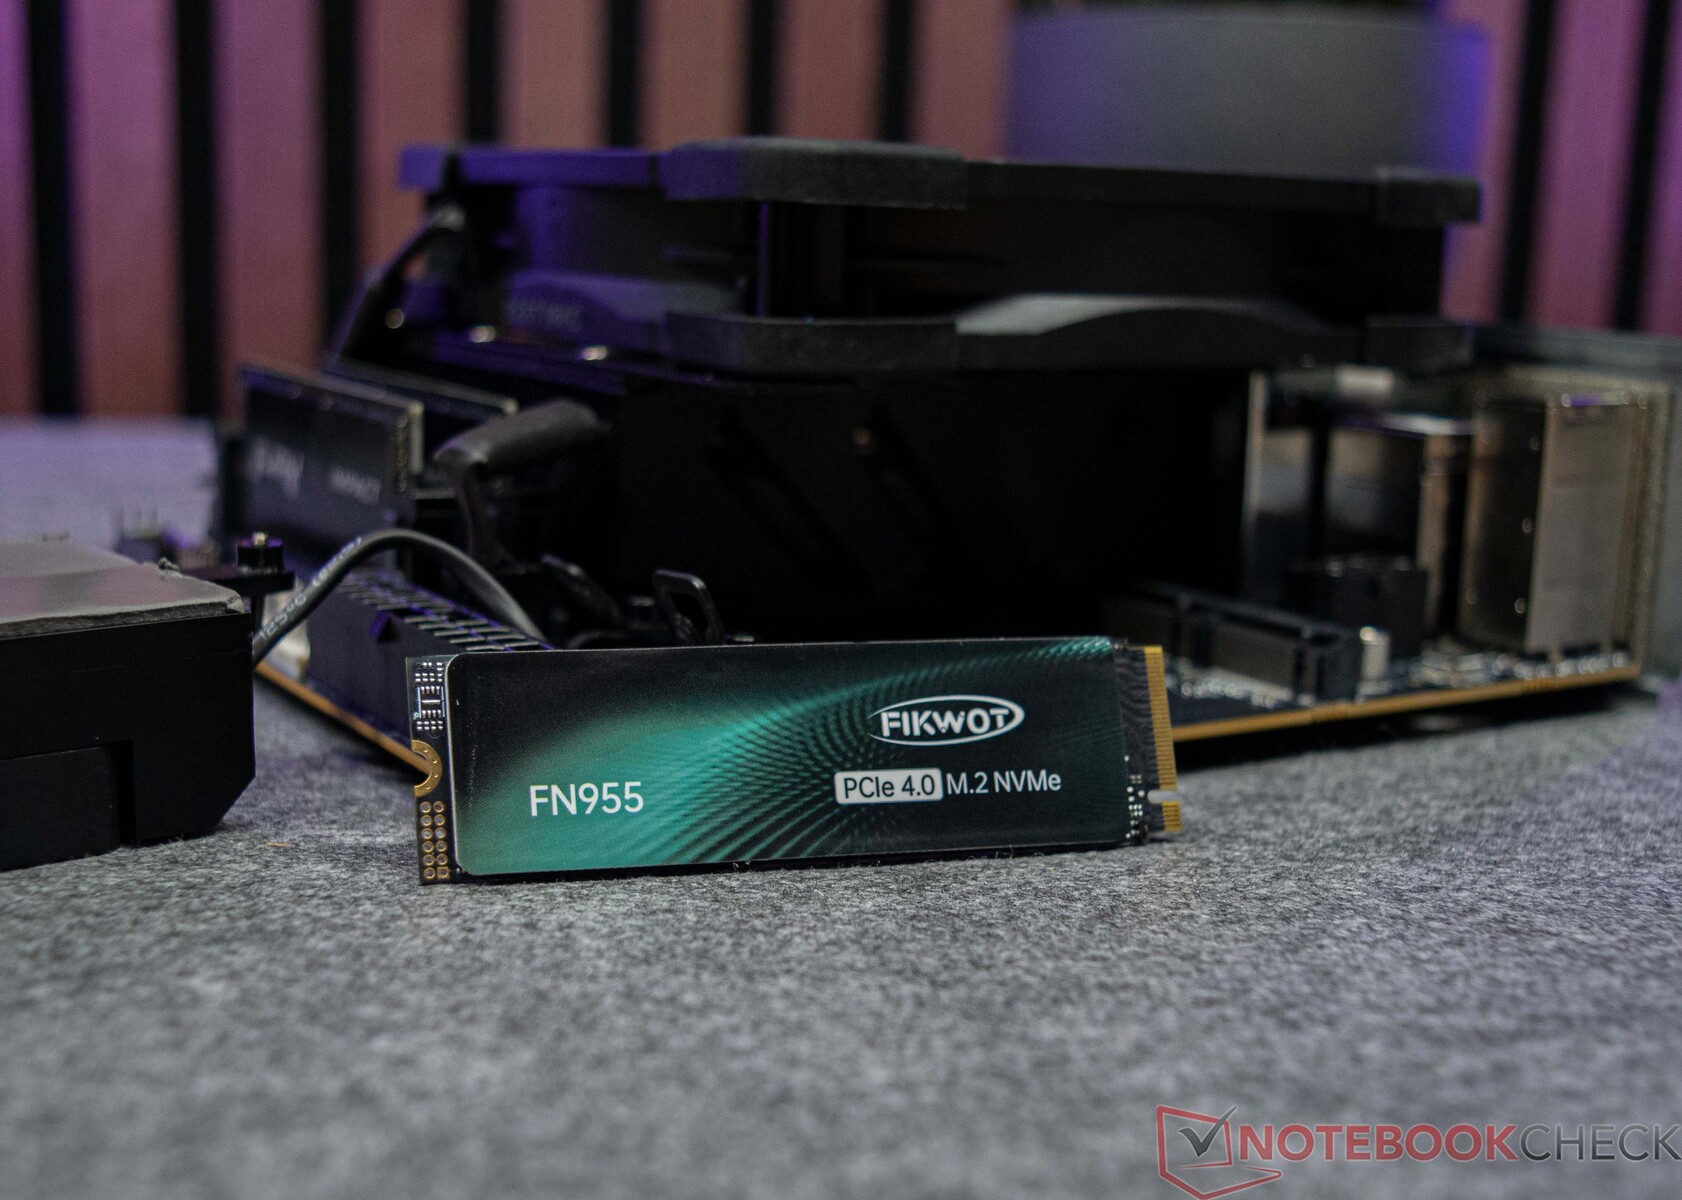
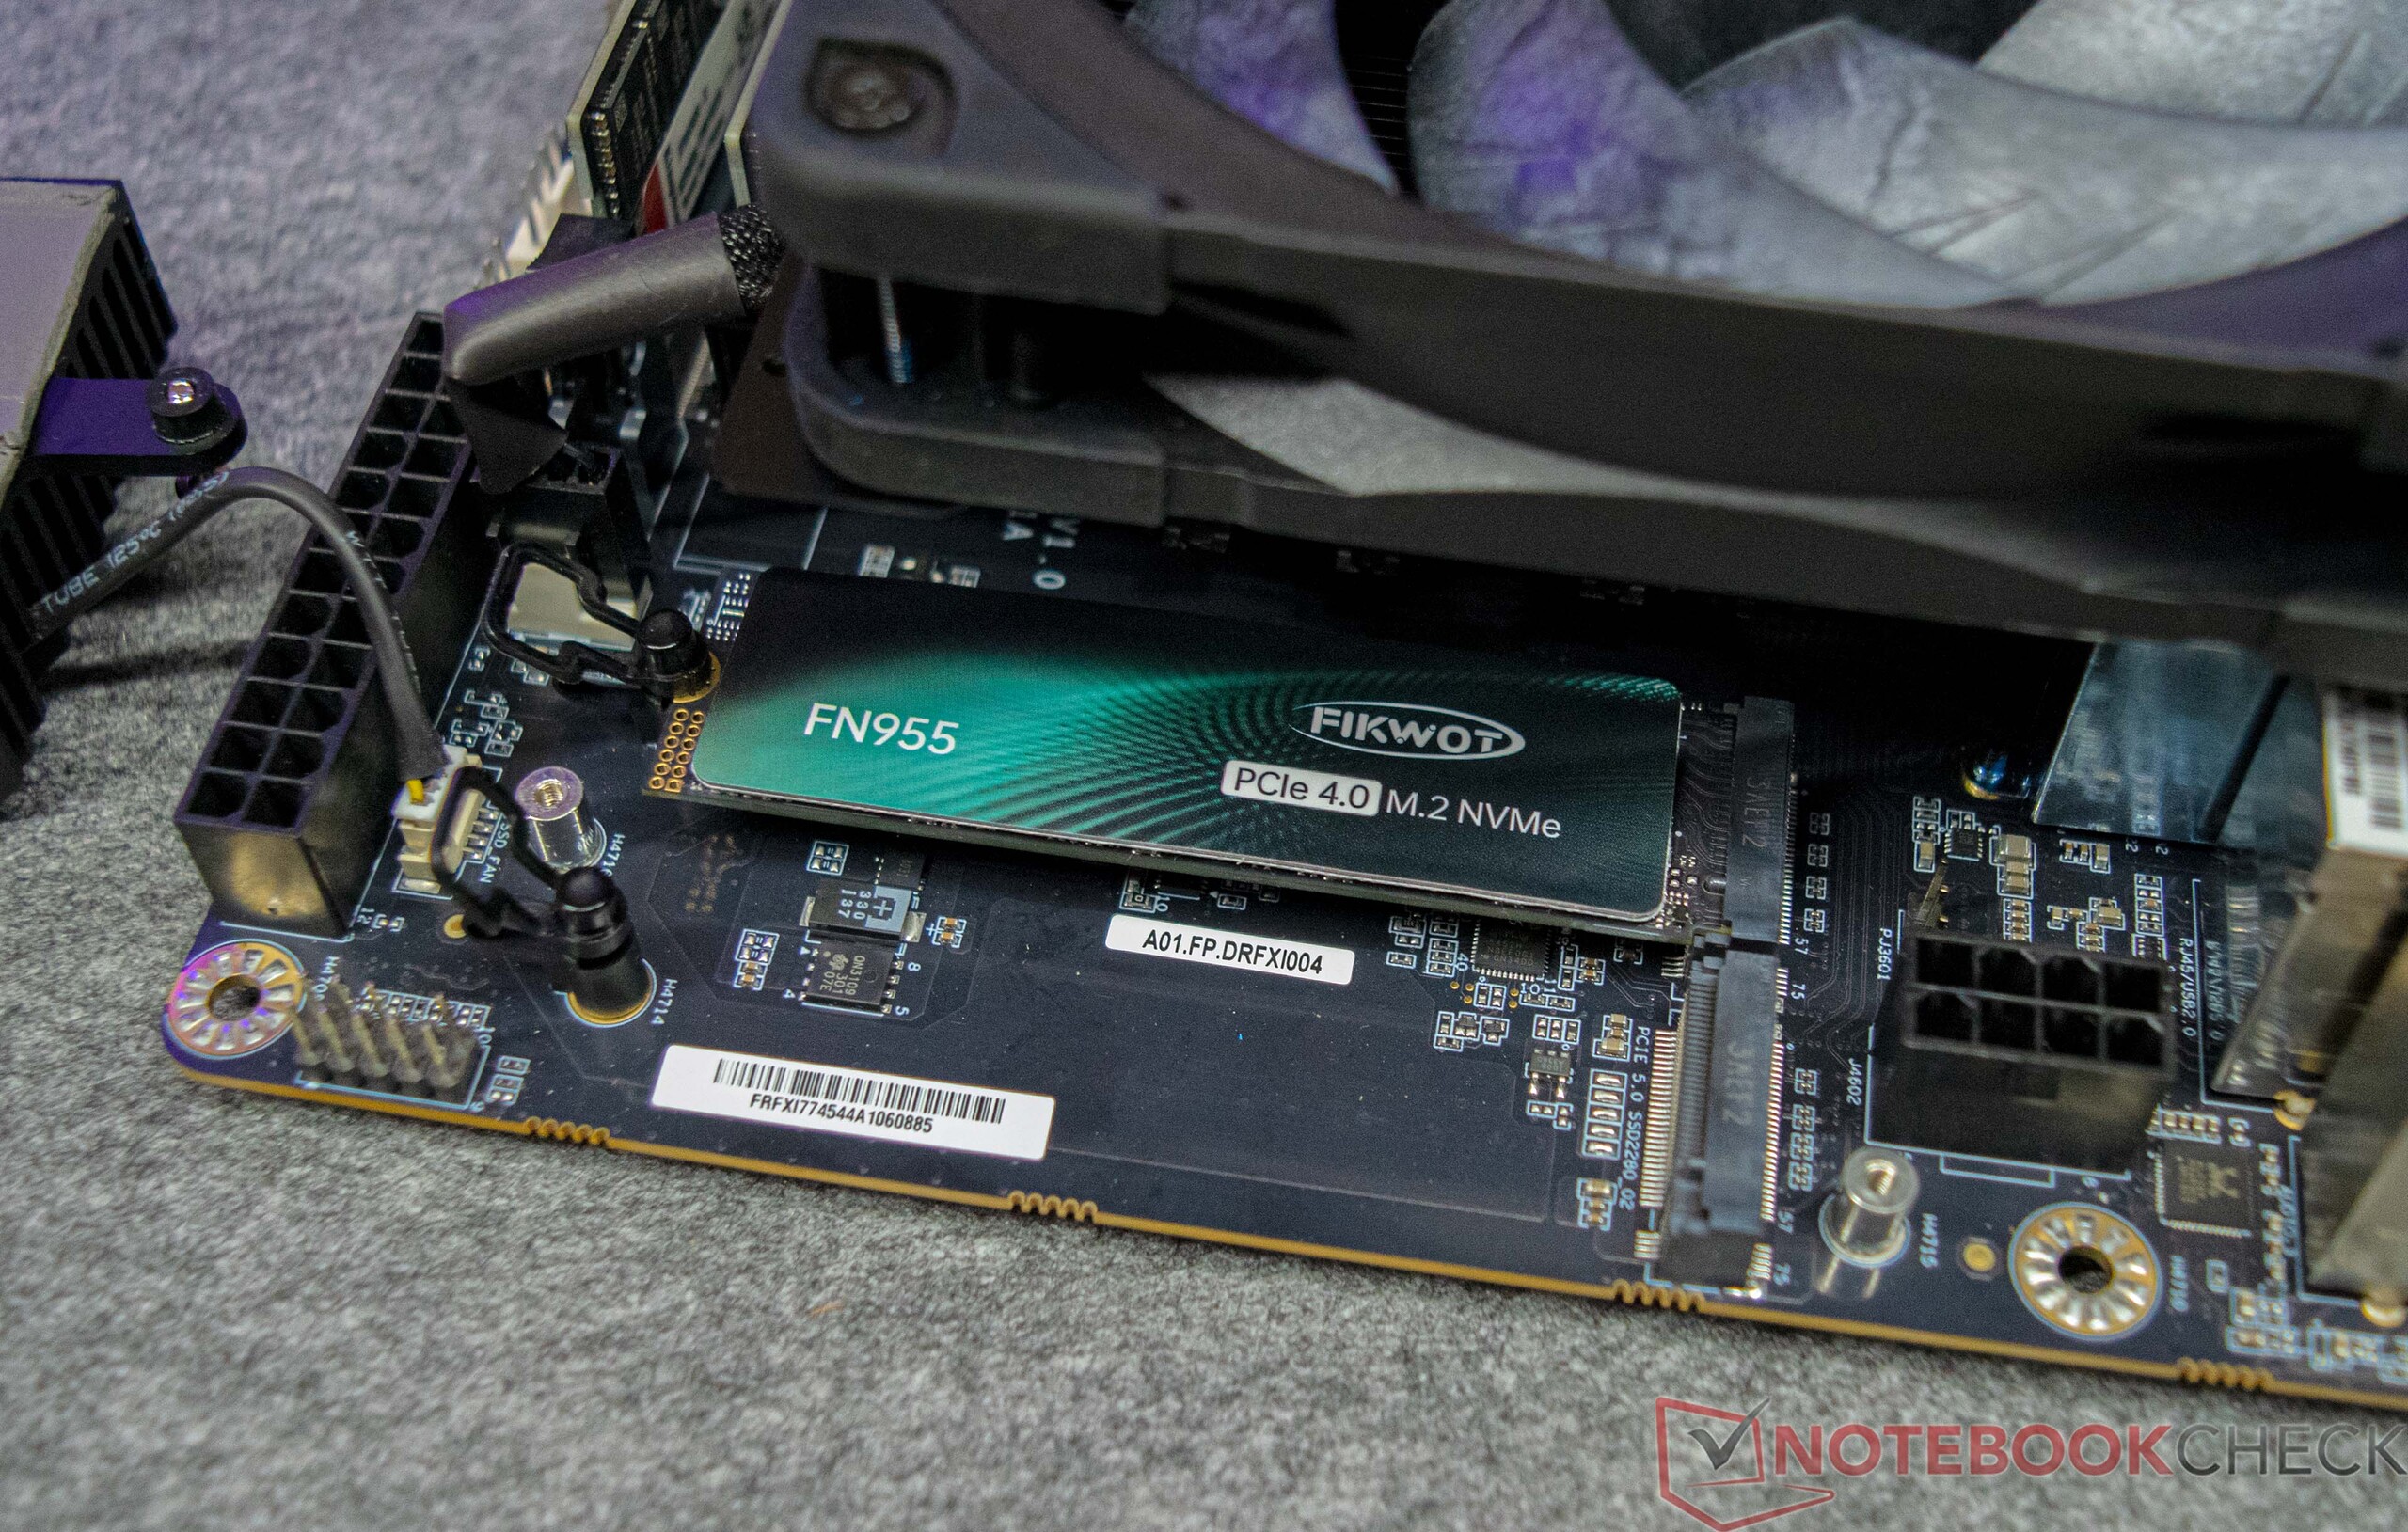
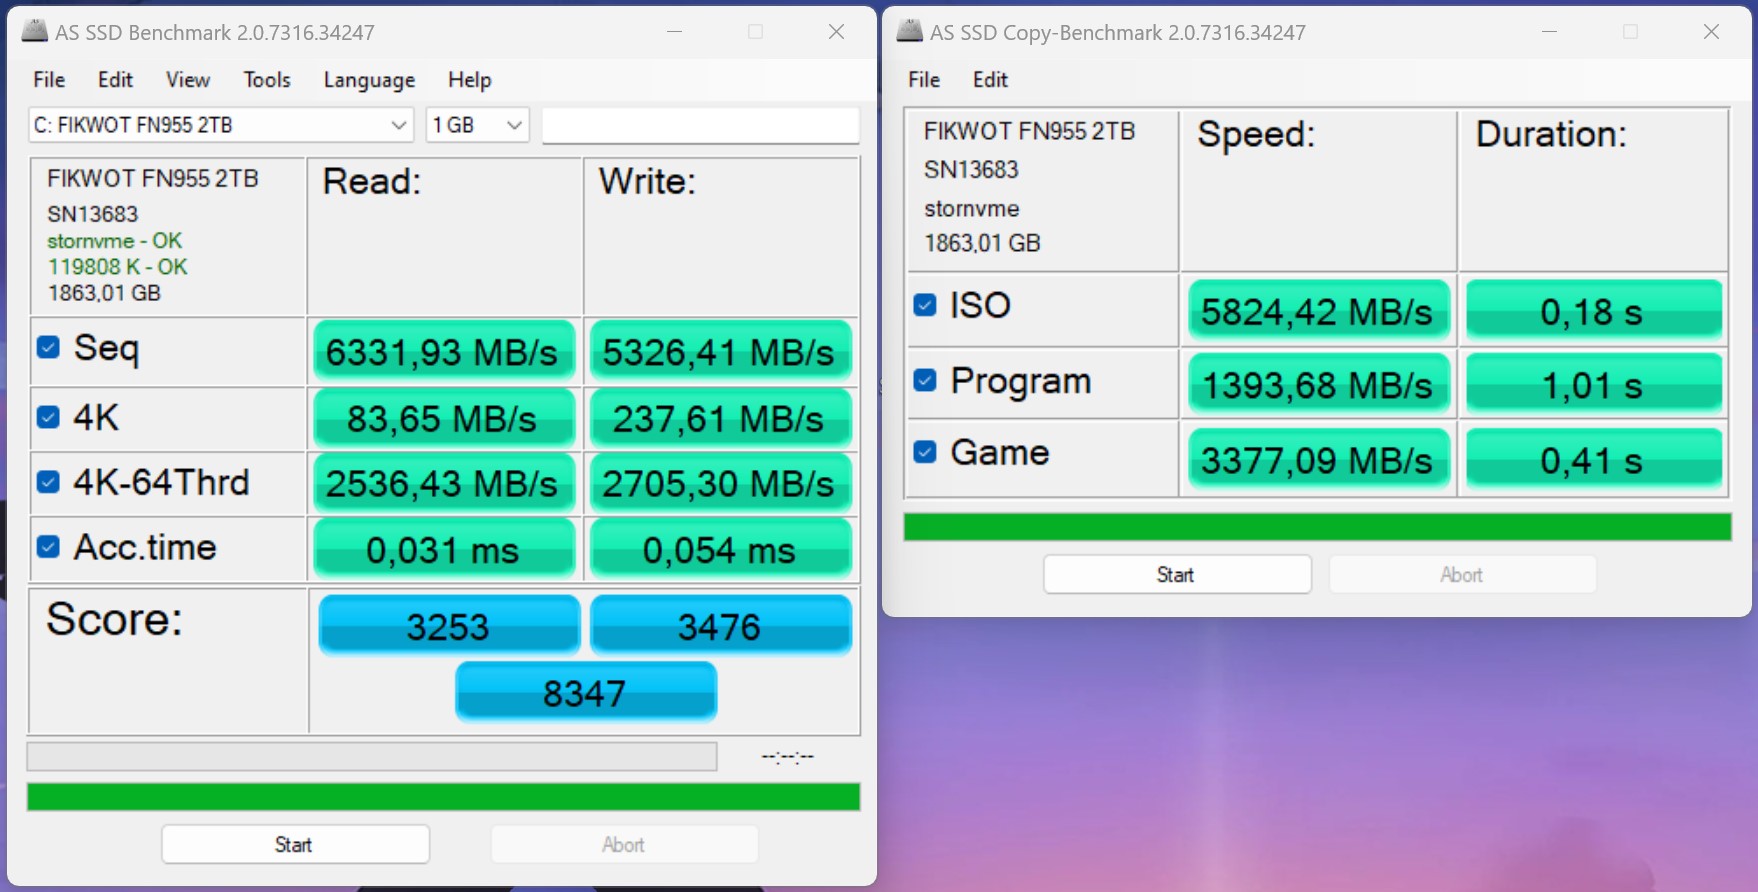
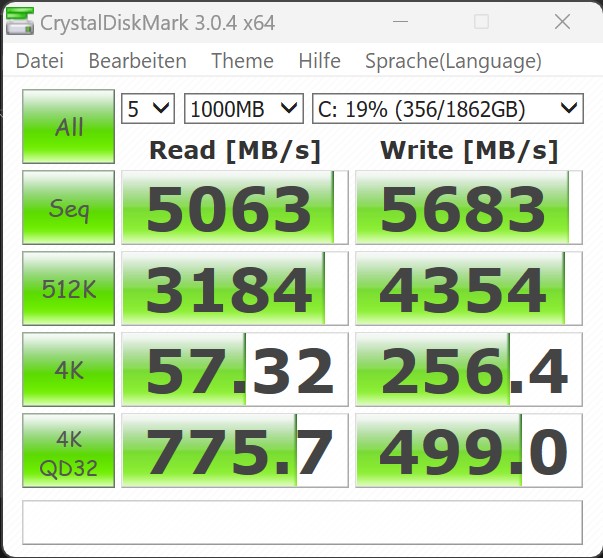
如前所述,Minisforum 提供的 BD770i 主板没有内置大容量存储器。为了测试目的,我们使用了制造商 Fikwot 提供的相对实惠的 2 TB SSD。该型号采用 M.2 接口,通过 PCIe 4.0 x4 连接,传输速率极高。主板最多可支持两个大容量存储设备,并兼容最新的 PCI 5.0 标准。固态硬盘还可配备主动冷却系统,这对 PCIe 5.0 固态硬盘尤为有利。在整个测试过程中,我们的固态硬盘在负载情况下没有出现热问题,性能保持稳定。
有关其他比较和基准,请参阅我们的 比较表.

"Reading continuous performance: DiskSpd Read Loop, Queue Depth 8 "
显卡 - AMD Radeon 610M 作为 iGPU
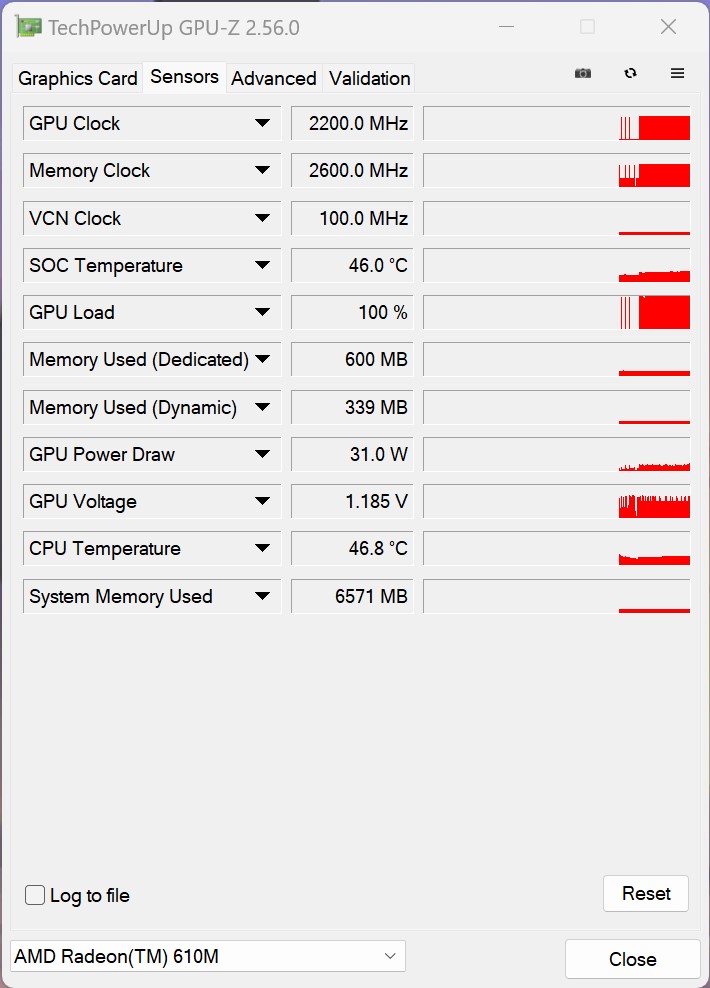
......(英文 AMD Ryzen 7 7745HX配备了 AMD Radeon 610MiGPU。不过,该 iGPU 基于 RDNA2 架构,仅提供 2 个计算单元 (CU),因此处理 3D 计算的着色器单元总数为 128 个。因此,AMD Radeon 610M 的性能相对一般。在我们的平均对比中,Minisforum BD770i 的 iGPU 性能超过了传统笔记本电脑,但仅限于简单的图形任务。考虑到这款入门级图形解决方案的局限性,除了简单的图像输出外,我们还应该控制对它的期望值。
有关其他比较和基准测试,请参阅我们的 图形处理器比较表.
| Performance rating - Percent | |
| Minisforum EliteMini UM780 XTX | |
| Minisforum Venus Series UM790 Pro | |
| Minisforum Mars Series MC560 | |
| NiPoGi AD08 | |
| Acemagic AD15 | |
| Minisforum BD770i | |
| Average AMD Radeon 610M | |
| Performance rating - Percent | |
| NiPoGi AD08 | |
| Minisforum EliteMini UM780 XTX | |
| Minisforum Venus Series UM790 Pro | |
| Average AMD Radeon 610M | |
| Acemagic AD15 | |
| Minisforum Mars Series MC560 | |
| Minisforum BD770i | |
| Unigine Valley 1.0 | |
| 1920x1080 Extreme HD DirectX AA:x8 | |
| Minisforum EliteMini UM780 XTX | |
| Minisforum Venus Series UM790 Pro | |
| Minisforum Mars Series MC560 | |
| NiPoGi AD08 | |
| Minisforum BD770i | |
| Average AMD Radeon 610M (9.8 - 10, n=4) | |
| Acemagic AD15 | |
| 1920x1080 Extreme HD Preset OpenGL AA:x8 | |
| Minisforum EliteMini UM780 XTX | |
| Minisforum Venus Series UM790 Pro | |
| NiPoGi AD08 | |
| Minisforum Mars Series MC560 | |
| Acemagic AD15 | |
| Minisforum BD770i | |
| Average AMD Radeon 610M (9.1 - 9.6, n=4) | |
| Affinity Photo 2 - Combined (Single / Multi GPU) | |
| NiPoGi AD08 | |
| Average AMD Radeon 610M (889 - 5750, n=4) | |
| Acemagic AD15 | |
| Minisforum EliteMini UM780 XTX | |
| Minisforum Mars Series MC560 | |
| Minisforum Venus Series UM790 Pro | |
| Minisforum BD770i | |
| 3DMark 06 Standard Score | 20555 points | |
| 3DMark Vantage P Result | 12092 points | |
| 3DMark 11 Performance | 3873 points | |
| 3DMark Ice Storm Standard Score | 41556 points | |
| 3DMark Cloud Gate Standard Score | 14629 points | |
| 3DMark Fire Strike Score | 2156 points | |
| 3DMark Fire Strike Extreme Score | 530 points | |
| 3DMark Time Spy Score | 740 points | |
Help | ||
游戏性能 - AMD Radeon 610M
如合成基准测试所示,只有有限的 3D 应用程序可以从 AMD Radeon 610M 的性能中获益。这一点在游戏测试中也很明显。集成图形处理器(iGPU)只能在最低图形设置和分辨率仅为 1,280 x 720 像素的情况下产生不错的帧速率。两台配备 AMD Radeon 780miGPU 的两台迷你电脑性能明显更好,但即使在这种情况下,当尝试玩现代游戏时,系统也会很快达到极限。目前所有的显卡都可以通过 PCI Express 接口轻松连接。
要全面了解 iGPU 与其他显卡相比的性能,请查阅我们的 GPU 游戏列表.
| The Witcher 3 | |
| 1024x768 Low Graphics & Postprocessing (sort by value) | |
| Minisforum EliteMini UM780 XTX | |
| Minisforum Venus Series UM790 Pro | |
| Minisforum BD770i | |
| NiPoGi AD08 | |
| Acemagic AD15 | |
| Minisforum Mars Series MC560 | |
| 1920x1080 High Graphics & Postprocessing (Nvidia HairWorks Off) (sort by value) | |
| Minisforum EliteMini UM780 XTX | |
| Minisforum Venus Series UM790 Pro | |
| Minisforum BD770i | |
| NiPoGi AD08 | |
| Acemagic AD15 | |
| Minisforum Mars Series MC560 | |
| Borderlands 3 | |
| 1280x720 Very Low Overall Quality (DX11) (sort by value) | |
| Minisforum EliteMini UM780 XTX | |
| Minisforum Venus Series UM790 Pro | |
| Minisforum BD770i | |
| NiPoGi AD08 | |
| Acemagic AD15 | |
| Minisforum Mars Series MC560 | |
| 1920x1080 High Overall Quality (DX11) (sort by value) | |
| Minisforum EliteMini UM780 XTX | |
| Minisforum Venus Series UM790 Pro | |
| Minisforum BD770i | |
| NiPoGi AD08 | |
| Acemagic AD15 | |
| Minisforum Mars Series MC560 | |
| GTA V | |
| 1024x768 Lowest Settings possible (sort by value) | |
| Minisforum EliteMini UM780 XTX | |
| Minisforum Venus Series UM790 Pro | |
| Minisforum BD770i | |
| NiPoGi AD08 | |
| Acemagic AD15 | |
| Minisforum Mars Series MC560 | |
| 1920x1080 High/On (Advanced Graphics Off) AA:2xMSAA + FX AF:8x (sort by value) | |
| Minisforum EliteMini UM780 XTX | |
| Minisforum Venus Series UM790 Pro | |
| Minisforum BD770i | |
| NiPoGi AD08 | |
| Acemagic AD15 | |
| Minisforum Mars Series MC560 | |
| Tiny Tina's Wonderlands | |
| 1280x720 Lowest Preset (DX12) (sort by value) | |
| Minisforum EliteMini UM780 XTX | |
| Minisforum Venus Series UM790 Pro | |
| Minisforum BD770i | |
| Acemagic AD15 | |
| Minisforum Mars Series MC560 | |
| 1920x1080 High Preset (DX12) (sort by value) | |
| Minisforum EliteMini UM780 XTX | |
| Minisforum Venus Series UM790 Pro | |
| Minisforum BD770i | |
| Acemagic AD15 | |
| Minisforum Mars Series MC560 | |
| Metro Exodus | |
| 1280x720 Low Quality AF:4x (sort by value) | |
| Minisforum EliteMini UM780 XTX | |
| Minisforum Venus Series UM790 Pro | |
| Minisforum BD770i | |
| NiPoGi AD08 | |
| 1920x1080 High Quality AF:16x (sort by value) | |
| Minisforum EliteMini UM780 XTX | |
| Minisforum Venus Series UM790 Pro | |
| Minisforum BD770i | |
| NiPoGi AD08 | |
| Shadow of the Tomb Raider | |
| 1280x720 Lowest Preset (sort by value) | |
| Minisforum EliteMini UM780 XTX | |
| Minisforum Venus Series UM790 Pro | |
| Minisforum BD770i | |
| NiPoGi AD08 | |
| Acemagic AD15 | |
| 1920x1080 High Preset AA:SM (sort by value) | |
| Minisforum EliteMini UM780 XTX | |
| Minisforum Venus Series UM790 Pro | |
| Minisforum BD770i | |
| NiPoGi AD08 | |
| Acemagic AD15 | |
| low | med. | high | ultra | |
|---|---|---|---|---|
| GTA V (2015) | 134.5 | 101.9 | 23.1 | 10.5 |
| The Witcher 3 (2015) | 44 | 26.2 | 13.5 | 8.49 |
| Final Fantasy XV Benchmark (2018) | 26.8 | 12.3 | 8.79 | |
| X-Plane 11.11 (2018) | 44.7 | 26.2 | 22.9 | |
| Far Cry 5 (2018) | 34 | 15 | 14 | 13 |
| Strange Brigade (2018) | 67.7 | 21.4 | 17 | |
| Shadow of the Tomb Raider (2018) | 40 | 14 | 12.6 | 10.5 |
| Far Cry New Dawn (2019) | 35 | 17 | 16 | 14 |
| Metro Exodus (2019) | 28.4 | 11.8 | 8.4 | 6.95 |
| Borderlands 3 (2019) | 40.3 | 14.9 | 9.04 | 6.48 |
| Tiny Tina's Wonderlands (2022) | 18.1 | 14.5 | 9.24 | 6.92 |
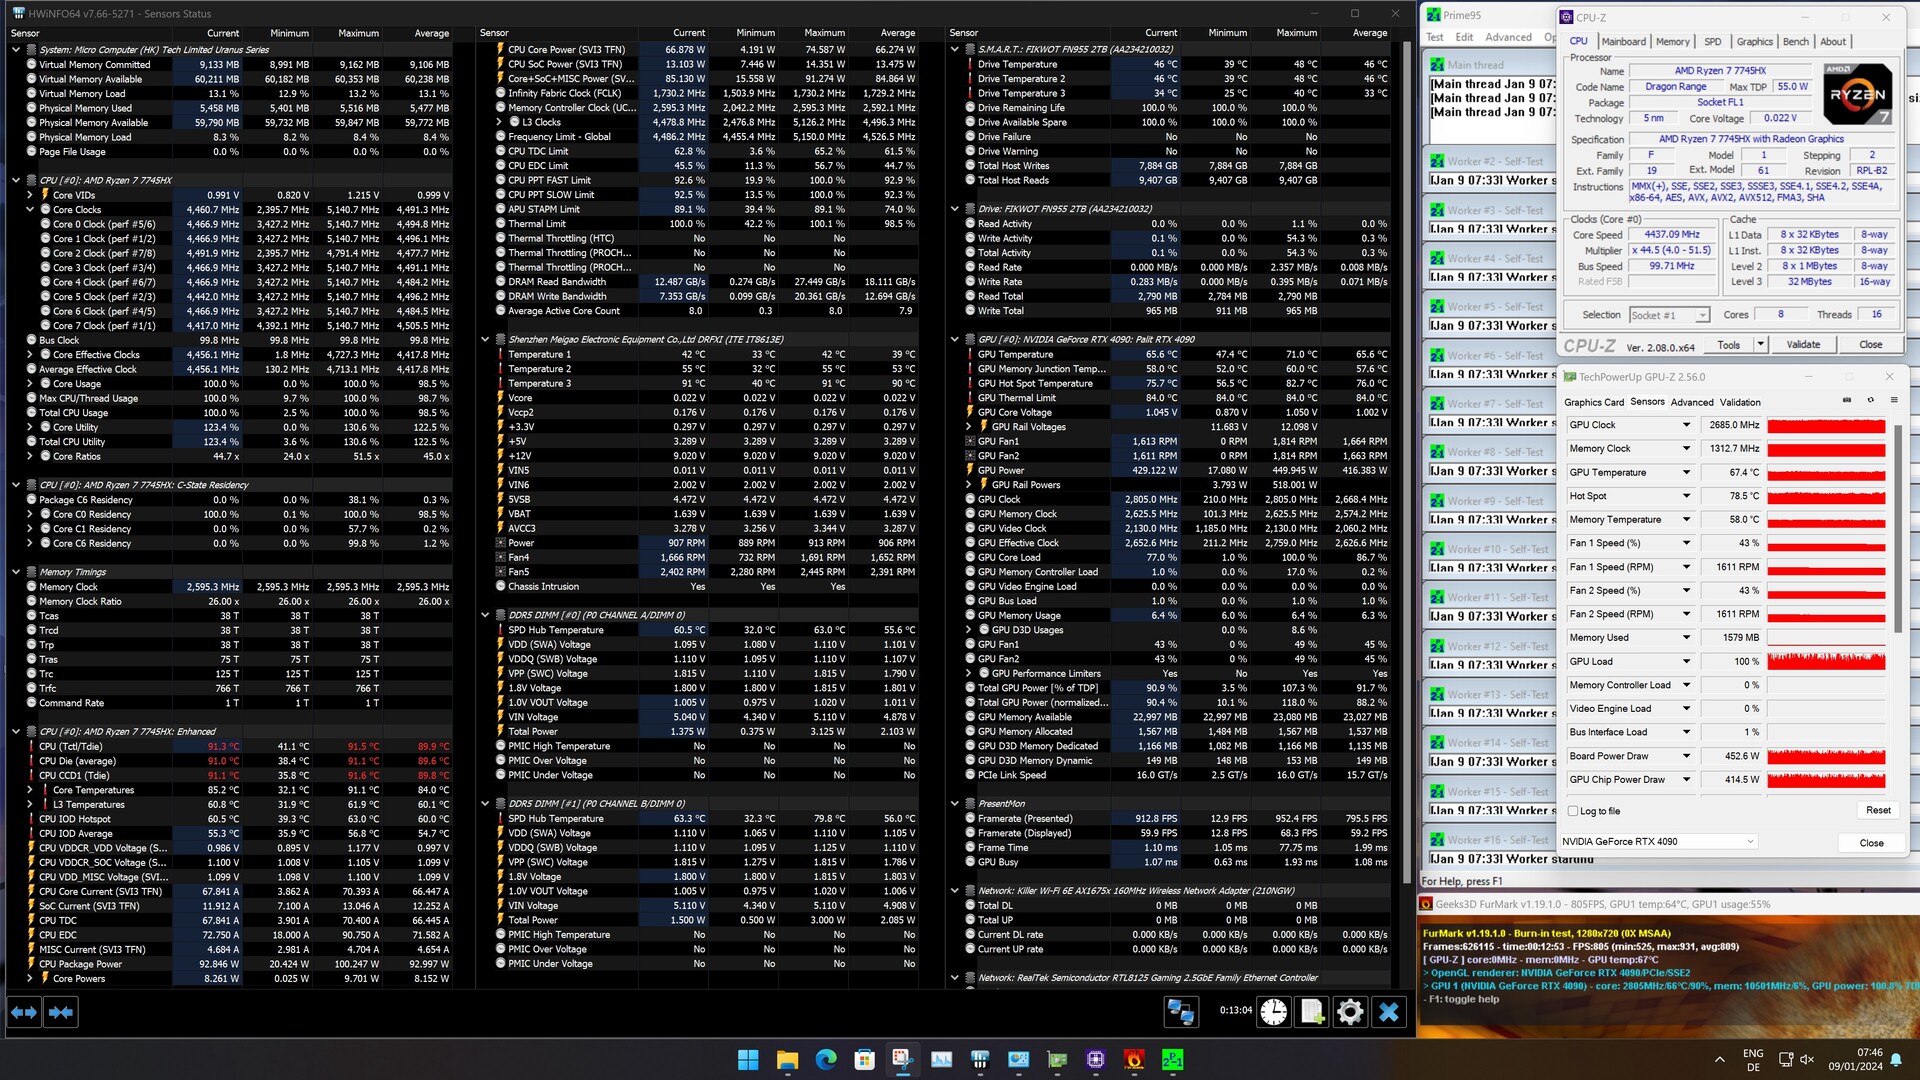
配备 NvidiaGeForce RTX 4090 的 Minisforum BD770i
如果您打算使用 Minisforum BD770i 主板作为游戏系统的基础,可以毫不犹豫地继续使用。AMD Ryzen 7 7745HX 拥有充足的性能储备,可与当前系统媲美。在合成基准测试中,我们的测试系统甚至能稳居第三。不过,由于显卡的尺寸问题,我们不得不使用开放式配置的 Minisforum BD770i 进行这些测试。 PaitGeForce RTX 4090 Gamerock OC对于 Phanteks Enthoo Evolv Shift XT 机箱来说太大了。
在游戏基准测试方面,关键是要区别对待:在确定纯 CPU 性能时,必须保持在 CPU 的极限范围内。在这种情况下,AMD Ryzen 7 7745HX 与Intel Core i7-13700 相当,甚至Intel Core i7-13700K 也无法超越它。在更高的细节级别和最高设置下,我们测试样本的排名保持一致。Minisforum BD770i 主板继续与英特尔酷睿 i7-13700 竞争,在单独测试时,AMD Ryzen 7 7745HX 搭配 PalitGeForce RTX 4090 Gamerock OC,在某些情况下可以与顶级型号竞争。在此配置下,所有当前的游戏均可在 2160p 下流畅播放,且不会损失任何细节。
本比较中列出的所有系统均使用同一款显卡进行测试,即PaitGeForce RTX 4090 Gamerock OC 。
使用 NvidiaGeForce RTX 4090 时需要注意:
我们测试的 Minisforum BD770i 样品在测试期间没有配备最新的 BIOS。因此,显卡只能连接 PCIe 4.0 x1。1.05 版是唯一能让显卡以最大带宽运行的版本,可在支持网站上找到。BIOS 更新过程可直接从 Windows 启动。
| Performance rating - Percent | |
| NVIDIA GeForce RTX 4090, Intel Core i9-14900K | |
| NVIDIA GeForce RTX 4090, Intel Core i5-14600K | |
| NVIDIA GeForce RTX 4090, AMD Ryzen 7 7745HX | |
| NVIDIA GeForce RTX 4090, AMD Ryzen 9 7950X | |
| NVIDIA GeForce RTX 4090, AMD Ryzen 7 7800X3D | |
| NVIDIA GeForce RTX 4090, Intel Core i7-13700 | |
| NVIDIA GeForce RTX 4090, Intel Core i7-12700 | |
| NVIDIA GeForce RTX 4090, Intel Core i5-13400 | |
| NVIDIA GeForce RTX 4090, Intel Core i5-12400F -6! | |
| 3DMark 11 - 1280x720 Performance GPU | |
| NVIDIA GeForce RTX 4090, AMD Ryzen 7 7745HX | |
| NVIDIA GeForce RTX 4090, AMD Ryzen 7 7800X3D | |
| NVIDIA GeForce RTX 4090, Intel Core i5-14600K | |
| NVIDIA GeForce RTX 4090, AMD Ryzen 9 7950X | |
| NVIDIA GeForce RTX 4090, Intel Core i7-13700 | |
| NVIDIA GeForce RTX 4090, Intel Core i7-12700 | |
| NVIDIA GeForce RTX 4090, Intel Core i5-13400 | |
| NVIDIA GeForce RTX 4090, Intel Core i9-14900K | |
| NVIDIA GeForce RTX 4090, Intel Core i5-12400F | |
| 3DMark | |
| 2560x1440 Time Spy Graphics | |
| NVIDIA GeForce RTX 4090, AMD Ryzen 7 7745HX | |
| NVIDIA GeForce RTX 4090, Intel Core i5-14600K | |
| NVIDIA GeForce RTX 4090, Intel Core i9-14900K | |
| NVIDIA GeForce RTX 4090, AMD Ryzen 7 7800X3D | |
| NVIDIA GeForce RTX 4090, Intel Core i7-13700 | |
| NVIDIA GeForce RTX 4090, AMD Ryzen 9 7950X | |
| NVIDIA GeForce RTX 4090, Intel Core i7-12700 | |
| NVIDIA GeForce RTX 4090, Intel Core i5-13400 | |
| NVIDIA GeForce RTX 4090, Intel Core i5-12400F | |
| 1920x1080 Fire Strike Graphics | |
| NVIDIA GeForce RTX 4090, AMD Ryzen 7 7745HX | |
| NVIDIA GeForce RTX 4090, Intel Core i5-14600K | |
| NVIDIA GeForce RTX 4090, Intel Core i5-12400F | |
| NVIDIA GeForce RTX 4090, Intel Core i7-12700 | |
| NVIDIA GeForce RTX 4090, Intel Core i7-13700 | |
| NVIDIA GeForce RTX 4090, Intel Core i5-13400 | |
| NVIDIA GeForce RTX 4090, AMD Ryzen 7 7800X3D | |
| NVIDIA GeForce RTX 4090, AMD Ryzen 9 7950X | |
| NVIDIA GeForce RTX 4090, Intel Core i9-14900K | |
| 3840x2160 Fire Strike Ultra Graphics | |
| NVIDIA GeForce RTX 4090, AMD Ryzen 7 7800X3D | |
| NVIDIA GeForce RTX 4090, AMD Ryzen 7 7745HX | |
| NVIDIA GeForce RTX 4090, Intel Core i5-14600K | |
| NVIDIA GeForce RTX 4090, Intel Core i7-13700 | |
| NVIDIA GeForce RTX 4090, Intel Core i5-13400 | |
| NVIDIA GeForce RTX 4090, AMD Ryzen 9 7950X | |
| NVIDIA GeForce RTX 4090, Intel Core i9-14900K | |
| NVIDIA GeForce RTX 4090, Intel Core i7-12700 | |
| NVIDIA GeForce RTX 4090, Intel Core i5-12400F | |
| Unigine Superposition | |
| 1280x720 720p Low | |
| NVIDIA GeForce RTX 4090, Intel Core i9-14900K | |
| NVIDIA GeForce RTX 4090, AMD Ryzen 7 7800X3D | |
| NVIDIA GeForce RTX 4090, AMD Ryzen 9 7950X | |
| NVIDIA GeForce RTX 4090, AMD Ryzen 7 7745HX | |
| NVIDIA GeForce RTX 4090, Intel Core i7-13700 | |
| NVIDIA GeForce RTX 4090, Intel Core i5-14600K | |
| NVIDIA GeForce RTX 4090, Intel Core i7-12700 | |
| NVIDIA GeForce RTX 4090, Intel Core i5-13400 | |
| NVIDIA GeForce RTX 4090, Intel Core i5-12400F | |
| 1920x1080 1080p High | |
| NVIDIA GeForce RTX 4090, Intel Core i9-14900K | |
| NVIDIA GeForce RTX 4090, AMD Ryzen 7 7800X3D | |
| NVIDIA GeForce RTX 4090, AMD Ryzen 9 7950X | |
| NVIDIA GeForce RTX 4090, AMD Ryzen 7 7745HX | |
| NVIDIA GeForce RTX 4090, Intel Core i7-13700 | |
| NVIDIA GeForce RTX 4090, Intel Core i5-14600K | |
| NVIDIA GeForce RTX 4090, Intel Core i7-12700 | |
| NVIDIA GeForce RTX 4090, Intel Core i5-13400 | |
| NVIDIA GeForce RTX 4090, Intel Core i5-12400F | |
| 1920x1080 1080p Extreme | |
| NVIDIA GeForce RTX 4090, AMD Ryzen 7 7800X3D | |
| NVIDIA GeForce RTX 4090, AMD Ryzen 7 7745HX | |
| NVIDIA GeForce RTX 4090, Intel Core i5-14600K | |
| NVIDIA GeForce RTX 4090, Intel Core i9-14900K | |
| NVIDIA GeForce RTX 4090, AMD Ryzen 9 7950X | |
| NVIDIA GeForce RTX 4090, Intel Core i7-13700 | |
| NVIDIA GeForce RTX 4090, Intel Core i5-13400 | |
| NVIDIA GeForce RTX 4090, Intel Core i7-12700 | |
| NVIDIA GeForce RTX 4090, Intel Core i5-12400F | |
| 3840x2160 4k Optimized | |
| NVIDIA GeForce RTX 4090, AMD Ryzen 9 7950X | |
| NVIDIA GeForce RTX 4090, Intel Core i7-13700 | |
| NVIDIA GeForce RTX 4090, Intel Core i9-14900K | |
| NVIDIA GeForce RTX 4090, Intel Core i5-14600K | |
| NVIDIA GeForce RTX 4090, AMD Ryzen 7 7800X3D | |
| NVIDIA GeForce RTX 4090, AMD Ryzen 7 7745HX | |
| NVIDIA GeForce RTX 4090, Intel Core i7-12700 | |
| NVIDIA GeForce RTX 4090, Intel Core i5-13400 | |
| NVIDIA GeForce RTX 4090, Intel Core i5-12400F | |
| 7680x4320 8k Optimized | |
| NVIDIA GeForce RTX 4090, AMD Ryzen 9 7950X | |
| NVIDIA GeForce RTX 4090, Intel Core i7-13700 | |
| NVIDIA GeForce RTX 4090, Intel Core i7-12700 | |
| NVIDIA GeForce RTX 4090, Intel Core i5-13400 | |
| NVIDIA GeForce RTX 4090, Intel Core i5-12400F | |
| NVIDIA GeForce RTX 4090, Intel Core i9-14900K | |
| NVIDIA GeForce RTX 4090, Intel Core i5-14600K | |
| NVIDIA GeForce RTX 4090, AMD Ryzen 7 7800X3D | |
| NVIDIA GeForce RTX 4090, AMD Ryzen 7 7745HX | |
| Unigine Valley 1.0 | |
| 1920x1080 Extreme HD DirectX AA:x8 | |
| NVIDIA GeForce RTX 4090, Intel Core i9-14900K | |
| NVIDIA GeForce RTX 4090, Intel Core i5-14600K | |
| NVIDIA GeForce RTX 4090, AMD Ryzen 9 7950X | |
| NVIDIA GeForce RTX 4090, Intel Core i7-13700 | |
| NVIDIA GeForce RTX 4090, AMD Ryzen 7 7745HX | |
| NVIDIA GeForce RTX 4090, AMD Ryzen 7 7800X3D | |
| NVIDIA GeForce RTX 4090, Intel Core i7-12700 | |
| NVIDIA GeForce RTX 4090, Intel Core i5-13400 | |
| NVIDIA GeForce RTX 4090, Intel Core i5-12400F | |
| 1920x1080 Extreme HD Preset OpenGL AA:x8 | |
| NVIDIA GeForce RTX 4090, Intel Core i9-14900K | |
| NVIDIA GeForce RTX 4090, Intel Core i5-14600K | |
| NVIDIA GeForce RTX 4090, Intel Core i7-13700 | |
| NVIDIA GeForce RTX 4090, AMD Ryzen 9 7950X | |
| NVIDIA GeForce RTX 4090, AMD Ryzen 7 7745HX | |
| NVIDIA GeForce RTX 4090, AMD Ryzen 7 7800X3D | |
| NVIDIA GeForce RTX 4090, Intel Core i7-12700 | |
| NVIDIA GeForce RTX 4090, Intel Core i5-13400 | |
| NVIDIA GeForce RTX 4090, Intel Core i5-12400F | |
| Unigine Heaven 4.0 | |
| Extreme Preset OpenGL | |
| NVIDIA GeForce RTX 4090, Intel Core i9-14900K | |
| NVIDIA GeForce RTX 4090, AMD Ryzen 7 7745HX | |
| NVIDIA GeForce RTX 4090, Intel Core i5-14600K | |
| NVIDIA GeForce RTX 4090, AMD Ryzen 9 7950X | |
| NVIDIA GeForce RTX 4090, Intel Core i7-13700 | |
| NVIDIA GeForce RTX 4090, AMD Ryzen 7 7800X3D | |
| NVIDIA GeForce RTX 4090, Intel Core i7-12700 | |
| NVIDIA GeForce RTX 4090, Intel Core i5-13400 | |
| NVIDIA GeForce RTX 4090, Intel Core i5-12400F | |
| Extreme Preset DX11 | |
| NVIDIA GeForce RTX 4090, AMD Ryzen 9 7950X | |
| NVIDIA GeForce RTX 4090, Intel Core i9-14900K | |
| NVIDIA GeForce RTX 4090, AMD Ryzen 7 7745HX | |
| NVIDIA GeForce RTX 4090, Intel Core i5-14600K | |
| NVIDIA GeForce RTX 4090, AMD Ryzen 7 7800X3D | |
| NVIDIA GeForce RTX 4090, Intel Core i7-13700 | |
| NVIDIA GeForce RTX 4090, Intel Core i7-12700 | |
| NVIDIA GeForce RTX 4090, Intel Core i5-13400 | |
| NVIDIA GeForce RTX 4090, Intel Core i5-12400F | |
| ComputeMark v2.1 | |
| 1024x600 Normal, Score | |
| NVIDIA GeForce RTX 4090, AMD Ryzen 7 7745HX | |
| NVIDIA GeForce RTX 4090, Intel Core i5-14600K | |
| NVIDIA GeForce RTX 4090, AMD Ryzen 9 7950X | |
| NVIDIA GeForce RTX 4090, Intel Core i9-14900K | |
| NVIDIA GeForce RTX 4090, Intel Core i7-12700 | |
| NVIDIA GeForce RTX 4090, AMD Ryzen 7 7800X3D | |
| NVIDIA GeForce RTX 4090, Intel Core i5-13400 | |
| NVIDIA GeForce RTX 4090, Intel Core i7-13700 | |
| 1024x600 Normal, Fluid 3DTex | |
| NVIDIA GeForce RTX 4090, AMD Ryzen 7 7800X3D | |
| NVIDIA GeForce RTX 4090, Intel Core i5-14600K | |
| NVIDIA GeForce RTX 4090, Intel Core i7-13700 | |
| NVIDIA GeForce RTX 4090, Intel Core i5-13400 | |
| NVIDIA GeForce RTX 4090, Intel Core i7-12700 | |
| NVIDIA GeForce RTX 4090, AMD Ryzen 9 7950X | |
| NVIDIA GeForce RTX 4090, AMD Ryzen 7 7745HX | |
| NVIDIA GeForce RTX 4090, Intel Core i9-14900K | |
| 1024x600 Normal, Fluid 2DTexArr | |
| NVIDIA GeForce RTX 4090, AMD Ryzen 7 7745HX | |
| NVIDIA GeForce RTX 4090, Intel Core i5-14600K | |
| NVIDIA GeForce RTX 4090, Intel Core i9-14900K | |
| NVIDIA GeForce RTX 4090, AMD Ryzen 9 7950X | |
| NVIDIA GeForce RTX 4090, Intel Core i7-12700 | |
| NVIDIA GeForce RTX 4090, Intel Core i7-13700 | |
| NVIDIA GeForce RTX 4090, AMD Ryzen 7 7800X3D | |
| NVIDIA GeForce RTX 4090, Intel Core i5-13400 | |
| 1024x600 Normal, Mandel Vector | |
| NVIDIA GeForce RTX 4090, AMD Ryzen 7 7745HX | |
| NVIDIA GeForce RTX 4090, Intel Core i5-14600K | |
| NVIDIA GeForce RTX 4090, AMD Ryzen 9 7950X | |
| NVIDIA GeForce RTX 4090, Intel Core i9-14900K | |
| NVIDIA GeForce RTX 4090, Intel Core i7-13700 | |
| NVIDIA GeForce RTX 4090, Intel Core i7-12700 | |
| NVIDIA GeForce RTX 4090, AMD Ryzen 7 7800X3D | |
| NVIDIA GeForce RTX 4090, Intel Core i5-13400 | |
| 1024x600 Normal, Mandel Scalar | |
| NVIDIA GeForce RTX 4090, AMD Ryzen 7 7745HX | |
| NVIDIA GeForce RTX 4090, Intel Core i5-14600K | |
| NVIDIA GeForce RTX 4090, Intel Core i9-14900K | |
| NVIDIA GeForce RTX 4090, AMD Ryzen 7 7800X3D | |
| NVIDIA GeForce RTX 4090, AMD Ryzen 9 7950X | |
| NVIDIA GeForce RTX 4090, Intel Core i7-12700 | |
| NVIDIA GeForce RTX 4090, Intel Core i7-13700 | |
| NVIDIA GeForce RTX 4090, Intel Core i5-13400 | |
| 1024x600 Normal, QJuliaRayTrace | |
| NVIDIA GeForce RTX 4090, AMD Ryzen 7 7745HX | |
| NVIDIA GeForce RTX 4090, Intel Core i5-14600K | |
| NVIDIA GeForce RTX 4090, AMD Ryzen 9 7950X | |
| NVIDIA GeForce RTX 4090, Intel Core i9-14900K | |
| NVIDIA GeForce RTX 4090, Intel Core i5-13400 | |
| NVIDIA GeForce RTX 4090, Intel Core i7-12700 | |
| NVIDIA GeForce RTX 4090, Intel Core i7-13700 | |
| NVIDIA GeForce RTX 4090, AMD Ryzen 7 7800X3D | |
| Performance rating - Percent | |
| AMD Ryzen 7 7800X3D | |
| AMD Ryzen 9 7950X3D | |
| Intel Core i9-14900K | |
| AMD Ryzen 9 7950X | |
| AMD Ryzen 5 7600X | |
| Intel Core i9-13900K | |
| Intel Core i7-13700K | |
| Intel Core i7-13700 | |
| AMD Ryzen 7 7745HX | |
| Intel Core i7-12700 | |
| Intel Core i5-13400 | |
| F1 22 - 1280x720 Ultra Low Preset AA:T AF:16x | |
| AMD Ryzen 7 7800X3D | |
| Intel Core i9-14900K | |
| AMD Ryzen 9 7950X3D | |
| AMD Ryzen 9 7950X | |
| AMD Ryzen 5 7600X | |
| Intel Core i9-13900K | |
| AMD Ryzen 7 7745HX | |
| Intel Core i7-13700K | |
| Intel Core i7-13700 | |
| Intel Core i7-12700 | |
| Intel Core i5-13400 | |
| Far Cry 5 - 1280x720 Low Preset AA:T | |
| AMD Ryzen 7 7800X3D | |
| AMD Ryzen 9 7950X3D | |
| Intel Core i9-14900K | |
| Intel Core i9-13900K | |
| Intel Core i7-13700K | |
| AMD Ryzen 5 7600X | |
| AMD Ryzen 9 7950X | |
| Intel Core i7-13700 | |
| AMD Ryzen 7 7745HX | |
| Intel Core i7-12700 | |
| Intel Core i5-13400 | |
| X-Plane 11.11 - 1280x720 low (fps_test=1) | |
| Intel Core i9-13900K | |
| Intel Core i9-14900K | |
| AMD Ryzen 9 7950X3D | |
| Intel Core i7-13700K | |
| AMD Ryzen 9 7950X | |
| AMD Ryzen 7 7800X3D | |
| Intel Core i7-13700 | |
| AMD Ryzen 5 7600X | |
| AMD Ryzen 7 7745HX | |
| Intel Core i7-12700 | |
| Intel Core i5-13400 | |
| Final Fantasy XV Benchmark - 1280x720 Lite Quality | |
| AMD Ryzen 7 7745HX | |
| Intel Core i9-13900K | |
| AMD Ryzen 9 7950X | |
| AMD Ryzen 5 7600X | |
| Intel Core i7-13700 | |
| Intel Core i7-13700K | |
| AMD Ryzen 7 7800X3D | |
| Intel Core i9-14900K | |
| AMD Ryzen 9 7950X3D | |
| Intel Core i7-12700 | |
| Intel Core i5-13400 | |
| Dota 2 Reborn - 1280x720 min (0/3) fastest | |
| AMD Ryzen 7 7800X3D | |
| AMD Ryzen 9 7950X3D | |
| AMD Ryzen 9 7950X | |
| Intel Core i9-14900K | |
| Intel Core i9-13900K | |
| AMD Ryzen 5 7600X | |
| AMD Ryzen 7 7745HX | |
| Intel Core i7-13700K | |
| Intel Core i7-13700 | |
| Intel Core i7-12700 | |
| Intel Core i5-13400 | |
| The Witcher 3 - 1024x768 Low Graphics & Postprocessing | |
| AMD Ryzen 9 7950X3D | |
| AMD Ryzen 7 7800X3D | |
| Intel Core i9-14900K | |
| AMD Ryzen 9 7950X | |
| Intel Core i9-13900K | |
| AMD Ryzen 5 7600X | |
| AMD Ryzen 7 7745HX | |
| Intel Core i7-13700K | |
| Intel Core i7-13700 | |
| Intel Core i7-12700 | |
| Intel Core i5-13400 | |
| GTA V - 1024x768 Lowest Settings possible | |
| AMD Ryzen 7 7800X3D | |
| AMD Ryzen 9 7950X | |
| AMD Ryzen 9 7950X3D | |
| AMD Ryzen 5 7600X | |
| Intel Core i9-14900K | |
| Intel Core i9-13900K | |
| Intel Core i7-13700 | |
| Intel Core i7-13700K | |
| AMD Ryzen 7 7745HX | |
| Intel Core i7-12700 | |
| Intel Core i5-13400 | |
| Borderlands 3 - 1280x720 Very Low Overall Quality (DX11) | |
| AMD Ryzen 7 7800X3D | |
| AMD Ryzen 9 7950X3D | |
| Intel Core i9-14900K | |
| Intel Core i9-13900K | |
| AMD Ryzen 9 7950X | |
| AMD Ryzen 5 7600X | |
| Intel Core i7-13700 | |
| Intel Core i7-13700K | |
| AMD Ryzen 7 7745HX | |
| Intel Core i7-12700 | |
| Intel Core i5-13400 | |
| Far Cry New Dawn - 1280x720 Low Preset | |
| AMD Ryzen 7 7800X3D | |
| AMD Ryzen 9 7950X3D | |
| Intel Core i9-14900K | |
| Intel Core i9-13900K | |
| Intel Core i7-13700 | |
| Intel Core i7-13700K | |
| AMD Ryzen 9 7950X | |
| AMD Ryzen 5 7600X | |
| Intel Core i7-12700 | |
| AMD Ryzen 7 7745HX | |
| Intel Core i5-13400 | |
| Shadow of the Tomb Raider - 1280x720 Lowest Preset | |
| AMD Ryzen 7 7800X3D | |
| AMD Ryzen 9 7950X3D | |
| AMD Ryzen 9 7950X | |
| Intel Core i9-14900K | |
| AMD Ryzen 5 7600X | |
| Intel Core i9-13900K | |
| AMD Ryzen 7 7745HX | |
| Intel Core i7-13700 | |
| Intel Core i7-13700K | |
| Intel Core i7-12700 | |
| Intel Core i5-13400 | |
| Tiny Tina's Wonderlands - 1280x720 Lowest Preset (DX12) | |
| AMD Ryzen 7 7800X3D | |
| Intel Core i9-14900K | |
| AMD Ryzen 9 7950X3D | |
| AMD Ryzen 9 7950X | |
| AMD Ryzen 5 7600X | |
| Intel Core i9-13900K | |
| AMD Ryzen 7 7745HX | |
| Intel Core i7-13700 | |
| Intel Core i7-13700K | |
| Intel Core i7-12700 | |
| Intel Core i5-13400 | |
| Strange Brigade - 1280x720 lowest AF:1 | |
| AMD Ryzen 5 7600X | |
| Intel Core i9-14900K | |
| AMD Ryzen 7 7800X3D | |
| AMD Ryzen 9 7950X | |
| Intel Core i9-13900K | |
| AMD Ryzen 7 7745HX | |
| AMD Ryzen 9 7950X3D | |
| Intel Core i7-13700K | |
| Intel Core i7-13700 | |
| Intel Core i7-12700 | |
| Intel Core i5-13400 | |
| Metro Exodus - 1280x720 Low Quality AF:4x | |
| AMD Ryzen 7 7800X3D | |
| Intel Core i9-14900K | |
| AMD Ryzen 5 7600X | |
| AMD Ryzen 9 7950X | |
| AMD Ryzen 9 7950X3D | |
| AMD Ryzen 7 7745HX | |
| Intel Core i7-13700 | |
| Intel Core i9-13900K | |
| Intel Core i7-13700K | |
| Intel Core i7-12700 | |
| Intel Core i5-13400 | |
| F1 2020 - 1280x720 Ultra Low Preset | |
| AMD Ryzen 7 7800X3D | |
| Intel Core i9-14900K | |
| AMD Ryzen 9 7950X3D | |
| AMD Ryzen 9 7950X | |
| AMD Ryzen 5 7600X | |
| AMD Ryzen 7 7745HX | |
| Intel Core i9-13900K | |
| Intel Core i7-13700K | |
| Intel Core i7-13700 | |
| Intel Core i7-12700 | |
| Intel Core i5-13400 | |
| F1 2021 - 1280x720 Ultra Low Preset | |
| AMD Ryzen 7 7800X3D | |
| Intel Core i9-14900K | |
| AMD Ryzen 5 7600X | |
| AMD Ryzen 9 7950X3D | |
| AMD Ryzen 9 7950X | |
| Intel Core i9-13900K | |
| AMD Ryzen 7 7745HX | |
| Intel Core i7-13700K | |
| Intel Core i7-13700 | |
| Intel Core i7-12700 | |
| Intel Core i5-13400 | |
| Performance rating - Percent | |
| AMD Ryzen 7 7800X3D | |
| AMD Ryzen 9 7950X3D | |
| Intel Core i9-14900K | |
| AMD Ryzen 9 7950X | |
| AMD Ryzen 5 7600X | |
| Intel Core i9-13900K | |
| Intel Core i7-13700K | |
| Intel Core i7-13700 | |
| AMD Ryzen 7 7745HX | |
| Intel Core i7-12700 | |
| Intel Core i5-13400 | |
| F1 22 | |
| 3840x2160 Ultra High Preset AA:T AF:16x | |
| AMD Ryzen 7 7745HX | |
| AMD Ryzen 7 7800X3D | |
| Intel Core i9-14900K | |
| AMD Ryzen 5 7600X | |
| AMD Ryzen 9 7950X | |
| Intel Core i7-13700K | |
| AMD Ryzen 9 7950X3D | |
| Intel Core i7-13700 | |
| Intel Core i7-12700 | |
| Intel Core i5-13400 | |
| Intel Core i9-13900K | |
| 2560x1440 Ultra High Preset AA:T AF:16x | |
| AMD Ryzen 7 7800X3D | |
| Intel Core i9-14900K | |
| AMD Ryzen 7 7745HX | |
| AMD Ryzen 9 7950X3D | |
| AMD Ryzen 5 7600X | |
| AMD Ryzen 9 7950X | |
| Intel Core i9-13900K | |
| Intel Core i7-13700K | |
| Intel Core i7-13700 | |
| Intel Core i7-12700 | |
| Intel Core i5-13400 | |
| 1920x1080 Ultra High Preset AA:T AF:16x | |
| AMD Ryzen 7 7800X3D | |
| Intel Core i9-14900K | |
| AMD Ryzen 5 7600X | |
| AMD Ryzen 9 7950X3D | |
| AMD Ryzen 9 7950X | |
| Intel Core i9-13900K | |
| AMD Ryzen 7 7745HX | |
| Intel Core i7-13700K | |
| Intel Core i7-13700 | |
| Intel Core i7-12700 | |
| Intel Core i5-13400 | |
| Far Cry 5 | |
| 3840x2160 Ultra Preset AA:T | |
| AMD Ryzen 7 7800X3D | |
| Intel Core i9-14900K | |
| Intel Core i9-13900K | |
| AMD Ryzen 9 7950X3D | |
| AMD Ryzen 9 7950X | |
| AMD Ryzen 5 7600X | |
| Intel Core i7-13700K | |
| Intel Core i7-13700 | |
| Intel Core i7-12700 | |
| AMD Ryzen 7 7745HX | |
| Intel Core i5-13400 | |
| 2560x1440 Ultra Preset AA:T | |
| AMD Ryzen 7 7800X3D | |
| AMD Ryzen 9 7950X3D | |
| Intel Core i9-14900K | |
| Intel Core i9-13900K | |
| AMD Ryzen 5 7600X | |
| AMD Ryzen 9 7950X | |
| Intel Core i7-13700K | |
| Intel Core i7-13700 | |
| AMD Ryzen 7 7745HX | |
| Intel Core i7-12700 | |
| Intel Core i5-13400 | |
| 1920x1080 Ultra Preset AA:T | |
| AMD Ryzen 7 7800X3D | |
| AMD Ryzen 9 7950X3D | |
| Intel Core i9-14900K | |
| Intel Core i9-13900K | |
| AMD Ryzen 9 7950X | |
| AMD Ryzen 5 7600X | |
| Intel Core i7-13700 | |
| Intel Core i7-13700K | |
| Intel Core i7-12700 | |
| AMD Ryzen 7 7745HX | |
| Intel Core i5-13400 | |
| Final Fantasy XV Benchmark | |
| 3840x2160 High Quality | |
| Intel Core i9-14900K | |
| Intel Core i9-13900K | |
| AMD Ryzen 9 7950X | |
| AMD Ryzen 7 7745HX | |
| AMD Ryzen 5 7600X | |
| AMD Ryzen 7 7800X3D | |
| Intel Core i7-13700 | |
| AMD Ryzen 9 7950X3D | |
| Intel Core i7-13700K | |
| Intel Core i7-12700 | |
| Intel Core i5-13400 | |
| 2560x1440 High Quality | |
| AMD Ryzen 7 7800X3D | |
| Intel Core i9-14900K | |
| Intel Core i9-13900K | |
| AMD Ryzen 9 7950X | |
| AMD Ryzen 9 7950X3D | |
| AMD Ryzen 5 7600X | |
| Intel Core i7-13700K | |
| Intel Core i7-13700 | |
| AMD Ryzen 7 7745HX | |
| Intel Core i7-12700 | |
| Intel Core i5-13400 | |
| 1920x1080 High Quality | |
| Intel Core i9-14900K | |
| AMD Ryzen 9 7950X | |
| AMD Ryzen 7 7800X3D | |
| Intel Core i9-13900K | |
| AMD Ryzen 9 7950X3D | |
| Intel Core i7-13700K | |
| AMD Ryzen 5 7600X | |
| Intel Core i7-13700 | |
| AMD Ryzen 7 7745HX | |
| Intel Core i7-12700 | |
| Intel Core i5-13400 | |
| Dota 2 Reborn | |
| 3840x2160 ultra (3/3) best looking | |
| AMD Ryzen 7 7800X3D | |
| AMD Ryzen 9 7950X3D | |
| AMD Ryzen 9 7950X | |
| Intel Core i9-13900K | |
| Intel Core i9-14900K | |
| AMD Ryzen 5 7600X | |
| Intel Core i7-13700K | |
| Intel Core i7-13700 | |
| AMD Ryzen 7 7745HX | |
| Intel Core i7-12700 | |
| Intel Core i5-13400 | |
| 1920x1080 ultra (3/3) best looking | |
| AMD Ryzen 7 7800X3D | |
| AMD Ryzen 9 7950X3D | |
| AMD Ryzen 9 7950X | |
| Intel Core i9-13900K | |
| Intel Core i9-14900K | |
| AMD Ryzen 5 7600X | |
| Intel Core i7-13700K | |
| Intel Core i7-13700 | |
| AMD Ryzen 7 7745HX | |
| Intel Core i7-12700 | |
| Intel Core i5-13400 | |
| The Witcher 3 | |
| 3840x2160 High Graphics & Postprocessing (Nvidia HairWorks Off) | |
| AMD Ryzen 5 7600X | |
| Intel Core i9-14900K | |
| AMD Ryzen 9 7950X | |
| Intel Core i5-13400 | |
| Intel Core i7-13700 | |
| Intel Core i7-12700 | |
| AMD Ryzen 7 7800X3D | |
| Intel Core i7-13700K | |
| AMD Ryzen 7 7745HX | |
| AMD Ryzen 9 7950X3D | |
| Intel Core i9-13900K | |
| 1920x1080 Ultra Graphics & Postprocessing (HBAO+) | |
| Intel Core i9-13900K | |
| AMD Ryzen 9 7950X | |
| AMD Ryzen 7 7800X3D | |
| Intel Core i9-14900K | |
| AMD Ryzen 5 7600X | |
| Intel Core i7-13700K | |
| Intel Core i7-13700 | |
| AMD Ryzen 9 7950X3D | |
| Intel Core i7-12700 | |
| AMD Ryzen 7 7745HX | |
| Intel Core i5-13400 | |
| GTA V | |
| 3840x2160 Highest AA:4xMSAA + FX AF:16x | |
| AMD Ryzen 7 7800X3D | |
| Intel Core i9-14900K | |
| Intel Core i9-13900K | |
| AMD Ryzen 9 7950X | |
| AMD Ryzen 9 7950X3D | |
| Intel Core i7-13700K | |
| AMD Ryzen 5 7600X | |
| Intel Core i7-13700 | |
| AMD Ryzen 7 7745HX | |
| Intel Core i7-12700 | |
| Intel Core i5-13400 | |
| 2560x1440 Highest AA:4xMSAA + FX AF:16x | |
| AMD Ryzen 7 7800X3D | |
| Intel Core i9-14900K | |
| Intel Core i9-13900K | |
| AMD Ryzen 9 7950X | |
| AMD Ryzen 9 7950X3D | |
| Intel Core i7-13700K | |
| Intel Core i7-13700 | |
| AMD Ryzen 5 7600X | |
| AMD Ryzen 7 7745HX | |
| Intel Core i7-12700 | |
| Intel Core i5-13400 | |
| 1920x1080 Highest AA:4xMSAA + FX AF:16x | |
| AMD Ryzen 7 7800X3D | |
| Intel Core i9-14900K | |
| Intel Core i9-13900K | |
| AMD Ryzen 9 7950X | |
| AMD Ryzen 9 7950X3D | |
| Intel Core i7-13700K | |
| AMD Ryzen 5 7600X | |
| Intel Core i7-13700 | |
| AMD Ryzen 7 7745HX | |
| Intel Core i7-12700 | |
| Intel Core i5-13400 | |
| Borderlands 3 | |
| 3840x2160 Badass Overall Quality (DX11) | |
| Intel Core i7-13700K | |
| Intel Core i9-14900K | |
| AMD Ryzen 7 7800X3D | |
| AMD Ryzen 9 7950X3D | |
| Intel Core i9-13900K | |
| AMD Ryzen 9 7950X | |
| AMD Ryzen 5 7600X | |
| Intel Core i7-13700 | |
| AMD Ryzen 7 7745HX | |
| Intel Core i7-12700 | |
| Intel Core i5-13400 | |
| 2560x1440 Badass Overall Quality (DX11) | |
| AMD Ryzen 7 7800X3D | |
| AMD Ryzen 9 7950X3D | |
| Intel Core i9-14900K | |
| AMD Ryzen 9 7950X | |
| Intel Core i9-13900K | |
| AMD Ryzen 5 7600X | |
| Intel Core i7-13700K | |
| Intel Core i7-13700 | |
| AMD Ryzen 7 7745HX | |
| Intel Core i7-12700 | |
| Intel Core i5-13400 | |
| 1920x1080 Badass Overall Quality (DX11) | |
| AMD Ryzen 9 7950X3D | |
| AMD Ryzen 7 7800X3D | |
| Intel Core i9-14900K | |
| AMD Ryzen 9 7950X | |
| Intel Core i9-13900K | |
| AMD Ryzen 5 7600X | |
| Intel Core i7-13700K | |
| Intel Core i7-13700 | |
| AMD Ryzen 7 7745HX | |
| Intel Core i7-12700 | |
| Intel Core i5-13400 | |
| Far Cry New Dawn | |
| 3840x2160 Ultra Preset | |
| AMD Ryzen 7 7800X3D | |
| AMD Ryzen 9 7950X3D | |
| Intel Core i9-14900K | |
| Intel Core i9-13900K | |
| AMD Ryzen 9 7950X | |
| Intel Core i7-13700 | |
| Intel Core i7-13700K | |
| AMD Ryzen 5 7600X | |
| Intel Core i7-12700 | |
| AMD Ryzen 7 7745HX | |
| Intel Core i5-13400 | |
| 2560x1440 Ultra Preset | |
| AMD Ryzen 7 7800X3D | |
| AMD Ryzen 9 7950X3D | |
| Intel Core i9-14900K | |
| Intel Core i9-13900K | |
| AMD Ryzen 9 7950X | |
| Intel Core i7-13700K | |
| AMD Ryzen 5 7600X | |
| Intel Core i7-13700 | |
| Intel Core i7-12700 | |
| AMD Ryzen 7 7745HX | |
| Intel Core i5-13400 | |
| 1920x1080 Ultra Preset | |
| AMD Ryzen 7 7800X3D | |
| AMD Ryzen 9 7950X3D | |
| Intel Core i9-14900K | |
| Intel Core i9-13900K | |
| AMD Ryzen 9 7950X | |
| Intel Core i7-13700K | |
| AMD Ryzen 5 7600X | |
| Intel Core i7-13700 | |
| Intel Core i7-12700 | |
| AMD Ryzen 7 7745HX | |
| Intel Core i5-13400 | |
| Shadow of the Tomb Raider | |
| 3840x2160 Highest Preset AA:T | |
| Intel Core i9-14900K | |
| Intel Core i7-13700K | |
| AMD Ryzen 7 7800X3D | |
| Intel Core i7-13700 | |
| AMD Ryzen 9 7950X3D | |
| AMD Ryzen 5 7600X | |
| AMD Ryzen 7 7745HX | |
| AMD Ryzen 9 7950X | |
| Intel Core i9-13900K | |
| Intel Core i7-12700 | |
| Intel Core i5-13400 | |
| 2560x1440 Highest Preset AA:T | |
| AMD Ryzen 7 7800X3D | |
| AMD Ryzen 9 7950X3D | |
| Intel Core i9-14900K | |
| Intel Core i9-13900K | |
| AMD Ryzen 9 7950X | |
| AMD Ryzen 5 7600X | |
| Intel Core i7-13700K | |
| Intel Core i7-13700 | |
| AMD Ryzen 7 7745HX | |
| Intel Core i7-12700 | |
| Intel Core i5-13400 | |
| 1920x1080 Highest Preset AA:T | |
| AMD Ryzen 7 7800X3D | |
| AMD Ryzen 9 7950X3D | |
| Intel Core i9-14900K | |
| AMD Ryzen 9 7950X | |
| Intel Core i9-13900K | |
| AMD Ryzen 5 7600X | |
| Intel Core i7-13700K | |
| Intel Core i7-13700 | |
| AMD Ryzen 7 7745HX | |
| Intel Core i7-12700 | |
| Intel Core i5-13400 | |
| Tiny Tina's Wonderlands | |
| 3840x2160 Badass Preset (DX12) | |
| Intel Core i9-14900K | |
| AMD Ryzen 9 7950X3D | |
| AMD Ryzen 7 7745HX | |
| AMD Ryzen 5 7600X | |
| AMD Ryzen 9 7950X | |
| Intel Core i7-13700 | |
| Intel Core i9-13900K | |
| AMD Ryzen 7 7800X3D | |
| Intel Core i7-12700 | |
| Intel Core i5-13400 | |
| Intel Core i7-13700K | |
| 2560x1440 Badass Preset (DX12) | |
| AMD Ryzen 9 7950X3D | |
| Intel Core i9-14900K | |
| AMD Ryzen 7 7800X3D | |
| AMD Ryzen 9 7950X | |
| AMD Ryzen 7 7745HX | |
| AMD Ryzen 5 7600X | |
| Intel Core i7-13700K | |
| Intel Core i9-13900K | |
| Intel Core i7-13700 | |
| Intel Core i7-12700 | |
| Intel Core i5-13400 | |
| 1920x1080 Badass Preset (DX12) | |
| AMD Ryzen 7 7800X3D | |
| Intel Core i9-14900K | |
| AMD Ryzen 9 7950X3D | |
| AMD Ryzen 9 7950X | |
| AMD Ryzen 5 7600X | |
| AMD Ryzen 7 7745HX | |
| Intel Core i9-13900K | |
| Intel Core i7-13700 | |
| Intel Core i7-13700K | |
| Intel Core i7-12700 | |
| Intel Core i5-13400 | |
| Strange Brigade | |
| 3840x2160 ultra AA:ultra AF:16 | |
| Intel Core i9-14900K | |
| AMD Ryzen 7 7800X3D | |
| AMD Ryzen 7 7745HX | |
| Intel Core i7-13700K | |
| AMD Ryzen 9 7950X3D | |
| Intel Core i7-12700 | |
| AMD Ryzen 5 7600X | |
| Intel Core i7-13700 | |
| AMD Ryzen 9 7950X | |
| Intel Core i9-13900K | |
| Intel Core i5-13400 | |
| 2560x1440 ultra AA:ultra AF:16 | |
| Intel Core i9-14900K | |
| AMD Ryzen 7 7800X3D | |
| AMD Ryzen 5 7600X | |
| AMD Ryzen 7 7745HX | |
| AMD Ryzen 9 7950X | |
| Intel Core i9-13900K | |
| AMD Ryzen 9 7950X3D | |
| Intel Core i7-13700K | |
| Intel Core i7-13700 | |
| Intel Core i7-12700 | |
| Intel Core i5-13400 | |
| 1920x1080 ultra AA:ultra AF:16 | |
| Intel Core i9-14900K | |
| AMD Ryzen 5 7600X | |
| AMD Ryzen 7 7800X3D | |
| AMD Ryzen 9 7950X | |
| Intel Core i9-13900K | |
| AMD Ryzen 7 7745HX | |
| AMD Ryzen 9 7950X3D | |
| Intel Core i7-13700K | |
| Intel Core i7-13700 | |
| Intel Core i7-12700 | |
| Intel Core i5-13400 | |
| Metro Exodus | |
| 3840x2160 Ultra Quality AF:16x | |
| Intel Core i9-14900K | |
| AMD Ryzen 7 7800X3D | |
| AMD Ryzen 9 7950X | |
| AMD Ryzen 9 7950X3D | |
| Intel Core i9-13900K | |
| AMD Ryzen 5 7600X | |
| Intel Core i7-13700 | |
| Intel Core i7-13700K | |
| AMD Ryzen 7 7745HX | |
| Intel Core i7-12700 | |
| Intel Core i5-13400 | |
| 2560x1440 Ultra Quality AF:16x | |
| AMD Ryzen 7 7800X3D | |
| Intel Core i9-14900K | |
| AMD Ryzen 9 7950X | |
| AMD Ryzen 5 7600X | |
| AMD Ryzen 7 7745HX | |
| AMD Ryzen 9 7950X3D | |
| Intel Core i9-13900K | |
| Intel Core i7-13700 | |
| Intel Core i7-13700K | |
| Intel Core i7-12700 | |
| Intel Core i5-13400 | |
| 1920x1080 Ultra Quality AF:16x | |
| AMD Ryzen 7 7800X3D | |
| Intel Core i9-14900K | |
| AMD Ryzen 9 7950X | |
| AMD Ryzen 7 7745HX | |
| AMD Ryzen 5 7600X | |
| AMD Ryzen 9 7950X3D | |
| Intel Core i9-13900K | |
| Intel Core i7-13700 | |
| Intel Core i7-13700K | |
| Intel Core i7-12700 | |
| Intel Core i5-13400 | |
| F1 2020 | |
| 3840x2160 Ultra High Preset AA:T AF:16x | |
| Intel Core i9-14900K | |
| AMD Ryzen 9 7950X3D | |
| AMD Ryzen 7 7800X3D | |
| AMD Ryzen 7 7745HX | |
| AMD Ryzen 9 7950X | |
| Intel Core i9-13900K | |
| AMD Ryzen 5 7600X | |
| Intel Core i7-13700K | |
| Intel Core i7-13700 | |
| Intel Core i7-12700 | |
| Intel Core i5-13400 | |
| 2560x1440 Ultra High Preset AA:T AF:16x | |
| AMD Ryzen 7 7800X3D | |
| Intel Core i9-14900K | |
| AMD Ryzen 9 7950X3D | |
| AMD Ryzen 9 7950X | |
| Intel Core i9-13900K | |
| AMD Ryzen 5 7600X | |
| AMD Ryzen 7 7745HX | |
| Intel Core i7-13700K | |
| Intel Core i7-13700 | |
| Intel Core i7-12700 | |
| Intel Core i5-13400 | |
| 1920x1080 Ultra High Preset AA:T AF:16x | |
| AMD Ryzen 7 7800X3D | |
| AMD Ryzen 9 7950X3D | |
| Intel Core i9-14900K | |
| AMD Ryzen 5 7600X | |
| AMD Ryzen 9 7950X | |
| AMD Ryzen 7 7745HX | |
| Intel Core i9-13900K | |
| Intel Core i7-13700K | |
| Intel Core i7-13700 | |
| Intel Core i7-12700 | |
| Intel Core i5-13400 | |
| F1 2021 | |
| 3840x2160 Ultra High Preset + Raytracing AA:T AF:16x | |
| AMD Ryzen 7 7800X3D | |
| AMD Ryzen 7 7745HX | |
| AMD Ryzen 5 7600X | |
| AMD Ryzen 9 7950X3D | |
| Intel Core i9-14900K | |
| AMD Ryzen 9 7950X | |
| Intel Core i7-13700K | |
| Intel Core i7-13700 | |
| Intel Core i9-13900K | |
| Intel Core i7-12700 | |
| Intel Core i5-13400 | |
| 2560x1440 Ultra High Preset + Raytracing AA:T AF:16x | |
| AMD Ryzen 7 7800X3D | |
| Intel Core i9-14900K | |
| AMD Ryzen 5 7600X | |
| AMD Ryzen 9 7950X3D | |
| AMD Ryzen 9 7950X | |
| Intel Core i7-13700K | |
| Intel Core i7-13700 | |
| AMD Ryzen 7 7745HX | |
| Intel Core i7-12700 | |
| Intel Core i5-13400 | |
| Intel Core i9-13900K | |
| 1920x1080 Ultra High Preset + Raytracing AA:T AF:16x | |
| AMD Ryzen 7 7800X3D | |
| Intel Core i9-14900K | |
| AMD Ryzen 5 7600X | |
| Intel Core i9-13900K | |
| AMD Ryzen 9 7950X | |
| AMD Ryzen 9 7950X3D | |
| Intel Core i7-13700K | |
| Intel Core i7-13700 | |
| AMD Ryzen 7 7745HX | |
| Intel Core i7-12700 | |
| Intel Core i5-13400 | |
Power consumption with external monitor
| low | med. | high | ultra | QHD | 4K DLSS | 4K | |
|---|---|---|---|---|---|---|---|
| GTA V (2015) | 187.6 | 186.9 | 183.7 | 142.9 | 142.6 | 183.6 | |
| The Witcher 3 (2015) | 692 | 608 | 566 | 291 | 255 | 277 | |
| Dota 2 Reborn (2015) | 252 | 222 | 218 | 195.2 | 192.8 | ||
| Final Fantasy XV Benchmark (2018) | 237 | 236 | 217 | 212 | 160.2 | ||
| X-Plane 11.11 (2018) | 195.9 | 164.5 | 127.3 | 106.7 | |||
| Far Cry 5 (2018) | 205 | 176 | 168 | 155 | 157 | 152 | |
| Strange Brigade (2018) | 676 | 553 | 548 | 541 | 517 | 287 | |
| Shadow of the Tomb Raider (2018) | 275 | 253 | 246 | 254 | 242 | 186.4 | |
| Far Cry New Dawn (2019) | 170 | 148 | 143 | 128 | 128 | 124 | |
| Metro Exodus (2019) | 287 | 271 | 239 | 199.4 | 182.8 | 135.8 | |
| Borderlands 3 (2019) | 203 | 179.9 | 162.4 | 154.7 | 153.2 | 127.9 | |
| F1 2020 (2020) | 529 | 408 | 431 | 392 | 383 | 287 | |
| Death Stranding (2020) | 238 | 237 | 234 | 230 | 227 | 197.7 | |
| Horizon Zero Dawn (2020) | 290 | 268 | 250 | 237 | 230 | 208 | 165 |
| F1 2021 (2021) | 589 | 567 | 483 | 253 | 252 | 207 | |
| Forza Horizon 5 (2021) | 359 | 281 | 278 | 201 | 187 | 161 | |
| God of War (2022) | 230 | 233 | 229 | 205 | 179.7 | 127.1 | |
| GRID Legends (2022) | 229 | 205 | 190.1 | 184.2 | 181.8 | 173.9 | |
| Tiny Tina's Wonderlands (2022) | 393 | 333 | 295 | 279 | 229 | 130.8 | |
| F1 22 (2022) | 375 | 391 | 363 | 191.4 | 159.5 | 84.9 | |
| The Callisto Protocol (2022) | 211.1 | 199.9 | 196.8 | 185.5 | 179.2 | 149.6 | |
| High On Life (2023) | 343 | 325 | 292 | 278 | 224 | 109.9 | |
| The Witcher 3 v4 (2023) | 259 | 219 | 191.6 | 180.1 | 176.9 | 160.4 | |
| Dead Space Remake (2023) | 194.3 | 194.1 | 186.1 | 184.9 | 170.6 | 97.9 | |
| Returnal (2023) | 199 | 199 | 196 | 193 | 170 | 113 | |
| Atomic Heart (2023) | 258 | 214 | 190 | 177.9 | 164.6 | 105.6 | |
| Company of Heroes 3 (2023) | 312.3 | 284.6 | 268.8 | 267.4 | 236.3 | 195.4 | |
| The Last of Us (2023) | 182.3 | 171.4 | 170.3 | 166.5 | 142.5 | 123.9 | 82.2 |
| F1 23 (2023) | 384 | 401 | 379 | 174.6 | 153.2 | 133.2 | 80.7 |
| Starfield (2023) | 164 | 162.7 | 152.6 | 144.5 | 122.7 | 82.1 | |
| Lies of P (2023) | 315 | 296 | 276 | 257 | 245 | 224 | 165.8 |
| Cyberpunk 2077 (2023) | 203 | 201 | 185.5 | 170.7 | 152 | 75.9 | |
| Assassin's Creed Mirage (2023) | 253 | 244 | 232 | 166 | 160 | 144 | 130 |
| Total War Pharaoh (2023) | 544.4 | 319.5 | 211.7 | 163.1 | 162.8 | 150 | |
| Lords of the Fallen (2023) | 160.8 | 154.8 | 147.8 | 122.1 | 93.9 | 93.2 | 55.4 |
| EA Sports WRC (2023) | 224 | 147.3 | 138.3 | 134.7 | 131.7 | 123.2 | 120.7 |
| Call of Duty Modern Warfare 3 2023 (2023) | 246 | 245 | 244 | 243 | 230 | 164 | |
| Avatar Frontiers of Pandora (2023) | 236 | 224 | 201 | 169 | 126 | 113 | 68 |
| The Finals (2023) | 302 | 268 | 261 | 270 | 257 | 223 | 140.4 |
功耗和温度
Minisforum 为 BD770i 主板预装了热管散热系统。不过,用户可以灵活选择安装 120 毫米的风扇。值得注意的是,与我们的 Noctua NF-A12x25 风扇相比,不同的风扇可能会产生温度差异。总的来说,我们对散热装置的批评很少。主板上的 SoC 和电压转换器采用直接冷却,强调不能安装其他散热器。在封闭和开放系统中,AMD Ryzen 7 7745HX 的温度都略高于 90 °C。对于移动领域的 CPU 来说,这属于可接受的范围,因为 AMD 的规格允许处理器在温度达到 100 ℃ 时性能才会下降。即使在长时间的压力测试中,我们的温度也没有达到 100 °C。
Minisforum BD770i 的突出特点之一是其功耗。在 Cinebench R15 Multi 测试中,我们仅记录了 127.5 瓦的功耗,效率出众,超过了其他台式机系统。在游戏场景中,显卡的性能需要消耗大量能源,我们记录到的平均耗电量为 495 瓦,相对较好。AMD Ryzen 7 7745HX 的能效与 AMD Ryzen 7 7800X3D 不相上下。不过,就游戏模式下的效率而言,AMD Ryzen 7 7745HX 的表现要优于 AMD Ryzen 7 7800X3D。在不使用专用显卡的情况下,测试系统的运行效率明显更高,在游戏模式下平均仅需 60 瓦。
关于整体运行和噪音水平,我们注意到在测试设置中可以听到安装的电源装置的声音。在空闲和负载条件下,我们都没有检测到任何受安装适配器影响的测量结果。预装的用于主动冷却固态硬盘的小型风扇运转非常安静,在封闭的机箱内听不到任何声音。Minisforum BD770i 主板的 BIOS 设置提供了有限的调整选项。用户可以按照预定义的步骤(45、55 和 75 瓦)设置 CPU 功率,并将 CPU 的最高温度调整为任意值。与知名主板生产商相比,Minisforum BD770i 主板的设置选项更为有限。对于那些喜欢灵活性而不是尝试 SoC 功率和温度限制的用户来说,调整风扇曲线的功能可能是一个有价值的附加功能。
| Power Consumption / Cinebench R15 Multi (external Monitor) | |
| Intel Core i9-14900K | |
| Intel Core i9-13900K | |
| AMD Ryzen 9 7950X (Idle: 95.2 W) | |
| Intel Core i7-13700K | |
| Intel Core i5-14600K | |
| Intel Core i5-13600K | |
| Intel Core i7-12700 | |
| AMD Ryzen 9 7950X3D | |
| AMD Ryzen 7 7800X3D | |
| Intel Core i5-13400 | |
| Intel Core i5-12400F | |
| AMD Ryzen 7 7745HX | |
| Power Consumption / Prime95 V2810 Stress (external Monitor) | |
| Intel Core i9-14900K | |
| Intel Core i9-13900K | |
| Intel Core i5-14600K | |
| Intel Core i7-13700K | |
| Intel Core i5-13600K | |
| AMD Ryzen 9 7950X (Idle: 95.2 W) | |
| Intel Core i7-12700 | |
| AMD Ryzen 9 7950X3D | |
| Intel Core i5-12400F | |
| Intel Core i5-13400 | |
| AMD Ryzen 7 7800X3D | |
| AMD Ryzen 7 7745HX | |
| Power Consumption / Cinebench R23 Multi (external Monitor) | |
| Intel Core i9-14900K | |
| AMD Ryzen 9 7950X (95.2) | |
| Intel Core i5-14600K | |
| AMD Ryzen 9 7950X3D | |
| AMD Ryzen 7 7800X3D | |
| AMD Ryzen 7 7745HX | |
| Power Consumption / Cinebench R23 Single (external Monitor) | |
| AMD Ryzen 7 7800X3D | |
| AMD Ryzen 9 7950X (95.2) | |
| Intel Core i9-14900K | |
| Intel Core i5-14600K | |
| AMD Ryzen 7 7745HX | |
| Power Consumption / Cinebench R15 Multi Efficiency (external Monitor) | |
| AMD Ryzen 7 7745HX | |
| AMD Ryzen 9 7950X3D | |
| AMD Ryzen 9 7950X | |
| AMD Ryzen 7 7800X3D | |
| Intel Core i9-13900K | |
| Intel Core i5-13600K | |
| Intel Core i9-14900K | |
| Intel Core i5-14600K | |
* ... smaller is better
| Power Consumption / The Witcher 3 ultra (external Monitor) | |
| Intel Core i5-14600K | |
| Intel Core i9-14900K | |
| Intel Core i7-13700 | |
| Intel Core i7-13700K | |
| AMD Ryzen 9 7950X | |
| AMD Ryzen 9 7950X3D | |
| Intel Core i9-13900K | |
| Intel Core i7-12700 | |
| Intel Core i5-13400 | |
| AMD Ryzen 7 7800X3D | |
| AMD Ryzen 7 7745HX | |
| Intel Core i5-12400F | |
| AMD Ryzen 7 7745HX | |
| Power Consumption / Witcher 3 ultra Efficiency (external Monitor) | |
| AMD Ryzen 7 7800X3D | |
| Intel Core i5-12400F | |
| Intel Core i9-13900K | |
| AMD Ryzen 9 7950X | |
| Intel Core i7-12700 | |
| AMD Ryzen 9 7950X3D | |
| AMD Ryzen 7 7745HX | |
| Intel Core i7-13700K | |
| Intel Core i7-13700 | |
| Intel Core i9-14900K | |
| Intel Core i5-14600K | |
| Intel Core i5-13400 | |
| AMD Ryzen 7 7745HX | |
* ... smaller is better
Power consumption with external monitor
Pros
Cons
结论 - 功能强大的 AMD Ryzen 7 7745HX

中国系统生产商 Minisforum BD770i 以生产小型 PC 而闻名,它为打造高效设备奠定了良好基础。Minisforum 推出的 BD770i 满足了对自行组装系统感兴趣的客户的需求,因为包装中只包括主板、永久安装的 CPU 和预装热管散热器。这样就可以灵活地为日常办公使用创建经济实惠的系统,或通过集成专用显卡创建功能强大的游戏设置。
Minisforum BD770i 配备 AMD Ryzen 7 7745HX,性能强劲,并通过 PCIe 5.0 连接支持未来的显卡。
事实证明,将移动 CPU 集成到台式机中的策略是成功的。有效的功率传输,无热节流,确保了低功耗带来的显著效率。即使与 AMD 当前的 X3D 处理器相比,Minisforum BD770i 主板的效率也毫不逊色。
虽然约 399 美元的初始价格似乎有些高昂,但考虑到其相对于传统台式机系统的性能级别,Minisforum BD770i 可能是一个令人信服的选择。它尤其适合那些以后不打算升级 CPU 的用户。尽管如此,值得注意的是,这是一种裸机系统,需要额外费用才能使设备完全运行。
价格和供应情况
Minisforum通过亚马逊销售 BD770i,主板售价为 399 美元。
Transparency
The selection of devices to be reviewed is made by our editorial team. The test sample was given to the author by the manufacturer free of charge for the purposes of review. There was no third-party influence on this review, nor did the manufacturer receive a copy of this review before publication. There was no obligation to publish this review. As an independent media company, Notebookcheck is not subjected to the authority of manufacturers, retailers or publishers.
This is how Notebookcheck is testing
Every year, Notebookcheck independently reviews hundreds of laptops and smartphones using standardized procedures to ensure that all results are comparable. We have continuously developed our test methods for around 20 years and set industry standards in the process. In our test labs, high-quality measuring equipment is utilized by experienced technicians and editors. These tests involve a multi-stage validation process. Our complex rating system is based on hundreds of well-founded measurements and benchmarks, which maintains objectivity. Further information on our test methods can be found here.

