PalitGeForce RTX 4090 GameRock OC桌面GPU回顾。高端性能与价格相匹配

Nvidia的新顶级型号的名称为GeForce RTX 4090,和它的前辈一样,拥有高达24GB的VRAM。因此,它正日益确立自己作为消费者显卡高端领域的标准。AMD最近发布的Radeon RX 7900 XTX也同样紧随其后,配备了24GB VRAM。
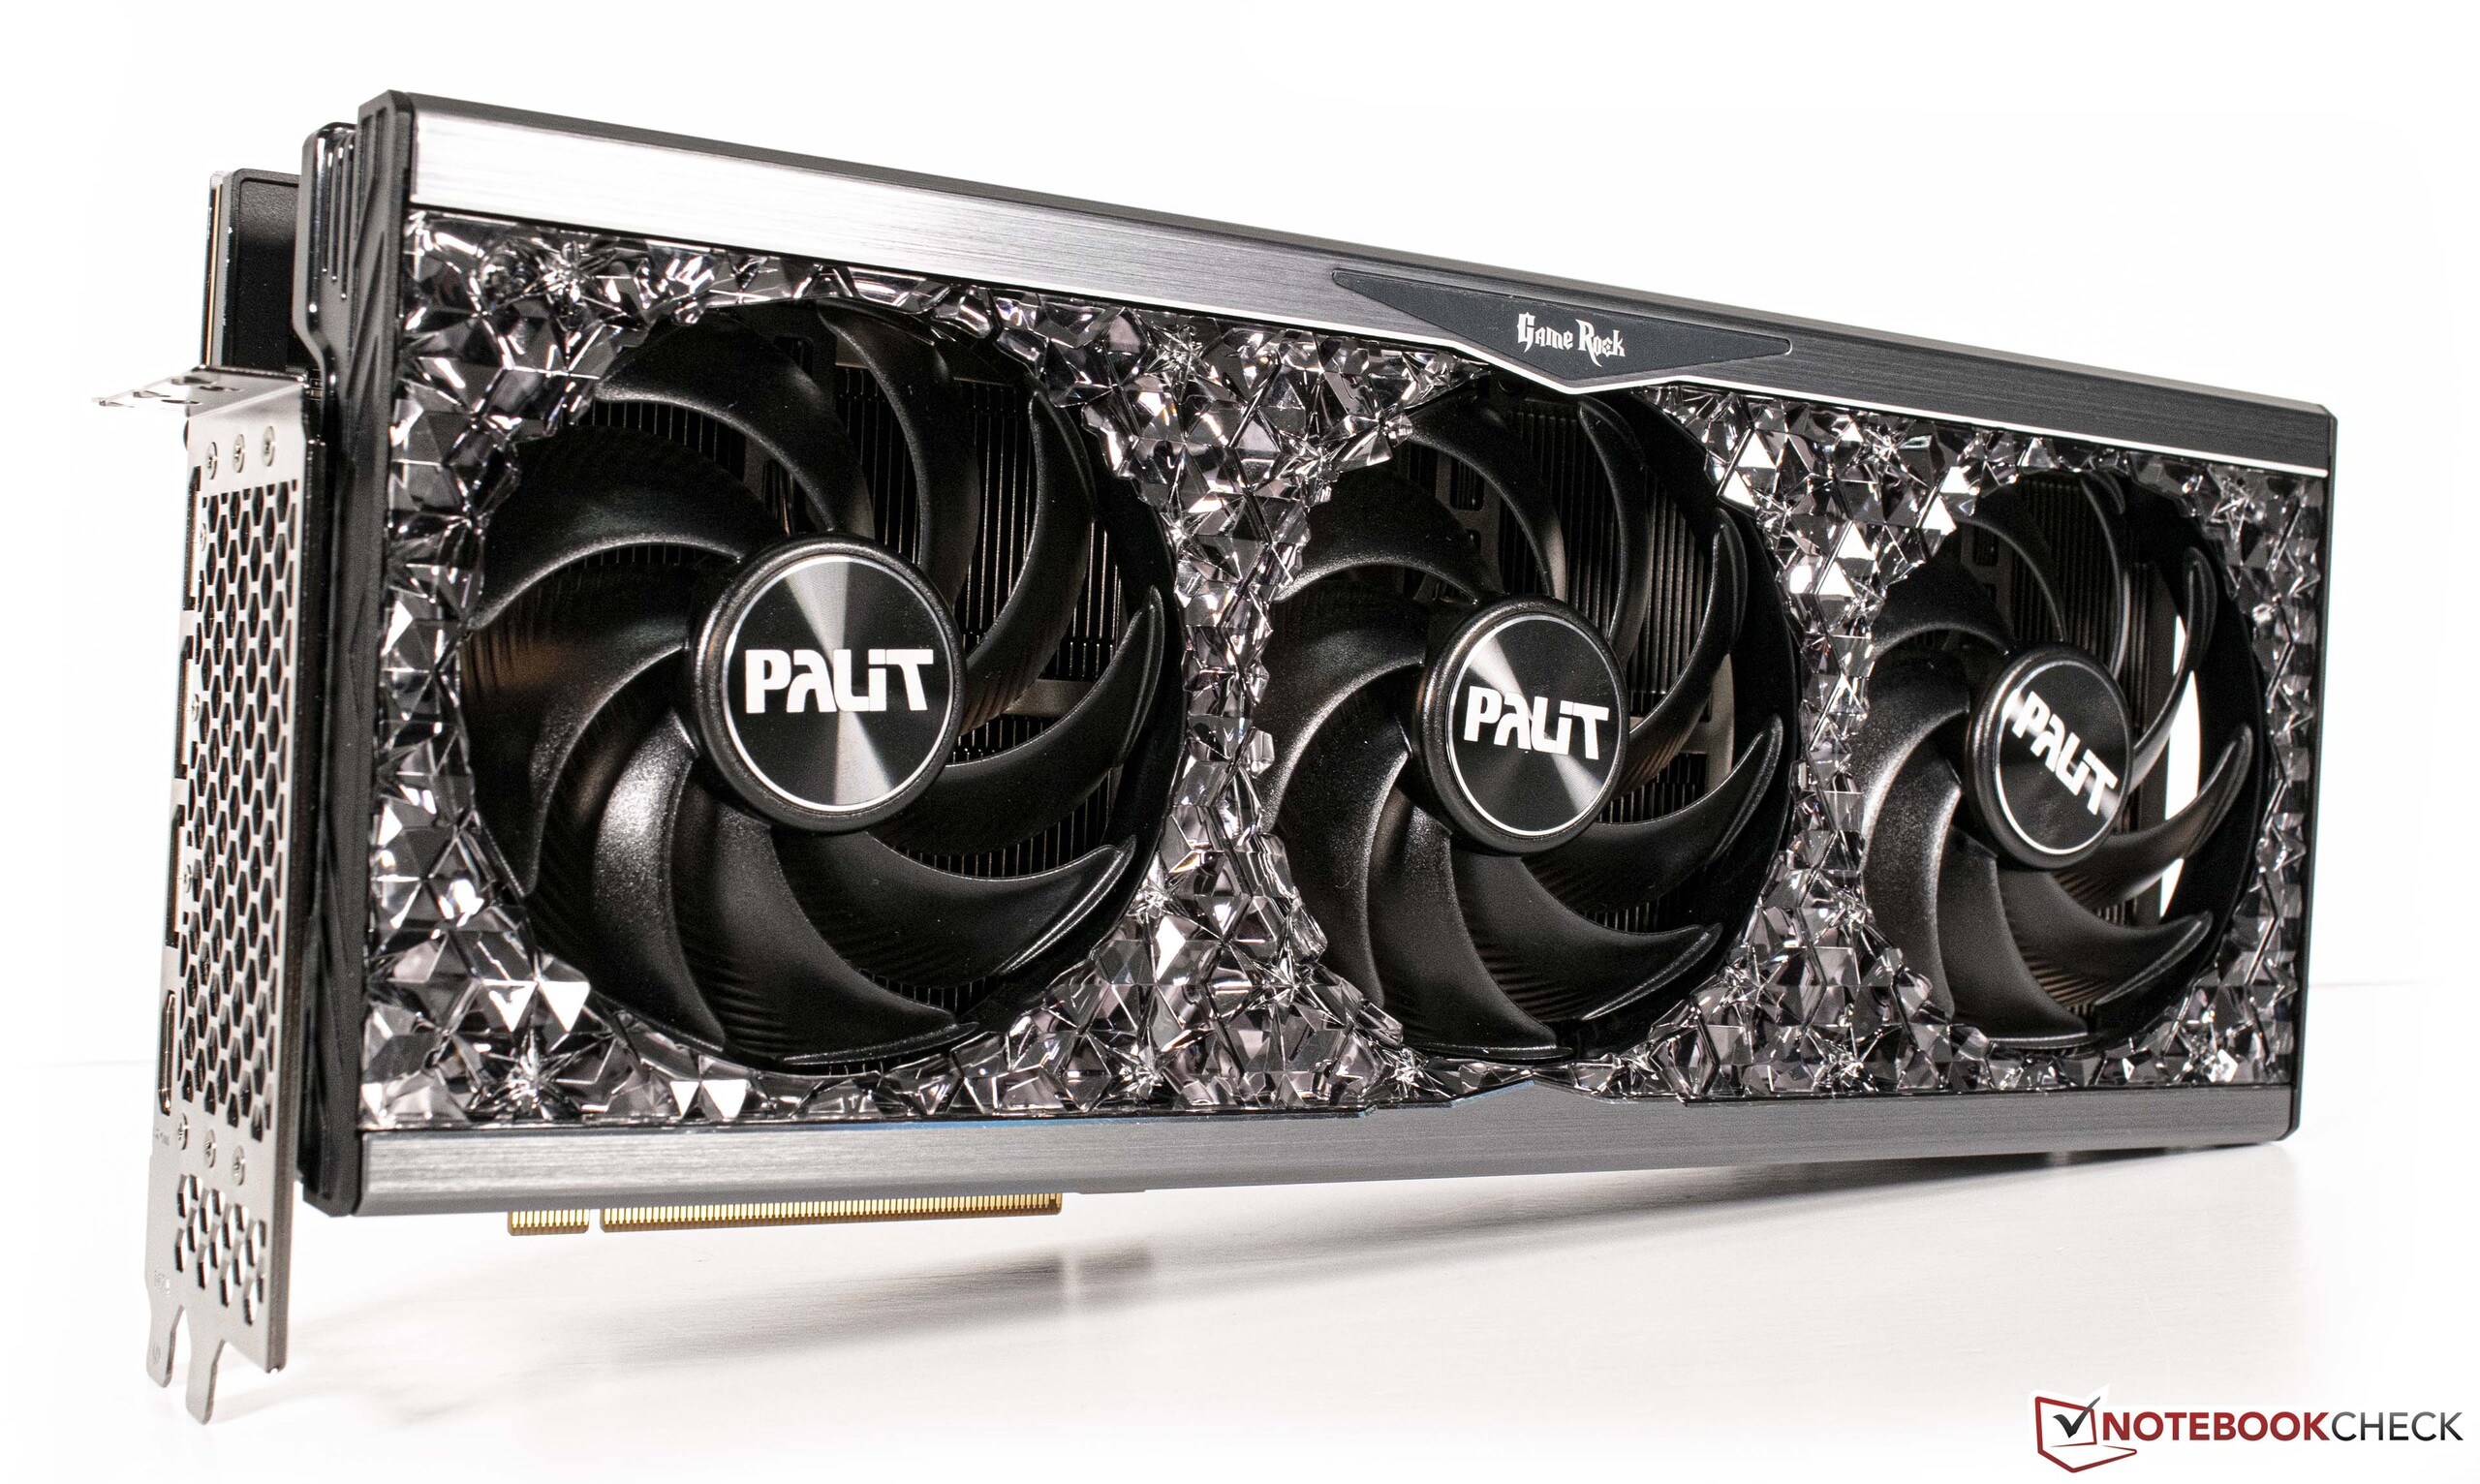
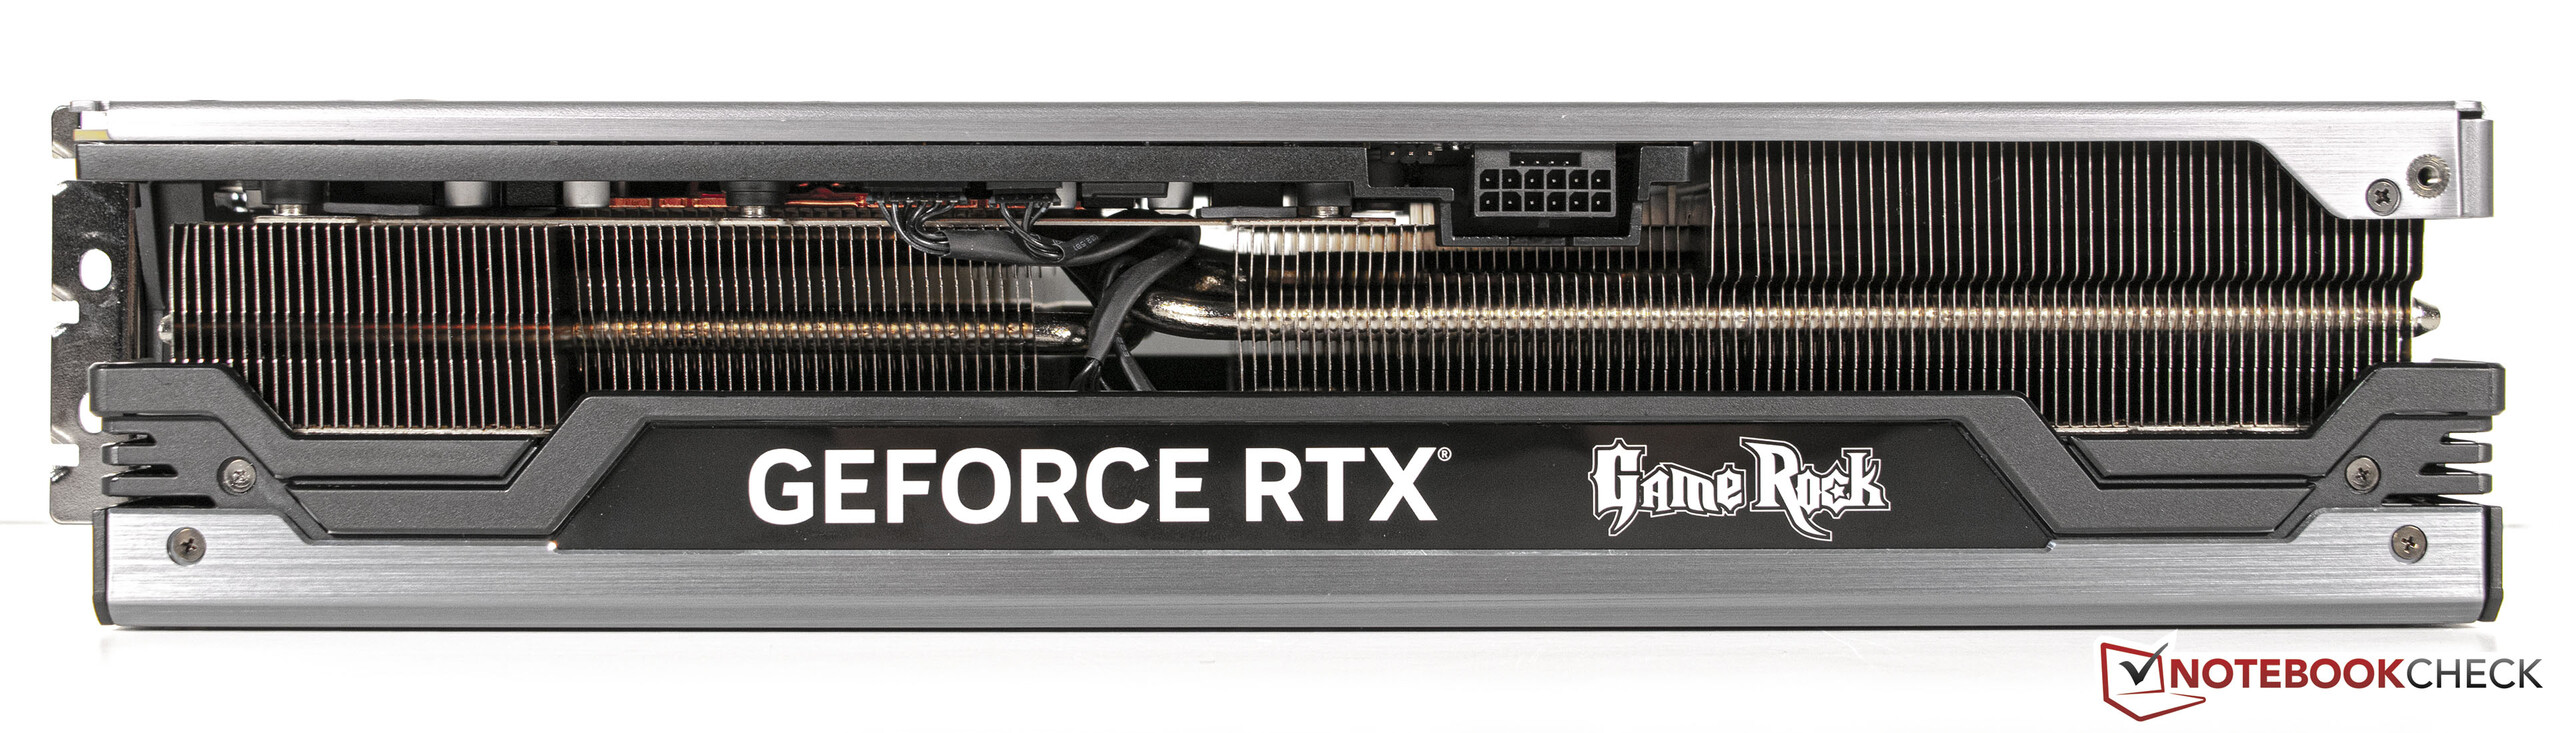
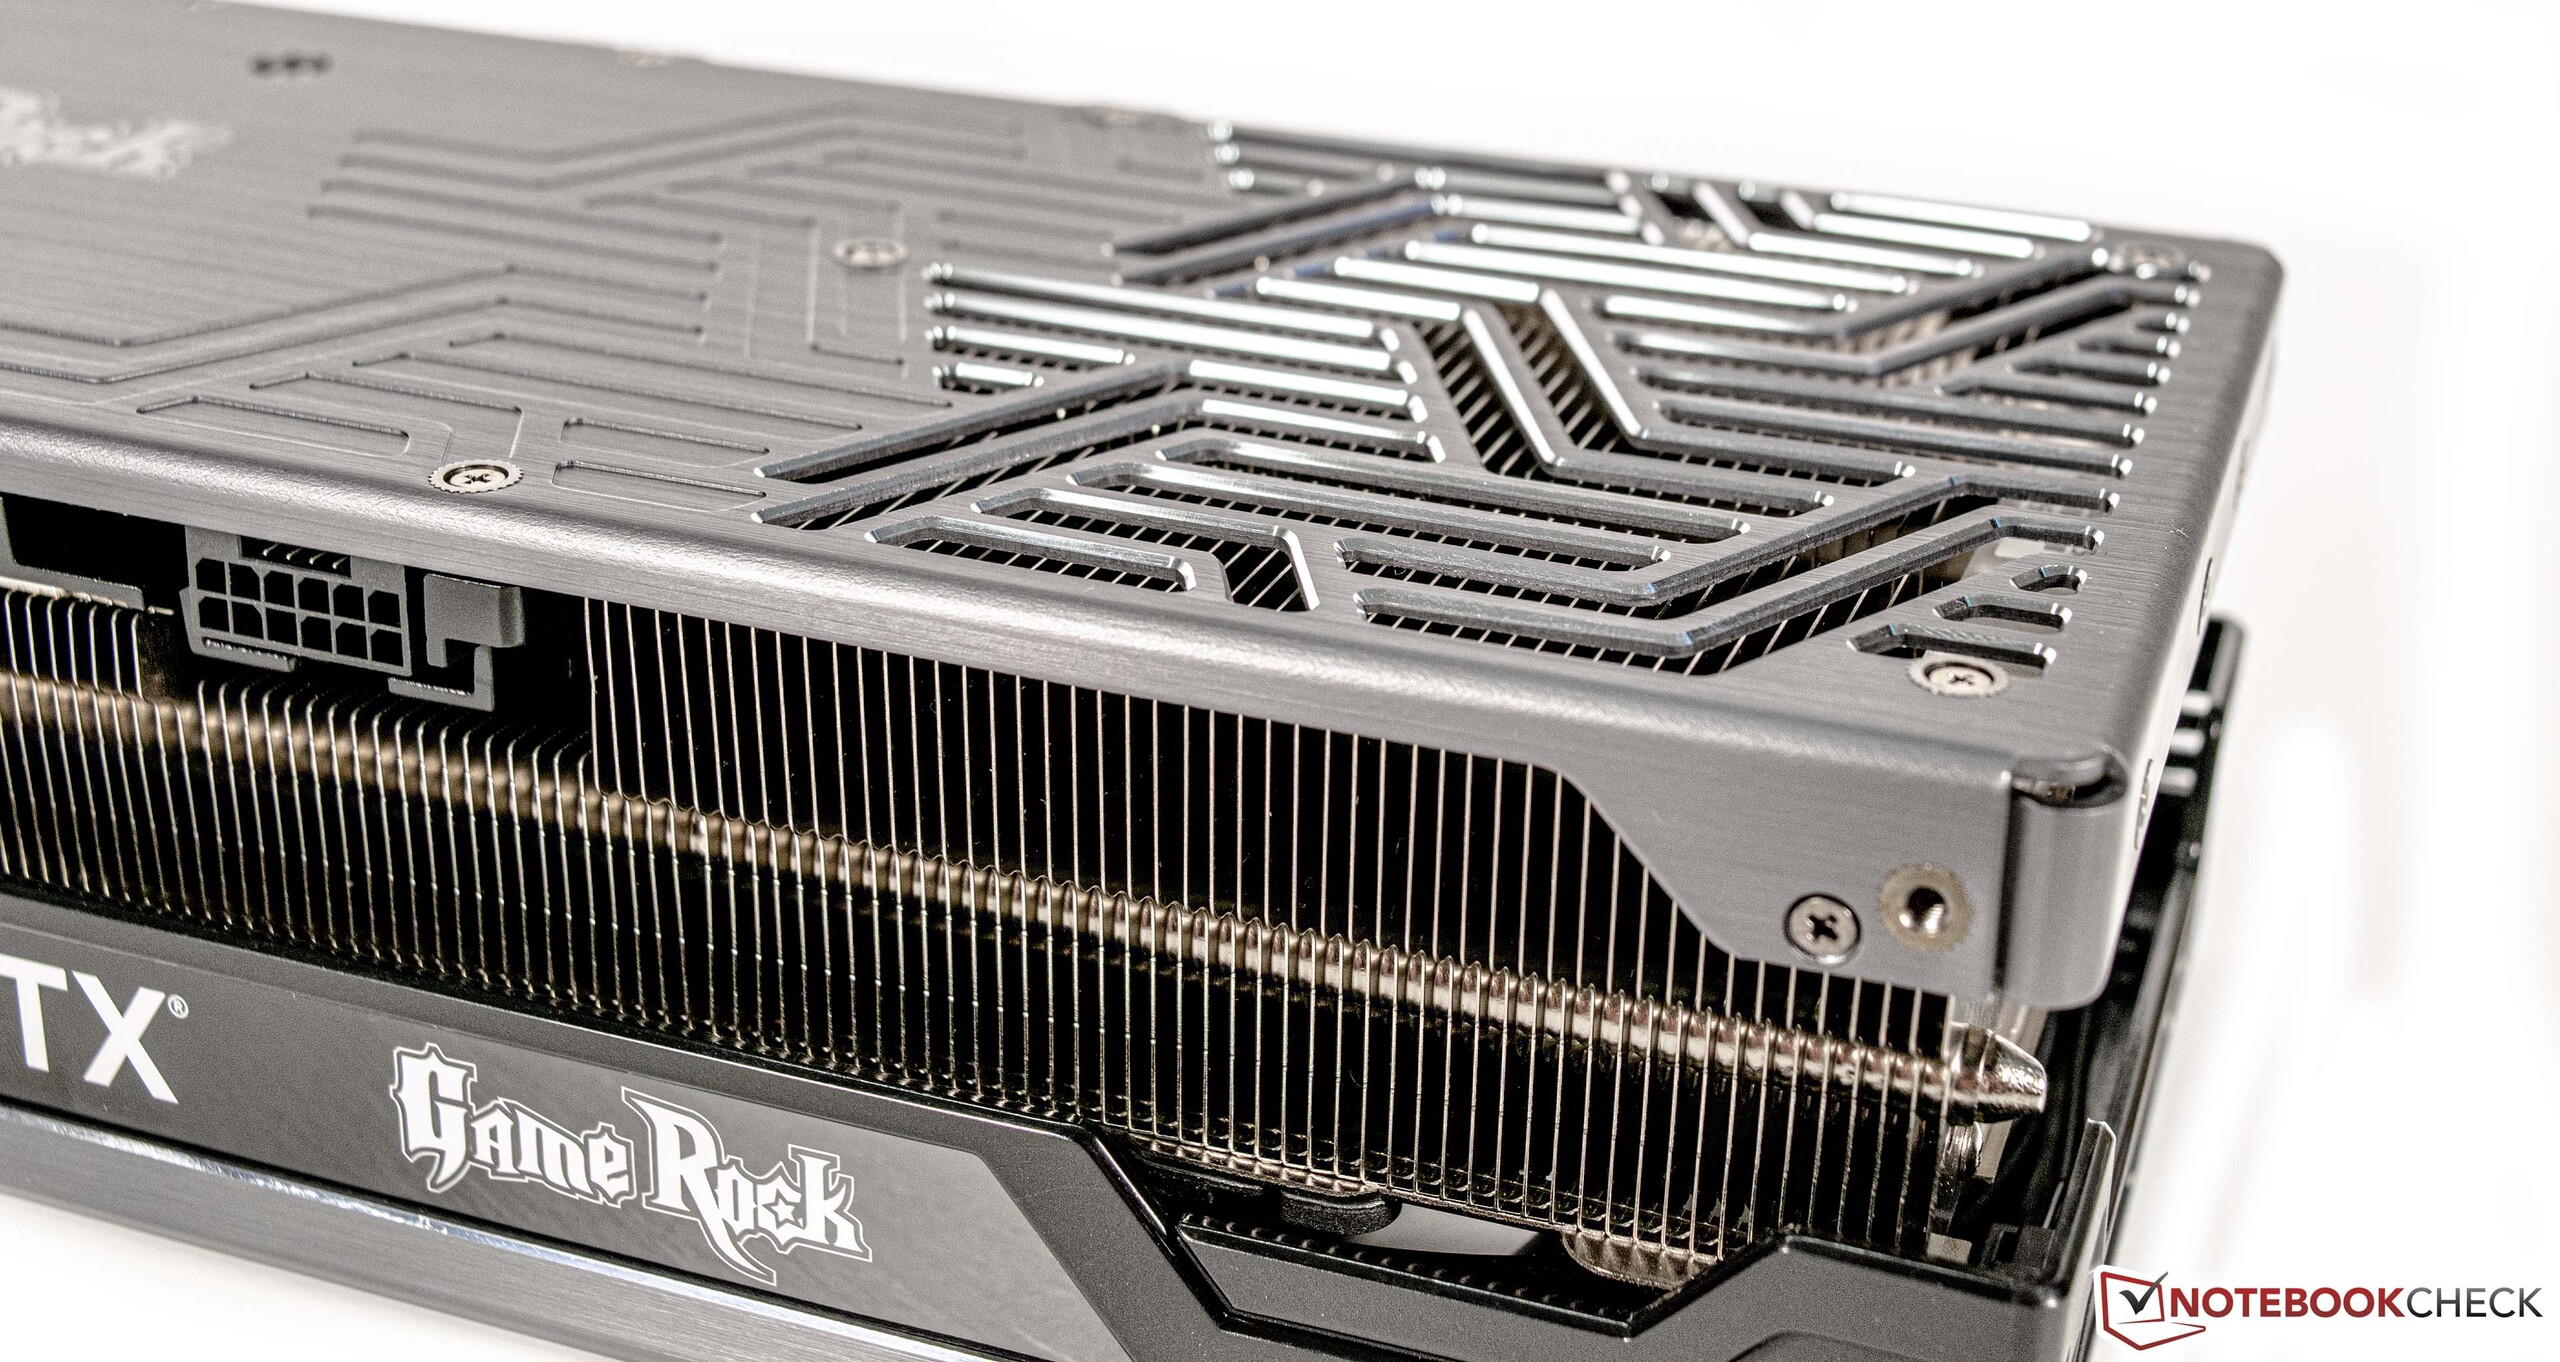
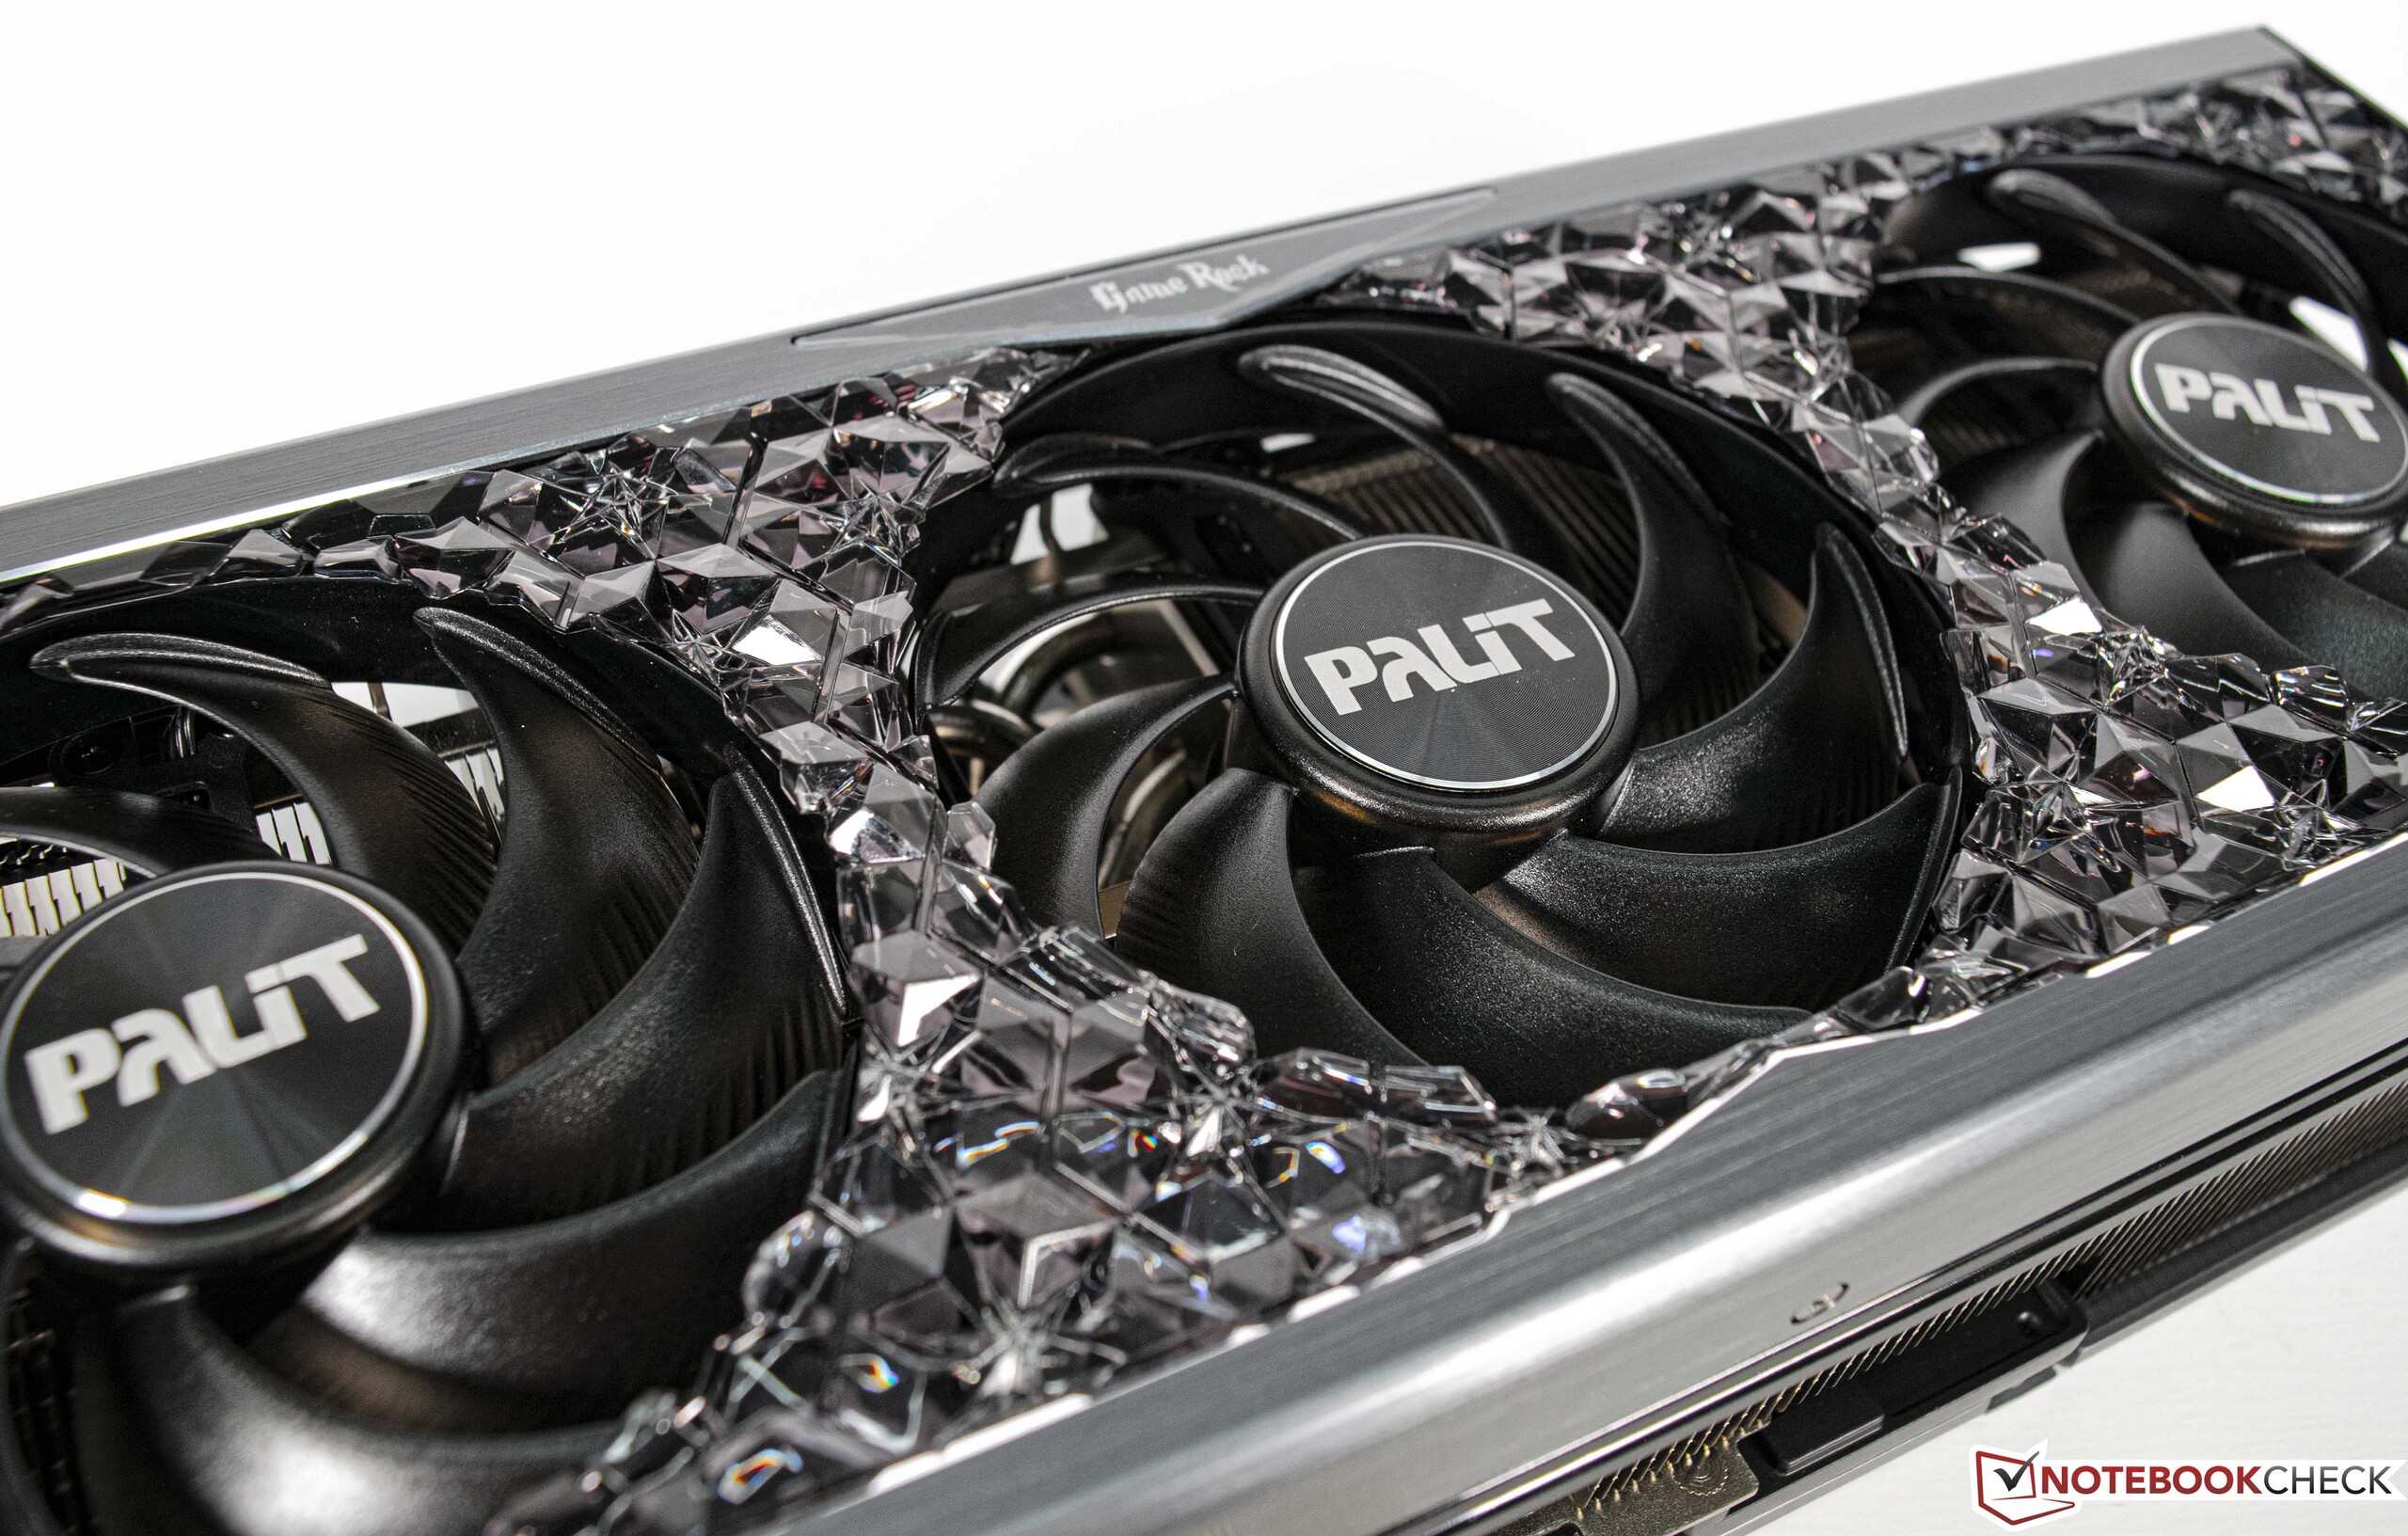
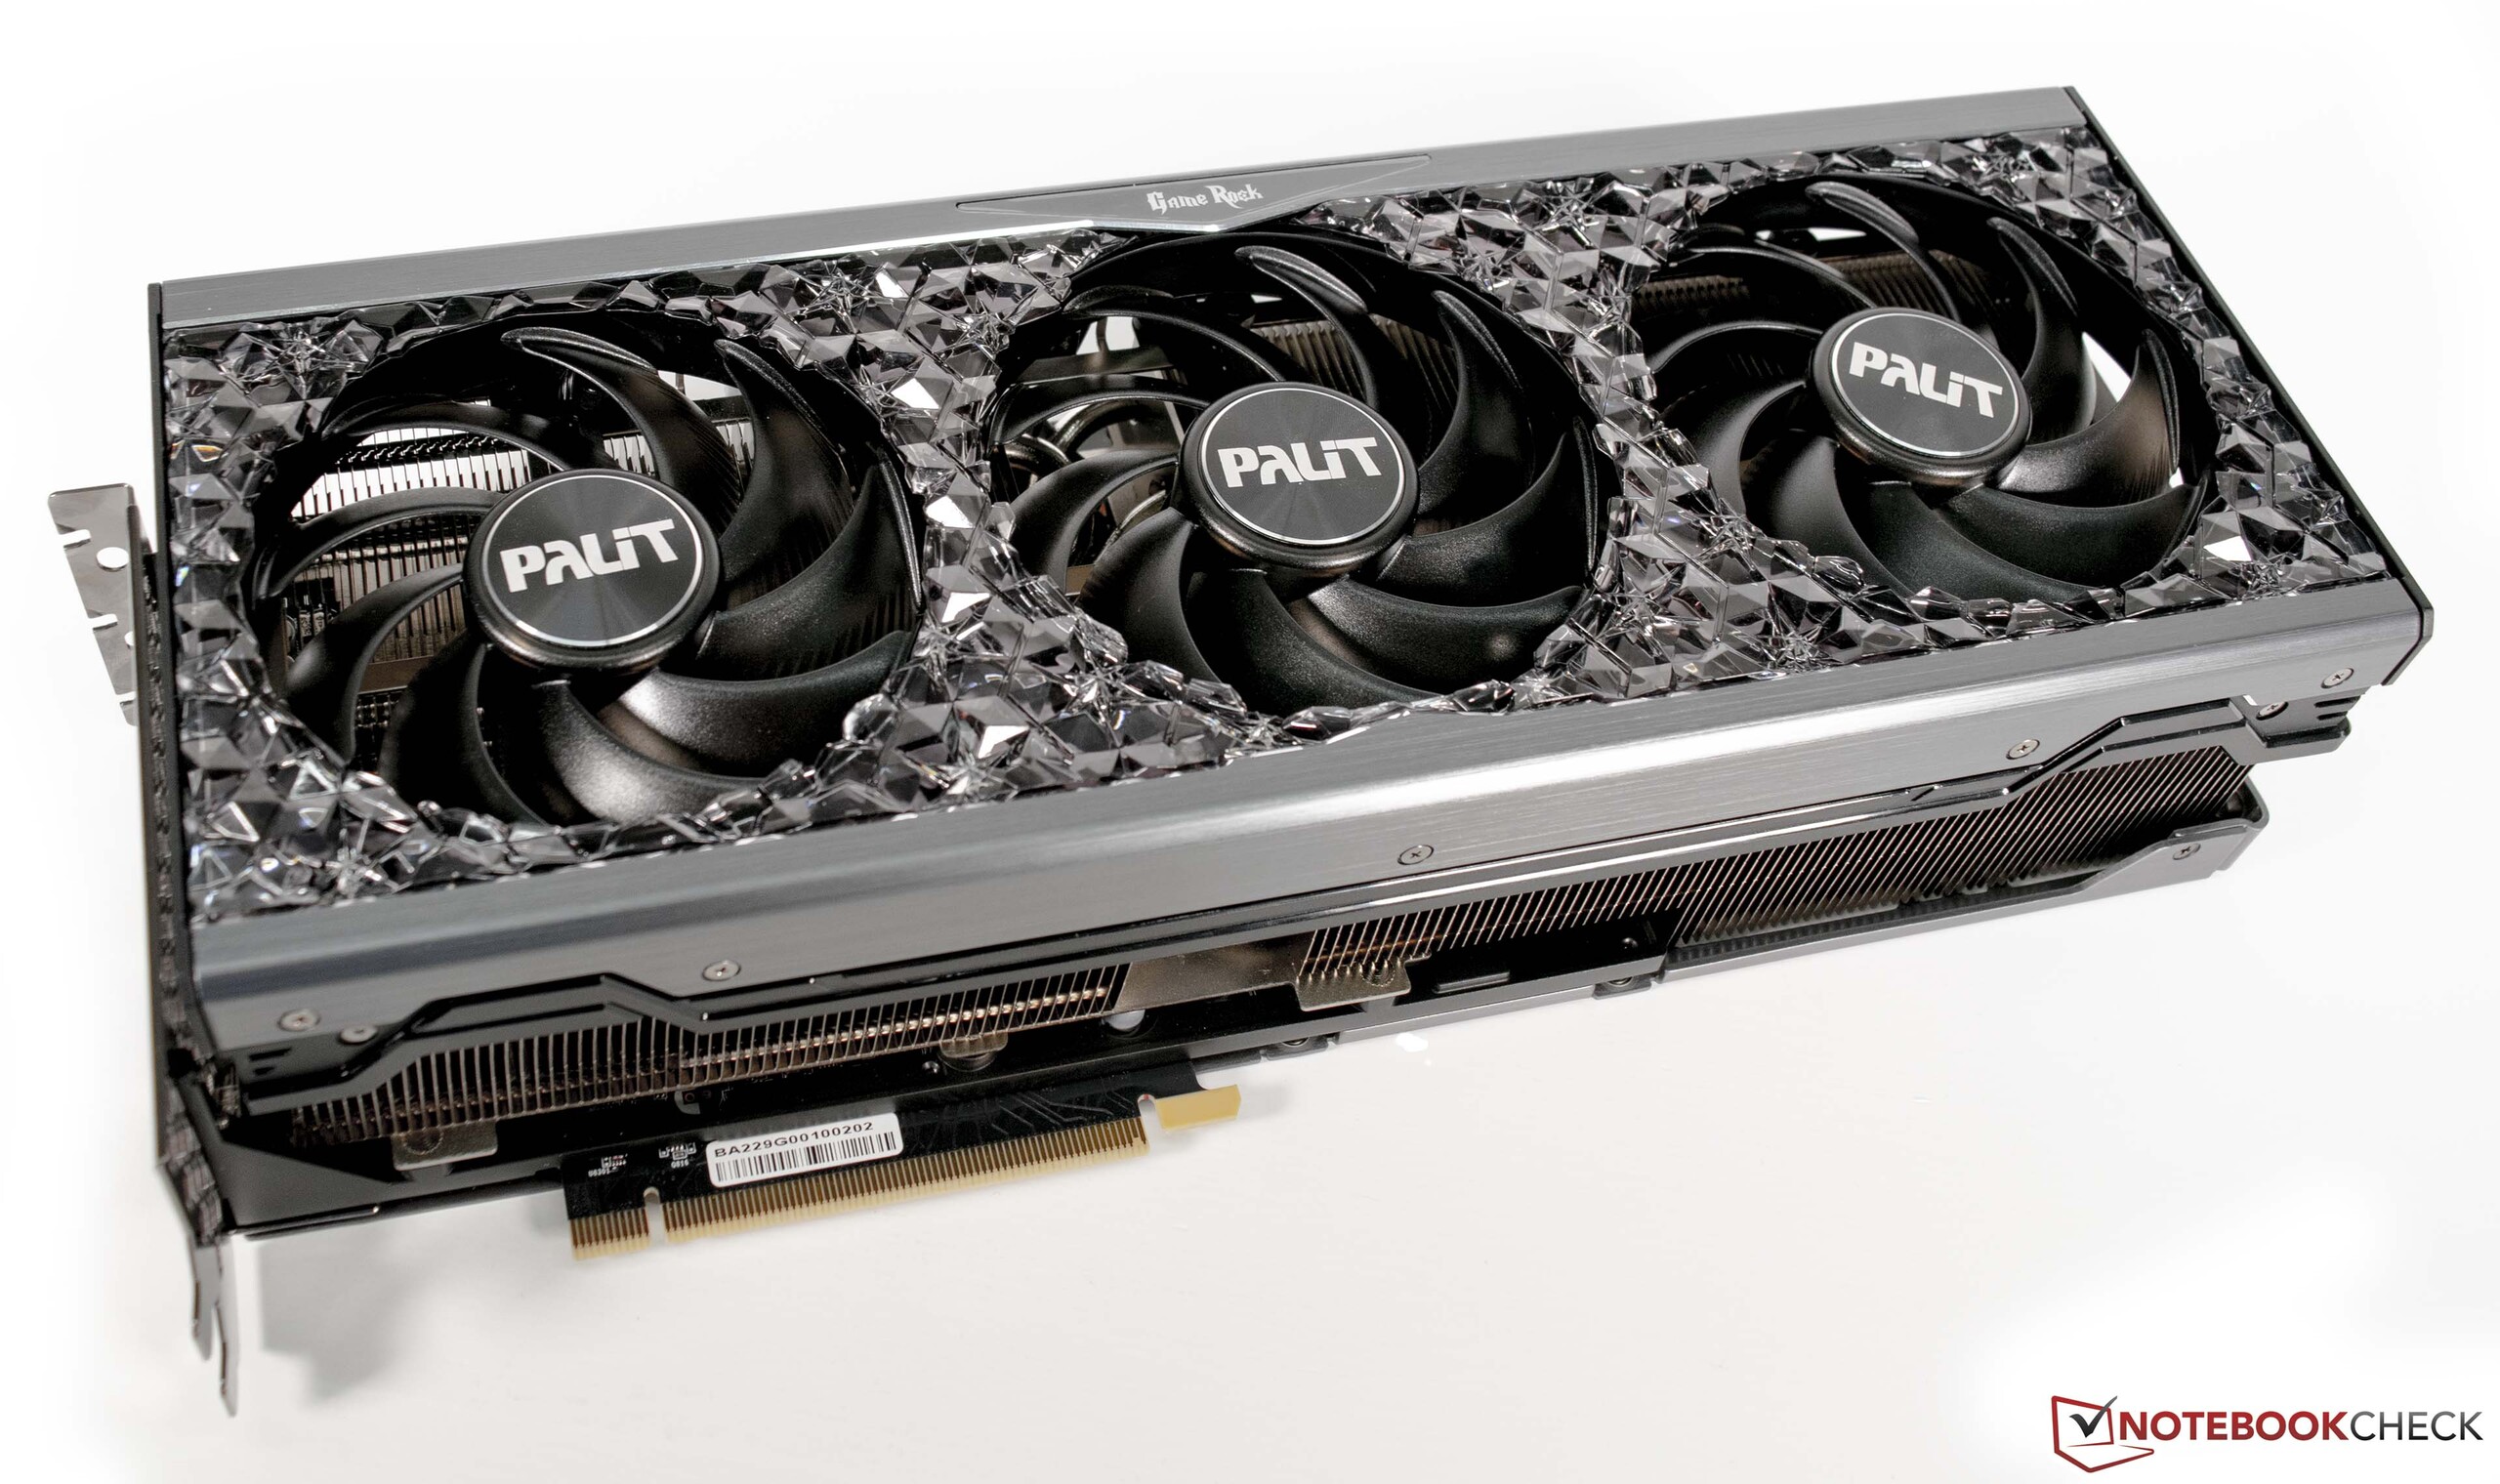
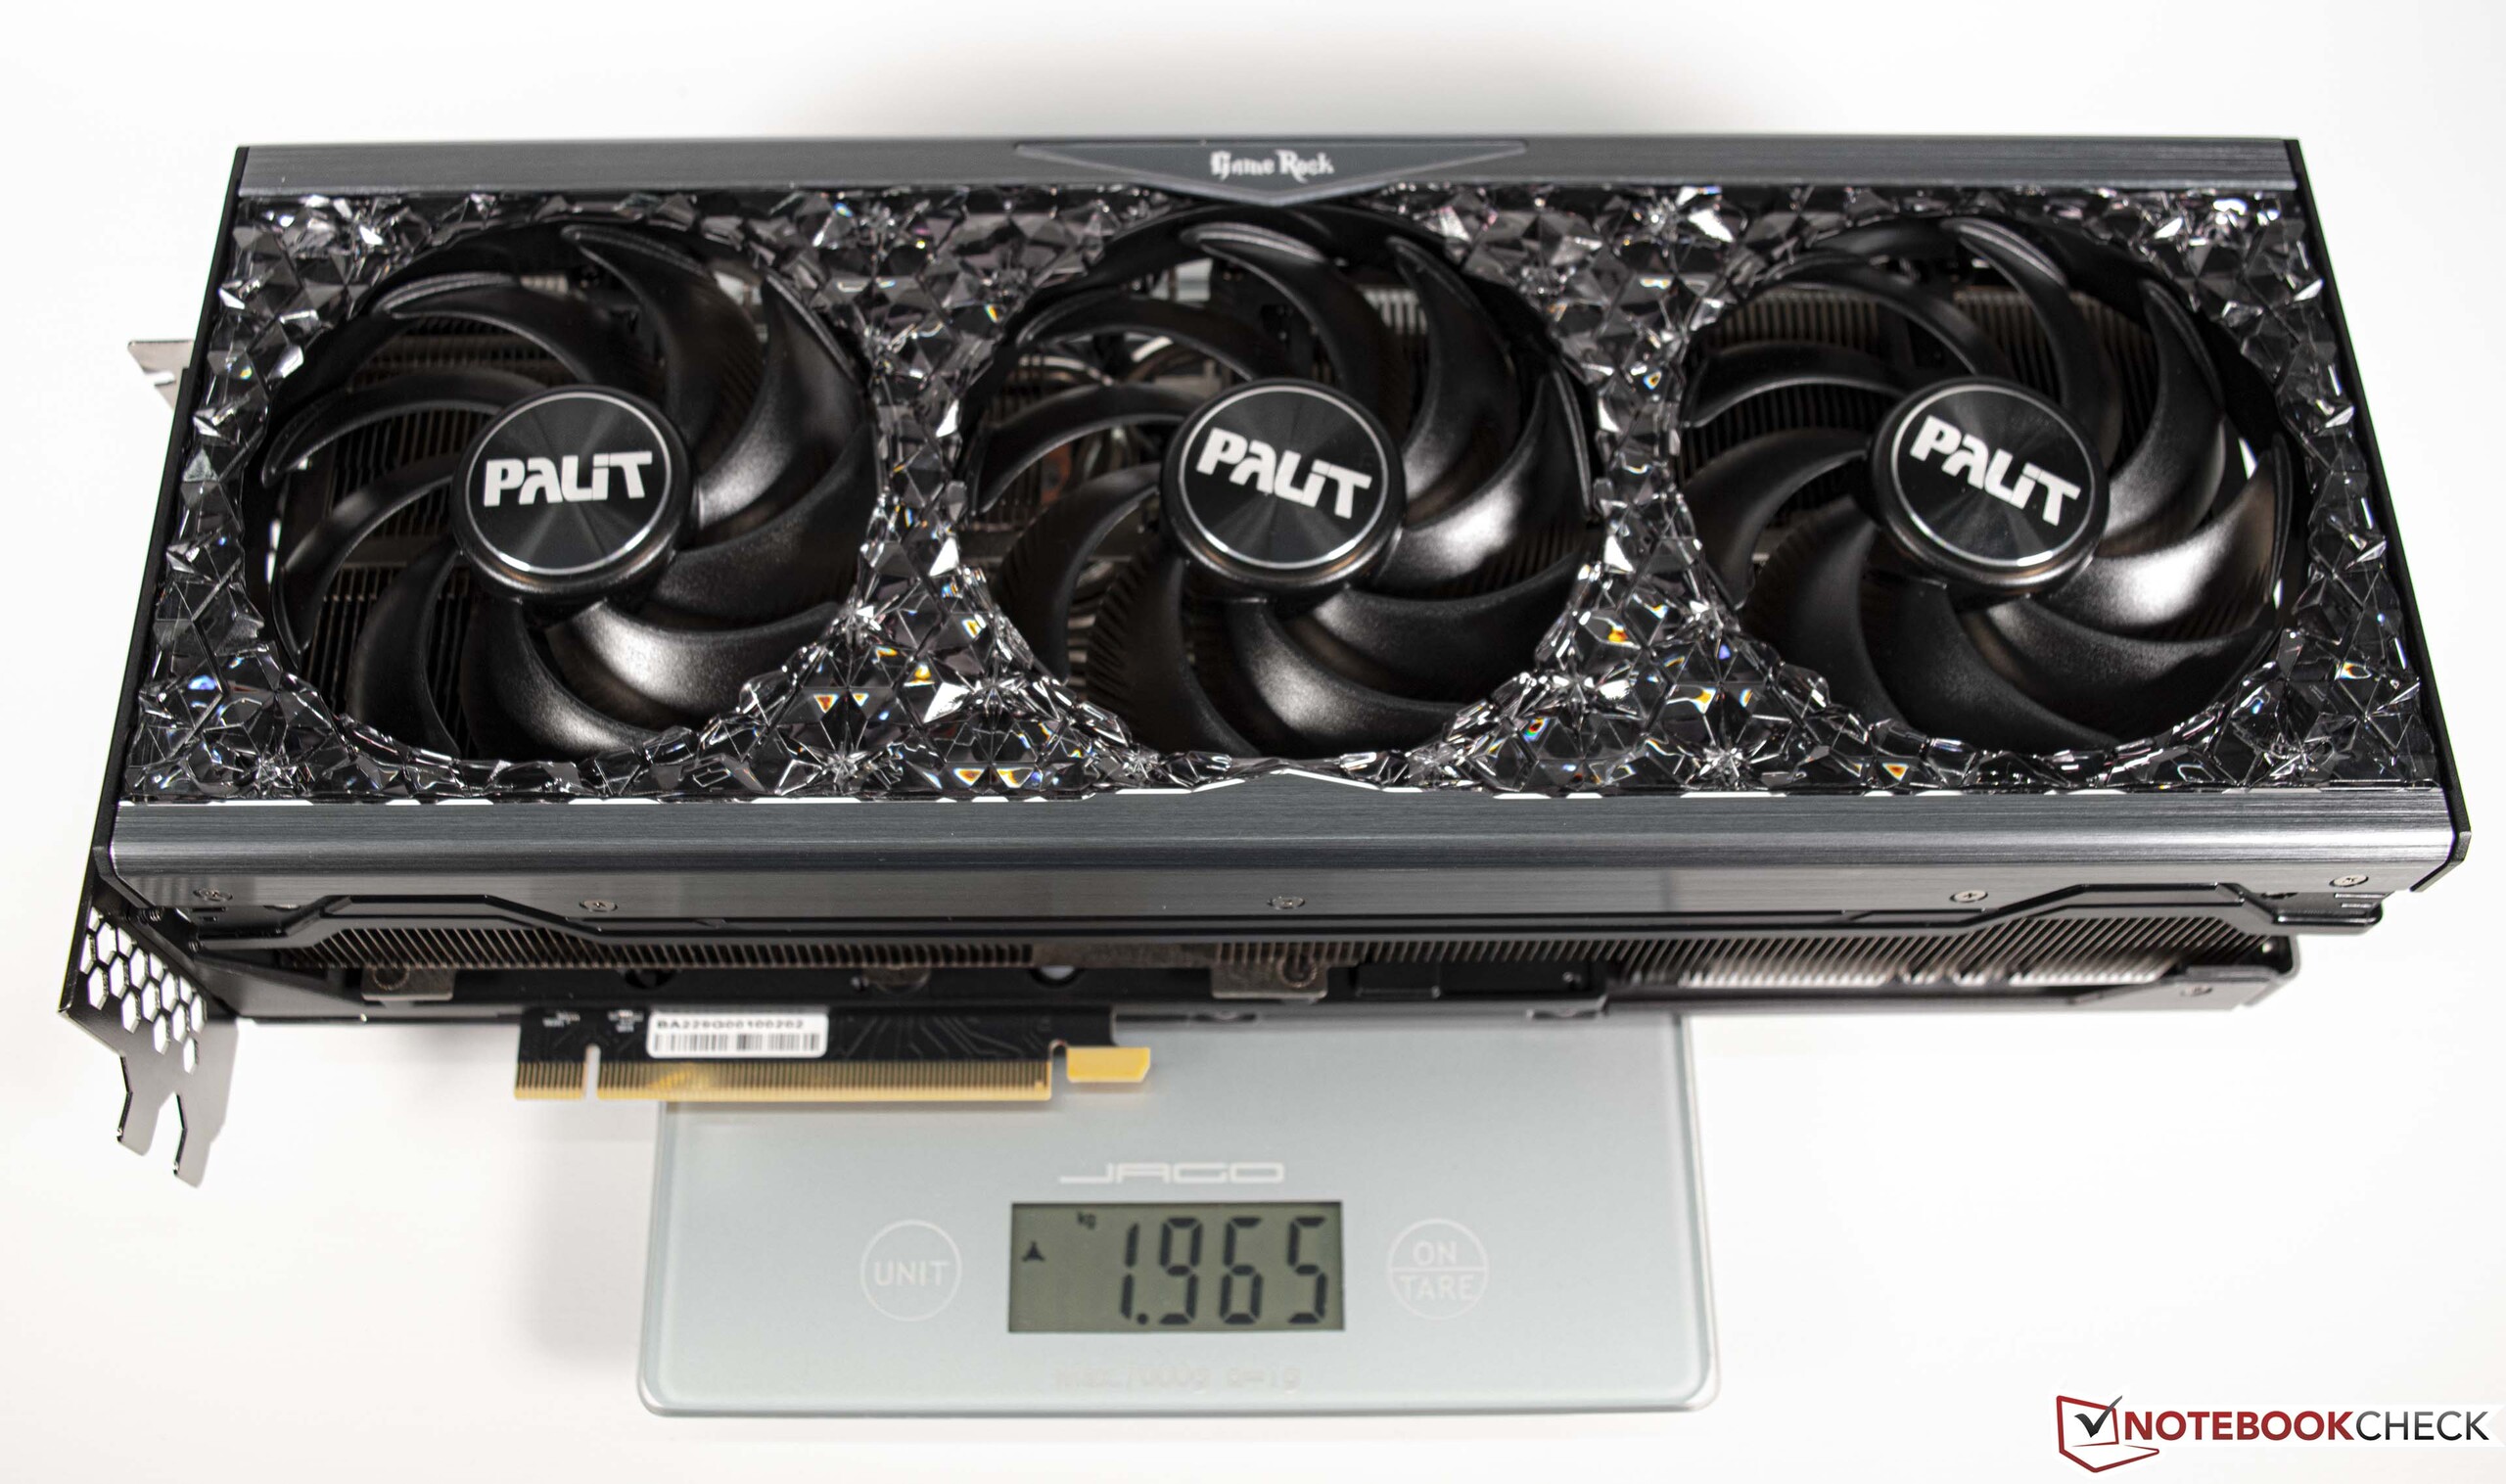
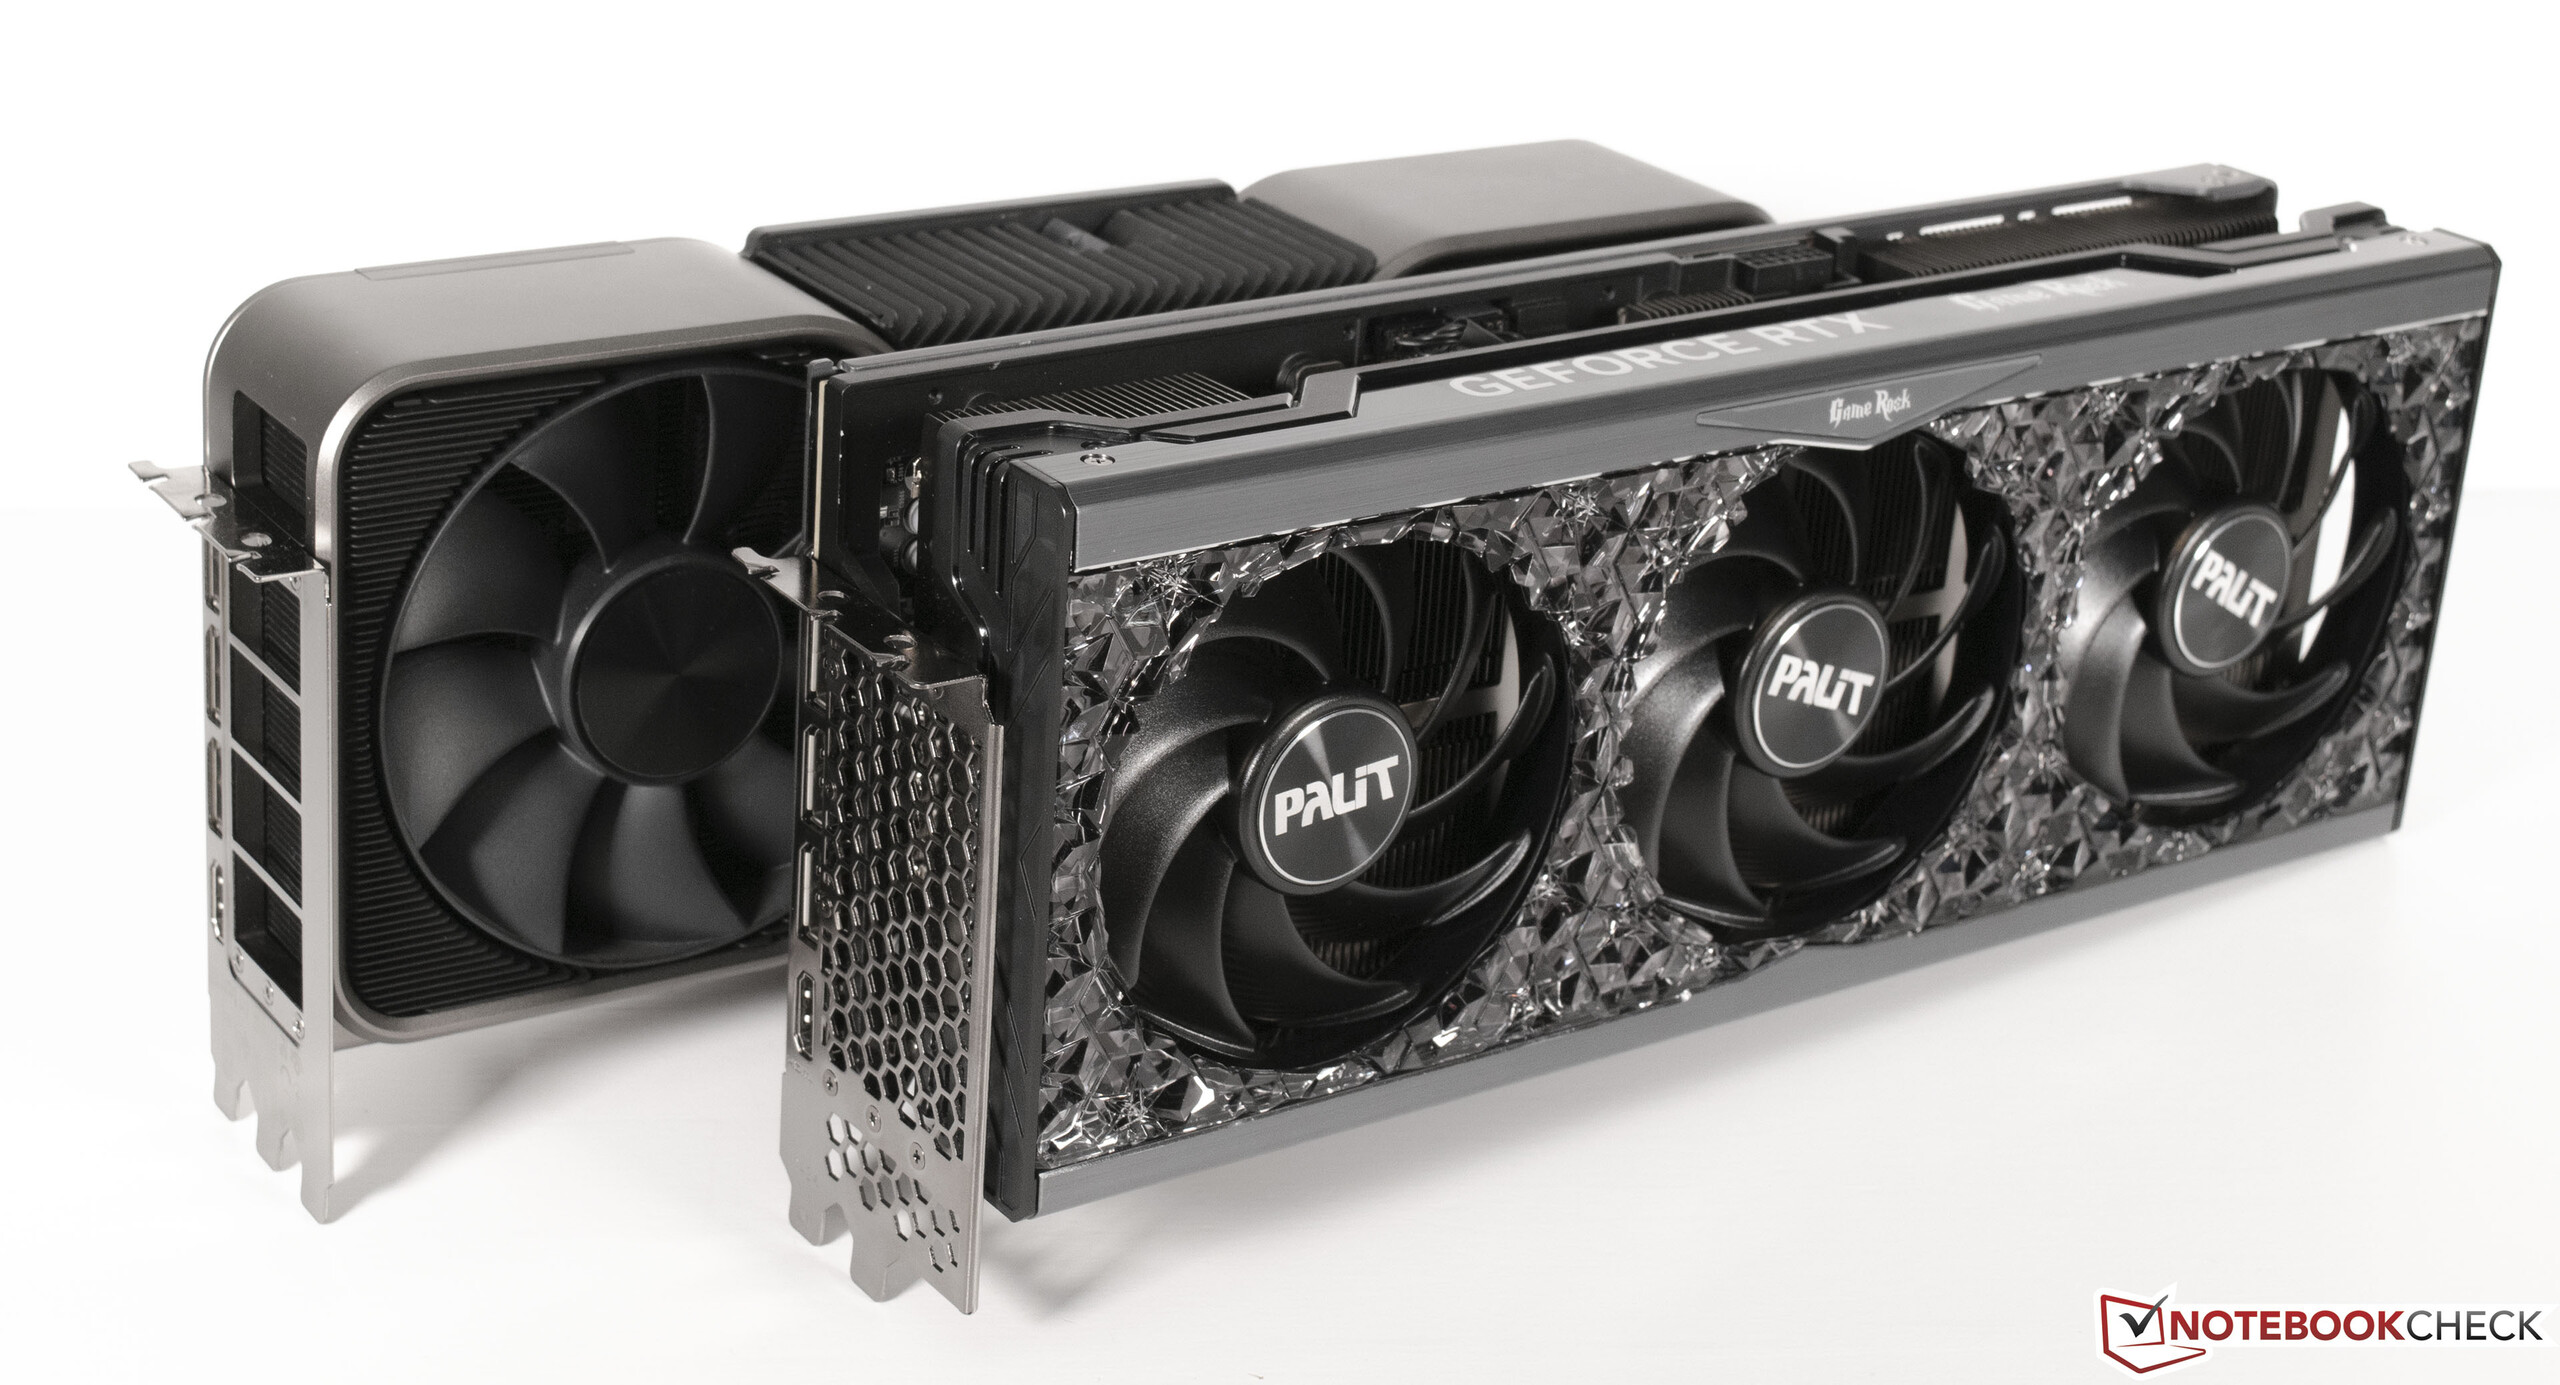
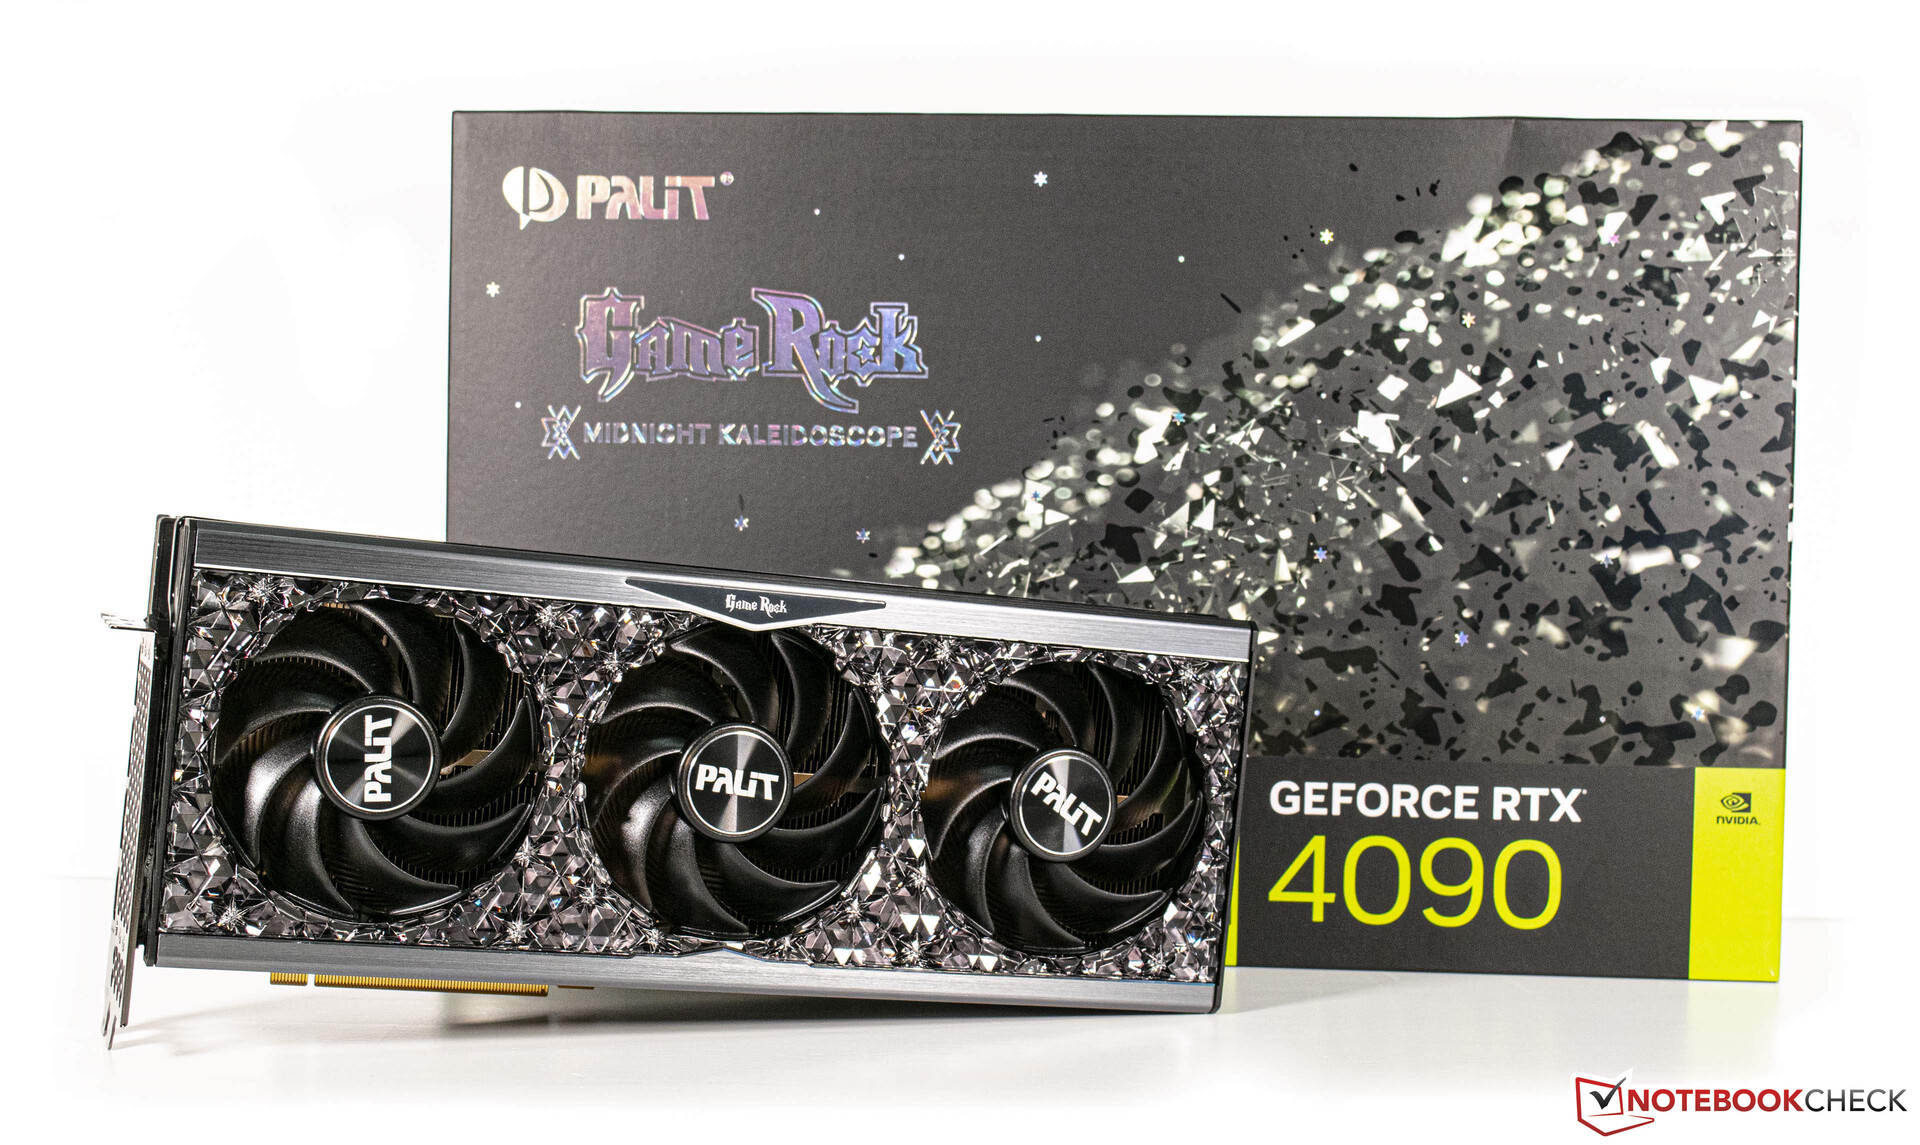
在这次审查中,我们使用的是PalitGeForce RTX 4090 GameRock OC,从视觉上看,它与创始版有很大不同。3.5插槽的冷却设计需要相当大的机箱内部空间,并配备了三个90毫米的风扇。传闻中新的高端显卡的600瓦功率耗散是这种强大的冷却结构的原因,在整个GeForce RTX 4090系列中都可以找到,与制造商无关。它有一些积极的意义,因为在任何地方都看不到芯片和VRAM的温度问题--这一点我们已经可以透露出来。最终,显卡的功耗为450瓦。
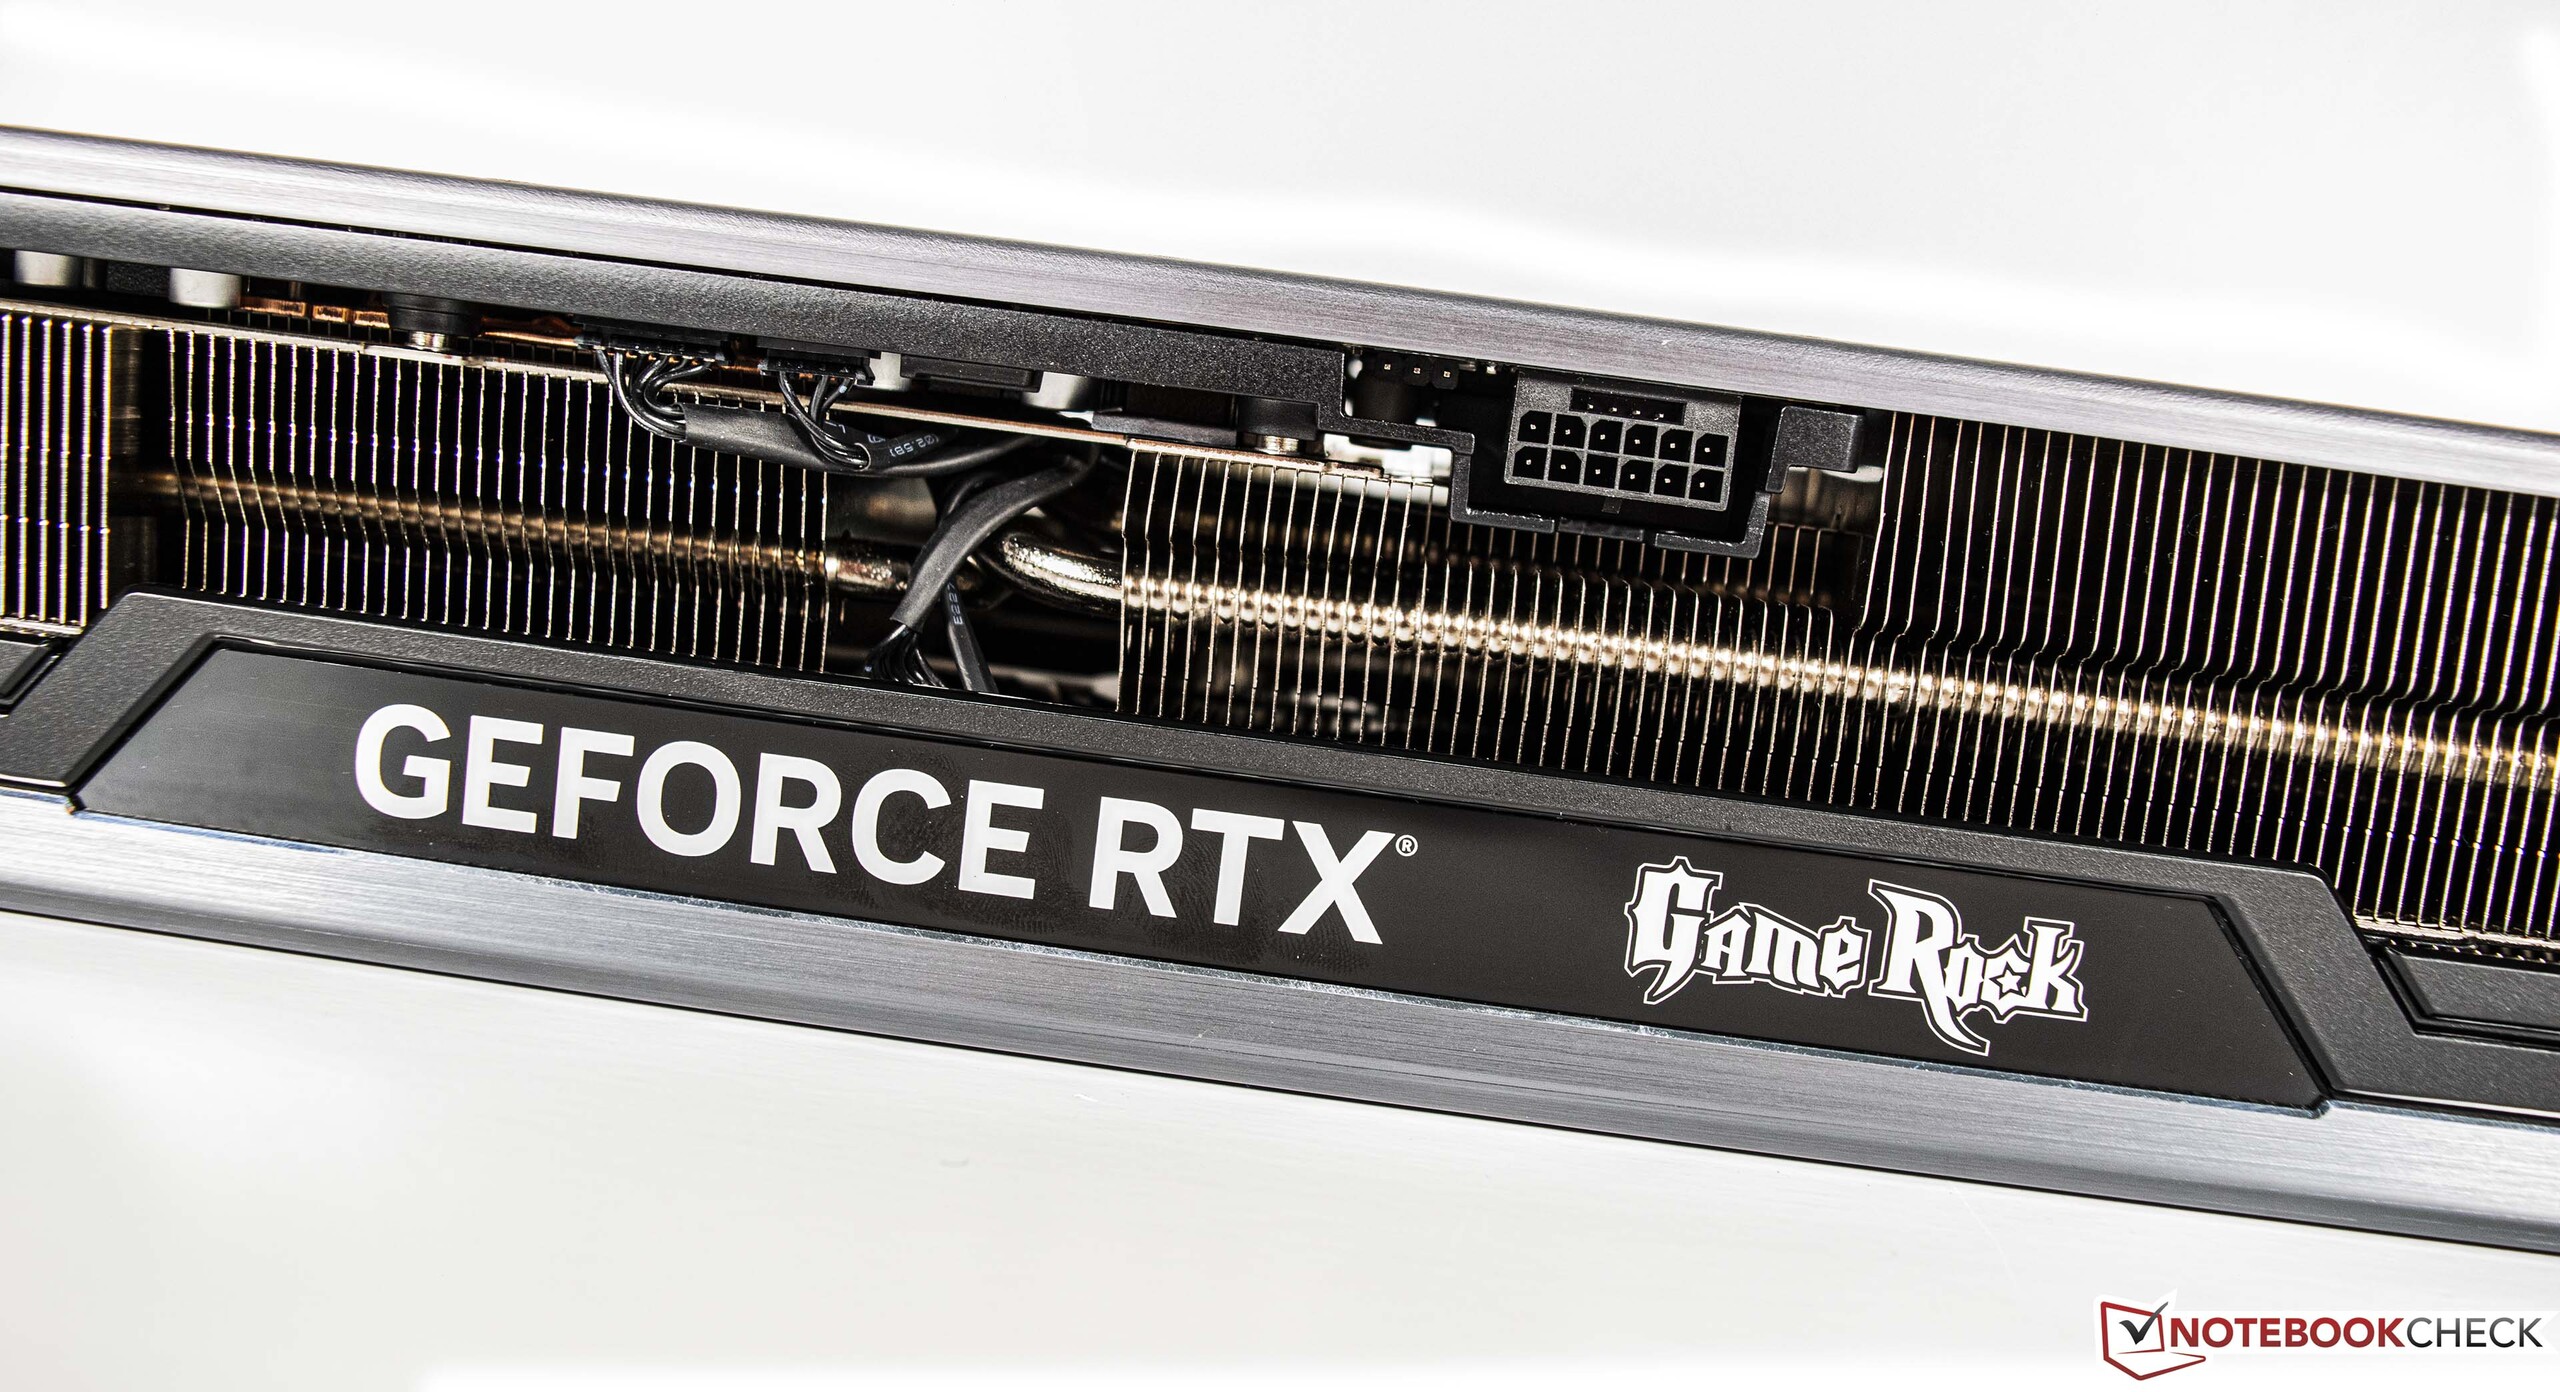
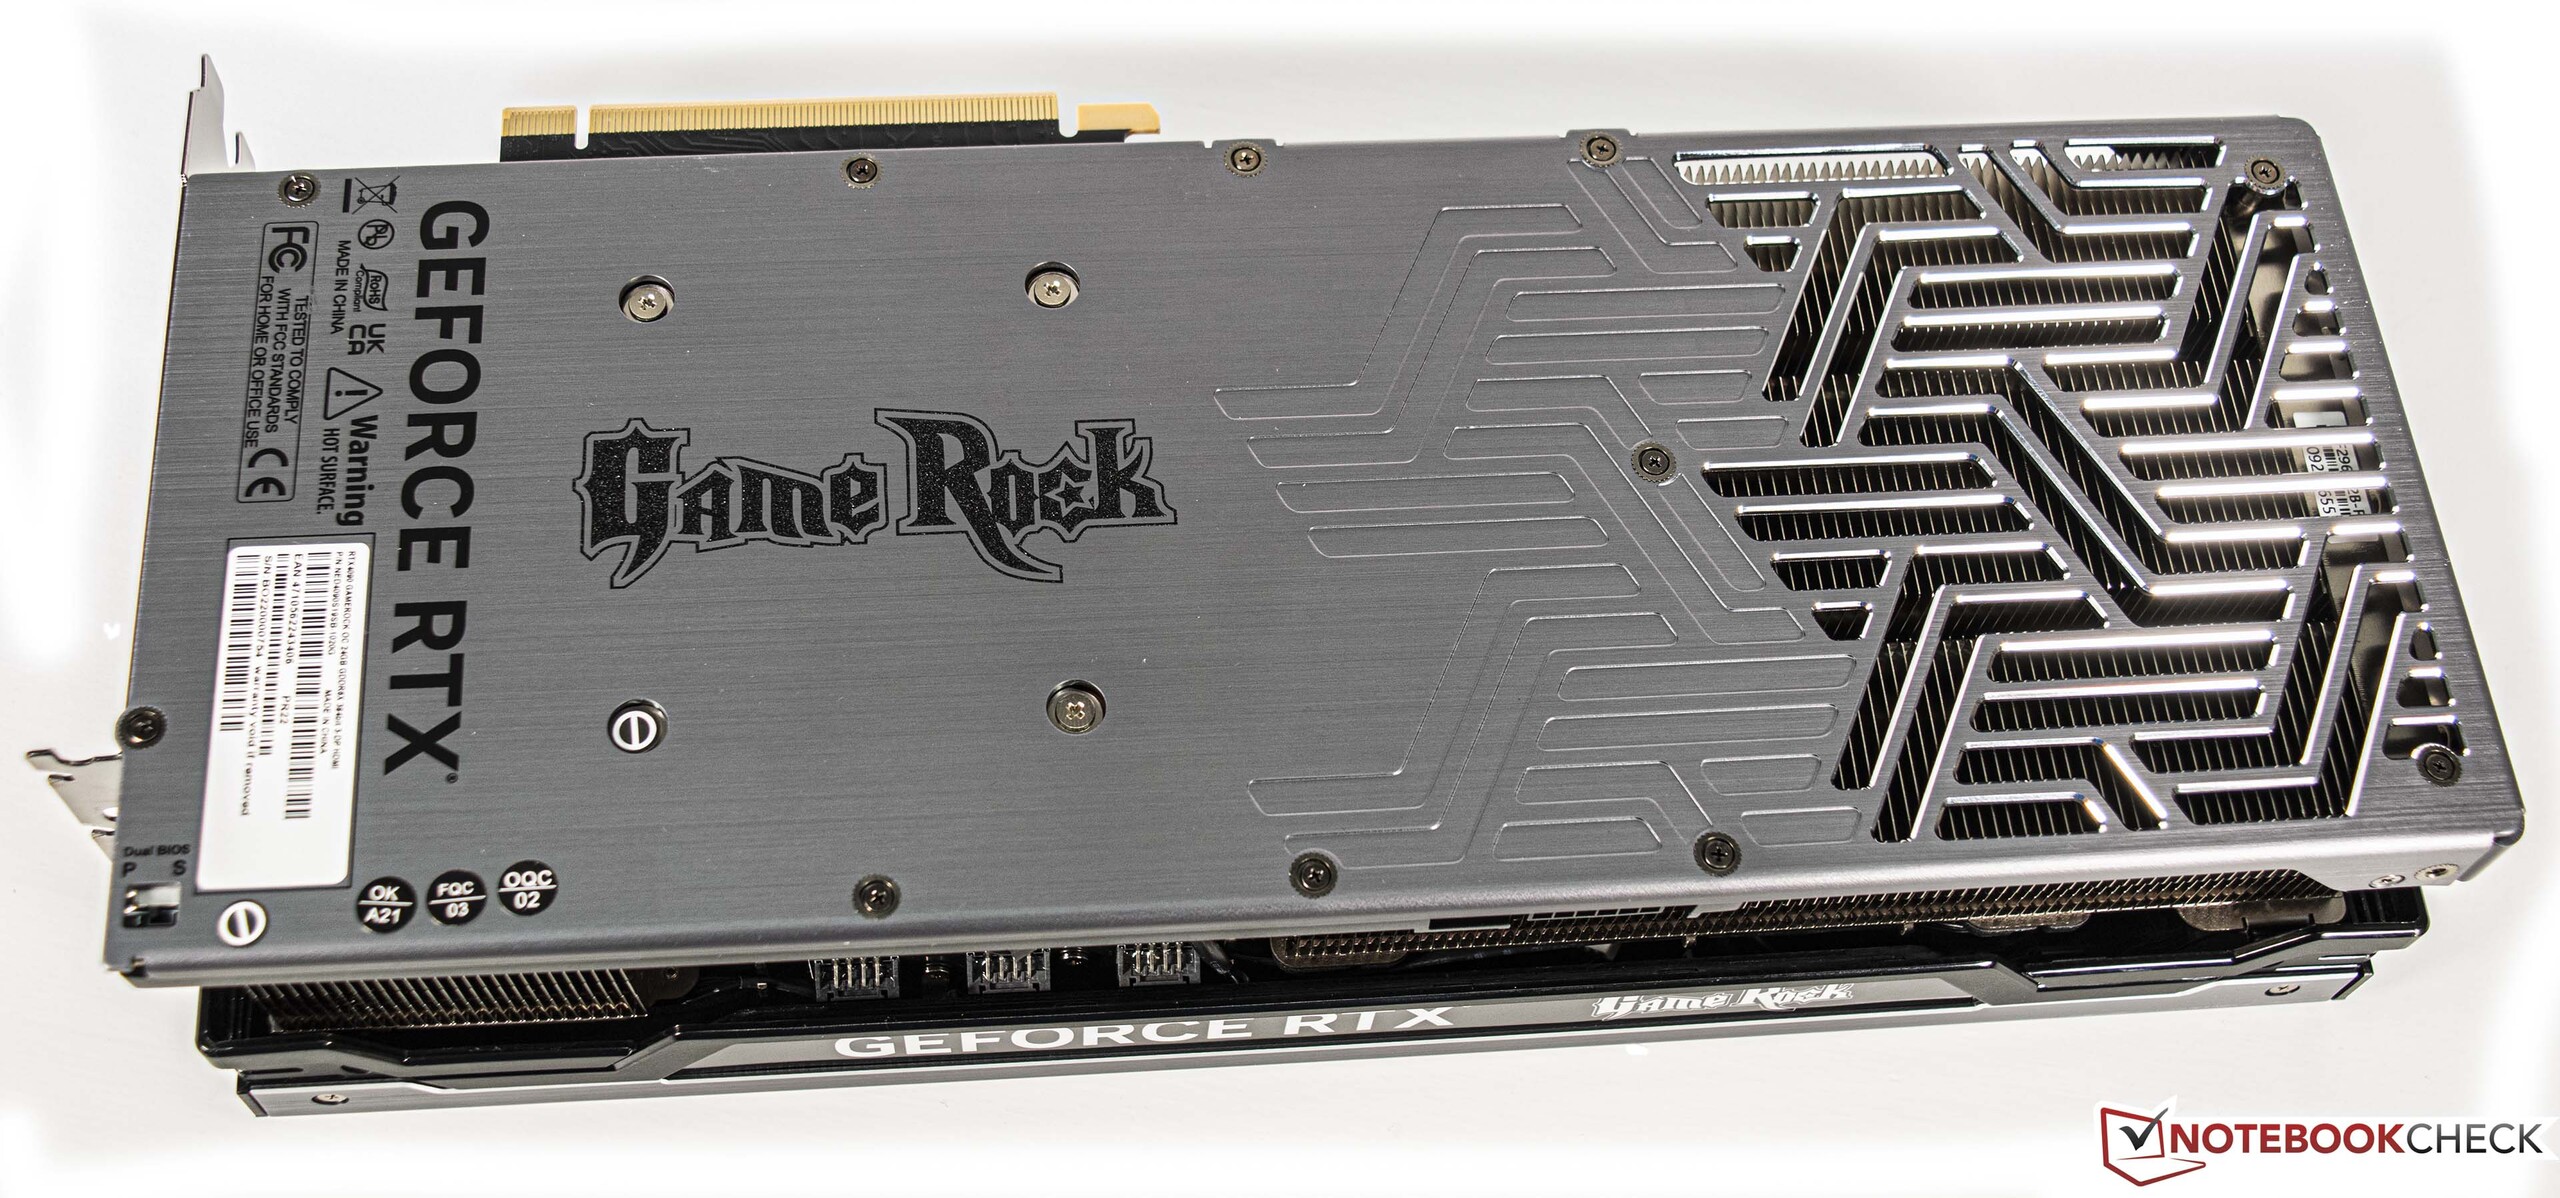
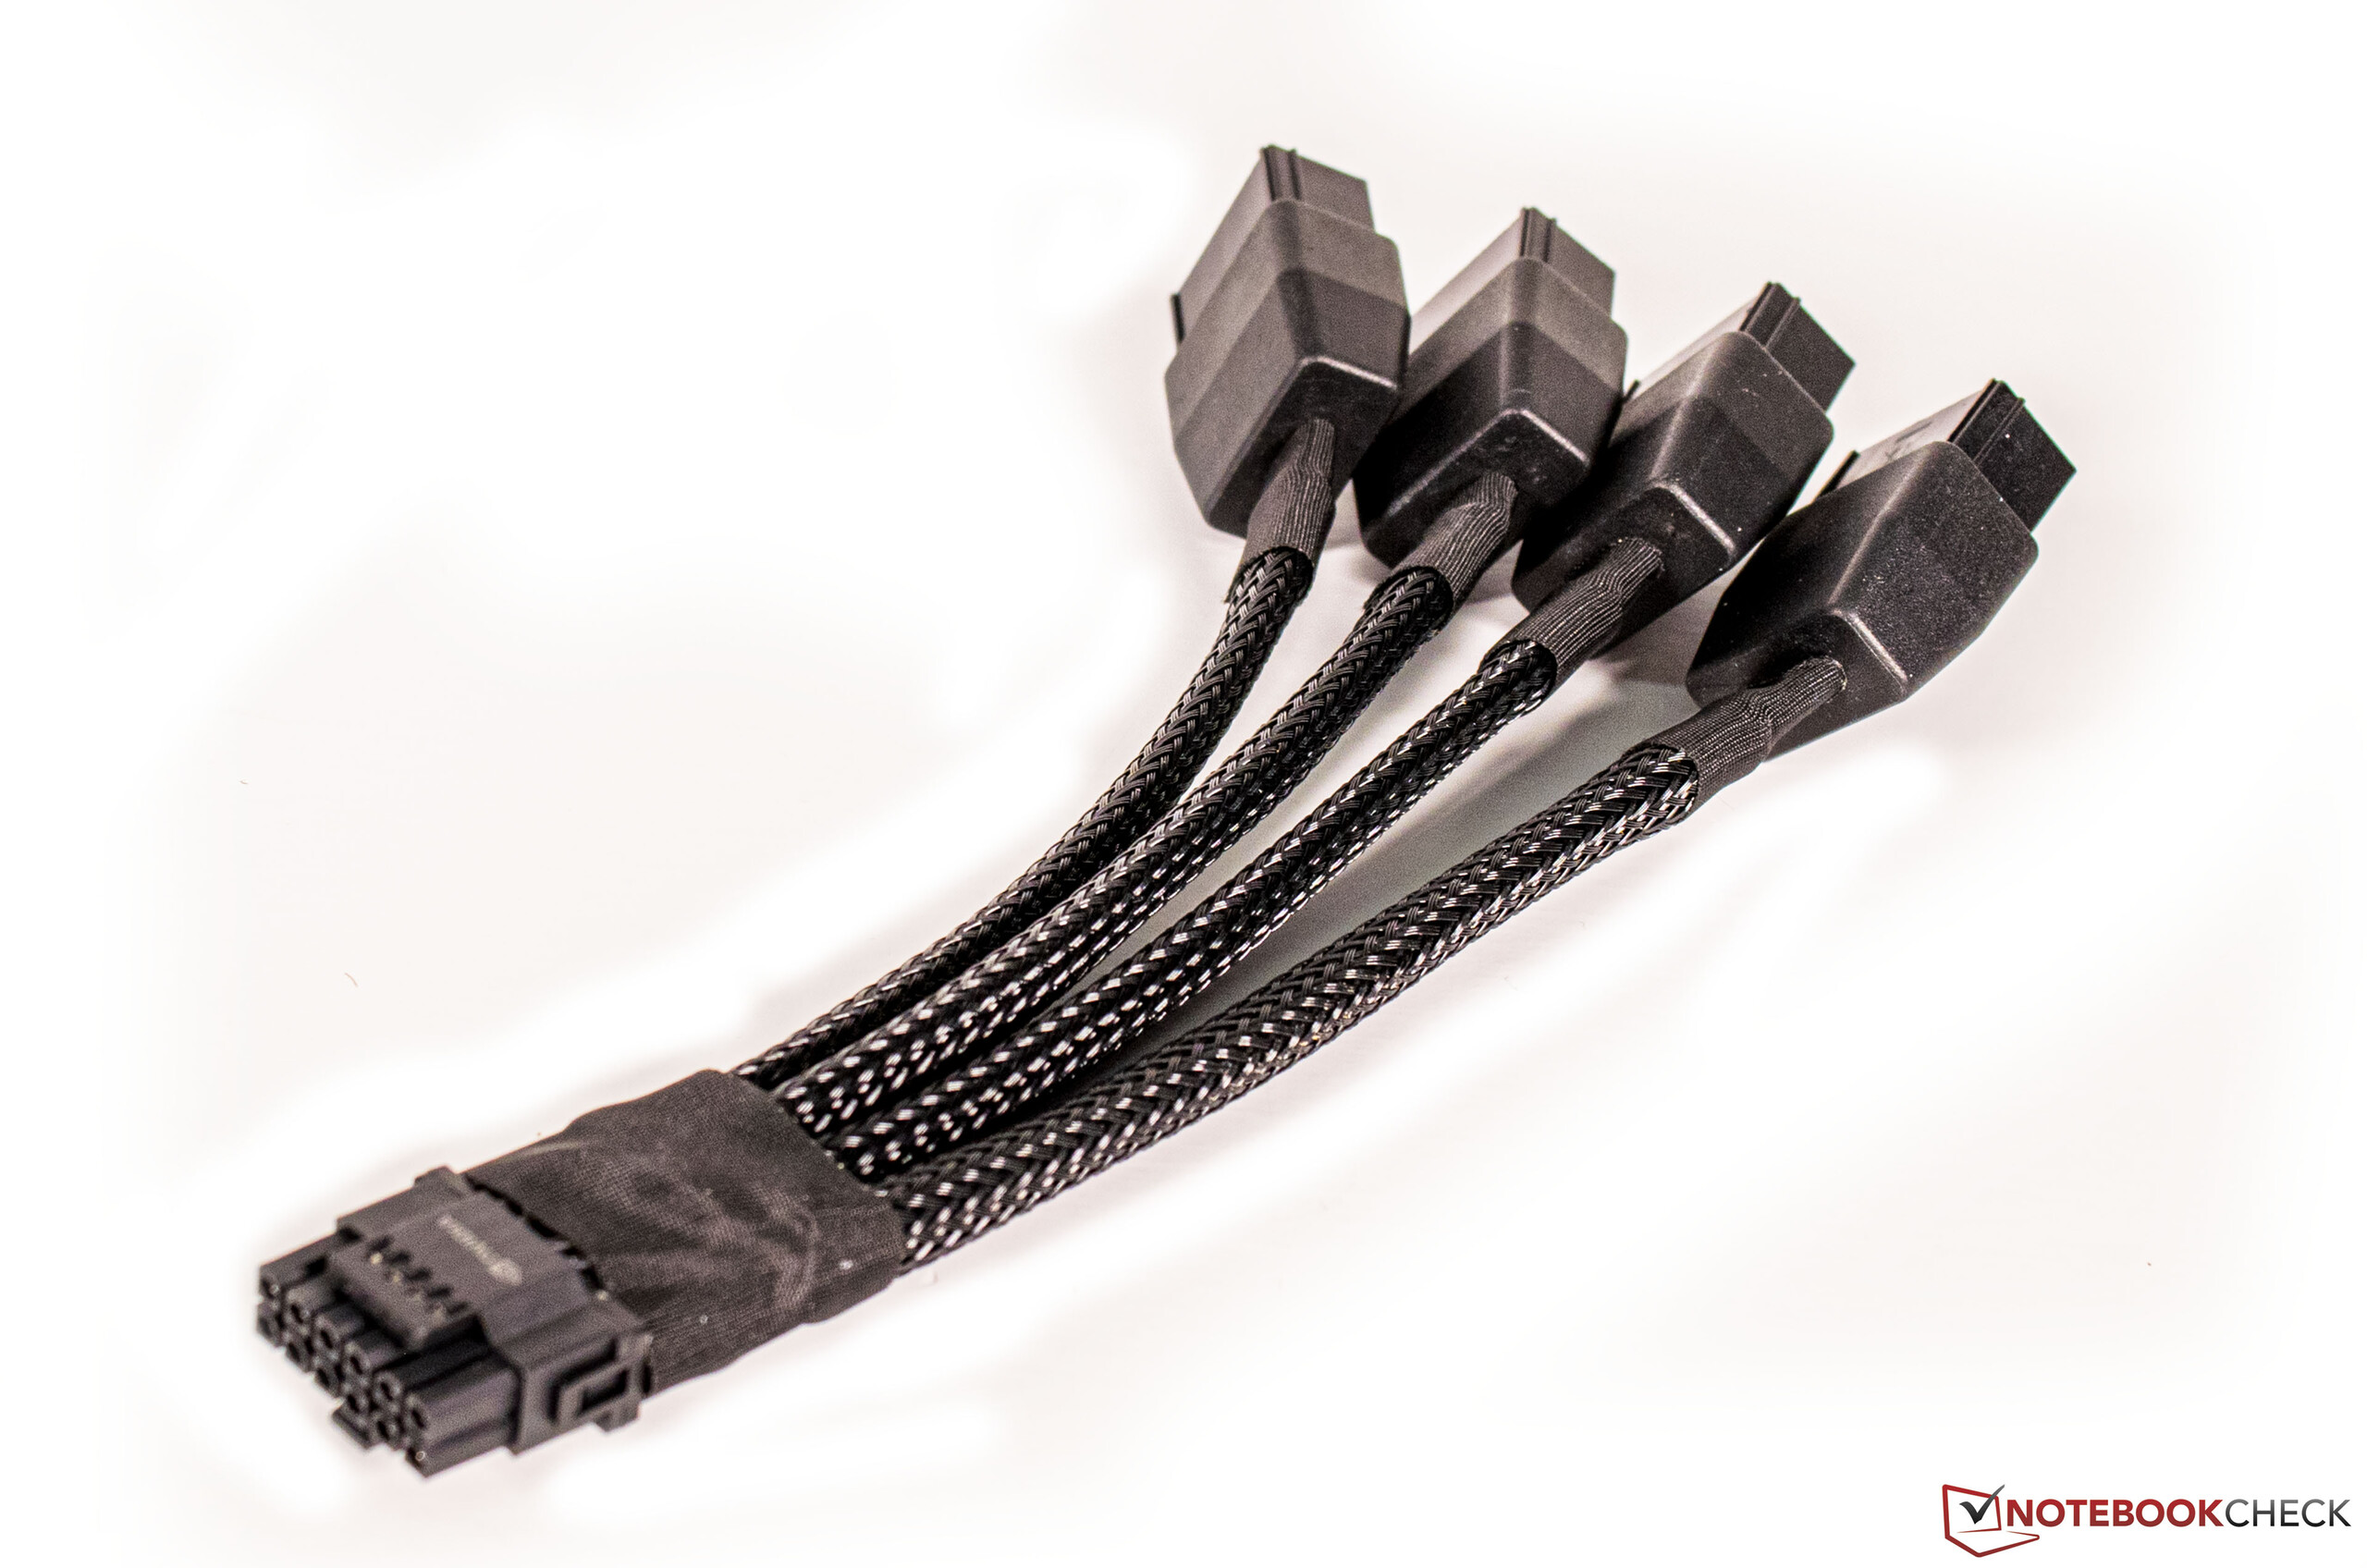
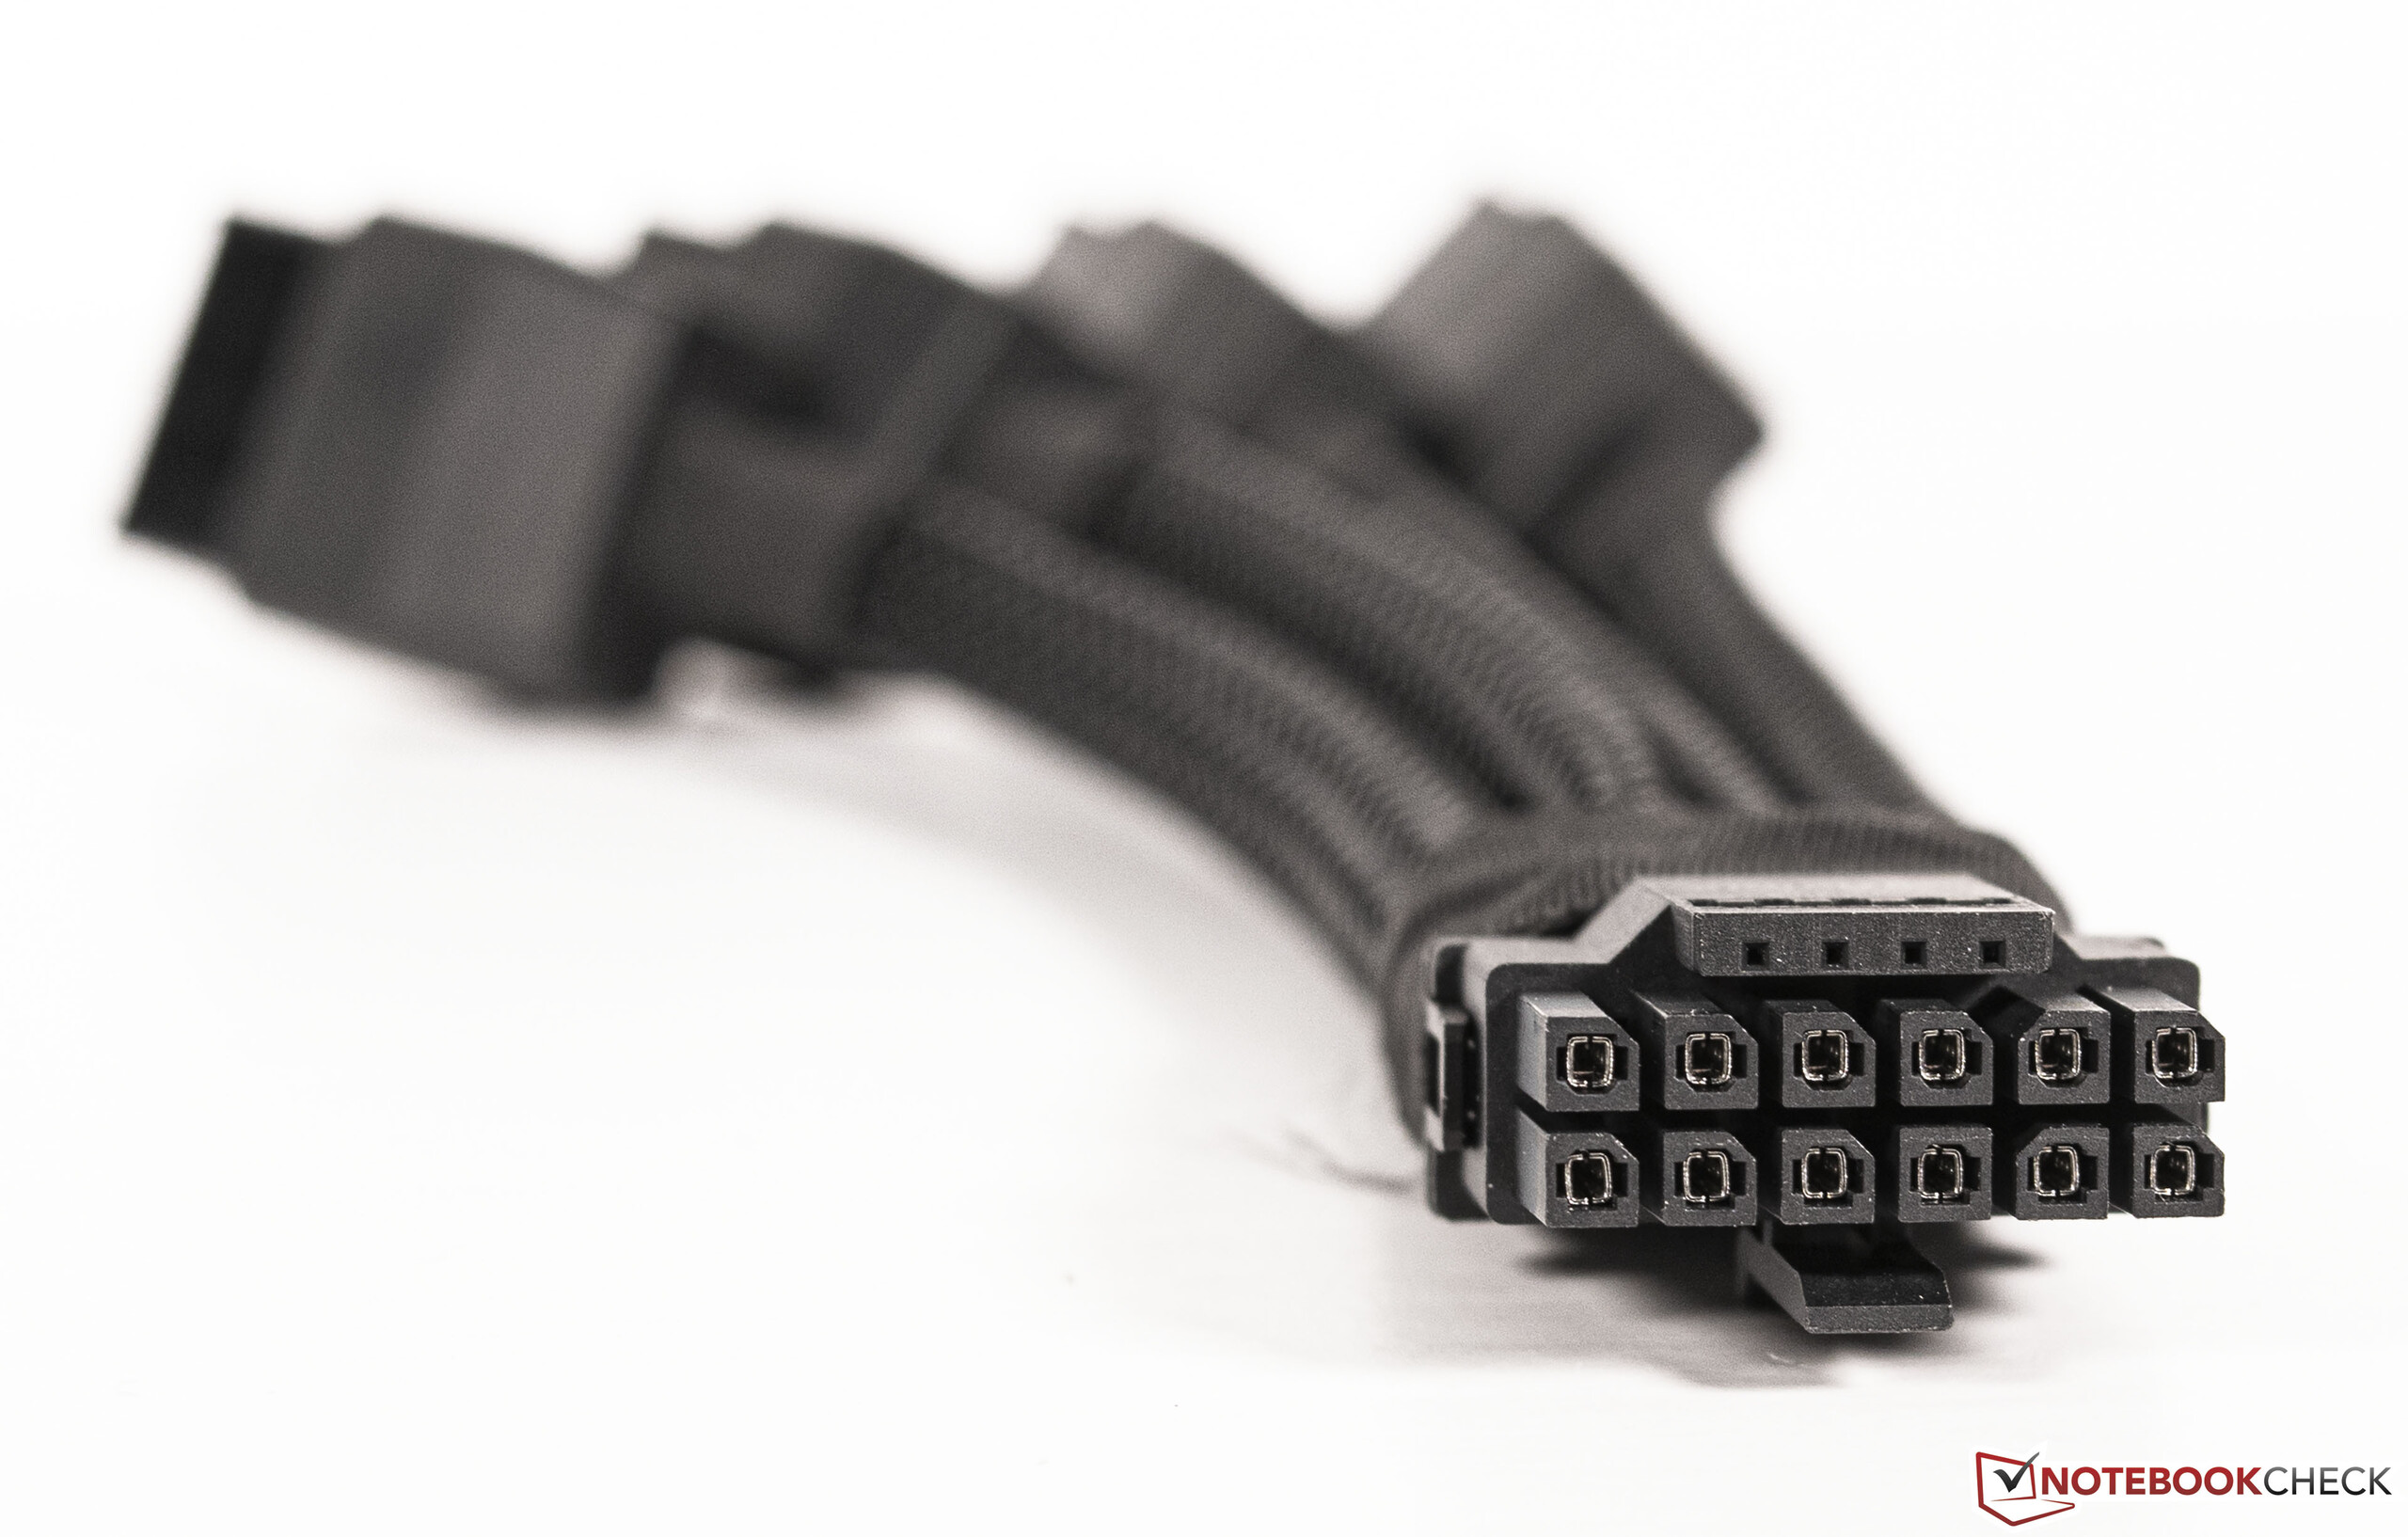
PalitGeForce RTX 4090 GameRock OC模型是一个真正的吸引人的东西,因为所谓的午夜万花筒设计,包括微妙的RGB照明。与其他RTX 4090显卡相比,我们的审查样本只有不到2公斤(4.4磅),属于轻量级。尽管如此,盒子里还包括一个显卡支架,帮助支持显卡的水平安装。此外,还有一个备受关注的主适配器,它将四个8针电源连接器合并到显卡的新12VHPWR连接器上。在这一点上,我们不希望进入技术构建和准确性。然而,应该小心处理该适配器,以避免潜在的故障。我们建议使用电源制造商提供的适当的连接器电缆。我们所有的测试都是用相应的适配器进行的,到目前为止没有遇到任何问题。
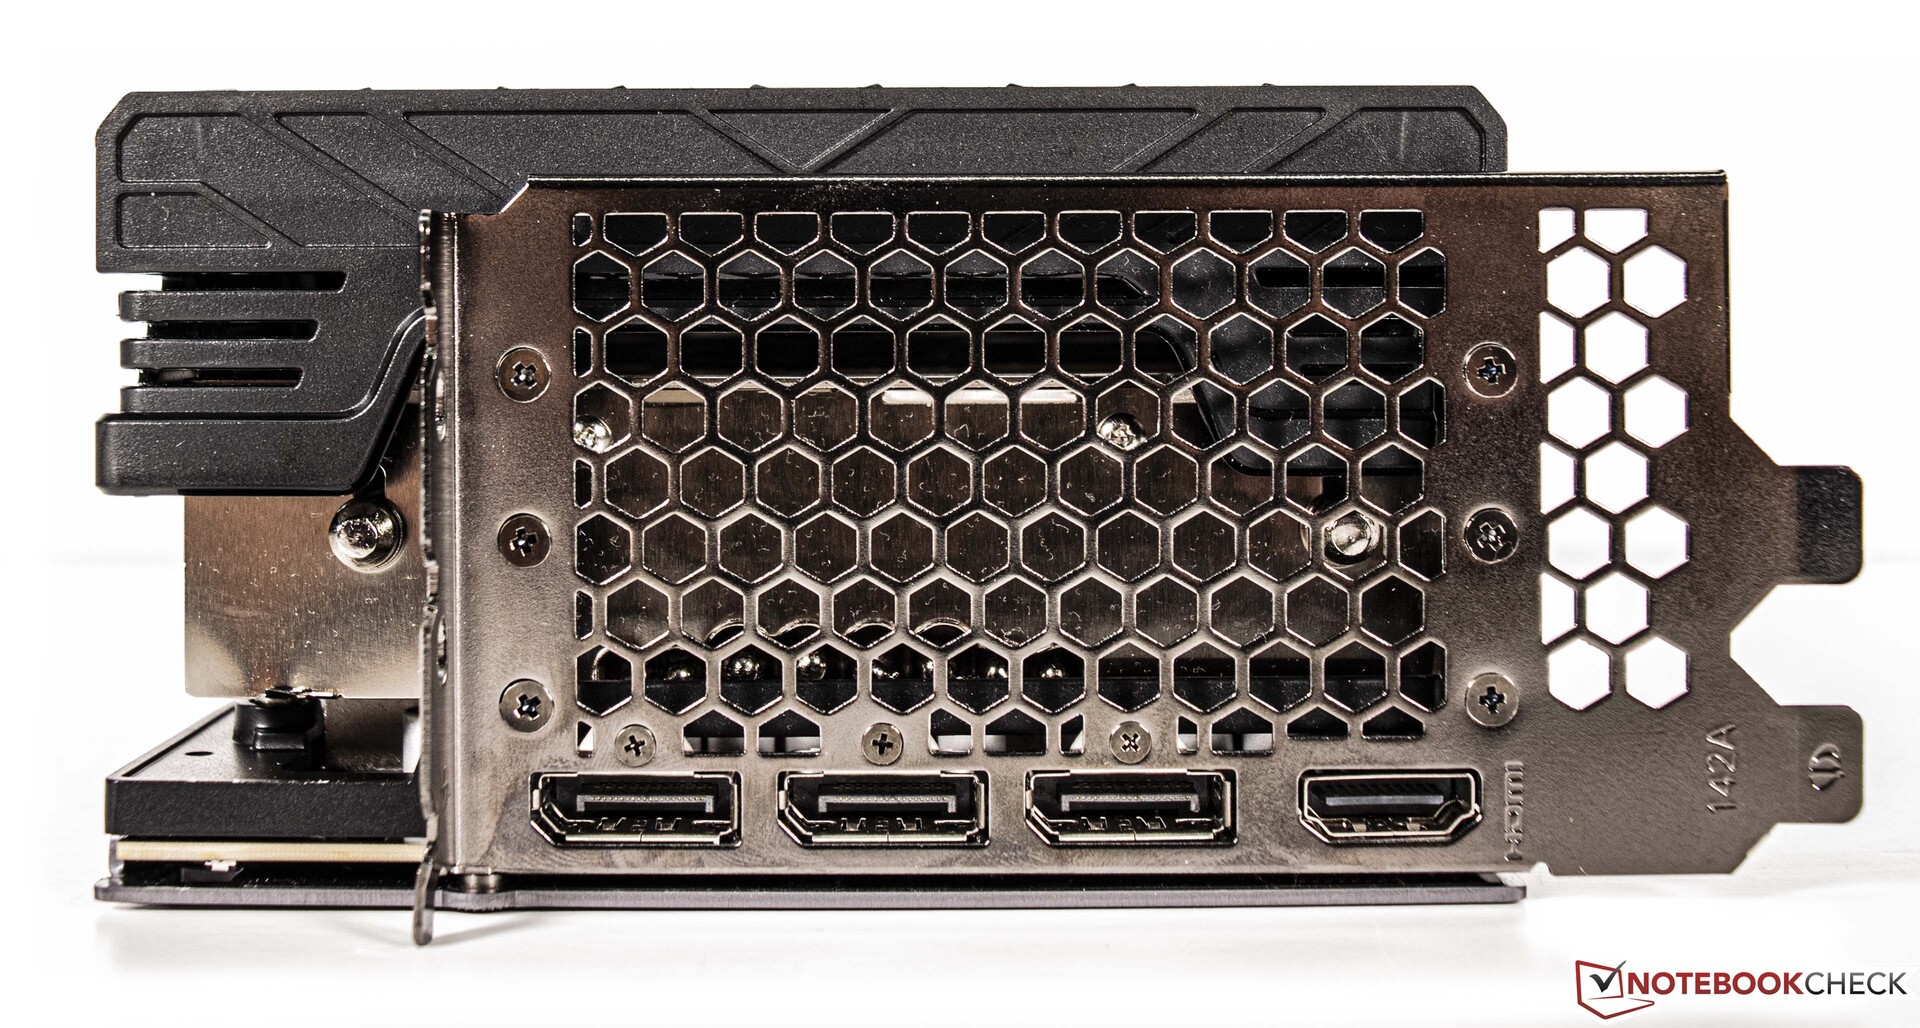
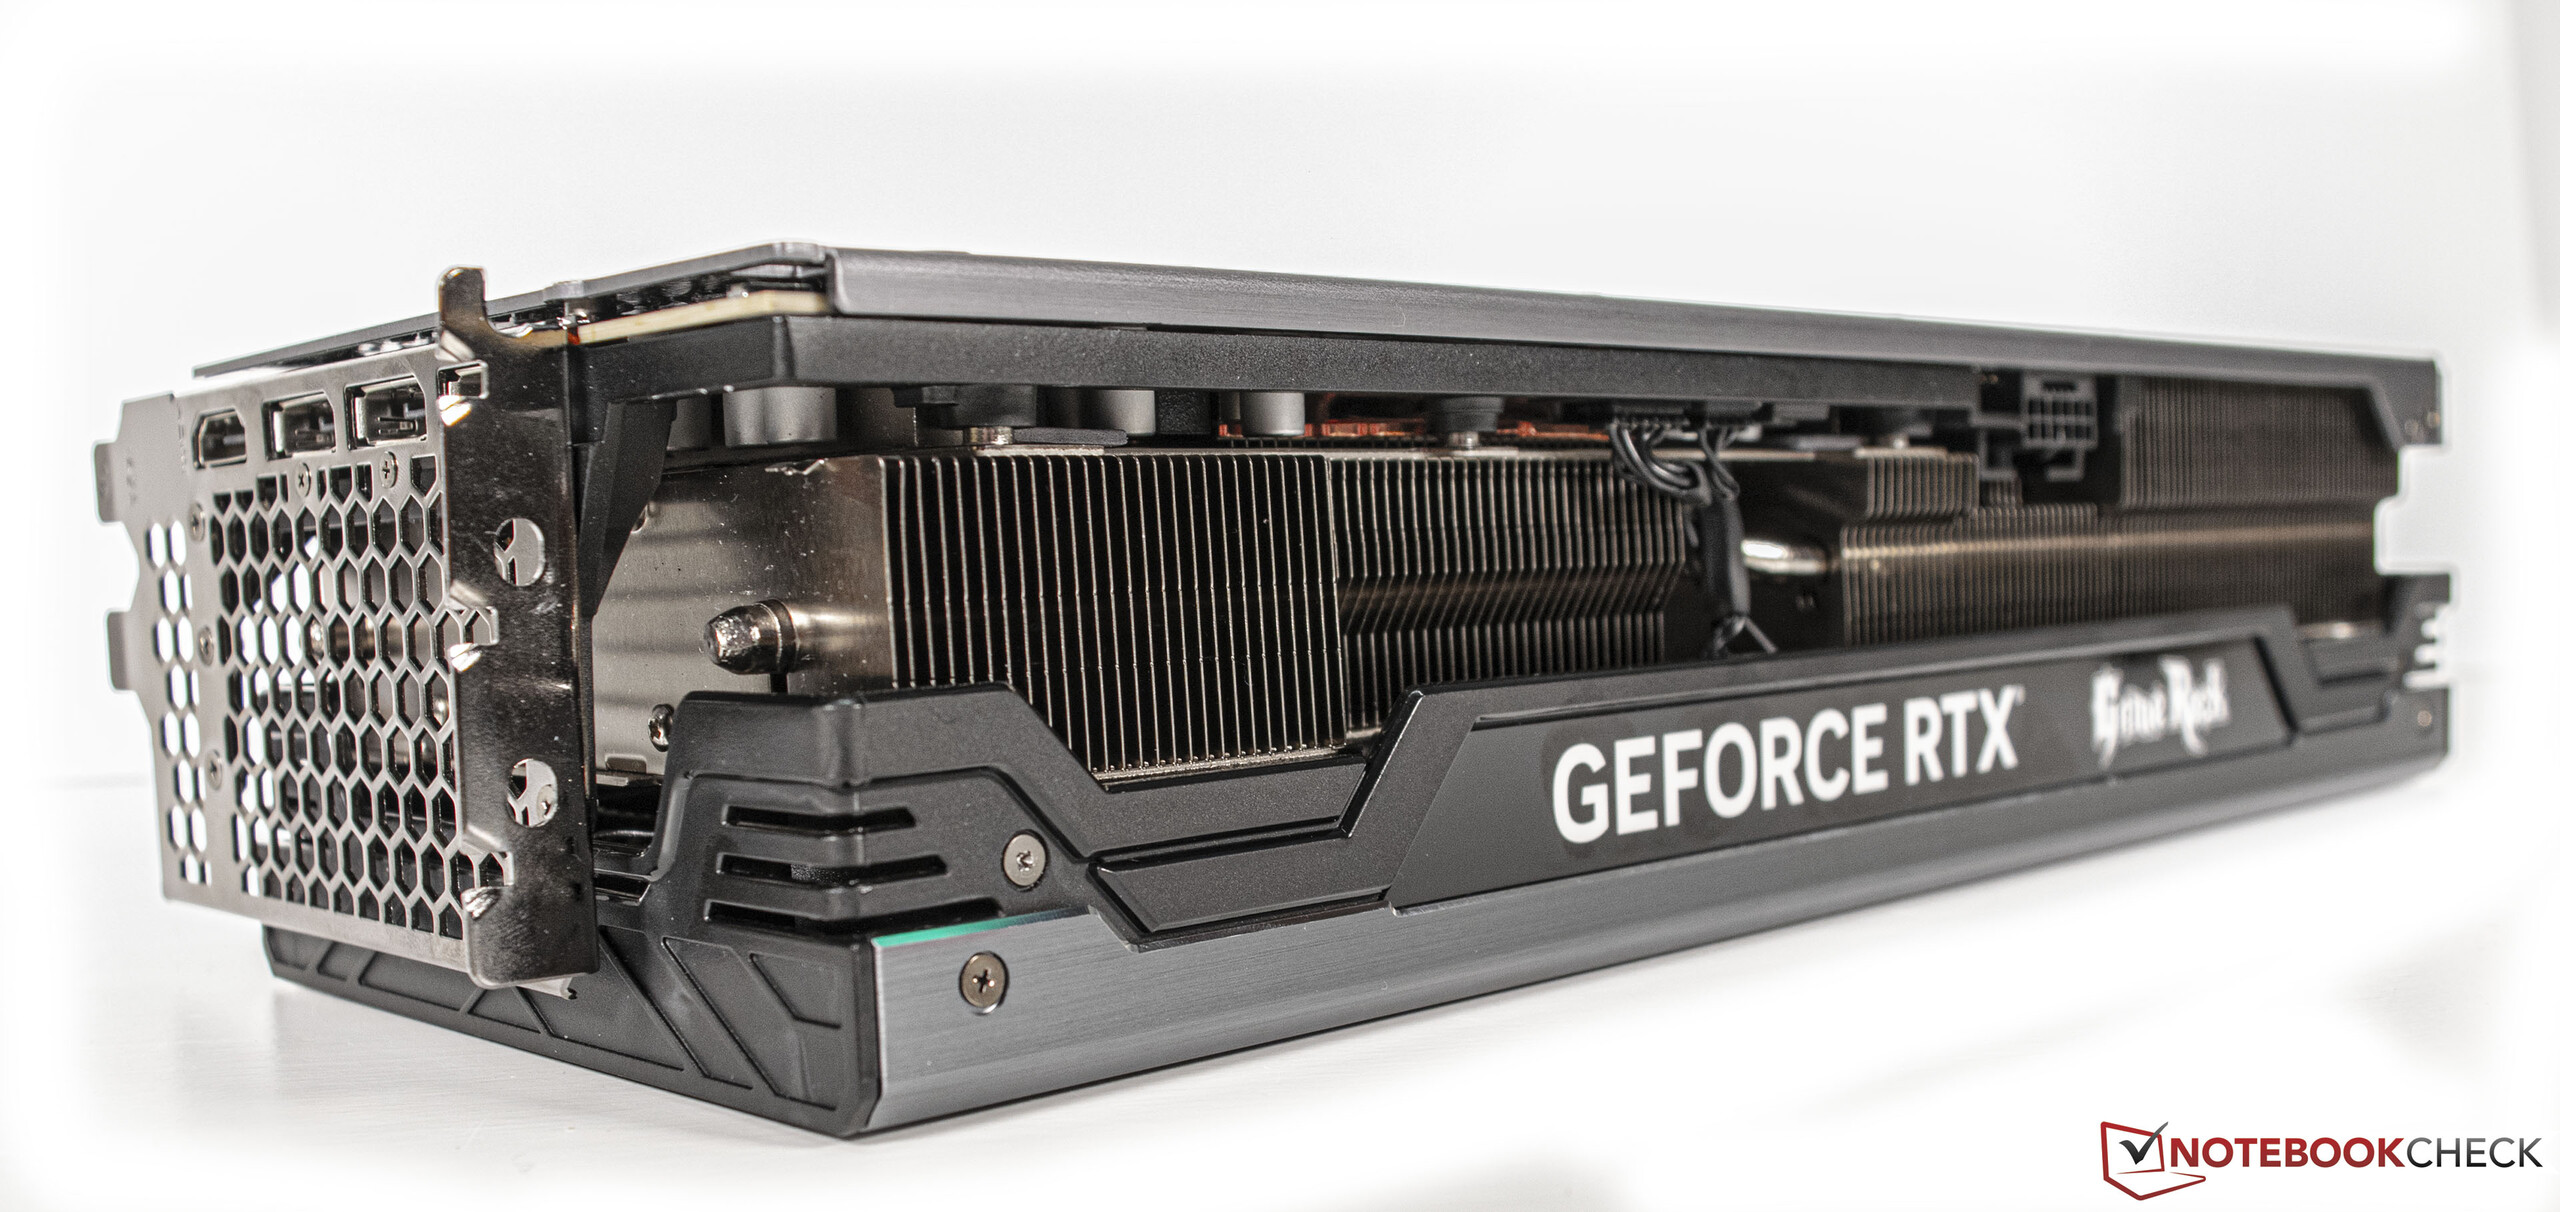
在外部,PalitGeForce RTX 4090 GameRock OC配备了1个HDMI 2.1a和3个DisplayPort 1.4a。

旗舰级GeForce 显卡。规格
| RTX 4090 (FE) | RTX 4080 | RTX 3090 Ti | RTX 3090 (FE) | RTX 3080 Ti (FE) | RTX 3080 (FE) | Titan RTX | |
| GPU | ad102 | ad103 | ga102 | ga102 | ga102 | ga102 | tu102 |
| FinFET工艺 | 4纳米 | 4纳米 | 8纳米 | 8纳米 | 8纳米 | 8纳米 | 12纳米 |
| CUDA核心 | 16,384 | 9,728 | 10,752 | 10,496 | 10,240 | 8,704 | 4,608 |
| 纹理单元 | 512 | 304 | 336 | 328 | 320 | 272 | 288 |
| 张量核心 | 512 第四代 | 304 第四代 | 336 第三代 | 328 第三代 | 320 第三代 | 272 第三代 | 576 第二代 |
| RT核心 | 128 | 76 | 84 | 82 | 80 | 68 | 72 |
| GPU基本时钟速度 | 2,235 MHz | 2,205 | 1,560 MHz | 1,395 MHz | 1,365 MHz | 1,440 MHz | 1,350 MHz |
| GPU Boost时钟速度 | 2,520 MHz | 2,505 | 1,860 MHz | 1,695 MHz | 1,665 MHz | 1,710 MHz | 1,770 MHz |
| 内存总线 | 384位 | 256位 | 384位 | 384位 | 384位 | 320位 | 384位 |
| 内存带宽 | 1,008 GB/s | 735,7 GB/s | 1,008 GB/s | 936 GB/s | 912,4 GB/s | 760 GB/s | 672 GB/s |
| 显存 | 24 GB GDDR6X | 16 GB GDDR6X | 24 GB GDDR6X | 24 GB GDDR6X | 12 GB GDDR6X | 10 GB GDDR6X | 24 GB GDDR6 |
| 功率消耗 | 450 W | 320 W | 450 W | 350 W | 350 W | 320 W | 280 W |
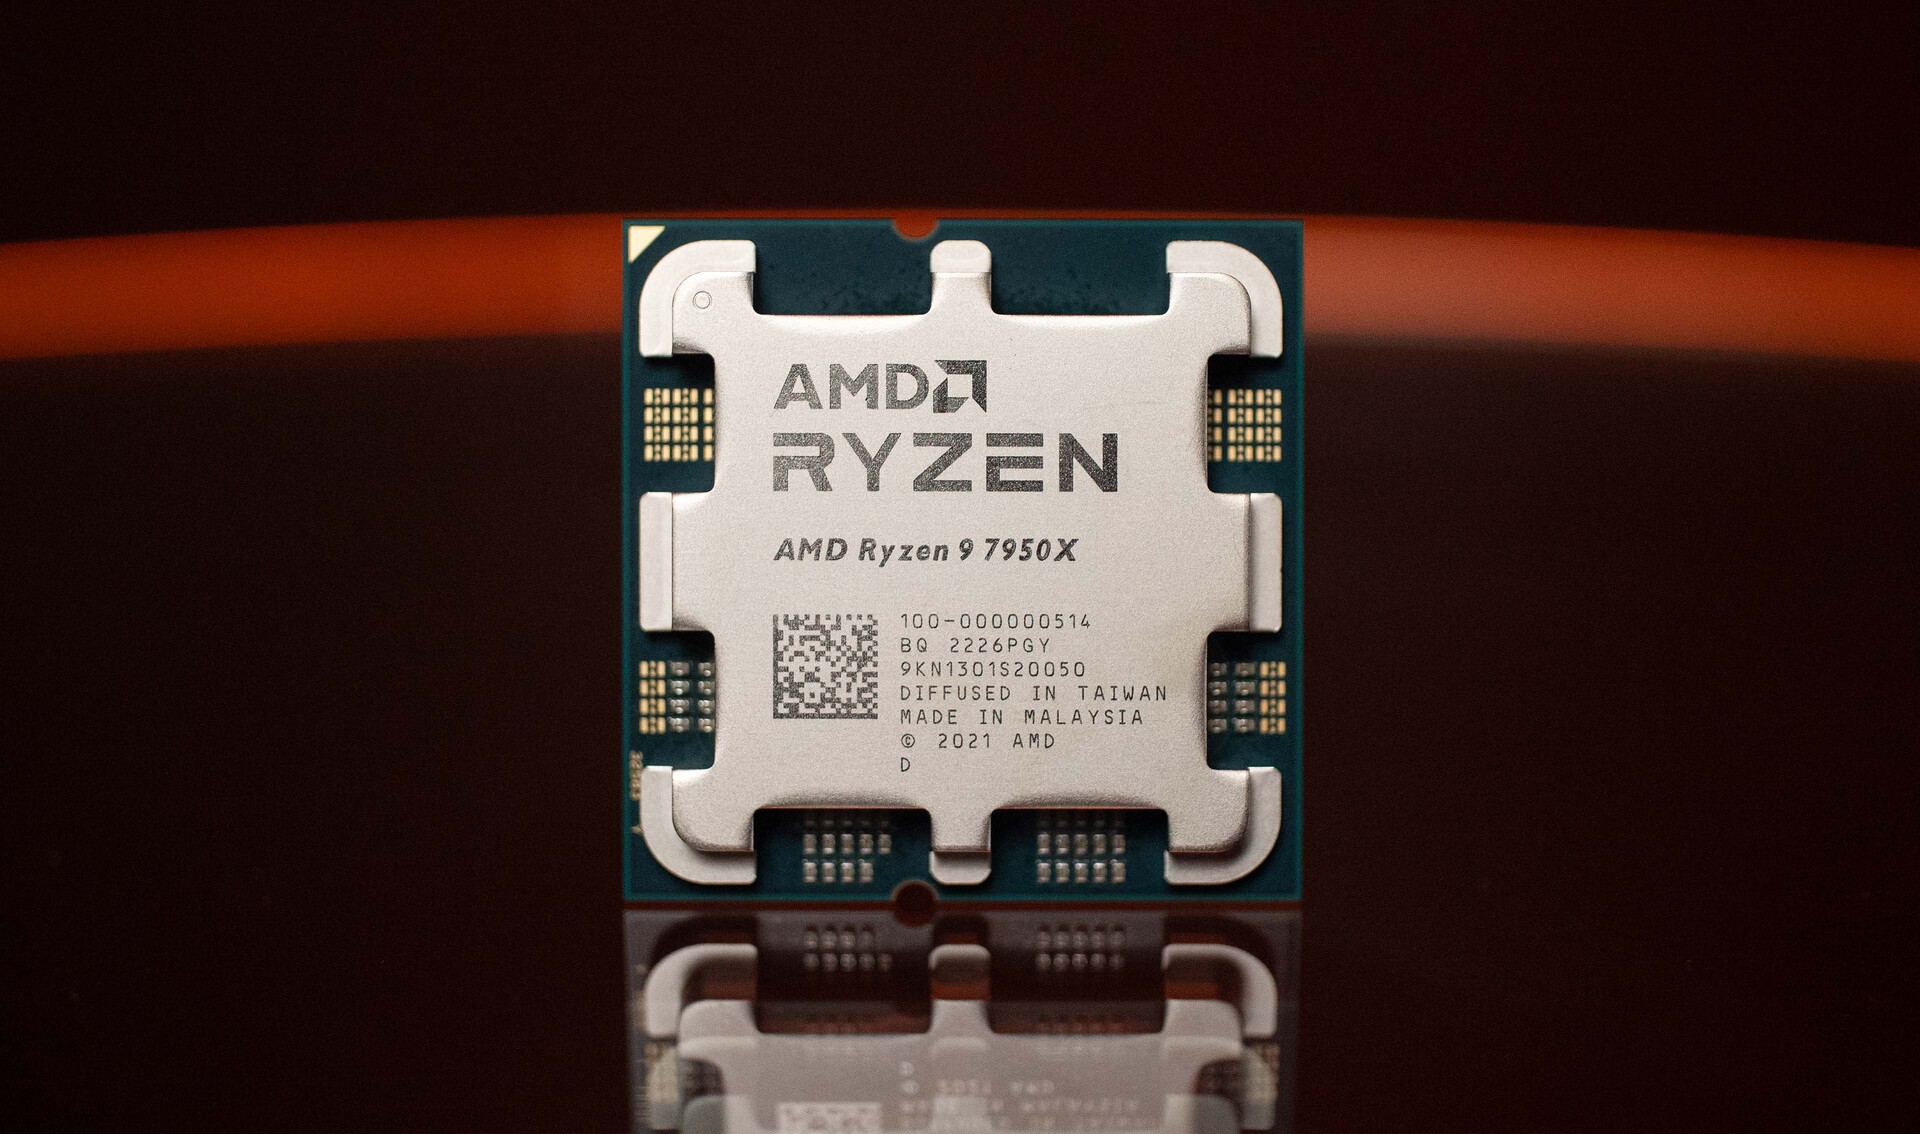
我们以AMD Ryzen 9 7950X为基础的审查单元
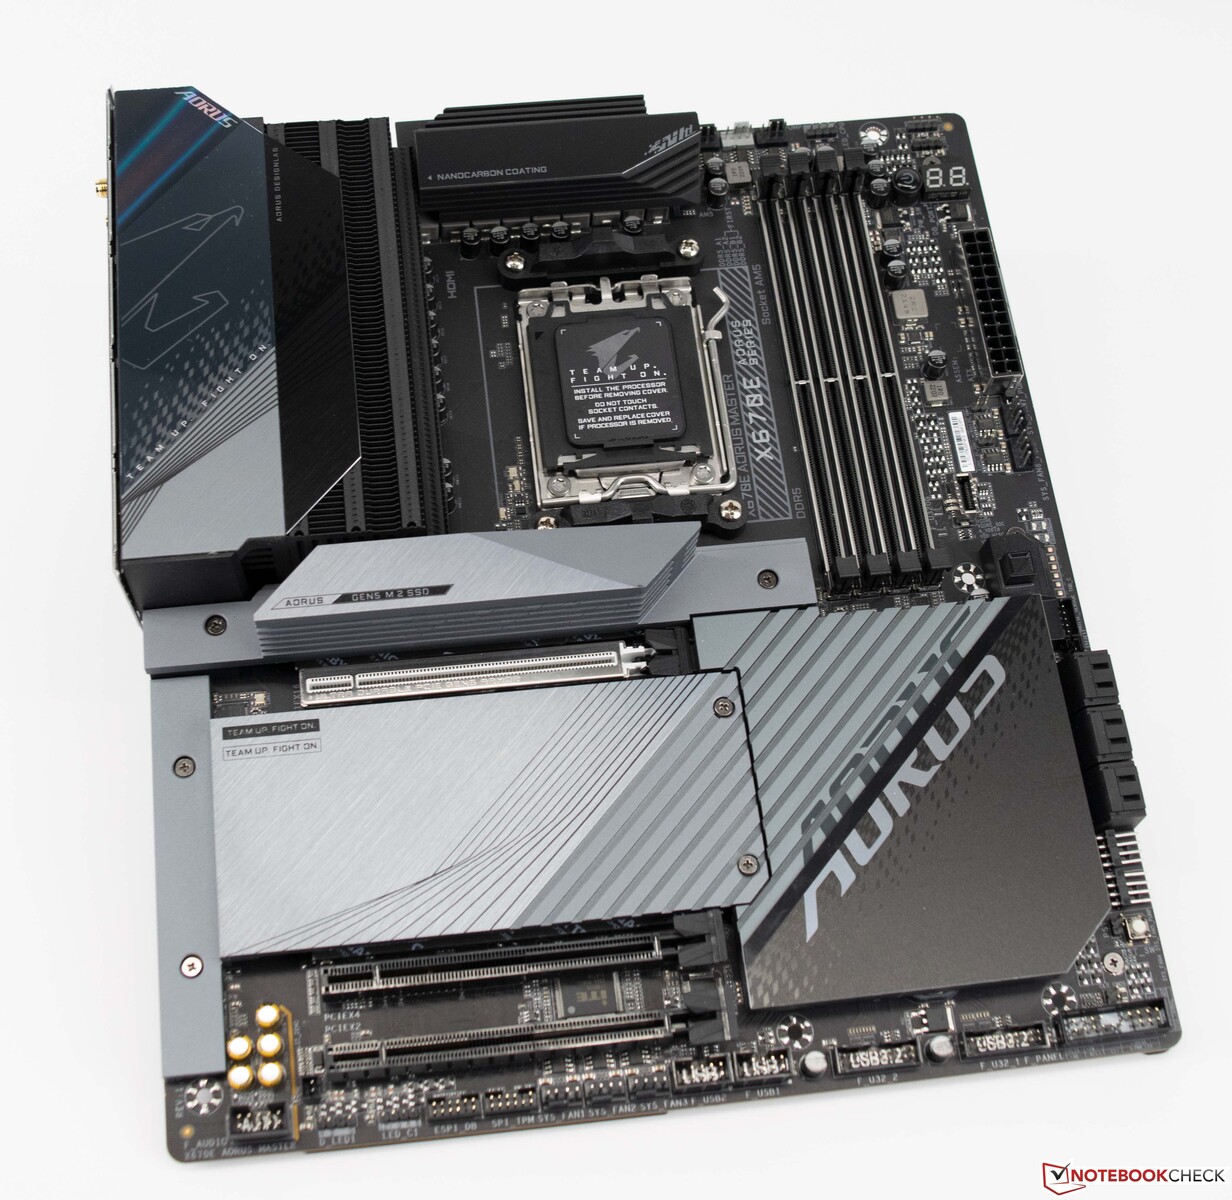
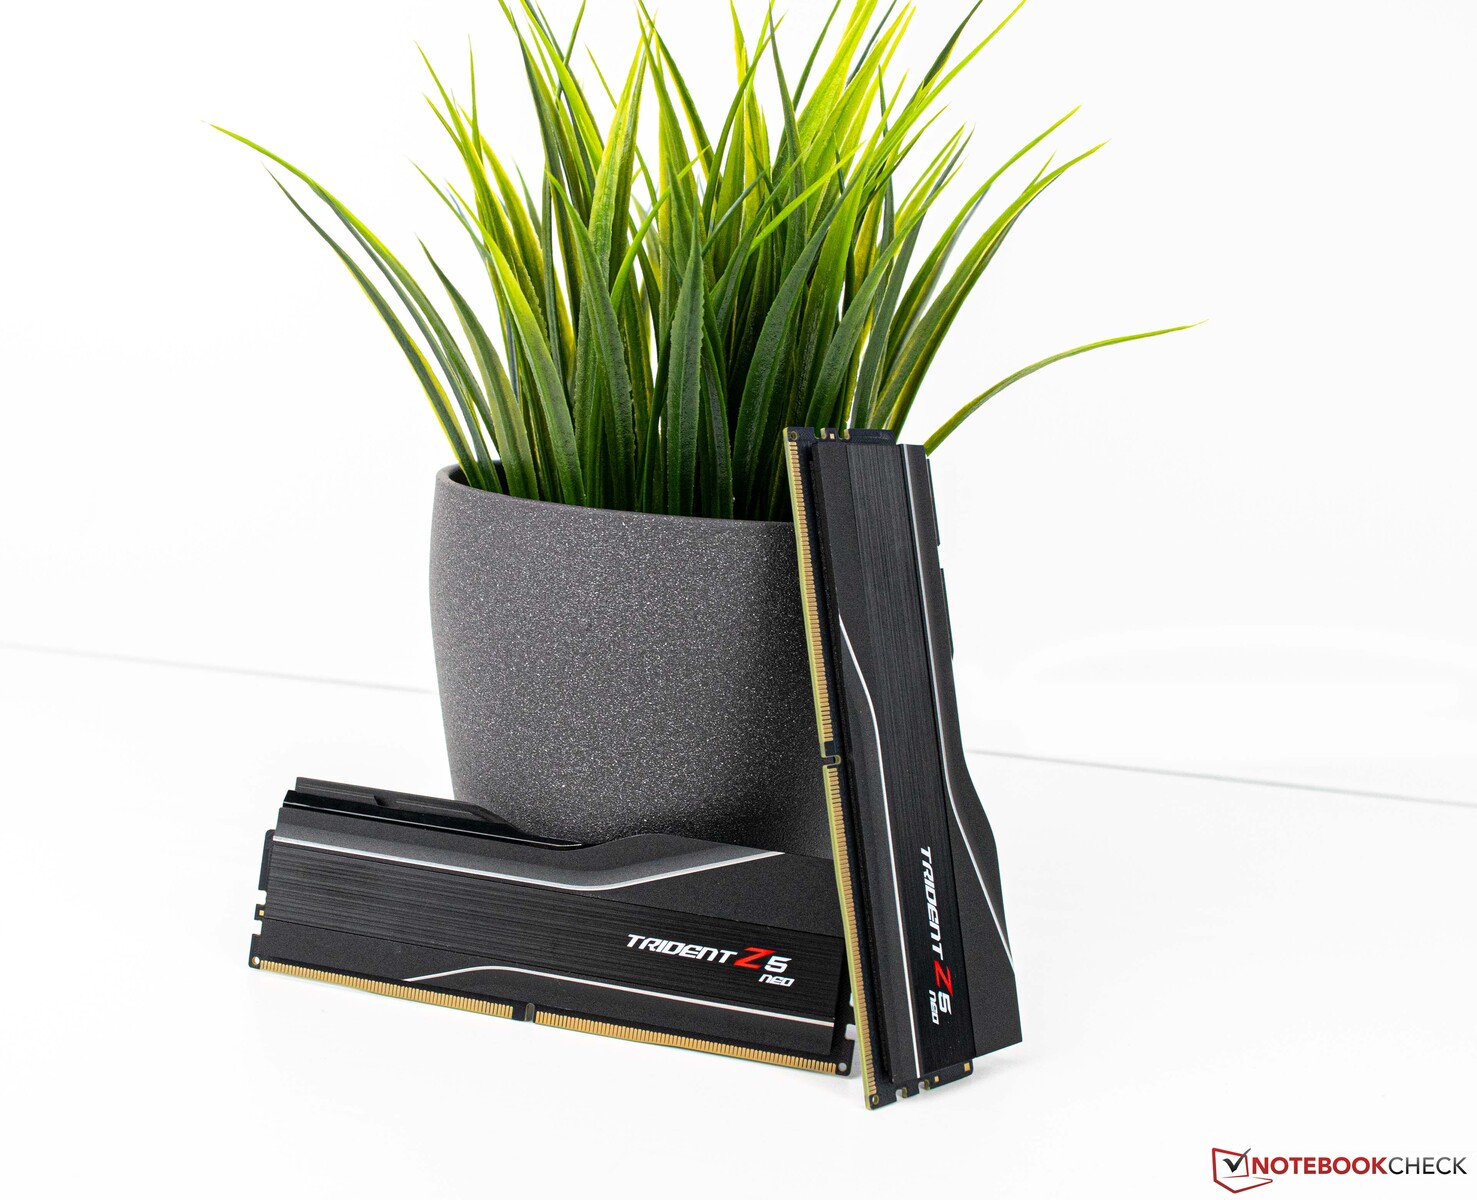
作为我们的测试系统,我们使用了基于Gigabyte X670E Aorus Master主板的当前AMD平台。该CPU (AMD Ryzen 9 7950X)提供了良好的CPU性能,对于冷却我们使用了Alphacool的AiO解决方案(Alphacool Eisbear Aurora 360 mm).32GB内存来自G.Skill,使用合适的EXPO配置文件。我们使用的显示器是Gigabyte M32U。
我们系统的细节
对于以下基准和测试,我们使用这个系统。
- Lian-Li O11 Dynamic
- AMD Ryzen 9 7950X
- Gigabyte X670E Aorus Master, BIOS:F8a
- Alphacool Eisbear 360 AiO
- 海瑟尔RM 1000x电源
- G.Skill Trident Z5 Neo DDR5-6000 2x 16 GB, EXPO (DDR5-6000 CL30-38-38-96)
- 海瑟尔MP600 2 TB
- Crucial MX500 2 TB
- 微软Windows 11专业版64位(版本22H2)。
合成基准
合成测试已经清楚地表明了NvidiaGeForce RTX 4090的能力。目前顶级型号的性能几乎完全被粉碎,在整体合成基准评级中,PalitGeForce RTX 4090 GameRock OC的性能超过了NvidiaGeForce RTX 3090 Ti的52%。之前AMD的顶级型号(AMD Radeon RX 6950 XT)发现自己在队伍中更靠后,在NvidiaGeForce RTX 3090 Founders Edition之后排名第四。
| Performance rating - Percent | |
| NVIDIA GeForce RTX 4090 | |
| NVIDIA Titan RTX | |
| AMD Radeon RX 6950 XT | |
| NVIDIA GeForce RTX 3090 | |
| NVIDIA GeForce RTX 3090 Ti -8! | |
| AMD Radeon RX 6900 XT | |
| NVIDIA GeForce RTX 3080 12 GB | |
| 3DMark | |
| 2560x1440 Time Spy Graphics | |
| NVIDIA GeForce RTX 4090 | |
| AMD Radeon RX 6950 XT | |
| NVIDIA GeForce RTX 3090 Ti | |
| NVIDIA GeForce RTX 3090 | |
| AMD Radeon RX 6900 XT | |
| NVIDIA GeForce RTX 3080 12 GB | |
| NVIDIA Titan RTX | |
| Fire Strike Extreme Graphics | |
| NVIDIA GeForce RTX 4090 | |
| AMD Radeon RX 6950 XT | |
| NVIDIA GeForce RTX 3090 Ti | |
| AMD Radeon RX 6900 XT | |
| NVIDIA GeForce RTX 3090 | |
| NVIDIA GeForce RTX 3080 12 GB | |
| NVIDIA Titan RTX | |
| 3840x2160 Fire Strike Ultra Graphics | |
| NVIDIA GeForce RTX 4090 | |
| AMD Radeon RX 6950 XT | |
| NVIDIA GeForce RTX 3090 Ti | |
| AMD Radeon RX 6900 XT | |
| NVIDIA GeForce RTX 3090 | |
| NVIDIA GeForce RTX 3080 12 GB | |
| NVIDIA Titan RTX | |
| 1920x1080 Fire Strike Graphics | |
| NVIDIA GeForce RTX 4090 | |
| AMD Radeon RX 6950 XT | |
| NVIDIA GeForce RTX 3090 Ti | |
| AMD Radeon RX 6900 XT | |
| NVIDIA GeForce RTX 3090 | |
| NVIDIA GeForce RTX 3080 12 GB | |
| NVIDIA Titan RTX | |
| Unigine Superposition | |
| 7680x4320 8k Optimized | |
| NVIDIA GeForce RTX 4090 | |
| NVIDIA GeForce RTX 3090 Ti | |
| NVIDIA GeForce RTX 3090 | |
| AMD Radeon RX 6950 XT | |
| NVIDIA GeForce RTX 3080 12 GB | |
| AMD Radeon RX 6900 XT | |
| NVIDIA Titan RTX | |
| 3840x2160 4k Optimized | |
| NVIDIA GeForce RTX 4090 | |
| NVIDIA GeForce RTX 3090 Ti | |
| AMD Radeon RX 6950 XT | |
| NVIDIA GeForce RTX 3090 | |
| NVIDIA GeForce RTX 3080 12 GB | |
| AMD Radeon RX 6900 XT | |
| NVIDIA Titan RTX | |
| 1920x1080 1080p Extreme | |
| NVIDIA GeForce RTX 4090 | |
| NVIDIA GeForce RTX 3090 Ti | |
| AMD Radeon RX 6950 XT | |
| NVIDIA GeForce RTX 3090 | |
| NVIDIA GeForce RTX 3080 12 GB | |
| AMD Radeon RX 6900 XT | |
| NVIDIA Titan RTX | |
| 1920x1080 1080p High | |
| NVIDIA GeForce RTX 4090 | |
| NVIDIA GeForce RTX 3090 Ti | |
| AMD Radeon RX 6950 XT | |
| NVIDIA GeForce RTX 3090 | |
| AMD Radeon RX 6900 XT | |
| NVIDIA GeForce RTX 3080 12 GB | |
| NVIDIA Titan RTX | |
| 1280x720 720p Low | |
| NVIDIA GeForce RTX 4090 | |
| NVIDIA Titan RTX | |
| NVIDIA GeForce RTX 3090 | |
| NVIDIA GeForce RTX 3090 Ti | |
| NVIDIA GeForce RTX 3080 12 GB | |
| AMD Radeon RX 6900 XT | |
| AMD Radeon RX 6950 XT | |
| Unigine Heaven 4.0 | |
| Extreme Preset DX11 | |
| NVIDIA GeForce RTX 4090 | |
| NVIDIA GeForce RTX 3090 | |
| NVIDIA GeForce RTX 3090 Ti | |
| AMD Radeon RX 6950 XT | |
| NVIDIA GeForce RTX 3080 12 GB | |
| AMD Radeon RX 6900 XT | |
| NVIDIA Titan RTX | |
| Extreme Preset OpenGL | |
| NVIDIA GeForce RTX 4090 | |
| NVIDIA GeForce RTX 3090 Ti | |
| NVIDIA GeForce RTX 3090 | |
| NVIDIA GeForce RTX 3080 12 GB | |
| AMD Radeon RX 6950 XT | |
| NVIDIA Titan RTX | |
| AMD Radeon RX 6900 XT | |
| Unigine Valley 1.0 | |
| 1920x1080 Extreme HD DirectX AA:x8 | |
| NVIDIA GeForce RTX 4090 | |
| NVIDIA GeForce RTX 3090 | |
| AMD Radeon RX 6950 XT | |
| NVIDIA GeForce RTX 3080 12 GB | |
| NVIDIA GeForce RTX 3090 Ti | |
| AMD Radeon RX 6900 XT | |
| NVIDIA Titan RTX | |
| 1920x1080 Extreme HD Preset OpenGL AA:x8 | |
| NVIDIA GeForce RTX 4090 | |
| NVIDIA GeForce RTX 3090 Ti | |
| NVIDIA GeForce RTX 3090 | |
| NVIDIA GeForce RTX 3080 12 GB | |
| AMD Radeon RX 6950 XT | |
| AMD Radeon RX 6900 XT | |
| NVIDIA Titan RTX | |
| 3DMark 11 | |
| 1280x720 Performance GPU | |
| NVIDIA GeForce RTX 4090 | |
| AMD Radeon RX 6950 XT | |
| NVIDIA GeForce RTX 3090 Ti | |
| NVIDIA GeForce RTX 3090 | |
| AMD Radeon RX 6900 XT | |
| NVIDIA GeForce RTX 3080 12 GB | |
| NVIDIA Titan RTX | |
| 1280x720 Performance | |
| NVIDIA GeForce RTX 4090 | |
| NVIDIA GeForce RTX 3090 Ti | |
| NVIDIA GeForce RTX 3090 | |
| NVIDIA Titan RTX | |
| AMD Radeon RX 6950 XT | |
| AMD Radeon RX 6900 XT | |
| NVIDIA GeForce RTX 3080 12 GB | |
| ComputeMark v2.1 | |
| 1024x600 Normal, QJuliaRayTrace | |
| NVIDIA GeForce RTX 4090 | |
| NVIDIA GeForce RTX 3090 | |
| NVIDIA GeForce RTX 3080 12 GB | |
| AMD Radeon RX 6950 XT | |
| AMD Radeon RX 6900 XT | |
| NVIDIA Titan RTX | |
| 1024x600 Normal, Mandel Scalar | |
| NVIDIA GeForce RTX 4090 | |
| AMD Radeon RX 6950 XT | |
| NVIDIA GeForce RTX 3090 | |
| AMD Radeon RX 6900 XT | |
| NVIDIA GeForce RTX 3080 12 GB | |
| NVIDIA Titan RTX | |
| 1024x600 Normal, Mandel Vector | |
| NVIDIA GeForce RTX 4090 | |
| NVIDIA GeForce RTX 3090 | |
| AMD Radeon RX 6950 XT | |
| AMD Radeon RX 6900 XT | |
| NVIDIA GeForce RTX 3080 12 GB | |
| NVIDIA Titan RTX | |
| 1024x600 Normal, Fluid 2DTexArr | |
| NVIDIA GeForce RTX 4090 | |
| NVIDIA GeForce RTX 3090 | |
| AMD Radeon RX 6950 XT | |
| NVIDIA GeForce RTX 3080 12 GB | |
| AMD Radeon RX 6900 XT | |
| NVIDIA Titan RTX | |
| 1024x600 Normal, Fluid 3DTex | |
| NVIDIA GeForce RTX 4090 | |
| AMD Radeon RX 6950 XT | |
| NVIDIA GeForce RTX 3090 | |
| AMD Radeon RX 6900 XT | |
| NVIDIA GeForce RTX 3080 12 GB | |
| NVIDIA Titan RTX | |
| 1024x600 Normal, Score | |
| NVIDIA GeForce RTX 4090 | |
| NVIDIA GeForce RTX 3090 | |
| AMD Radeon RX 6950 XT | |
| NVIDIA GeForce RTX 3080 12 GB | |
| AMD Radeon RX 6900 XT | |
| NVIDIA Titan RTX | |
| LuxMark v2.0 64Bit | |
| Sala GPUs-only | |
| AMD Radeon RX 6950 XT | |
| AMD Radeon RX 6900 XT | |
| NVIDIA GeForce RTX 4090 | |
| NVIDIA GeForce RTX 3090 | |
| NVIDIA GeForce RTX 3080 12 GB | |
| NVIDIA Titan RTX | |
| Room GPUs-only | |
| NVIDIA GeForce RTX 4090 | |
| NVIDIA GeForce RTX 3090 | |
| NVIDIA GeForce RTX 3080 12 GB | |
| AMD Radeon RX 6950 XT | |
| AMD Radeon RX 6900 XT | |
| NVIDIA Titan RTX | |
Palit GeForce RTX 4090 GameRock OC with Ryzen 9 vs. Core i9
| Performance rating - Percent | |
| NVIDIA GeForce RTX 4090, AMD Ryzen 9 7950X | |
| NVIDIA GeForce RTX 4090, Intel Core i9-13900K | |
| 3DMark | |
| 2560x1440 Time Spy Graphics | |
| NVIDIA GeForce RTX 4090, Intel Core i9-13900K | |
| NVIDIA GeForce RTX 4090, AMD Ryzen 9 7950X | |
| Fire Strike Extreme Graphics | |
| NVIDIA GeForce RTX 4090, AMD Ryzen 9 7950X | |
| NVIDIA GeForce RTX 4090, Intel Core i9-13900K | |
| 3840x2160 Fire Strike Ultra Graphics | |
| NVIDIA GeForce RTX 4090, Intel Core i9-13900K | |
| NVIDIA GeForce RTX 4090, AMD Ryzen 9 7950X | |
| 1920x1080 Fire Strike Graphics | |
| NVIDIA GeForce RTX 4090, AMD Ryzen 9 7950X | |
| NVIDIA GeForce RTX 4090, Intel Core i9-13900K | |
| Unigine Superposition | |
| 7680x4320 8k Optimized | |
| NVIDIA GeForce RTX 4090, AMD Ryzen 9 7950X | |
| NVIDIA GeForce RTX 4090, Intel Core i9-13900K | |
| 3840x2160 4k Optimized | |
| NVIDIA GeForce RTX 4090, Intel Core i9-13900K | |
| NVIDIA GeForce RTX 4090, AMD Ryzen 9 7950X | |
| 1920x1080 1080p Extreme | |
| NVIDIA GeForce RTX 4090, Intel Core i9-13900K | |
| NVIDIA GeForce RTX 4090, AMD Ryzen 9 7950X | |
| 1920x1080 1080p High | |
| NVIDIA GeForce RTX 4090, Intel Core i9-13900K | |
| NVIDIA GeForce RTX 4090, AMD Ryzen 9 7950X | |
| 1280x720 720p Low | |
| NVIDIA GeForce RTX 4090, Intel Core i9-13900K | |
| NVIDIA GeForce RTX 4090, AMD Ryzen 9 7950X | |
| Unigine Heaven 4.0 | |
| Extreme Preset DX11 | |
| NVIDIA GeForce RTX 4090, AMD Ryzen 9 7950X | |
| NVIDIA GeForce RTX 4090, Intel Core i9-13900K | |
| Extreme Preset OpenGL | |
| NVIDIA GeForce RTX 4090, Intel Core i9-13900K | |
| NVIDIA GeForce RTX 4090, AMD Ryzen 9 7950X | |
| Unigine Valley 1.0 | |
| 1920x1080 Extreme HD DirectX AA:x8 | |
| NVIDIA GeForce RTX 4090, Intel Core i9-13900K | |
| NVIDIA GeForce RTX 4090, AMD Ryzen 9 7950X | |
| 1920x1080 Extreme HD Preset OpenGL AA:x8 | |
| NVIDIA GeForce RTX 4090, Intel Core i9-13900K | |
| NVIDIA GeForce RTX 4090, AMD Ryzen 9 7950X | |
| 3DMark 11 | |
| 1280x720 Performance GPU | |
| NVIDIA GeForce RTX 4090, AMD Ryzen 9 7950X | |
| NVIDIA GeForce RTX 4090, Intel Core i9-13900K | |
| 1280x720 Performance | |
| NVIDIA GeForce RTX 4090, AMD Ryzen 9 7950X | |
| NVIDIA GeForce RTX 4090, Intel Core i9-13900K | |
Compute Benchmarks and professional applications
| ComputeMark v2.1 | |
| 1024x600 Normal, QJuliaRayTrace | |
| NVIDIA GeForce RTX 4090 | |
| NVIDIA GeForce RTX 3090 | |
| NVIDIA GeForce RTX 3080 12 GB | |
| AMD Radeon RX 6950 XT | |
| AMD Radeon RX 6900 XT | |
| NVIDIA Titan RTX | |
| 1024x600 Normal, Mandel Scalar | |
| NVIDIA GeForce RTX 4090 | |
| AMD Radeon RX 6950 XT | |
| NVIDIA GeForce RTX 3090 | |
| AMD Radeon RX 6900 XT | |
| NVIDIA GeForce RTX 3080 12 GB | |
| NVIDIA Titan RTX | |
| 1024x600 Normal, Mandel Vector | |
| NVIDIA GeForce RTX 4090 | |
| NVIDIA GeForce RTX 3090 | |
| AMD Radeon RX 6950 XT | |
| AMD Radeon RX 6900 XT | |
| NVIDIA GeForce RTX 3080 12 GB | |
| NVIDIA Titan RTX | |
| 1024x600 Normal, Fluid 2DTexArr | |
| NVIDIA GeForce RTX 4090 | |
| NVIDIA GeForce RTX 3090 | |
| AMD Radeon RX 6950 XT | |
| NVIDIA GeForce RTX 3080 12 GB | |
| AMD Radeon RX 6900 XT | |
| NVIDIA Titan RTX | |
| 1024x600 Normal, Fluid 3DTex | |
| NVIDIA GeForce RTX 4090 | |
| AMD Radeon RX 6950 XT | |
| NVIDIA GeForce RTX 3090 | |
| AMD Radeon RX 6900 XT | |
| NVIDIA GeForce RTX 3080 12 GB | |
| NVIDIA Titan RTX | |
| 1024x600 Normal, Score | |
| NVIDIA GeForce RTX 4090 | |
| NVIDIA GeForce RTX 3090 | |
| AMD Radeon RX 6950 XT | |
| NVIDIA GeForce RTX 3080 12 GB | |
| AMD Radeon RX 6900 XT | |
| NVIDIA Titan RTX | |
| LuxMark v2.0 64Bit | |
| Sala GPUs-only | |
| AMD Radeon RX 6950 XT | |
| AMD Radeon RX 6900 XT | |
| NVIDIA GeForce RTX 4090 | |
| NVIDIA GeForce RTX 3090 | |
| NVIDIA GeForce RTX 3080 12 GB | |
| NVIDIA Titan RTX | |
| Room GPUs-only | |
| NVIDIA GeForce RTX 4090 | |
| NVIDIA GeForce RTX 3090 | |
| NVIDIA GeForce RTX 3080 12 GB | |
| AMD Radeon RX 6950 XT | |
| AMD Radeon RX 6900 XT | |
| NVIDIA Titan RTX | |
| Blender - v3.3 Classroom CUDA | |
| NVIDIA Titan RTX | |
| Geekbench 5.5 | |
| OpenCL Score | |
| NVIDIA GeForce RTX 4090 | |
| NVIDIA GeForce RTX 3090 Ti | |
| NVIDIA GeForce RTX 3090 | |
| NVIDIA GeForce RTX 3080 12 GB | |
| AMD Radeon RX 6950 XT | |
| AMD Radeon RX 6900 XT | |
| NVIDIA Titan RTX | |
| Vulkan Score 5.5 | |
| NVIDIA GeForce RTX 3090 Ti | |
| NVIDIA GeForce RTX 4090 | |
| NVIDIA Titan RTX | |
| NVIDIA GeForce RTX 3090 | |
| AMD Radeon RX 6900 XT | |
| AMD Radeon RX 6950 XT | |
| NVIDIA GeForce RTX 3080 12 GB | |
| V-Ray 5 Benchmark | |
| GPU CUDA | |
| NVIDIA GeForce RTX 4090 | |
| NVIDIA GeForce RTX 3090 | |
| NVIDIA GeForce RTX 3080 12 GB | |
| AMD Radeon RX 6950 XT | |
| GPU RTX | |
| NVIDIA GeForce RTX 4090 | |
| NVIDIA GeForce RTX 3090 | |
* ... smaller is better
游戏基准
PalitGeForce RTX 4090 GameRock OC不仅在合成基准测试中表现非常好,而且在游戏测试中也是如此。高达50%至60%的增幅对这块怪物般的显卡来说是小菜一碟。虽然AMD在这方面远远落后,但新的AMD Radeon RX 7900 XTX已经处于起步阶段。
为了进行公平的比较,我们还测试了PalitGeForce RTX 4090 GameRock OC与 英特尔酷睿i9-13900K.在这里,有可能从显卡中提取更多一点的性能。这再次证实,英特尔的酷睿i9-13900K目前提供了最快的游戏CPU解决方案。当与AMD Ryzen 9 7950X配对时,其性能AMD Ryzen 9 7950X搭配时的性能没有什么可挑剔的。然而,如果目标是从显卡中榨取每秒钟的最后一帧,目前没有办法绕过英特尔平台。由于PalitGeForce RTX 4090 GameRock OC的巨大力量,应该使用4K显示器。即使在这么高的分辨率下,我们有时也会达到CPU的极限,这在一定程度上减缓了GPU的速度。目前,只有少数游戏,例如《赛博朋克2077》、《F1 2022》或《采石场》,真正让GeForce RTX 4090在4K下出汗。有了DLSS等功能,这一点可以被抵消,所以这里也可以实现三位数的帧率。我们使用Nvidia的DLSS确定了所有基准测试结果。
新的DLSS 3.0以DLSS 2.0为基础,通过帧生成(FG)功能集进行扩展,大大有助于提高帧率。受益于此的最著名游戏是《赛博朋克2077》。在原生4K分辨率和光线追踪超预设下,即使是GeForce RTX 4090也只能在平均每秒43帧左右徘徊。通过激活DLSS,每秒可能超过100帧,这几乎是性能的三倍。DLSS 3.0依赖于第四代Tensor Core,目前只用于RTX 4000系列。已经支持DLSS 3.0或未来将支持该功能的游戏列表可以在这里找到https://www.nvidia.com/en-us/geforce/news/dlss3-supports-over-35-games-apps/ 。
| GTA V - 3840x2160 High/On (Advanced Graphics Off) AA:FX AF:8x | |
| NVIDIA GeForce RTX 4090, AMD Ryzen 9 7950X | |
| NVIDIA GeForce RTX 3090 Ti, AMD Ryzen 7 5800X3D | |
| NVIDIA GeForce RTX 3090, AMD Ryzen 9 7950X | |
| AMD Radeon RX 6950 XT, AMD Ryzen 9 5900X | |
| NVIDIA GeForce RTX 3080 12 GB, AMD Ryzen 9 5900X | |
| NVIDIA Titan RTX, AMD Ryzen 9 7950X | |
| The Witcher 3 - 3840x2160 High Graphics & Postprocessing (Nvidia HairWorks Off) | |
| NVIDIA GeForce RTX 4090, AMD Ryzen 9 7950X | |
| NVIDIA GeForce RTX 3090 Ti, AMD Ryzen 7 5800X3D | |
| NVIDIA GeForce RTX 3090, AMD Ryzen 9 7950X | |
| AMD Radeon RX 6950 XT, AMD Ryzen 9 5900X | |
| NVIDIA GeForce RTX 3080 12 GB, AMD Ryzen 9 5900X | |
| AMD Radeon RX 6900 XT, AMD Ryzen 9 5950X | |
| NVIDIA Titan RTX, AMD Ryzen 9 7950X | |
| Final Fantasy XV Benchmark - 3840x2160 High Quality | |
| NVIDIA GeForce RTX 4090, AMD Ryzen 9 7950X | |
| NVIDIA GeForce RTX 3090 Ti, AMD Ryzen 7 5800X3D | |
| NVIDIA GeForce RTX 3090, AMD Ryzen 9 7950X | |
| AMD Radeon RX 6950 XT, AMD Ryzen 9 5900X | |
| NVIDIA GeForce RTX 3080 12 GB, AMD Ryzen 9 5900X | |
| NVIDIA Titan RTX, AMD Ryzen 9 7950X | |
| Strange Brigade - 3840x2160 ultra AA:ultra AF:16 | |
| NVIDIA GeForce RTX 4090, AMD Ryzen 9 7950X | |
| AMD Radeon RX 6950 XT, AMD Ryzen 9 5900X | |
| NVIDIA GeForce RTX 3090, AMD Ryzen 9 7950X | |
| NVIDIA GeForce RTX 3080 12 GB, AMD Ryzen 9 5900X | |
| NVIDIA Titan RTX, AMD Ryzen 9 7950X | |
| Far Cry 5 - 3840x2160 Ultra Preset AA:T | |
| NVIDIA GeForce RTX 4090, AMD Ryzen 9 7950X | |
| AMD Radeon RX 6950 XT, AMD Ryzen 9 5900X | |
| NVIDIA GeForce RTX 3090, AMD Ryzen 9 7950X | |
| NVIDIA GeForce RTX 3080 12 GB, AMD Ryzen 9 5900X | |
| NVIDIA Titan RTX, AMD Ryzen 9 7950X | |
| Far Cry New Dawn - 3840x2160 Ultra Preset | |
| NVIDIA GeForce RTX 4090, AMD Ryzen 9 7950X | |
| AMD Radeon RX 6950 XT, AMD Ryzen 9 5900X | |
| NVIDIA GeForce RTX 3090, AMD Ryzen 9 7950X | |
| AMD Radeon RX 6900 XT, AMD Ryzen 9 5950X | |
| NVIDIA GeForce RTX 3080 12 GB, AMD Ryzen 9 5900X | |
| NVIDIA Titan RTX, AMD Ryzen 9 7950X | |
| Far Cry 6 - 3840x2160 Ultra Graphics Quality + HD Textures AA:T | |
| NVIDIA GeForce RTX 4090, AMD Ryzen 9 7950X | |
| NVIDIA GeForce RTX 3090 Ti, AMD Ryzen 7 5800X3D | |
| AMD Radeon RX 6950 XT, AMD Ryzen 9 5900X | |
| NVIDIA GeForce RTX 3090, AMD Ryzen 9 7950X | |
| NVIDIA Titan RTX, AMD Ryzen 9 7950X | |
| NVIDIA GeForce RTX 3080 12 GB, AMD Ryzen 9 5900X | |
| Metro Exodus - 3840x2160 Ultra Quality AF:16x | |
| NVIDIA GeForce RTX 4090, AMD Ryzen 9 7950X | |
| NVIDIA GeForce RTX 3090 Ti, AMD Ryzen 7 5800X3D | |
| NVIDIA GeForce RTX 3090, AMD Ryzen 9 7950X | |
| AMD Radeon RX 6950 XT, AMD Ryzen 9 5900X | |
| AMD Radeon RX 6900 XT, AMD Ryzen 9 5950X | |
| NVIDIA GeForce RTX 3080 12 GB, AMD Ryzen 9 5900X | |
| NVIDIA Titan RTX, AMD Ryzen 9 7950X | |
| F1 2020 - 3840x2160 Ultra High Preset AA:T AF:16x | |
| NVIDIA GeForce RTX 4090, AMD Ryzen 9 7950X | |
| AMD Radeon RX 6950 XT, AMD Ryzen 9 5900X | |
| NVIDIA GeForce RTX 3090, AMD Ryzen 9 7950X | |
| AMD Radeon RX 6900 XT, AMD Ryzen 9 5950X | |
| AMD Radeon RX 6900 XT, AMD Ryzen 9 5950X | |
| NVIDIA GeForce RTX 3080 12 GB, AMD Ryzen 9 5900X | |
| NVIDIA Titan RTX, AMD Ryzen 9 7950X | |
| F1 2021 - 3840x2160 Ultra High Preset + Raytracing AA:T AF:16x | |
| NVIDIA GeForce RTX 4090, AMD Ryzen 9 7950X | |
| NVIDIA GeForce RTX 3090 Ti, AMD Ryzen 7 5800X3D | |
| NVIDIA GeForce RTX 3090, AMD Ryzen 9 7950X | |
| AMD Radeon RX 6950 XT, AMD Ryzen 9 5900X | |
| NVIDIA GeForce RTX 3080 12 GB, AMD Ryzen 9 5900X | |
| NVIDIA Titan RTX, AMD Ryzen 9 7950X | |
| F1 22 - 3840x2160 Ultra High Preset AA:T AF:16x | |
| NVIDIA GeForce RTX 4090, AMD Ryzen 9 7950X | |
| NVIDIA GeForce RTX 3090, AMD Ryzen 9 7950X | |
| AMD Radeon RX 6950 XT, AMD Ryzen 9 5900X | |
| NVIDIA Titan RTX, AMD Ryzen 9 7950X | |
| Borderlands 3 - 3840x2160 Badass Overall Quality (DX11) | |
| NVIDIA GeForce RTX 4090, AMD Ryzen 9 7950X | |
| NVIDIA GeForce RTX 3090 Ti, AMD Ryzen 7 5800X3D | |
| NVIDIA GeForce RTX 3090, AMD Ryzen 9 7950X | |
| NVIDIA GeForce RTX 3080 12 GB, AMD Ryzen 9 5900X | |
| AMD Radeon RX 6950 XT, AMD Ryzen 9 5900X | |
| AMD Radeon RX 6900 XT, AMD Ryzen 9 5950X | |
| AMD Radeon RX 6900 XT, AMD Ryzen 9 5950X | |
| NVIDIA Titan RTX, AMD Ryzen 9 7950X | |
| Cyberpunk 2077 1.6 - 3840x2160 Ultra Preset | |
| NVIDIA GeForce RTX 4090, AMD Ryzen 9 7950X | |
| NVIDIA GeForce RTX 3090 Ti, AMD Ryzen 7 5800X3D | |
| AMD Radeon RX 6950 XT, AMD Ryzen 9 5900X | |
Palit GeForce RTX 4090 GameRock OC with Ryzen 9 vs. Core i9
| Performance rating - Percent | |
| Palit GeForce RTX 4090 GameRock OC -1! | |
| Palit GeForce RTX 4090 GameRock OC | |
| GTA V - 3840x2160 Highest AA:4xMSAA + FX AF:16x | |
| Palit GeForce RTX 4090 GameRock OC | |
| Palit GeForce RTX 4090 GameRock OC | |
| The Witcher 3 - 3840x2160 Ultra Graphics & Postprocessing (HBAO+) | |
| Palit GeForce RTX 4090 GameRock OC | |
| Palit GeForce RTX 4090 GameRock OC | |
| Dota 2 Reborn - 3840x2160 ultra (3/3) best looking | |
| Palit GeForce RTX 4090 GameRock OC | |
| Palit GeForce RTX 4090 GameRock OC | |
| Final Fantasy XV Benchmark - 3840x2160 High Quality | |
| Palit GeForce RTX 4090 GameRock OC | |
| Palit GeForce RTX 4090 GameRock OC | |
| X-Plane 11.11 - 3840x2160 high (fps_test=3) | |
| Palit GeForce RTX 4090 GameRock OC | |
| Palit GeForce RTX 4090 GameRock OC | |
| Shadow of the Tomb Raider - 3840x2160 Highest Preset AA:T | |
| Palit GeForce RTX 4090 GameRock OC | |
| Palit GeForce RTX 4090 GameRock OC | |
| Far Cry 5 - 3840x2160 Ultra Preset AA:T | |
| Palit GeForce RTX 4090 GameRock OC | |
| Palit GeForce RTX 4090 GameRock OC | |
| Far Cry New Dawn - 3840x2160 Ultra Preset | |
| Palit GeForce RTX 4090 GameRock OC | |
| Palit GeForce RTX 4090 GameRock OC | |
| Far Cry 6 - 3840x2160 Ultra Graphics Quality + HD Textures AA:T | |
| Palit GeForce RTX 4090 GameRock OC | |
| Palit GeForce RTX 4090 GameRock OC | |
| GRID Legends - 3840x2160 Ultra Preset | |
| Palit GeForce RTX 4090 GameRock OC | |
| Palit GeForce RTX 4090 GameRock OC | |
| Metro Exodus - 3840x2160 Ultra Quality AF:16x | |
| Palit GeForce RTX 4090 GameRock OC | |
| Palit GeForce RTX 4090 GameRock OC | |
| Forza Horizon 5 - 3840x2160 Extreme Preset | |
| Palit GeForce RTX 4090 GameRock OC | |
| F1 2020 - 3840x2160 Ultra High Preset AA:T AF:16x | |
| Palit GeForce RTX 4090 GameRock OC | |
| Palit GeForce RTX 4090 GameRock OC | |
| F1 2021 - 3840x2160 Ultra High Preset + Raytracing AA:T AF:16x | |
| Palit GeForce RTX 4090 GameRock OC | |
| Palit GeForce RTX 4090 GameRock OC | |
| F1 22 - 3840x2160 Ultra High Preset AA:T AF:16x | |
| Palit GeForce RTX 4090 GameRock OC | |
| Palit GeForce RTX 4090 GameRock OC | |
| Borderlands 3 - 3840x2160 Badass Overall Quality (DX11) | |
| Palit GeForce RTX 4090 GameRock OC | |
| Palit GeForce RTX 4090 GameRock OC | |
| Tiny Tina's Wonderlands - 3840x2160 Badass Preset (DX12) | |
| Palit GeForce RTX 4090 GameRock OC | |
| Palit GeForce RTX 4090 GameRock OC | |
| God of War - 3840x2160 Ultra Preset | |
| Palit GeForce RTX 4090 GameRock OC | |
| Palit GeForce RTX 4090 GameRock OC | |
| The Quarry - 3840x2160 Ultra Preset | |
| Palit GeForce RTX 4090 GameRock OC | |
| Palit GeForce RTX 4090 GameRock OC | |
| Cyberpunk 2077 1.6 | |
| 3840x2160 Ray Tracing Ultra Preset (DLSS off) | |
| Palit GeForce RTX 4090 GameRock OC | |
| Palit GeForce RTX 4090 GameRock OC | |
| 3840x2160 Ultra Preset | |
| Palit GeForce RTX 4090 GameRock OC | |
| Palit GeForce RTX 4090 GameRock OC | |
| low | med. | high | ultra | QHD | 4K DLSS | 4K | |
|---|---|---|---|---|---|---|---|
| GTA V (2015) | 188.2 | 187.9 | 187.4 | 162 | 164.8 | 187.5 | |
| The Witcher 3 (2015) | 826 | 747 | 642 | 320 | 284 | ||
| Dota 2 Reborn (2015) | 310.6 | 276 | 262.9 | 239.2 | 234.4 | ||
| Rise of the Tomb Raider (2016) | 494 | 403 | 379 | 378 | 239 | ||
| Final Fantasy XV Benchmark (2018) | 236 | 233 | 233 | 225 | 161.1 | ||
| X-Plane 11.11 (2018) | 223 | 196.3 | 151.6 | 124.5 | |||
| Far Cry 5 (2018) | 238 | 209 | 200 | 188 | 185 | 175 | |
| Strange Brigade (2018) | 698 | 575 | 570 | 565 | 512 | 281 | |
| Shadow of the Tomb Raider (2018) | 332 | 325 | 323 | 304 | 279 | 186 | |
| Far Cry New Dawn (2019) | 200 | 177 | 171 | 154 | 152 | 145 | |
| Metro Exodus (2019) | 300 | 265 | 234 | 201 | 185.8 | 139.7 | |
| Anno 1800 (2019) | 211 | 199.3 | 143.1 | 73.6 | 72.8 | 66.9 | |
| Control (2019) | 240 | 240 | 240 | 219 | 113.3 | ||
| Borderlands 3 (2019) | 242 | 216 | 200 | 186.8 | 186 | 135 | |
| F1 2020 (2020) | 563 | 475 | 471 | 412 | 407 | 286 | |
| Crysis Remastered (2020) | 491 | 446 | 327 | 284 | 231 | 147.3 | |
| Mafia Definitive Edition (2020) | 292 | 266 | 237 | 226 | 162.7 | ||
| Watch Dogs Legion (2020) | 184.6 | 178.7 | 160.3 | 149.7 | 146.5 | 116.7 | |
| Dirt 5 (2020) | 385.7 | 356.1 | 333.8 | 325.7 | 287.4 | 190.4 | |
| F1 2021 (2021) | 677 | 642 | 529 | 271 | 263 | 199.1 | |
| New World (2021) | 215 | 188 | 183.5 | 175.3 | 174.8 | 149.3 | |
| Far Cry 6 (2021) | 209 | 189.4 | 169.5 | 173.9 | 168.4 | 136.9 | |
| Riders Republic (2021) | 318 | 309 | 292 | 279 | 229 | 149 | |
| Forza Horizon 5 (2021) | 411 | 302 | 283 | 208 | 197 | 162 | |
| God of War (2022) | 278 | 276 | 269 | 212 | 179.5 | 130.1 | |
| GRID Legends (2022) | 330 | 297 | 262 | 252 | 244 | 201 | |
| Cyberpunk 2077 1.6 (2022) | 229 | 225 | 215 | 207 | 149.6 | 78 | |
| Ghostwire Tokyo (2022) | 284 | 281 | 280 | 277 | 277 | 163.4 | |
| Tiny Tina's Wonderlands (2022) | 428 | 354 | 311 | 289 | 229 | 130.3 | |
| Vampire Bloodhunt (2022) | 460 | 398 | 394 | 382 | 374 | 254 | |
| F1 22 (2022) | 443 | 414 | 414 | 194.5 | 157.5 | 82.5 | |
| The Quarry (2022) | 427 | 337 | 290 | 256 | 193.8 | 75.4 | |
| FIFA 23 (2022) | 276 | 273 | 270 | 267 | 248 | 245 | |
| A Plague Tale Requiem (2022) | 179.6 | 173.6 | 167.9 | 154.3 | 125.8 | 73.7 | |
| Uncharted Legacy of Thieves Collection (2022) | 146.3 | 145.5 | 144.5 | 143.7 | 143.6 | 100.7 | |
| Call of Duty Modern Warfare 2 2022 (2022) | 304 | 287 | 245 | 240 | 191 | 183 | 128 |
| Spider-Man Miles Morales (2022) | 208 | 198.9 | 174.5 | 175.4 | 174.4 | 130.8 | |
| The Callisto Protocol (2022) | 229 | 222 | 202 | 201 | 183 | 127 | |
| Need for Speed Unbound (2022) | 178.2 | 171.1 | 154.3 | 153.7 | 152.8 | 146.3 | |
| High On Life (2023) | 388 | 357 | 307 | 293 | 224 | 106.6 | |
| The Witcher 3 v4 (2023) | 289 | 255 | 229 | 212 | 212 | 164.2 | |
| Dead Space Remake (2023) | 266 | 265 | 246 | 248 | 199.7 | 106.5 | |
| Hogwarts Legacy (2023) | 162.1 | 142.9 | 129.6 | 121.5 | 120.3 | 86 | |
| Returnal (2023) | 214 | 212 | 208 | 201 | 174 | 109 | |
| Atomic Heart (2023) | 316 | 251 | 234 | 223 | 181.6 | 110.9 | |
| Company of Heroes 3 (2023) | 383.1 | 364 | 344.8 | 330.8 | 302.8 | 205.7 | |
| Sons of the Forest (2023) | 133.3 | 126.3 | 122.3 | 120.7 | 118 | 114.2 | |
| Resident Evil 4 Remake (2023) | 287 | 303 | 294 | 213 | 188.9 | 121.8 | |
| The Last of Us (2023) | 169.6 | 163.2 | 163 | 162.8 | 136.9 | 118.1 | 77.4 |
| Dead Island 2 (2023) | 326 | 312 | 280 | 250 | 261 | 165.1 | |
| Star Wars Jedi Survivor (2023) | 170.6 | 166.3 | 160 | 155.4 | 150.3 | 80.4 | |
| Diablo 4 (2023) | 398 | 399 | 399 | 398 | 392 | 239 | 220 |
| F1 23 (2023) | 476 | 509 | 472 | 210 | 154 | 134 | 79.6 |
| Ratchet & Clank Rift Apart (2023) | 231 | 217 | 184.7 | 153.5 | 147.1 | 108.8 | |
| Atlas Fallen (2023) | 194.9 | 192.5 | 187 | 185.4 | 184.2 | 168.4 | |
| Immortals of Aveum (2023) | 155.6 | 138.2 | 124.4 | 97.3 | 126.1 | 62.6 | |
| Armored Core 6 (2023) | 119.7 | 119.6 | 119.8 | 119.5 | 119.5 | 119.3 | |
| Starfield (2023) | 138.9 | 139.2 | 130 | 124.5 | 78.1 | ||
| Lies of P (2023) | 330 | 327 | 303 | 286 | 264 | 237 | 166.7 |
| Baldur's Gate 3 (2023) | 323 | 299 | 274 | 265 | 203 | 189.4 | 112.6 |
| Counter-Strike 2 (2023) | 351 | 340 | 339 | 340 | 312 | 202 | |
| EA Sports FC 24 (2023) | 382 | 323 | 266 | 264 | 263 | 254 | |
| Assassin's Creed Mirage (2023) | 247 | 240 | 230 | 170 | 162 | 144 | 126 |
| Total War Pharaoh (2023) | 565.7 | 348.2 | 231.3 | 187.1 | 186.2 | 158.2 | |
| Lords of the Fallen (2023) | 181.7 | 174.2 | 155 | 116 | 88.6 | 88.6 | 53.2 |
| Alan Wake 2 (2023) | 152.4 | 149.3 | 144.4 | 126.7 | 58.7 | 72.2 | |
| EA Sports WRC (2023) | 255 | 170.6 | 157.8 | 152.6 | 147.4 | 139.6 | 121 |
| Call of Duty Modern Warfare 3 2023 (2023) | 330 | 306 | 265 | 254 | 199 | 129 | |
| Avatar Frontiers of Pandora (2023) | 251 | 234 | 209 | 170 | 124 | 113 | 69 |
| The Finals (2023) | 332 | 309 | 295 | 300 | 256 | 209 | 139.2 |
| Ready or Not (2023) | 336 | 356 | 336 | 323 | 263 | 243 | 132.4 |
PalitGeForce RTX 4090 GameRock OC Emissions
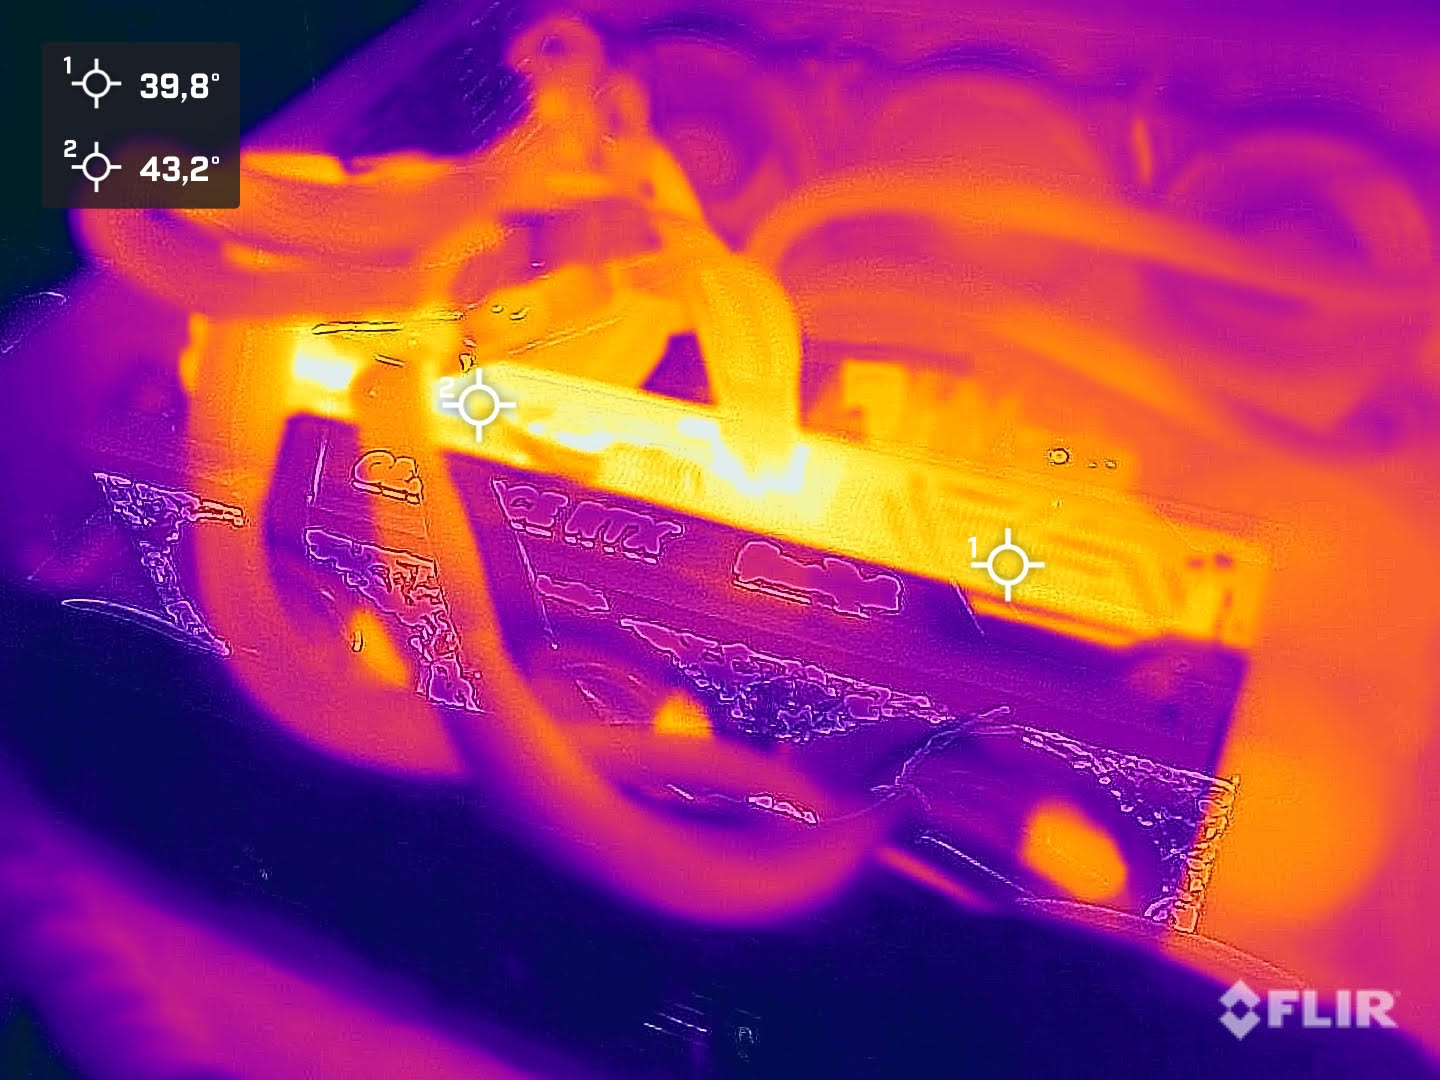
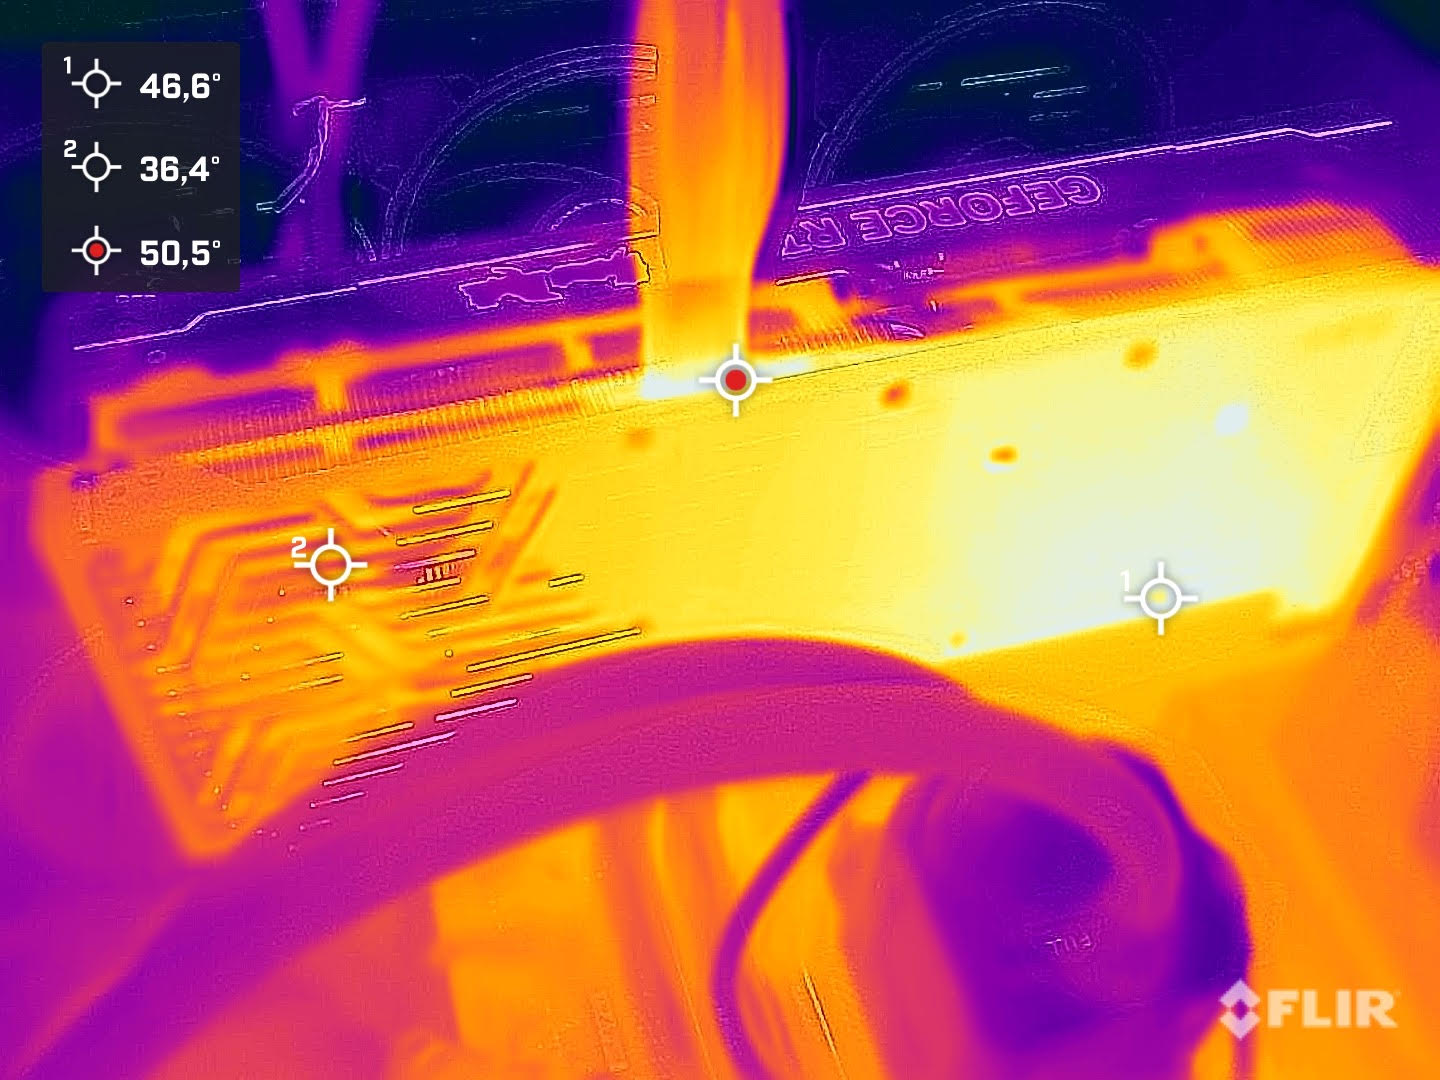
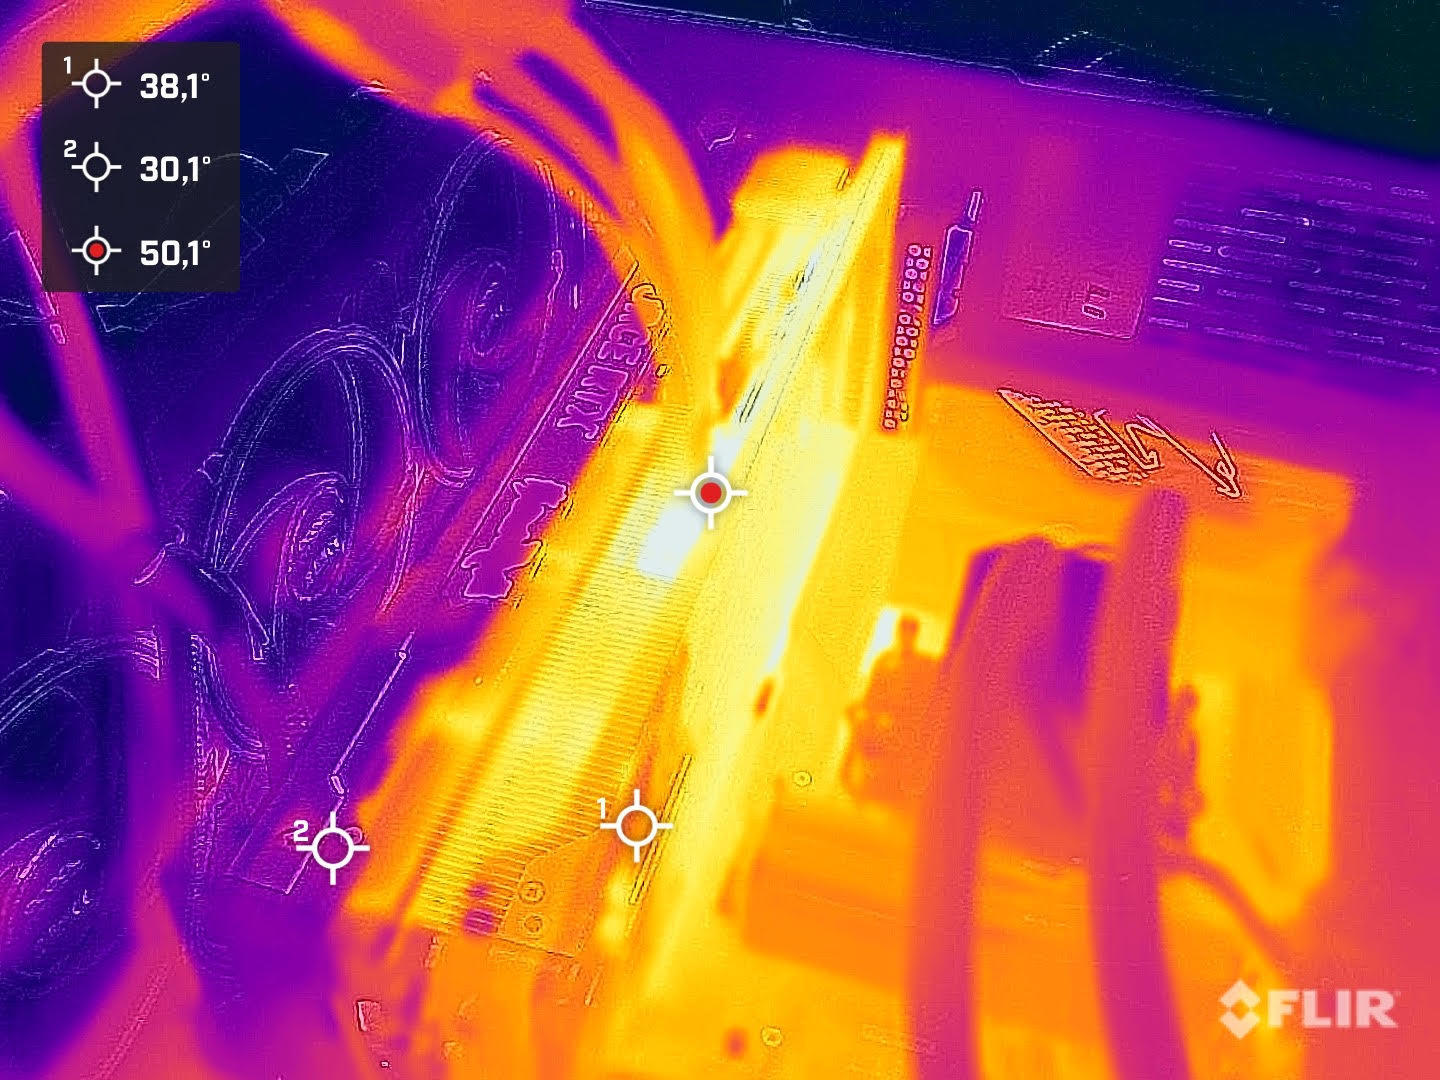
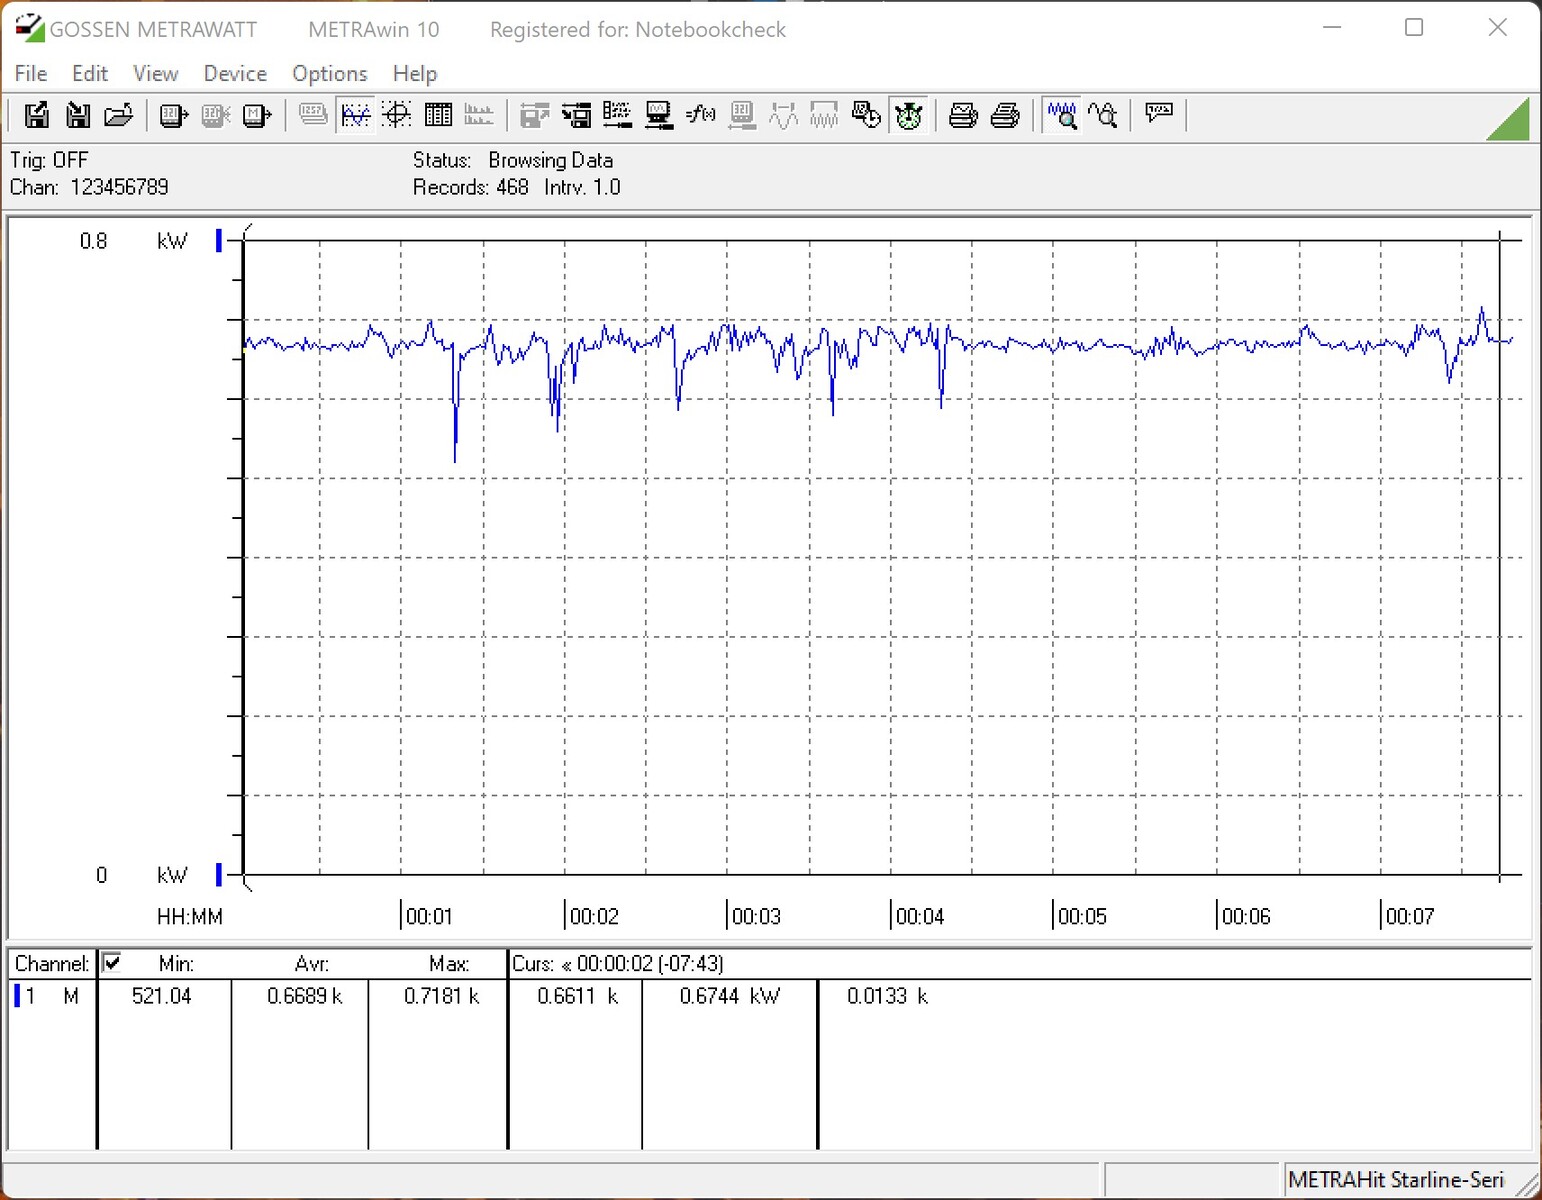
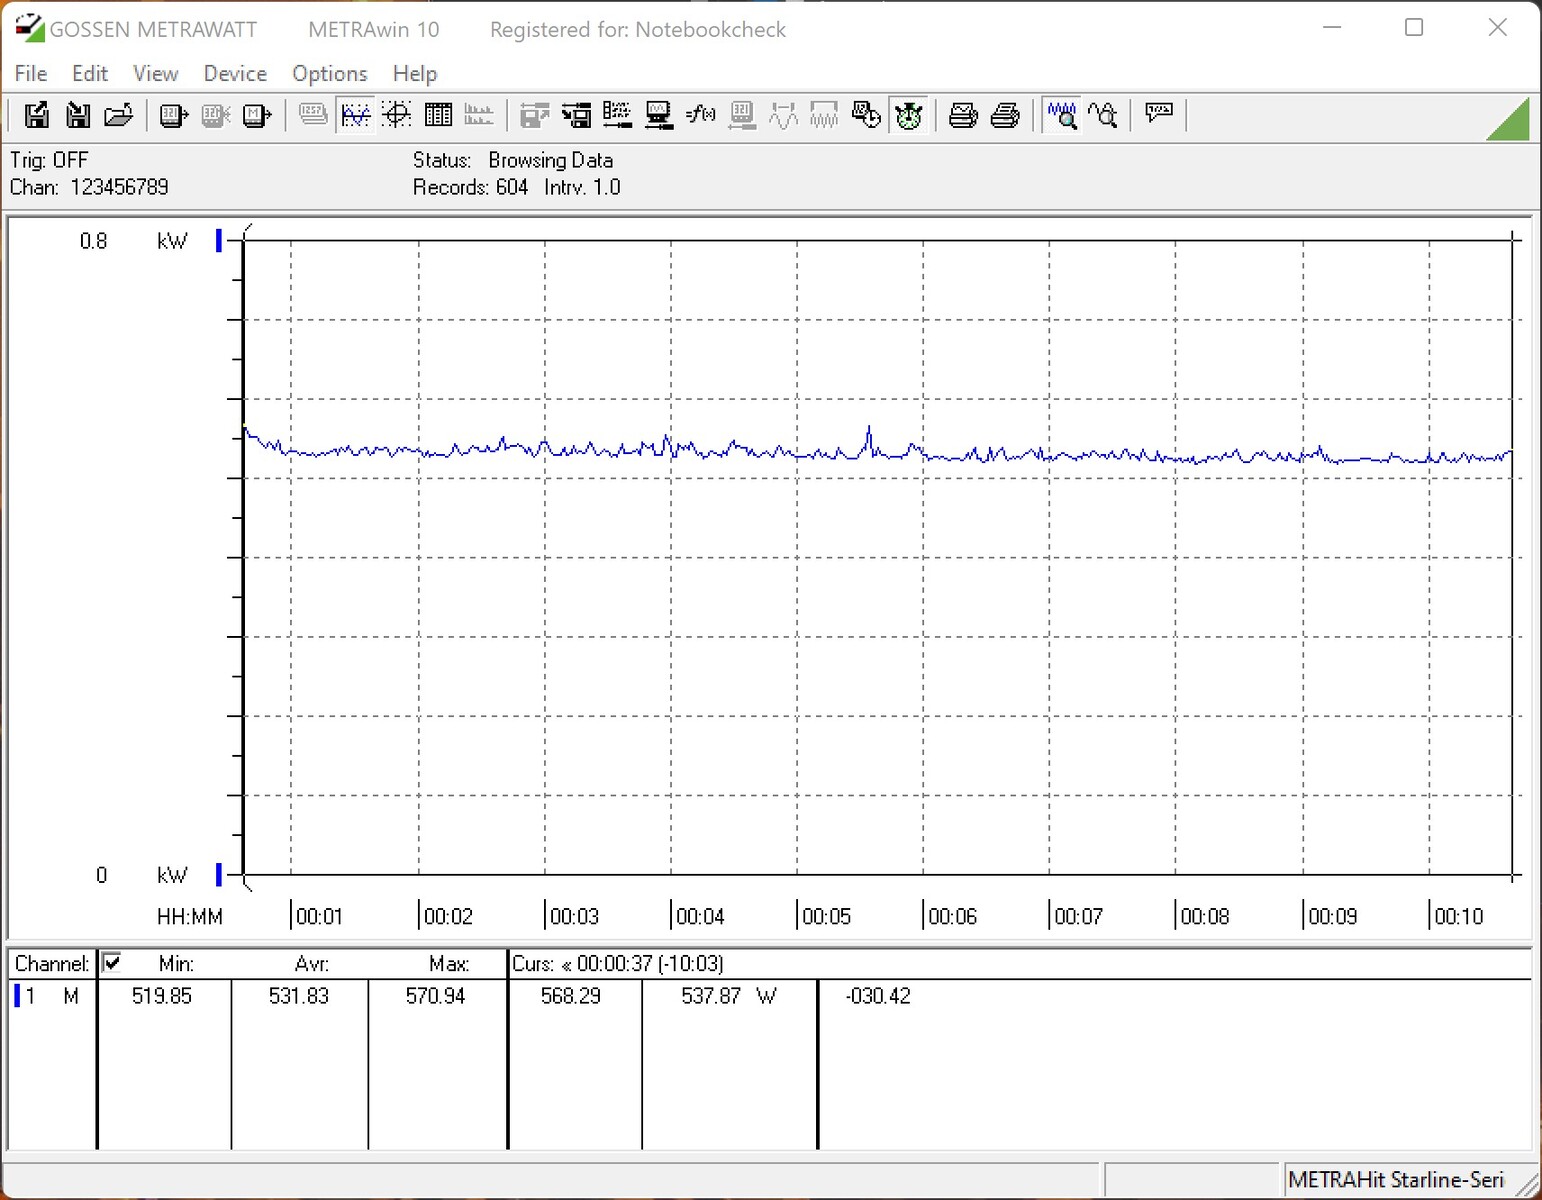
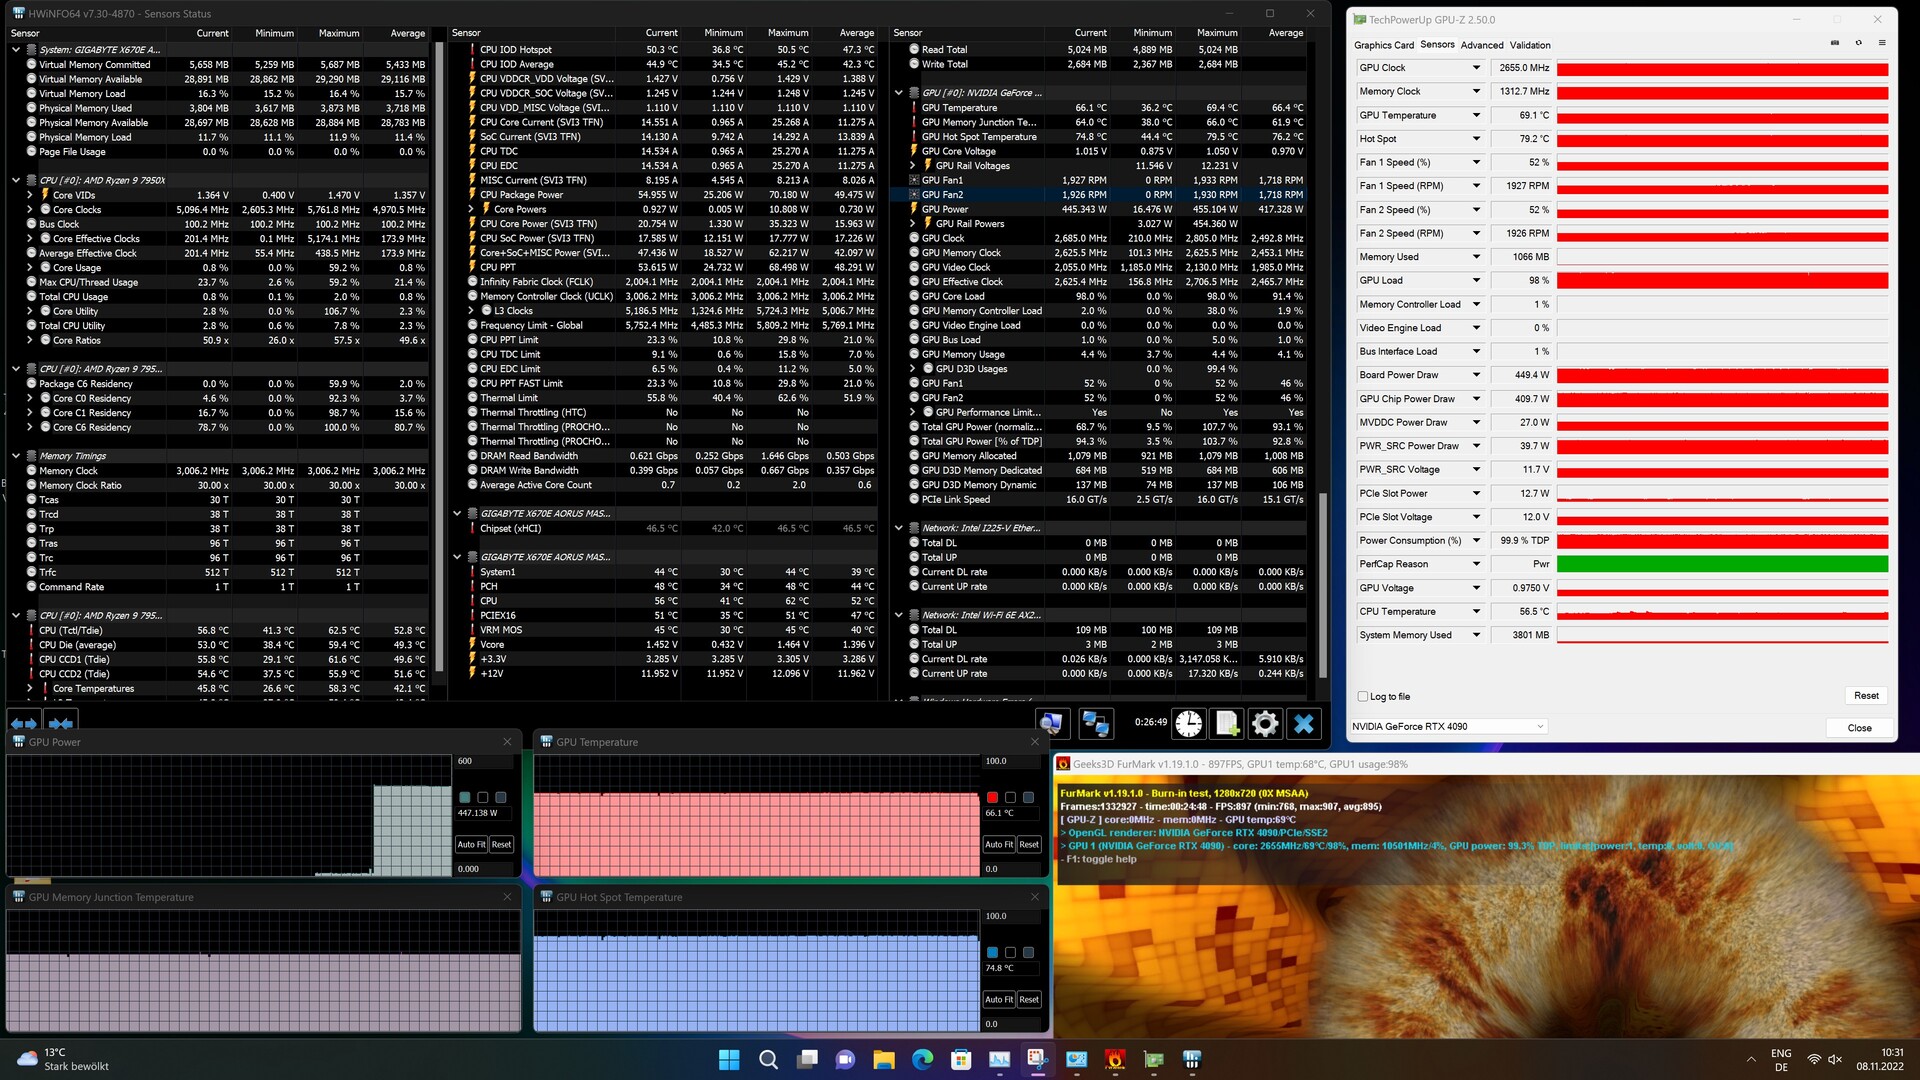
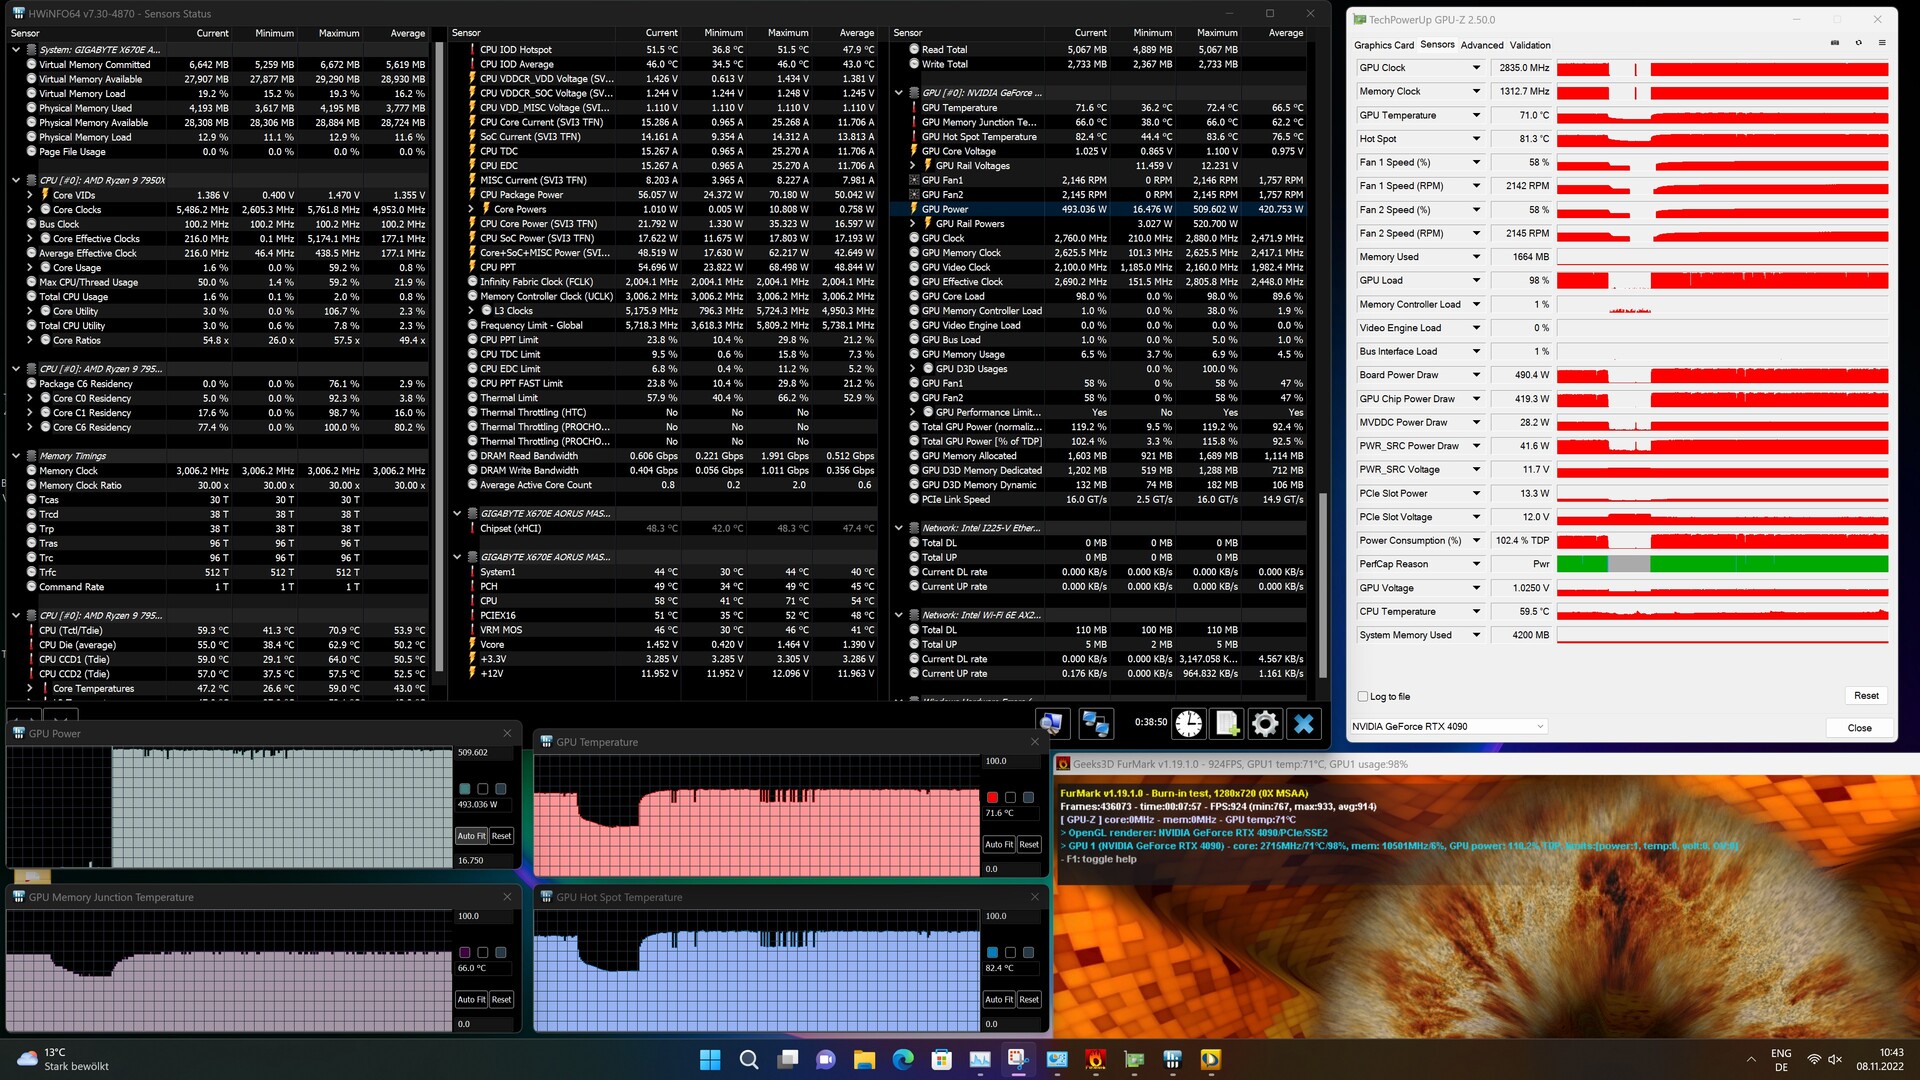
在450瓦的情况下,NvidiaGeForce RTX 4090的水平与 NvidiaGeForce RTX 3090 Ti.然而,与Nvidia RTX 3090 Ti相比,耗电量增加了整整100瓦。 NvidiaGeForce RTX 3090,这一趋势在过去几年中已经固化,我们只能希望目前的极限已经达到。任何寻求终极性能的人都不应该关注功耗的话题。PalitGeForce RTX 4090 GameRock OC在压力测试期间消耗的450瓦被成功消散。在近70℃的温度下,GPU芯片保持相对凉爽,VRAM也是如此,在最高66℃的温度下我们无法检测到任何温度问题。功率目标和CPU电压可以稍微增加,据此显卡在负载下达到最大509瓦。芯片温度也因此而略有上升。内置风扇做得很好,在标准操作中以大约2000转/分的速度冷却显卡。从机箱内只能听到显卡的声音。
说到游戏,PalitGeForce RTX 4090 GameRock OC没有理由隐藏。这里的AMD Radeon RX 6950 XT以及NvidiaGeForce RTX 3090 Ti需要更多能量。然而,在这个测试中,我们已经接近了CPU的极限,这意味着GPU无法实现最大性能。当比较FurMark压力测试下的功耗时,对PalitGeForce RTX 4090 GameRock OC来说,情况发生了变化。平均为611瓦,新的高端显卡的功耗明显偏高。因此,应该使用一个强大的电源来操作显卡。帕利特自己建议使用1000瓦的电源,我们在测试中使用的就是这样的电源。在所有的测试和基准测试中,电源都没有问题。
| Power Consumption / The Witcher 3 ultra (external Monitor) | |
| AMD Radeon RX 6950 XT, AMD Ryzen 9 5900X | |
| NVIDIA GeForce RTX 3090 Ti, AMD Ryzen 7 5800X3D (Idle: 102 W) | |
| NVIDIA GeForce RTX 3090, AMD Ryzen 9 7950X | |
| NVIDIA GeForce RTX 4090, AMD Ryzen 9 7950X | |
| NVIDIA GeForce RTX 3080 12 GB, AMD Ryzen 9 5900X | |
| AMD Radeon RX 6900 XT, AMD Ryzen 9 5950X (Idle: 99.15 W) | |
| Power Consumption / FurMark 1.19 GPU Stress Test (external Monitor) | |
| NVIDIA GeForce RTX 4090, AMD Ryzen 9 7950X | |
| AMD Radeon RX 6950 XT, AMD Ryzen 9 5900X | |
| NVIDIA GeForce RTX 3090, AMD Ryzen 9 7950X | |
| NVIDIA GeForce RTX 3080 12 GB, AMD Ryzen 9 5900X | |
| AMD Radeon RX 6900 XT, AMD Ryzen 9 5950X (Idle: 99.15 W) | |
* ... smaller is better
Pros
Cons
结论 - 蛮力,没有温度问题
Nvidia的最新旗舰产品,GeForce RTX 4090,将之前的一切都置于阴影之下--然后是一些。在性能上的飞跃比起 NvidiaGeForce RTX 3090的飞跃是巨大的。在某些情况下,这几乎意味着帧率翻了一番。然而,总体而言,性能增长在50%至70%的水平上,这仍然令人印象深刻。同样地,AMD也处于劣势,其最新的 Radeon RX 6950 XT.几天前才推出的AMD Radeon RX 7900 XTX正竭力与之抗衡。
在我们的审查中使用的GeForce RTX 4090 GameRock OC的性能一直很好。凭借DLSS和光线追踪等众所周知的功能,Nvidia再次通过目前只有RTX 4000系列提供的创新大大提升了性能,并以此来吸引潜在买家。AMD是否能在这方面效仿,还有待观察。尽管如此,这些功能承诺很多,因为越来越多的游戏正在使用该技术,在不损失图像质量的情况下提高帧率。但即使没有DLSS,GeForce RTX 4090也为目前几乎所有的游戏在最高设置下的2160p提供了巨大的动力。
对于考虑购买的人来说,值得记住的是,一个非常快的CPU是必要的。此外,只为1080p或1440p游戏浪费显卡功率是没有意义的。显卡很快就会感到厌烦。
PalitGeForce RTX 4090 GameRock OC以午夜万花筒的设计吸引了人们的注意。感谢阿达-拉芙蕾丝,设计与性能相匹配,不受限制的4K游戏是可能的。
当涉及到功耗和实施的12VHPWR连接器时,意见可能是分裂的。一方面,450瓦的功率仍然在限制范围内,如果我们保持NvidiaGeForce RTX 3090 Ti铭记在心。这款产品采用了相同的TBP,但在很大程度上无法达到NvidiaGeForce RTX 4090的性能。因此,Nvidia再次能够通过新的Ada Lovelace架构大幅提高效率。新的电源连接器最近一直受到抨击。到目前为止,我们还无法检测到与该连接器有关的任何问题。然而,我们将继续监测此事,并向您提供最新信息,如果这种命运也降临到我们身上。帕利特GeForce RTX 4090 GameRock OC的设计也是一个成功的设计,部分原因是其钻石般的表面。包装被微妙的RGB灯光很好地圆了起来。同样,内置的帕利特冷却器做得很好,尽管功耗很高,但显卡在负载下仍保持愉快的安静。
价格和可用性
这些显卡仍然很难买到。当模型可以买到时,它们往往在Nvidia的1949欧元的建议零售价基础上加了一大笔附加费。目前,我们的审查样本在 亚马逊售价2679美元.然而,交货时间为4至6周。PalitGeForce RTX 4090 GameRock的非OC型号目前在亚马逊上可以买到,价格为2369美元。
Price comparison

