小米 Mi Mix 平板手机简短评测

| Networking | |
| iperf3 transmit AX12 | |
| Apple iPhone 7 (Klaus I211) | |
| Google Pixel XL 2016 | |
| Samsung Galaxy S7 Edge | |
| OnePlus 3T | |
| Xiaomi Mi Mix | |
| Huawei Mate 9 | |
| iperf3 receive AX12 | |
| Apple iPhone 7 (Klaus I211) | |
| Google Pixel XL 2016 | |
| Xiaomi Mi Mix | |
| Samsung Galaxy S7 Edge | |
| Huawei Mate 9 | |
| OnePlus 3T | |


| |||||||||||||||||||||||||
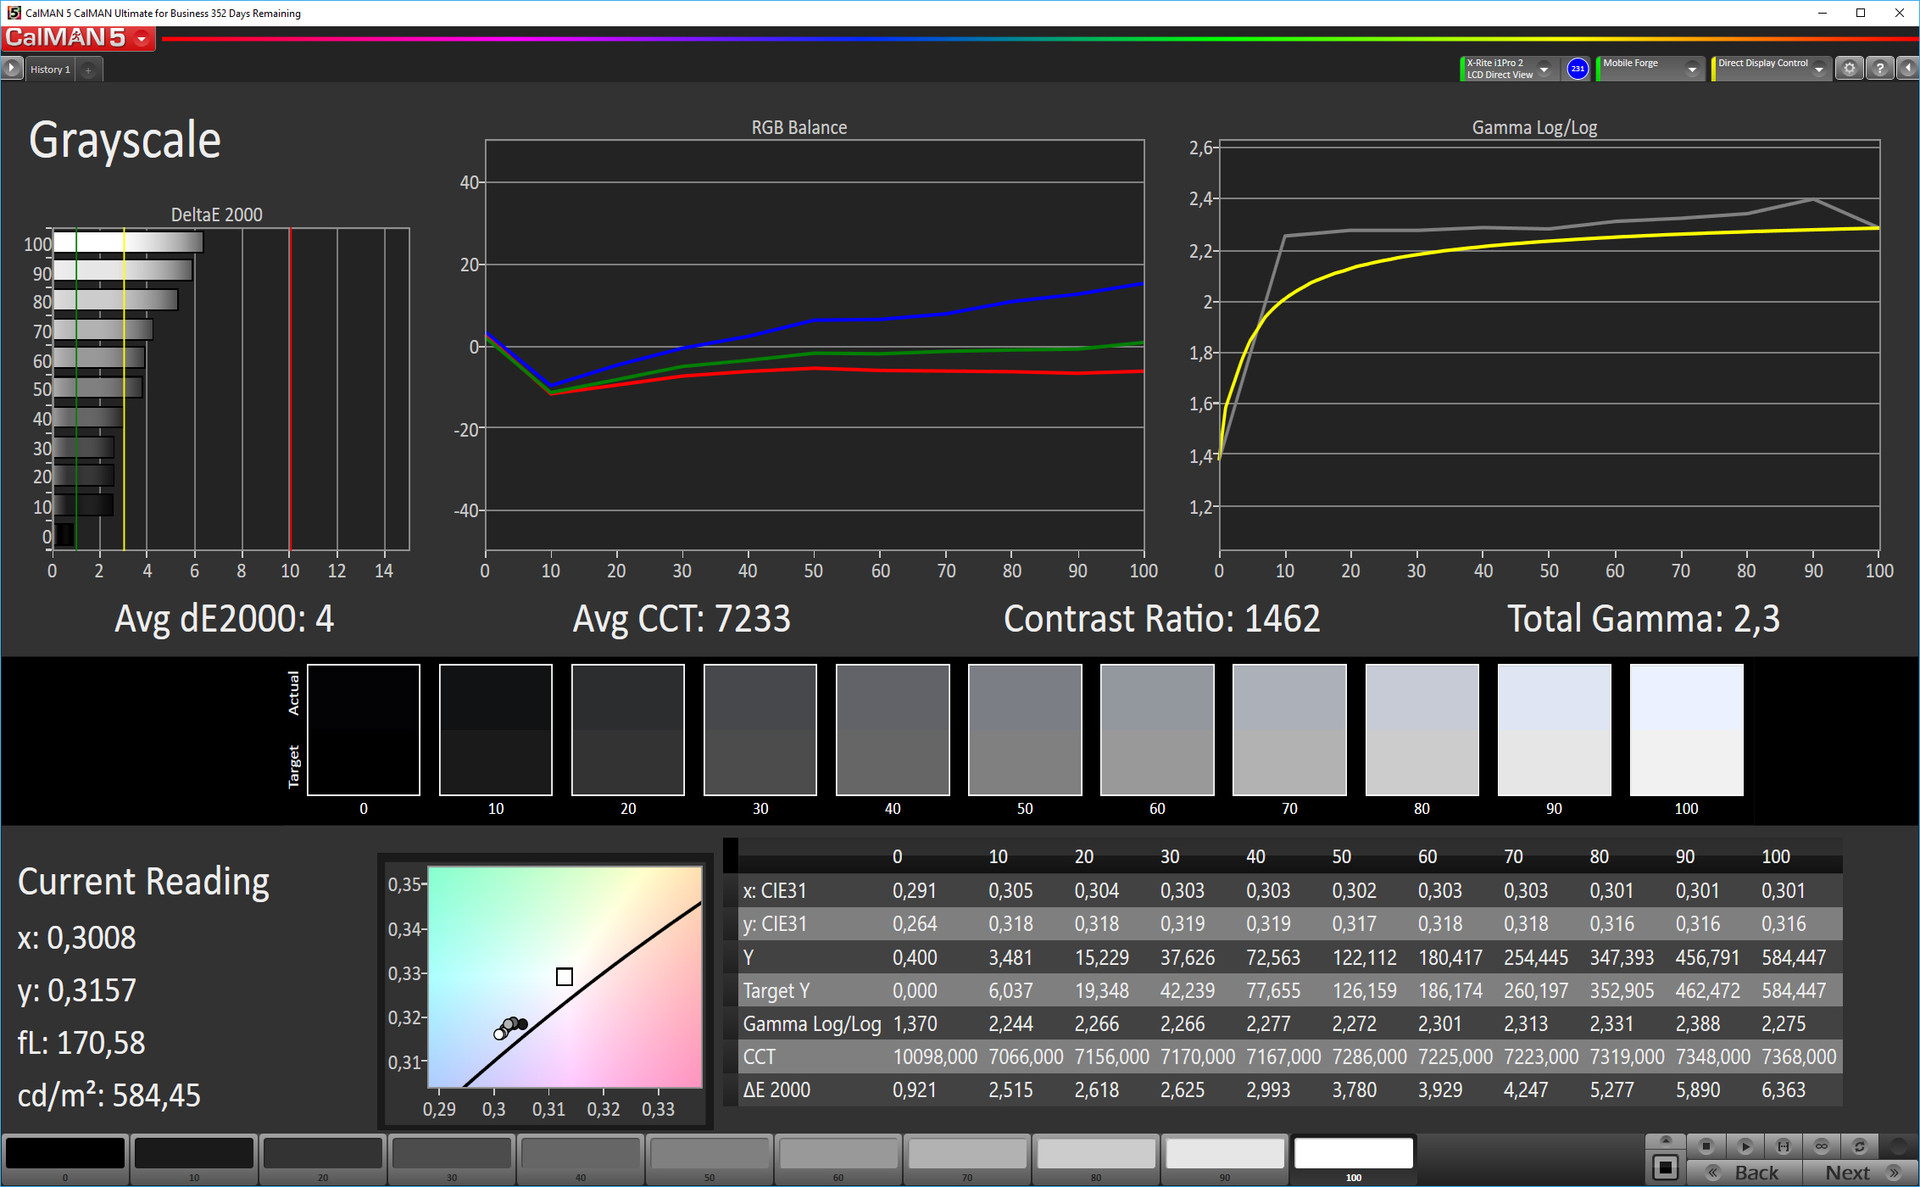
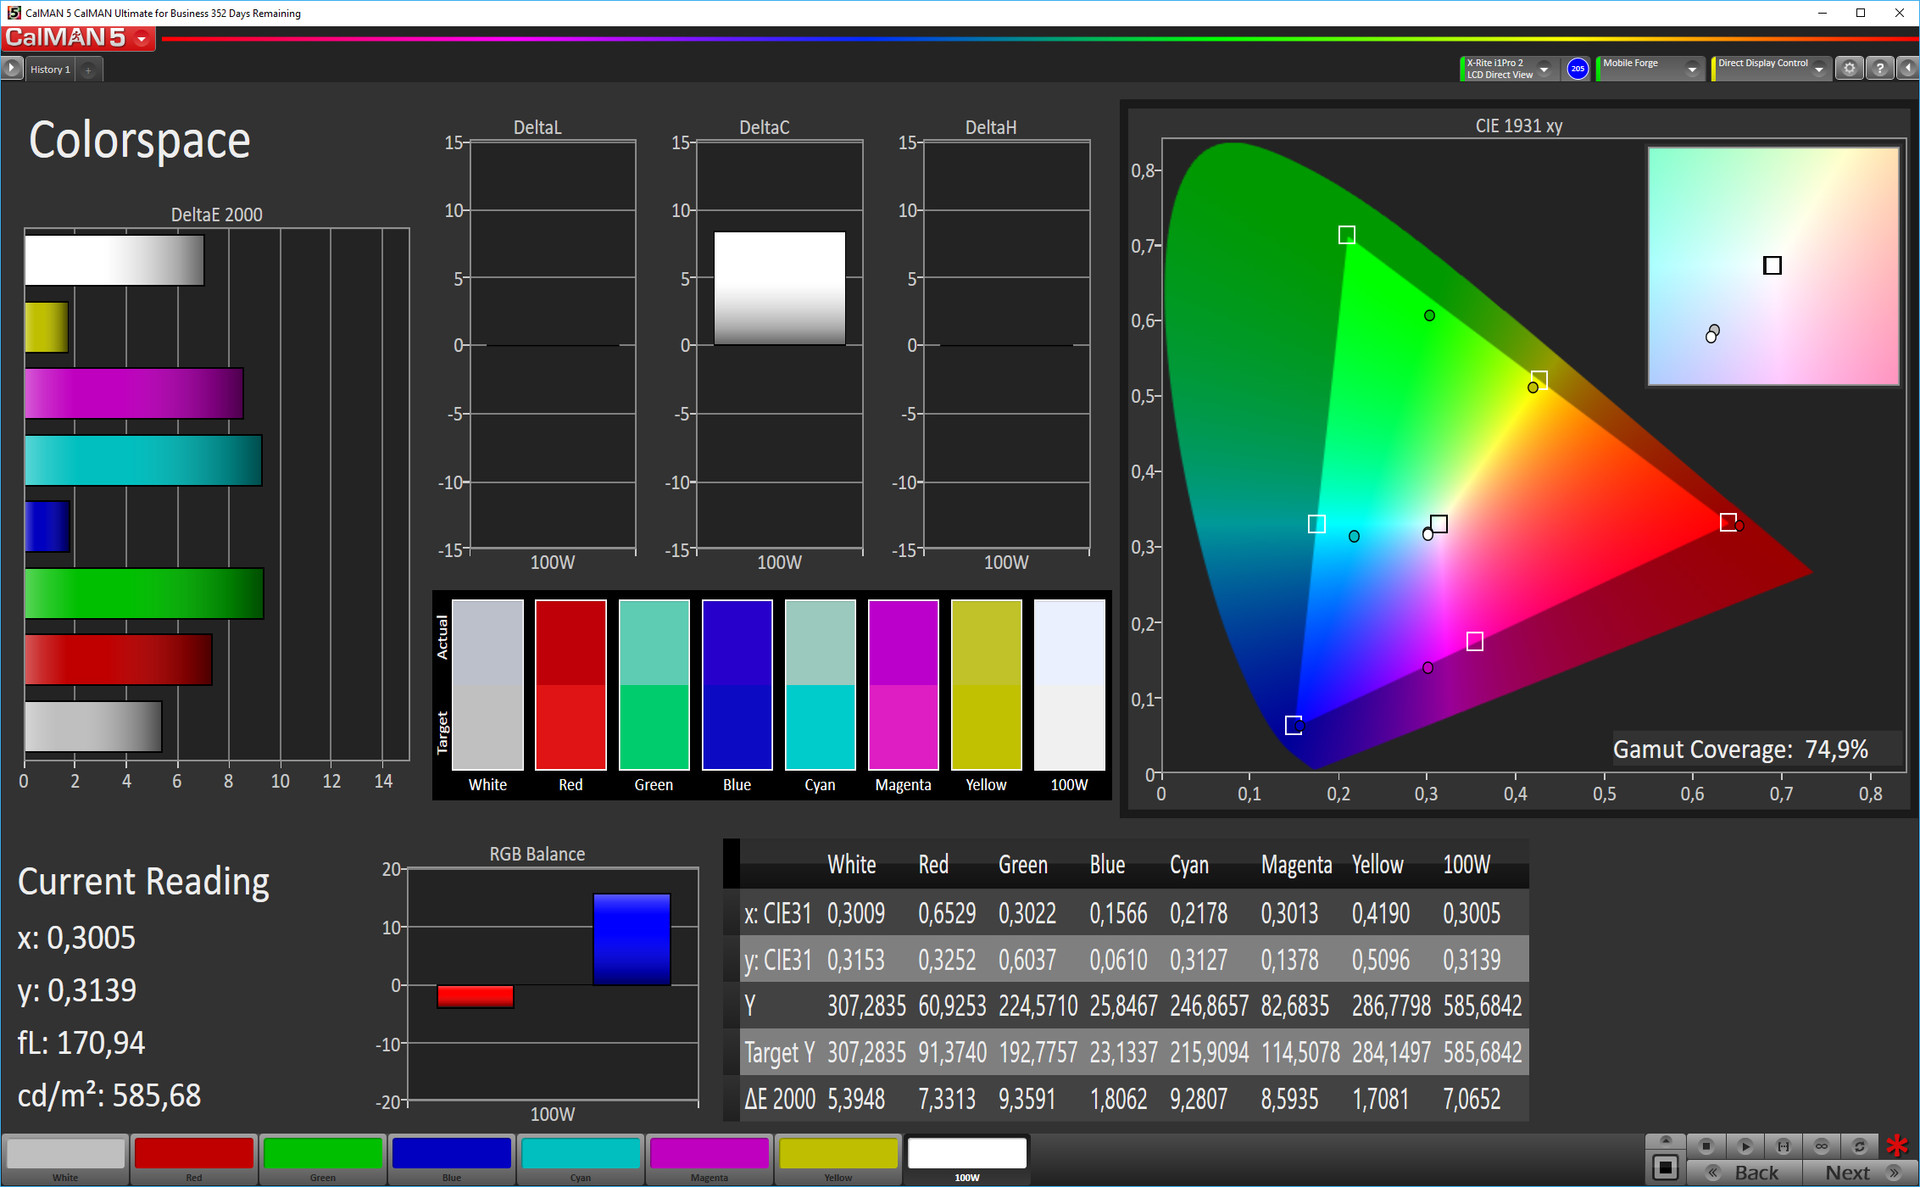
Brightness Distribution: 89 %
Center on Battery: 530 cd/m²
Contrast: 1374:1 (Black: 0.42 cd/m²)
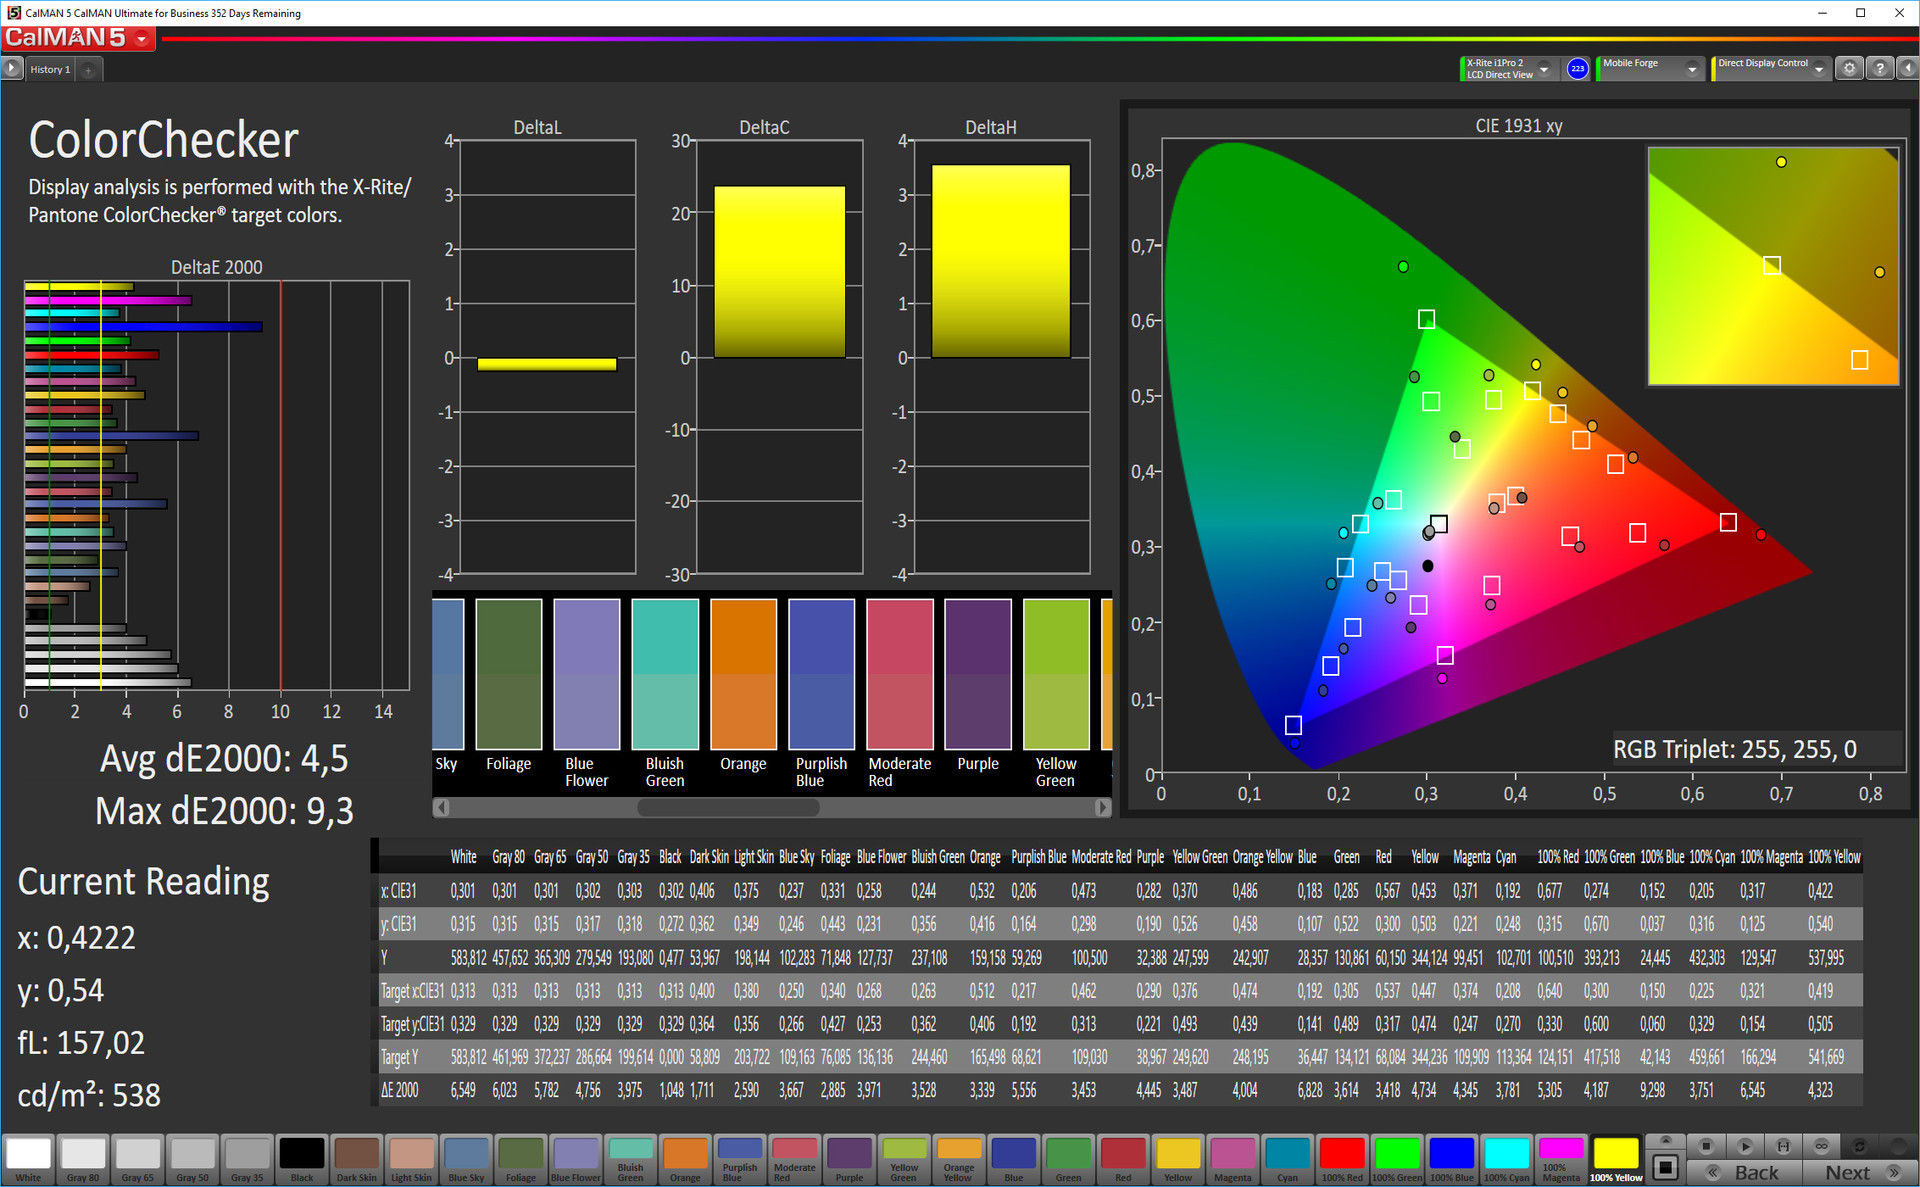
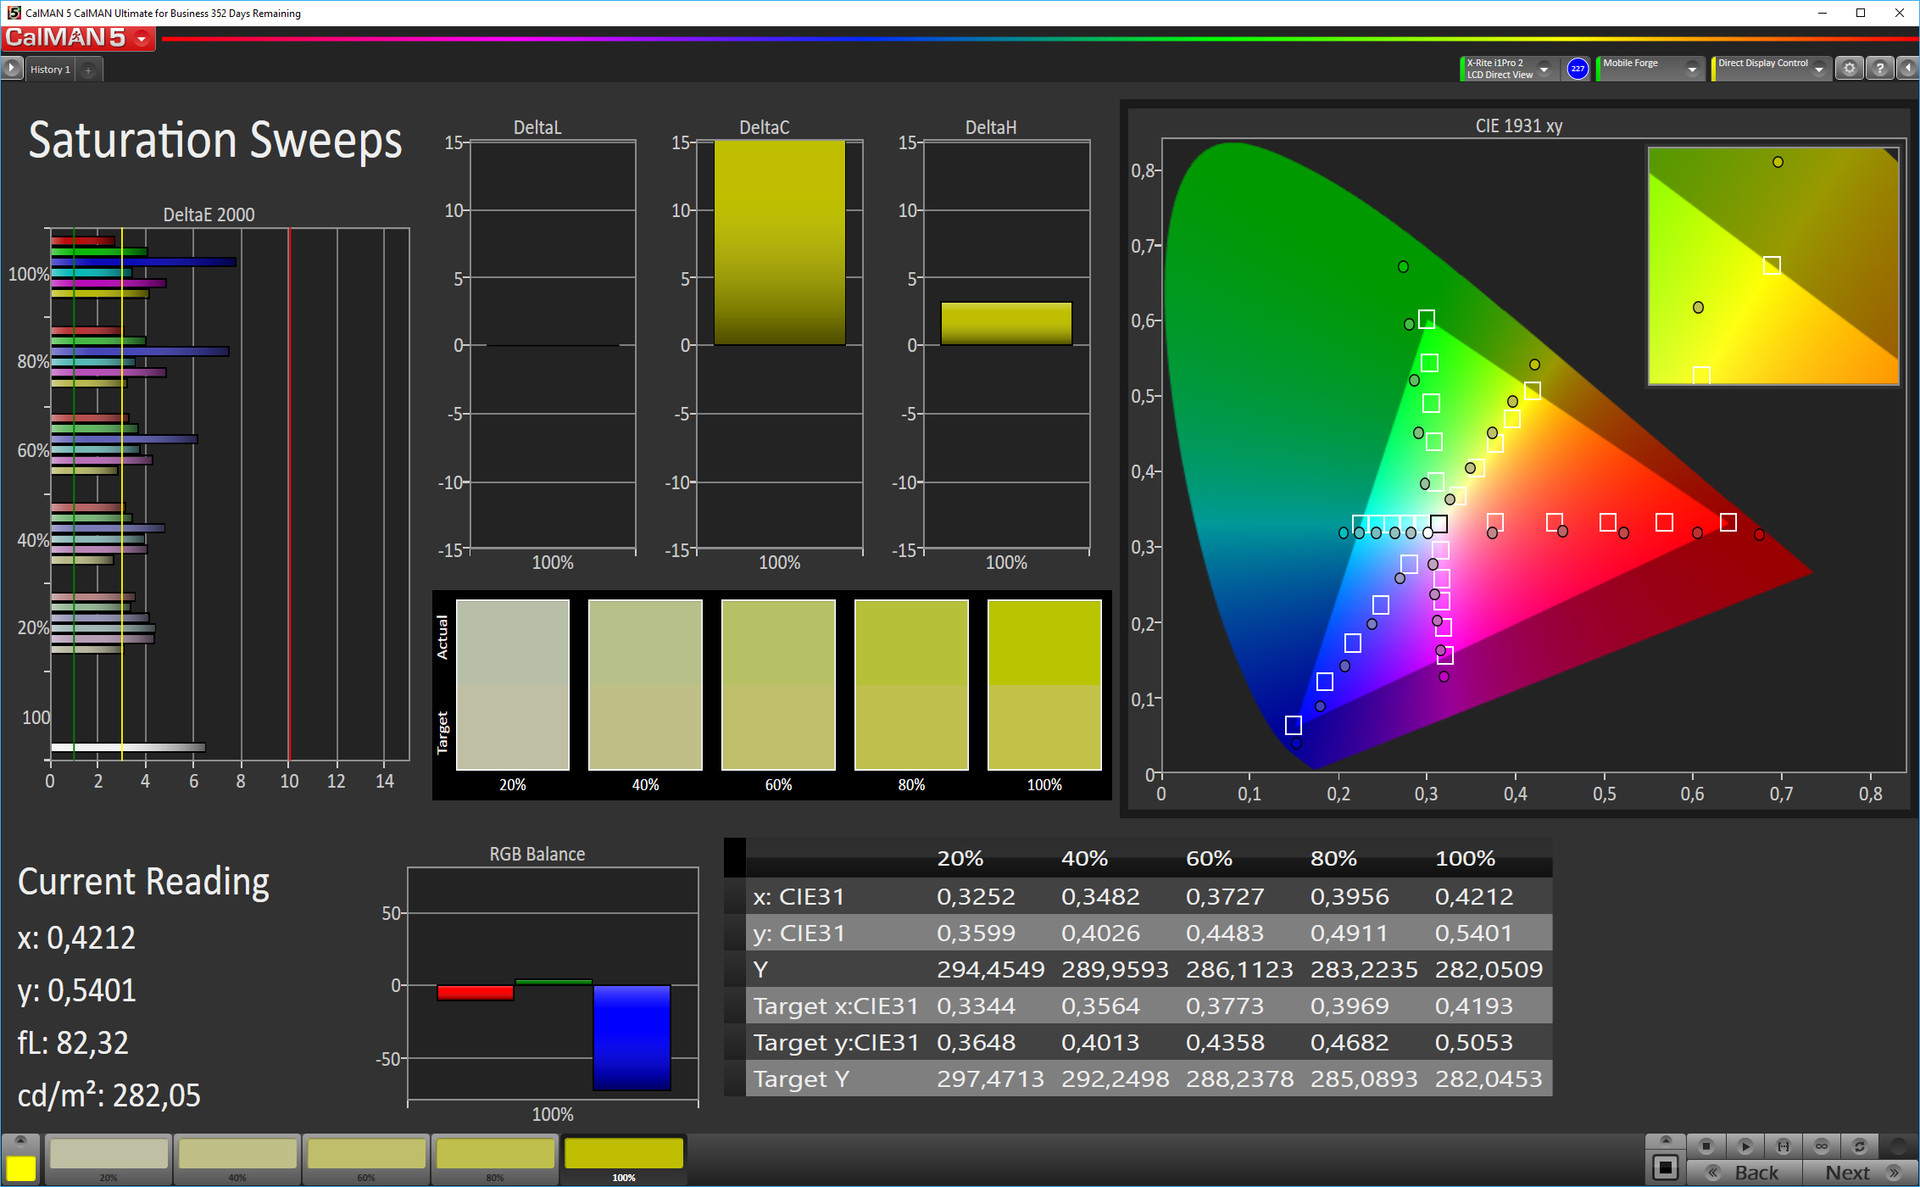
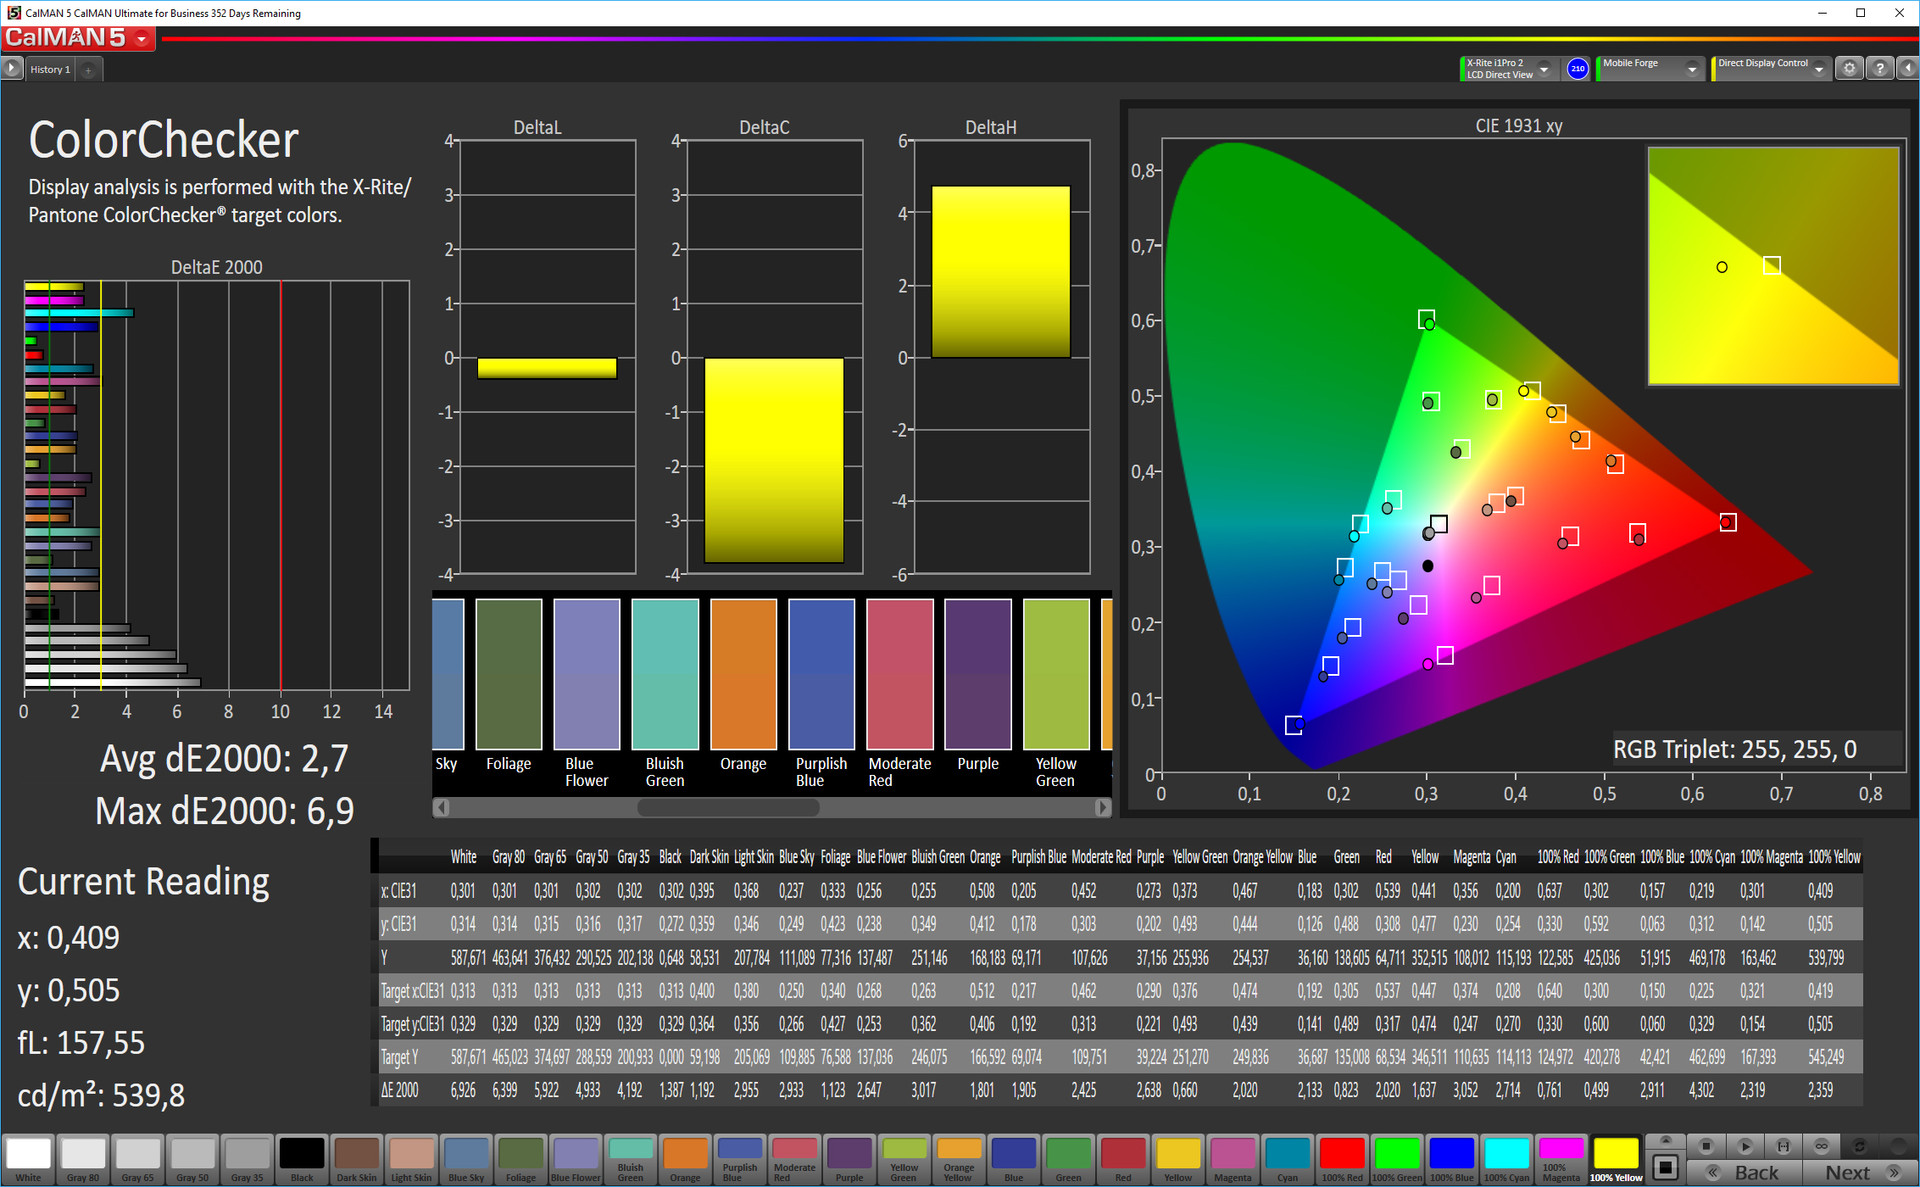
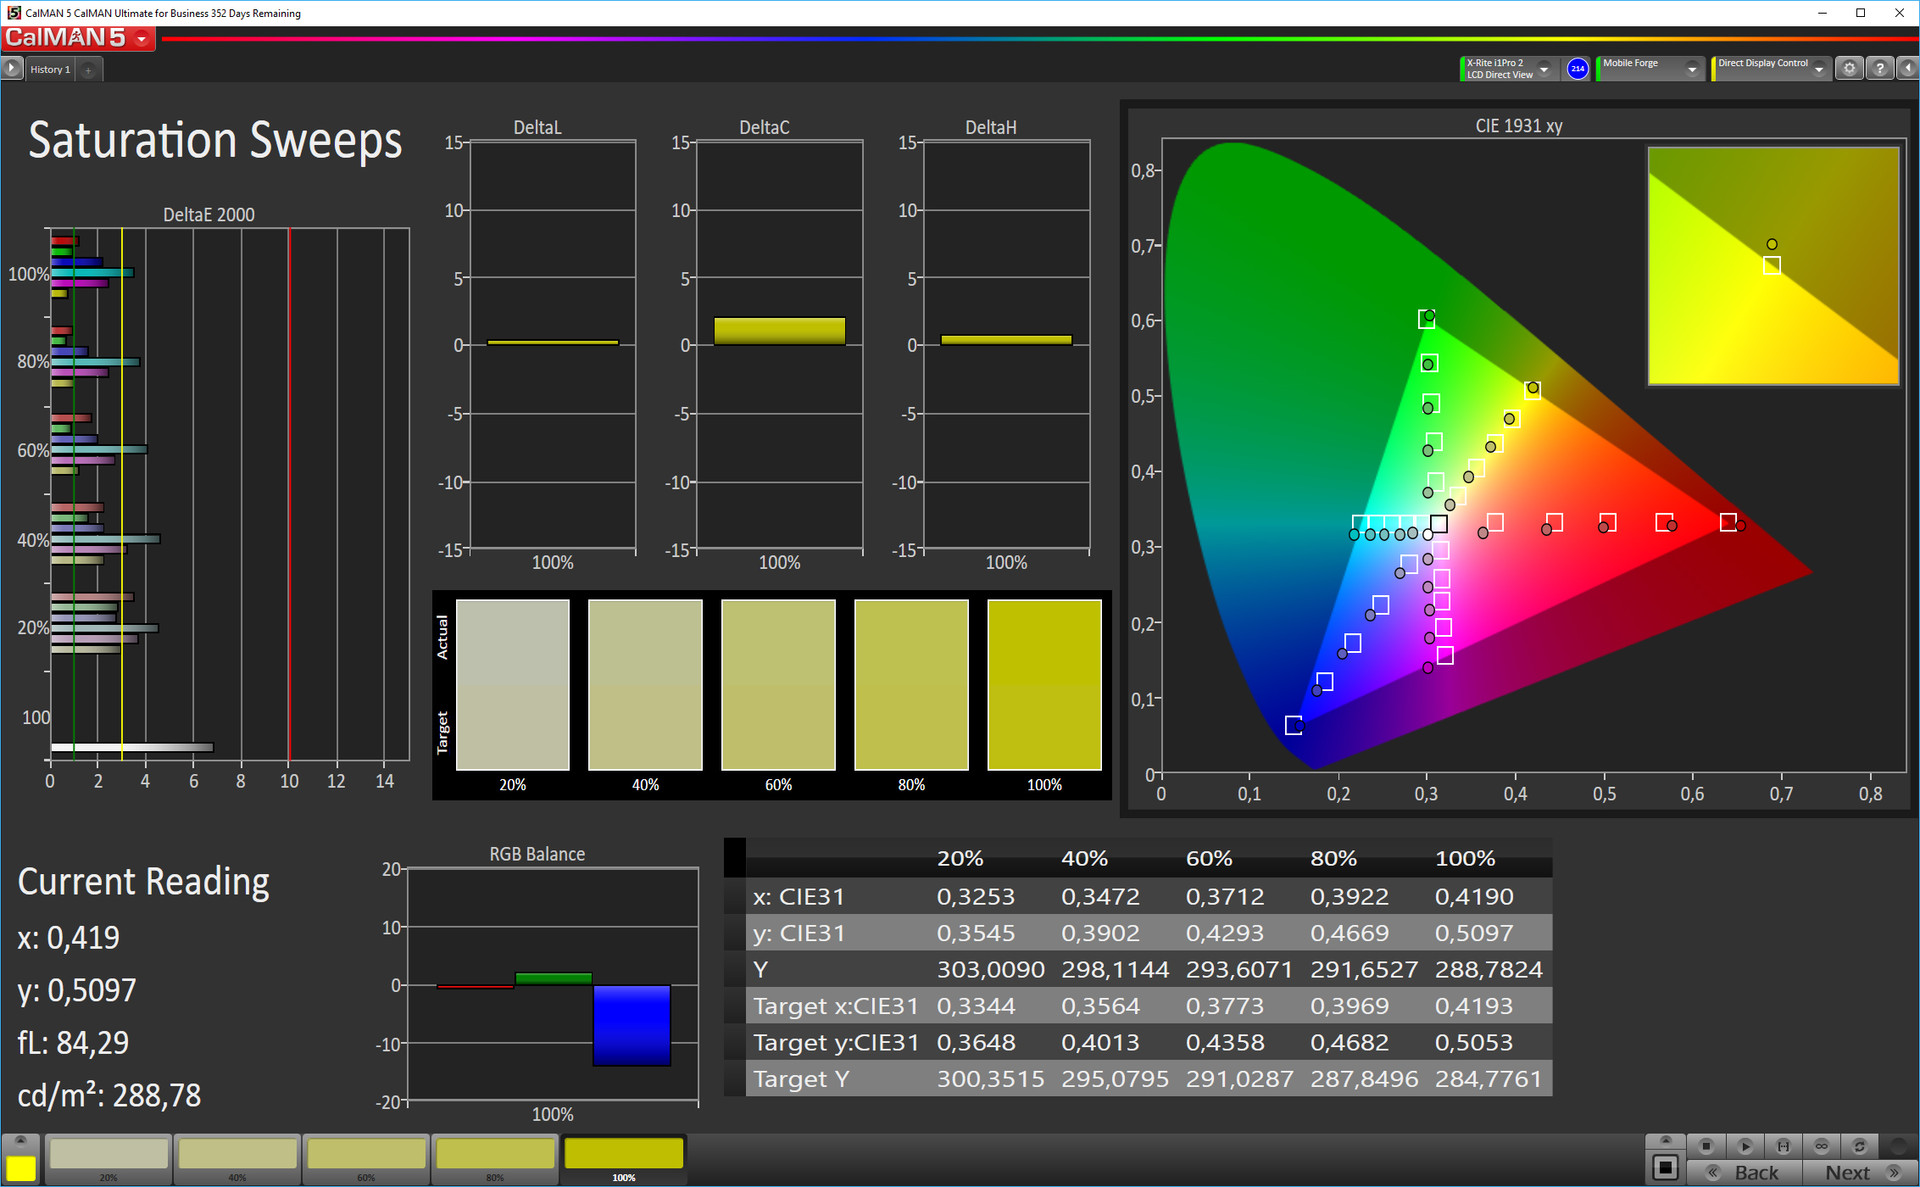
ΔE ColorChecker Calman: 2.7 | ∀{0.5-29.43 Ø4.73}
ΔE Greyscale Calman: 4.2 | ∀{0.09-98 Ø4.97}
Gamma: 2.23
CCT: 7287 K
| Xiaomi Mi Mix IPS, 2040x1080, 6.4" | Huawei Mate 9 IPS, 1920x1080, 5.9" | Samsung Galaxy S7 Edge Super AMOLED, 2560x1440, 5.5" | Google Pixel XL 2016 AMOLED, 2560x1440, 5.5" | OnePlus 3T Optic-AMOLED, 1920x1080, 5.5" | Microsoft Lumia 950 XL AMOLED, 2560x1440, 5.7" | Apple iPhone 7 Plus IPS, 1920x1080, 5.5" | |
|---|---|---|---|---|---|---|---|
| Screen | |||||||
| Brightness middle (cd/m²) | 577 | 696 21% | 554 -4% | 402 -30% | 421 -27% | 297 -49% | 557 -3% |
| Brightness (cd/m²) | 576 | 680 18% | 552 -4% | 408 -29% | 430 -25% | 297 -48% | 553 -4% |
| Brightness Distribution (%) | 89 | 93 4% | 96 8% | 85 -4% | 84 -6% | 93 4% | 97 9% |
| Black Level * (cd/m²) | 0.42 | 0.42 -0% | 0.35 17% | ||||
| Contrast (:1) | 1374 | 1657 21% | 1591 16% | ||||
| Colorchecker dE 2000 * | 2.7 | 4.3 -59% | 1.59 41% | 4 -48% | 7.1 -163% | 2.67 1% | 1.4 48% |
| Colorchecker dE 2000 max. * | 6.9 | 9.4 -36% | 2.56 63% | 10.1 -46% | 15.3 -122% | 3.98 42% | 3.1 55% |
| Greyscale dE 2000 * | 4.2 | 4.8 -14% | 2.01 52% | 3.2 24% | 6.8 -62% | 2.81 33% | 1.3 69% |
| Gamma | 2.23 99% | 2.33 94% | 2.01 109% | 2.19 100% | 2.23 99% | 2.08 106% | 2.21 100% |
| CCT | 7287 89% | 7255 90% | 6321 103% | 7037 92% | 7866 83% | 6379 102% | 6667 97% |
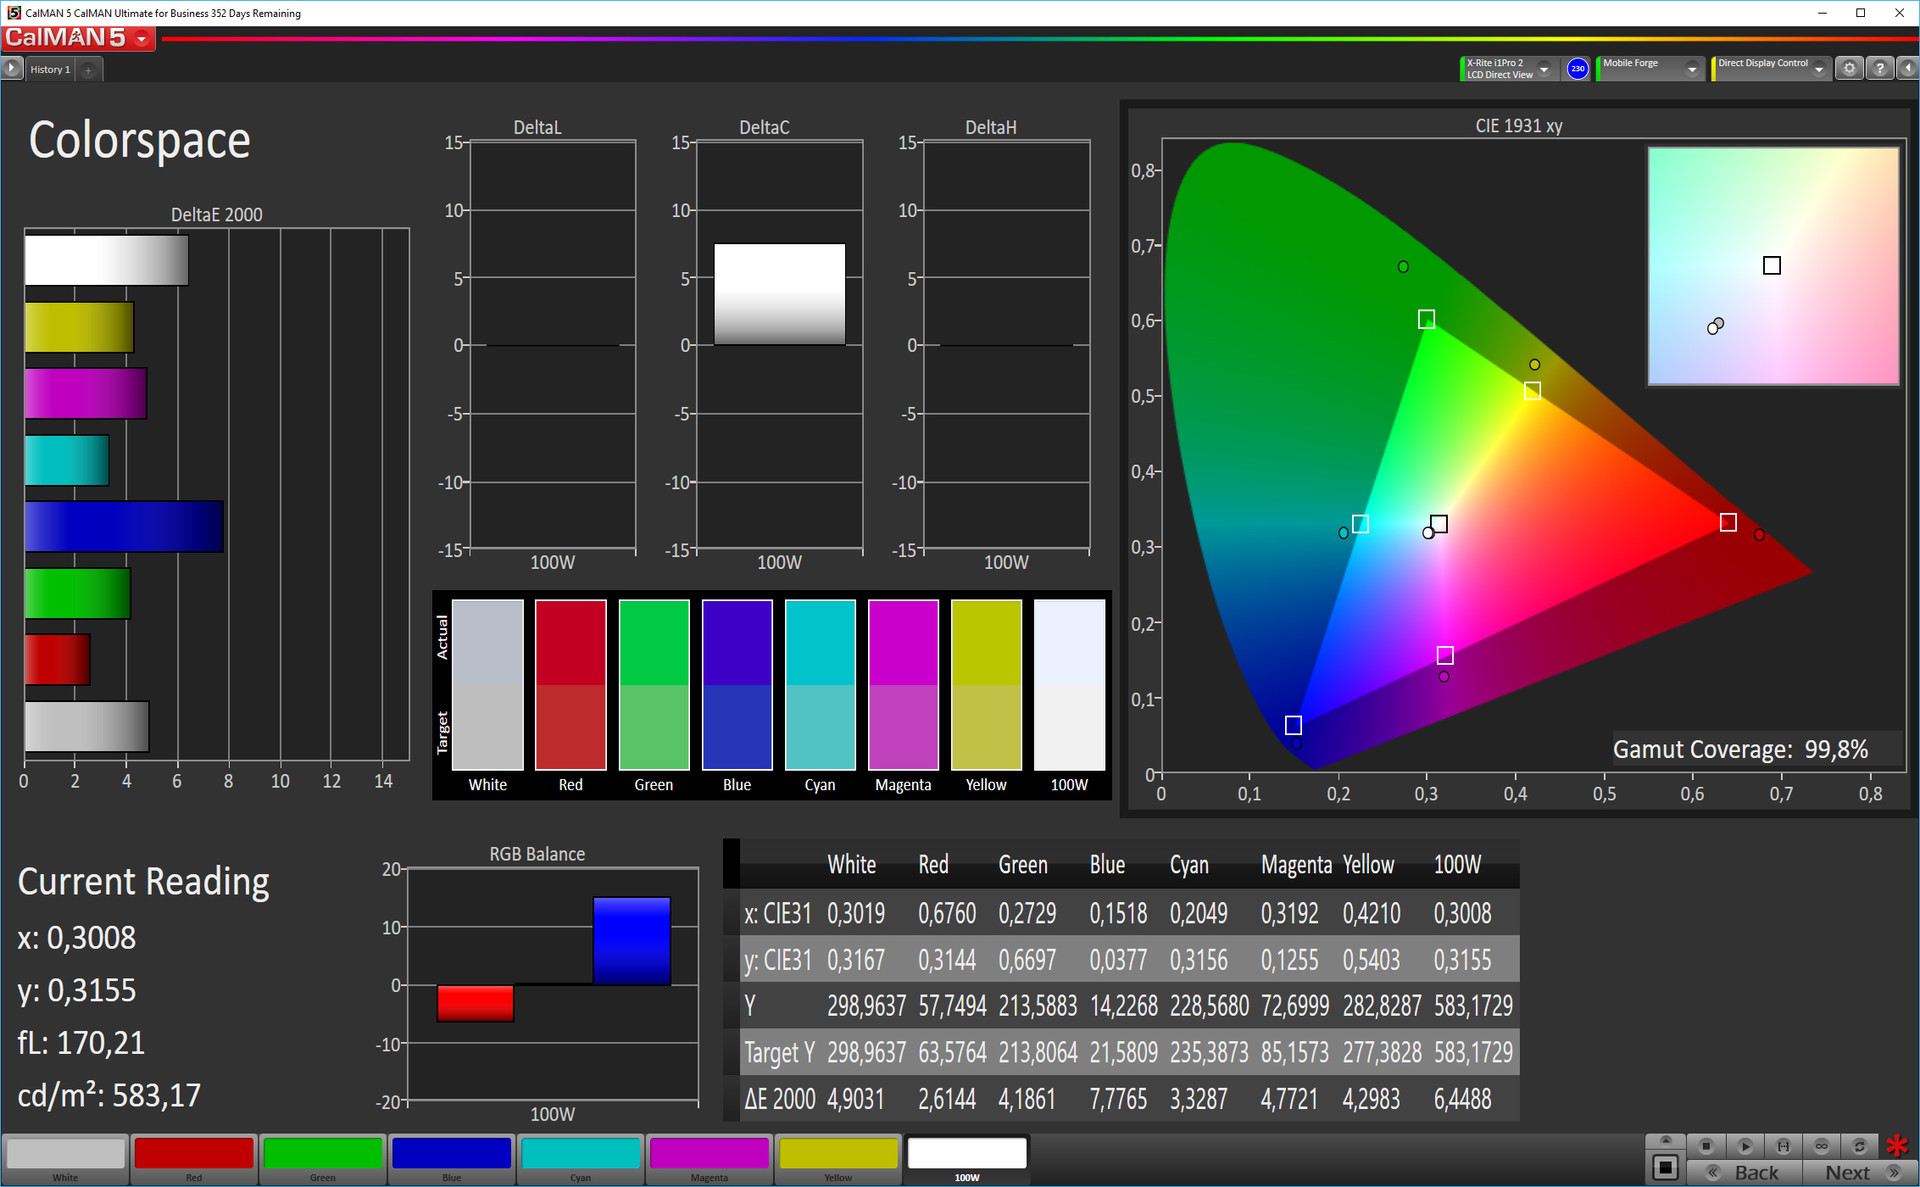
| Color Space (Percent of AdobeRGB 1998) (%) | 82.12 | 66.31 | 63.1 | ||||
| Color Space (Percent of sRGB) (%) | 99.98 | 99.79 | 99.83 |
* ... smaller is better
Screen Flickering / PWM (Pulse-Width Modulation)
| Screen flickering / PWM detected | 1136 Hz | ≤ 10 % brightness setting | 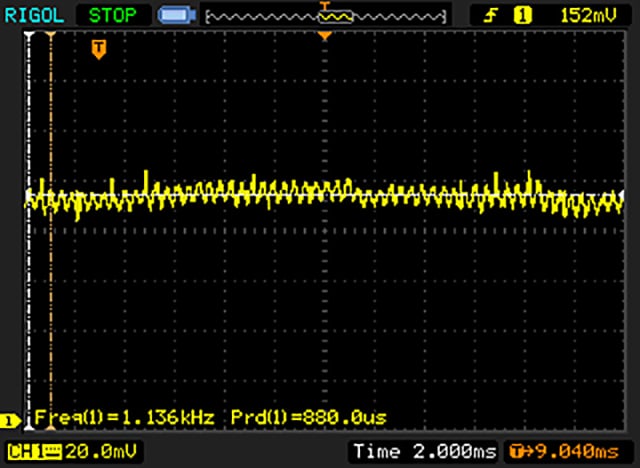 |
The display backlight flickers at 1136 Hz (worst case, e.g., utilizing PWM) Flickering detected at a brightness setting of 10 % and below. There should be no flickering or PWM above this brightness setting. The frequency of 1136 Hz is quite high, so most users sensitive to PWM should not notice any flickering. In comparison: 52 % of all tested devices do not use PWM to dim the display. If PWM was detected, an average of 7801 (minimum: 5 - maximum: 343500) Hz was measured. | |||
Display Response Times
| ↔ Response Time Black to White | ||
|---|---|---|
| 37.2 ms ... rise ↗ and fall ↘ combined | ↗ 10.4 ms rise | 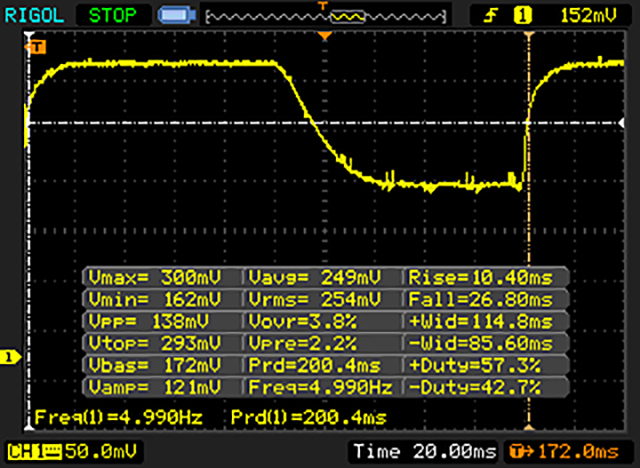 |
| ↘ 26.8 ms fall | ||
| The screen shows slow response rates in our tests and will be unsatisfactory for gamers. In comparison, all tested devices range from 0.1 (minimum) to 240 (maximum) ms. » 95 % of all devices are better. This means that the measured response time is worse than the average of all tested devices (19.9 ms). | ||
| ↔ Response Time 50% Grey to 80% Grey | ||
| 36 ms ... rise ↗ and fall ↘ combined | ↗ 14.8 ms rise | 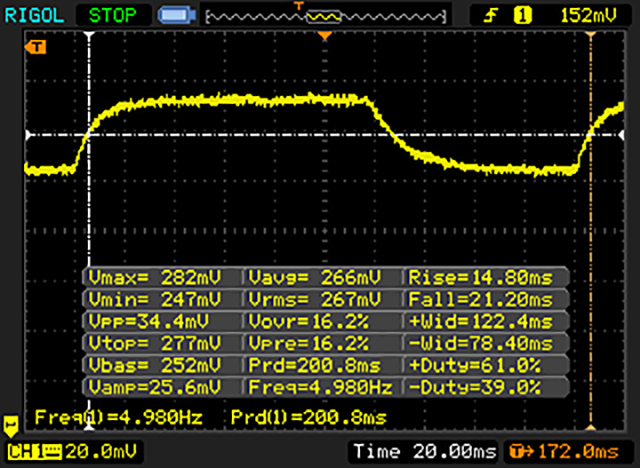 |
| ↘ 21.2 ms fall | ||
| The screen shows slow response rates in our tests and will be unsatisfactory for gamers. In comparison, all tested devices range from 0.165 (minimum) to 636 (maximum) ms. » 50 % of all devices are better. This means that the measured response time is worse than the average of all tested devices (31.1 ms). | ||

| AnTuTu v6 - Total Score (sort by value) | |
| Xiaomi Mi Mix | |
| Huawei Mate 9 | |
| Samsung Galaxy S7 Edge | |
| Google Pixel XL 2016 | |
| OnePlus 3T | |
| Microsoft Lumia 950 XL | |
| Apple iPhone 7 Plus | |
| Geekbench 4.0 | |
| 64 Bit Multi-Core Score (sort by value) | |
| Xiaomi Mi Mix | |
| Huawei Mate 9 | |
| Samsung Galaxy S7 Edge | |
| Google Pixel XL 2016 | |
| OnePlus 3T | |
| Apple iPhone 7 Plus | |
| 64 Bit Single-Core Score (sort by value) | |
| Xiaomi Mi Mix | |
| Huawei Mate 9 | |
| Samsung Galaxy S7 Edge | |
| Google Pixel XL 2016 | |
| OnePlus 3T | |
| Apple iPhone 7 Plus | |
| Compute RenderScript Score (sort by value) | |
| Xiaomi Mi Mix | |
| Huawei Mate 9 | |
| Samsung Galaxy S7 Edge | |
| Google Pixel XL 2016 | |
| PCMark for Android - Work performance score (sort by value) | |
| Xiaomi Mi Mix | |
| Huawei Mate 9 | |
| Samsung Galaxy S7 Edge | |
| Google Pixel XL 2016 | |
| OnePlus 3T | |
| GFXBench (DX / GLBenchmark) 2.7 | |
| T-Rex Onscreen (sort by value) | |
| Xiaomi Mi Mix | |
| Huawei Mate 9 | |
| Samsung Galaxy S7 Edge | |
| Google Pixel XL 2016 | |
| OnePlus 3T | |
| Microsoft Lumia 950 XL | |
| Apple iPhone 7 Plus | |
| 1920x1080 T-Rex Offscreen (sort by value) | |
| Xiaomi Mi Mix | |
| Huawei Mate 9 | |
| Samsung Galaxy S7 Edge | |
| Google Pixel XL 2016 | |
| OnePlus 3T | |
| Microsoft Lumia 950 XL | |
| Apple iPhone 7 Plus | |
| GFXBench 3.0 | |
| 1920x1080 1080p Manhattan Offscreen (sort by value) | |
| Xiaomi Mi Mix | |
| Huawei Mate 9 | |
| Samsung Galaxy S7 Edge | |
| Google Pixel XL 2016 | |
| OnePlus 3T | |
| Microsoft Lumia 950 XL | |
| Apple iPhone 7 Plus | |
| on screen Manhattan Onscreen OGL (sort by value) | |
| Xiaomi Mi Mix | |
| Huawei Mate 9 | |
| Samsung Galaxy S7 Edge | |
| Google Pixel XL 2016 | |
| OnePlus 3T | |
| Microsoft Lumia 950 XL | |
| Apple iPhone 7 Plus | |
| GFXBench 3.1 | |
| 1920x1080 Manhattan ES 3.1 Offscreen (sort by value) | |
| Xiaomi Mi Mix | |
| Huawei Mate 9 | |
| Samsung Galaxy S7 Edge | |
| Google Pixel XL 2016 | |
| OnePlus 3T | |
| Apple iPhone 7 Plus | |
| on screen Manhattan ES 3.1 Onscreen (sort by value) | |
| Xiaomi Mi Mix | |
| Huawei Mate 9 | |
| Samsung Galaxy S7 Edge | |
| Google Pixel XL 2016 | |
| OnePlus 3T | |
| Apple iPhone 7 Plus | |
| 3DMark | |
| 1280x720 offscreen Ice Storm Unlimited Score (sort by value) | |
| Xiaomi Mi Mix | |
| Huawei Mate 9 | |
| Samsung Galaxy S7 Edge | |
| Google Pixel XL 2016 | |
| OnePlus 3T | |
| Apple iPhone 7 Plus | |
| 1280x720 offscreen Ice Storm Unlimited Graphics Score (sort by value) | |
| Xiaomi Mi Mix | |
| Huawei Mate 9 | |
| Samsung Galaxy S7 Edge | |
| Google Pixel XL 2016 | |
| OnePlus 3T | |
| Apple iPhone 7 Plus | |
| 1280x720 offscreen Ice Storm Unlimited Physics (sort by value) | |
| Xiaomi Mi Mix | |
| Huawei Mate 9 | |
| Samsung Galaxy S7 Edge | |
| Google Pixel XL 2016 | |
| OnePlus 3T | |
| Apple iPhone 7 Plus | |
| 2560x1440 Sling Shot OpenGL ES 3.0 Physics (sort by value) | |
| Xiaomi Mi Mix | |
| Huawei Mate 9 | |
| Samsung Galaxy S7 Edge | |
| Google Pixel XL 2016 | |
| OnePlus 3T | |
| Apple iPhone 7 Plus | |
| 2560x1440 Sling Shot OpenGL ES 3.0 Graphics (sort by value) | |
| Xiaomi Mi Mix | |
| Huawei Mate 9 | |
| Samsung Galaxy S7 Edge | |
| Google Pixel XL 2016 | |
| OnePlus 3T | |
| Apple iPhone 7 Plus | |
| 2560x1440 Sling Shot OpenGL ES 3.0 (sort by value) | |
| Xiaomi Mi Mix | |
| Huawei Mate 9 | |
| Samsung Galaxy S7 Edge | |
| Google Pixel XL 2016 | |
| OnePlus 3T | |
| Apple iPhone 7 Plus | |
| Mozilla Kraken 1.1 - Total (sort by value) | |
| Xiaomi Mi Mix | |
| Huawei Mate 9 | |
| Samsung Galaxy S7 Edge | |
| Google Pixel XL 2016 | |
| OnePlus 3T | |
| Microsoft Lumia 950 XL | |
| Apple iPhone 7 Plus | |
| Octane V2 - Total Score (sort by value) | |
| Xiaomi Mi Mix | |
| Huawei Mate 9 | |
| Samsung Galaxy S7 Edge | |
| Google Pixel XL 2016 | |
| OnePlus 3T | |
| Microsoft Lumia 950 XL | |
| Apple iPhone 7 Plus | |
| WebXPRT 2015 - Overall (sort by value) | |
| Xiaomi Mi Mix | |
| Huawei Mate 9 | |
| Samsung Galaxy S7 Edge | |
| Google Pixel XL 2016 | |
| OnePlus 3T | |
| Microsoft Lumia 950 XL | |
| Apple iPhone 7 Plus | |
| JetStream 1.1 - 1.1 Total (sort by value) | |
| Xiaomi Mi Mix | |
| Huawei Mate 9 | |
| Samsung Galaxy S7 Edge | |
| Google Pixel XL 2016 | |
| OnePlus 3T | |
| Microsoft Lumia 950 XL | |
| Apple iPhone 7 Plus | |
* ... smaller is better
| Xiaomi Mi Mix | Huawei Mate 9 | Samsung Galaxy S7 Edge | Google Pixel XL 2016 | OnePlus 3T | Microsoft Lumia 950 XL | Apple iPhone 7 Plus | |
|---|---|---|---|---|---|---|---|
| AndroBench 3-5 | |||||||
| Random Read 4KB (MB/s) | 116.6 | 94.7 -19% | 86.7 -26% | 87.7 -25% | 123.6 6% | ||
| Random Write 4KB (MB/s) | 15.15 | 8.77 -42% | 15.79 4% | 14.56 -4% | 74.4 391% | ||
| Sequential Write 256KB (MB/s) | 161.3 | 142.9 -11% | 145.1 -10% | 83.4 -48% | 165.3 2% | ||
| Sequential Read 256KB (MB/s) | 409.9 | 594 45% | 487.3 19% | 258.2 -37% | 436.4 6% | ||
| Sequential Write 256KB SDCard (MB/s) | 29.53 | 50.4 | |||||
| Sequential Read 256KB SDCard (MB/s) | 54 | 76.4 | |||||
| BaseMark OS II | |||||||
| Memory (Points) | 1747 | 3850 120% | 2072 19% | 1677 -4% | 1954 12% | 1945 11% | 1319 -24% |
| Asphalt 8: Airborne | |||
| Settings | Value | ||
| high | 29 fps | ||
| very low | 29 fps | ||
| Real Racing 3 | |||
| Settings | Value | ||
| high | 51 fps | ||
| low | 60 fps | ||
(±) The maximum temperature on the upper side is 40.2 °C / 104 F, compared to the average of 35.3 °C / 96 F, ranging from 21.9 to 247 °C for the class Smartphone.
(+) The bottom heats up to a maximum of 36.2 °C / 97 F, compared to the average of 34 °C / 93 F
(±) In idle usage, the average temperature for the upper side is 32 °C / 90 F, compared to the device average of 32.9 °C / 91 F.
Xiaomi Mi Mix audio analysis
(+) | speakers can play relatively loud (88.4 dB)
Bass 100 - 315 Hz
(-) | nearly no bass - on average 21.8% lower than median
(±) | linearity of bass is average (10.6% delta to prev. frequency)
Mids 400 - 2000 Hz
(+) | balanced mids - only 3.2% away from median
(+) | mids are linear (3.7% delta to prev. frequency)
Highs 2 - 16 kHz
(±) | higher highs - on average 7.5% higher than median
(+) | highs are linear (3.2% delta to prev. frequency)
Overall 100 - 16.000 Hz
(±) | linearity of overall sound is average (18.9% difference to median)
Compared to same class
» 23% of all tested devices in this class were better, 10% similar, 67% worse
» The best had a delta of 11%, average was 34%, worst was 134%
Compared to all devices tested
» 44% of all tested devices were better, 8% similar, 48% worse
» The best had a delta of 4%, average was 24%, worst was 134%
Huawei Mate 9 audio analysis
(+) | speakers can play relatively loud (83.9 dB)
Bass 100 - 315 Hz
(-) | nearly no bass - on average 24.1% lower than median
(±) | linearity of bass is average (11.1% delta to prev. frequency)
Mids 400 - 2000 Hz
(+) | balanced mids - only 3.2% away from median
(±) | linearity of mids is average (8.6% delta to prev. frequency)
Highs 2 - 16 kHz
(±) | higher highs - on average 10.4% higher than median
(+) | highs are linear (3.8% delta to prev. frequency)
Overall 100 - 16.000 Hz
(±) | linearity of overall sound is average (25.2% difference to median)
Compared to same class
» 63% of all tested devices in this class were better, 6% similar, 31% worse
» The best had a delta of 11%, average was 34%, worst was 134%
Compared to all devices tested
» 77% of all tested devices were better, 5% similar, 18% worse
» The best had a delta of 4%, average was 24%, worst was 134%
| Off / Standby | |
| Idle | |
| Load |
|
Key:
min: | |
| Xiaomi Mi Mix 4400 mAh | Huawei Mate 9 4000 mAh | Samsung Galaxy S7 Edge 3600 mAh | Google Pixel XL 2016 3450 mAh | OnePlus 3T 3400 mAh | Microsoft Lumia 950 XL 3340 mAh | Apple iPhone 7 Plus 2915 mAh | |
|---|---|---|---|---|---|---|---|
| Power Consumption | 18% | 37% | 45% | 21% | -57% | 19% | |
| Idle Minimum * (Watt) | 0.87 | 0.78 10% | 0.63 28% | 0.53 39% | 0.61 30% | 2.85 -228% | 0.77 11% |
| Idle Average * (Watt) | 2.16 | 2.13 1% | 1.1 49% | 1.07 50% | 1.77 18% | 2.95 -37% | 2.04 6% |
| Idle Maximum * (Watt) | 2.28 | 2.17 5% | 1.56 32% | 1.12 51% | 1.81 21% | 3.26 -43% | 2.24 2% |
| Load Average * (Watt) | 9.21 | 6.32 31% | 5.95 35% | 5.53 40% | 6.67 28% | 8.92 3% | 4.69 49% |
| Load Maximum * (Watt) | 11.76 | 6.49 45% | 6.7 43% | 6.26 47% | 10.98 7% | 9.39 20% | 8.66 26% |
* ... smaller is better
| Xiaomi Mi Mix 4400 mAh | Huawei Mate 9 4000 mAh | Samsung Galaxy S7 Edge 3600 mAh | Google Pixel XL 2016 3450 mAh | OnePlus 3T 3400 mAh | Microsoft Lumia 950 XL 3340 mAh | Apple iPhone 7 Plus 2915 mAh | |
|---|---|---|---|---|---|---|---|
| Battery runtime | -6% | 8% | -29% | -16% | -40% | -11% | |
| Reader / Idle (h) | 30 | 25.6 -15% | 27.7 -8% | 22.2 -26% | 23.7 -21% | 18 -40% | 30.6 2% |
| H.264 (h) | 16.1 | 15.8 -2% | 15.2 -6% | 8.4 -48% | 13.5 -16% | 10.2 -37% | 13.6 -16% |
| WiFi v1.3 (h) | 10.7 | 12.6 18% | 12.2 14% | 8.4 -21% | 8.2 -23% | 6.2 -42% | 9.8 -8% |
| Load (h) | 4.9 | 3.7 -24% | 6.5 33% | 3.8 -22% | 4.7 -4% | 3 -39% | 3.8 -22% |
Pros
Cons
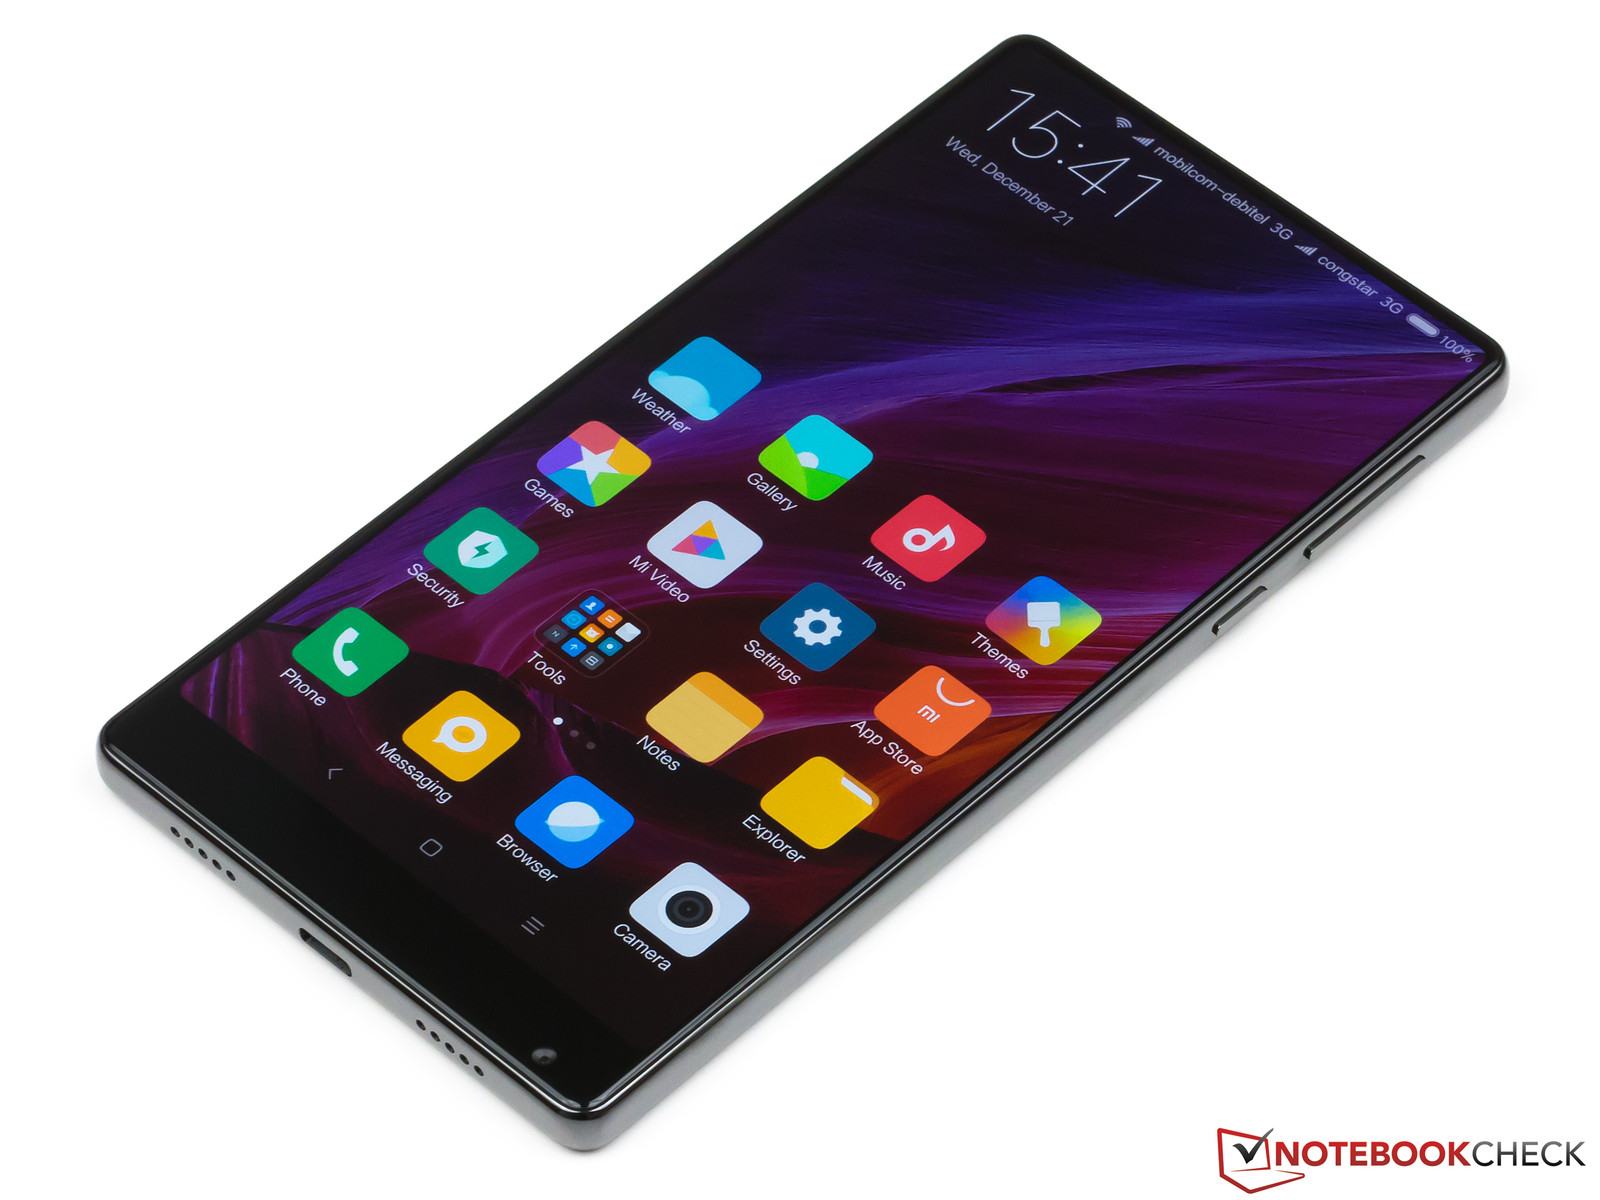
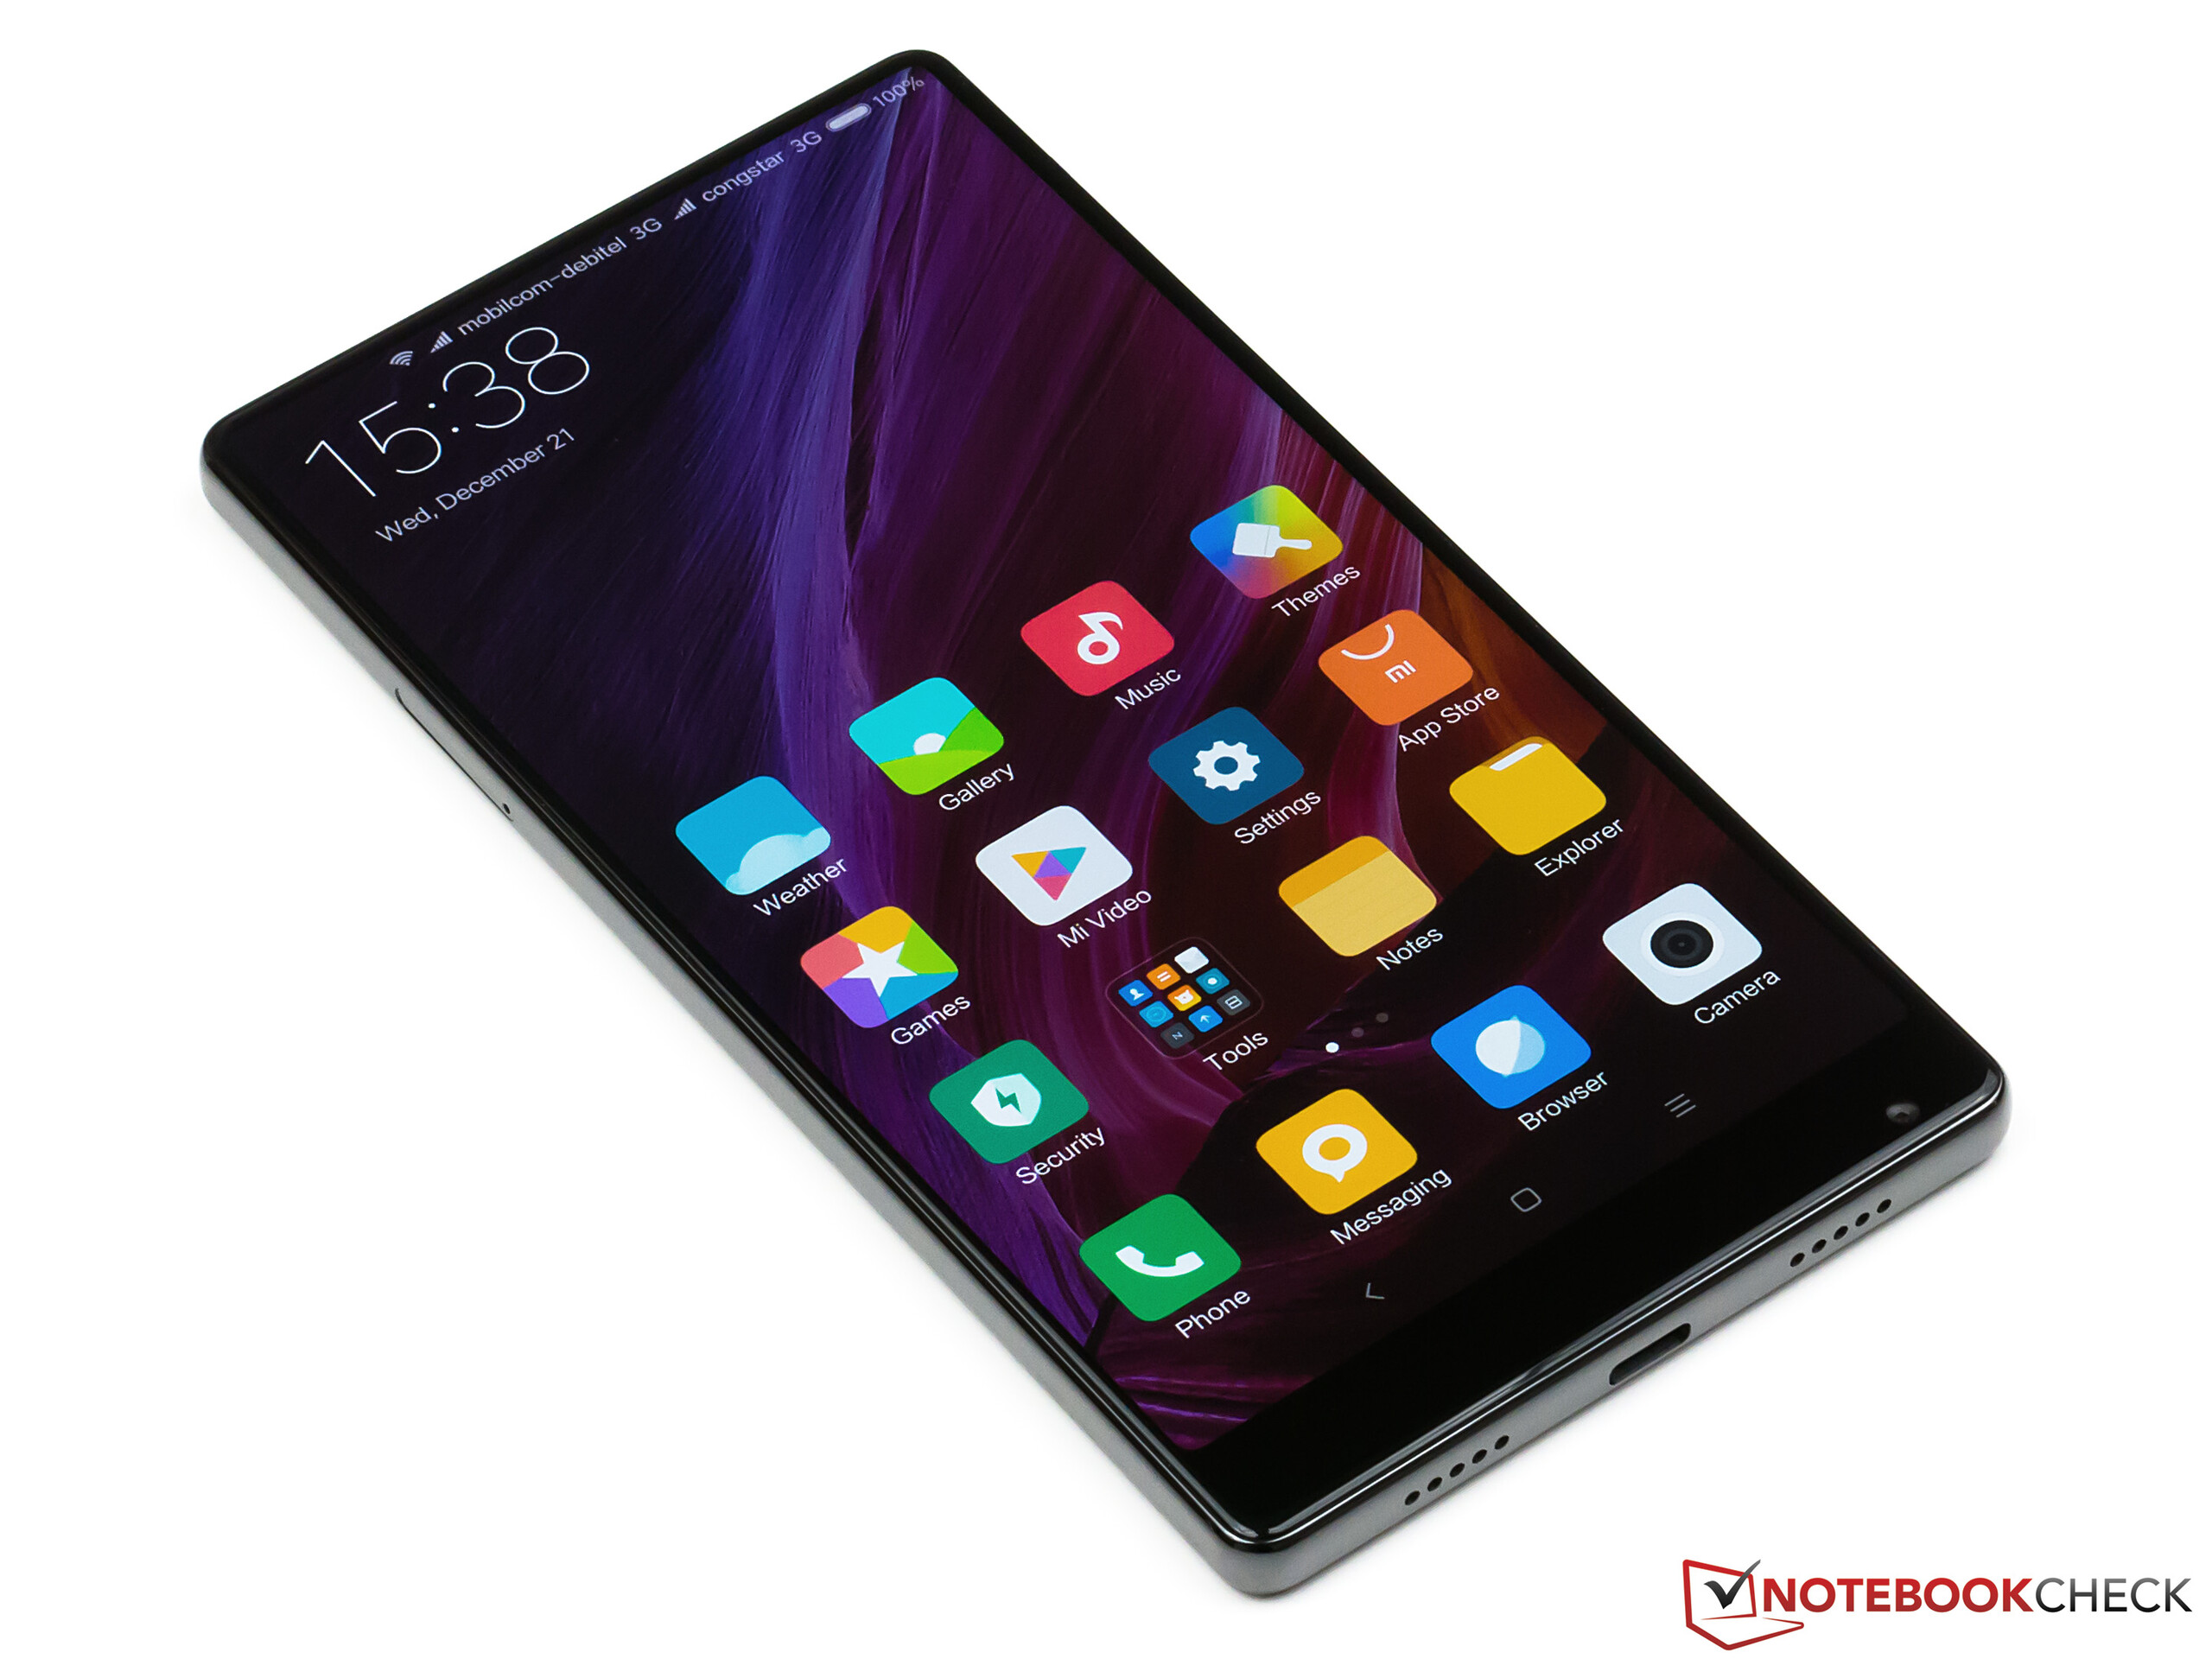
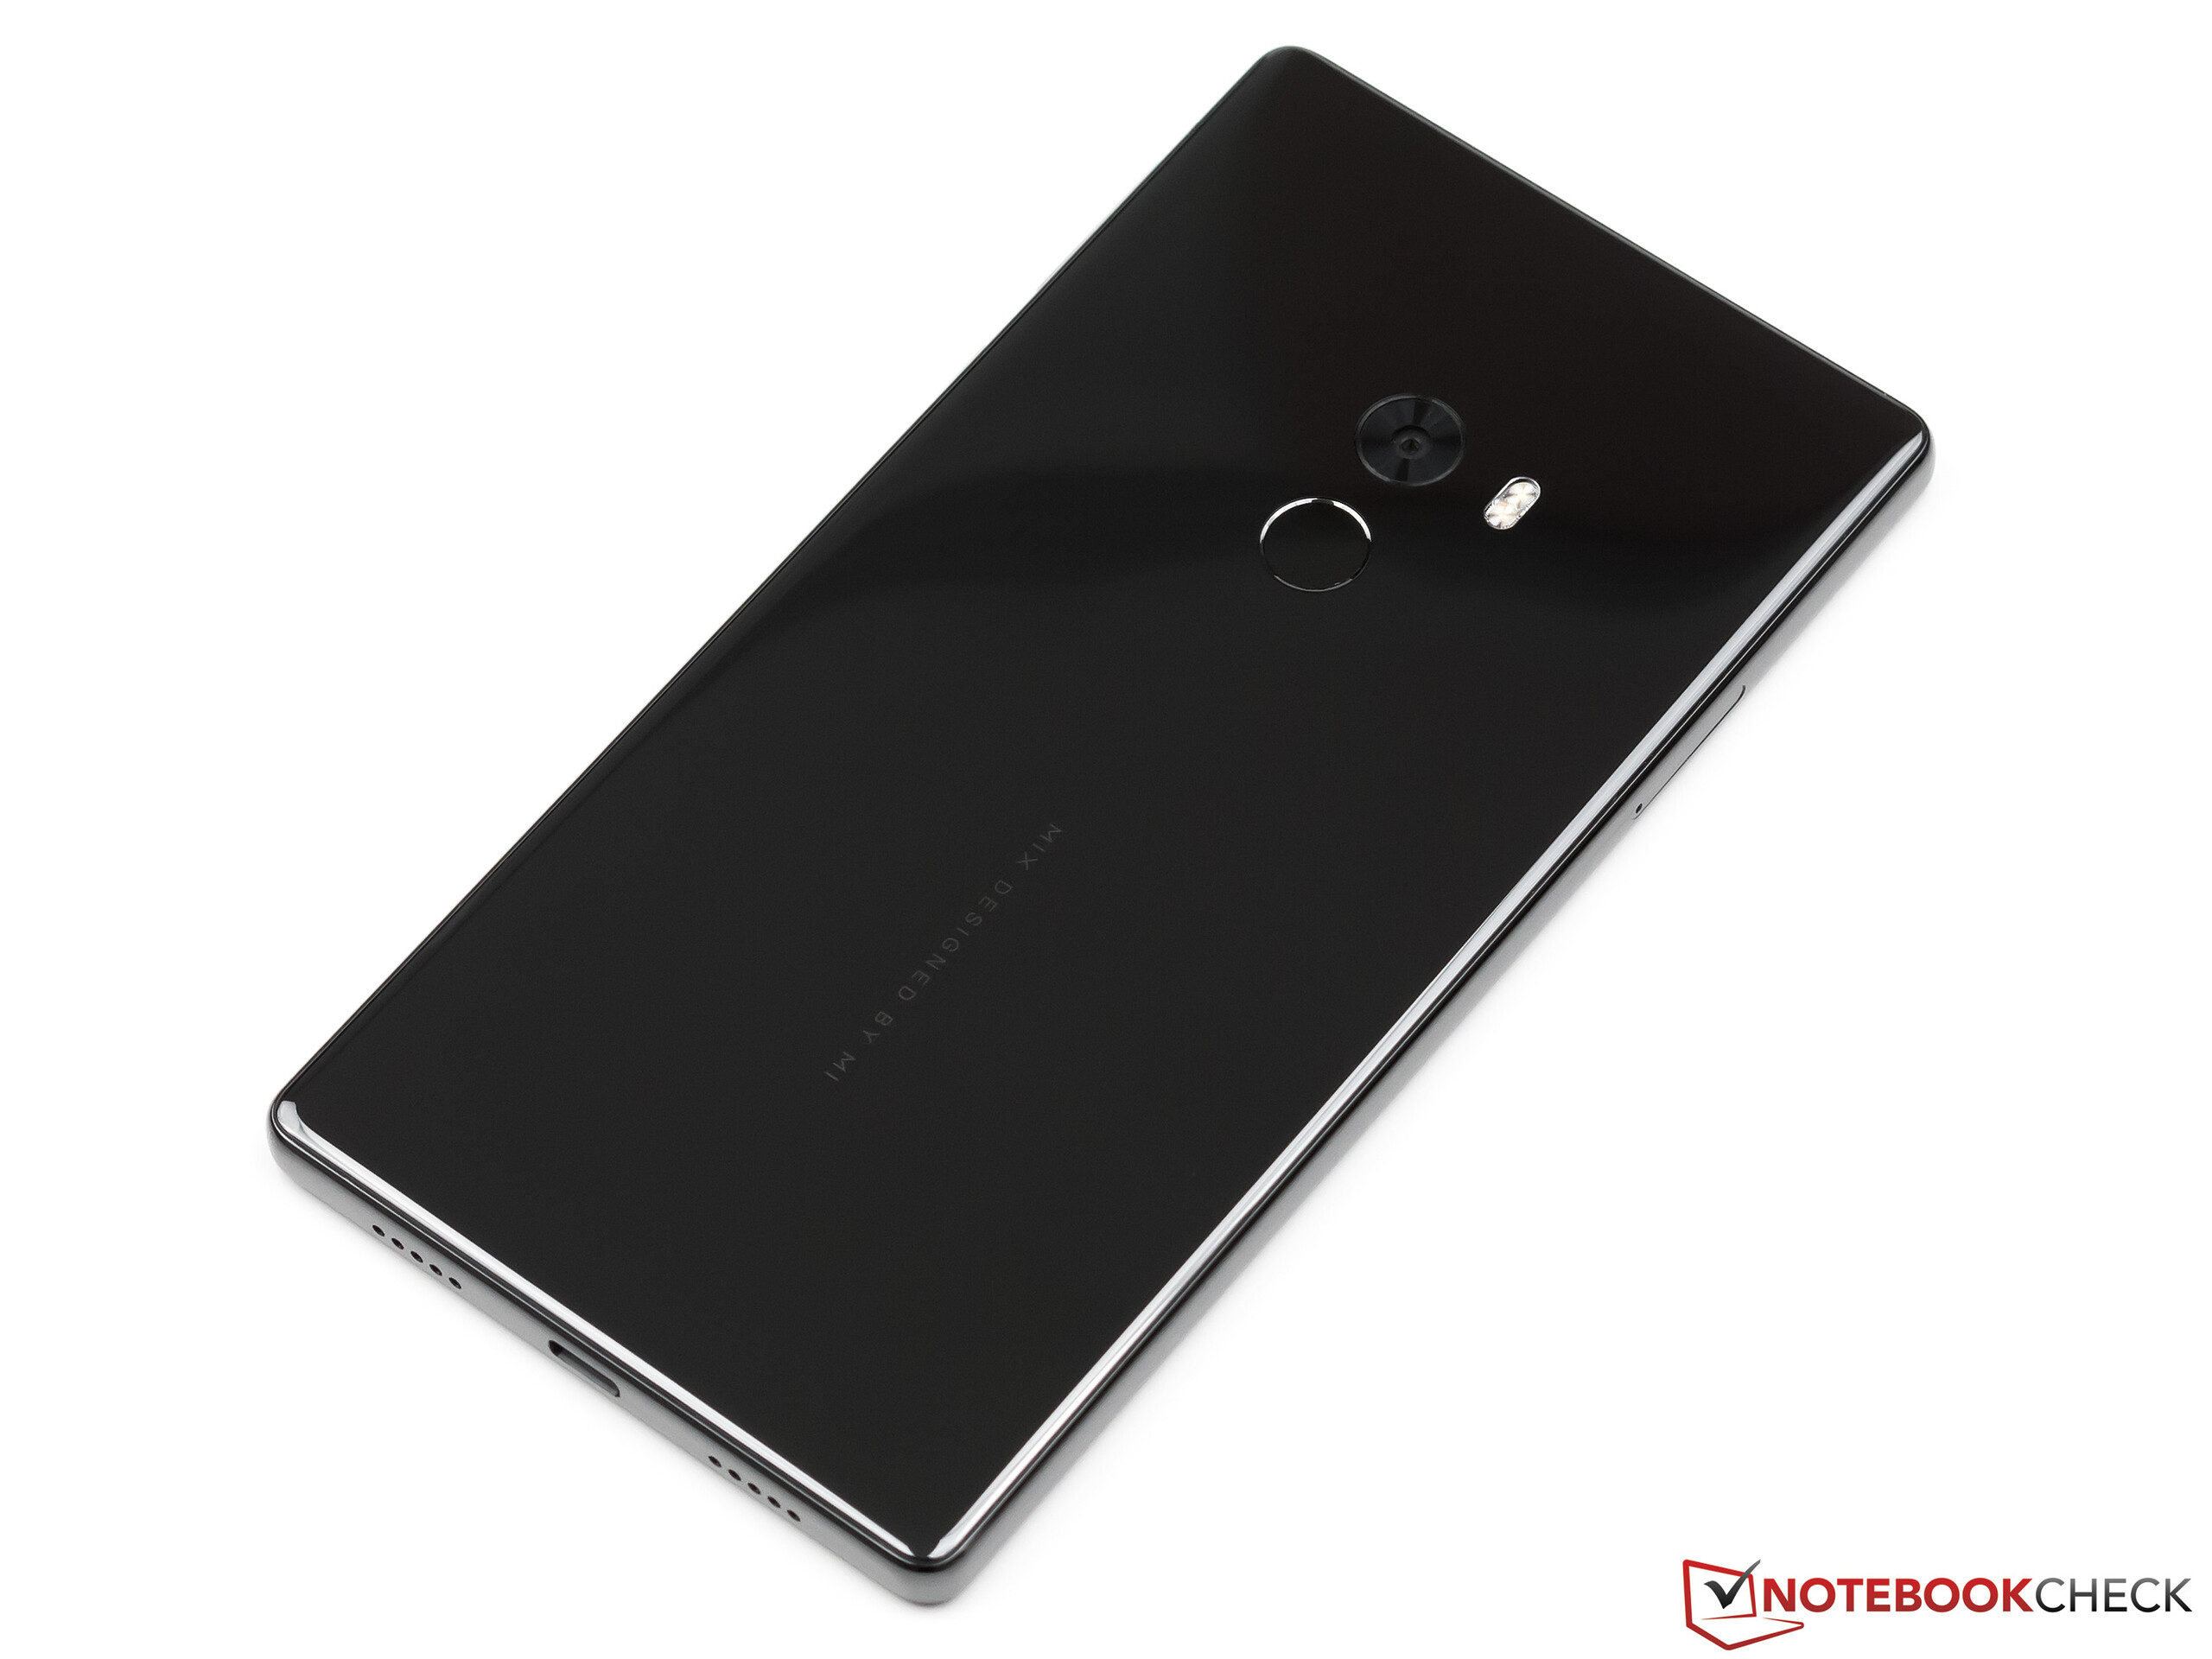
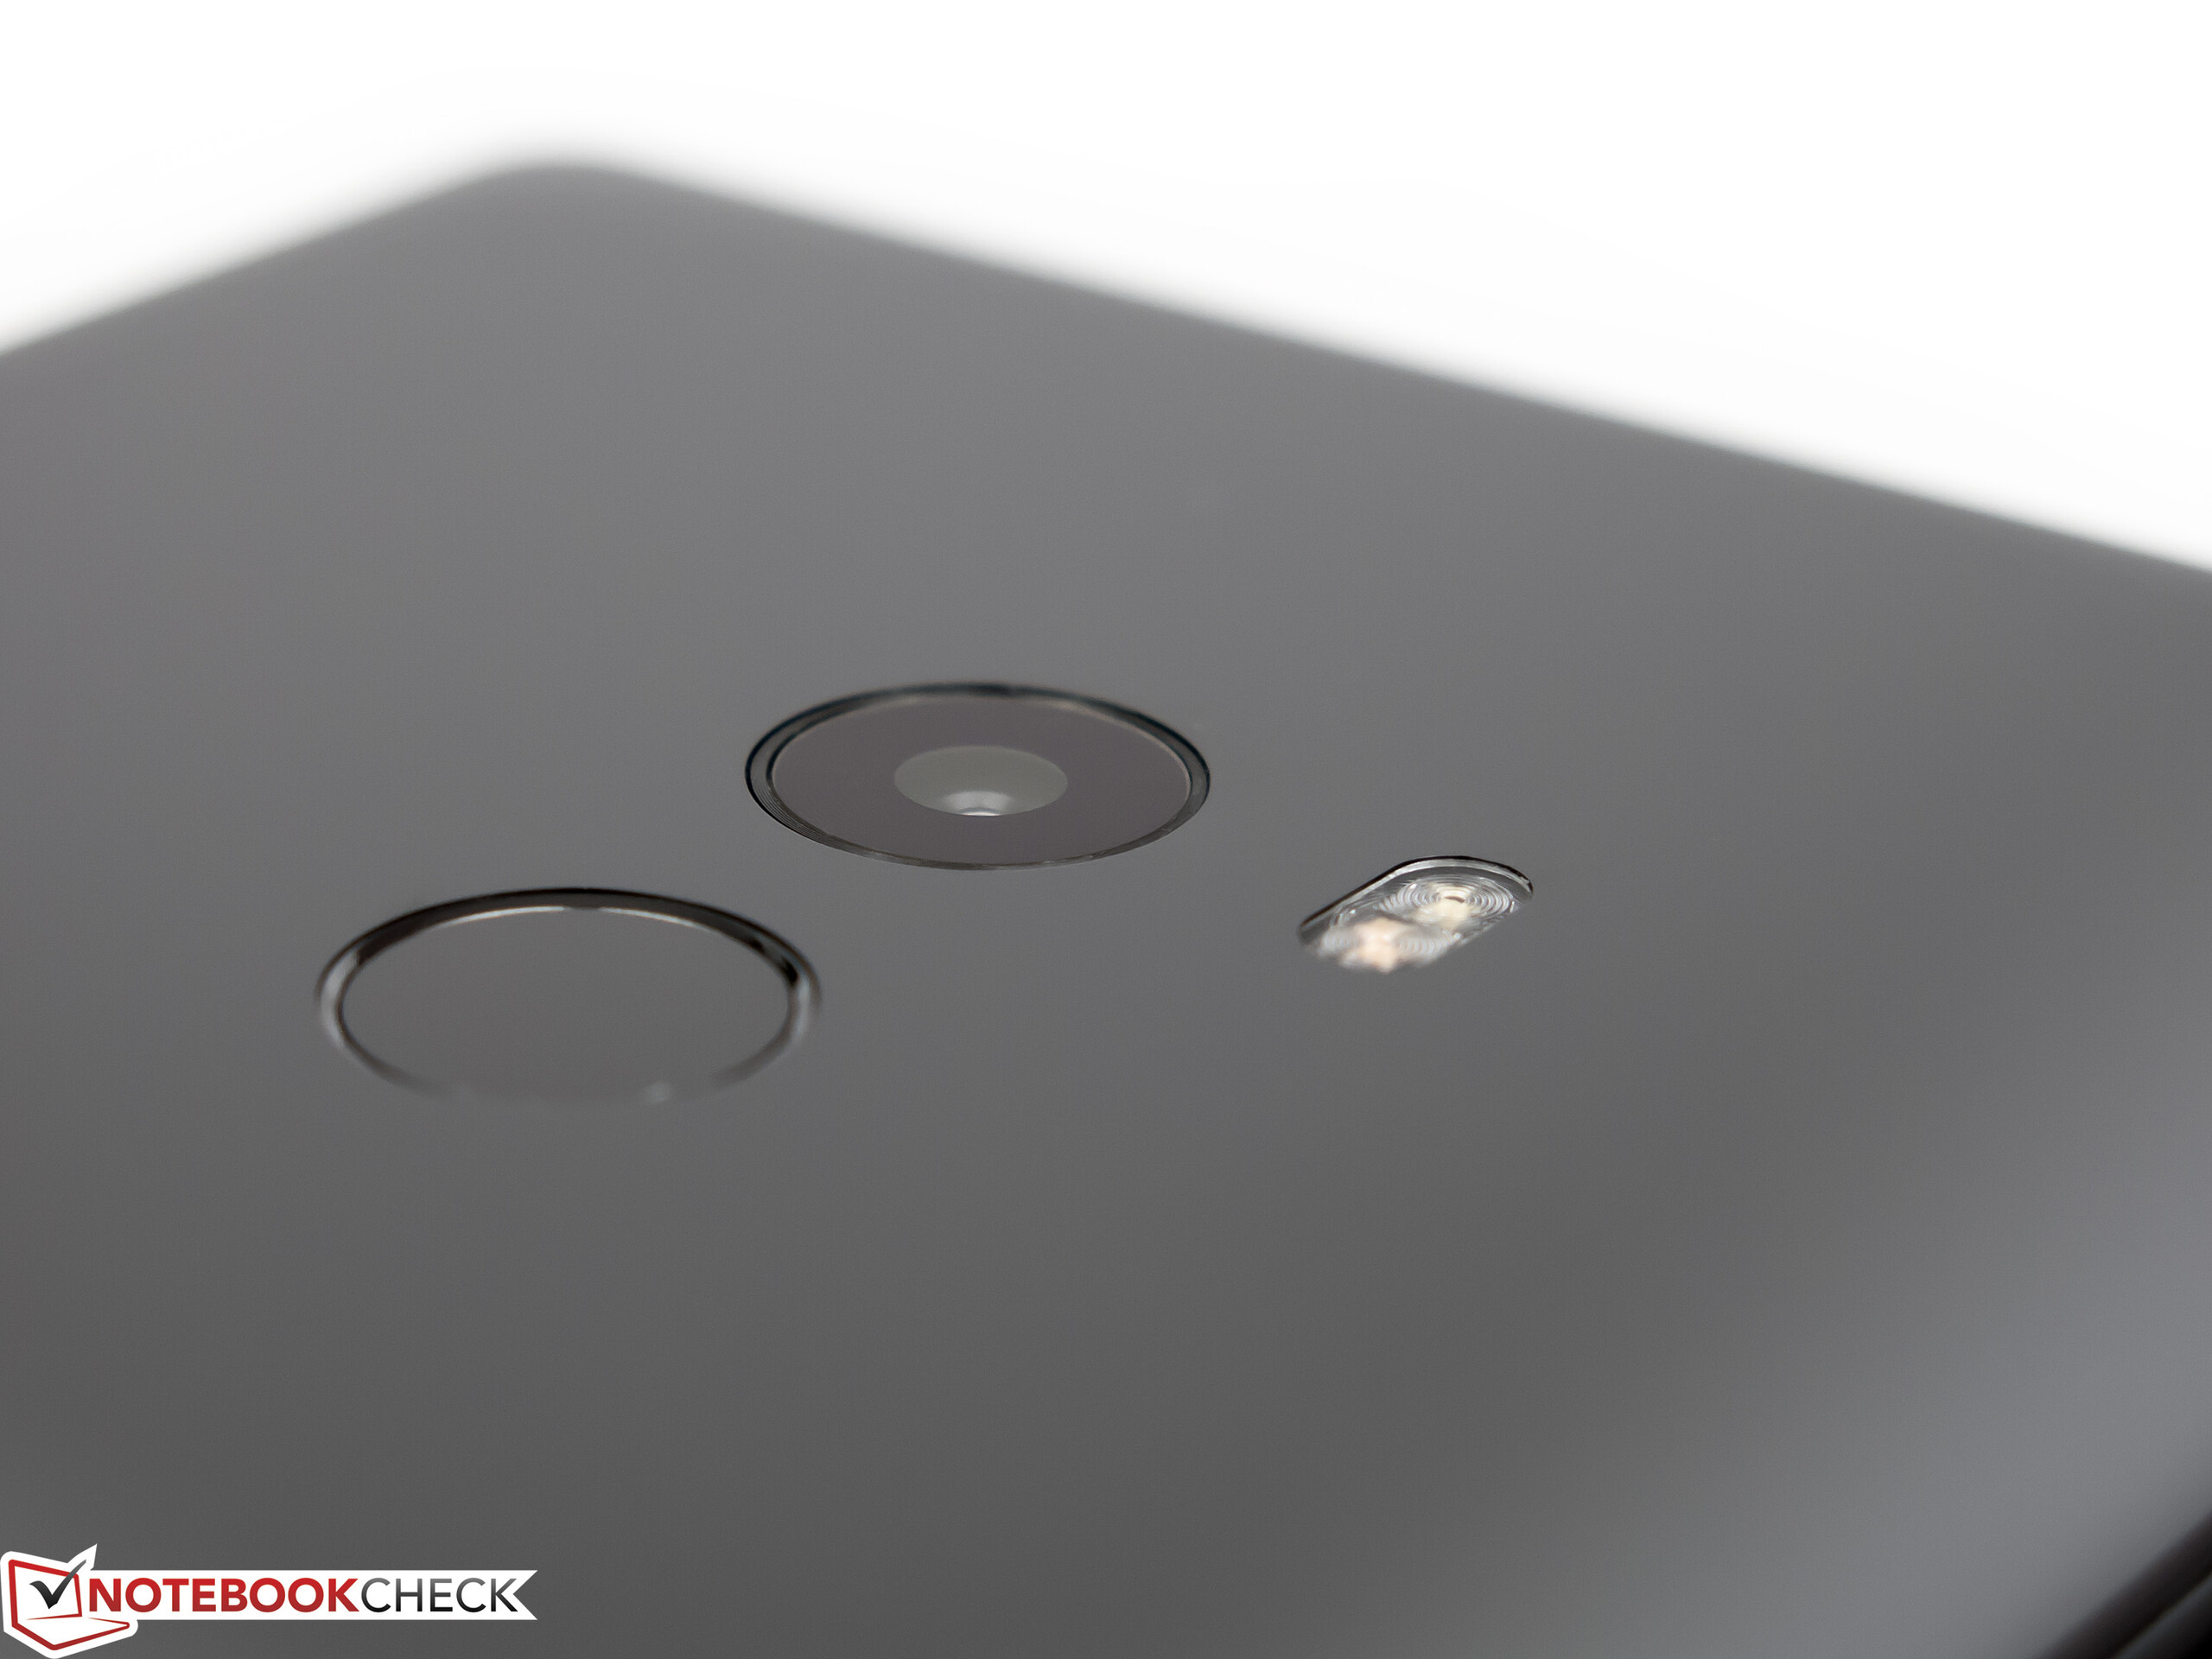
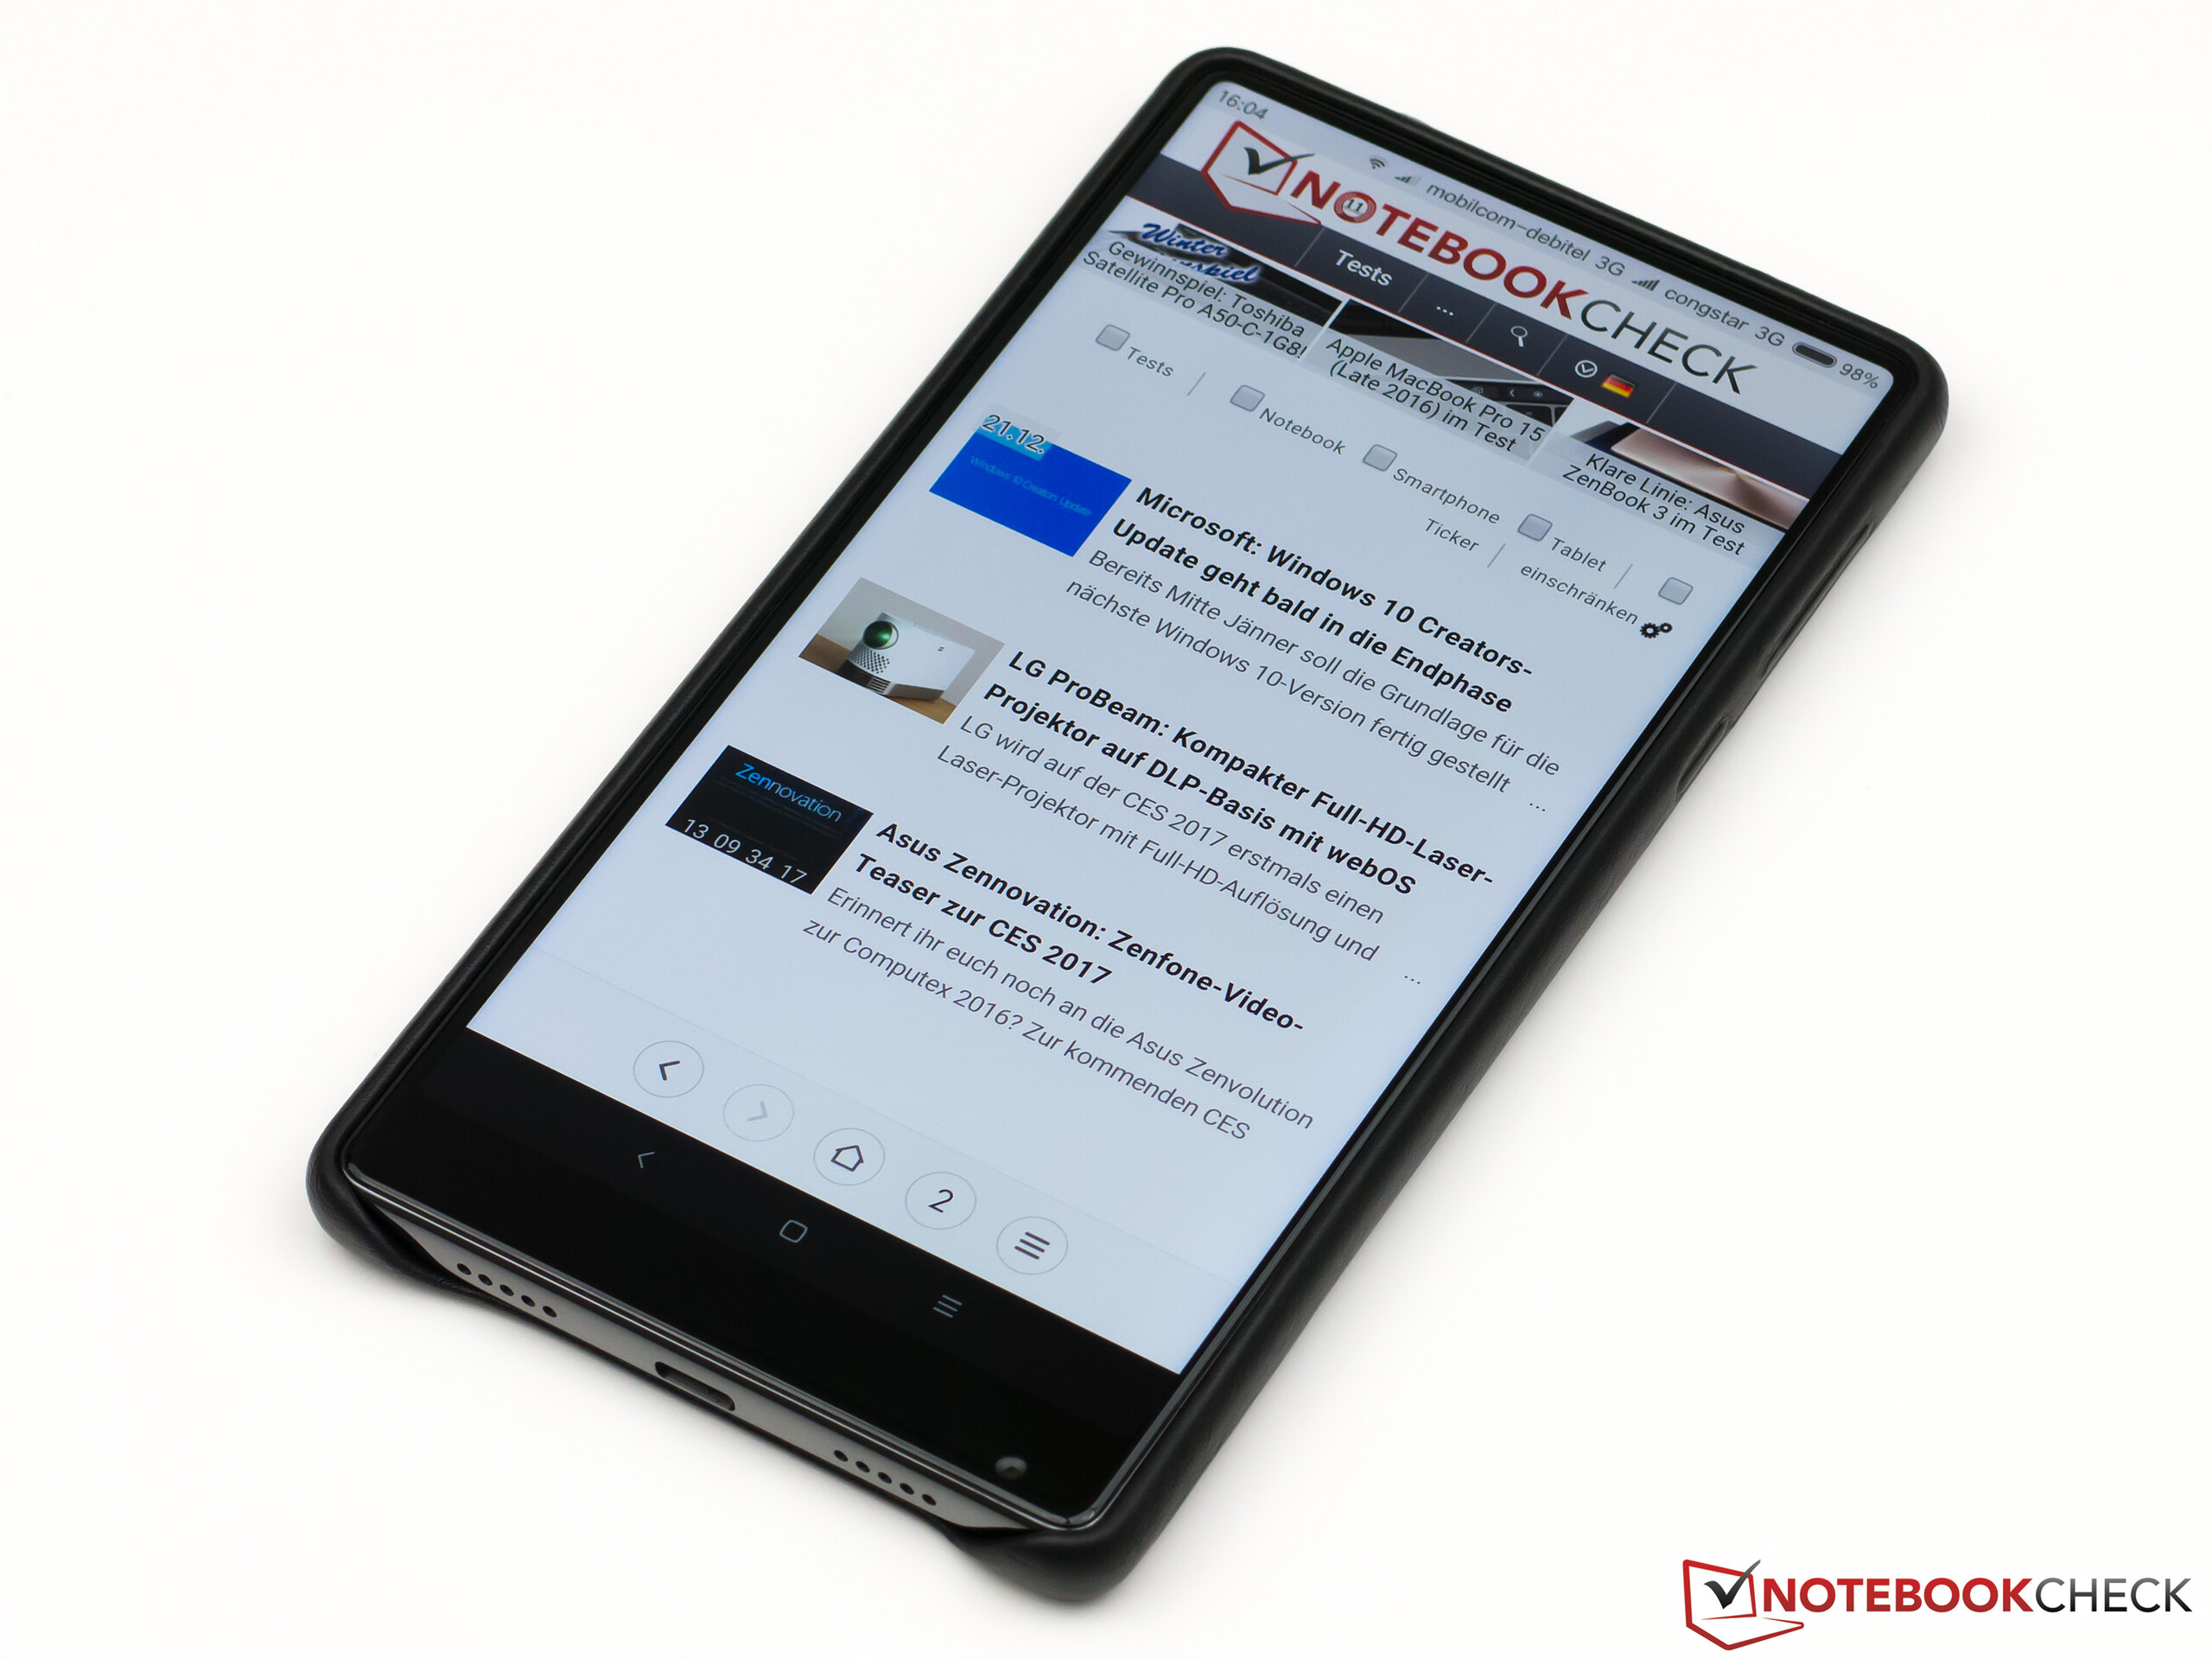
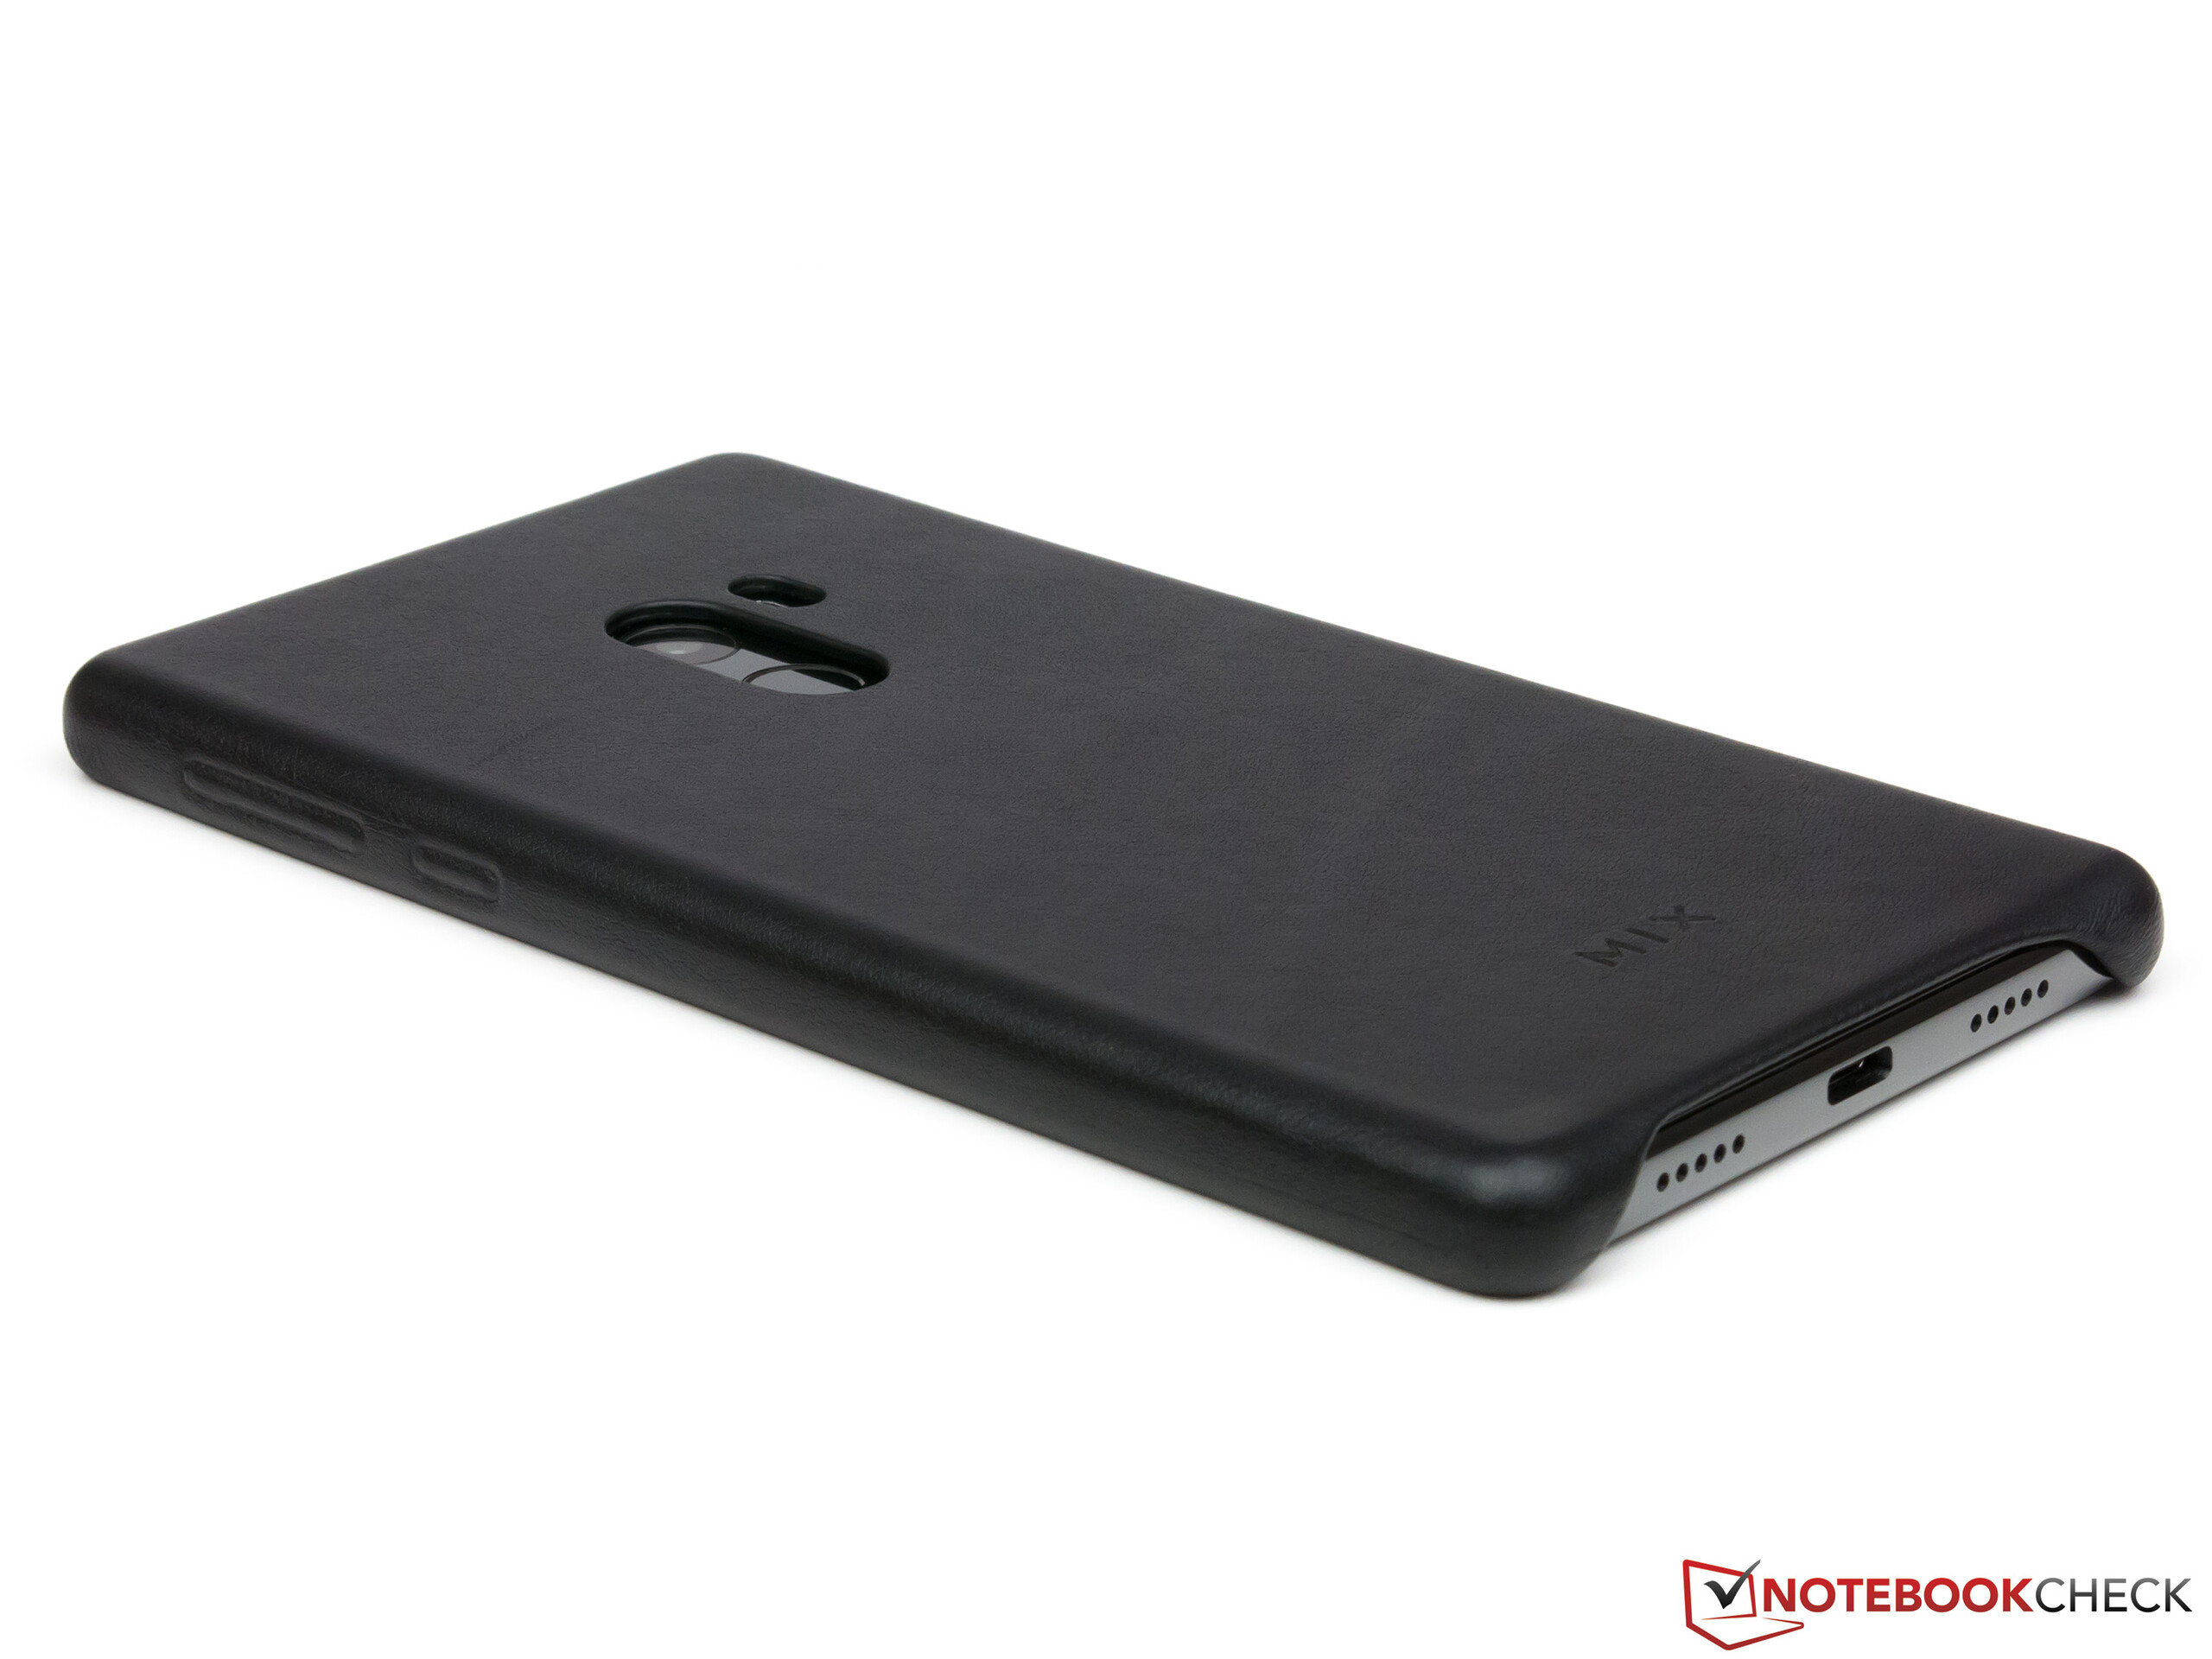
小米Mix的闪光点绝对是它不寻常的6.4英寸IPS屏幕,几乎无边框的设计使屏幕与陶瓷机身完美融合。不仅仅它那巨大的屏幕尺寸令人印象深刻,它的分辨率,亮度,对比度能适应所有的使用环境。诸如显示圆角之类的设计细节带给屏幕些许未来感。这台手机也有着最新的硬件配置。配以高通旗舰芯片,4GB的运行内存以及128GB的UFS2.0存储,这台设备能够流畅地运行,且在启动程序时不需要冗长的等待时间。由于完善的NFC,USB OTG,无线投影和蓝牙4.2版本,在外部连接方面无可挑剔。同时,可靠的指纹识别装置,附赠的皮制外壳和双面USB type-C接口也使得日常使用更加方便。没有光学防抖组件的相机和缺少对欧洲常用的LTE band 20的支持实在是太可惜了。
欧洲的用户不得不在软件上做出一些妥协。小米专有的用户界面有着很多实用的附加功能,但并不提供德语语言包,英文的翻译也不完整。而且谷歌服务也没有被预装,而其它在德国官方发售的Android手机基本上都有。但是,安装其他的系统或者安装Google Play商店则可以解决这个问题。
小米 MI Mix 因为它的创造性的屏幕设计而从其他的高端智能手机和平板手机当中脱颖而出。不幸的是,它并没有为欧洲的用户进行优化,包括有限的LTE 频段支持和不完整的翻译。
在欧洲,小米Mi Max只能从像为我们提供评测样机的TradingShenzen这样的进口商那里购买到。它目前的价格是677欧元加上邮递和可能的海关进口费用。目前价格在700欧元左右的华为的全新Mate 9平板手机绝对是一个有趣的替代品。尽管用户们可能无法在这台设备上找到像我们手上这台评测样品这样的不同寻常的屏幕,但是欧洲的LTE频段以及为中国用户设计的交互界面却不再是一个问题。
注:本文是基于完整评测的缩减版本,阅读完整的英文评测,请点击这里。
Xiaomi Mi Mix
- 01/02/2017 v6 (old)
Andreas Kilian