小米Mix 3智能手机评测


| |||||||||||||||||||||||||
Brightness Distribution: 96 %
Center on Battery: 599 cd/m²
Contrast: ∞:1 (Black: 0 cd/m²)
ΔE ColorChecker Calman: 1.4 | ∀{0.5-29.43 Ø4.73}
ΔE Greyscale Calman: 2 | ∀{0.09-98 Ø4.97}
97.5% sRGB (Calman 2D)
Gamma: 2.25
CCT: 6496 K
| Xiaomi Mi Mix 3 OLED, 2340x1080, 6.4" | Xiaomi Mi 8 Explorer Edition Super AMOLED, 2248x1080, 6.2" | Oppo Find X AMOLED, 2340x1080, 6.4" | Vivo Nex Ultimate Super AMOLED, 2316x1080, 6.6" | OnePlus 6T Optic AMOLED, 2340x1080, 6.4" | Samsung Galaxy S9 Plus Super AMOLED, 2960x1440, 6.2" | HTC U12 Plus Super LCD 6, 2880x1440, 6" | Huawei Mate 20 Pro OLED, 3120x1440, 6.3" | |
|---|---|---|---|---|---|---|---|---|
| Screen | -56% | -97% | -161% | -25% | -20% | -8% | 1% | |
| Brightness middle (cd/m²) | 599 | 429 -28% | 427 -29% | 356 -41% | 437 -27% | 565 -6% | 395 -34% | 576 -4% |
| Brightness (cd/m²) | 593 | 432 -27% | 432 -27% | 352 -41% | 442 -25% | 571 -4% | 402 -32% | 582 -2% |
| Brightness Distribution (%) | 96 | 88 -8% | 87 -9% | 95 -1% | 95 -1% | 96 0% | 90 -6% | 90 -6% |
| Black Level * (cd/m²) | 0.37 | |||||||
| Colorchecker dE 2000 * | 1.4 | 3.39 -142% | 5.37 -284% | 7.08 -406% | 2.21 -58% | 2.3 -64% | 1.6 -14% | 1.3 7% |
| Colorchecker dE 2000 max. * | 3.2 | 5.25 -64% | 7.51 -135% | 14.1 -341% | 4.27 -33% | 4.8 -50% | 3.4 -6% | 3.5 -9% |
| Greyscale dE 2000 * | 2 | 3.3 -65% | 4 -100% | 4.7 -135% | 2.1 -5% | 1.9 5% | 1.1 45% | 1.6 20% |
| Gamma | 2.25 98% | 2.238 98% | 2.243 98% | 2.096 105% | 2.307 95% | 2.16 102% | 2.14 103% | 2.18 101% |
| CCT | 6496 100% | 7135 91% | 6851 95% | 7297 89% | 6353 102% | 6332 103% | 6536 99% | 6561 99% |
| Contrast (:1) | 1068 |
* ... smaller is better
Screen Flickering / PWM (Pulse-Width Modulation)
| Screen flickering / PWM detected | 240.4 Hz | 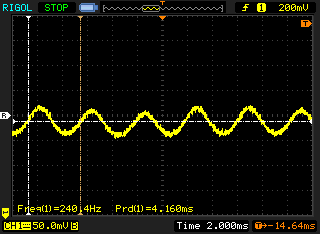 | |
The display backlight flickers at 240.4 Hz (worst case, e.g., utilizing PWM) . The frequency of 240.4 Hz is relatively low, so sensitive users will likely notice flickering and experience eyestrain at the stated brightness setting and below. In comparison: 52 % of all tested devices do not use PWM to dim the display. If PWM was detected, an average of 7798 (minimum: 5 - maximum: 343500) Hz was measured. | |||
Display Response Times
| ↔ Response Time Black to White | ||
|---|---|---|
| 12.2 ms ... rise ↗ and fall ↘ combined | ↗ 9.4 ms rise | 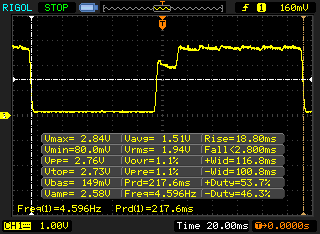 |
| ↘ 2.8 ms fall | ||
| The screen shows good response rates in our tests, but may be too slow for competitive gamers. In comparison, all tested devices range from 0.1 (minimum) to 240 (maximum) ms. » 32 % of all devices are better. This means that the measured response time is better than the average of all tested devices (19.9 ms). | ||
| ↔ Response Time 50% Grey to 80% Grey | ||
| 7.6 ms ... rise ↗ and fall ↘ combined | ↗ 2.8 ms rise | 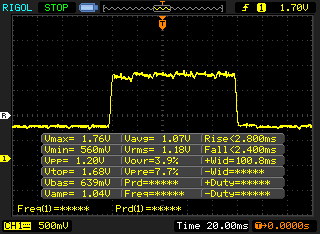 |
| ↘ 4.8 ms fall | ||
| The screen shows very fast response rates in our tests and should be very well suited for fast-paced gaming. In comparison, all tested devices range from 0.165 (minimum) to 636 (maximum) ms. » 20 % of all devices are better. This means that the measured response time is better than the average of all tested devices (31.1 ms). | ||
| JetStream 1.1 - 1.1 Total | |
| Huawei Mate 20 Pro (Chrome 69) | |
| HTC U12 Plus (Chrome 66) | |
| OnePlus 6T (Chrome 70) | |
| Xiaomi Mi Mix 3 (Chrome 70) | |
| Xiaomi Mi 8 Explorer Edition (Chrome 69) | |
| Average Qualcomm Snapdragon 845 (22.5 - 90.9, n=25) | |
| Samsung Galaxy S9 Plus (Samsung Browser 7.0) | |
| Oppo Find X (Chrome 69) | |
| Vivo Nex Ultimate (Chrome 67) | |
| Octane V2 - Total Score | |
| Average of class Smartphone (2800 - 126661, n=157, last 2 years) | |
| Huawei Mate 20 Pro (Chrome 69) | |
| OnePlus 6T (Chrome 70) | |
| Xiaomi Mi Mix 3 (Chrome 70) | |
| HTC U12 Plus (Chrome 66) | |
| Average Qualcomm Snapdragon 845 (3991 - 18275, n=28) | |
| Samsung Galaxy S9 Plus (Samsung Browser 7.0) | |
| Xiaomi Mi 8 Explorer Edition (Chrome 69) | |
| Oppo Find X (Chrome 69) | |
| Vivo Nex Ultimate (Chrome 67) | |
| Mozilla Kraken 1.1 - Total | |
| Vivo Nex Ultimate (Chrome 67) | |
| Oppo Find X (Chrome 69) | |
| Average Qualcomm Snapdragon 845 (2154 - 11204, n=28) | |
| HTC U12 Plus (Chrome 66) | |
| Xiaomi Mi 8 Explorer Edition (Chrome 69) | |
| Xiaomi Mi Mix 3 (Chrome 70) | |
| OnePlus 6T (Chrome 70) | |
| Samsung Galaxy S9 Plus (Samsung Browser 7.0) | |
| Huawei Mate 20 Pro (Chrome 69) | |
| Average of class Smartphone (257 - 28190, n=135, last 2 years) | |
| WebXPRT 3 - Overall | |
| Average of class Smartphone (104 - 380, n=12, last 2 years) | |
| Huawei Mate 20 Pro (Chrome 69) | |
| HTC U12 Plus (Chrome 66) | |
| Xiaomi Mi Mix 3 (Chrome 70) | |
| Average Qualcomm Snapdragon 845 (19 - 103, n=17) | |
| Samsung Galaxy S9 Plus | |
| Vivo Nex Ultimate (Stock Browser) | |
| WebXPRT 2015 - Overall | |
| Huawei Mate 20 Pro (Chrome 69) | |
| OnePlus 6T (Chrome 70) | |
| Xiaomi Mi Mix 3 (Chrome 70) | |
| HTC U12 Plus (Chrome 66) | |
| Xiaomi Mi 8 Explorer Edition (Chrome 69) | |
| Average Qualcomm Snapdragon 845 (96 - 291, n=23) | |
| Samsung Galaxy S9 Plus (Samsung Browser 7.0) | |
| Vivo Nex Ultimate (Chrome 67) | |
* ... smaller is better
| Xiaomi Mi Mix 3 | Xiaomi Mi 8 Explorer Edition | Oppo Find X | Vivo Nex Ultimate | OnePlus 6T | Samsung Galaxy S9 Plus | HTC U12 Plus | Huawei Mate 20 Pro | Average 128 GB UFS 2.1 Flash | Average of class Smartphone | |
|---|---|---|---|---|---|---|---|---|---|---|
| AndroBench 3-5 | 5% | 15% | 5% | 6% | 8% | 106% | 187% | 161% | 738% | |
| Sequential Read 256KB (MB/s) | 675 | 692 3% | 761 13% | 687 2% | 735 9% | 819 21% | 709 5% | 853 26% | 762 ? 13% | 2251 ? 233% |
| Sequential Write 256KB (MB/s) | 206.8 | 205.2 -1% | 206.9 0% | 228.4 10% | 204.4 -1% | 204.9 -1% | 195.8 -5% | 196.4 -5% | 300 ? 45% | 1932 ? 834% |
| Random Read 4KB (MB/s) | 133.2 | 135.2 2% | 145.9 10% | 126.7 -5% | 138.5 4% | 129.7 -3% | 118.1 -11% | 157.4 18% | 154.7 ? 16% | 310 ? 133% |
| Random Write 4KB (MB/s) | 19.54 | 22.65 16% | 26.98 38% | 22.1 13% | 22 13% | 22.74 16% | 104.2 433% | 157.8 708% | 131.1 ? 571% | 362 ? 1753% |
PUBG Mobile
Asphalt 9 Legends
Emissions - low temperatures
Xiaomi Mi Mix 3 audio analysis
(+) | speakers can play relatively loud (84.8 dB)
Bass 100 - 315 Hz
(-) | nearly no bass - on average 27.4% lower than median
(±) | linearity of bass is average (10.7% delta to prev. frequency)
Mids 400 - 2000 Hz
(+) | balanced mids - only 3.2% away from median
(+) | mids are linear (4.5% delta to prev. frequency)
Highs 2 - 16 kHz
(±) | higher highs - on average 7.4% higher than median
(+) | highs are linear (4.3% delta to prev. frequency)
Overall 100 - 16.000 Hz
(±) | linearity of overall sound is average (21.7% difference to median)
Compared to same class
» 44% of all tested devices in this class were better, 8% similar, 48% worse
» The best had a delta of 11%, average was 34%, worst was 134%
Compared to all devices tested
» 61% of all tested devices were better, 7% similar, 31% worse
» The best had a delta of 4%, average was 24%, worst was 134%
OnePlus 6T audio analysis
(±) | speaker loudness is average but good (80.5 dB)
Bass 100 - 315 Hz
(-) | nearly no bass - on average 62.9% lower than median
(+) | bass is linear (0% delta to prev. frequency)
Mids 400 - 2000 Hz
(-) | nearly no mids - on average 62.9% lower than median
(+) | mids are linear (0% delta to prev. frequency)
Highs 2 - 16 kHz
(-) | nearly no highs - on average 62.9% lower than median
(+) | highs are linear (0% delta to prev. frequency)
Overall 100 - 16.000 Hz
(-) | overall sound is not linear (116.1% difference to median)
Compared to same class
» 88% of all tested devices in this class were better, 4% similar, 8% worse
» The best had a delta of 11%, average was 34%, worst was 134%
Compared to all devices tested
» 96% of all tested devices were better, 1% similar, 2% worse
» The best had a delta of 4%, average was 24%, worst was 134%
| Off / Standby | |
| Idle | |
| Load |
|
Key:
min: | |
| Xiaomi Mi Mix 3 3200 mAh | Xiaomi Mi 8 Explorer Edition 3000 mAh | Oppo Find X 3730 mAh | Vivo Nex Ultimate 4000 mAh | OnePlus 6T 3700 mAh | Samsung Galaxy S9 Plus 3500 mAh | HTC U12 Plus 3500 mAh | Huawei Mate 20 Pro 4200 mAh | Average Qualcomm Snapdragon 845 | Average of class Smartphone | |
|---|---|---|---|---|---|---|---|---|---|---|
| Power Consumption | -192% | -130% | -57% | -51% | -18% | -104% | -94% | -82% | -80% | |
| Idle Minimum * (Watt) | 0.49 | 1.8 -267% | 0.9 -84% | 0.9 -84% | 0.7 -43% | 0.68 -39% | 0.77 -57% | 0.95 -94% | 0.862 ? -76% | 0.875 ? -79% |
| Idle Average * (Watt) | 0.67 | 2.9 -333% | 1.9 -184% | 1.5 -124% | 1.1 -64% | 0.95 -42% | 2.18 -225% | 2.17 -224% | 1.728 ? -158% | 1.47 ? -119% |
| Idle Maximum * (Watt) | 0.87 | 3.5 -302% | 3.2 -268% | 1.7 -95% | 2.1 -141% | 1.09 -25% | 2.21 -154% | 2.25 -159% | 2.07 ? -138% | 1.659 ? -91% |
| Load Average * (Watt) | 3.64 | 4.8 -32% | 7.1 -95% | 3.7 -2% | 4.2 -15% | 4.58 -26% | 6.25 -72% | 4.47 -23% | 4.87 ? -34% | 6.8 ? -87% |
| Load Maximum * (Watt) | 9.04 | 11.2 -24% | 10.7 -18% | 7.2 20% | 8.3 8% | 5.16 43% | 10.16 -12% | 6.15 32% | 9.27 ? -3% | 11.3 ? -25% |
* ... smaller is better
| Xiaomi Mi Mix 3 3200 mAh | Xiaomi Mi 8 Explorer Edition 3000 mAh | Oppo Find X 3730 mAh | Vivo Nex Ultimate 4000 mAh | OnePlus 6T 3700 mAh | Samsung Galaxy S9 Plus 3500 mAh | HTC U12 Plus 3500 mAh | Huawei Mate 20 Pro 4200 mAh | |
|---|---|---|---|---|---|---|---|---|
| Battery runtime | -4% | -17% | 23% | 19% | -12% | -19% | 13% | |
| Reader / Idle (h) | 30.2 | 23.4 -23% | 32.1 6% | 32.3 7% | 22.4 -26% | 24.2 -20% | 29.1 -4% | |
| H.264 (h) | 13.9 | 15.4 11% | 18.9 36% | 15.1 9% | 11.2 -19% | 7.7 -45% | 14.2 2% | |
| WiFi v1.3 (h) | 12 | 11.6 -3% | 9.9 -17% | 17.1 43% | 14.4 20% | 8.7 -27% | 8.5 -29% | 12.8 7% |
| Load (h) | 3.2 | 3.2 0% | 3.4 6% | 4.4 38% | 4 25% | 3.8 19% | 4.7 47% |
Pros
Cons
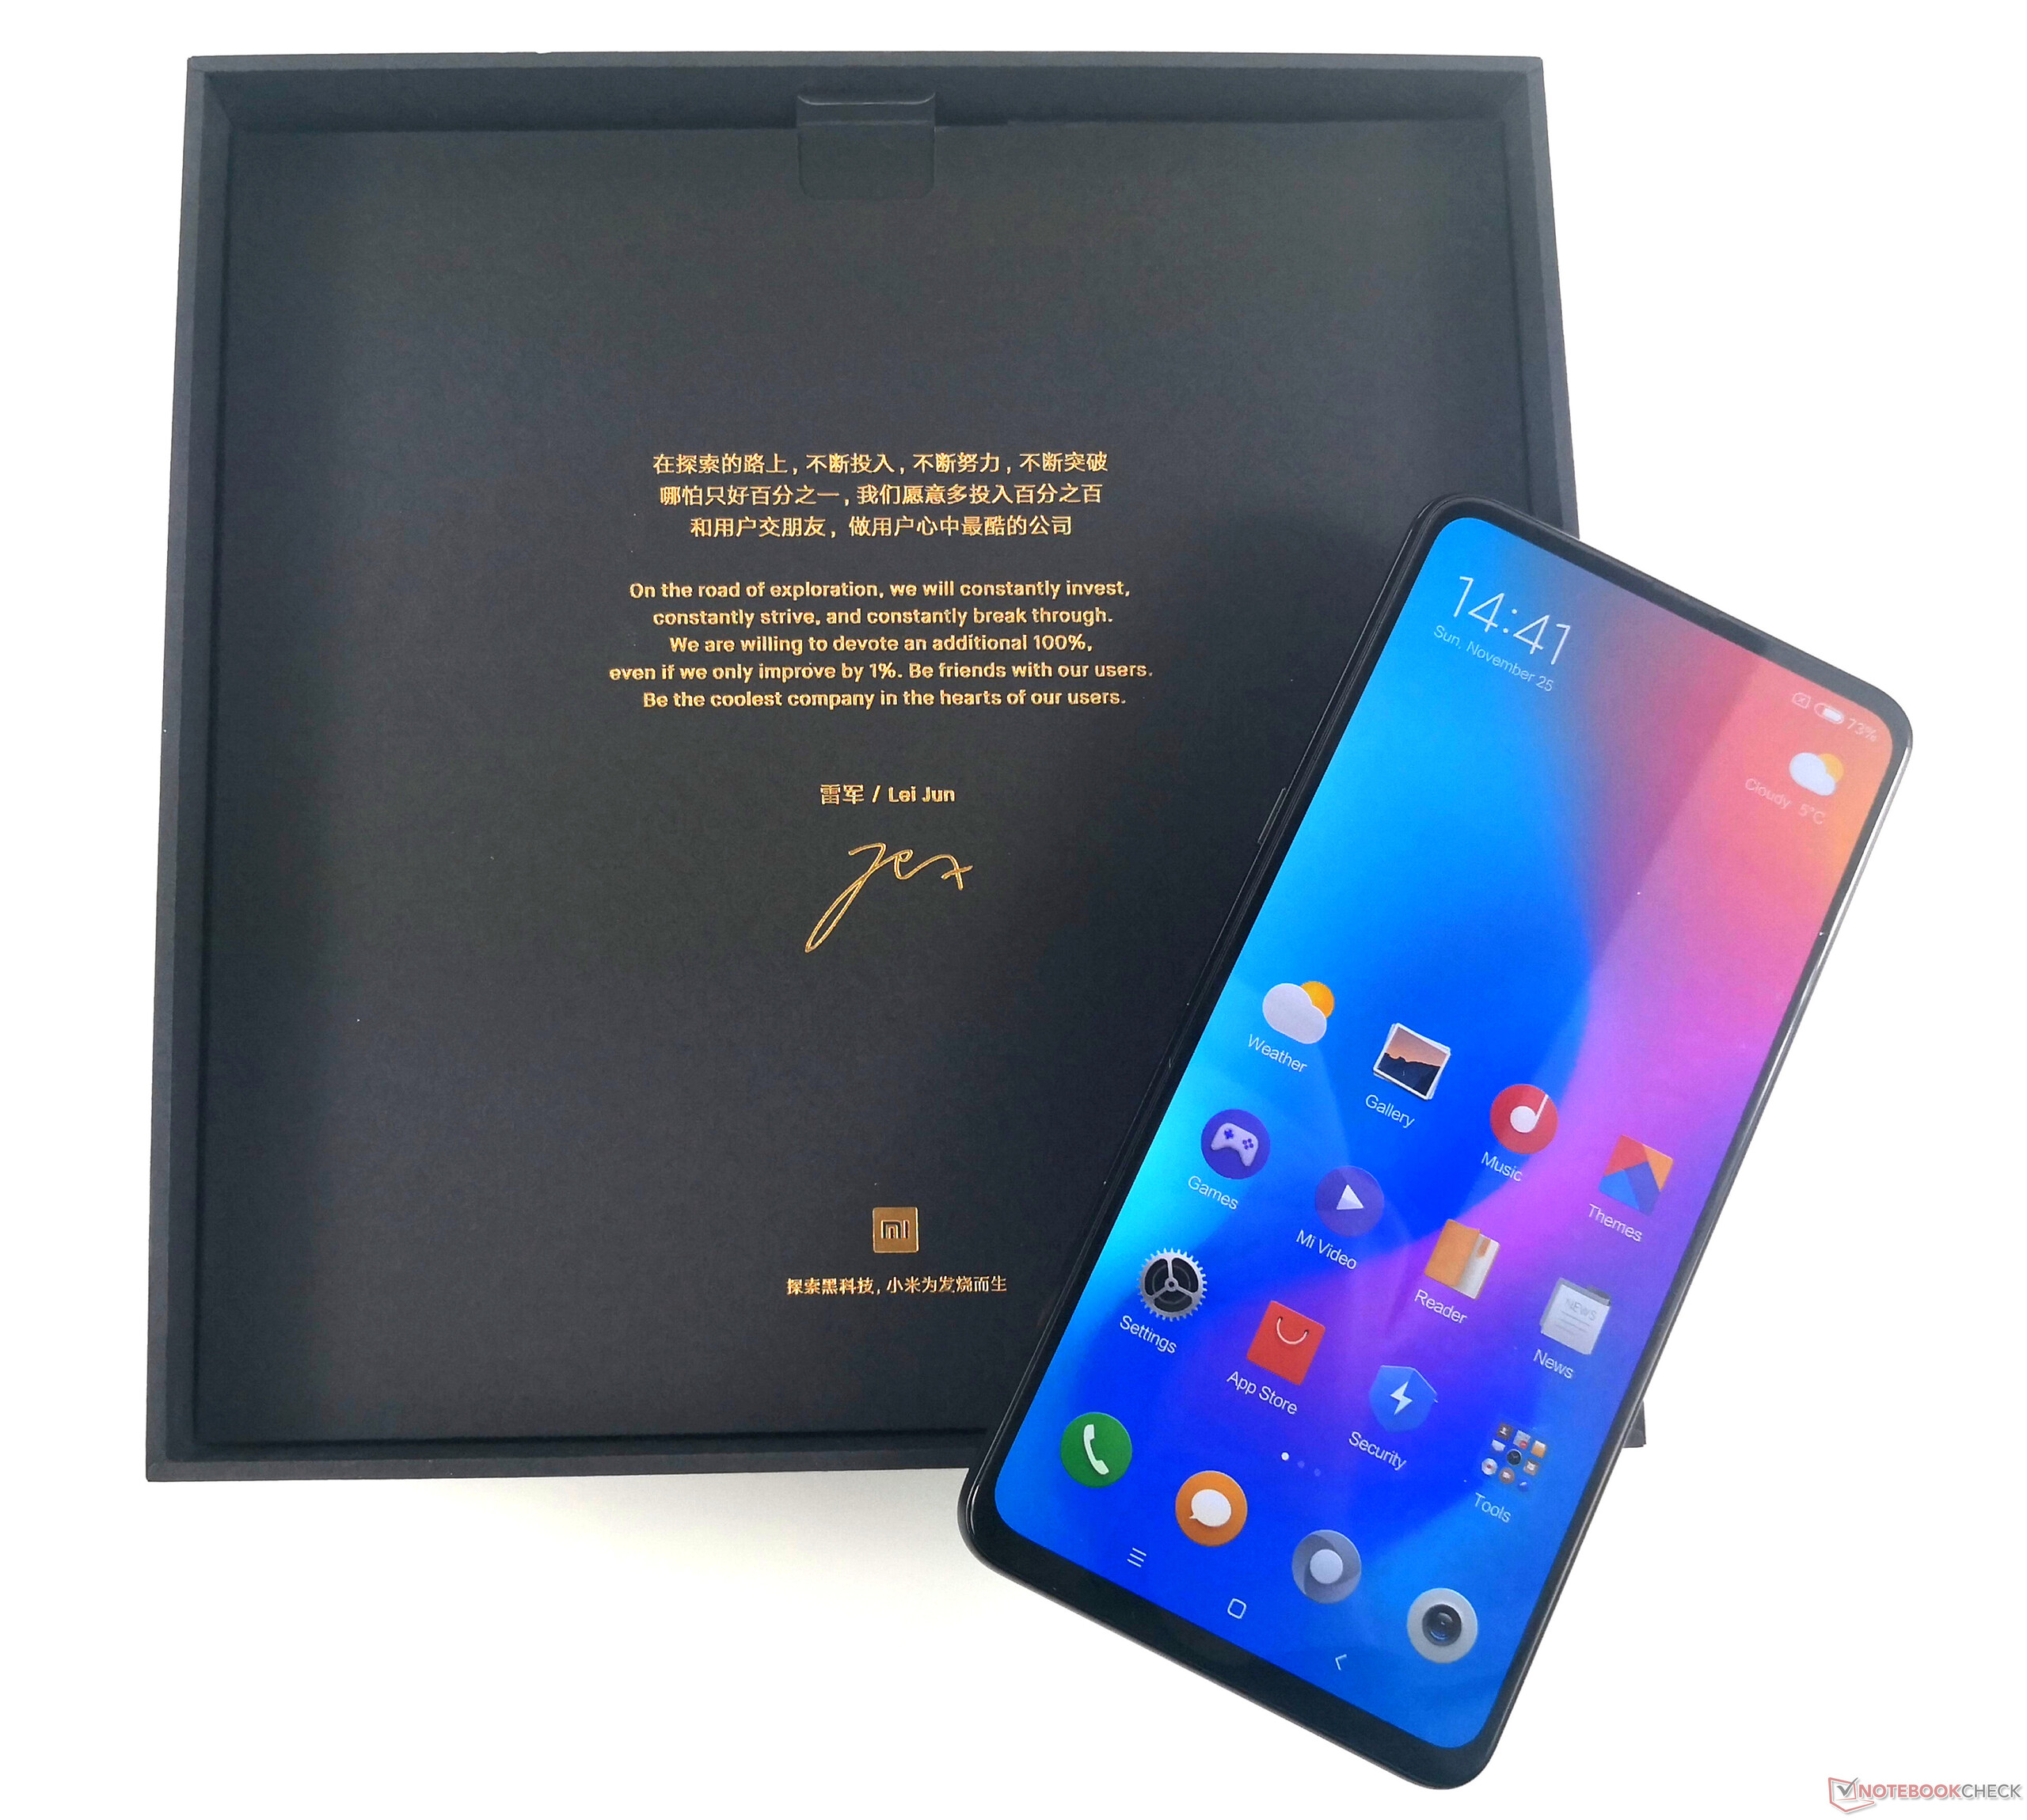
总结-绝佳的滑盖手机:
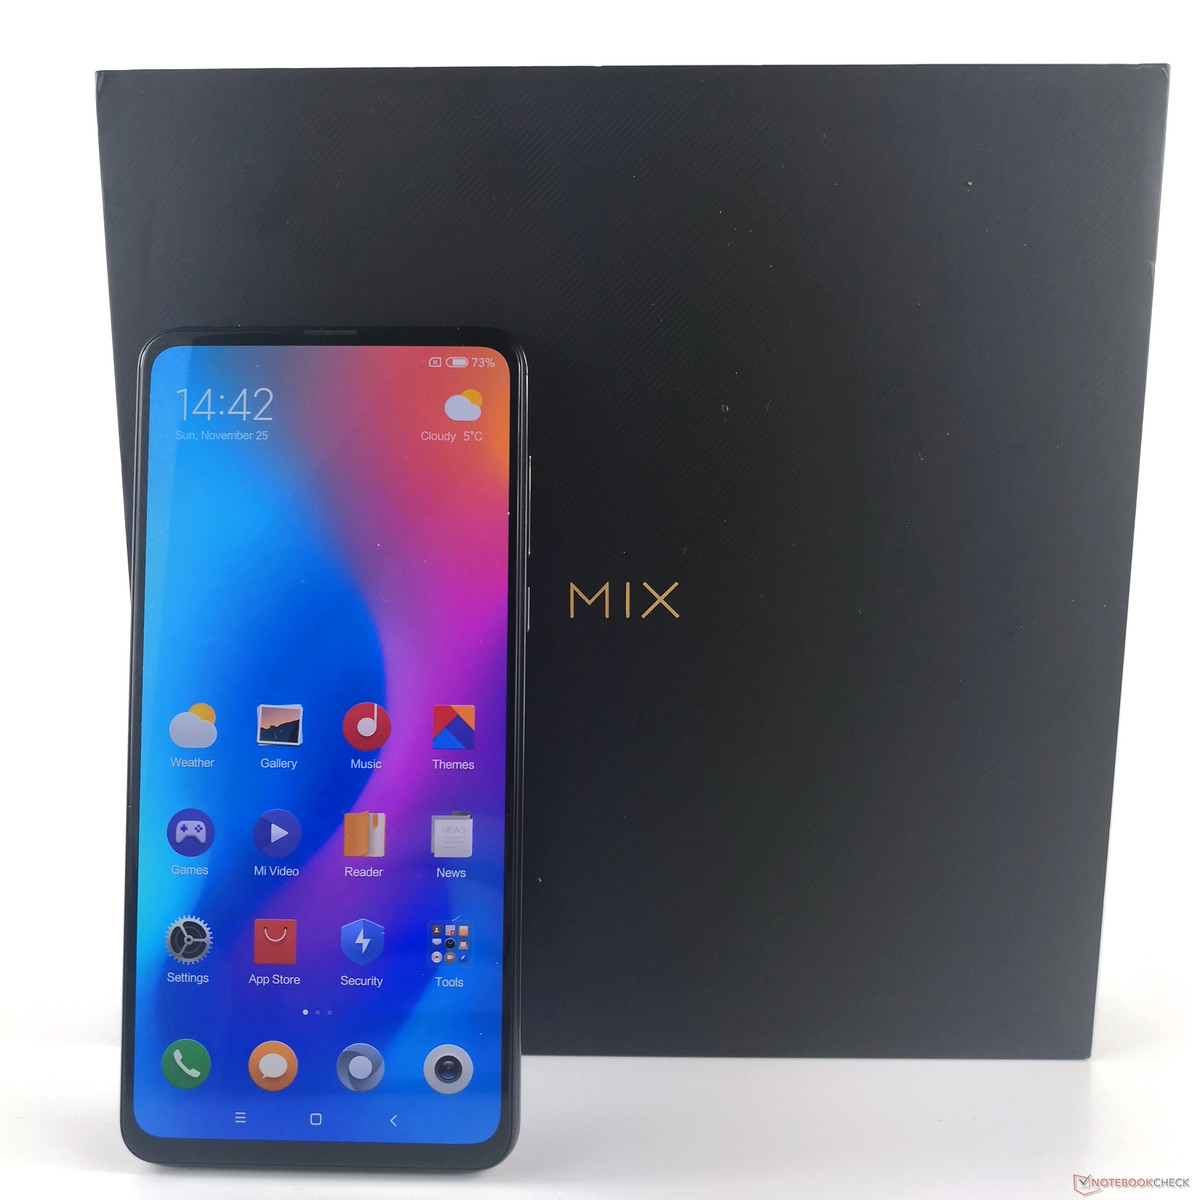
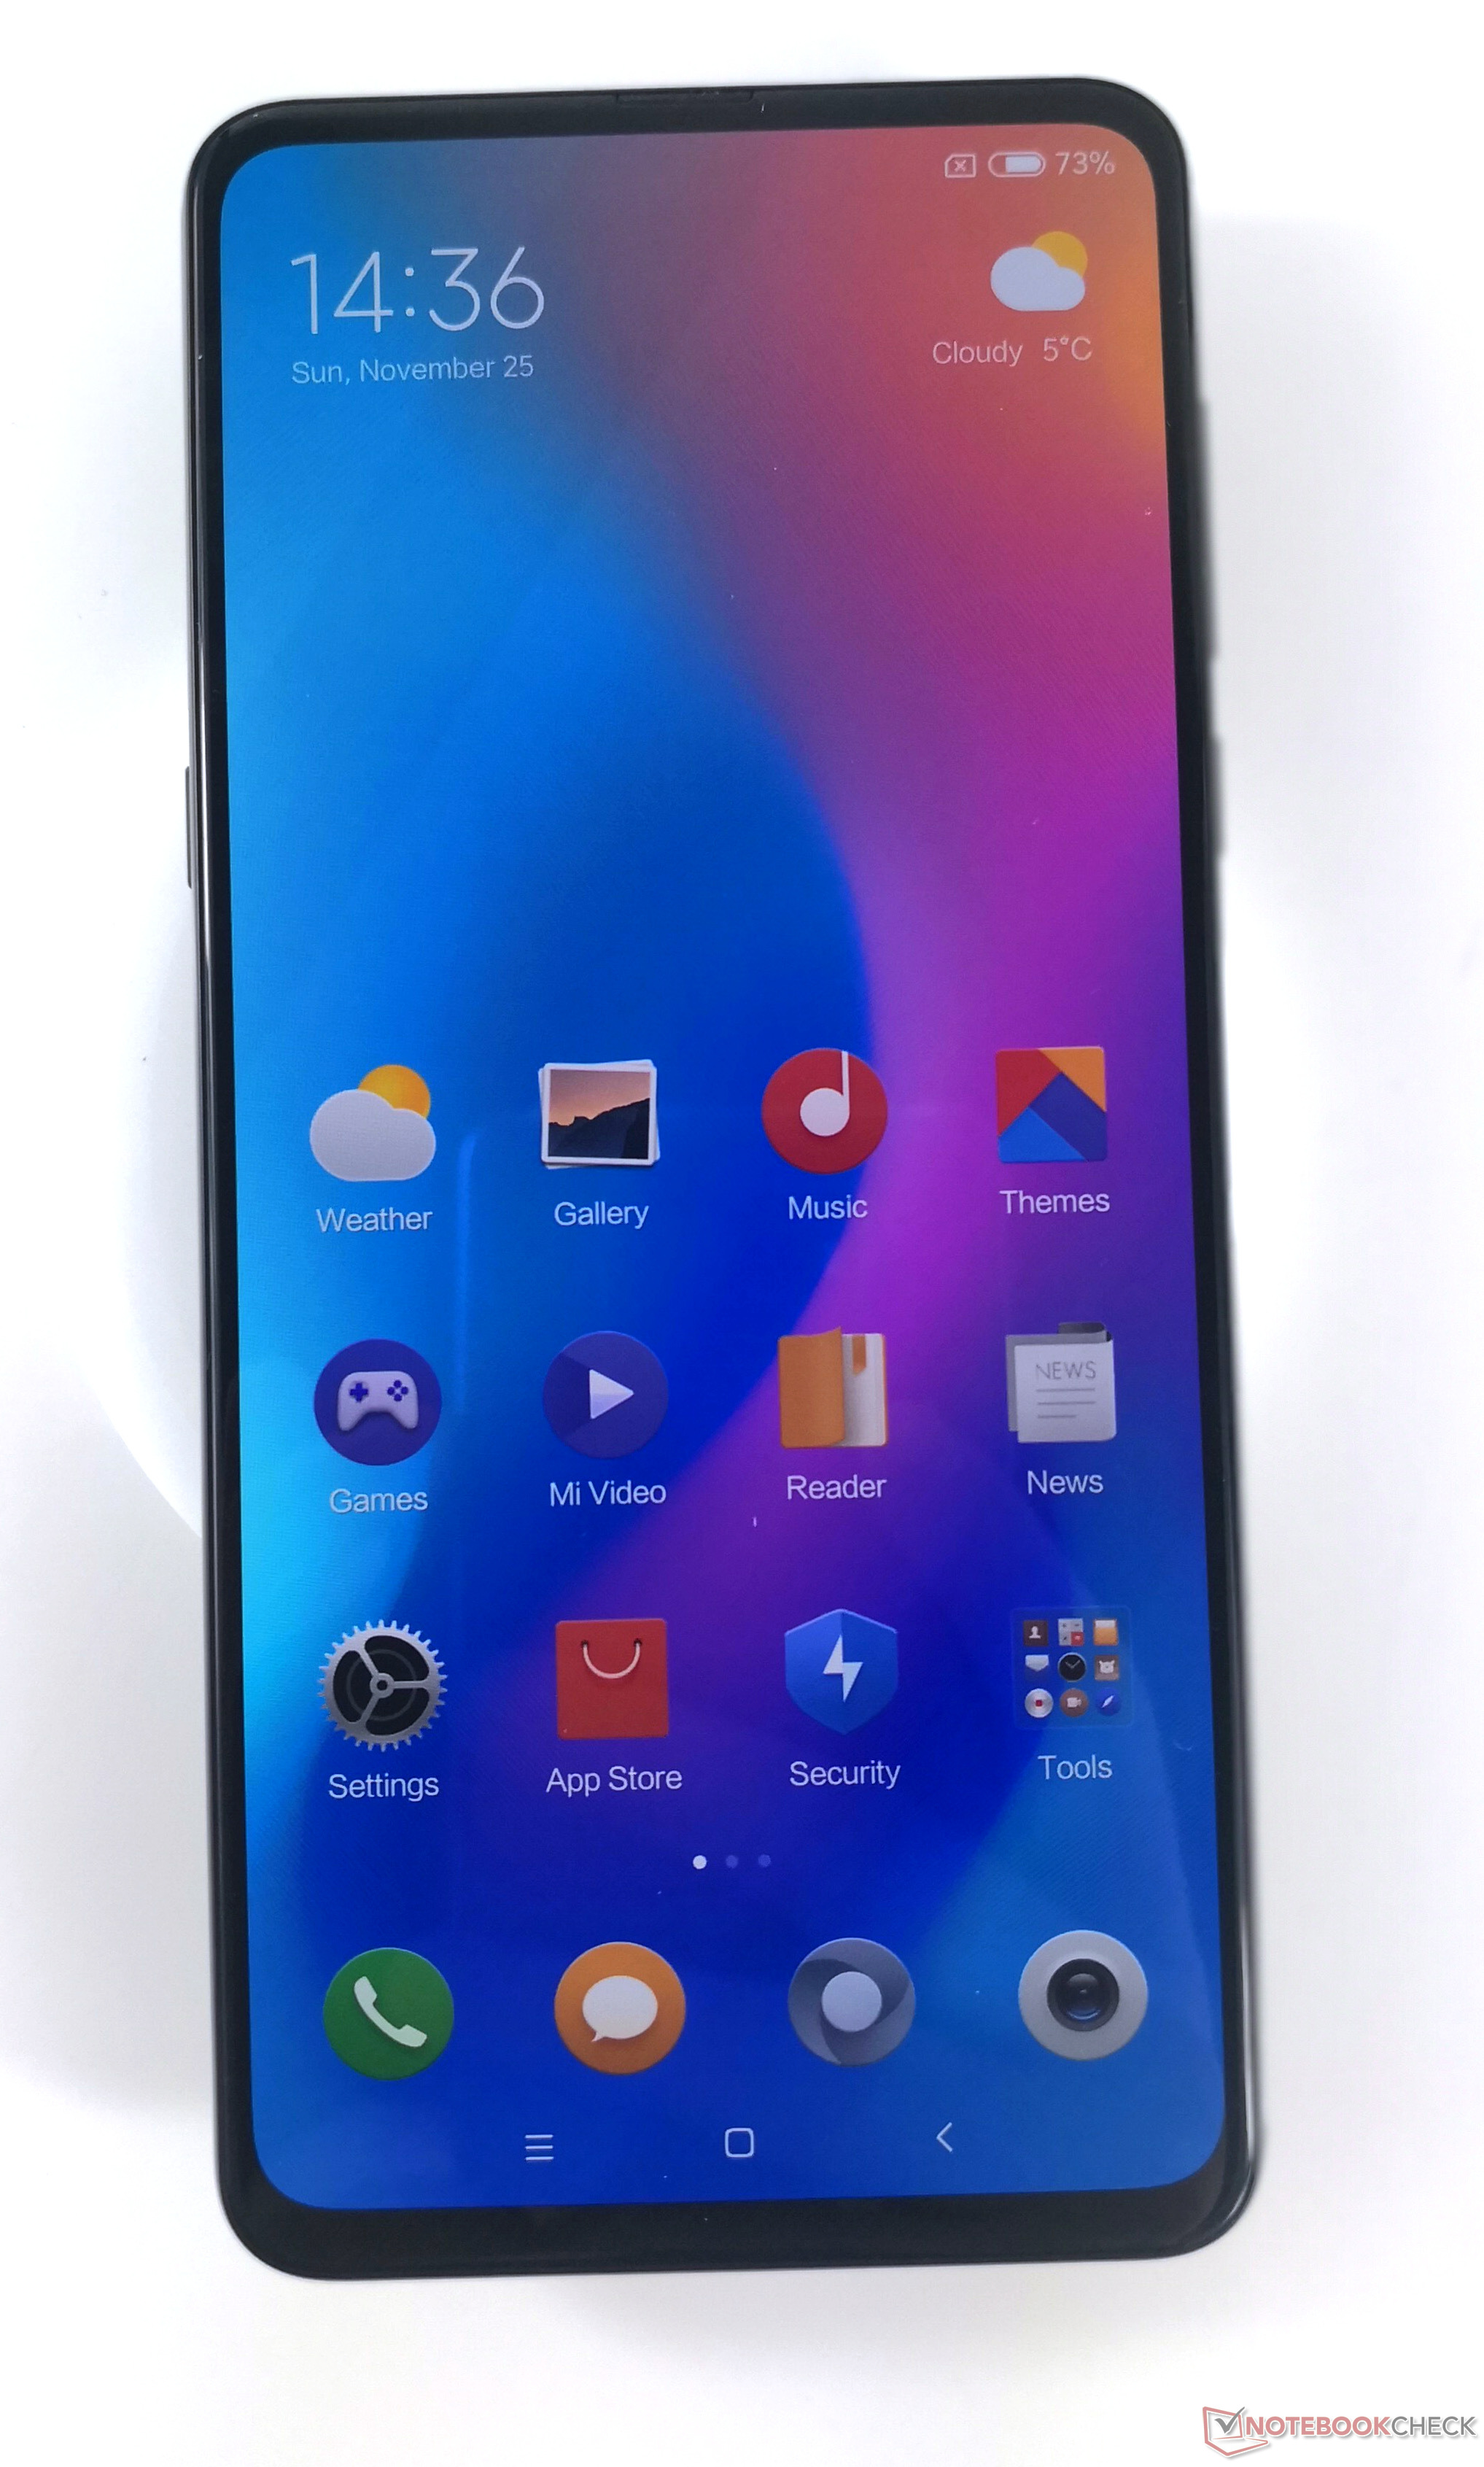
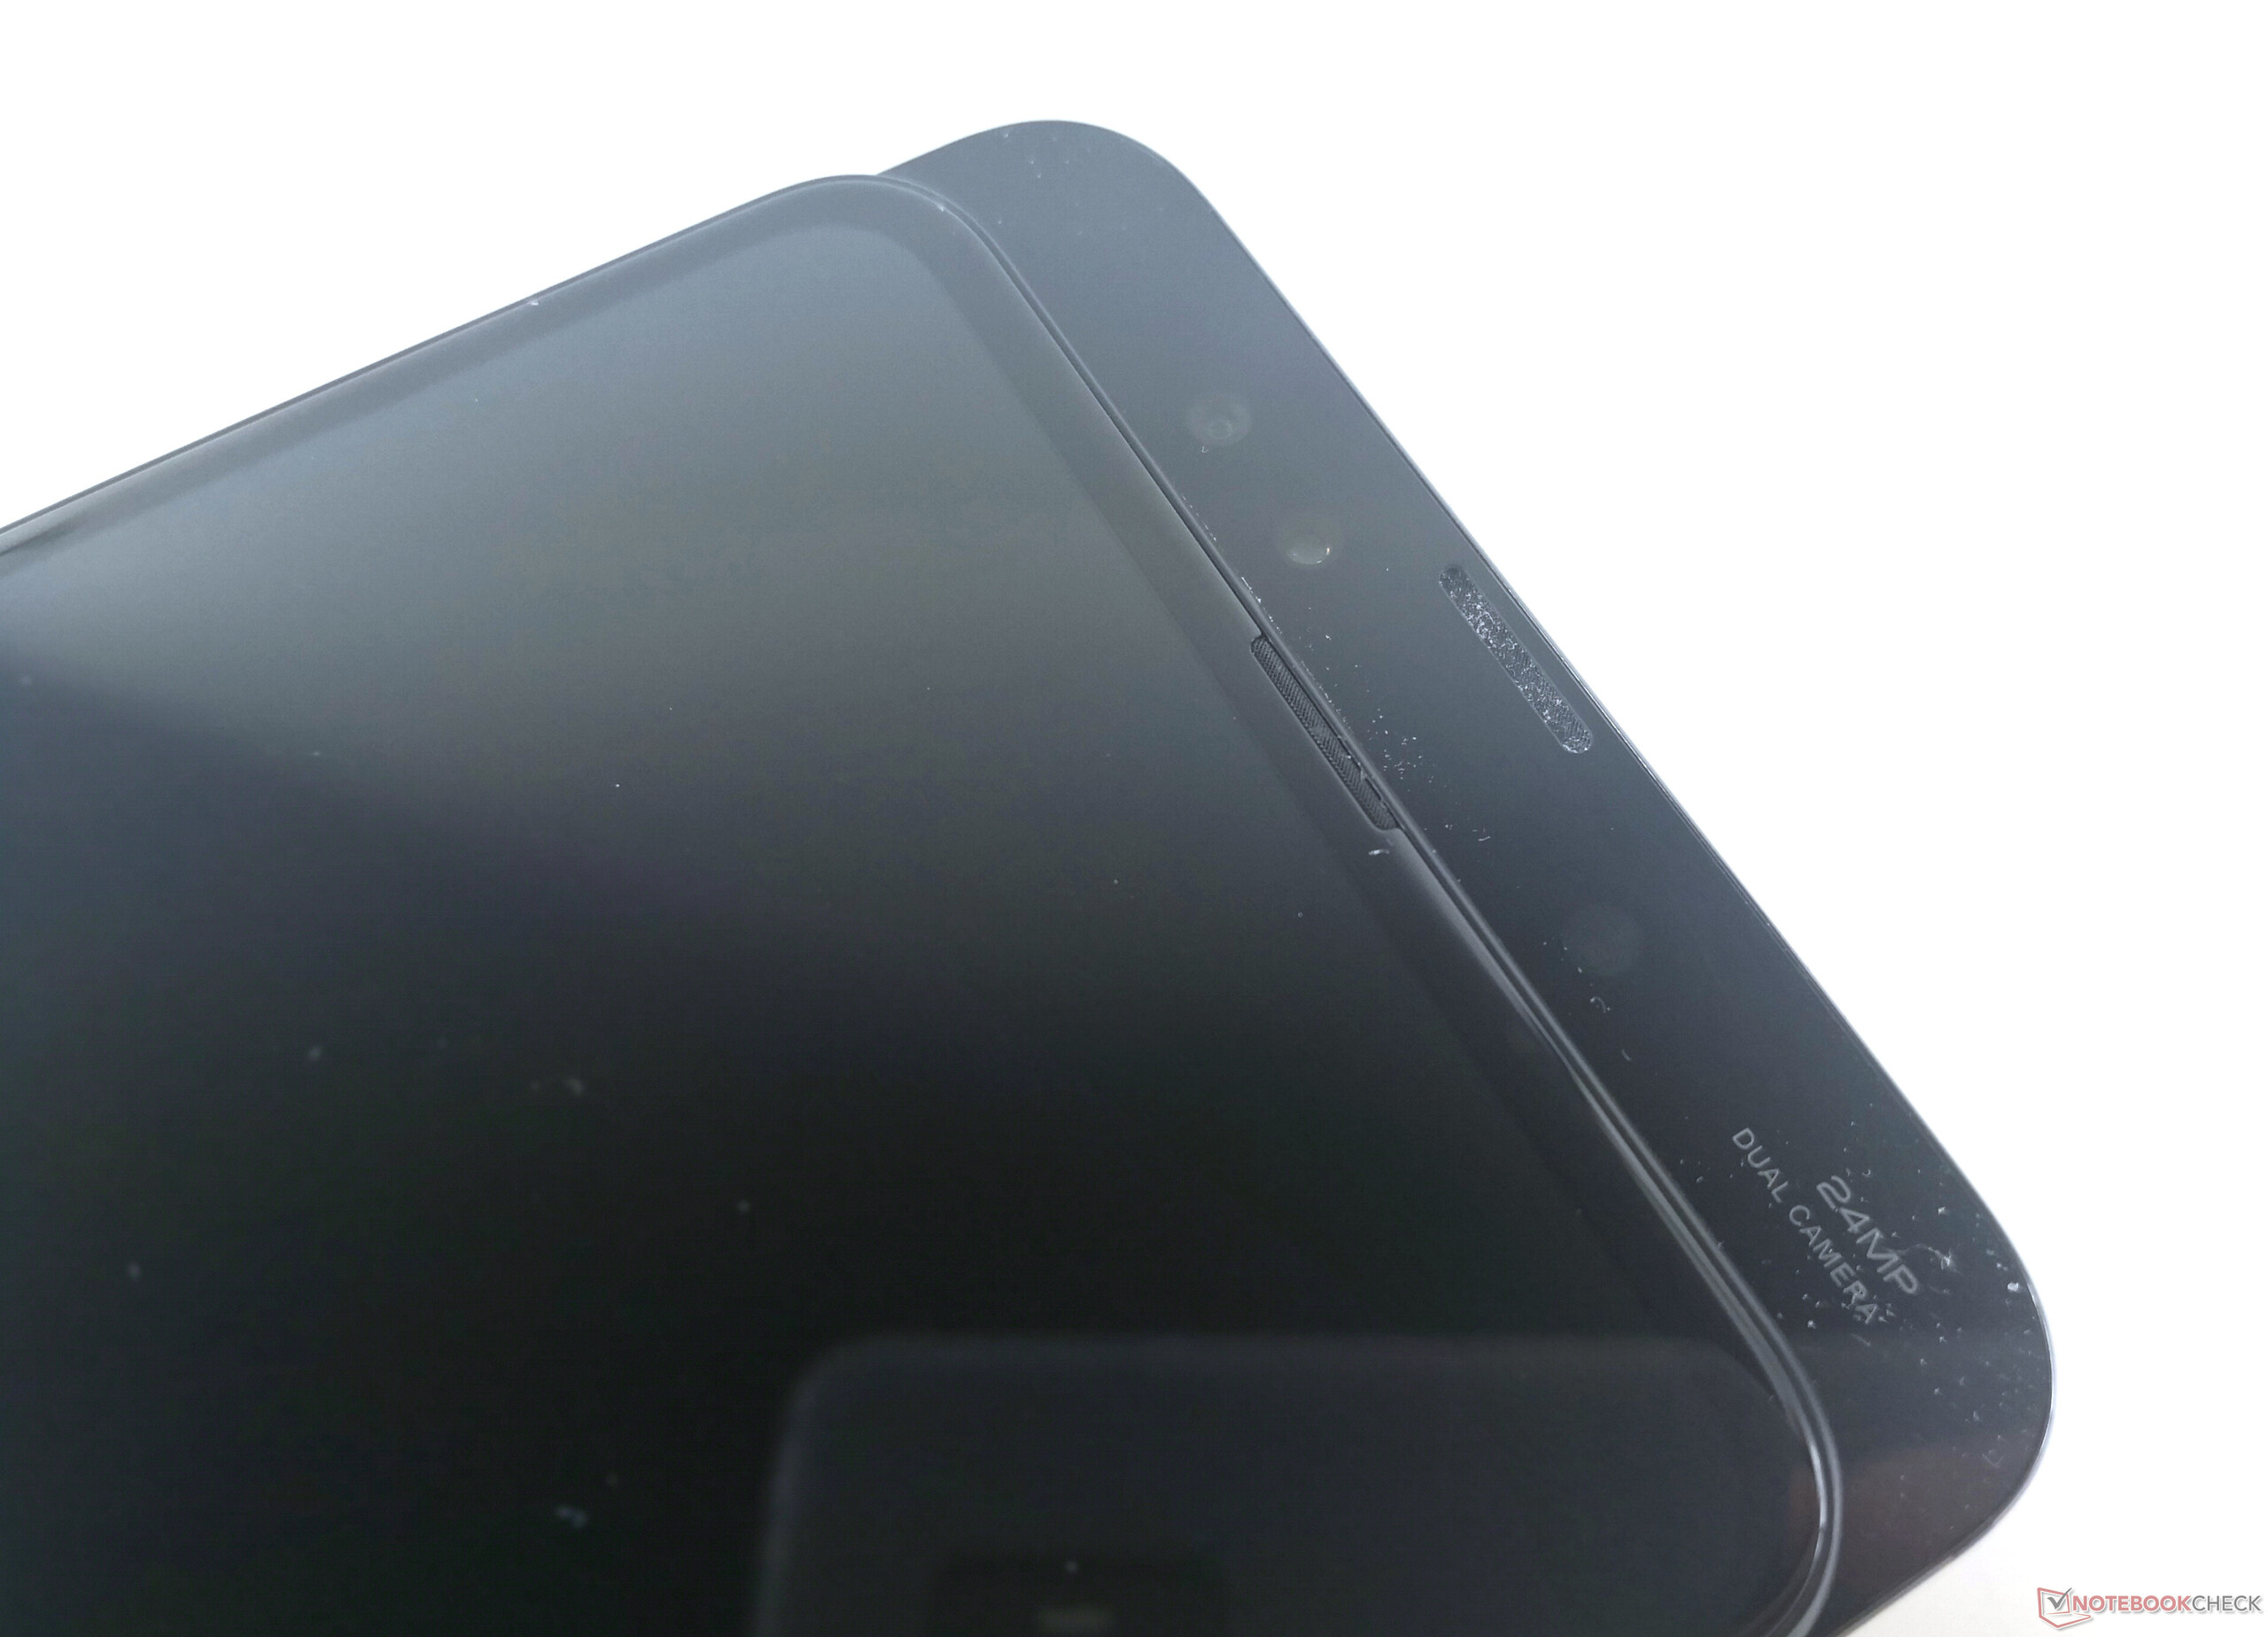
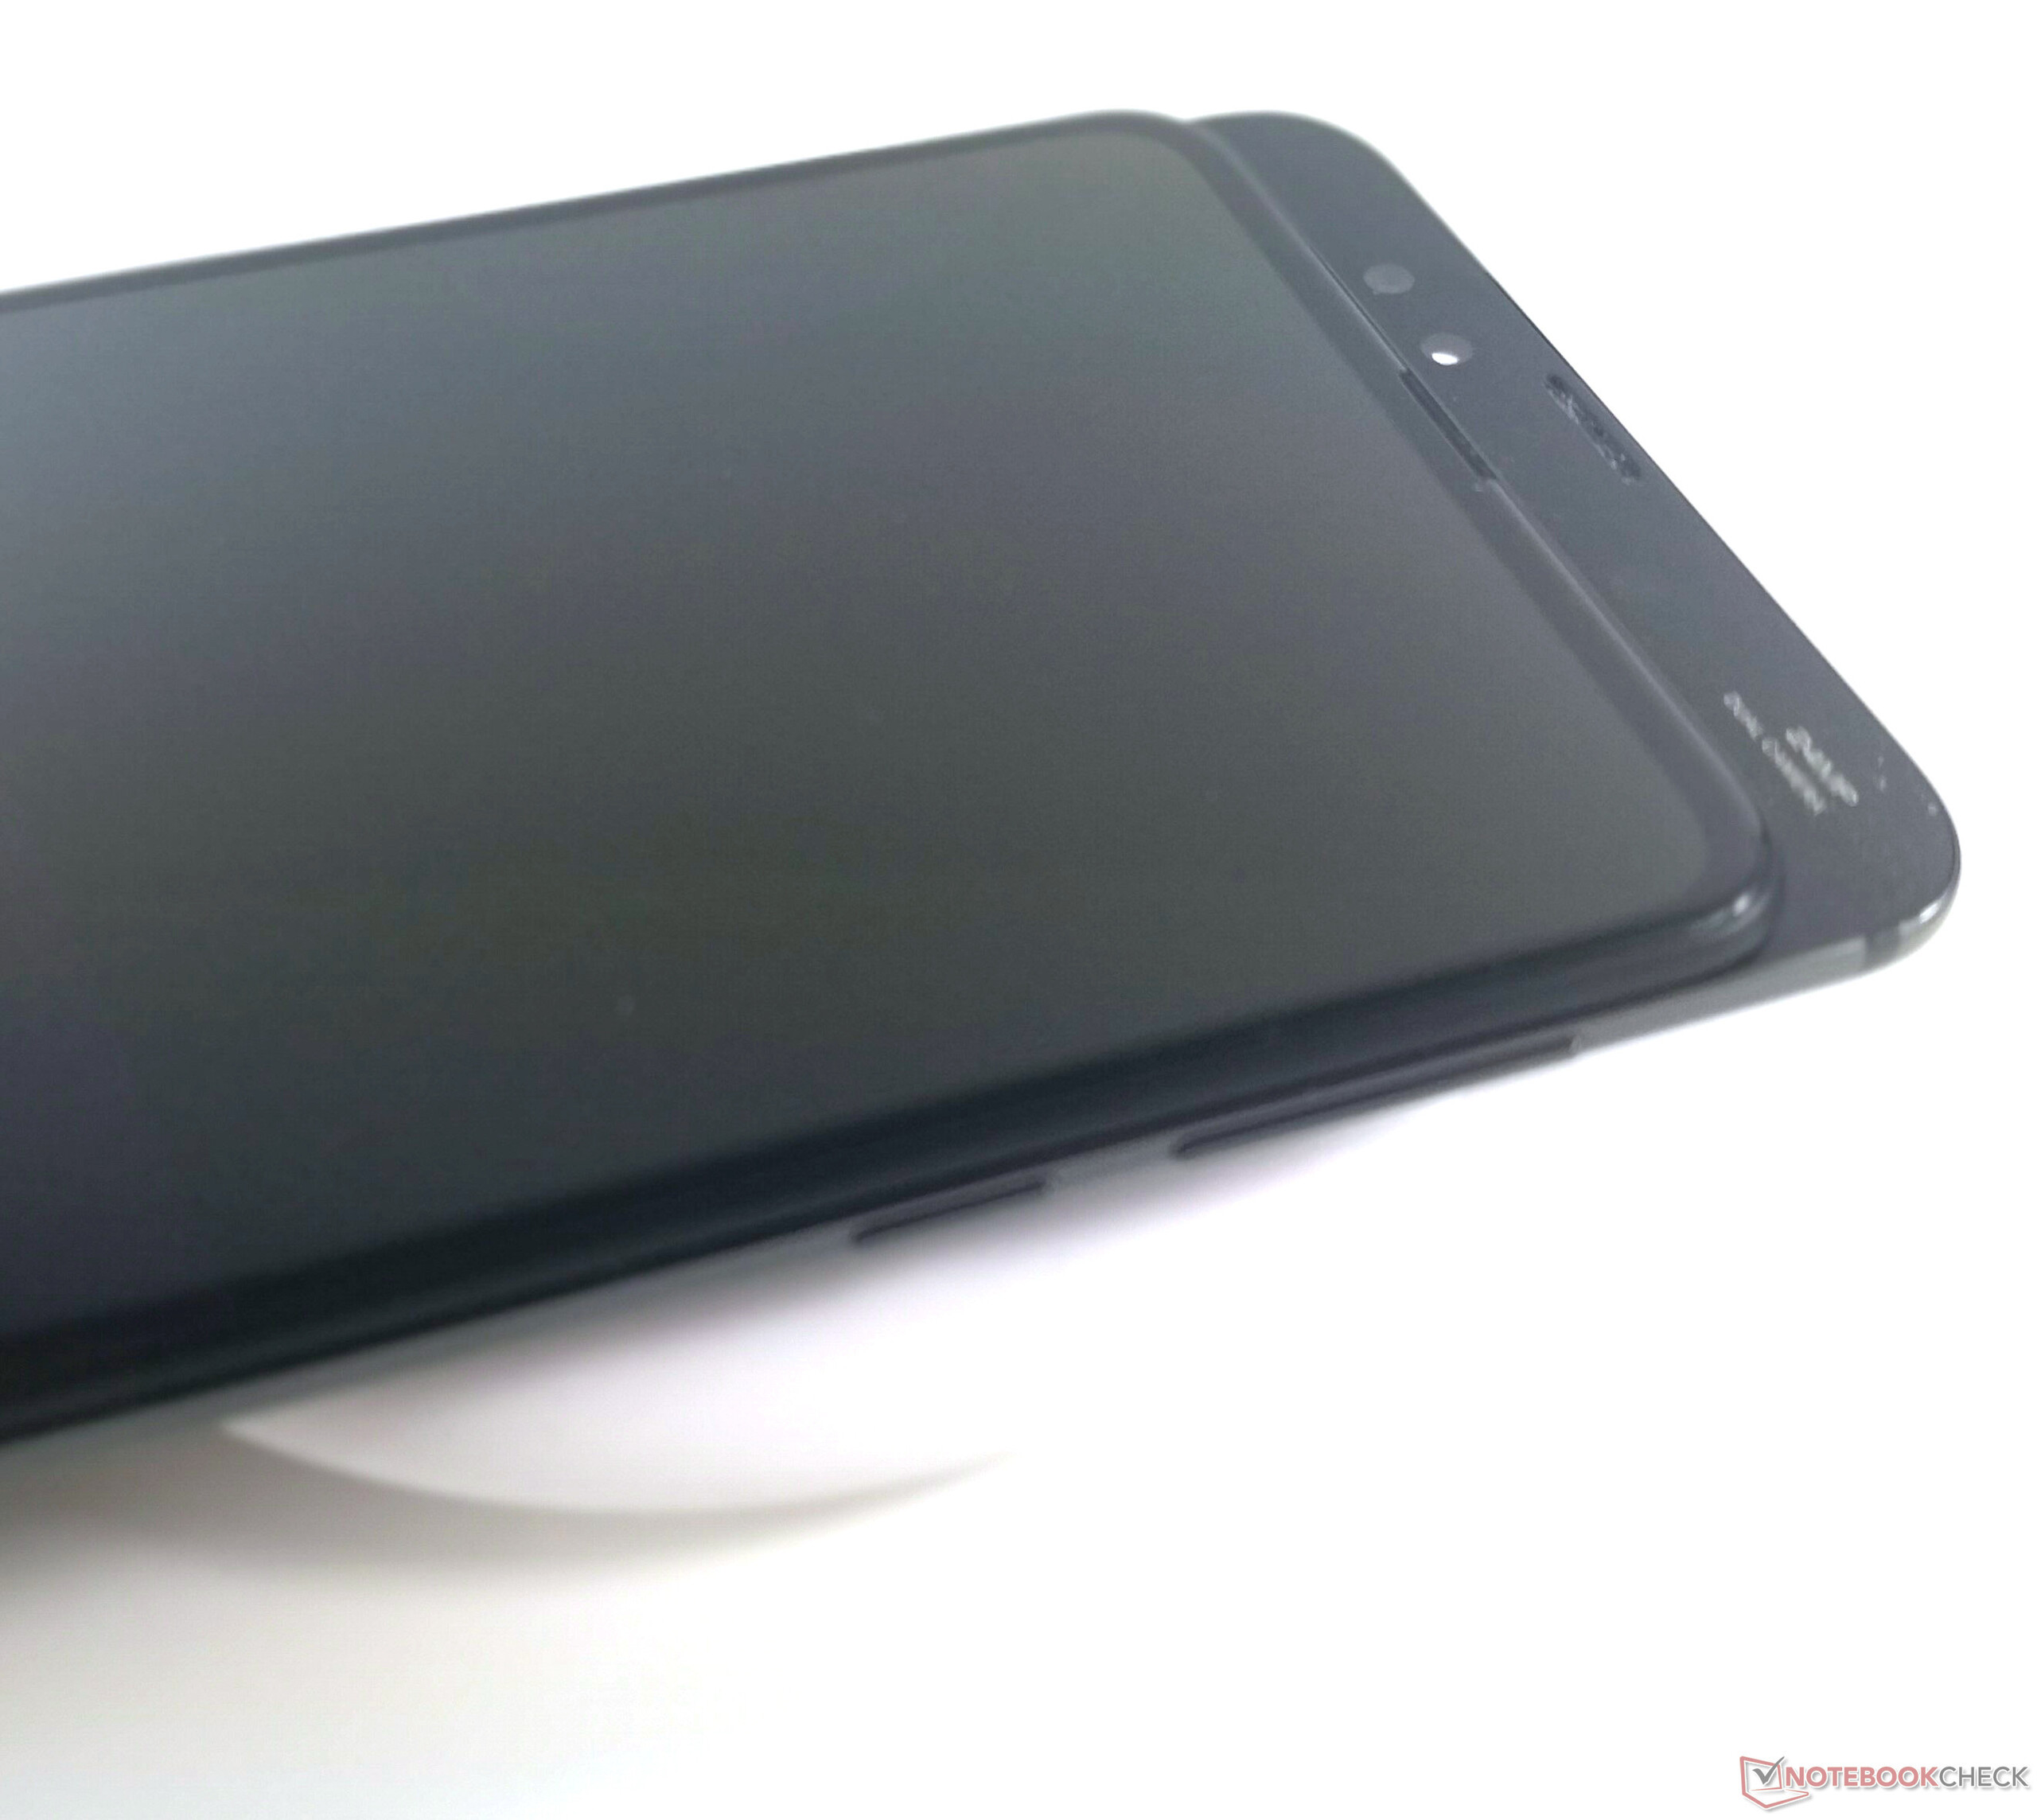
小米Mix 3是一款非常不错的无边框智能手机,屏幕没有刘海。屏幕素质也比小米8更进一步,显示技术非常出色。
我们对滑盖智能手机中相对较小的电池的续航水平感到惊讶。我们的电池测试表明小米Mix 3具有非常好的功耗,可以提供良好的续航时间。大多数用户应该可以做到一天一充。
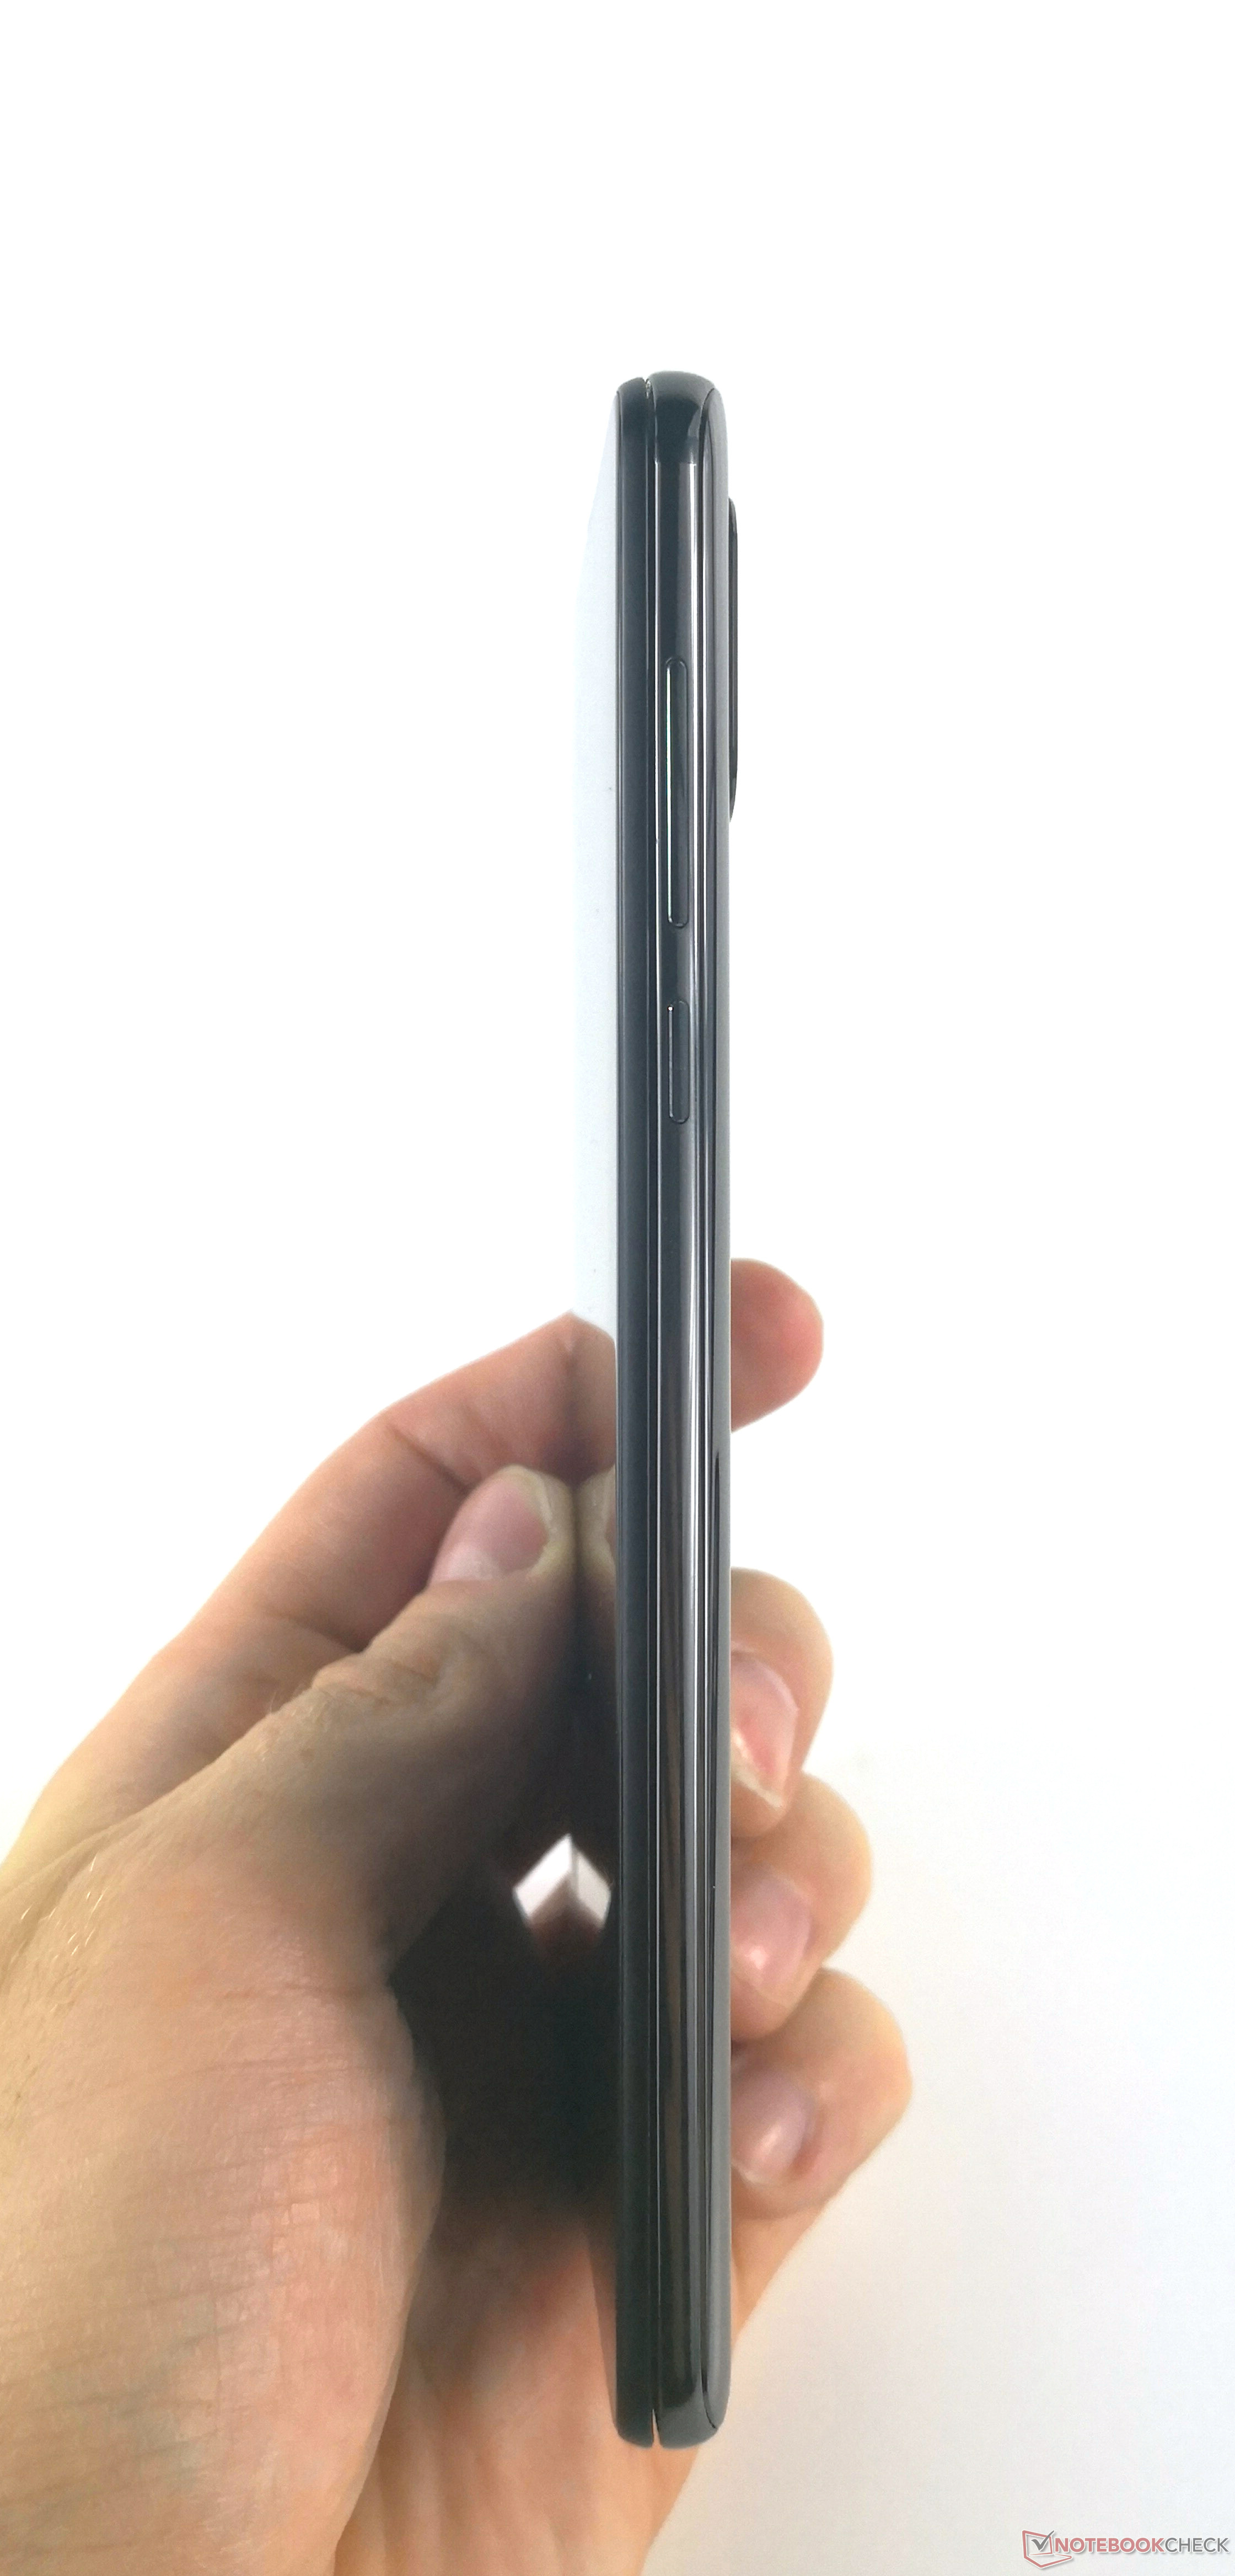
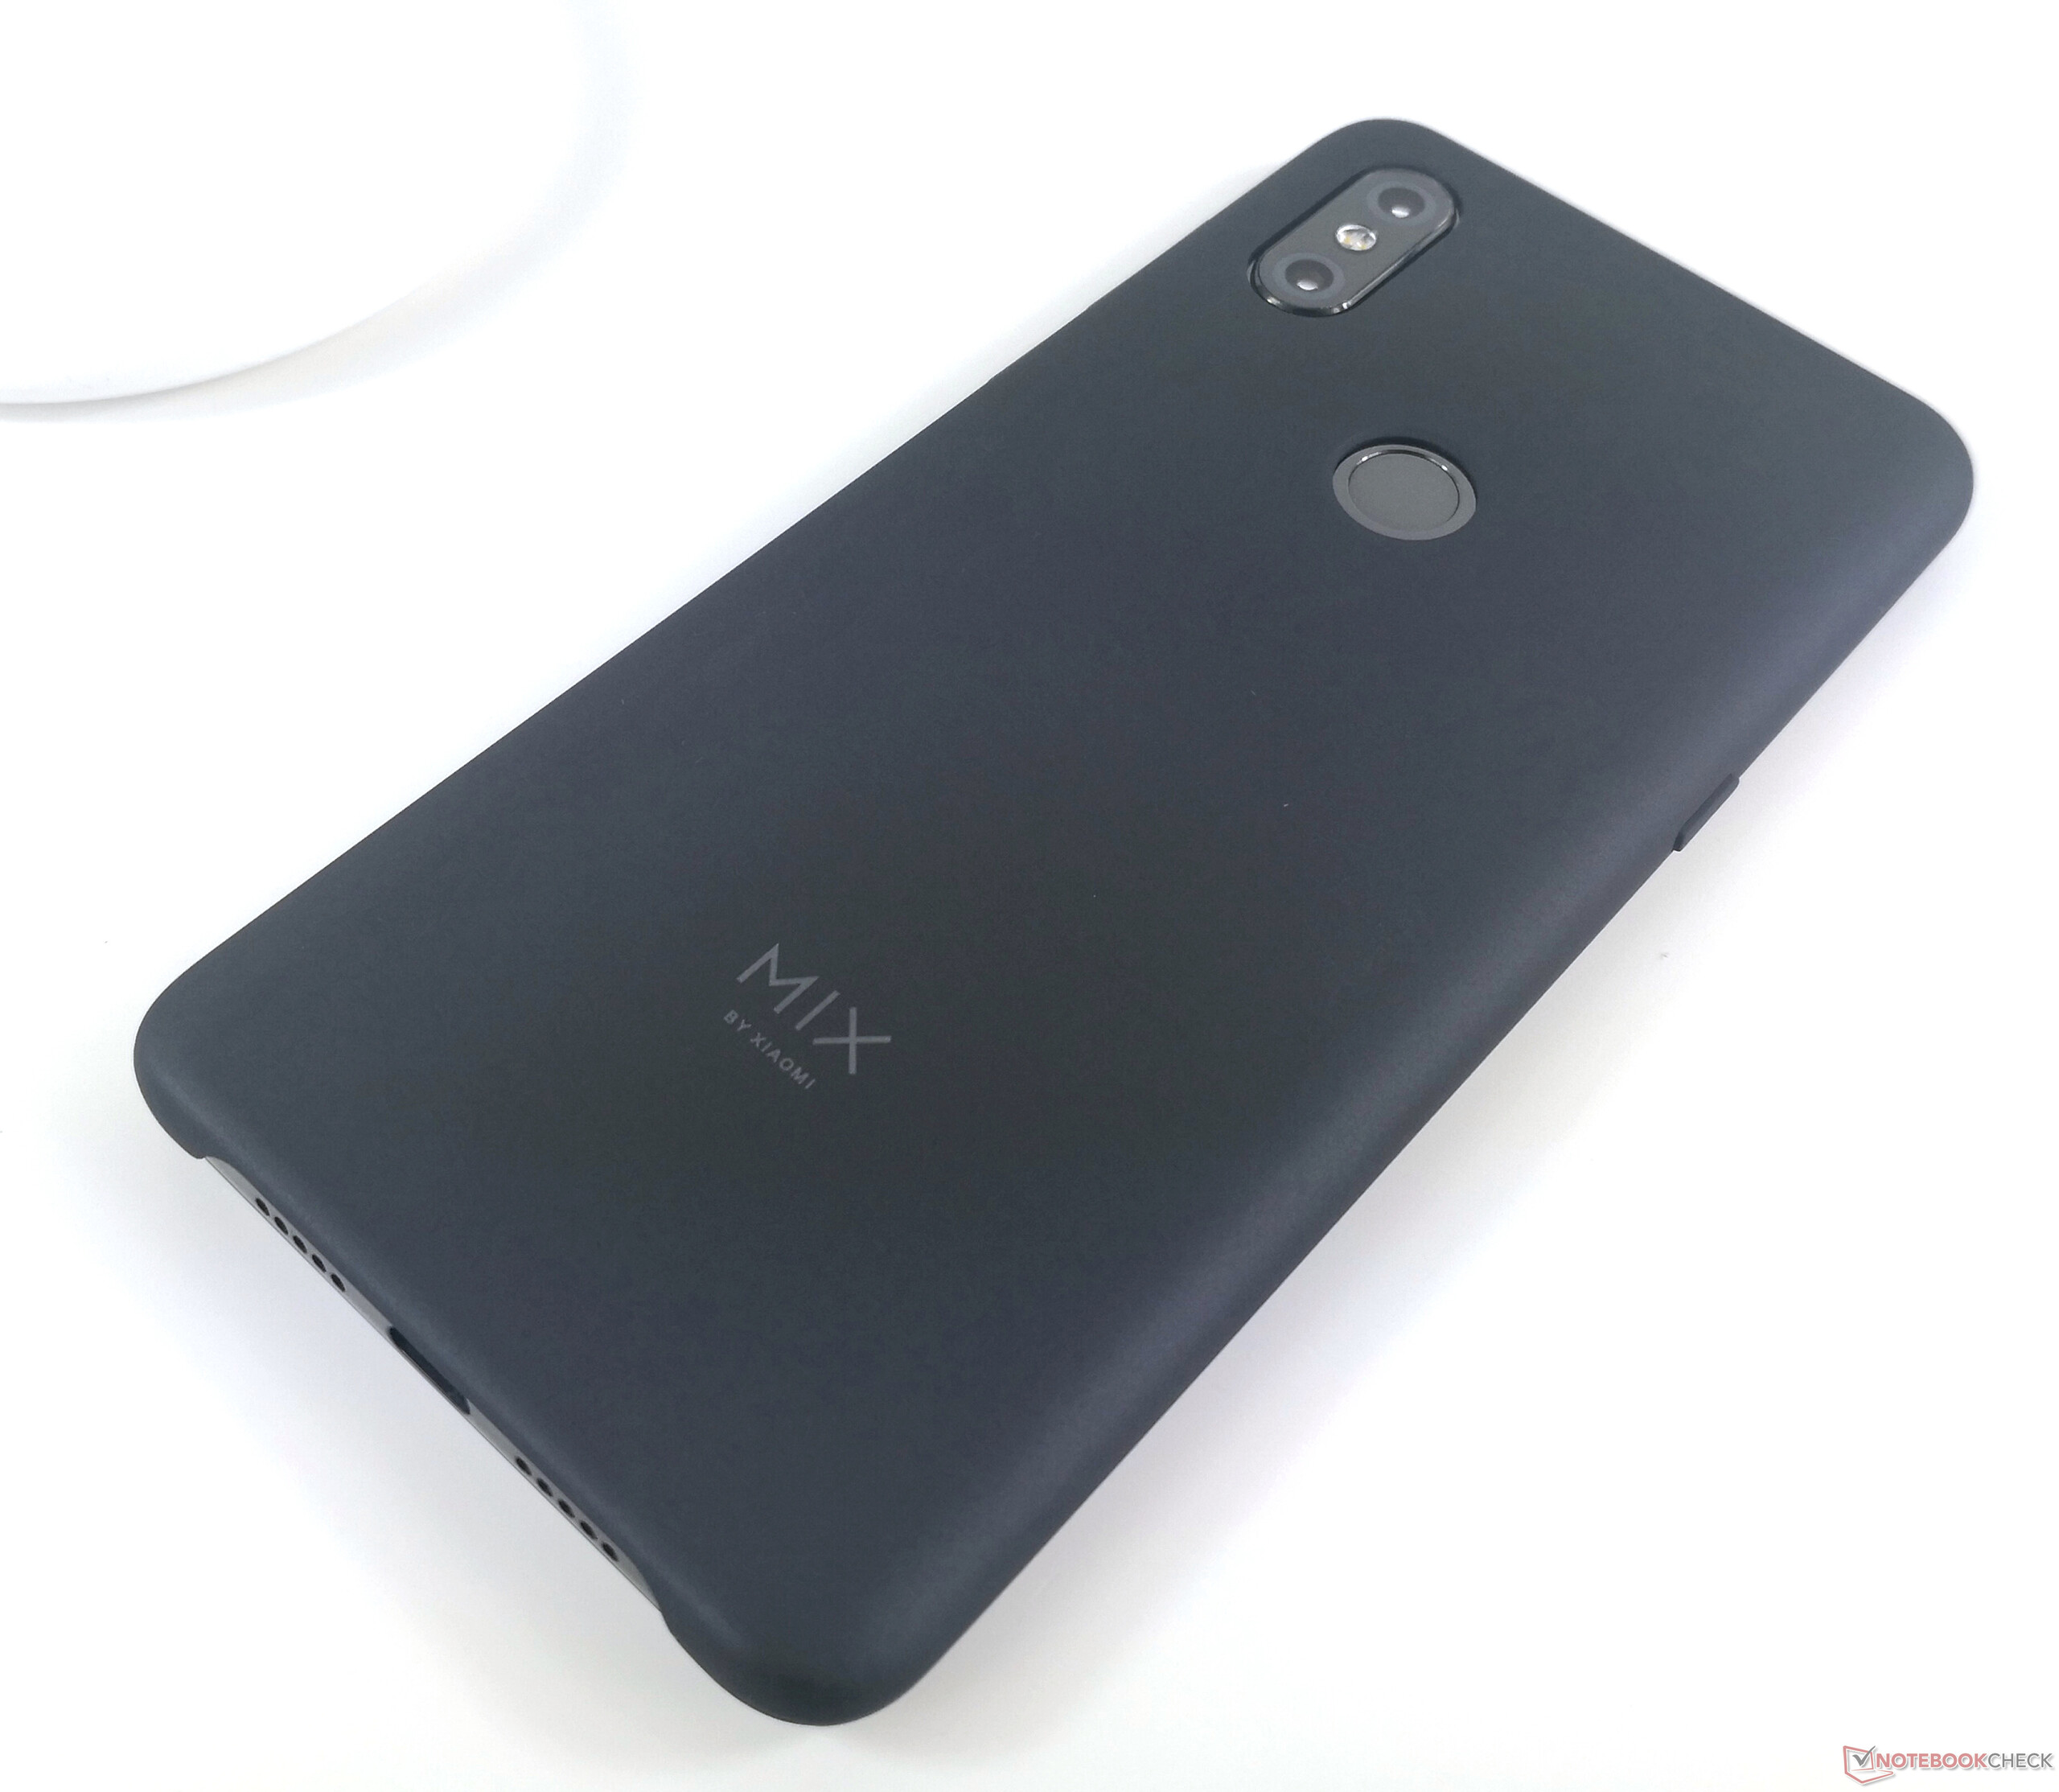
“小米 Mix是一款非常漂亮的智能手机,但是由于其滑动结构,这可能不是每个人理想的旅行伴侣。”
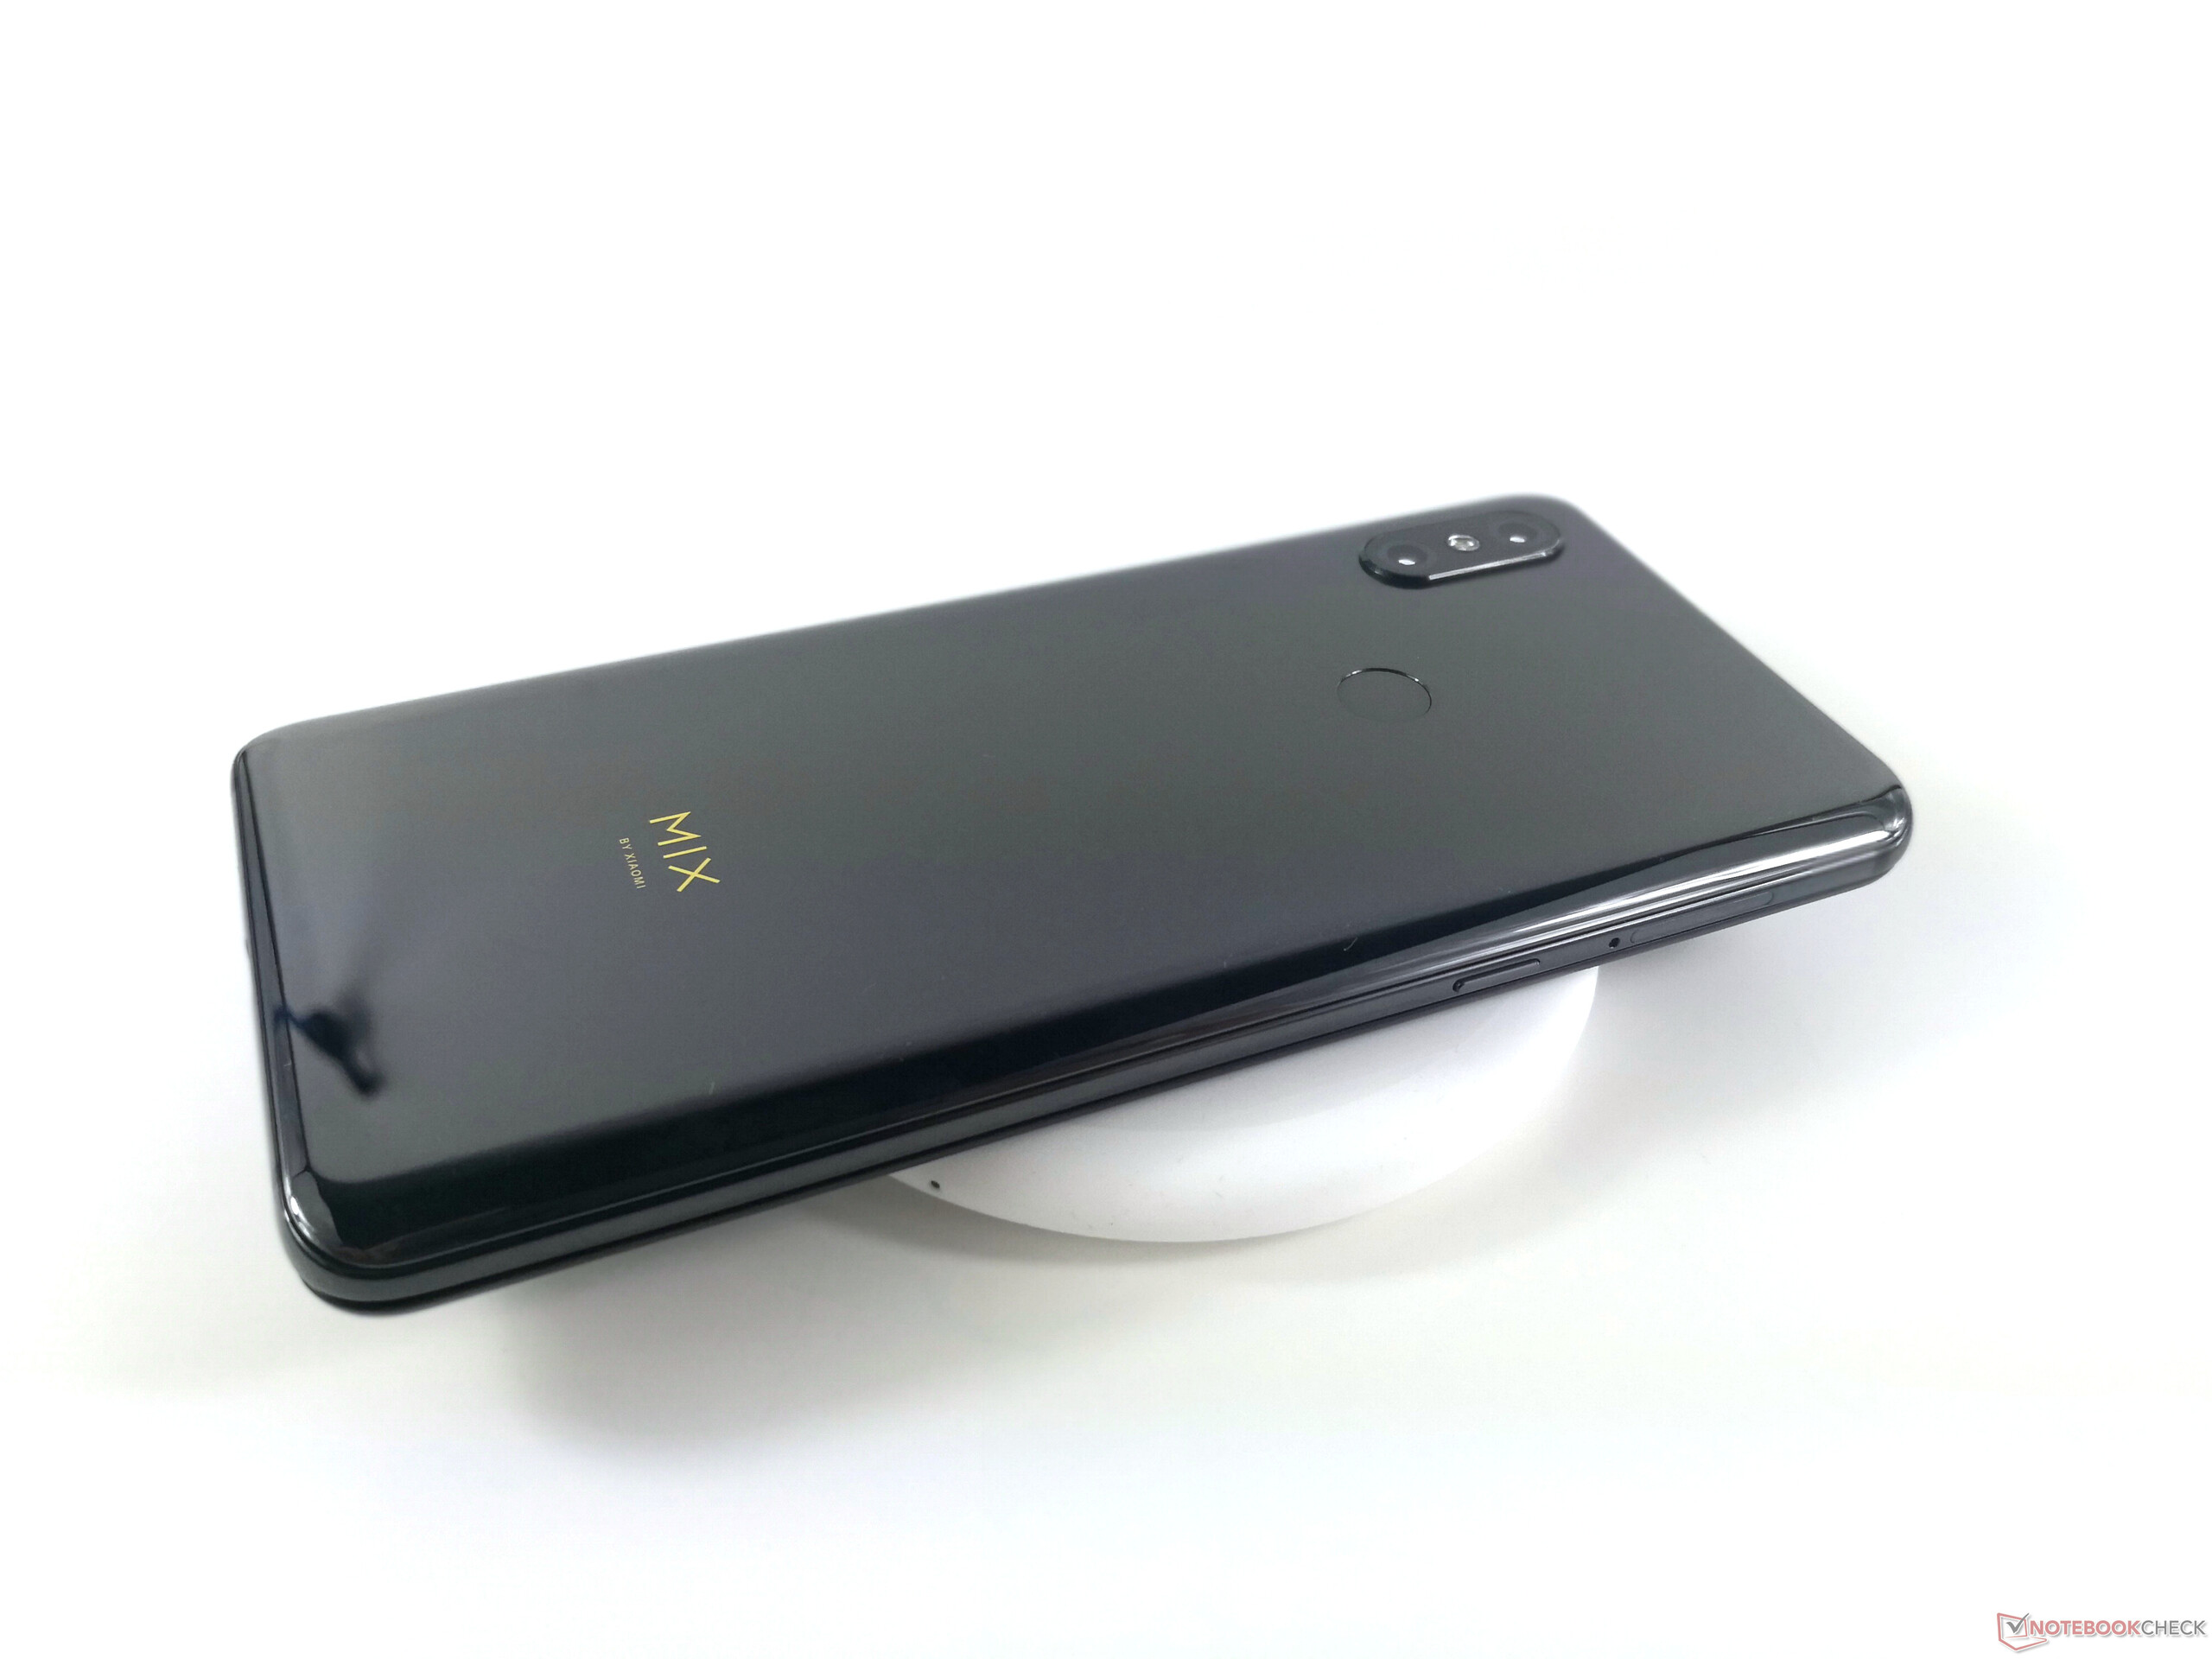
来自小米的Mix 3并没有太多的弱点。滑动结构导致其没有任何IP认证,并且相当沉重,还比具有整体机身的“普通”智能手机更容易损坏。
Xiaomi Mi Mix 3
- 12/03/2018 v6 (old)
Marcus Herbrich
Price comparison

